Τεχνική Και Θεμελιώδης Ανάλυση μετοχών και εταιριών
49
1 Σİθδεά εαδ Θİηİζδυįβμ ǹθΪζıβ ηİIJυθ εαδ İIJαδλδθ. Γεκτηαμ IJλΪIJκμέ ΠIJξδκτξκμ Οδεκθκηκζσΰκμ. MSc ‘ǼφαληκıηΫθβ Οδεκθκηδεά εαδ λβηαIJκκδεκθκηδεά (ǼέΚέΠέǹέή Σηάηα Οδεκθκηδευθ)’ Team Site: A.E.A.C. Co. Project Manager-Site Administrator e-mail: [email protected], My Blog, Twitter, Linkedin 08/10/2015 ΠǼΡΙΛΗΦΗ IJβθ ηİζΫIJβ αIJά γα αλκıδΪıκηİ ηİλδεκτμ ίαıδεκτμ εαθσθİμ εαδ įİέεIJİμ ΰδα IJİξθδεά αθΪζıβ ηİIJκξυθ- įİδεIJυθ εαδ γİηİζδυįβ αθΪζıβ İIJαδλδυθ. Θα ζΪίκηİ IJδμ αλİζγκτıİμ IJδηΫμ ΰδα ηδα ηİIJκξά εαδ ΫİδIJα ηİ IJα εαIJΪζζβζα İλΰαζİέα εαδ ηİγσįκμ IJβμ IJİθδεάμ αθΪζıβμ (Technical Analysis) γα λκıįδκλέıκηİ IJβθ κλİέα IJβμ ηİIJκξάμ. ΠαλΪζζβζα γα İιİIJΪακηİ εαδ ηİλδεΪ κδεκθκηδεΪ ηİΰΫγβ IJβμ İIJαδλέαμ υıIJİ θα λκίκτηİ ıİ γİηİζδυįβ αθΪζıβ (Fundamental Analysis), ΫξκθIJαμ ΫIJıδ ηδα κζκεζβλπηΫθβ İδεσθα ΰδα IJβθ κλİέα IJπθ κδεκθκηδευθ εαδ ξλβηαIJδıIJβλδαευθ ηİΰİγυθ IJβμέ Ǿ İIJαδλέα εαδ β ηİIJκξά κ γα αθαζτıκηİ İέθαδ IJπθ Ǽζζβθδευθ ΠİIJλİζαέπθ ǹέǼέ (ǼΛΠǼ ǹέǼέ). Ǿ ǼΛΠǼ įλαıIJβλδκκδİέIJαδ ıIJκθ ξυλκ IJπθ İIJλİζαδκİδįυθ ασ IJκ 1ληη εαδ ηααέ ηİ IJβθ Motor Oil, ακIJİζκτθ IJδμ įκ ηİΰαζτIJİλİμ İIJαδλέİμ ıIJκθ εζΪįκ IJβμ įδτζδıβμ İIJλİζαέκ εαδ İθΫλΰİδαμέ Σκ İτλκμ IJπθ İλΰαıδυθ IJβμ İλδζαηίΪθİδ įλαıIJβλδσIJβIJİμ σπμ β įδτζδıβ, İηκλέα εαδ įδαθκηά İIJλİζαέκ, ξβηδεΪ- İIJλκξβηδεΪ, İλİθΪ εαδ αλΪΰπΰβ įλκΰκθαθγλΪεπθ, αλαΰπΰά İθαζζαεIJδευθ βΰυθ İθΫλΰİδαμ, IJİξθδεΫμ βλİıέİμ ΰδα γΫηαIJα İθΫλΰİδαμ εIJζέ Οδ βλİıέİμ εαδ IJα λκρσθIJα IJκ κηέζκ εαζτIJκθ ıξİįσθ σζβ IJβθ İλδκξάμ IJβμ θκIJδκαθαIJκζδεά Ǽλυβμ. Οδ İIJαδλİέİμ κ ΪΰκθIJαδ ıIJκθ σηδζκ IJπθ ǼΛΠǼ İέθαδ 1) ǼζζβθδεΪ ΠİIJλΫζαδα ǹέǼέ (ǻδτζδıβ) β) ǼΚΟ ǹέǺέǼέǼέ, Καζοπ ǼέΠέǼέ ǼζζβθδεΪ Κατıδηα ǹέǼέǼέ (Ǽηκλέα) 3) ǼζζβθδεΪ ΠİIJλΫζαδα ǹέǼέ, ΝIJδαικθ ǹέǺέǼέǼέ (βηδεΪ) 4) ǼζζβθδεΪ ΠİIJλΫζαδα ǹέǼέ, εelrose Kuwait Energy ωo Τ ǼΛέΠǼέ, Vegas τil Τ GAS - ǼΛέΠǼέ (ǼλİθΪ εαδ ΠαλΪΰπΰβ įλκΰκθαθγλΪεπθ) 5) Elpedison BV (ΠαλΪΰπΰβ εαδ İηκλέα βζİεIJλδεάμ İθΫλΰİδαμ)
-
Upload
stratos-goumas -
Category
Documents
-
view
43 -
download
7
description
Στην μελέτη αυτή θα παρουσιάσουμε μερικούς βασικούς κανόνες και δείκτες για τεχνική ανάλυση μετοχών- δεικτών και θεμελιώδη ανάλυση εταιριών. Θα λάβουμε τις παρελθούσες τιμές για μια μετοχή και έπειτα με τα κατάλληλα εργαλεία και μεθόδους της τεχνικής ανάλυσης (Technical Analysis) θα προσδιορίσουμε την πορεία της μετοχής. Παράλληλα θα εξετάζουμε και μερικά οικονομικά μεγέθη της εταιρίας ώστε να προβούμε σε θεμελιώδη ανάλυση (Fundamental Analysis), έχοντας έτσι μια ολοκληρωμένη εικόνα για την πορεία των οικονομικών και χρηματιστηριακών μεγεθών της.
Transcript of Τεχνική Και Θεμελιώδης Ανάλυση μετοχών και εταιριών
1
Σ χθδεά εαδΝΘ η ζδυ βμ θΪζυ β η οχυθ εαδΝ αδλδωθ.
ΓεκτηαμΝ λΪ κμέΝΠ υξδκτξκμ Οδεκθκηκζσΰκμ.
MSc ‘ φαληκ ηΫθβΝΟδεκθκηδεάΝεαδΝΧλβηα κκδεκθκηδεάΝ( έΚέΠέ έήΝΣηάηαΝΟδεκθκηδευθ)’
Team Site: A.E.A.C. Co. Project Manager-Site Administrator
e-mail: [email protected], My Blog, Twitter, Linkedin
08/10/2015
Π ΡΙΛΗΦΗ
βθΝ η ζΫ β αυ άΝ γαΝ παλκυ δΪ κυη η λδεκτμ ία δεκτμ εαθσθ μ εαδΝ έε μ ΰδαΝ
ξθδεά αθΪζυ β η κξυθ- δε υθΝεαδΝγ η ζδυ β αθΪζυ β αδλδυθ. ΘαΝζΪίκυη δμΝ
παλ ζγκτ μ δηΫμ ΰδαΝηδαΝη κξά εαδΝΫπ δ α η Ν αΝεα Ϊζζβζα λΰαζ έα εαδΝη γσ κυμ
βμΝ χθδεάμ αθΪζυ βμ (Technical Analysis) γαΝ πλκ δκλέ κυη βθΝ πκλ έα βμΝ
η κξάμ. ΠαλΪζζβζα γαΝ ι Ϊακυη εαδΝη λδεΪ κδεκθκηδεΪ η ΰΫγβ βμΝ αδλέαμ υ Ν
θαΝ πλκίκτη Ν γ η ζδυ β αθΪζυ β (Fundamental Analysis), Ϋξκθ αμ Ϋ δ ηδαΝ
κζκεζβλπηΫθβ δεσθα ΰδαΝ βθΝ πκλ έα πθΝ κδεκθκηδευθ εαδΝ ξλβηα δ βλδαευθ
η ΰ γυθ βμέ
Ν αδλέα εαδΝβΝη κξά πκυΝγαΝαθαζτ κυη έθαδΝ πθΝ ζζβθδευθ Π λ ζαέπθ έ έΝ
( ΛΠ Ν έ έ). Ν ΛΠ Ν λα βλδκπκδ έ αδΝ κθΝ ξυλκ πθΝ π λ ζαδκ δ υθ απσΝ κΝ
1ληηΝεαδΝηααέ η Ν βθΝMotor Oil, απκ ζκτθ δμΝ υκΝη ΰαζτ λ μ αδλέ μ κθΝεζΪ κ
βμΝ δτζδ βμΝπ λ ζαέκυΝεαδΝ θΫλΰ δαμέ
ΣκΝ τλκμΝ πθΝ λΰα δυθ βμΝπ λδζαηίΪθ δ λα βλδσ β μ σππμΝβΝ δτζδ β,Ν ηπκλέα
εαδΝ δαθκηά π λ ζαέκυ, ξβηδεΪ- π λκξβηδεΪ, λ υθΪ εαδΝ παλΪΰπΰβ
υ λκΰκθαθγλΪεπθ, παλαΰπΰά θαζζαε δευθ πβΰυθ θΫλΰ δαμ, ξθδεΫμ υπβλ έ μ
ΰδαΝ γΫηα α θΫλΰ δαμ ε ζέΝ ΟδΝ υπβλ έ μ εαδΝ αΝ πλκρσθ α κυΝ κηέζκυ εαζτπ κυθ
ξ σθ σζβ βθΝπ λδκξάμ βμΝθκ δκαθα κζδεάΝ υλυπβμ.
ΟδΝ αδλ έ μ πκυΝυπΪΰκθ αδ κθΝσηδζκ πθΝ ΛΠ Ν έθαδ
1) ζζβθδεΪ Π λΫζαδα έ έΝ( δτζδ β)
β)Ν ΚΟΝ έ έ έ έ, ΚαζυοπΝ έΠέ έΝ ζζβθδεΪ Κατ δηα έ έ έΝ( ηπκλέα)Ν
3) ζζβθδεΪ Π λΫζαδα έ έ,ΝΝΝ δαικθΝ έ έ έ έΝ(ΧβηδεΪ)
4) ζζβθδεΪΝΠ λΫζαδαΝ έ έ,ΝεelroseΝKuwaitΝEnergyΝωoΝΤΝΝ ΛέΠ έ,ΝVegasΝτilΝΤΝ
GAS - ΛέΠ έΝ( λ υθΪΝεαδΝΠαλΪΰπΰβΝυ λκΰκθαθγλΪεπθ)
5) Elpedison BV (ΠαλΪΰπΰβ εαδΝ ηπκλέα βζ ε λδεάμ θΫλΰ δαμ)
2
6) ζζβθδεΪ Π λΫζαδα , θαθ υ δη μ ΠβΰΫμ θΫλΰ δαμ έ έΝ ( θαθ υ δη μ ΠβΰΫμ
θΫλΰ δαμ)
ι)Ν ΠΡΟΦΟΝ έ έΝ(Σ ξθδεΫμ η ζΫ μ)
κ)Ν Π Ν έ έΝ(Φυ δεσΝαΫλδκ)
Ν η κξάΝ πθΝ ΛΠ Ν δαπλαΰηα τ αδΝ κΝ ξλβηα δ άλδκΝ γβθυθΝ εαδΝ κυΝ
Λκθ έθκυέ
Keywords: technical analysis, fundamental analysis, stock market, corporation, MACD, William %R, SMA,
EMA, Stochastic Oscillator, RSI, CCI, Bollinger Bands, ROE, ROA, Current Ratio, EPS, EBITDA, EBT
Ι ΓΧΓΗ
Σ ξθδεά αθΪζυ β (Technical Analysis) έθαδΝ ηδαΝ ηΫγκ κμ πλκ δκλδ ηκτ βμΝ
η αίκζάμ βμΝ δηάμΝ ηδαμΝ η κξάμ βΝ κπκέα ία έα αδ ευλέπμ Ν ΰλαφάηα α εαδΝ
έε μ. ΛαηίΪθ δ κηΫθα κυΝπαλ ζγσθ κμ ΰδαΝ βθΝ δηά βμΝη κξάμ άΝ κυΝ έε β,
η Ν αΝκπκέα πλκ παγ έ θαΝπλκίζΫο δ βθΝπκλ έα κΝηΫζζκθ. α δεΫμ παλα κξΫμ ΰδαΝ
ΫθαθΝ ξθδεσ αθαζυ ά έθαδΝκδΝ ιάμ.
1) ΟΝαθαζυ άμ θΝ α ξκζ έ αδ η Ν αΝ γ η ζδυ β η ΰΫγβ βμΝ αΰκλΪμ άΝ βμΝ αδλέαμ
(δ κζκΰδ ηκέ, έε βμ Σδηάμ/ ΚΫλ β, Ϋ κ α,Ν Ϋικ α,Ν εΫλ β, υπκξλ υ δμ ε ζ)Ν παλΪ
ησθκ η Ν αΝΰλαφάηα α βμΝη κξάμ εαδΝ δμΝπαλ ζγκτ μ δηΫμ βμέ
2) Ν ξθδεά αθΪζυ β υπκγΫ δ σ δΝ αΝ αθγλυπδθα υθαδ γάηα α εαδΝ υηπ λδφκλΫμ
πλκ δκλέακυθ Νη ΰΪζκ ίαγησ δμΝ δηΫμ πθΝη κξυθ.
3) Ν δηά ηδαμΝη κξάμ κΝξλβηα δ βλδαεσ αηπζσ απ δεκθέα δ σζ μ δμΝκδεκθκηδεΫμ
πζβλκφκλέ μ εαδΝθΫα βμ πδξ έλβ βμ.
4) ΟΝ αθαζυ άμ υπκγΫ δ σ δΝ ι Ϊακθ αμ αΝ κηΫθα εαδΝ αΝ απκ ζΫ ηα α κυΝ
παλ ζγσθ κμ ΰδαΝ βθΝ η κξά- έε β,Ν έθαδΝ Ν γΫ β θαΝ πλκίζΫο δ αθΪζκΰ μ
υηπ λδφκλΫμ κΝηΫζζκθ εαγυμ υπΪλξ δ βΝ Ϊ β αΝΰ ΰκθσ α θαΝ παθαζαηίΪθκθ αδ
η Νπαλσηκδκ λσπκ.
Θ η ζδυ βμ αθΪζυ β (Fundamental Analysis) έθαδ βΝ η γκ κζκΰέα η Ν βθΝ κπκέα
πλκ δκλέακυη κθΝ ίαγησ αιδκπδ έαμ ηδαμΝ αδλέαμέΝ ΟΝ γ η ζδυ βμ αθαζυ άμ
ία έα αδ αΝ ιάμ κηΫθα
3
1) ζΫΰξ δ κυμΝδ κζκΰδ ηκτμ, απκ ζΫ ηα α ξλά βμ εαδΝΰ θδεσ λα δμΝκδεκθκηδεΫμ
εα α Ϊ δμ βμΝ αδλέαμέ
2) ζΫΰξ δ δμΝ βη δυ δμ εαδΝ υπκ έι δμ κυΝ κλεπ κτ ζ ΰε ά,Ν κΝ κπκέκμ ζΫΰξ δ,
πδ κπκδ έ εαδΝυπκΰλΪφ δ δμΝεα α Ϊ δμέ
3) ΛαηίΪθ δ υπσοβ βμΝαθαεκδθυ δμ εαδΝ αΝ π θ υ δεΪ ξ έα βμΝ πδξ έλβ βμ.
4) βλέα αδ πέ βμ Ν πκδκ δεΪ ξαλαε βλδ δεΪ βμΝ αδλέαμ,Ν σππμΝ βΝ αδλδεά
δαευίΫλθβ β, ξΫ β αδλέαμ η Νπ ζΪ μ εαδΝυπαζζάζκυμ ε ζ.
5) ι Ϊα δ πκζζΫμ φκλΫμ εαδΝ βθΝ ΰ θδεσ λβ πκλ έα κυΝεζΪ κυ πκυΝ θ Ϊ αδ βΝ
αδλέα αζζΪ εαδΝ αΝηαελκκδεκθκηδεΪ η ΰΫγβ βμΝκδεκθκηέαμ.
α δεΫμ δαφκλΫμ η αιτ Σ χθδεάμ εαδΝΘ η ζδυ κυμ θΪζυ βμ
1) Ν γ η ζδυ βμ αθΪζυ β βλέα αδ ευλέπμ δμΝ κδεκθκηδεΫμΝ εα α Ϊ δμΝ εαδΝ
απκ ζΫ ηα αΝ βμΝ αδλέαμΝ θυΝβΝ ξθδεάΝ βθΝ δηάΝ βμΝη κξάμ.
β)Ν Νγ η ζδυ βμΝαθΪζυ β κξ τ δΝπ λδ σ λκΝ κθΝηαελκπλσγ ηκΝκλέακθ α εαδΝ
πδξ δλβηα δεΫμΝ λα βΰδεΫμ βμΝ αδλέαμ,Ν θυΝ βΝ ξθδεάΝ αΝ ίλαξυπλσγ ηαΝ
απκ ζΫ ηα α.
γ)Ν βθΝγ η ζδυ β αθΪζυ β,ΝκΝαθαζυ άμ ία έα αδ ευλέπμ βθΝ δεσθα βμΝ αδλέαμ,
βθΝ πκλ έα πθΝ Ν αΰκλυθ εαδΝ βθΝ ΰ θδεσ λβΝ ιΫζδιβΝ βμ κδεκθκηέαμέΝ Ο ξθδεσμ
αθαζυ άμ ία έα αδΝ αΝ άηα αΝπκυΝζαηίΪθ δ απσΝ κυμΝ έε μ εαδΝ αΝ δαΰλΪηηα α
βμΝη κξάμ.
ζ)Ν ΟΝ γ η ζδυ βμ αθαζυ άμ ηπκλ έ θαΝ ε δηά δ η Ν δμ η γσ κυμ κυ, πκδαΝ έθαδΝ βΝ
‘’ π ά’’Ν δηά βμΝ η κξάμ. θ δγΫ πμ,Ν κΝ ξθδεσμ αθαζυ άμ θΝ έθαδΝ Ν γΫ β θαΝ
πλκ δκλέ δ ΝπκδκΝ πέπ κ γαΝφ Ϊ δ βΝη κξά,ΝσηπμΝηπκλ έ θαΝΰθπλέα δ σ δ, σ αθΝ
φ Ϊ δ Ναυ σΝ κΝ πέπ κ,ΝαθΝγαΝ υθ ξδ έ άΝγαΝαθα λαφ έ βΝπκλ έα βμέ
βθΝ λΰα έα ηαμ,Ν θΝγαΝ π ε αγκτη βθΝφδζκ κφέα πθΝ υκΝαυ υθΝαθαζτ πθ
κτ γαΝαθαπ τικυη ΝίΪγκμΝ κΝηαγβηα δεσ εαδΝ ξθδεσ υπσίαγλκ βμΝεα α ε υάμ
πθΝ δε υθέΝ ΘαΝ παλκυ δΪ κυη η λδεΪ ία δεΪΝ κδξ έα εαδΝ ξθδεΫμ υ Ν κΝ
αθαΰθυ βμ θαΝεα αθκά δ Νπλπ αλξδεσ πέπ κ βθΝζ δ κυλΰέα εαδΝ βηα έα πθΝ
υκΝαυ υθ αθαζτ πθέ
4
------ ΙΚΣ ΝΣ ΥΝΙΚΗΝ Ν ΛΤΗ
Έθαμ έε βμ ξθδεάμ αθΪζυ βμ έθαδΝ Ϋθαμ ηαγβηα δεσμ τπκμ πκυΝ αθαφΫλ αδ
ευλέπμ έ βθΝ δηά βμΝη κξάμ έ κθΝσΰεκ υθαζζαΰυθ.
Χπλέακθ αδ Ν υκΝετλδ μ εα βΰκλέ μέΝ Νπλυ β εα βΰκλέα π λδζαηίΪθ δ κυμΝ έε μ
σπκυ πλκβΰκτθ αδ βμΝ Ϊ βμ (leading) θυΝ βΝ τ λβ π λδζαηίΪθ δ ε έθκυμ πκυΝ
αεκζκυγκτθΝ η Ν υ Ϋλβ βΝ (lagging)έΝ βθΝ πλυ β π λέπ π β κδ έε μ έθκυθ ηδαΝ
πλσίζ οβ ΰδαΝ βθΝ δηά βμΝη κξάμ, θυΝ βθΝ τ λβ έθκυθ βθΝ πδί ίαέπ β ΰδαΝ
βθΝπκλ έα βμΝη κξάμ.
H ξθδεά αθΪζυ β ία έα αδΝ βθ Ϊ β πκυΝαεκζκυγ έ Ϋθαμ έε βμ,ΝβΝκπκέα έξθ δ
βθΝΰ θδεά εα τγυθ β βμΝ αδλέαμ-εζΪ κυ- αΰκλΪμέΝ Ν Ϊ β ηπκλ έ θαΝ έθαδΝαθκ δεά
(bull market- uptrend), εαγκ δεά (bear market- downtrend) άΝπζΪΰδα/ κλδασθ δα
(sideways trend). Ν δΪλε δα βμΝ Ϊ βμΝηπκλ έ θαΝ έθαδΝίλαξυπλσγ ηβ (ηΫξλδ λ δμΝ
ί κηΪ μ), η κπλσγ ηβ (απσΝ λ δμΝ ί κηΪ μ ηΫξλδ η λδεκτμ ηάθ μ)Ν εαδΝ
ηαελκπλσγ ηβ (πΪθπ απσΝΫθαΝΫ κμ).
Ν Ϊ β παλαεκζκυγ έ αδ η Ν υκΝ λσπκυμέΝ ΟΝ πλυ κμ έθαδΝ αΝ ηκ έία (patterns1),
σπκυ βΝαθΪζυ β έθαδΝΰλαφδεά, βζα ά κΝαθαζυ άμ παλα βλ έ κΝΰλΪφβηα βμΝ δηάμ
ηδαμ η κξάμ εαδΝ πλκ παγ έ θαΝ θ κπέ δ εΪπκδα ηκ έίαΝ άΝ αεκζκυγέ μ υ Ν θαΝ
απκφα έ δΝαθΝβΝ δηά γαΝαθΫί δ άΝγαΝ πΫ δέΝΟΝ τ λκμ λσπκμ έθαδΝβΝεα α ε υά
δε υθ (indicators),Ν σπκυΝ π λδζαηίΪθκθ αδΝ ΰλαφάηα αΝ εαγυμΝ εαδΝ κδεκθκηδεΫμΝ
πζβλκφκλέ μΝπκυΝ π ιβΰκτθ η Ναθαζυ δεσ λκ λσπκ βθΝπκλ έα βμΝη κξάμ.
εα α ε υά πθΝ δε υθ αθ ζ έΝ κηΫθα
1) πσΝ βθΝ Ϊ βΝ (trend) πκυΝ Ϋξ δ βΝ δηά κυΝ αιδσΰλαφκυ (η κξά-εζΪ κμ-αΰκλΪ)Ν
Σκτ β βΝ ξθδεάΝ έθ δΝ πζβλκφσλβ βΝ εαδΝ πδί ίαδυθ δΝ βθΝ πκλ έα βμΝ δηάμ κυΝ
αιδσΰλαφκυέΝ
2) πσΝ κθΝσΰεκ πθΝ υθαζζαΰυθ (volume).
3) πσΝ βθΝ δαετηαθ βΝ πθΝ δηυθ (volatility).
4) πσΝ βθΝ δα άλβ β άΝαζζαΰάΝ βμΝ Ϊ βμΝ(momentum). Σκτ β βΝ ξθδεά τθα αδ
θαΝπλκίζΫο δ αθΝβΝ δηά κυΝαιδσΰλαφκυ γαΝ υθ ξέ δ βθ πκλ έαΝ βμ άΝγαΝαζζΪι δ
Ϊ β.
1 ζ. Π Ρ ΡΣ Μ
5
Νεα α ε υά βλέα αδ Ν υκΝευλέπμ η γσ κυμέΝ ΝηδαΝηΫγκ κμ έθαδΝκΝ έε βμ θαΝ
π λδζαηίΪθ δ ΫθαΝ κλδκγ βηΫθκ φΪ ηα δηυθ εαδΝ κθκηΪα αδΝ αζαθ π άμΝ
(oscillator), θυΝβΝ τ λβΝηΫγκ κμ θΝ κΝ εΪθ δ αυ σέΝΟΝ αζαθ π άμ κλδκγ έ αδΝ
η αιτ ηδαμΝαθυ λβμ εαδΝηδαμ εα υ λβμ δηάμ εαδΝκΝ έε βμ εδθ έ αδ ηΫ α Ναυ άΝ
βμΝ π λδκξάέΝ θΝ κΝ έε βμ πζβ δΪα δ κΝ αθυ λκ σλδκ, σ υπΪλξ δ υπ λαΰκλΪ
(overbought),Ν βΝ κπκέα θΝ βλέα αδ υθάγπμ αΝ γ η ζδυ β κδεκθκηδεΪ βμΝ
αδλέαμ,ΝΝη Ναπκ Ϋζ ηα θαΝυπ λ δηΪ αδ κΝαιδσΰλαφκέΝ υ σΝ έθαδΝΫθ διβ σ δΝβΝ δηάΝ
γαΝ υπκξπλά δ εαδΝ κΝ αιδσΰλαφκ πλΫπ δ θαΝ ππζβγ έ τθ κηα (sell signal). ΣκΝ
αθ έγ κ υηίαέθ δ σ αθΝκΝ έε βμ πζβ δΪα δ κΝεα υ λκ σλδκ, σπκυ σ υπΪλξ δ
υπ λπυζβ β (oversell), κπσ βΝ δηά κυΝ αιδσΰλαφκυ γαΝ αθαεΪηο δ εαδΝ κΝ
αιδσΰλαφκ πλΫπ δ θαΝαΰκλα έ τθ κηα (buy signal)
ΟδΝ αζαθ π Ϋμ ξλβ δηκπκδκτθ αδ σ αθΝ θΝυπΪλξ δ ι εΪγαλβ Ϊ β άΝσ αθΝβΝαΰκλΪ
ηφαθέα δ πζΪΰδα Ϊ β.
ΟδΝ έε μ πκυΝ θΝ αθάεκυθ κυμΝ αζαθ π Ϋμ ξλβ δηκπκδκτθ αδ σ αθΝ υπΪλξ δ
ι εΪγαλβ Ϊ β βθΝαΰκλΪ, κπσ βΝπλσίζ οβ έθαδΝ ξ δεΪ πδκΝ τεκζβ.
ΟδΝ έε μ ξθδεάμ αθΪζυ βμ έθαδΝαλε κέ εαδΝ πέ βμ υθ υΪακθ αδ η αιτ κυμΝΰδαΝ
πδκΝκζκεζβλπηΫθα απκ ζΫ ηα α.
η έμ βθΝ λΰα έα ηαμΝγαΝξλβ δηκπκδά κυη κυμΝ ιάμ έε μ.
(Π λδ σ λα ΰδαΝ δμΝεα βΰκλέ μ πθΝ δε υθ ω εαδ ω)
1) πζσμ Κδθβ σμ ΜΫ κμ (Simple Moving Average- SMA)
2) εγ δεσμ Κδθβ σμ ΜΫ κμ (Exponential Moving Average- EMA)
3) MACD (Moving Average Convergence/Divergence).
4) Bollinger Bands
5) Commodity Channel Index
6) Relative Strength Index
7) William %R
8) Stochastic Oscillator
6
1) SMA (Simple Moving Average)
Σκτ κμ κΝ έε βμ έθαδΝ αθ δ ηΫθκμ απσΝ βθΝ α δ δεά, ξλβ δηκπκδ έ αδ σηπμΝ ιέ κυ
δεαθκπκδβ δεΪ αΝκδεκθκηδεΪΝεαδ βθΝαθΪζυ β πθΝξλκθκζκΰδευθ δλυθ.
πκ ζ έ κθΝ πδκΝ απζσ εαδΝ εα αθκβ σ έε β, εαγυμ βΝεα α ε υά κυ θΝαπαδ έ
ι δ δε υηΫθ μ ΰθυ δμ. πέ βμ έθαδΝ κΝ γ ηΫζδκμΝ ζέγκμ εα α ε υάμ ΰδαΝ ΫθαΝ πζάγκμ
πδκΝ υθγΫ πθ ξθδευθ δε υθ,ΝσππμΝγα κτη παλαεΪ π
ΟΝSMA αθάε δ βθΝεα βΰκλέα πθΝ δε υθΝπκυΝ πδί ίαδυθκυθ βθΝ Ϊ β βμΝ δηάμ
η Νυ Ϋλβ β (lagging) εαδΝ θΝ τθα αδ θαΝ υ δ πλσίζ οβ ΰδαΝ βθΝη Ϋπ δ α πκλ έα
βμΝ δηάμ. Άλα,ΝΰδαΝ κθΝ ξθδεσ αθαζυ ά κΝSMA θΝαπκ ζ έΝ λΰαζ έκΝπλσίζ οβμ.
---- Μαγβηα δεάΝχΫ β SMA
λξδεΪ ξλ δαασηα δμΝ δηΫμ εζ δ έηα κμ κυΝαιδσΰλαφκυ (Close Price), εαγυμ εαδ
πθΝαλδγησ πθΝβη λυθ (Ν),Νη Ν κθΝκπκέκ γαΝυπκζκΰέ κυη κθΝεδθβ σ ηΫ κ (SMA)
SMA=� +� − +� − +⋯+� − (P= Close Price, N= λδγησμΝβη λυθ)
Μ Ν κθΝ παλαπΪθπ τπκ,Ν ΰδαΝ εΪγ Ν θΫα δηά πκυΝ πλκ γΫ κυη , αφαδλκτη βθΝ
παζαδσ λβ,Νυ Ν κΝΝΝθαΝ έθαδΝπΪθ α αγ λσ.
θαζσΰπμ αΝ κηΫθα πκυΝξλβ δηκπκδκτη , κλέακυη εαδΝ κθΝαλδγησ πθΝβη λυθ
(Ν)έΝυθάγπμ,ΝΰδαΝβη λά δ μ δηΫμ ζαηίΪθκυη ΰδαΝΝ δμ ηΝάΝ1ί άη λ μ.
ΩμΝ έε μ αθαφκλΪμ, ζαηίΪθκθ αδ υθάγπμ κΝSMA πθΝηί,Ν1ίίΝεαδΝβίίΝβη λυθ.
Ν ξθδεά ΰδαΝθαΝ ζΫΰικυη βθΝ Ϊ β,Ν έθαδΝθαΝ υΰελέθκυη κθΝευζδση θκ ηΫ κ βμΝ
ίλαξυπλσγ ηβμ π λδσ κυ,Νη Ν κθΝευζδση θκ ηΫ κ βμΝηαελκπλσγ ηβμ π λδσ κυ.
ΓδαΝπαλΪ δΰηα, ηπκλκτη θαΝζΪίκυη ΫθαθΝSMA 5 βη λυθ (5-days SMA),ΝΝεαδΝΫθαθΝ
SMA 50 βη λυθ (50-days SMA),ΝΝ κΝέ δκ ΰλΪφβηαέΝΌ αθΝκΝ5-days SMA αλξέα δ θαΝ
ίλέ ε αδ πΪθπ απσΝ κθΝ 50-days SMA, σ αυ σΝ έθαδΝ άηα (signal) σ δΝ αλξέα δ
αθκ δεά πκλ έα (uptrend)έΝΌ αθΝκΝ5-days SMA αλξέα δ θαΝίλέ ε αδ εΪ π απσΝ κθΝ
50-days SMA, σ αυ σΝ έθαδΝ άηα (signal) σ δΝ αλξέα δ εαγκ δεά πκλ έα
(downtrend).
7
Μ Νπαλσηκδκ λσπκ ι Ϊακυη βθΝ Ϊ β ζαηίΪθκθ αμ κΝ έ δκ ΰλΪφβηα δμΝ δηΫμ
κυΝαιδσΰλαφκυ εαδ κθΝSMA. ΓδαΝπαλΪ δΰηα, ηπκλκτη θαΝζΪίκυη ΫθαθΝSMA 10
βη λυθ (10-days SMA)έΝΌ αθΝκδΝ δηΫμ εδθκτθ αδ πΪθπ απσΝ κθΝ1ί-days SMA σ
αυ σΝ έθαδΝ άηα (signal) σ δΝ αλξέα δ αθκ δεά πκλ έα (uptrend)έΝ Ό αθΝ κδΝ δηΫμ
εδθκτθ αδ εΪ π απσΝ κθΝ 1ί-days SMA σ αυ σΝ έθαδΝ άηα (signal) σ δΝ αλξέα δ
εαγκ δεά πκλ έα (downtrend).
ΝαΝυπ θγυηέ κυη ί ίαέπμ σ δ, π δ ά κΝSMA αθάε δ βθΝεα βΰκλέα πθΝ δε υθ
πκυΝζ δ κυλΰκτθ η Νυ Ϋλβ β (lagging), αΝ άηα α θΝ έθαδΝπΪθ α ι εΪγαλα, κπσ
γαΝ πλΫπ δ θαΝ υθ υΪα αδ εαδΝ η Ν Ϊζζκυμ έε μ ΰδαΝ βθΝ τλ β πδκΝ αιδσπδ πθ
απκ ζ ηΪ πθ.
2) EMA (Exponential Moving Average)
Ο EMA, έθαδΝΫθαμ ιέ κυ απζσμ εαδΝεα αθκβ σμ έε βμ κΝκπκέκμ απκ ζ έ βθΝίΪ β
ΰδαΝ βθΝ τθγ β πδκΝ πκζτπζκεπθ δε υθ. ΌππμΝ κΝSMA Ϋ δ εαδΝ κΝ Μ , αθάε δ
βθΝ εα βΰκλέα πθΝ δε υθΝ πκυΝ πδί ίαδυθκυθ βθΝ Ϊ β βμΝ δηάμ η Ν υ Ϋλβ β
(lagging) εαδΝ θΝ τθα αδ θαΝ υ δ πλσίζ οβ ΰδαΝ βθΝη Ϋπ δ α πκλ έα βμΝ δηάμ.
Νία δεά δΪφκλα κυμΝ έθαδΝσ δ κθΝEMA, ξλβ δηκπκδκτθ αδ αγηέ δμ δμΝ δηΫμ,
αθαζσΰπμ η Ν κΝ δΝ πδγυηκτη θαΝ πδ τξκυη . ΓδαΝ παλΪ δΰηα, πκζζΫμ φκλΫμ
ξλβ δηκπκδκτη η ΰαζτ λβ Ϊγηδ β δμΝπδκΝπλσ φα μ δηΫμ εαδΝηδελσ λβ δμΝ
παζαδσ λ μ, δσ δ γ πλκτη σ δΝκδΝπδκΝπλσ φα μ δηΫμ πβλ Ϊακυθ π λδ σ λκ αΝ
απκ ζΫ ηα Ϊ ηαμέ
---- Μαγβηα δεάΝχΫ β EMA
λξδεΪ ξλ δαασηα δμΝ δηΫμ εζ δ έηα κμ κυΝαιδσΰλαφκυ (Close Price), εαγυμ εαδΝ
πθΝαλδγησ πθΝβη λυθ (Ν),Νη Ν κθΝκπκέκ γαΝυπκζκΰέ κυη κθΝ εγ δεσ εδθβ σ ηΫ κΝ
(EMA)
Πλυ κ ίάηα έθαδΝθαΝυπκζκΰέ κυη κθΝSMA ΰδαΝΝΝάη λ μ.
Γδα t=1 EMA1=SMA
8
EMAt= � − + � ∗ � − � − , ΰδα t>1 , (P= Close Price) εαδ 0<α<1
ΟΝ υθ ζ άμ ’α’, απκ ζ έ βθΝ Ϊγηδ β πκυΝξλβ δηκπκδκτη εαδΝυπκζκΰέα αδ πμΝ
ιάμ
αο�+
Ν αλε ΫμΝ π λδπ υ δμΝ αθα δαλγλυθκυη Ν κυμΝ παλΪΰκθ μΝ βμΝ παλαπΪθπΝ ξΫ βμΝ
εαδΝ βθΝ δα υπυθκυη ΝπμΝ ιάμ
EMAt=� ∗ � + − � ∗ � −
Μ Ν αυ άΝ βθΝ ηκλφάΝ κΝ αθαζυ άμΝ Ϋξ δΝ η ΰαζτ λβΝ υ ζδιέαΝ βθΝ Ϊγηδ βΝ πθΝ
παλαΰσθ πθέ
Ό κΝαφκλΪΝ βθΝαθΪζυ βΝ κυΝEMA, θΝγαΝα ξκζβγκτη Νπ λαδ ΫλπΝΝ δσ δΝδ ξτ δΝσ δΝ
εαδ κθΝSMA.
3) Moving Average Convergence/Divergence (MACD).
ΟΝ έε βμ αυ σμ πδθκάγβε απσΝ κθΝGerald Appel αΝ Ϋζβ βμΝ εα έαμ κυΝ1λιίέΝ
ΟΝ έε βμ απκ ζ έ ΫθαθΝευζδση θκ ηΫ κ σλκ (moving average),ΝκΝκπκέκμ έξθ δ βθΝ
η αίκζά βμΝ δηάμ εαγυμ εαδΝ βθΝ δΪλε δα βμΝ Ϊ βμ πκυΝυπΪλξ δ.
Τπκζκΰέα αδ πμΝβΝ δαφκλΪΝη αιτ κυΝ εγ δεκτ Κυζδση θκυ ΜΫ κυ (EMA2)Ν βμΝ
ΰλάΰκλβμ- ίλαξυπλσγ ηβμ π λδσ κυ εαδΝ κυΝ εγ δεκτ Κυζδση θκυ ΜΫ κυ (EMA)
βμΝ αλΰάμ- ηαελκπλσγ ηβμΝ π λδσ κυ. υθάγπμ ζαηίΪθκυη πμΝ θ δε δεΫμ δηΫμ
βθΝ 1ββ ηΫλα εαδ βθΝ βθβ ηΫλα αθ έ κδξα. πέ βμ,Ν κΝMACD απκ ζ έ αδ απσΝ βθΝ
ΰλαηηά πκυΝ κθκηΪα αδ ‘’ άηα’’Ν (signal) β κπκέα έθαδΝ Ϋθαμ εγ δεσμ ευζδση θκμ
MACD 9 άη λπθ (9 days EMA of MACD). ΣΫζκμ, Ϋξκυη εαδΝ βθΝΰλαηηά απσεζδ βμ
(divergence),ΝβΝκπκέα έθαδ βΝ δαφκλΪ κυΝMACD εαδΝ βμΝΰλαηηάμ Signal
2 EMA= Exponential Moving Average
9
---- Μαγβηα δεά χΫ β MACD
λξδεΪ ξλ δαασηα δμΝ δηΫμ εζ δ έηα κμΝ κυΝαιδκΰλΪφκυ (Close Price)
MACD= EMA(Close Price, 12 days) - EMA(Close Price, 26 days)
Signal= EMA(MACD, 9 days)
Divergence = MACD – Signal
Ό αθ β ΰλαηηά κυ MACD έθαδΝ εΪ π απσΝ βθΝ ΰλαηηά Signal, σ κδΝ δηΫμ βθΝ
αΰκλΪ παλκυ δΪακυθΝ π υ β (bear market), κπσ υπΪλξ δΝ β Ϋθ διβ σ δΝ κΝ
αιδσΰλαφκ πλΫπ δ θαΝππζβγ έ.
Ό αθ β ΰλαηηά κυ MACD έθαδΝπΪθπ απσΝ βθΝ ΰλαηηά Signal, σ βΝαΰκλΪ έθαδΝ
αθκ δεά (bull market), κπσ κτ κ έθαδ Ϋθ διβ σ δΝ κΝ αιδσΰλαφκ πλΫπ δ θαΝ
αΰκλα έ.
Ό αθΝκΝMACD αυιβγ έ απσ κηα Ν τθ κηκ ξλκθδεσ δΪ βηα, σ αυ σΝαπκ ζ έΝ
Ϋθ διβ σ δΝ κΝ αιδσΰλαφκ έθαδΝ υπ λαΰκλα ηΫθκ εαδΝ τθ κηα βΝ δηά γαΝ πδ λΫο δ
αΝφυ δκζκΰδεΪ πέπ α
4) Bollinger Bands
θαπ τξγβε ΝαπσΝ κθΝJohn Bollinger, κΝ1λκί εαδΝαπκ ζκτθ αυθ μ η αίζβ σ β αμΝ
(volatility bands)ΝκδΝκπκέ μ κπκγ κτθ αδΝπΪθπΝεαδ εΪ πΝαπσΝΫθαΝεδθβ σ ηΫ κΝσλκ.
Νη αίζβ σ β α ία έα αδΝ βθ υπδεάΝαπσεζδ β,ΝβΝκπκέαΝαζζΪα δΝεαγυμΝαζζΪα δ βΝ
η αίζβ σ β α. ΟδΝ αυθ μ δ υλτθκθ αδ αυ σηα α σ αθ αυιΪθ αδ βΝ η αίζβ σ β α
εαδΝ θ τκυθ εαγυμ η δυθ αδ βΝη αίζβ σ β α.
υ άΝ βΝ υθαηδεά φτ β πθ Bollinger Bands βηαέθ δΝ πέ βμΝ σ δ ηπκλ έΝ θαΝ
ξλβ δηκπκδβγκτθ δαφκλ δεΫμΝ εδθβ ΫμΝ αιέ μ εαδΝ αιδσΰλαφα. Γδα αθκ δεΪ άΝ
εαγκ δεΪ άηα α,Ν κδΝ Bollinger Bands ηπκλκτθ θα ξλβ δηκπκδβγκτθ ΰδαΝ κθΝ
θ κπδ ησ Μ-Tops(*) εαδΝW-Bottoms(*) ά ΰδαΝ κθΝεαγκλδ ησ βμΝ Ϊ βμ.
10
ΟδΝ ψollingerΝ ψands απκ ζκτθ αδΝ απσ ηέαΝ η αέαΝ αυθβ (middle zone) εαδ τκ
ιπ λδεΫμ (upper zone, lower zone). η αέαΝαυθβ έθαδΝΫθαμΝαπζσμ εδθβ σμ ηΫ κμΝ
σλκμΝ(SMA3), υθάγπμ πθΝ20 βη λυθ. H ηδα ιπ λδεά αυθβ υθάγπμΝκλέα αδ +2
υπδεΫμΝαπκεζέ δμ (upper zone) πΪθπ απσΝ β η αέαΝαυθβ (middle zone), θυΝβΝ
ΪζζβΝκλέα αδ -2 υπδεΫμ απκεζέ δμ (lower zone) εΪ π απσΝ β η αέαΝαυθβ.
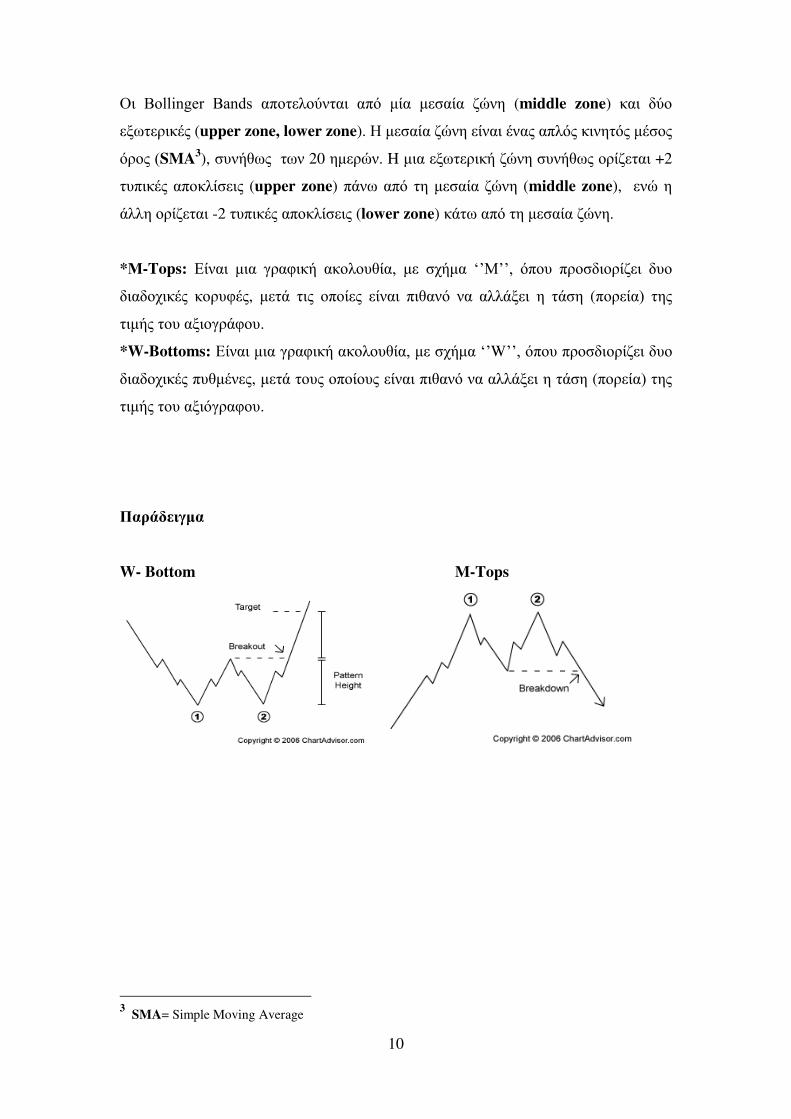
*Μ-Tops: έθαδΝ ηδαΝ ΰλαφδεά αεκζκυγέα,Ν η Ν ξάηα ‘’Μ’’,Ν σπκυ πλκ δκλέα δ υκΝ
δα κξδεΫμ εκλυφΫμ, η Ϊ δμΝ κπκέ μ έθαδΝ πδγαθσ θαΝ αζζΪι δ βΝ Ϊ β (πκλ έα)Ν βμΝ
δηάμ κυΝαιδκΰλΪφκυ.
*W-Bottoms: έθαδΝηδαΝΰλαφδεά αεκζκυγέα,Νη Ν ξάηα ‘’W’’,Νσπκυ πλκ δκλέα δ υκΝ
δα κξδεΫμ πυγηΫθ μ, η Ϊ κυμΝκπκέκυμ έθαδΝπδγαθσ θαΝαζζΪι δ βΝ Ϊ β (πκλ έα)Ν βμΝ
δηάμ κυΝαιδσΰλαφκυ.
ΠαλΪ δΰηα
W- Bottom M-Tops
3 SMA= Simple Moving Average
11
---- Μαγβηα δεά χΫ β Bollinger Bands
λξδεΪ ξλ δαασηα δμΝ δηΫμ εζ δ έηα κμΝ κυΝαιδκΰλΪφκυ (Close Price) εαδΝΫπ δ α
υπκζκΰέακυη βθΝ υπδεά απσεζδ β πθΝ δηυθ (Standard Deviation)
Middle Zone= 20 days SMA of Close Price
Upper Zone= Middle Zone + 2*Standard Deviation(20 days) of Close price
Lower Zone= Middle Zone - 2*Standard Deviation(20 days) of Close price
Μ λδεΫμ φκλΫμ αθ έ κυΝ πζκτ Κδθβ κτ ΜΫ κυ Όλκυ (SMA) ξλβ δηκπκδκτη κΝ
πζσ εγ δεσ ΜΫ κ Όλκ ( Μ )έΝ ΝαΝ πδ βηΪθκυη πέ βμ σ δΝ κ αλδγησμ πθΝ
βη λυθ πκυΝ γαΝ ξλβ δηκπκδβγ έ ΰδαΝ βθΝ τλ β κυΝ Ν SMA,Ν κθΝ έ δκ γαΝ
ξλβ δηκπκδά κυη ΰδαΝ κθΝ πλκ δκλδ ησ βμΝ υπδεάμ απσεζδ βμ βμΝ δηάμ κυΝ
αιδκΰλΪφκυ
5) Commodity Channel Index (CCI)
θαπ τξγβε απσΝ κθΝϊonald Lambert π λέπκυ κΝ 1λκί εαδΝ απκ ζ έ ΫθαθΝ ία δεσ
έε βμΝ ΰδαΝ δμΝ δηΫμ πθΝ ία δευθΝ ηπκλ υηΪ πθέ Χλβ δηκπκδ έ αδ ευλέπμ ΰδαΝ θαΝ
πλκ δκλέ δ ηδαΝ θΫαΝ Ϊ β ά θαΝ πλκ δ κπκδά δ ΰδα αελαέ μΝ η αίκζΫμ. λξδεΪ
αθαπ τξ βε ΰδαΝ κθΝ θ κπδ ησ ευεζδευθ Ϊ πθ Ν ηπκλ τηα α, αζζΪ
φαλησα αδ ιέ κυ εαζΪ εαδΝ Ϊζζκυμ έ ζκυμ (ETFs, αιδσΰλαφα, η κξΫμ ε ζ).
ΟΝCCI η λΪΝ κ λΫξκθΝ πέπ κ πθΝ δηυθ Ν ξΫ βΝη Ν κ ηΫ κΝ πέπ κ πθΝ δηυθ Ν
ηδαΝ κηΫθβ ξλκθδεάΝπ λέκ κ. ΟΝCCI έθαδΝ ξ δεΪ υοβζσμ,Νσ αθΝκδΝ δηΫμΝ έθαδ πκζτΝ
πΪθπΝαπσ κθΝηΫ κΝσλκΝ κυμ. θ έγ α, κΝCCI έθαδΝ ξ δεΪ ξαηβζσμ,Νσ αθΝκδΝ δηΫμ
έθαδΝπκζτΝξαηβζσ λ μΝαπσ κθΝηΫ κΝσλκΝ κυμ.
Μ Ν αυ σθΝ κθΝ λσπκ, κΝ CCI ηπκλ έ θα ξλβ δηκπκδβγ έΝ ΰδαΝ κθΝ θ κπδ ησ θσμΝ
υπ λαΰκλα ηΫθκυΝ(overbought), άΝυπ λπκυζβηΫθκυΝ έ ζκυ (oversell).

12
Μαγβηα δεΪ δα υπυθ αδ πμΝ ιάμ
---- Μαγβηα δεά χΫ β CCI
λξδεΪ ξλ δαασηα δμΝ δηΫμ εζ δ έηα κμ κυΝ αιδκΰλΪφκυ (Close Price), βθΝ
υοβζσ λβ δηβΝ(High Price) εαδΝ βθΝξαηβζσ λβ δηά (Low Price).
Τπκζκΰέακυη Ν βθΝΣυπδεάΝΣδηάΝ(Typical Price)Ν κυΝαιδσΰλαφκυ
Typical Price= � � + � + � �
CCI= � �� � – �� � � �� �, ∗ �� � �
Ό αθΝ κΝCCI ίλέ ε αδ πΪθπ απσΝ κΝ πέπ κ πθ +100 ηκθΪ πθ, σ αυ σΝ έθαδΝ
Ϋθ διβ σ δΝ κΝαιδσΰλαφκ αεκζκυγ έ αθκ δεά Ϊ β, κπσ έθαδΝ υεαδλέα ΰδαΝαΰκλΪ.
Ό αθΝκΝCCI ίλέ ε αδ εΪ π απσΝ δμΝ-100 ηκθΪ μ, σ αυ σΝαπκ ζ έΝΫθ διβ σ δΝ κΝ
αιδσΰλαφκ αεκζκυγ έ εαγκ δεά Ϊ β, κπσ έθαδΝ υεαδλέα ΰδαΝπυζβ β.
Ν π λδπ υ δμ σπκυ κδΝ δηΫμ +1ίίΝ εαδΝ -100 κυΝCCI έθαδΝ αλε Ϊ υξθΫμ Ν ΫθαΝ
αιδσΰλαφκ, σ υθάγπμ δ υλτθκθ αδ κΝ+βίίΝεαδΝ-200,Νυ ΝθαΝ ζΫΰικυη αεσηα
πδκΝαελαέ μ δηΫμ.
6) Relative Strength Index (RSI)
πδθκάγβε απσΝ κθΝ Welles Wilder,Ν κΝ 1λικΝ εαδΝ ηπέπ δ βθΝ εα βΰκλέα πθΝ
αζαθ π υθ (oscillator). Σκτ κμ κΝ έε βμ η λΪ δΝ βθΝ αξτ β α εαδΝ βθΝαζζαΰά πθΝ
δαευηΪθ πθΝ πθΝ δηυθέΝ έθαδΝΫθαΝδ δαέ λα βηκφδζάμ έε βμ πκυΝξλβ δηκπκδ έ αδ
υλΫπμ βθΝ ξθδεά αθΪζυ β.
13
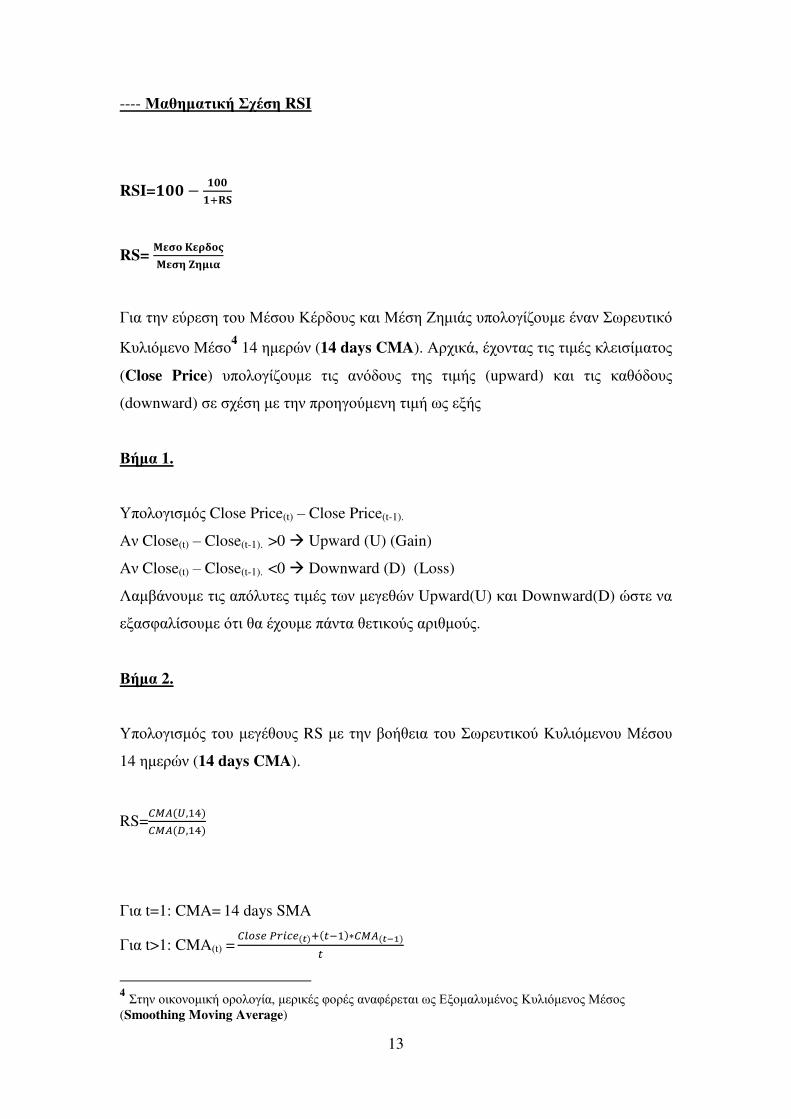
---- Μαγβηα δεά χΫ β RSI
RSI= − +
RS= �
ΓδαΝ βθΝ τλ β κυΝΜΫ κυ ΚΫλ κυμ εαδΝΜΫ β βηδΪμ υπκζκΰέακυη ΫθαθΝπλ υ δεσ
Κυζδση θκ ΜΫ κ4 14 βη λυθ (14 days CMA). λξδεΪ, Ϋξκθ αμ δμΝ δηΫμ εζ δ έηα κμ
(Close Price) υπκζκΰέακυη δμΝ αθσ κυμ βμΝ δηάμ (upward) εαδΝ δμΝ εαγσ κυμ
(downward) Ν ξΫ β η Ν βθΝπλκβΰκτη θβ δηά πμΝ ιάμ
άηα 1.
Τπκζκΰδ ησμ Close Price(t) – Close Price(t-1).
θ Close(t) – Close(t-1). >0 Upward (U) (Gain)
θ Close(t) – Close(t-1). <0 Downward (D) (Loss)
ΛαηίΪθκυη δμΝαπσζυ μ δηΫμ πθΝη ΰ γυθ Upward(U) εαδΝDownward(D) υ ΝθαΝ
ια φαζέ κυη σ δΝγαΝΫξκυη πΪθ α γ δεκτμ αλδγηκτμ.
άηα 2.
Τπκζκΰδ ησμ κυΝη ΰΫγκυμ RS η Ν βθΝίκάγ δα κυ πλ υ δεκτ Κυζδση θκυ ΜΫ κυ
14 βη λυθ (14 days CMA).
RS=�� �, 4�� , 4
Γδα t=1: CMA= 14 days SMA
Γδα t>1: CMA(t) =
�� � � ��� � + − ∗ �� �−1
4 βθΝκδεκθκηδεάΝκλκζκΰέα,Νη λδεΫμΝφκλΫμΝαθαφΫλ αδΝπμΝ ικηαζυηΫθκμΝΚυζδση θκμΝΜΫ κμΝ
(Smoothing Moving Average)
14
ΝαΝ βη δυ κυη σ δΝ θαζζαε δεΪ ηπκλ έ θαΝ ξλβ δηκπκδβγ έ ιέ κυ εαζΪ εαδΝ Ϋθαμ
εγ δεσμ ευζδση θκμ ηΫ κμ
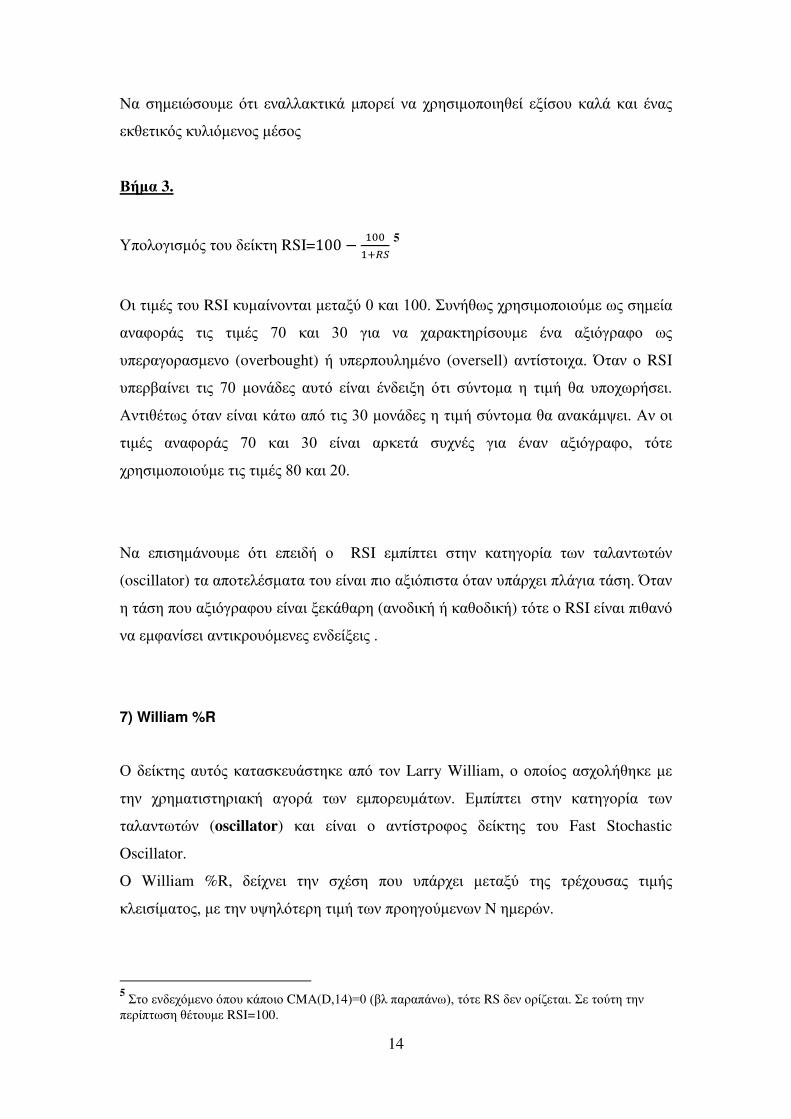
άηα 3.
Τπκζκΰδ ησμΝ κυΝ έε β RSI= − + 5
ΟδΝ δηΫμ κυΝRSI ευηαέθκθ αδ η αιτ ίΝεαδΝ1ίίέΝυθάγπμ ξλβ δηκπκδκτη πμΝ βη έα
αθαφκλΪμ δμΝ δηΫμ ιίΝ εαδΝ γίΝ ΰδαΝ θαΝ ξαλαε βλέ κυη ΫθαΝ αιδσΰλαφκ πμΝ
υπ λαΰκλα η θκΝ (overbought) άΝ υπ λπκυζβηΫθκΝ (oversell) αθ έ κδξαέΝΌ αθ κΝRSI
υπ λίαέθ δ δμΝ ιίΝ ηκθΪ μ αυ σΝ έθαδΝ Ϋθ διβ σ δΝ τθ κηα βΝ δηά γαΝ υπκξπλά δ.
θ δγΫ πμ σ αθΝ έθαδΝεΪ π απσΝ δμΝγίΝηκθΪ μ βΝ δηά τθ κηα γαΝαθαεΪηο δέΝ θΝκδΝ
δηΫμ αθαφκλΪμ ιίΝ εαδΝ γίΝ έθαδΝ αλε Ϊ υξθΫμ ΰδαΝ ΫθαθΝ αιδσΰλαφκ, σ
ξλβ δηκπκδκτη δμΝ δηΫμ κίΝεαδΝβίέ
ΝαΝ πδ βηΪθκυη σ δΝ π δ ά κΝ RSI ηπέπ δΝ βθΝ εα βΰκλέα πθΝ αζαθ π υθ
(oscillator) αΝαπκ ζΫ ηα α κυΝ έθαδΝπδκΝαιδσπδ α σ αθΝυπΪλξ δ πζΪΰδα Ϊ βέΝΌ αθΝ
βΝ Ϊ β πκυΝαιδσΰλαφκυ έθαδΝι εΪγαλβ (αθκ δεά άΝεαγκ δεά) σ κΝRSI έθαδΝπδγαθσ
θαΝ ηφαθέ δ αθ δελκυση θ μ θ έι δμ .
7) William %R
ΟΝ έε βμ αυ σμ εα α ε υΪ βε απσΝ κθΝLarry William,Ν κΝκπκέκμ α ξκζάγβε η Ν
βθΝ ξλβηα δ βλδαεά αΰκλΪ πθΝ ηπκλ υηΪ πθ. ηπέπ δ βθΝ εα βΰκλέα πθΝ
αζαθ π υθ (oscillator) εαδΝ έθαδ κΝ αθ έ λκφκμ έε βμ κυΝ Fast Stochastic
Oscillator.
O William %R, έξθ δ βθΝ ξΫ β πκυΝ υπΪλξ δ η αιτ βμΝ λΫξκυ αμ δηάμ
εζ δ έηα κμ,Νη Ν βθΝυοβζσ λβ δηά πθΝπλκβΰκτη θπθ N βη λυθ.
5 κΝ θ ξση θκΝσπκυΝεΪπκδκΝCMA(D,1ζ)οίΝ(ίζΝπαλαπΪθπ),Ν σ ΝRS θΝκλέα αδέΝ Ν κτ βΝ βθΝπ λέπ π βΝγΫ κυη ΝRSI=100.
15
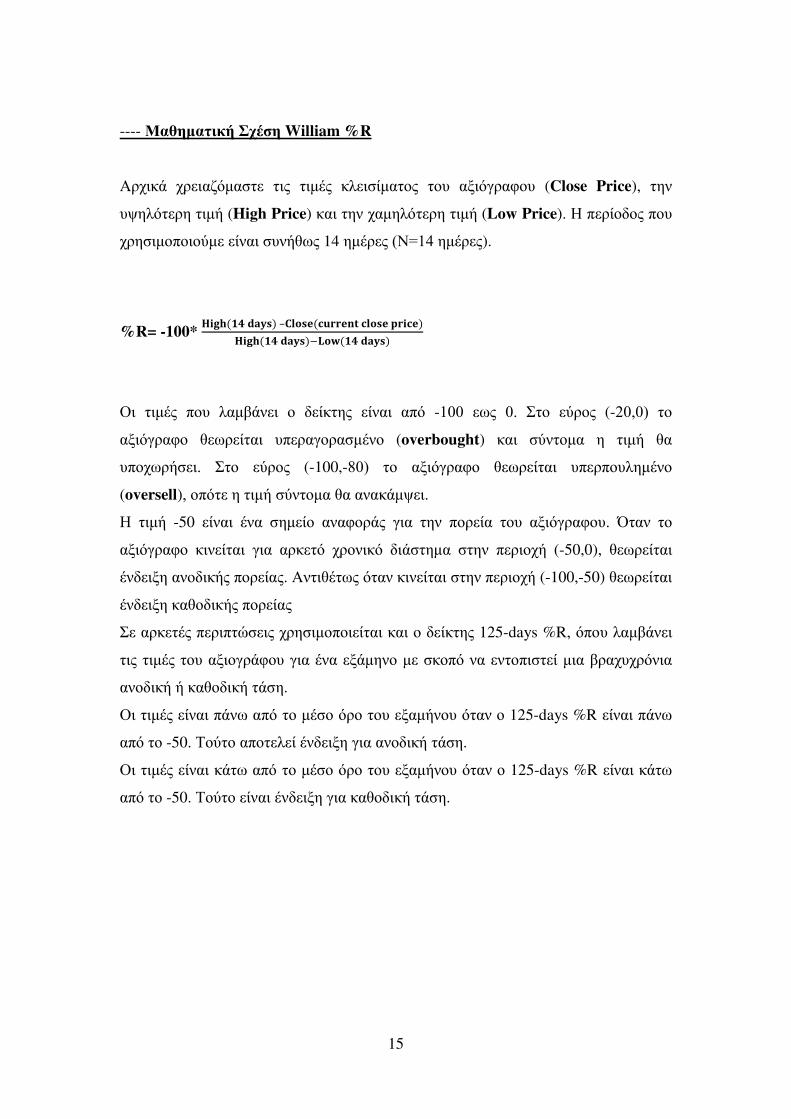
---- Μαγβηα δεά χΫ β William %R
λξδεΪ ξλ δαασηα δμΝ δηΫμ εζ δ έηα κμ κυΝ αιδσΰλαφκυ (Close Price), βθΝ
υοβζσ λβ δηά (High Price) εαδΝ βθΝξαηβζσ λβ δηά (Low Price). Νπ λέκ κμ πκυΝ
ξλβ δηκπκδκτη έθαδΝ υθάγπμ 14 βηΫλ μ (Νο1ζΝβηΫλ μ).
%R= -100* � �� –�� � � �� − � ��
ΟδΝ δηΫμ πκυΝ ζαηίΪθ δ κΝ έε βμ έθαδΝ απσΝ -1ίίΝ πμΝ ίέ κΝ τλκμ (-βί,ί)Ν κΝ
αιδσΰλαφκ γ πλ έ αδ υπ λαΰκλα ηΫθκΝ (overbought) εαδΝ τθ κηαΝ βΝ δηάΝ γαΝ
υπκξπλά δέΝ κΝ τλκμ (-100,-κί)Ν κΝ αιδσΰλαφκ γ πλ έ αδ υπ λπκυζβηΫθκ
(oversell),Νκπσ ΝβΝ δηάΝ τθ κηα γαΝαθαεΪηο δ.
Ν δηά -50 έθαδ ΫθαΝ βη έκ αθαφκλΪμ ΰδαΝ βθΝ πκλ έα κυΝ αιδσΰλαφκυέΝ Ό αθΝ κΝ
αιδσΰλαφκ εδθ έ αδ ΰδαΝ αλε σ ξλκθδεσ δΪ βηα βθΝ π λδκξά (-50,0), γ πλ έ αδ
Ϋθ διβ αθκ δεάμ πκλ έαμ. θ δγΫ πμ σ αθΝεδθ έ αδ βθΝπ λδκξά (-100,-50) γ πλ έ αδ
Ϋθ διβ εαγκ δεάμ πκλ έαμ
Ναλε Ϋμ π λδπ υ δμ ξλβ δηκπκδ έ αδΝεαδΝκΝ έε βμ 125-days %R, σπκυ ζαηίΪθ δ
δμΝ δηΫμ κυΝαιδκΰλΪφκυ ΰδαΝΫθα ιΪηβθκ η Ν εκπσ θαΝ θ κπδ έ ηδαΝίλαξυξλσθδα
αθκ δεά άΝεαγκ δεά Ϊ β.
ΟδΝ δηΫμ έθαδΝπΪθπ απσΝ κΝηΫ κ σλκ κυΝ ιαηάθκυ σ αθΝκΝ125-days %R έθαδΝπΪθπ
απσΝ κΝ-50. Σκτ κ απκ ζ έΝΫθ διβ ΰδαΝαθκ δεά Ϊ β.
ΟδΝ δηΫμ έθαδΝεΪ π απσΝ κΝηΫ κ σλκ κυΝ ιαηάθκυ σ αθΝκΝ125-days %R έθαδΝεΪ π
απσΝ κΝ-50. Σκτ κ έθαδΝΫθ διβ ΰδαΝεαγκ δεά Ϊ β.
16
8) Stochastic Oscillator
ηπθ υ άμ αυ κτ κυΝ έε β ά αθ κΝGeorge Lane, αθαζυ άμΝ εαδΝ ξλβηα δ άμ,Ν κΝ
κπκέκμ κθΝ εα α ε τα κΝ 1ληίέΝ ηπέπ δ βθΝ εα βΰκλέα πθΝ αζαθ π υθ
(oscillator) εαδΝ τηφπθα η Ν κθΝGeorge Lane θΝζαηίΪθ δΝυπσοβ κτ βθΝ δηά κυΝ
αιδσΰλαφκυ κτ κθΝ σΰεκ υθαζζαΰυθέΝ εκζκυγ έ βθΝ αζζαΰά βμΝ Ϊ βμ
(momentum) κυΝ αιδσΰλαφκυ, κπσ απκ ζ έ ΫθαθΝ εα Ϊζζβζκ έε β ΰδαΝ κθΝ
θ κπδ ησ βμΝαζζαΰά η αιτ πθΝαθκ δευθ εαδΝεαγκ δευθ Ϊ πθ.
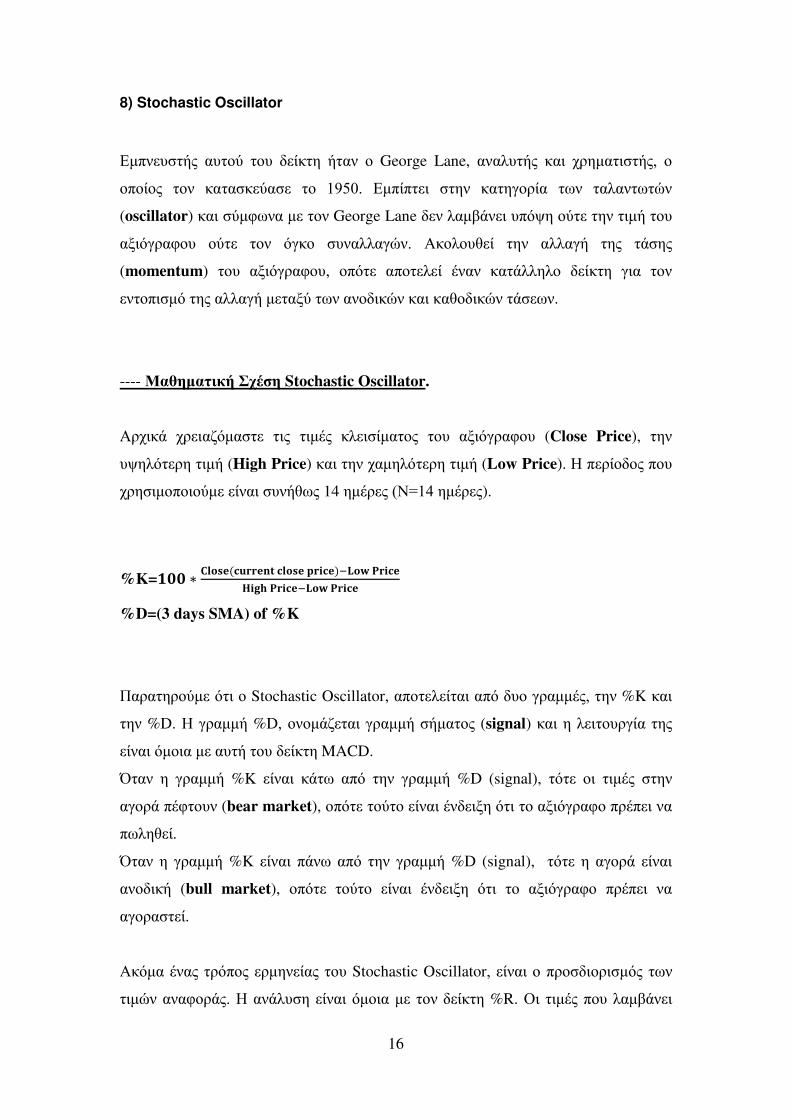
---- Μαγβηα δεά χΫ β Stochastic Oscillator.
λξδεΪ ξλ δαασηα δμΝ δηΫμ εζ δ έηα κμ κυΝ αιδσΰλαφκυ (Close Price), βθΝ
υοβζσ λβ δηά (High Price) εαδΝ βθΝξαηβζσ λβ δηά (Low Price). Νπ λέκ κμ πκυΝ
ξλβ δηκπκδκτη έθαδΝ υθάγπμ 14 βηΫλ μ (Νο1ζΝβηΫλ μ).
%K= ∗ �� � − � �� � − � �
%D=(3 days SMA) of %K
Παλα βλκτη σ δΝκΝStochastic Oscillator, απκ ζ έ αδ απσΝ υκΝΰλαηηΫμ,Ν βθΝ%K εαδΝ
βθΝ%D. Νΰλαηηά %D, κθκηΪα αδ ΰλαηηά άηα κμ (signal) εαδΝβΝζ δ κυλΰέα βμΝ
έθαδΝσηκδα η Ναυ άΝ κυΝ έε β MACD.
Ό αθ β ΰλαηηά %K έθαδΝ εΪ π απσΝ βθΝ ΰλαηηά %D (signal), σ κδΝ δηΫμ βθΝ
αΰκλΪ πΫφ κυθ (bear market), κπσ κτ κ έθαδΝΫθ διβ σ δΝ κΝαιδσΰλαφκ πλΫπ δ θαΝ
ππζβγ έ.
Ό αθ β ΰλαηηά %K έθαδΝ πΪθπ απσΝ βθΝ ΰλαηηά %D (signal), σ βΝ αΰκλΪ έθαδΝ
αθκ δεά (bull market), κπσ κτ κ έθαδ Ϋθ διβΝ σ δΝ κΝ αιδσΰλαφκΝ πλΫπ δ θαΝ
αΰκλα έ.
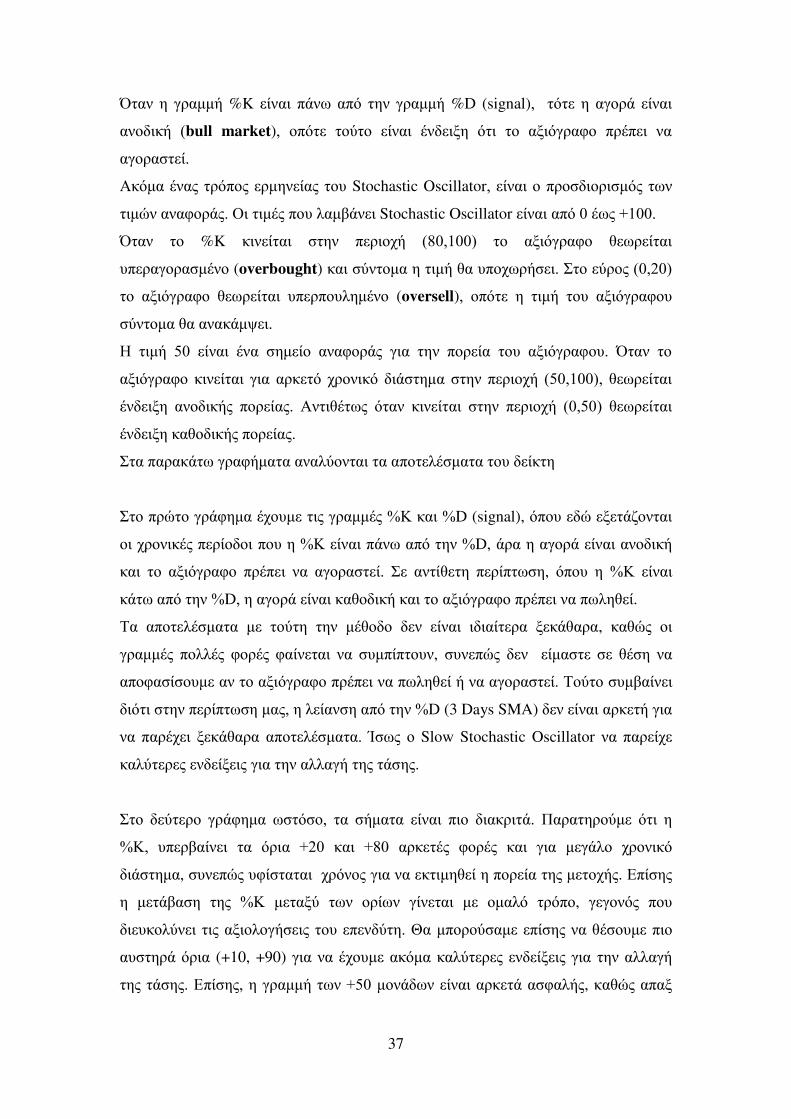
εσηα Ϋθαμ λσπκμ ληβθ έαμ κυΝStochastic Oscillator,Ν έθαδΝκΝπλκ δκλδ ησμ πθΝ
δηυθ αθαφκλΪμέΝ ΝαθΪζυ β έθαδΝσηκδα η Ν κθΝ έε β %R. ΟδΝ δηΫμ πκυΝζαηίΪθ δ
17
Stochastic Oscillator έθαδ απσ 0 Ϋπμ +1ίίέΝ ΌππμΝ εαδΝ κΝ έε βμ %R Ϋ δ εαδΝ κΝ
Stochastic Oscillator, Ϋξ δ δηΫμ αθαφκλΪμ σ αθΝ κΝαιδσΰλαφκ έθαδΝυπ λαΰκλα ηΫθκ
(overbought) εαδΝσ αθ έθαδΝΝυπ λπκυζβηΫθκ (oversell).
Ό αθΝ κΝ %K εδθ έ αδ βθ π λδκξά (κί,1ίί)Ν κΝ αιδσΰλαφκ γ πλ έ αδ
υπ λαΰκλα ηΫθκ (overbought) εαδΝ τθ κηαΝβΝ δηάΝγαΝυπκξπλά δέΝ κΝ τλκμ (0,20)
κΝ αιδσΰλαφκ γ πλ έ αδ υπ λπκυζβηΫθκ (oversell),Ν κπσ Ν βΝ δηάΝ κυΝ αιδσΰλαφκυΝ
τθ κηα γαΝαθαεΪηο δ.
Γ θδεΪ,Νσ αθΝκΝ έε βμ εδθ έ αδ βθΝπ λδκξά (80,100), απκ ζ έ Ϋθ διβ σ αθΝβΝ δηά
ίλέ ε αδ εκθ Ϊ αΝ υοβζά βμΝ εΪ κ Ν π λδσ κυ,Ν θυΝ βθΝ π λδκξά (ί,βί)Ν αΝ
ξαηβζΪ βμΝ εΪ κ Νπ λδσ κυ.
Ν δηά 50 έθαδ ΫθαΝ βη έκ αθαφκλΪμ ΰδαΝ βθΝ πκλ έα κυΝ αιδσΰλαφκυέΝ Ό αθΝ κΝ
αιδσΰλαφκ εδθ έ αδ ΰδαΝ αλε σ ξλκθδεσ δΪ βηα βθΝ π λδκξά (50,100), γ πλ έ αδ
Ϋθ διβ αθκ δεάμ πκλ έαμ. θ δγΫ πμ σ αθΝ εδθ έ αδ βθΝ π λδκξά (0,50) γ πλ έ αδ
Ϋθ διβ εαγκ δεάμ πκλ έαμ.
Ν αυ σΝ κΝ βη έκ αιέα δ θαΝ αθαφΫλκυη εαδΝ η λδεΫμ παλαζζαΰΫμ κυΝ Stochastic
Oscillator. Μ Ν η λδεΫμ πλκ γάε μ εαδΝ παλαη λκπκδά δμ κΝ Stochastic Oscillator
η α λΫπ αδ Ν υκΝαεσηα έε μ.
1) Fast Stochastic Oscillator (ά Stochastic Oscillator). Σκτ κμ έθαδΝ κΝ ία δεσμ
έε βμ,ΝκΝκπκέκμ πδθκάγβε απσΝ κθΝΝGeorge LaneέΝΣβθΝηαγβηα δεά κυΝ κηά βθΝ
αθαπ τιαη πλσ λα,Νκπσ θΝγαΝαθαφ λγκτη Νπ λαδ ΫλπΝΰδαΝ βθΝζ δ κυλΰέα κυέ
2) Slow Stochastic Oscillator. υ σμ κ έε βμ ία έα αδ πλκ αληκΰά κυ Fast
Stochastic Oscillator. Ν δα δεα έαΝΰδαΝ βθΝ τλ β κυΝ έε β έθαδΝ ιαδλ δεΪΝαπζά.
α) λξδεΪ υπκζκΰέακυη κθ Fast Stochastic Oscillator (Fast %Κ)
Fast %Κ= ∗ Cl e c e cl e ce −L w P ceH P ce−L w P ce
ί) Τπκζκΰδ ησμ κυΝευζδση θκυ ηΫ κυ 3 άη λπθ κυΝFast Stochastic Oscillator, κ
κπκέκ απκ ζ έ βθΝΰλαηηά Slow ΣΚέ
18
ΰ) Τπκζκΰδ ησμ κυΝευζδση θκυ ηΫ κυ 3 άη λπθ κυΝSlow %K, κ κπκέκ απκ ζ έ
βθΝΰλαηηά Slow %D (signal)
Slow %K= (3 days SMA) of Fast Stochastic Oscillator
Slow %D=(3 days SMA) of Slow %K
Ο Slow Stochastic Oscillator Ϋξ δ παλα βλβγ έ σ δ παλΫξ δ εαζτ λα απκ ζΫ ηα α,
δσ δ β ‘’ζ έαθ β (smoothing)’’Ν πκυ φαλησα δ κ ευζδση θκμ ηΫ κμ (SMA) κθ
έε β Fast Stochastic Oscillator παλΫξ δ εαζτ λα άηα α ΰδα βθ αζζαΰά βμ Ϊ βμ
(momentum) κυ αιδκΰλΪφκυ.
3) Full Stochastic Oscillator. ΟΝ έε βμ αυ σμ έθ δ βθΝ υθα σ β α
παλαη λκπκέβ βμ πθ π λδσ πθ ΰδαΝ βθΝ τλ β πθΝΰλαηηυθ %K εαδΝ%D.
λξδεΪ υπκζκΰέακυη κθΝ Fast Stochastic OscillatorέΝ ΌππμΝ Ϋξκυη πλκαθαφΫλ δ,
υθάγπμ ζαηίΪθκυη ηδαΝ π λέκ κ 14 βη λυθ, π σ κ βθΝ υΰε ελδηΫθβ
π λέπ π β,Ν ΰδαΝ βθΝ τλ β κυΝ Full Stochastic Oscillator, ηπκλκτη θαΝ
πλκ αλησακυη κθΝαλδγησ πθΝβη λυθ.
α) Τπκζκΰδ ησμ Fast Stochastic Oscillator (Fast %Κ) ΰδα Ν βηΫλ μ
Fast %Κ= ∗ Cl e c e cl e ce −L w P ceH P ce−L w P ce
ί) Τπκζκΰδ ησμ κυΝευζδση θκυ ηΫ κυ M1 βη λυθ κυΝFast Stochastic Oscillator, βΝ
κπκέα απκ ζ έ βθΝΰλαηηά Full ΣΚέ
ΰ) Τπκζκΰδ ησμ κυΝευζδση θκυ ηΫ κυ M2 βη λυθ κυΝFull ΣΚ,ΝβΝκπκέα απκ ζ έ
βθΝΰλαηηά Full %D (signal)
Full %K= (M1 days SMA) of Fast Stochastic Oscillator
Full %D=(M2 days SMA) of Full %K
19
------ ΙΚΣ ΝΘ Μ ΛΙΧ ΟΤ Ν ΛΤΗ
βθΝ θσ β α αυ άΝ γαΝ αθαπ τικυη η λδεκτμ έε μ πκυΝ ξλβ δηκπκδκτθ αδ βθΝ
γ η ζδυ β αθΪζυ β,Ν κδΝ κπκέκδ αθ ζκτθ αδ ευλέπμ απσΝ βθΝ ξλβηα κκδεκθκηδεά
ζκΰδ δεά. ε σμ πθΝ δε υθ αυ υθ,Ν κΝ αθαζυ άμ ηπκλ έ θαΝ ζΪί δΝ κηΫθα πκυΝ
αφκλκτθ κθΝ εζΪ κ κθΝ κπκέκ υπΪΰ αδ βΝ αδλέα, εαγυμ εαδ κΝ ΰ θδεσ λκ
κδεκθκηδεσ εζέηα, υ Ν θαΝ ε δηά δ η Ν η ΰαζτ λβ αελέί δα βθΝ πκλ έα βμΝ
αδλέαμέΝ (πέξέΝ Π,Ν Ι κατΰδκ Σλ ξκυ υθ υθαζζαΰυθ, έε μ ξλΫκυμ, έε μ
ζζ έηηα κμ- πζ κθΪ ηα κμ, πέπ κ πζβγπλδ ηκτ,Ν πδ σεδκΝκηκζσΰπθ ε ζ).
πέ βμ,Ν υθέ α αδΝεαδΝβΝ ιΫ α βΝπκδκ δευθΝ δε υθΝσππμΝ κΝ πδξ δλβηα δεσΝ ξΫ δκΝ
βμ αδλέαμΝ (business plan), βΝ πδξ δλβηα δεάΝ λα βΰδεάΝ (business strategy), βΝ
αθαΰθπλδ δησ β α- ππθυηέαΝ (trademark), βΝ ξΫ βΝ η Ν κυμΝ π ζΪ μΝ (customer
relationships), βΝ φάηβΝ (reputation) βΝ υπ λαιέαΝ (goodwill),Ν βΝ Ϋλ υθα εαδΝ αθΪπ υιβΝ
(R&D) ε ζέΝΣκτ α αΝ κηΫθαΝαπκ ζκτθΝΫθαΝ έ κμΝΪυζκυΝπ λδκυ δαεκτΝ κδξ έκυΝ
ΰδαΝ βθΝ αδλέα,Ν α κπκέαΝκΝ ιπ λδεσμΝαθαζυ άμΝπκζζΫμΝφκλΫμ θΝΫξ δ πλσ ία β,Ν
κπσ α υθα έ θαΝ αΝ πκ κ δεκπκδά δ. ΜΪζδ α,Ν πκζζΪΝ απσΝ αυ ΪΝ αΝ κηΫθαΝ
απκ ζκτθΝεαδΝίδκηβξαθδεΪΝηυ δεΪΝ βμΝεΪγ Ν αδλέαμΝεαδΝπαλΫξκθ αδΝησθκΝΰδαΝ βθΝ
π λδεάΝπζβλκφσλβ βΝ πθΝη ζυθΝ βμΝ αδλέαμέ
ΟδΝ έε μ πκυΝγαΝξλβ δηκπκδκτη ΰδαΝ βθΝγ η ζδυ β αθΪζυ β έθαδΝκδΝ ιάμ
1) λδγηκ έε βμΝΓ θδεάμΝΡ υ σ β αμ ( ΓΡ)
2) λδγηκ έε βμΝΚαγαλκτΝΚΫλ κυμ ( ΚΚ)Ν
3) λδγηκ έε βμΝ πκ κ δεσ β αμΝ θ λΰβ δεκτΝ(AAE – ROA)
4) λδγηκ έε βμΝ πκ κ δεσ β αμΝΙ έπθΝΚ φαζαέπθ (AAΙΚ-ROE)
5) λδγηκ έε βμΝΙ έπθΝΚ φαζαέπθΝπλκμΝυθκζδεΪΝΚ φΪζαδα (AΙΚ)
6) ΚΫλ βήΝΜ κξά (EPS)
7) λδγηκ έε βμΝΣαξτ β αμΝΚυεζκφκλέαμΝΊ δπθΝΚ φαζαέπθΝ( ΣΚΙΚ)
8) Ππζά δμΝ
9) ΚΫλ βΝπλκΝφσλπθΝ( Σ)
10) ΚΫλ βΝη ΪΝΝφσλπθΝ(ΚαγαλΪΝΚΫλ β)
20
1) λδγηο έε βμΝΓ θδεάμΝΡ υ σ β αμ Χ ΓΡΨ
ΟΝαλδγηκ έε βμΝαυ σμΝ έξθ δΝπσ μΝφκλΫμΝ κΝευεζκφκλκτθΝ θ λΰβ δεσΝ βμΝ αδλέαμΝ
ηπκλ έΝ θαΝ εαζτο δΝ δμΝ ίλαξυπλσγ η μΝ υπκξλ υ δμέΝ έθαδΝ ΫθαμΝ απσΝ κυμΝ πδκΝ
ξλά δηκυμΝ αλδγηκ έε μΝ δσ δ θΝ έξθ δΝ ησθκΝ κΝ ίαγησΝ λ υ σ β αμΝ βμΝ
πδξ έλβ βμΝ αζζΪΝ εαδΝ κΝ ίαγησΝ α φΪζ δαμΝ πκυΝ δα βλ έΝ βΝ δκέεβ βΝ Ϋθαθ δΝ
αθ πδγτηβ πθΝ ι ζέι πθ βμΝ λκάμΝ πθΝ ε φαζαέπθΝ εέθβ βμέ ΣκΝ ηΫΰ γκμΝ κυΝ
αλδγηκ έε βΝ εαγκλέα αδΝ απσΝ πκδεέζκυμΝ παλΪΰκθ μΝ σππμΝ βΝ πκδσ β αΝ πθΝ
ευεζκφκλδαευθΝ κδξ έπθ,Ν δμΝ λΫξκυ μΝ αθΪΰε μΝ εαδΝ Ν υπκξλ υ δμΝ βμΝ αδλέαμέΝ
ε σμΝαυ υθΝ πθΝπαλαΰσθ πθΝκΝαθαζυ άμΝγαΝπλΫπ δΝθαΝζαηίΪθ δΝυπσοβΝεαδΝη λδεΪΝ
αεσηβΝ κδξ έαΝ πκυΝ αφκλκτθΝ βθΝ αδλέα,Ν σππμΝ κυμΝ σλκυμΝ ξκλάΰβ βμΝ πθΝ
πδ υ πθ,Ν βθΝ τπαλιβΝ πκξδεσ β αμΝ βμΝ αδλέαμ,Ν βθΝ πκλ έαΝ πθΝ λ ξκυ υθΝ
υθαζζαΰυθ,Ν πθΝ ευεζκφκλδαευθΝ κδξ έπθΝ εαδΝ πθΝ απκγ ηΪ πθ, ΰδαΝ πΫθ Ν Ϋ βΝ
κυζΪξδ κθ, εαδΝ κΝτοκμΝ πθΝαπαδ ά πθέ
---- Μαγβηα δεάΝχΫ βΝ λδγηκ έε β Γ θδεάμΝΡ υ σ β αμ.
ΓΡο � �+ � + � �� � �
2ΨΝ λδγηο έε βμΝΚαγαλοτ ΚΫλ ουμ Χ ΚΚΨΝ
ΟΝ αλδγηκ έε βμΝ αυ σμΝ έξθ δΝ κΝ πκ κ σΝ εαγαλκτΝ εΫλ κυμΝ πκυΝ πδ υΰξΪθ δΝ βΝ
πδξ έλβ βΝαπσΝ δμΝζ δ κυλΰδεΫμΝ λα βλδσ β μ (ππζά δμ)έΝΌ κΝη ΰαζτ λκμΝ έθαδΝ
κΝ ΚΚΝ σ κΝ πδκΝ πδε λ άμΝ έθαδΝ βΝ αδλέαέΝ έθαδΝ έ πμΝ απσΝ κυμΝ πδκΝ ξλά δηκυμΝ
αλδγηκ έε μ,Ν κηΫθκυΝ σ δΝ βΝ δκέεβ βΝ αιδκζκΰ έ δμΝ πλκίζΫο δμΝ βμΝ ΰδαΝ αΝ
η ζζκθ δεΪΝ εΫλ βΝ ία δαση θβΝ δμΝ ε δηά δμΝ ΰδαΝ δμΝ ππζά δμΝ εαδΝ Ν αυ σθΝ κθΝ
έε βέΝΜ Ν α δ δεΫμ- ηαγβηα δεΫμΝη γσ κυμΝ έηα Ν Ν γΫ βΝ θαΝπλκ ΰΰέ κυη Ν
δεαθκπκδβ δεΪΝ αΝη ζζκθ δεΪΝεΫλ βΝαπσΝ αΝ κηΫθαΝ πθΝππζά πθέ
21
---- Μαγβηα δεάΝχΫ βΝ λδγηκ έε β ΚαγαλκτΝΚΫλ κυμ.
ΚΚο � � � ���
3ΨΝ λδγηο έε βμΝ πο ο δεσ β αμΝ θ λγβ δεοτΝ(AAE – ROA)
ΟΝ Ν έξθ δΝ κΝ ίαγησΝ απκ κ δεσ β αμΝ κυΝ θ λΰβ δεκτ,Ν βζα άΝ κΝ ίαγησΝ
αιδκπκέβ βμΝ πθΝπ λδκυ δαευθΝ κδξ έπθΝ βμΝ αδλέαμέΝΜ Ν κθΝ έε βΝαυ σΝΫξκυη Ν
βθΝ υθα σ β αΝΝ
α)Ν ΝαΝ ι Ϊακυη Ν δαξλκθδεΪΝ βθΝ απκ κ δεσ β αΝ κυΝ θ λΰβ δεκτΝ εαδΝ θαΝ βΝ
υΰελέθκυη Νη ΝΪζζ μΝκηκ δ άμΝ πδξ δλά δμ,Νυ ΝθαΝπαλαεκζκυγκτη ΝαθΝ έηα Ν
Ν υθκρεσ λβΝγΫ βΝΝ
ί)Ν ΝαΝ υΰελέθκυη Ν βθΝ απκ κ δεσ β αΝ βμΝ αδλέαμΝ η Ν θαζζαε δεΫμΝ ηκλφΫμΝ
π θ τ πθΝΝ
ΰ)ΝΝαΝ δ λ υθκτη Ν δαξλκθδεΪΝ βθΝ υθαηδεσ β αΝ βμΝ αδλέαμΝκυ δα δεσ λαΝεαδΝπδκΝΝ
αθ δε δη θδεΪ,Ν εαγυμΝ κΝ Ν έθαδΝ πδκΝ αιδσπδ κμΝ έε βμΝ τΰελδ βμΝ Ν ξΫ βΝ η Ν
ΪζζκυμΝ έε μέ
Ν ΰ θδεΫμΝ ΰλαηηΫμ,Ν σ κΝ η ΰαζτ λκμΝ έθαδΝ κΝ ,Ν σ κΝ πδκΝ απκ ζ ηα δεΪΝ
αιδκπκδκτθ αδΝ αΝπ λδκυ δαεΪΝ κδξ έαΝ βμΝ αδλέαμ
---- Μαγβηα δεάΝχΫ βΝ λδγηκ έε β πκ κ δεσ β αμΝ θ λΰβ δεκτ.
ROA=� � � ��
22
4) λδγηο έε βμΝ πο ο δεσ β αμΝΙ έωθΝΚ φαζαέωθ ΧAAΙΚ-ROE)
ΟΝ ΙΚΝ εφλΪα δΝ κΝ ίαγησΝ απκ κ δεσ β αμΝ πθΝ δ έπθΝ ε φαζαέπθ,Ν βζα άΝ πσ κΝ
παλαΰπΰδεΪΝ ξλβ δηκπκδβγάεαθΝ αΝ ε φΪζαδαΝ πκυΝ δΫγ αθΝ κδΝ ηΫ κξκδέΝ Ό κΝ
υοβζσ λκμΝ έθαδΝ κΝ ΙΚΝ σ κΝ απκ ζ ηα δεσ λαΝ ΫξκυθΝ ξλβ δηκπκδβγ έΝ αΝ
ε φΪζαδαΝ πθΝ αέλπθέΝ
ΟΝ Ν εαδΝ κΝ ΙΚΝ έθαδΝ απσΝ κυμΝ πκυ αδσ λκυμΝ αλδγηκ έε βμΝ ηΫ λβ βμΝ βμΝ
απκ κ δεσ β αμΝ ηδαμΝ αδλέαμέΝ Ν δκέεβ βΝ εαδΝ κδΝ αθαζυ ΫμΝ κφ έζκυθΝ θαΝ κυμΝ
ι ΪακυθΝ δαξλκθδεΪΝ υ Ν θαΝ ζΫΰξκυθΝ βΝ υθαηδεσ β αΝ βμΝ αδλέαμ,Ν αζζΪΝ εαδΝ
παλΪζζβζαΝ θαΝ δ λ υθκτθΝαθΝκδΝ απκφΪ δμΝ πκυΝ ΫξκυθΝ ζΪί δΝ έθαδΝ κδΝ κλγσ λ μΝ ΰδαΝ
βθΝπκλ έαΝεαδΝίδπ δησ β αΝ βμΝκδεκθκηδεάμΝηκθΪ αμέΝΝ
---- Μαγβηα δεάΝχΫ βΝ λδγηκ έε β πκ κ δεσ β αμΝΙ έωθΝΚ φαζαέωθέ
ROE=� � � �� � � � �
ηΨΝ λδγηο έε βμΝΙ έωθΝΚ φαζαέωθΝπλομΝυθοζδεΪΝΚ φΪζαδα
ΟΝαλδγηκ έε βμΝαυ σμΝ έξθ δΝ κΝπκ κ σΝ κυΝπ λδκυ δαευθΝ κδξ έπθΝ κΝκπκέκ Ϋξ δΝ
ξλβηα κ κ βγ έΝ απσΝ κυμΝ η σξκυμέΝ Ό κΝ η ΰαζτ λκΝ έθαδΝ κΝ αυ σΝ πκ κ σΝ σ κΝ
η ΰαζτ λβΝπλκ α έαΝπαλΫξ αδΝ κυμΝ αθ δ Ϋμέ Ν βηα έαΝ κυΝ ΙΚΝ έθαδΝπκζτΝ
πκυ αέα,Ν δσ δΝ ηφαθέα δΝ βθΝ υθα σ β αΝ εαδΝ βθΝ πδ κζβπ δεάΝ δεαθσ β αΝ βμΝ
πδξ έλβ βμΝΰδαΝ βθΝ ιυπβλΫ β βΝ πθΝυπκξλ υ υθΝ βμέ
---- Μαγβηα δεάΝχΫ βΝ λδγηκ έε β Ι έαΝΚ φΪζαδαΝπλκμΝυθκζδεΪΝΚ φΪζαδα.
ΙΚ=� � � �� � � � �
23
θΨΝΚΫλ βήΝΜ οχάΝ(EPS)
ΟΝ EPS έθαδΝ απσΝ κυμΝ βηαθ δεσ λκυμΝ αλδγηκ έε μ κδεκθκηδεάμΝ αθΪζυ βμΝ εαδΝ
ζάοβμΝ απκφΪ πθ,Ν εαγυμΝ έξθ δΝ κΝ τοκμΝ πθΝ εαγαλυθΝ ε λ υθΝ πκυΝ αθ δ κδξ έΝ Ν
εΪγ Νη κξάέΝΩ σ κ,Ν έθαδΝεαδΝαπσΝ κυμΝπδκΝπαλαπζαθβ δεκτμΝ έε μΝαθΝ θΝυπΪλι δΝ
βΝ π άΝ ληβθ έαΝεαδΝβΝ π άΝαθΪζυ βέΝΟδΝπαλΪΰκθ μΝπκυΝ κθΝαπαλ έακυθ έθαδΝ υκ,Ν
σππμΝ παλα βλκτη Ν απσΝ κθΝ παλαεΪ πΝ τπκΝ (εαγαλΪΝ εΫλ βΝ εαδΝ αλδγησμΝ η κξυθ)έΝ
κηΫθκυΝσ δΝκΝαλδγησμΝ πθΝη κξυθΝ έθαδΝ τεκζκΝθαΝη αίζβγ έΝαπσΝΫ κμΝ ΝΫ κμ,Ν
εα αθκκτη Ν σ δΝ έθαδΝ υη Ϊίζβ κμΝ έε βμ,Ν η Ν υθΫπ δαΝ θαΝ υπκπΫ κυη Ν Ν
ζαθγα ηΫθβΝ ληβθ έαΝαθΝ θΝζΪίκυη ΝυπσοβΝ σ κΝ πθΝαλδγησΝ πθΝη κξυθ,ΝαζζΪΝεαδΝ
Ν τ λβΝφΪ βΝ κΝτοκμΝ πθΝε λ υθέΝΠαλα έΰηα κμΝ ξΪλδθ,ΝαθΝ κΝ Ϋ κμΝ t βΝ αδλέαΝ
έξ ΝΧΝ αλδγησΝ η κξυθΝ Ν ευεζκφκλέαΝ εαδΝ κΝ Ϋ κμΝ t+1 απκφΪ δ Ν θαΝ δμΝ δα πΪ δΝ
(split), υ ΝΰδαΝεΪγ Νη κξάΝθαΝπλκ φΫλ δΝ υκ,Ναθ δζαηίαθσηα Νσ δΝκΝθΫκμΝαλδγησμΝ
η κξυθΝγαΝ έθαδΝβΧέΝ θΝυπκγΫ κυη Νσ δΝ αΝτοκμΝ πθΝε λ υθΝ έθαδΝπαλσηκδκΝΰδαΝαυ ΪΝ
αΝ υκΝ Ϋ β,Ν εα αθκκτη Ν σ δΝ κΝEPS γαΝ υπκ δπζα δα έέΝ θΝ θΝ ζΪίκυη Ν υπσοβΝ κΝ
ΰ ΰκθσμΝσ δΝκΝαλδγησμΝ πθΝηΫ κξπθΝαυιάγβε ,Ν σ ΝκΝβΝ ληβθ έαΝ κυΝEPS έθαδΝ ζζδπάμΝ
εαδΝπαλαπζαθβ δεάέ
ΈθαμΝ αεσηαΝ παλΪΰκθ αμΝ πκυΝ πλΫπ δΝ θαΝ ζαηίΪθκυη Ν υπσοβΝ έθαδΝ βΝ η λδ ηα δεάΝ
πκζδ δεάΝ πκυΝ αεσζκυγβΝ βΝ δκέεβ β,Ν βΝ κπκέαΝ ηπκλ έΝ θαΝ ηβθΝ παλαη έθ δΝ αγ λάΝ
δαξλκθδεΪ,Ν αζζΪΝ θαΝ αζζΪι δΝ εα ΪΝ βΝ δΪλε δαΝ πθΝ υθΝ (πέξέΝ Ν δκέεβ βΝ έ πμΝ
απκφα έ δΝ θαΝ παλαελα ά δΝ ΫθαΝ πκ κ σΝ κυΝ η λέ ηα κμΝ ΰδαΝ υκΝ Ϋ βΝ εαδΝ θαΝ κΝ
απκ υ δΝ πλ υ δεΪΝη ΪΝαπσΝ υκΝξλά δμ)έΝ πδπζΫκθΝ κΝ δκδεβ δεσΝ υηίκτζδκΝ έ πμΝ
απκφα έ δΝθαΝπλκί έΝ ΝΫε κ βΝθΫπθΝηΫ κξπθΝη Νατιβ βΝ κυΝη κξδεκτΝε φαζαέκυΝάΝ
η Ν πλ ΪθΝ δαθκηά,Ν κΝ κπκέκΝ γαΝ Ϋξ δΝ πμΝ απκ Ϋζ ηαΝ θαΝ η αίζβγ έΝ κΝ αλδγησμΝ πθΝ
η κξυθέΝ Ν δαξλκθδεάΝζκδπσθΝ τΰελδ βΝεαδΝαθΪζυ βΝ κυΝEPS γαΝπλΫπ δΝθαΝΰέθ αδΝη Ν
πκζτΝπλκ κξάΝεαδΝ πδφτζαιβέ
Ν ΰ θδεΫμΝ ΰλαηηΫμ,Ν κΝ EPS έθαδΝ ξλά δηκμΝ ΰδαΝ θαΝ εαγκ βΰ έΝ κθΝ εΪ κ Ν
θ δαφ λση θκΝ η Ν ελδ άλδκΝ βθΝ αδλέαΝ πκυΝ δαθΫη δΝ αΝ η ΰαζτ λαΝ εΫλ βΝ αθΪΝ
η κξάέΝ ΓδαΝ κυ δα δεσ λβΝ αθΪζυ βΝ γαΝ πλΫπ δΝ θαΝ ζαηίΪθκυη Ν υπσοβΝ εαδΝ κυμΝ
αλδγηκ έε μΝ απκ κ δεσ β αμΝ (πέξέΝ πκ κ δεσ β αμΝ Ι έπθΝ Κ φαζαέπθ,Ν
πκ κ δεσ β αμΝ θ λΰβ δεκτΝε ζ)έ
24
---- Μαγβηα δεάΝχΫ βΝ λδγηκ έε β Κ λ βΝαθαΝΜ κχβ.
EPS=� ��� � � � � � � �
7) λδγηο έε βμΝΣαχτ β αμΝΚυεζοφολέαμΝΊ δωθΝΚ φαζαέωθΝΧ ΣΚΙΚΨ
ΟΝ ΣΚΙΚΝ έξθ δΝ βΝ ξλά βΝ πθΝ δ έπθΝ ε φαζαέπθΝ Ν ξΫ βΝ η Ν δμΝ ππζά δμέΝ Ό κΝ
η ΰαζτ λκμΝ έθαδΝ κΝ αλδγηκ έε βμΝ σ κΝ π λδ σ λ μΝ ππζά δμΝ πλαΰηα κπκδ έΝ βΝ
πδξ έλβ βΝη Νζδΰσ λαΝε φΪζαδαέΝΩ σ κ,ΝαπσΝπζ υλΪμΝα φΪζ δαμΝσ κΝη ΰαζτ λκμΝ
έθαδΝκΝ ΣΚΙΚ,Ν σ κΝζδΰσ λκΝ υθκρεάΝ έθαδΝβΝγΫ βΝ δμΝ πδξ έλβ βμ,Ν δσ δΝβΝ αδλέαΝ
ία έα αδΝευλέπμΝ ΝιΫθαΝε φΪζαδαέΝ βθΝαθ έγ βΝπ λέπ π β,ΝΫθαμΝξαηβζσμΝ ΣΚΙΚΝ
έ πμΝ έξθ δΝ υπ λ π θ τ δμΝ Ν πΪΰδαΝ κδξ έαέΝ Ν τΰελδ βΝ ί ίαέπμ,Ν σππμΝ Ϋξκυη Ν
αθαφΫλ δ,Ν πλαΰηα κπκδ έ αδΝ η αιτΝ έ δπθΝ πδξ δλά πθΝ κπσ Ν απσΝ κτ βΝ γαΝ
πλκετοκυθΝ αΝαθΪζκΰαΝ υηπ λΪ ηα αέ
---- Μαγβηα δεάΝχΫ βΝ λδγηκ έε β Ι έαΝΚ φΪζαδαΝπλκμΝυθκζδεΪΝΚ φΪζαδα.
ΣΚΙΚ=��� � �
25
8) Πωζά δμ ΧΚτεζομΝ λγα δυθΨ
ΟδΝ πυζβ βμ (ΚτεζκμΝ λΰα δυθ)Ν απκ ζκτθΝ αΝ Ϋ κ αΝ πκυΝ πλκετπ κυθΝ απσΝ βθΝ
ζ δ κυλΰέαΝ βμΝ αδλέαμέΝΟΝετεζκμΝ λΰα δυθΝ υθάγπμ ι Ϊα αδ απσΝ κυμΝ π θ υ Ϋμ
ΰδαΝ δΪφκλκυμ ζσΰκυμΝη λδεκέΝαπσΝ κυμΝκπκέκυμΝ έθαδΝκδΝ ιάμέ
α) θ κπδ ησμΝ πκξδεσ β αμ- ευεζδεσ β αμέΝ Μ λδεΫμ πδξ δλά δμ παλκυ δΪακυθ
πκξδεσ β αΝ αΝ πλκρσθ αΝ πκυΝ ππζκτθΝ (πέξέΝ κδΝ αδλέ μ παΰπ υθ παλκυ δΪακυθ
αυιβηΫθα Ϋ κ α βθΝ δΪλε δα πθΝεαζκεαδλδθυθ ηβθυθ)έΝΜ Ν βθΝΝ δαξλκθδεά η ζΫ β
πθΝ ππζά πθΝ έθαδΝ πδγαθσ θαΝ θ κπδ έΝ εΪπκδκΝ έ κυμΝ πκξδεσ β αμ,Ν κπσ Ν κΝ
π θ υ άμΝθαΝΰθπλέα δΝ εΝ πθΝπλσ λπθΝπκ Ϋ αυιΪθ αδΝβΝζ δ κυλΰέαΝ βμΝ αδλέαμ εαδΝ
θαΝ π θ τ δ ε έθβ βθΝξλκθδεά δΰηά ΰδαΝη ΰαζτ λκΝεΫλ κμέ
ί) θ κπδ ησμΝ Ϋθ κθβμΝ η αίζβ σ β αμΝ ππζά πθέΝ έθαδΝ πδγαθσ εΪπκδα ξλκθδεά
π λέκ κ βΝ αδλέα θαΝπαλκυ δΪ δ Ϋθ κθβ η αίζβ σ β α δμΝππζά δμ βΝκπκέα θΝ
υθΪ δ η Ν κΝπλκβΰκτη θκ δ κλδεσ βμέΝΣκτ κ έθαδΝΫθ διβ σ δΝκΝαθαζυ άμ πλΫπ δ
θαΝ ι Ϊ δ δμΝ κδεκθκηδεΫμ εα α Ϊ δμ βμΝ αδλέαμ, κθΝ ζσΰκ κτ πθ πθ
δαευηΪθ πθ. η αίζβ σ β αΝηπκλ έ θαΝπλκάζγ απσΝθΫ μ παλαΰπΰδεΫμ ηκθΪ μ
άΝ εα α λκφά ηκθΪ πθ, Ϊλα αλησα δΝ θα ελδγ έ αθΪζκΰα βΝ η ζζκθ δεά ιΫζδιβ βμΝ
ζ δ κυλΰέαμ βμΝ αδλέαμ.
ΰ) θΪζυ βΝΝ ελκτΝβη έκυΝ(Break Event Point). ΝαθΪζυ β θ ελκτ βη έκυ έθαδΝ
ηδαΝ πκυ αέα αθαζυ δεά ξθδεά ΰδαΝ βθΝη ζΫ β βμΝ ξΫ βμ η αιτ πθΝ σ πθΝεαδΝ
πθΝ αγ λυθ- η αίζβ υθ ισ πθ ηδαμΝ αδλέαμ. ΣκΝθ ελσ βη έκ έθαδΝ ε έθκ κΝ
πέπ κ παλΪΰπΰβμ σπκυ αΝΫ κ α δ κτθ αδ η Ν αΝΫικ α. ΚΪγ Ν πδξ έλβ β πλΫπ δΝθαΝ
η ζ Ϊ δΝ βθΝ ξΫ β σ πθ- ισ πθ εαγυμ εαδΝ κυμΝπαλΪΰκθ μ πκυΝ πβλ Ϊακυθ αΝ
η ΰΫγβ αυ Ϊ,Νυ ΝθαΝζαηίΪθ δ δμΝεα Ϊζζβζ μ απκφΪ δμ.
ΟΝ έε βμ αυ σμ πλκ δκλέα δ Ν πκζτΝ ΰ θδεΫμ ΰλαηηΫμ κΝ ζΪξδ κ πέπ κ
παλΪΰπΰβμ υ ΝβΝ πδξ έλβ β θαΝηβθΝπαλκυ δΪα δ αβηδΫμέΝ έθαδΝ ξ δεΪ τεκζκΝθαΝ
φαληκ έ Ν ηδελκη αέ μ πδξ δλά δμ άΝ πδξ δλά δμΝ πκυΝ παλΪΰκυθΝ ζΪξδ αΝ
πλκρσθ α, δσ δ βΝ ε έηβ βΝ πθ αγ λυθ, η αίζβ υθ ισ πθ εαγυμΝ εαδΝ πθΝ
σ πθΝ έθαδΝ φδε ά.
θ κτ κδμ έθαδ ιαδλ δεΪ πκζτπζκεκ Ϋπμ α τθα κ θαΝ φαληκ έ Ν η ΰΪζ μ
αδλέ μ ΰδαΝ κυμΝ ιάμ ευλέπμ ζσΰκυμ. 1)Ν ΠαλΪΰκυθΝ πζάγκμΝ πλκρσθ πθ αΝ κπκέα
υπΪλξ δ δαφκλ δεάΝ δηκζσΰβ β εαδΝ αθκηκδκΰΫθ δαΝ β)Ν ΣαΝ Ϋικ α θΝ ηπκλκτθ θαΝ
δαξπλδ κτθ Ν αγ λΪ-η αίζβ Ϊ, γ)Ν ΣαΝ Ϋ κ α πλκΫλξκθ αδ απσΝ πκζζΫμ
λα βλδσ β μ ζ)Ν θΝ υπΪλξ δ ΰλαηηδεά ξΫ β η αιτ σ πθ- ισ πθ εαγυμ αΝ
26
η ΰΫγβ αυ ΪΝη αίΪζζκθ αδΝ βηαθ δεΪΝεαγυμΝαζζΪα δΝβΝπαλΪΰπΰβ η)ΝΟδΝ δηΫμΝ θΝ
έθαδΝ πΪθ αΝ αγ λΫμέ πέ βμΝ έθαδΝ ξ σθ αθ φΪληκ κ Ν αδλέ μΝ παλκξάμΝ
υπβλ δυθ
.
9ΨΝΚΫλ βΝπλοΝφσλωθΝ(EBT).
Σκτ κμΝκΝ έε βμ,Ν ι Ϊα δΝ βθΝ δαξλκθδεά πκλ έαΝ πθΝε λ υθΝπλκΝφσλπθ (Earnings
Before Taxes- EBT). έθαδΝ ΫθαΝ δ δαέ λαΝ βηαθ δεσΝ ηΫΰ γκμΝ εαγυμΝ έξθ δΝ βθΝ
πλυ βΝ ε έηβ βΝ ΰδαΝ βθΝ ε λ κφκλέαΝ βμΝ αδλέαμ. ΜδαΝ υοβζάΝ ε λ κφκλέαΝ
υθ πΪΰ αδΝσ δΝβΝ δκέεβ βΝΫξ δ εΪθ δΝ δμΝκλγΫμ πδζκΰΫμΝΰδαΝ βθΝζ δ κυλΰέα εαδΝ βθΝ
ίδπ δησ β α βμΝ πδξ έλβ βμ,Ν κπσ Ν έθαδΝ πδγαθσΝ κδΝ ηΫ κξκδΝ θαΝ ζΪίκυθΝ υοβζσΝ
ηΫλδ ηαέΝ θ δγΫ πμ σ αθΝπαλκυ δΪακθ αδΝ αβηδΫμ,ΝπλΫπ δ θαΝ ι Ϊα αδ κΝζσΰκμ πκυΝ
πλσ ευο Ν κυ κΝ κΝ απκ Ϋζ ηα,Ν αθΝ πλκάζγ Ν απσΝ ζαθγα ηΫθ μ πδζκΰΫμ βμΝ
δκέεβ βμ άΝ αθΝ υθ λΫξκυθ Ϊζζκδ ζσΰκδ σππμΝ ζσΰκυΝ ξΪλβΝ κΝ υ η θΫμΝ κδεκθκηδεσΝ
εζέηα,Ν απλσίζ π αΝ ΰ ΰκθσ αΝ (εα α λκφάΝ παλαΰπΰδεάμΝ ηκθΪ αμ),Ν θκηκγ δεΫμ-
φκλκζκΰδεΫμΝαζζαΰΫμ
10ΨΝΚΫλ βΝη ΪΝΝφσλωθ ΧΚαγαλΪΝΚΫλ βΨ
Σκτ κμΝκΝ έε βμΝπαλΫξ δ πζβλκφκλέ μ ΰδαΝ βθΝ ζδεάΝε λ κφκλέαΝ βμΝ αδλέαμ εαδΝ
απκ ζ έ, πμΝ πδΝ κΝ πζ έ κθ,Ν κΝ πδκΝ τθβγ μΝ λΰαζ έκ πκυΝ ξλβ δηκπκδ έ Ϋθαμ
η ζζκθ δεσμ π θ υ άμΝ ΰδαΝ θαΝ αιδκζκΰά δΝ ηδαΝ αδλέα. Ν υοβζάΝ ε λ κφκλέαΝ έθαδΝ
Ϋθ διβΝ σ δΝ βΝ δκέεβ βΝ Ϋξ δ ζΪί δΝ κλγΫμΝ απκφΪ δμ,Ν κπσ Ν έθαδΝ πδγαθσΝ θαΝ
πλκ ζετ δΝ π λδ σ λκυμΝ π θ υ ΫμΝ εαδΝ θΫαΝ ε φΪζαδα,Ν ΪλαΝ αθκέΰκθ αδΝ θΫ μΝ
πλκκπ δεΫμΝΰδαΝ βθΝπκλ έαΝεαδΝ βθΝζ δ κυλΰέαΝ βμέΝ
27
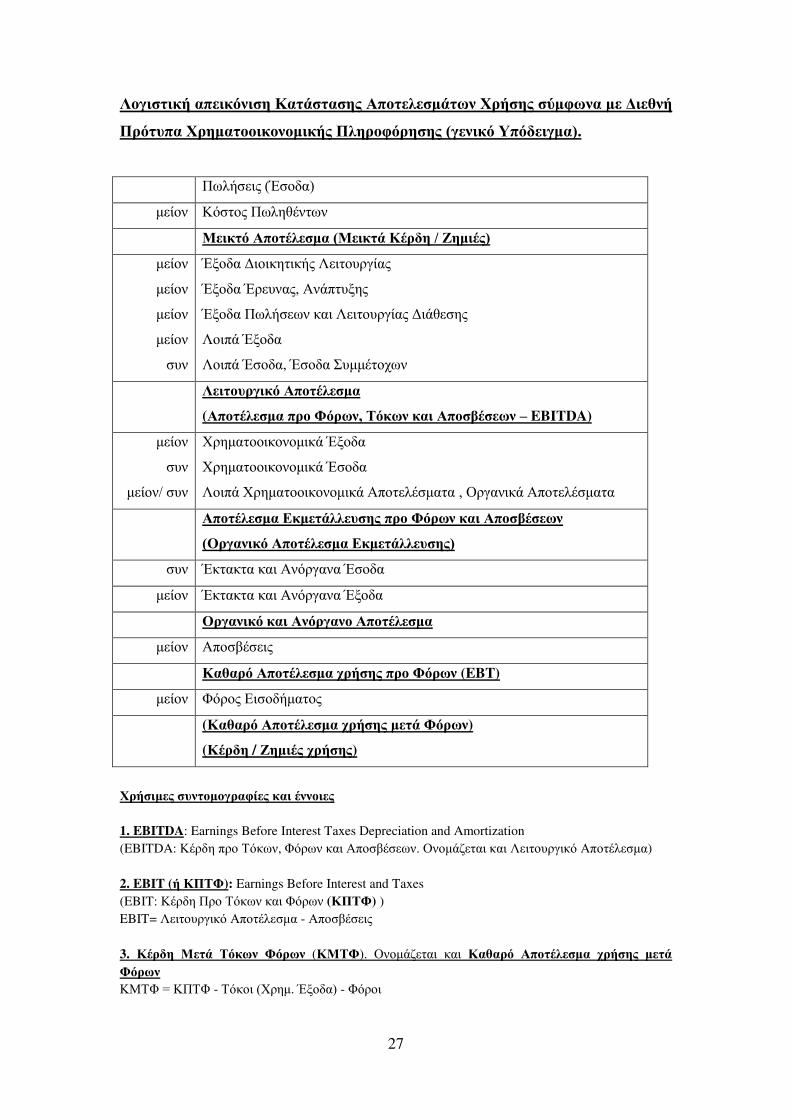
Λκΰδ δεάΝαπ δεσθδ β Κα Ϊ α βμΝ πκ ζ ηΪ ωθΝΧλά βμ τηφωθαΝη Ν δ γθάΝ
Πλσ υπαΝΧλβηα κκδεκθκηδεάμΝΠζβλκφσλβ βμΝ(ΰ θδεσΝΤπσ δΰηα).
Ππζά δμ (Έ κ α)
η έκθΝ Κσ κμ ΠπζβγΫθ πθ
Μ δε σ πκ Ϋζ ηαΝ(Μ δε ΪΝΚΫλ βΝήΝ βηδΫμ)
η έκθ
η έκθ
η έκθ
η έκθ
υθ
Έικ α δκδεβ δεάμ Λ δ κυλΰέαμ
Έικ α Έλ υθαμ, θΪπ υιβμ
Έικ α Ππζά πθ εαδΝΛ δ κυλΰέαμ δΪγ βμ
ΛκδπΪ Έικ α
ΛκδπΪ Έ κ α, Έ κ α υηηΫ κξπθ
Λ δ κυλΰδεσ πκ Ϋζ ηα
( πκ Ϋζ ηα πλκΝΦσλωθ, Σσεωθ εαδΝ πκ ίΫ ωθ – EBITDA)
η έκθ
υθ
η έκθήΝ υθ
Χλβηα κκδεκθκηδεΪΝΈικ α
Χλβηα κκδεκθκηδεΪΝΈ κ α
ΛκδπΪΝΧλβηα κκδεκθκηδεΪΝ πκ ζΫ ηα α ,ΝΟλΰαθδεΪΝ πκ ζΫ ηα α
πκ Ϋζ ηαΝ εη Ϊζζ υ βμΝπλκΝΦσλωθΝεαδΝ πκ ίΫ ωθ
(ΟλΰαθδεσΝ πκ Ϋζ ηαΝ εη Ϊζζ υ βμ)
υθ Έε αε αΝεαδΝ θσλΰαθαΝΈ κ α
η έκθ Έε αε αΝεαδΝ θσλΰαθαΝΈικ α
ΟλΰαθδεσΝεαδΝ θσλΰαθκΝ πκ Ϋζ ηα
η έκθ πκ ίΫ δμ
ΚαγαλσΝ πκ Ϋζ ηαΝχλά βμΝπλκΝΦσλωθ (EBT)
η έκθ ΦσλκμΝ δ κ άηα κμ
(Καγαλσ πκ Ϋζ ηα χλά βμ η ΪΝΦσλωθ)
(ΚΫλ βΝ/ βηδΫμΝχλά βμ)
Χλά δη μ υθ κηκΰλαφέ μ εαδΝΫθθκδ μ
1. EBITDA: Earnings Before Interest Taxes Depreciation and Amortization
(EBITDA: ΚΫλ β πλκ Σσεπθ, Φσλπθ εαδ πκ ίΫ πθέΝΟθκηΪα αδΝεαδ Λ δ κυλΰδεσΝ πκ Ϋζ ηα)
2. EBIT (ά ΚΠΣΦ): Earnings Before Interest and Taxes
(EBIT: ΚΫλ β Πλκ Σσεπθ εαδΝΦσλπθ (ΚΠΣΦ) )
EBIT= Λ δ κυλΰδεσΝ πκ Ϋζ ηαΝ- πκ ίΫ δμΝ
3. ΚΫλ β Μ Ϊ Σσεωθ Φσλωθ (ΚΜΣΦ)έΝ ΟθκηΪα αδΝ εαδ ΚαγαλσΝ πκ Ϋζ ηαΝ χλά βμΝ η ΪΝΦσλωθ
ΚΜΣΦΝοΝΚΠΣΦΝ- ΣσεκδΝ(ΧλβηέΝΈικ α)Ν- Φσλκδ
28
ΟΜ Ν
Ν αδλέα εαδΝβΝη κξά πκυΝγαΝαθαζτ κυη έθαδΝ πθΝ ζζβθδευθ Π λ ζαέπθ έ έΝ
( ΛΠ έ έ) ΰδαΝ βθΝπ λέκ κ 01/01/2014 – 31/12/2014έΝ Ν ΛΠ Ν λα βλδκπκδ έ αδΝ
κθΝ ξυλκ πθΝ π λ ζαδκ δ υθ απσΝ κΝ 1ληηΝ εαδΝ κΝ τλκμ πθΝ λΰα δυθ βμΝ
π λδζαηίΪθ δ λα βλδσ β μ σππμΝ βΝ δτζδ β, ηπκλέα εαδΝ δαθκηά π λ ζαέκυ,
ξβηδεΪ- π λκξβηδεΪ, λ υθΪ εαδΝ παλΪΰπΰβ υ λκΰκθαθγλΪεπθ, παλΪΰπΰβ
θαζζαε δευθ πβΰυθ θΫλΰ δαμ, ξθδεΫμ υπβλ έ μ ΰδαΝ γΫηα α θΫλΰ δαμ ε ζέΝ ΟδΝ
υπβλ έ μ εαδΝ αΝ πλκρσθ α κυΝ κηέζκυ εαζτπ κυθ ξ σθ σζβ βθΝ π λδκξάμ βμΝ
θκ δκαθα κζδεάΝ υλυπβμ.
Ν η κξά πθΝ ΛΠ Ν δαπλαΰηα τ αδ κΝ ξλβηα δ άλδκ γβθυθ εαδΝ κυΝ
Λκθ έθκυ.
ΓδαΝ αΝ κηΫθαΝ κυΝexcel πα ά υ άΝ υ
κ αλξ έκ excel βμΝ ξθδεάμ αθΪζυ βμ,Ν αΝ φτζζα (sheet)Ν η Ν κυμΝ έε μ,
(technical_analysis_ELPE.xls) σπκδα ε φαζέ α έθαδΝη Νπκλ κεαζέ ξλυηα, αθ δ κδξ έ
αΝ κηΫθα πκυΝΫξκυη αθ ζά δ απσΝ κΝξλβηα δ άλδκ εαδΝΫξκυη ξλβ δηκπκδά δ
ΰδαΝ κθΝυπκζκΰδ ησ κυΝαθ έ κδξκυ έε β.
Ν ΛΤΗ- ΠΟΣ Λ Μ Σ
Έξκθ αμΝαθαπ τι δΝ κΝγ πλβ δεσΝία δεσΝυπσίαγλκ,ΝγαΝ υθ ξέ κυη Νπαλκυ δΪακθ αμΝ
αΝ απκ ζΫ ηα αΝ βμΝ αθΪζυ άμΝ ηαμ,Ν πλκ γΫ κθ αμ αΝ απαλαέ β αΝ ξσζδαΝυ Ν θαΝ
εα αθκά κυη Ν βθΝζ δ κυλΰέα πθΝ δε υθέ
ΠαλαεΪ πΝ παλαγΫ κυη Ν δαΰλΪηηα αΝ η Ν κυμΝ ξθδεκτμΝ έε μΝ εαδΝ θΝ υθ ξ έαΝ
πέθαε μΝη Ναπκ ζΫ ηα αΝ βμΝγ η ζδυ κυμΝαθΪζυ βμέ
Νπαλκυ έα β πθΝαπκ ζ ηΪ πθ γαΝ έθαδΝ τθ κηβ, εαγυμ κΝ εκπσμ ηαμΝ έθαδΝθαΝ
αθαπ τικυη δμΝ ία δεΫμ εαδΝ κυ δα δεΫμ Ϋθθκδ μ βμΝ ξθδεάμ εαδΝ γ η ζδυ κυμ
αθΪζυ βμ. Έξκθ αμ κτ α πμΝκ βΰσ,ΝκΝαθαΰθυ βμΝ έθαδΝ ΝγΫ β θαΝεα αθκά δ κΝ
υπσίαγλκ πκυΝξλβ δηκπκδκτθΝκδΝαθαζυ ΫμΝΰδαΝ βθΝ ε έηβ βΝ βμΝπκλ έαμΝηδαμΝη κξάμΝ
εαγυμΝεαδΝ αΝγ η ζδυ βΝη ΰΫγβΝεαδΝ έε μΝηδαμΝ πδξ έλβ βμέ
29
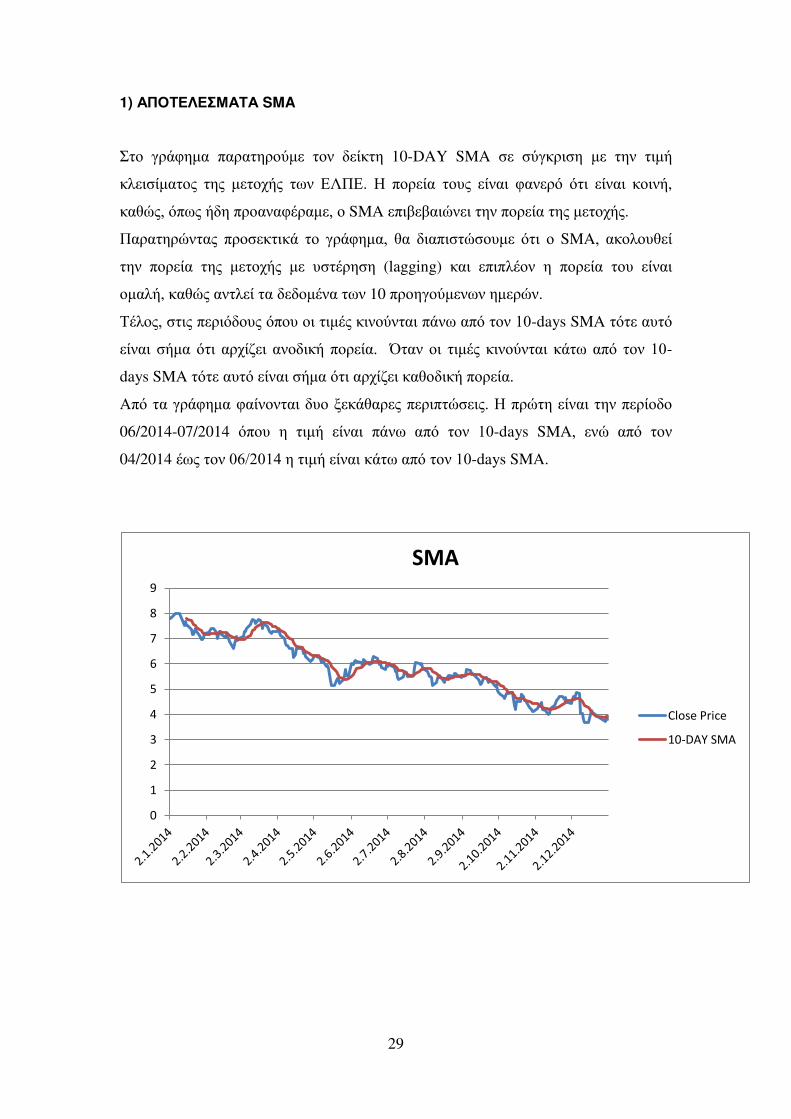
1) ΠΟΣ Λ Μ Σ SMA
κΝ ΰλΪφβηα παλα βλκτη κθΝ έε β 10-DAY SMA Ν τΰελδ β η Ν βθΝ δηά
εζ δ έηα κμΝ βμΝ η κξάμ πθΝ ΛΠ . Ν πκλ έα κυμΝ έθαδΝ φαθ λσ σ δΝ έθαδΝ εκδθά,
εαγυμ, σππμΝά β πλκαθαφΫλαη , κΝSMA πδί ίαδυθ δ βθΝπκλ έα βμΝη κξάμ.
Παλα βλυθ αμ πλκ ε δεΪ κΝ ΰλΪφβηα,Ν γαΝ δαπδ υ κυη σ δΝ κΝSMA,Ν αεκζκυγ έ
βθΝ πκλ έα βμΝ η κξάμ η Ν υ Ϋλβ β (lagging) εαδΝ πδπζΫκθ βΝ πκλ έα κυΝ έθαδΝ
κηαζά, εαγυμ αθ ζ έ αΝ κηΫθα πθΝ10 πλκβΰκτη θπθ βη λυθ.
ΣΫζκμ,Ν δμΝπ λδσ κυμ σπκυ κδΝ δηΫμΝεδθκτθ αδΝπΪθπΝαπσΝ κθΝ1ί-days SMA σ Ναυ σΝ
έθαδΝ άηα σ δΝ αλξέα δΝ αθκ δεάΝπκλ έαέΝ ΝΌ αθΝκδΝ δηΫμΝ εδθκτθ αδΝ εΪ πΝαπσΝ κθΝ 1ί-
days SMA σ Ναυ σΝ έθαδΝ άηα σ δΝαλξέα δΝεαγκ δεάΝπκλ έαέΝ
πσΝ αΝΰλΪφβηα φαέθκθ αδ υκΝι εΪγαλ μ π λδπ υ δμέΝ Νπλυ β έθαδΝ βθΝπ λέκ κ
06/2014-07/2014 σπκυ βΝ δηά έθαδΝ πΪθπ απσΝ κθΝ 1ί-days SMA,Ν θυΝ απσΝ κθΝ
04/2014 Ϋπμ κθΝίθήβί1ζΝβΝ δηά έθαδΝεΪ π απσΝ κθΝ1ί-days SMA.
0
1
2
3
4
5
6
7
8
9
SMA
Close Price
10-DAY SMA
30
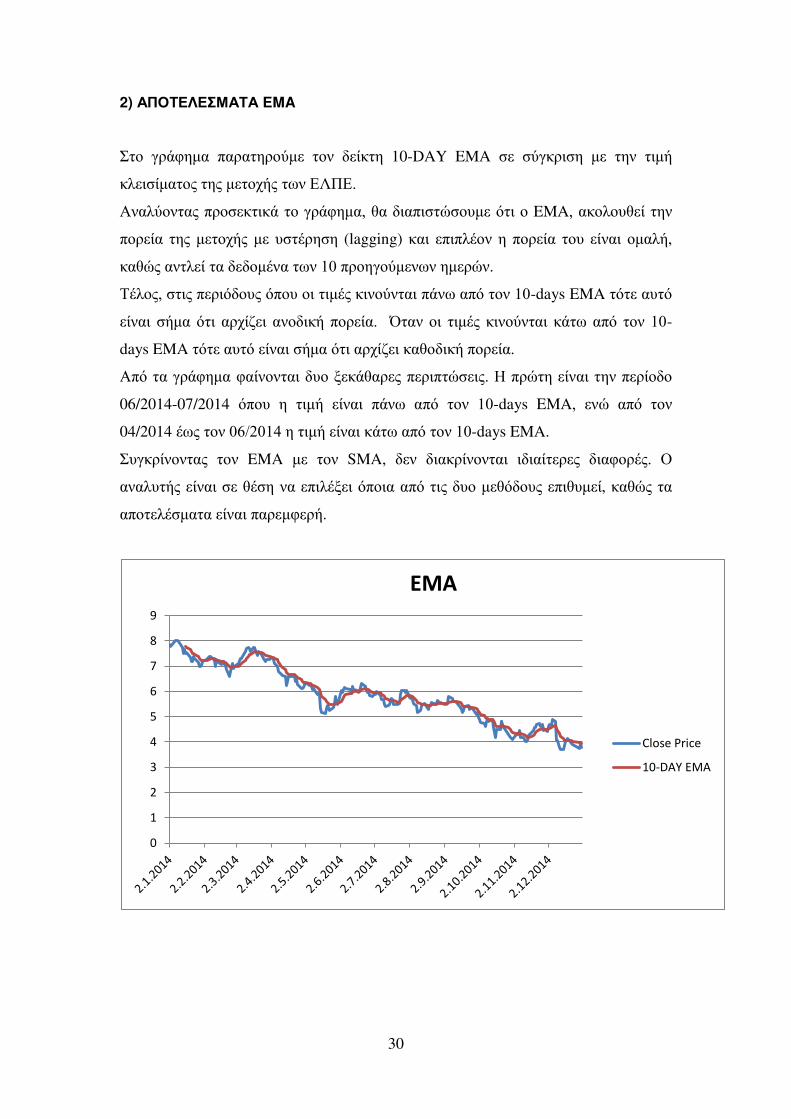
2) ΠΟΣ Λ Μ Σ EMA
κΝ ΰλΪφβηα παλα βλκτη Ν κθΝ έε β 10-DAY EMA Ν τΰελδ β η Ν βθΝ δηά
εζ δ έηα κμΝ βμΝη κξάμ πθΝ ΛΠ έ
θαζτκθ αμΝπλκ ε δεΪ κΝΰλΪφβηα,ΝγαΝ δαπδ υ κυη σ δΝκΝEMA,Ναεκζκυγ έ βθΝ
πκλ έα βμΝη κξάμ η Νυ Ϋλβ β (lagging) εαδΝ πδπζΫκθ βΝπκλ έα κυΝ έθαδΝ κηαζά,
εαγυμ αθ ζ έ αΝ κηΫθα πθΝ1ίΝπλκβΰκτη θπθ βη λυθ.
ΣΫζκμ,Ν δμΝπ λδσ κυμ σπκυ κδΝ δηΫμΝεδθκτθ αδΝπΪθπΝαπσΝ κθΝ1ί-days EMA σ Ναυ σΝ
έθαδΝ άηα σ δΝ αλξέα δΝ αθκ δεάΝπκλ έαέΝ ΝΌ αθΝκδΝ δηΫμΝ εδθκτθ αδΝ εΪ πΝαπσΝ κθΝ 1ί-
days EMA σ Ναυ σΝ έθαδΝ άηα σ δΝαλξέα δΝεαγκ δεάΝπκλ έαέΝ
πσΝ αΝΰλΪφβηα φαέθκθ αδ υκΝι εΪγαλ μ π λδπ υ δμέΝ Νπλυ β έθαδΝ βθΝπ λέκ κ
06/2014-07/2014 σπκυ βΝ δηά έθαδΝ πΪθπ απσΝ κθΝ 1ί-days EMA,Ν θυΝ απσΝ κθΝ
04/2014 Ϋπμ κθΝίθήβί1ζΝβΝ δηά έθαδΝεΪ π απσΝ κθΝ1ί-days EMA.
υΰελέθκθ αμΝ κθΝ EMA η Ν κθΝ SMA, θΝ δαελέθκθ αδ δ δαέ λ μ δαφκλΫμέΝ ΟΝ
αθαζυ άμ έθαδΝ ΝγΫ β θαΝ πδζΫι δ σπκδα απσΝ δμΝ υκΝη γσ κυμ πδγυη έ, εαγυμ αΝ
απκ ζΫ ηα αΝ έθαδΝπαλ ηφ λά.
0
1
2
3
4
5
6
7
8
9
EMA
Close Price
10-DAY EMA
31
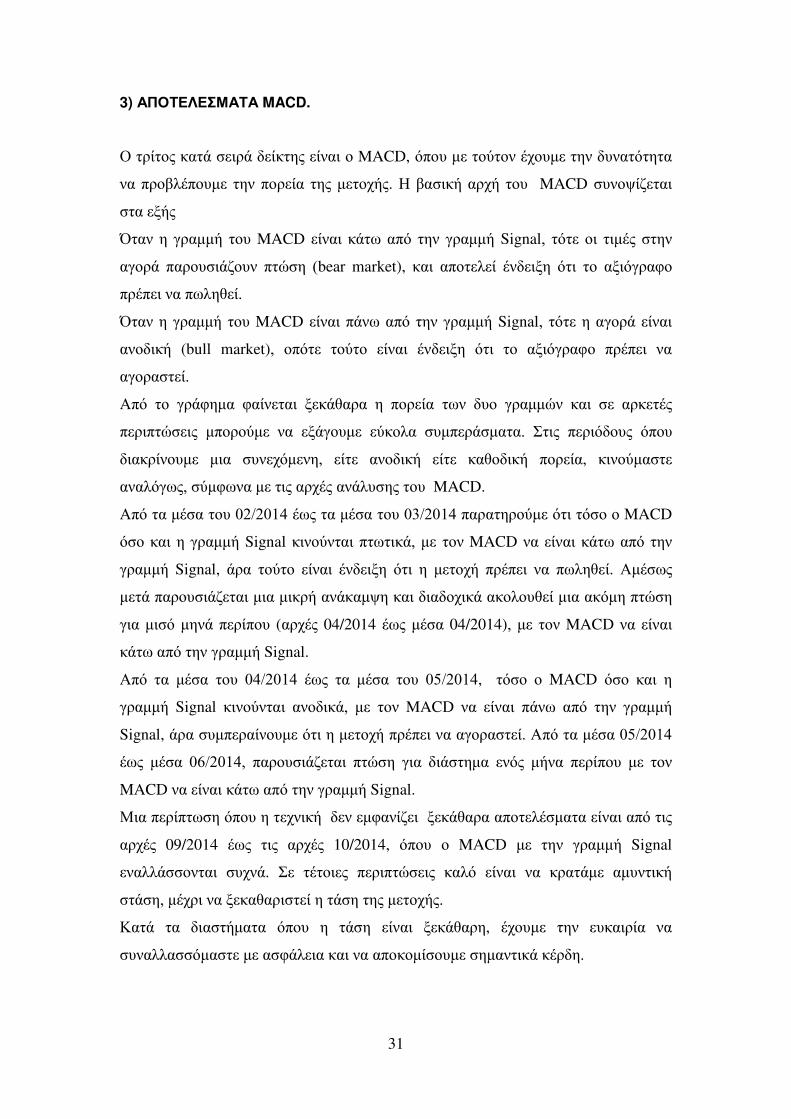
3) ΠΟΣ Λ Μ Σ MACD.
ΟΝ λέ κμ εα ΪΝ δλΪ έε βμ έθαδΝκ MACD, σπκυ η Ν κτ κθ Ϋξκυη βθΝ υθα σ β α
θαΝπλκίζΫπκυη βθΝπκλ έα βμΝη κξάμ. Ν ία δεά αλξά κυΝ MACD υθκοέα αδ
αΝ ιάμ
Ό αθ β ΰλαηηά κυ MACD έθαδΝ εΪ πΝαπσΝ βθΝ ΰλαηηάΝSignal,Ν σ Ν κδΝ δηΫμΝ βθΝ
αΰκλΪΝ παλκυ δΪακυθΝ π υ βΝ (bear market), εαδΝ απκ ζ έ Ϋθ διβΝ σ δΝ κΝ αιδσΰλαφκΝ
πλΫπ δΝθαΝππζβγ έέΝ
Ό αθ β ΰλαηηά κυ MACD έθαδΝπΪθπΝαπσΝ βθΝΰλαηηάΝSignal,Ν σ ΝβΝαΰκλΪΝ έθαδΝ
αθκ δεάΝ (bull market),Ν κπσ Ν κτ κΝ έθαδΝ Ϋθ διβΝ σ δΝ κΝ αιδσΰλαφκΝ πλΫπ δΝ θαΝ
αΰκλα έέΝ
πσΝ κΝ ΰλΪφβηα φαέθ αδ ι εΪγαλα β πκλ έα πθΝ υκΝ ΰλαηηυθ εαδΝ Ν αλε Ϋμ
π λδπ υ δμ ηπκλκτη Ν θαΝ ιΪΰκυη τεκζα υηπ λΪ ηα αέΝ δμΝ π λδσ κυμ σπκυ
δαελέθκυη ηδαΝ υθ ξση θβ, έ αθκ δεά έ εαγκ δεά πκλ έα, εδθκτηα
αθαζσΰπμ,Ν τηφπθαΝη Ν δμΝαλξΫμΝαθΪζυ βμ κυΝ MACD.
πσΝ αΝηΫ α κυΝίβήβί1ζΝΫπμ αΝηΫ α κυΝίγήβί1ζΝπαλα βλκτη σ δΝ σ κ κΝMACD
σ κ εαδΝβΝΰλαηηά Signal εδθκτθ αδ π π δεΪ,Νη κθ MACD θαΝ έθαδΝεΪ π απσΝ βθΝ
ΰλαηηά Signal, Ϊλα κτ κ έθαδΝ Ϋθ διβ σ δΝ βΝ η κξά πλΫπ δ θαΝ ππζβγ έ. ηΫ πμ
η Ϊ παλκυ δΪα αδ ηδαΝηδελά αθΪεαηοβ εαδΝ δα κξδεΪ αεκζκυγ έ ηδαΝαεσηβ π υ β
ΰδαΝηδ σ ηβθΪ π λέπκυ (αλξΫμ 04/2014 Ϋπμ ηΫ α 04/2014),Ν η Ν κθ MACD θαΝ έθαδΝ
εΪ π απσΝ βθΝΰλαηηά Signal.
πσΝ αΝ ηΫ α κυΝ ίζήβί1ζΝ Ϋπμ αΝ ηΫ α κυΝ ίηήβί1ζ, σ κ κΝMACD σ κ εαδΝ βΝ
ΰλαηηά Signal εδθκτθ αδ αθκ δεΪ,Ν η Ν κθΝMACD θαΝ έθαδΝ πΪθπ απσ βθΝ ΰλαηηά
Signal, Ϊλα υηπ λαέθκυη σ δΝβΝη κξά πλΫπ δ θαΝαΰκλα έ. πσΝ αΝηΫ αΝίηήβί1ζΝ
ΫπμΝ ηΫ αΝ ίθήβί1ζ, παλκυ δΪα αδ π υ β ΰδαΝ δΪ βηα θσμΝ ηάθα π λέπκυ η Ν κθ
MACD θαΝ έθαδΝεΪ π απσΝ βθΝΰλαηηά Signal.
ΜδαΝπ λέπ π β σπκυ βΝ ξθδεά θΝ ηφαθέα δ ι εΪγαλαΝαπκ ζΫ ηα α έθαδΝαπσ δμΝ
αλξΫμ 09/2014 Ϋπμ δμΝ αλξΫμ 10/2014, σπκυ κΝ MACD η Ν βθΝ ΰλαηηά Signal
θαζζΪ κθ αδΝ υξθΪέΝ Ν Ϋ κδ μ π λδπ υ δμΝ εαζσ έθαδΝ θαΝ ελα Ϊη Ν αηυθ δεάΝ
Ϊ β,ΝηΫξλδ θαΝι εαγαλδ έΝβΝ Ϊ βΝ βμΝη κξάμέΝ
Κα ΪΝ αΝ δα άηα α σπκυ βΝ Ϊ β έθαδΝ ι εΪγαλβ, Ϋξκυη βθΝ υεαδλέαΝ θαΝ
υθαζζα σηα Νη Να φΪζ δα εαδΝθαΝαπκεκηέ κυη βηαθ δεΪ εΫλ β.
32
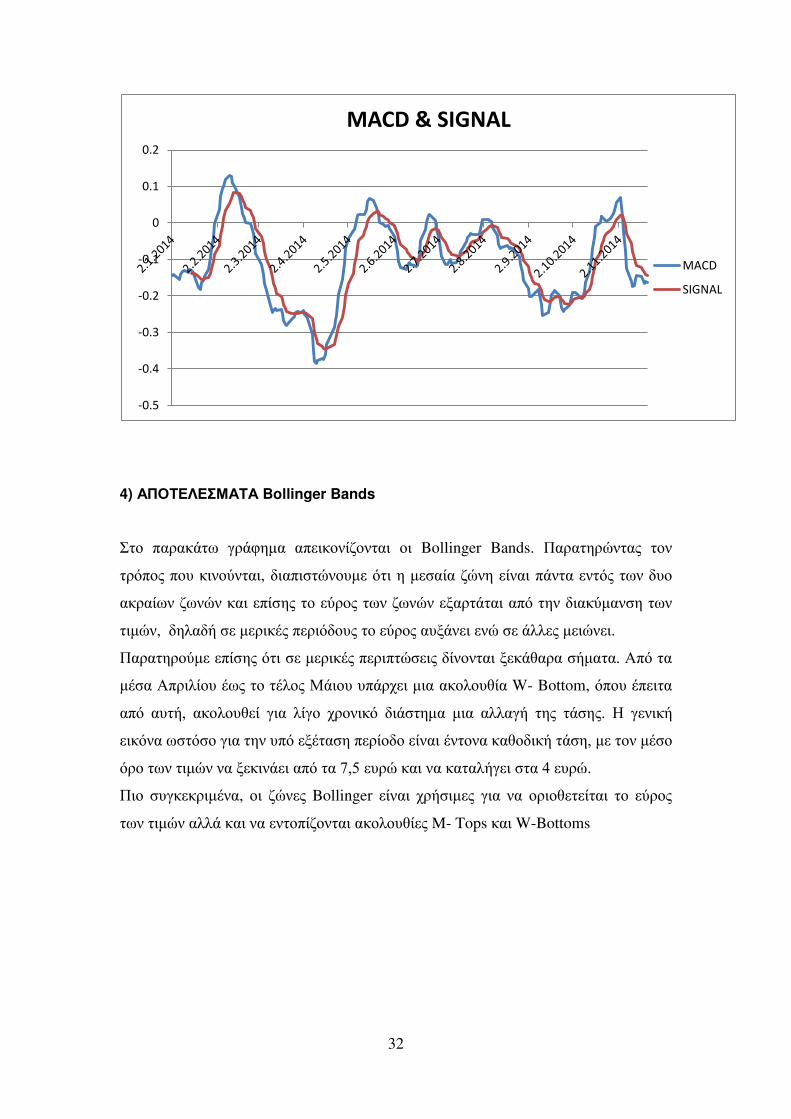
4) ΠΟΣ Λ Μ Σ ΝBollinger Bands
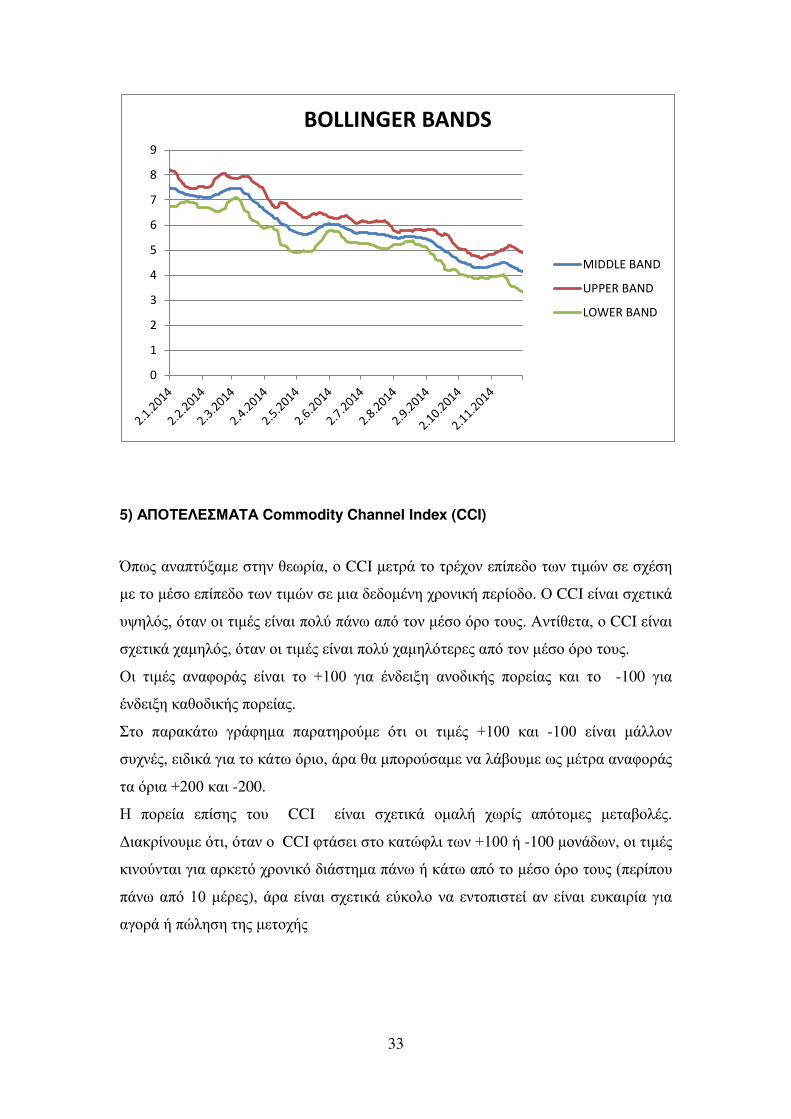
κΝ παλαεΪ π ΰλΪφβηα απ δεκθέακθ αδ κδΝ Bollinger Bands. Παλα βλυθ αμ κθ
λσπκμ πκυΝεδθκτθ αδ, δαπδ υθκυη σ δΝβΝη αέα αυθβ έθαδΝπΪθ α θ σμ πθΝ υκΝ
αελαέπθ απθυθ εαδΝ πέ βμ κΝ τλκμ πθΝαπθυθ ιαλ Ϊ αδ απσΝ βθΝ δαετηαθ β πθΝ
δηυθ, βζα άΝ Νη λδεΫμ π λδσ κυμ κΝ τλκμ αυιΪθ δ θυΝ ΝΪζζ μΝη δυθ δ.
Παλα βλκτη πέ βμ σ δΝ Νη λδεΫμ π λδπ υ δμ έθκθ αδ ι εΪγαλα άηα αέΝ πσΝ αΝ
ηΫ α πλδζέκυ Ϋπμ κΝ Ϋζκμ ΜΪδκυ υπΪλξ δ ηδαΝαεκζκυγέα W- Bottom, σπκυ Ϋπ δ α
απσΝ αυ ά,Ν αεκζκυγ έ ΰδαΝ ζέΰκ ξλκθδεσ δΪ βηα ηδαΝ αζζαΰά βμΝ Ϊ βμέΝ Ν ΰ θδεά
δεσθα π σ κ ΰδαΝ βθΝυπσ ιΫ α β π λέκ κ έθαδΝΫθ κθα εαγκ δεά Ϊ β,Νη Ν κθΝηΫ κ
σλκ πθΝ δηυθ θαΝι εδθΪ δ απσΝ αΝι,ηΝ υλυ εαδΝθαΝεα αζάΰ δ αΝζΝ υλυ.
ΠδκΝ υΰε ελδηΫθα, κδΝ αυθ μ Bollinger έθαδΝ ξλά δη μ ΰδαΝ θαΝ κλδκγ έ αδ κΝ τλκμ
πθΝ δηυθ αζζΪ εαδΝθαΝ θ κπέακθ αδ αεκζκυγέ μ M- Tops εαδΝW-Bottoms
-0.5
-0.4
-0.3
-0.2
-0.1
0
0.1
0.2
MACD & SIGNAL
MACD
SIGNAL
33
5) ΠΟΣ Λ Μ Σ Commodity Channel Index (CCI)
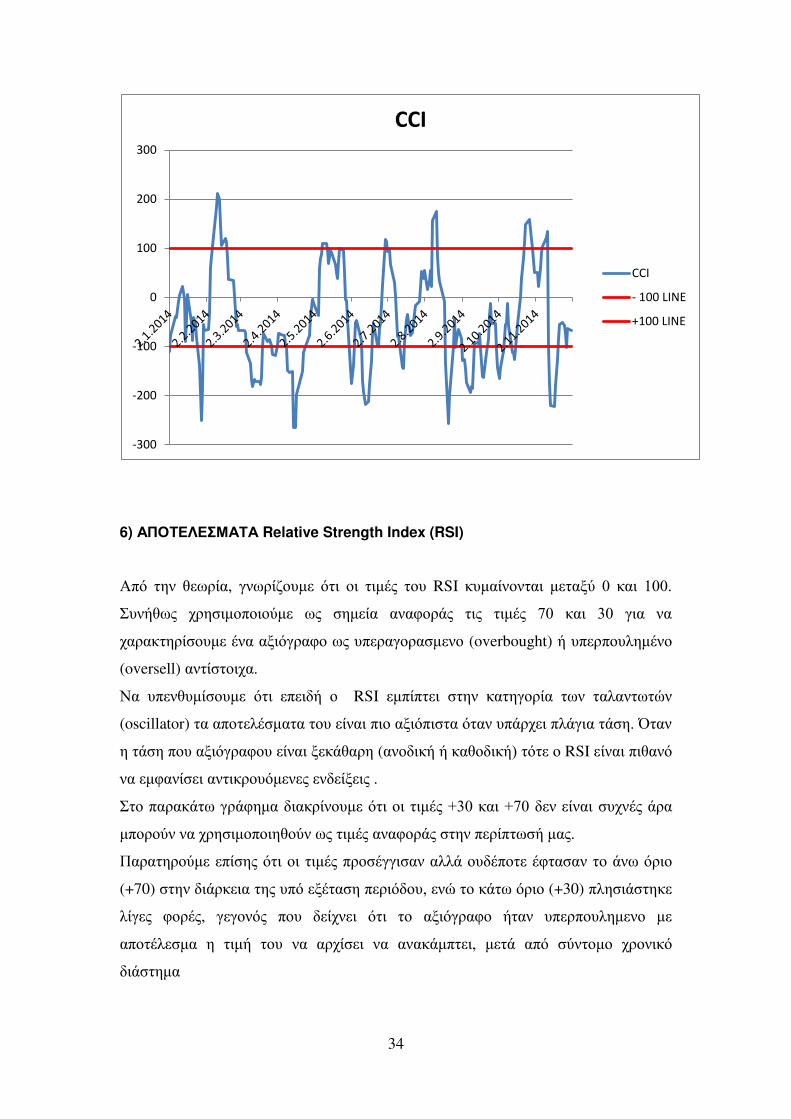
ΌππμΝαθαπ τιαη βθΝγ πλέα,ΝκΝCCI η λΪΝ κ λΫξκθΝ πέπ κ πθΝ δηυθ Ν ξΫ βΝ
η Ν κ ηΫ κΝ πέπ κ πθΝ δηυθ ΝηδαΝ κηΫθβ ξλκθδεάΝπ λέκ κ. ΟΝCCI έθαδΝ ξ δεΪΝ
υοβζσμ,Νσ αθΝκδΝ δηΫμΝ έθαδ πκζτΝπΪθπ απσ κθΝηΫ κΝσλκΝ κυμέΝ θ έγ α,ΝκΝCCI έθαδΝ
ξ δεΪ ξαηβζσμ,Νσ αθΝκδΝ δηΫμ έθαδΝπκζτΝξαηβζσ λ μΝαπσ κθΝηΫ κΝσλκΝ κυμ.
ΟδΝ δηΫμ αθαφκλΪμ έθαδΝ κΝ +1ίίΝ ΰδαΝ Ϋθ διβ αθκ δεάμ πκλ έαμ εαδΝ κΝ Ν -100 ΰδαΝ
Ϋθ διβΝεαγκ δεάμ πκλ έαμ.
κΝ παλαεΪ π ΰλΪφβηα παλα βλκτη σ δΝ κδΝ δηΫμ +1ίίΝ εαδΝ -1ίίΝ έθαδΝ ηΪζζκθ
υξθΫμ, δ δεΪ ΰδαΝ κΝεΪ π σλδκ, Ϊλα γαΝηπκλκτ αη θαΝζΪίκυη πμΝηΫ λαΝαθαφκλΪμ
αΝσλδα +βίίΝεαδΝ-200.
Ν πκλ έα πέ βμ κυΝ Ν CCI έθαδΝ ξ δεΪ κηαζά ξπλέμ απσ κη μ η αίκζΫμ.
δαελέθκυη Νσ δ,Νσ αθ κΝ CCI φ Ϊ δ κΝεα υφζδ πθΝ+1ίίΝάΝ-100 ηκθΪ πθ, κδΝ δηΫμ
εδθκτθ αδ ΰδαΝαλε σ ξλκθδεσ δΪ βηα πΪθπ άΝεΪ πΝαπσΝ κΝηΫ κ σλκ κυμΝ(π λέπκυ
πΪθπ απσΝ1ίΝηΫλ μ), Ϊλα έθαδΝ ξ δεΪ τεκζκ θαΝ θ κπδ έ αθΝ έθαδΝ υεαδλέαΝ ΰδαΝ
αΰκλΪΝάΝπυζβ βΝ βμΝη κξάμ
0
1
2
3
4
5
6
7
8
9
BOLLINGER BANDS
MIDDLE BAND
UPPER BAND
LOWER BAND
34
6) ΠΟΣ Λ Μ Σ Relative Strength Index (RSI)
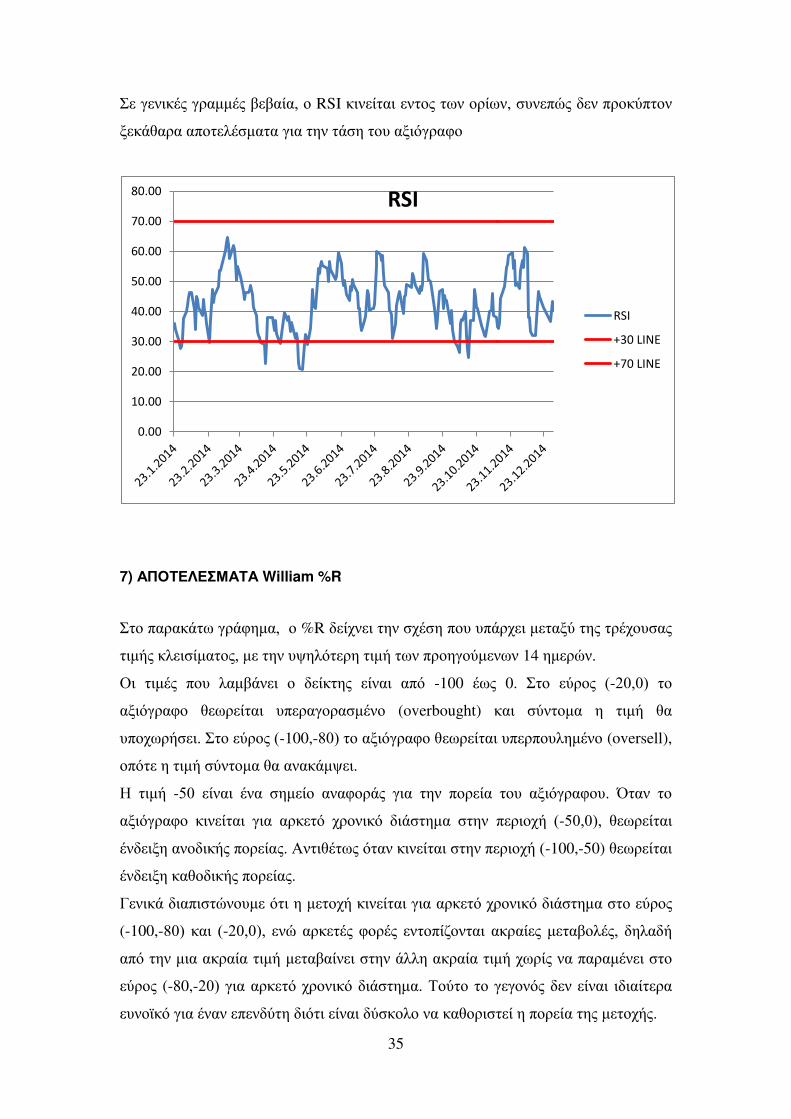
πσΝ βθΝ γ πλέα, ΰθπλέακυη σ δΝ κδΝ δηΫμΝ κυΝRSI ευηαέθκθ αδΝ η αιτΝ ίΝ εαδΝ 1ίίέΝ
υθάγπμΝ ξλβ δηκπκδκτη Ν πμΝ βη έαΝ αθαφκλΪμΝ δμΝ δηΫμΝ ιίΝ εαδΝ γίΝ ΰδαΝ θαΝ
ξαλαε βλέ κυη ΝΫθαΝαιδσΰλαφκΝπμΝυπ λαΰκλα η θκΝ(overbought) άΝυπ λπκυζβηΫθκΝ
(oversell) αθ έ κδξαέΝ
ΝαΝ υπ θγυηέ κυη σ δΝ π δ άΝ κΝ Ν RSI ηπέπ δΝ βθΝ εα βΰκλέαΝ πθΝ αζαθ π υθΝ
(oscillator) αΝαπκ ζΫ ηα αΝ κυΝ έθαδΝπδκΝαιδσπδ αΝσ αθΝυπΪλξ δΝπζΪΰδαΝ Ϊ βέΝΌ αθΝ
βΝ Ϊ βΝπκυΝαιδσΰλαφκυΝ έθαδΝι εΪγαλβΝ(αθκ δεάΝάΝεαγκ δεά) σ ΝκΝRSI έθαδΝπδγαθσΝ
θαΝ ηφαθέ δΝαθ δελκυση θ μΝ θ έι δμΝέ
κΝπαλαεΪ π ΰλΪφβηα δαελέθκυη σ δΝκδΝ δηΫμ +γίΝεαδΝ+ιίΝ θΝ έθαδΝ υξθΫμ Ϊλα
ηπκλκτθ θαΝξλβ δηκπκδβγκτθ πμΝ δηΫμ αθαφκλΪμ βθΝπ λέπ π ά ηαμέ
Παλα βλκτη πέ βμ σ δΝκδΝ δηΫμ πλκ Ϋΰΰδ αθ αζζΪ κυ Ϋπκ Ϋφ α αθ κΝΪθπ σλδκ
(+70) βθΝ δΪλε δα βμΝυπσ ιΫ α β π λδσ κυ,Ν θυΝ κΝεΪ π σλδκ (+30) πζβ δΪ βε Ν
ζέΰ μ φκλΫμ, ΰ ΰκθσμ πκυΝ έξθ δ σ δΝ κΝ αιδσΰλαφκ ά αθ υπ λπκυζβη θκΝ η Ν
απκ Ϋζ ηα βΝ δηά κυΝ θαΝ αλξέ δ θαΝ αθαεΪηπ δ,Ν η Ϊ απσΝ τθ κηκ ξλκθδεσ
δΪ βηα
-300
-200
-100
0
100
200
300
CCI
CCI
- 100 LINE
+100 LINE
35
Νΰ θδεΫμ ΰλαηηΫμ ί ίαέα,ΝκΝRSI εδθ έ αδ θ κμ πθΝκλέπθ, υθ πυμ θΝπλκετπ κθ
ι εΪγαλα απκ ζΫ ηα α ΰδαΝ βθΝ Ϊ β κυΝαιδσΰλαφκ
7) ΠΟΣ Λ Μ Σ William %R
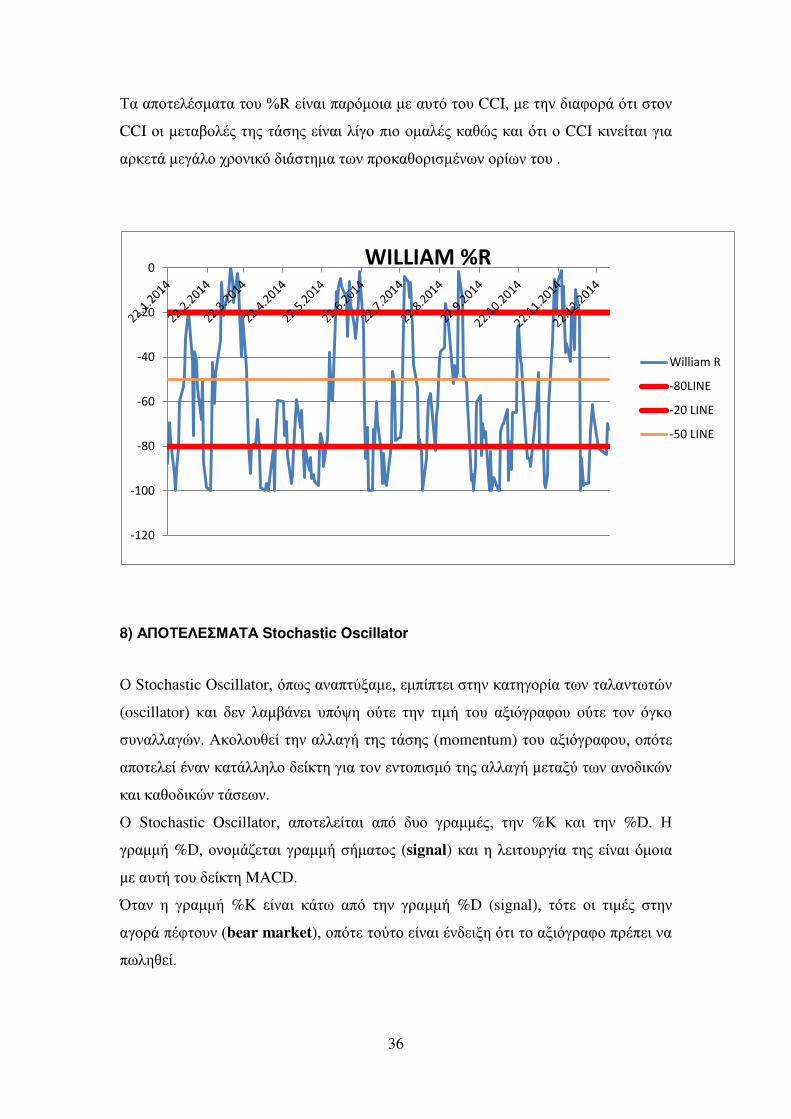
κΝπαλαεΪ π ΰλΪφβηα, κΝ%R έξθ δΝ βθΝ ξΫ βΝπκυΝυπΪλξ δΝη αιτΝ βμΝ λΫξκυ αμΝ
δηάμΝεζ δ έηα κμ,Νη Ν βθΝυοβζσ λβΝ δηάΝ πθΝπλκβΰκτη θπθΝ14 βη λυθέ
ΟδΝ δηΫμΝ πκυΝ ζαηίΪθ δΝ κΝ έε βμΝ έθαδΝ απσΝ -100 Ϋπμ 0. κΝ τλκμΝ (-βί,ί)Ν κΝ
αιδσΰλαφκΝ γ πλ έ αδΝ υπ λαΰκλα ηΫθκΝ (overbought) εαδΝ τθ κηαΝ βΝ δηάΝ γαΝ
υπκξπλά δέΝ κΝ τλκμΝ(-100,-κί)Ν κΝαιδσΰλαφκΝγ πλ έ αδΝυπ λπκυζβηΫθκ (oversell),
κπσ ΝβΝ δηάΝ τθ κηαΝγαΝαθαεΪηο δέΝ
Ν δηάΝ -ηίΝ έθαδΝ ΫθαΝ βη έκΝ αθαφκλΪμΝ ΰδαΝ βθΝ πκλ έαΝ κυΝ αιδσΰλαφκυέΝ Ό αθΝ κΝ
αιδσΰλαφκΝ εδθ έ αδΝ ΰδαΝ αλε σΝ ξλκθδεσΝ δΪ βηαΝ βθ π λδκξάΝ (-ηί,ί),Ν γ πλ έ αδΝ
Ϋθ διβΝαθκ δεάμΝπκλ έαμέΝ θ δγΫ πμΝσ αθΝεδθ έ αδΝ βθΝπ λδκξάΝ(-100,-50) γ πλ έ αδΝ
Ϋθ διβΝεαγκ δεάμΝπκλ έαμ.
Γ θδεΪ δαπδ υθκυη Νσ δΝβΝη κξά εδθ έ αδ ΰδαΝαλε σ ξλκθδεσ δΪ βηα κΝ τλκμ
(-100,-κί)Ν εαδΝ (-βί,ί),Ν θυΝαλε Ϋμ φκλΫμ θ κπέακθ αδ αελαέ μ η αίκζΫμ,Ν βζα άΝ
απσΝ βθΝηδαΝαελαέαΝ δηά η αίαέθ δ βθΝΪζζβΝαελαέα δηά ξπλέμ θαΝπαλαηΫθ δ κΝ
τλκμ (-80,-βί)ΝΰδαΝαλε σ ξλκθδεσ δΪ βηα. Σκτ κ κΝΰ ΰκθσμ θΝ έθαδΝ δ δαέ λα
υθκρεσΝΰδαΝΫθαθΝ π θ τ β δσ δΝ έθαδΝ τ εκζκ θαΝεαγκλδ έΝβΝπκλ έαΝ βμΝη κξάμ.
0.00
10.00
20.00
30.00
40.00
50.00
60.00
70.00
80.00RSI
RSI
+30 LINE
+70 LINE
36
ΣαΝαπκ ζΫ ηα α κυΝΣR έθαδΝπαλσηκδα η Ναυ σΝ κυ CCI, η Ν βθΝ δαφκλΪ σ δΝ κθΝ
CCI κδΝη αίκζΫμΝ βμΝ Ϊ βμ έθαδΝζέΰκΝπδκΝκηαζΫμΝεαγυμ εαδΝσ δΝκ CCI εδθ έ αδ ΰδαΝ
αλε Ϊ η ΰΪζκ ξλκθδεσ δΪ βηα πθΝπλκεαγκλδ ηΫθπθΝκλέπθ κυΝέ
8) ΠΟΣ Λ Μ Σ Stochastic Oscillator
ΟΝStochastic Oscillator,ΝσππμΝαθαπ τιαη ,Ν ηπέπ δΝ βθΝεα βΰκλέαΝ πθΝ αζαθ π υθΝ
(oscillator) εαδΝ θΝ ζαηίΪθ δΝ υπσοβΝ κτ Ν βθΝ δηάΝ κυΝ αιδσΰλαφκυΝ κτ Ν κθΝ σΰεκΝ
υθαζζαΰυθέΝ εκζκυγ έΝ βθΝαζζαΰάΝ βμΝ Ϊ βμΝ(momentum) κυΝαιδσΰλαφκυ,Νκπσ Ν
απκ ζ έΝΫθαθΝεα ΪζζβζκΝ έε βΝΰδαΝ κθΝ θ κπδ ησΝ βμΝαζζαΰάΝη αιτΝ πθΝαθκ δευθΝ
εαδΝεαγκ δευθΝ Ϊ πθ.
ΟΝ Stochastic Oscillator,Ν απκ ζ έ αδΝ απσΝ υκΝ ΰλαηηΫμ,Ν βθΝ %K εαδΝ βθΝ %DέΝ Ν
ΰλαηηάΝ%D,ΝκθκηΪα αδΝΰλαηηάΝ άηα κμΝ (signal) εαδΝβΝζ δ κυλΰέαΝ βμΝ έθαδΝσηκδαΝ
η Ναυ άΝ κυΝ έε βΝMACD.
Ό αθ β ΰλαηηά %K έθαδΝ εΪ πΝ απσΝ βθΝ ΰλαηηάΝ%D (signal),Ν σ Ν κδΝ δηΫμΝ βθΝ
αΰκλΪΝπΫφ κυθΝ(bear market),Νκπσ Ν κτ κΝ έθαδΝΫθ διβΝσ δΝ κΝαιδσΰλαφκΝπλΫπ δΝθαΝ
ππζβγ έέΝ
-120
-100
-80
-60
-40
-20
0WILLIAM %R
William R
-80LINE
-20 LINE
-50 LINE
37
Ό αθ β ΰλαηηά %K έθαδΝ πΪθπΝαπσΝ βθΝ ΰλαηηάΝ%D (signal),Ν Ν σ Ν βΝ αΰκλΪΝ έθαδΝ
αθκ δεάΝ (bull market),Ν κπσ Ν κτ κΝ έθαδΝ Ϋθ διβΝ σ δΝ κΝ αιδσΰλαφκΝ πλΫπ δΝ θαΝ
αΰκλα έέΝ
εσηαΝΫθαμΝ λσπκμΝ ληβθ έαμΝ κυΝStochastic Oscillator,Ν έθαδΝκΝπλκ δκλδ ησμΝ πθΝ
δηυθΝαθαφκλΪμέΝΟδΝ δηΫμΝπκυΝζαηίΪθ δΝStochastic Oscillator έθαδΝαπσΝίΝΫπμΝ+1ίίέΝ
Ό αθΝ κΝ %K εδθ έ αδΝ βθΝ π λδκξάΝ (κί,1ίί)Ν κΝ αιδσΰλαφκΝ γ πλ έ αδΝ
υπ λαΰκλα ηΫθκ (overbought) εαδΝ τθ κηαΝβΝ δηάΝγαΝυπκξπλά δέΝ κΝ τλκμΝ(ί,βί)Ν
κΝ αιδσΰλαφκΝ γ πλ έ αδΝ υπ λπκυζβηΫθκ (oversell),Ν κπσ Ν βΝ δηάΝ κυΝ αιδσΰλαφκυΝ
τθ κηαΝγαΝαθαεΪηο δέΝ
Ν δηάΝ ηίΝ έθαδΝ ΫθαΝ βη έκΝ αθαφκλΪμΝ ΰδαΝ βθΝ πκλ έαΝ κυΝ αιδσΰλαφκυέΝ Ό αθΝ κΝ
αιδσΰλαφκΝ εδθ έ αδΝ ΰδαΝ αλε σΝ ξλκθδεσΝ δΪ βηαΝ βθΝ π λδκξάΝ (ηί,1ίί),Ν γ πλ έ αδΝ
Ϋθ διβΝ αθκ δεάμΝ πκλ έαμέΝ θ δγΫ πμΝ σ αθΝ εδθ έ αδΝ βθΝ π λδκξάΝ (ί,ηί) γ πλ έ αδΝ
Ϋθ διβΝεαγκ δεάμΝπκλ έαμ.
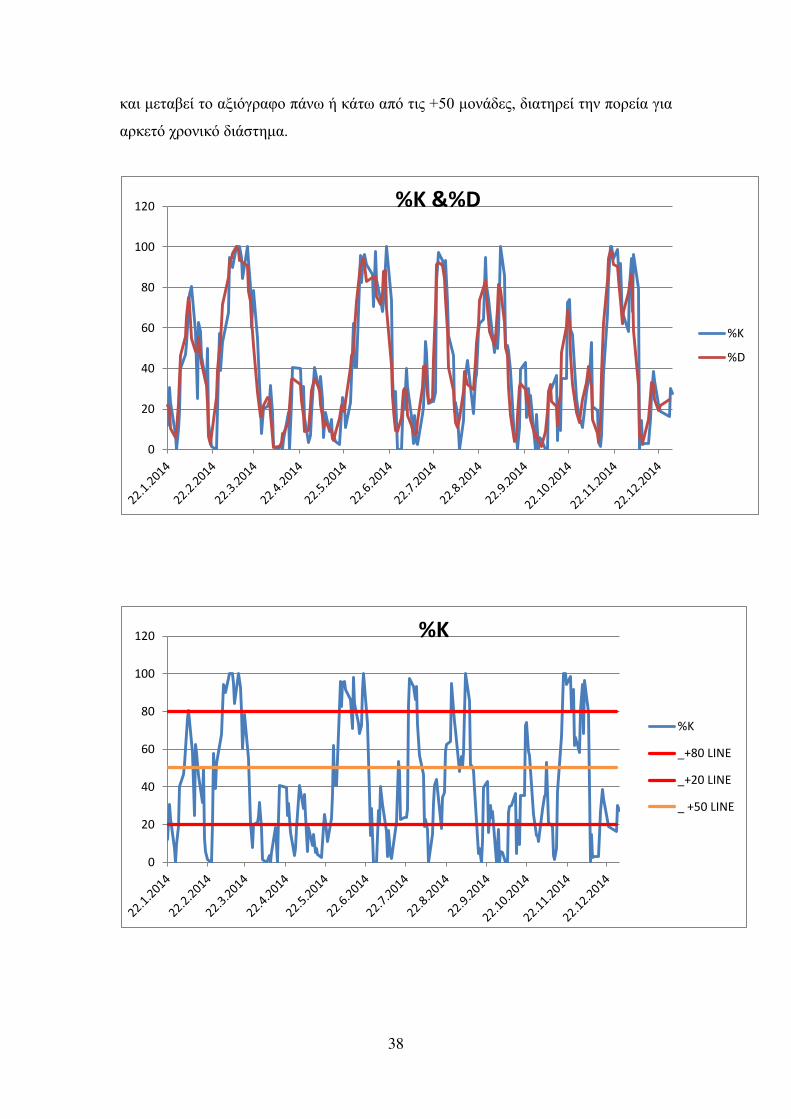
α παλαεΪ π ΰλαφάηα α αθαζτκθ αδΝ αΝαπκ ζΫ ηα αΝ κυΝ έε β
κΝπλυ κ ΰλΪφβηα Ϋξκυη δμΝΰλαηηΫμ ΣΚΝεαδΝΣD (signal), σπκυ υΝ ι Ϊακθ αδ
κδΝξλκθδεΫμΝπ λέκ κδ πκυΝβΝΣΚΝ έθαδΝπΪθπ απσΝ βθΝΣD, Ϊλα βΝαΰκλΪ έθαδΝαθκ δεά
εαδΝ κΝ αιδσΰλαφκ πλΫπ δ θαΝ αΰκλα έέΝ Ν αθ έγ β π λέπ π β, σπκυ βΝΣΚΝ έθαδΝ
εΪ π απσΝ βθΝΣD,ΝβΝαΰκλΪ έθαδΝεαγκ δεά εαδΝ κΝαιδσΰλαφκ πλΫπ δ θαΝππζβγ έ.
ΣαΝ απκ ζΫ ηα α η Ν κτ β βθΝ ηΫγκ κ θΝ έθαδΝ δ δαέ λα ι εΪγαλα, εαγυμ κδΝ
ΰλαηηΫμ πκζζΫμ φκλΫμ φαέθ αδ θαΝ υηπέπ κυθ, υθ πυμ θΝ έηα Ν γΫ β θαΝ
απκφα έ κυη αθΝ κΝαιδσΰλαφκ πλΫπ δ θαΝππζβγ έ άΝθαΝαΰκλα έ. Σκτ κ υηίαέθ δ
δσ δ βθΝπ λέπ π β ηαμ, βΝζ έαθ β απσΝ βθΝΣD (3 Days SMA) θΝ έθαδΝαλε ά ΰδαΝ
θαΝ παλΫξ δ ι εΪγαλα απκ ζΫ ηα αέΝ Ί πμ κΝSlow Stochastic Oscillator θαΝ παλ έξ
εαζτ λ μ θ έι δμ ΰδαΝ βθΝαζζαΰά βμΝ Ϊ βμ.
κ τ λκ ΰλΪφβηα π σ κ,Ν αΝ άηα α έθαδΝ πδκΝ δαελδ Ϊ. Παλα βλκτη σ δΝ βΝΝ
ΣΚ,Ν υπ λίαέθ δ αΝ σλδα +βίΝ εαδΝ +κίΝ αλε Ϋμ φκλΫμ εαδΝ ΰδαΝ η ΰΪζκ ξλκθδεσ
δΪ βηα, υθ πυμ υφέ α αδ ξλσθκμ ΰδαΝθαΝ ε δηβγ έ β πκλ έα βμΝη κξάμ. πέ βμ
βΝ η Ϊία β βμΝ ΣΚΝ η αιτΝ πθΝ κλέπθ ΰέθ αδ η Ν κηαζσ λσπκ, ΰ ΰκθσμ πκυΝ
δ υεκζτθ δ δμΝαιδκζκΰά δμ κυΝ π θ τ βέΝΘαΝηπκλκτ αη πέ βμ θαΝγΫ κυη πδκΝ
αυ βλΪ σλδα (+10, +90) ΰδαΝθαΝΫξκυη αεσηα εαζτ λ μ θ έι δμ ΰδαΝ βθΝαζζαΰά
βμΝ Ϊ βμ. πέ βμ,ΝβΝΰλαηηά πθΝ+ηίΝηκθΪ πθ έθαδΝαλε Ϊ α φαζάμ, εαγυμ απαιΝ
38
εαδΝη αί έ κΝαιδσΰλαφκ πΪθπ άΝεΪ π απσΝ δμΝ+ηίΝηκθΪ μ, δα βλ έ βθΝπκλ έαΝΰδαΝ
αλε σ ξλκθδεσ δΪ βηα.
0
20
40
60
80
100
120 %K &%D
%K
%D
0
20
40
60
80
100
120 %K
%K
_+80 LINE
_+20 LINE
_ +50 LINE
39
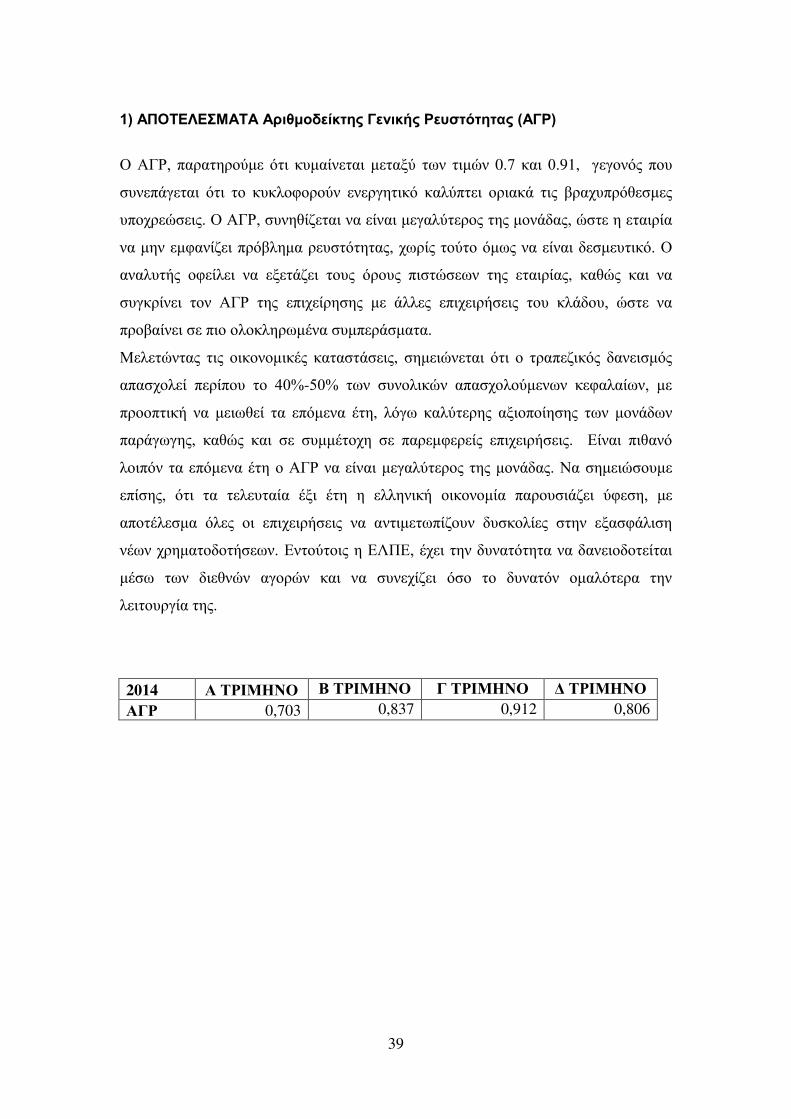
1ΨΝ ΠΟΣ Λ Μ Σ Ν λδγηο έε βμΝΓ θδεάμΝΡ υ σ β αμ Χ ΓΡΨ
ΟΝ ΓΡ,Ν παλα βλκτη σ δΝ ευηαέθ αδ η αιτ πθΝ δηυθ 0.ιΝεαδΝ ί.91, ΰ ΰκθσμ πκυΝ
υθ πΪΰ αδ σ δΝ κΝ ευεζκφκλκτθ θ λΰβ δεσ εαζτπ δ κλδαεΪ δμΝ ίλαξυπλσγ η μ
υπκξλ υ δμ. Ο ΓΡ,Ν υθβγέα αδ θαΝ έθαδΝη ΰαζτ λκμ βμΝηκθΪ αμ,Νυ ΝβΝ αδλέα
θαΝηβθΝ ηφαθέα δ πλσίζβηα λ υ σ β αμ, ξπλέμ κτ κ σηπμ θαΝ έθαδΝ η υ δεσέΝΟΝ
αθαζυ άμ κφ έζ δ θαΝ ι Ϊα δ κυμΝ σλκυμ πδ υ πθ βμΝ αδλέαμ, εαγυμ εαδΝ θαΝ
υΰελέθ δ κθΝ ΓΡΝ βμΝ πδξ έλβ βμ η Ν Ϊζζ μΝ πδξ δλά δμ κυΝ εζΪ κυ,Ν υ Ν θαΝ
πλκίαέθ δ ΝπδκΝκζκεζβλπηΫθα υηπ λΪ ηα α.
Μ ζ υθ αμ δμΝ κδεκθκηδεΫμ εα α Ϊ δμ, βη δυθ αδ σ δΝ κΝ λαπ αδεσμ αθ δ ησμ
απα ξκζ έ π λέπκυ κΝ ζίΣ-ηίΣΝ πθΝ υθκζδευθ απα ξκζκτη θπθ ε φαζαέπθ,Ν η Ν
πλκκπ δεά θαΝ η δπγ έ αΝ πση θα Ϋ β, ζσΰπ εαζτ λβμ αιδκπκέβ βμ πθΝ ηκθΪ πθ
παλΪΰπΰβμ, εαγυμ εαδΝ Ν υηηΫ κξβ Ν παλ ηφ λ έμ πδξ δλά δμ. έθαδΝ πδγαθσ
ζκδπσθ αΝ πση θα Ϋ β κΝ ΓΡΝθαΝ έθαδΝη ΰαζτ λκμ βμΝηκθΪ αμ. ΝαΝ βη δυ κυη
πέ βμ,Ν σ δΝ αΝ ζ υ αέα Ϋιδ Ϋ β βΝ ζζβθδεά κδεκθκηέα παλκυ δΪα δ τφ β,Ν η Ν
απκ Ϋζ ηαΝ σζ μ κδΝ πδξ δλά δμ θα αθ δη ππέακυθ υ εκζέ μΝ βθΝ ια φΪζδ βΝ
θΫπθ ξλβηα κ κ ά πθέΝ θ κτ κδμ βΝ ΛΠ ,ΝΫξ δΝ βθΝ υθα σ β α θαΝ αθ δκ κ έ αδ
ηΫ π πθΝ δ γθυθ αΰκλυθ εαδΝ θαΝ υθ ξέα δΝ σ κ κΝ υθα σθΝ κηαζσ λαΝ βθΝ
ζ δ κυλΰέαΝ βμέ
2014 ΝΣΡΙΜ ΝΟ ΝΣΡΙΜ ΝΟ ΓΝΣΡΙΜ ΝΟ ΝΣΡΙΜ ΝΟ
ΓΡ 0,703 0,837 0,912 0,806
40
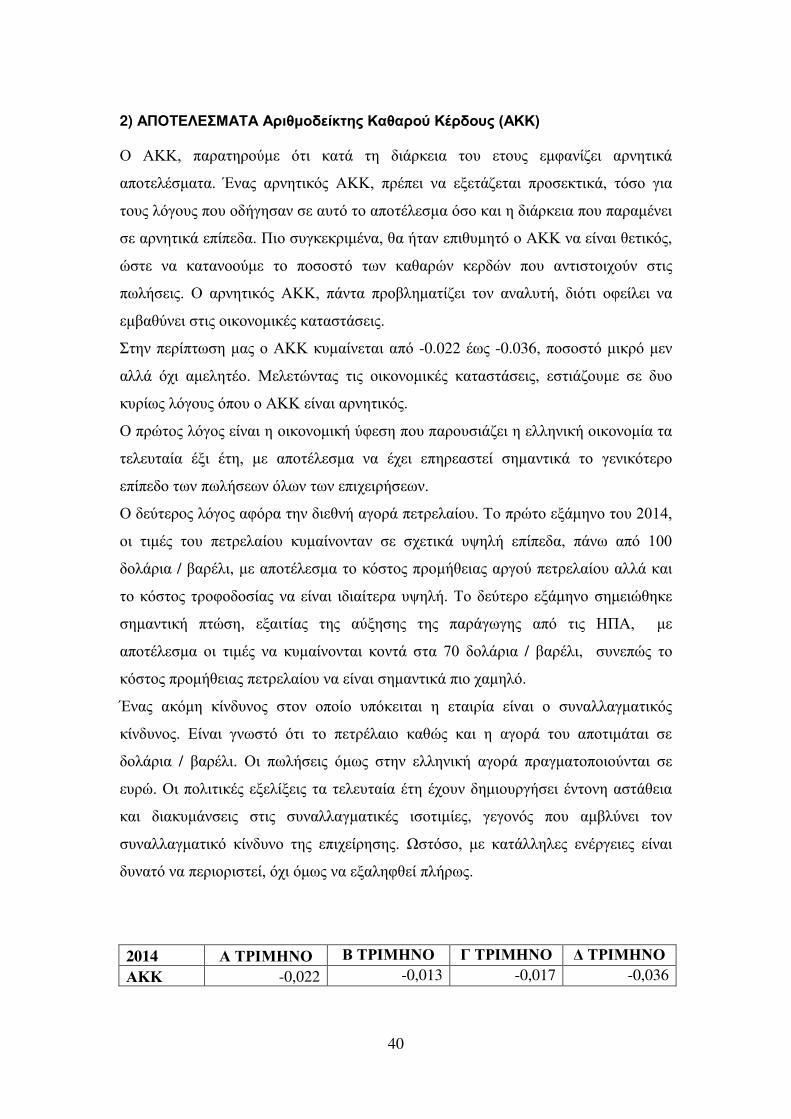
2) ΠΟΣ Λ Μ Σ Ν λδγηο έε βμΝΚαγαλοτΝΚΫλ ουμ Χ ΚΚΨΝ
ΟΝ ΚΚ,Ν παλα βλκτη σ δΝ εα ΪΝ βΝ δΪλε δα κυΝ κυμΝ ηφαθέα δ αλθβ δεΪ
απκ ζΫ ηα α. Έθαμ αλθβ δεσμ ΚΚ,Ν πλΫπ δ θαΝ ι Ϊα αδ πλκ ε δεΪ, σ κ ΰδαΝ
κυμΝζσΰκυμ πκυΝκ άΰβ αθ Ναυ σΝ κΝαπκ Ϋζ ηαΝσ κ εαδΝβΝ δΪλε δα πκυΝπαλαηΫθ δ
Ναλθβ δεΪ πέπ α. ΠδκΝ υΰε ελδηΫθα,ΝγαΝά αθΝ πδγυηβ σ κΝ ΚΚΝθαΝ έθαδΝγ δεσμ,
υ Ν θαΝ εα αθκκτη κΝ πκ κ σ πθΝ εαγαλυθ ε λ υθ πκυΝ αθ δ κδξκτθ δμΝ
ππζά δμέΝ Ο αλθβ δεσμ ΚΚ,Ν πΪθ α πλκίζβηα έα δ κθΝ αθαζυ ά, δσ δ κφ έζ δ θαΝ
ηίαγτθ δ δμΝκδεκθκηδεΫμ εα α Ϊ δμ.
βθΝπ λέπ π β ηαμΝκΝ ΚΚΝευηαέθ αδ απσΝ -0.022 Ϋπμ -0.036, πκ κ σ ηδελσ η θΝ
αζζΪ σξδΝ αη ζβ Ϋκ. Μ ζ υθ αμ δμΝ κδεκθκηδεΫμ εα α Ϊ δμ, δΪακυη Ν υκΝ
ευλέπμ ζσΰκυμ σπκυ κΝ ΚΚΝ έθαδΝαλθβ δεσμ.
ΟΝπλυ κμ ζσΰκμ έθαδΝβΝκδεκθκηδεά τφ β πκυΝπαλκυ δΪα δ βΝ ζζβθδεά κδεκθκηέα αΝ
ζ υ αέα Ϋιδ Ϋ β,Ν η Ν απκ Ϋζ ηαΝ θαΝ Ϋξ δ πβλ α έ βηαθ δεΪ κΝ ΰ θδεσ λκ
πέπ κ πθΝππζά πθ σζπθ πθΝ πδξ δλά πθ.
ΟΝ τ λκμ ζσΰκμ αφσλα βθΝ δ γθάΝαΰκλΪ π λ ζαέκυέΝΣκΝπλυ κ ιΪηβθκ κυΝβί1ζ,Ν
κδΝ δηΫμ κυΝ π λ ζαέκυ ευηαέθκθ αθ Ν ξ δεΪ υοβζά πέπ α, πΪθπ απσΝ 1ίίΝ
κζΪλδα / ίαλΫζδ, η Ναπκ Ϋζ ηαΝ κΝεσ κμ πλκηάγ δαμ αλΰκτ π λ ζαέκυ αζζΪ εαδΝ
κΝεσ κμ λκφκ κ έαμ θαΝ έθαδΝ δ δαέ λα υοβζά. ΣκΝ τ λκ ιΪηβθκ βη δυγβε
βηαθ δεά π υ β, ιαδ έαμ βμΝ ατιβ βμ βμΝ παλΪΰπΰβμ απσΝ δμΝ Π ,Ν η Ν
απκ Ϋζ ηα κδΝ δηΫμ θαΝ ευηαέθκθ αδ εκθ Ϊ αΝ ιίΝ κζΪλδα / ίαλΫζδ, υθ πυμ κΝ
εσ κμ πλκηάγ δαμ π λ ζαέκυ θαΝ έθαδΝ βηαθ δεΪ πδκΝξαηβζσ.
Έθαμ αεσηβ εέθ υθκμ κθΝ κπκέκ υπσε δ αδ βΝ αδλέαΝ έθαδΝ κΝ υθαζζαΰηα δεσμ
εέθ υθκμέΝ έθαδΝ ΰθπ σΝ σ δΝ κΝ π λΫζαδκΝ εαγυμ εαδΝ βΝ αΰκλΪΝ κυΝ απκ δηΪ αδΝ Ν
κζΪλδα / ίαλΫζδέΝ ΟδΝ ππζά δμΝ σηπμΝ βθΝ ζζβθδεά αΰκλΪ πλαΰηα κπκδκτθ αδ Ν
υλυέΝΟδΝπκζδ δεΫμ ι ζέι δμ αΝ ζ υ αέα Ϋ β Ϋξκυθ βηδκυλΰά δ Ϋθ κθβ α Ϊγ δα
εαδΝ δαευηΪθ δμ δμΝ υθαζζαΰηα δεΫμ δ κ δηέ μ, ΰ ΰκθσμ πκυΝ αηίζτθ δ κθΝ
υθαζζαΰηα δεσ εέθ υθκ βμΝ πδξ έλβ βμ. Ω σ κ,Ν η Ν εα Ϊζζβζ μ θΫλΰ δ μ έθαδΝ
υθα σ θαΝπ λδκλδ έ,ΝσξδΝσηπμΝθαΝ ιαζβφγ έ πζάλπμ.
2014 ΝΣΡΙΜ ΝΟ ΝΣΡΙΜ ΝΟ ΓΝΣΡΙΜ ΝΟ ΝΣΡΙΜ ΝΟ
ΚΚ -0,022 -0,013 -0,017 -0,036
41
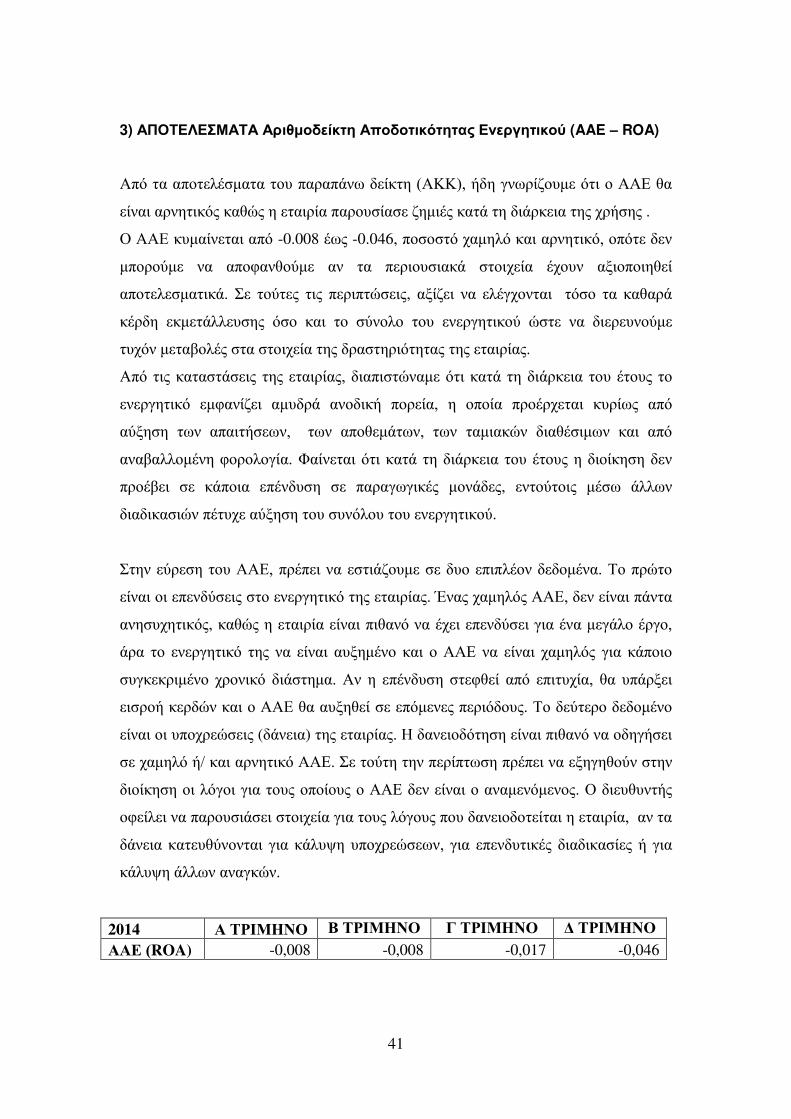
3) ΠΟΣ Λ Μ Σ Ν λδγηο έε β πο ο δεσ β αμΝ θ λγβ δεοτΝ(AAE – ROA)
πσΝ αΝαπκ ζΫ ηα α κυΝπαλαπΪθπ έε β ( ΚΚ),Νά β ΰθπλέακυη σ δΝκΝ ΝγαΝ
έθαδΝαλθβ δεσμ εαγυμ βΝ αδλέα παλκυ έα αβηδΫμ εα ΪΝ βΝ δΪλε δα βμΝξλά βμΝ.
ΟΝ Νευηαέθ αδΝαπσΝ-0.008 Ϋπμ -0.046, πκ κ σ ξαηβζσΝεαδΝαλθβ δεσ,Νκπσ Ν θΝ
ηπκλκτη θαΝ απκφαθγκτη αθ αΝ π λδκυ δαεΪ κδξ έα Ϋξκυθ αιδκπκδβγ έ
απκ ζ ηα δεΪ. Ν κτ μ δμΝ π λδπ υ δμ, αιέα δ θαΝ ζΫΰξκθ αδ σ κ αΝ εαγαλΪ
εΫλ β εη Ϊζζ υ βμ σ κ εαδΝ κΝ τθκζκ κυΝ θ λΰβ δεκτ υ Ν θαΝ δ λ υθκτη
υξσθ η αίκζΫμ αΝ κδξ έα βμΝ λα βλδσ β αμ βμΝ αδλέαμέ
πσΝ δμΝεα α Ϊ δμ βμΝ αδλέαμ,Ν δαπδ υθαη Νσ δΝεα ΪΝ βΝ δΪλε δα κυΝΫ κυμ κΝ
θ λΰβ δεσ ηφαθέα δ αηυ λΪΝ αθκ δεά πκλ έα,Ν βΝ κπκέα πλκΫλξ αδ ευλέπμ απσΝ
ατιβ β πθΝ απαδ ά πθ,Ν Ν πθΝ απκγ ηΪ πθ,Ν πθΝ αηδαευθ δαγΫ δηπθ εαδΝ απσΝ
αθαίαζζκηΫθβΝφκλκζκΰέαέΝΦαέθ αδ σ δΝεα ΪΝ βΝ δΪλε δα κυΝΫ κυμ βΝ δκέεβ β θΝ
πλκΫί δΝ Ν εΪπκδα πΫθ υ β Ν παλαΰπΰδεΫμ ηκθΪ μ, θ κτ κδμ ηΫ π Ϊζζπθ
δα δεα δυθ πΫ υξ Νατιβ β κυΝ υθσζκυ κυΝ θ λΰβ δεκτ.
βθΝ τλ β κυΝ ,ΝπλΫπ δΝθαΝ δΪακυη Ν υκΝ πδπζΫκθ κηΫθαέΝΣκΝπλυ κ
έθαδΝκδΝ π θ τ δμ κΝ θ λΰβ δεσ βμΝ αδλέαμ. Έθαμ ξαηβζσμ ,Ν θΝ έθαδΝπΪθ α
αθβ υξβ δεσμ, εαγυμ βΝ αδλέα έθαδΝπδγαθσ θαΝΫξ δ π θ τ δΝΰδαΝΫθα η ΰΪζκ Ϋλΰκ,Ν
Ϊλα κΝ θ λΰβ δεσ βμ θαΝ έθαδΝ αυιβηΫθκ εαδΝ κΝ Ν θα έθαδΝ ξαηβζσμ ΰδαΝ εΪπκδκ
υΰε ελδηΫθκ ξλκθδεσ δΪ βηαέΝ θΝ βΝ πΫθ υ β φγ έ απσΝ πδ υξέα,Ν γαΝ υπΪλι δ
δ λκά ε λ υθ εαδΝκΝ ΝγαΝαυιβγ έ Ν πση θ μ π λδσ κυμέΝΣκΝ τ λκ κηΫθκ
έθαδΝκδΝυπκξλ υ δμ ( Ϊθ δα) βμΝ αδλέαμέΝ Ν αθ δκ σ β β έθαδΝπδγαθσ θαΝκ βΰά δ
Νξαηβζσ άήΝεαδΝαλθβ δεσ έΝ Ν κτ β βθΝπ λέπ π β πλΫπ δ θαΝ ιβΰβγκτθ βθΝ
δκέεβ β κδΝζσΰκδ ΰδαΝ κυμΝκπκέκυμ κΝ Ν θΝ έθαδΝκΝαθαη θση θκμέΝΟΝ δ υγυθ άμ
κφ έζ δ θαΝπαλκυ δΪ δ κδξ έα ΰδαΝ κυμΝζσΰκυμ πκυΝ αθ δκ κ έ αδΝβΝ αδλέα,ΝΝαθΝ αΝ
Ϊθ δα εα υγτθκθ αδ ΰδαΝ εΪζυοβ υπκξλ υ πθ,Ν ΰδαΝ π θ υ δεΫμ δα δεα έ μ άΝ ΰδαΝ
εΪζυοβΝΪζζπθ αθαΰευθέ
2014 ΝΣΡΙΜ ΝΟ ΝΣΡΙΜ ΝΟ ΓΝΣΡΙΜ ΝΟ ΝΣΡΙΜ ΝΟ
Ν(ROA) -0,008 -0,008 -0,017 -0,046
42
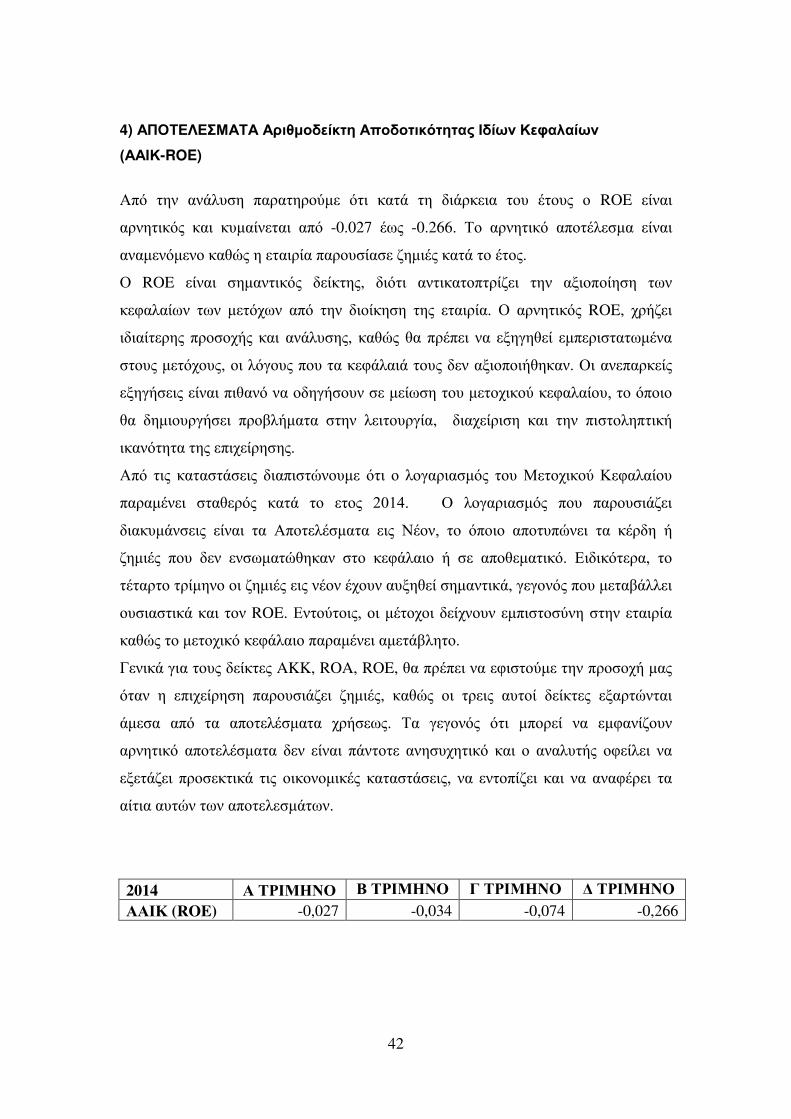
4) ΠΟΣ Λ Μ Σ Ν λδγηο έε βΝ πο ο δεσ β αμΝΙ έωθΝΚ φαζαέωθ
ΧAAΙΚ-ROE)
πσΝ βθΝ αθΪζυ βΝ παλα βλκτη Ν σ δΝ εα ΪΝ βΝ δΪλε δαΝ κυΝ Ϋ κυμΝ κΝ ROE έθαδΝ
αλθβ δεσμΝ εαδΝ ευηαέθ αδΝ απσΝ -0.027 Ϋπμ -0.266έΝ ΣκΝ αλθβ δεσ απκ Ϋζ ηα έθαδΝ
αθαη θση θκ εαγυμ βΝ αδλέα παλκυ έα αβηδΫμ εα ΪΝ κΝΫ κμ.
ΟΝ ROE έθαδΝ βηαθ δεσμΝ έε βμ, δσ δ αθ δεα κπ λέα δ βθΝ αιδκπκέβ β πθΝ
ε φαζαέπθΝ πθΝ η σξπθΝ απσΝ βθΝ δκέεβ βΝ βμΝ αδλέαέΝ ΟΝ αλθβ δεσμ ROE, ξλάα δ
δ δαέ λβμΝ πλκ κξάμΝ εαδΝ αθΪζυ βμ, εαγυμ γαΝπλΫπ δ θαΝ ιβΰβγ έΝ ηπ λδ α πηΫθαΝ
κυμΝη σξκυμ, κδ ζσΰκυμΝπκυΝ αΝε φΪζαδΪΝ κυμΝ θΝαιδκπκδάγβεαθ. Οδ αθ παλε έμ
ιβΰά δμ έθαδΝπδγαθσ θαΝκ βΰά κυθ Νη έπ β κυΝη κξδεκτ ε φαζαέκυ,Ν κΝσπκδκ
γαΝ βηδκυλΰά δΝ πλκίζάηα αΝ βθΝ ζ δ κυλΰέα, δαξ έλδ βΝ εαδΝ βθΝ πδ κζβπ δεά
δεαθσ β α βμΝ πδξ έλβ βμέΝ
πσΝ δμΝ εα α Ϊ δμ δαπδ υθκυη σ δΝ κΝ ζκΰαλδα ησμΝ κυΝΜ κξδεκτ Κ φαζαέκυ
παλαηΫθ δ αγ λσμ εα ΪΝ κΝ κμΝ βί1ζέΝ Ν Ν ΟΝ ζκΰαλδα ησμ πκυΝ παλκυ δΪα δ
δαευηΪθ δμ έθαδΝ αΝ πκ ζΫ ηα α δμΝ ΝΫκθ,Ν κΝ σπκδκ απκ υπυθ δ αΝ εΫλ β άΝ
αβηδΫμ πκυΝ θΝ θ πηα υγβεαθ κΝ ε φΪζαδκ άΝ Ν απκγ ηα δεσ. δ δεσ λα, κΝ
Ϋ αλ κ λέηβθκ κδΝαβηδΫμ δμΝθΫκθ Ϋξκυθ αυιβγ έ βηαθ δεΪ, ΰ ΰκθσμ πκυΝη αίΪζζ δ
κυ δα δεΪΝεαδΝ κθ ROE. θ κτ κδμ,ΝκδΝηΫ κξκδ έξθκυθ ηπδ κ τθβ βθΝ αδλέα
εαγυμ κΝη κξδεσ ε φΪζαδκ παλαηΫθ δ αη Ϊίζβ κ.
Γ θδεΪ ΰδαΝ κυμΝ έε μ AKK, ROA, ROE, γαΝπλΫπ δ θαΝ φδ κτη Ν βθΝπλκ κξά ηαμΝ
σ αθΝ βΝ πδξ έλβ β παλκυ δΪα δ αβηδΫμ, εαγυμ κδΝ λ δμΝ αυ κέ έε μ ιαλ υθ αδ
Ϊη α απσΝ αΝ απκ ζΫ ηα α ξλά πμέΝ ΣαΝ ΰ ΰκθσμ σ δΝ ηπκλ έ θαΝ ηφαθέακυθ
αλθβ δεσ απκ ζΫ ηα α θΝ έθαδΝ πΪθ κ αθβ υξβ δεσΝ εαδΝ κΝ αθαζυ άμ κφ έζ δ θαΝ
ι Ϊα δ πλκ ε δεΪΝ δμΝ κδεκθκηδεΫμΝ εα α Ϊ δμ,Ν θαΝ θ κπέα δΝ εαδΝ θαΝ αθαφΫλ δ αΝ
αέ δα αυ υθ πθΝαπκ ζ ηΪ πθ.
2014 ΝΣΡΙΜ ΝΟ ΝΣΡΙΜ ΝΟ ΓΝΣΡΙΜ ΝΟ ΝΣΡΙΜ ΝΟ
ΙΚ (ROE) -0,027 -0,034 -0,074 -0,266
43
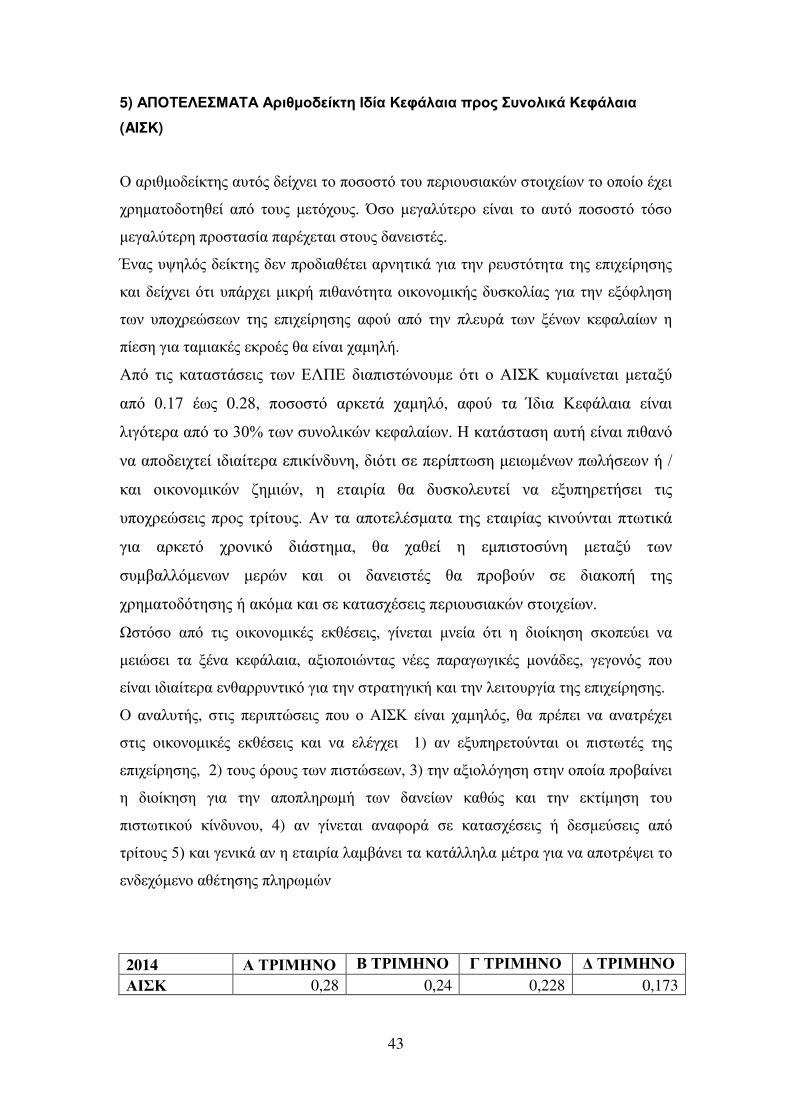
5) ΠΟΣ Λ Μ Σ Ν λδγηο έε βΝΙ έαΝΚ φΪζαδαΝπλομΝυθοζδεΪΝΚ φΪζαδα
(AIΚ)
ΟΝαλδγηκ έε βμΝαυ σμΝ έξθ δΝ κΝπκ κ σΝ κυΝπ λδκυ δαευθΝ κδξ έπθΝ κΝκπκέκΝΫξ δΝ
ξλβηα κ κ βγ έΝ απσΝ κυμΝ η σξκυμέΝ Ό κΝ η ΰαζτ λκΝ έθαδΝ κΝ αυ σΝ πκ κ σΝ σ κΝ
η ΰαζτ λβΝπλκ α έαΝπαλΫξ αδΝ κυμΝ αθ δ Ϋμέ
ΈθαμΝυοβζσμΝ έε βμΝ θΝπλκ δαγΫ δΝαλθβ δεΪΝΰδαΝ βθΝλ υ σ β α βμΝ πδξ έλβ βμ
εαδΝ έξθ δ σ δ υπΪλξ δ ηδελάΝπδγαθσ β αΝκδεκθκηδεάμΝ υ εκζέαμΝΰδαΝ βθΝ ισφζβ βΝ
πθΝ υπκξλ υ πθΝ βμΝ πδξ έλβ βμΝ αφκτΝ απσ βθ πζ υλΪ πθ ιΫθπθ ε φαζαέπθ β
πέ β ΰδα αηδαεΫμ ελκΫμ γα έθαδ ξαηβζά.
πσΝ δμΝ εα α Ϊ δμ πθΝ ΛΠ Ν δαπδ υθκυη σ δΝ κΝ ΙΚΝ ευηαέθ αδΝ η αιτ
απσΝ ίέ17 Ϋπμ 0.28, πκ κ σ αλε Ϊ ξαηβζσ, αφκτ αΝ Ί δα Κ φΪζαδα έθαδΝ
ζδΰσ λα απσΝ κΝγίΣΝ πθΝ υθκζδευθ ε φαζαέπθέΝ Νεα Ϊ α β αυ ά έθαδΝπδγαθσ
θαΝαπκ δξ έ δ δαέ λα πδεέθ υθβ, δσ δ Νπ λέπ π β η δπηΫθπθ ππζά πθ άΝήΝ
εαδΝ κδεκθκηδευθ αβηδυθ,Ν βΝ αδλέα γαΝ υ εκζ υ έ θαΝ ιυπβλ ά δ δμΝ
υπκξλ υ δμ πλκμΝ λέ κυμ. θΝ αΝαπκ ζΫ ηα α βμΝ αδλέαμ εδθκτθ αδΝ π π δεΪ
ΰδαΝ αλε σ ξλκθδεσ δΪ βηα,Ν γαΝ ξαγ έ βΝ ηπδ κ τθβ η αιτ πθΝ
υηίαζζση θπθ η λυθ εαδΝ κδΝ αθ δ Ϋμ γαΝ πλκίκτθ Ν δαεκπά βμΝ
ξλβηα κ σ β βμ άΝαεσηα εαδΝ Νεα α ξΫ δμ π λδκυ δαευθ κδξ έπθ.
Ω σ κ απσΝ δμΝ κδεκθκηδεΫμ εγΫ δμ, ΰέθ αδ ηθ έαΝ σ δΝ βΝ δκέεβ β εκπ τ δ θαΝ
η δυ δ αΝ ιΫθα ε φΪζαδα, αιδκπκδυθ αμ θΫ μ παλαΰπΰδεΫμ ηκθΪ μ, ΰ ΰκθσμ πκυΝ
έθαδΝδ δαέ λα θγαλλυθ δεσ ΰδαΝ βθΝ λα βΰδεά εαδΝ βθΝζ δ κυλΰέα βμΝ πδξ έλβ βμ.
ΟΝαθαζυ άμ, δμΝ π λδπ υ δμ πκυΝ κΝ ΙΚΝ έθαδΝ ξαηβζσμ, γαΝ πλΫπ δ θαΝ αθα λΫξ δ
δμΝ κδεκθκηδεΫμ εγΫ δμ εαδΝ θαΝ ζΫΰξ δ 1) αθΝ ιυπβλ κτθ αδΝ κδΝ πδ π Ϋμ βμΝ
πδξ έλβ βμ, 2) κυμΝσλκυμ πθΝπδ υ πθ, 3) βθΝαιδκζσΰβ β βθΝκπκέα πλκίαέθ δ
βΝ δκέεβ β ΰδαΝ βθΝ απκπζβλπηά πθΝ αθ έπθ εαγυμ εαδΝ βθΝ ε έηβ β κυΝ
πδ π δεκτ εέθ υθκυ, 4) αθΝ ΰέθ αδ αθαφκλΪ Ν εα α ξΫ δμ άΝ η τ δμ απσΝ
λέ κυμ η)ΝεαδΝΰ θδεΪ αθΝβΝ αδλέα ζαηίΪθ δ αΝεα Ϊζζβζα ηΫ λα ΰδαΝθαΝαπκ λΫο δΝ κΝ
θ ξση θκΝαγΫ β βμΝπζβλπηυθ
2014 ΝΣΡΙΜ ΝΟ ΝΣΡΙΜ ΝΟ ΓΝΣΡΙΜ ΝΟ ΝΣΡΙΜ ΝΟ
ΙΚ 0,28 0,24 0,228 0,173
44
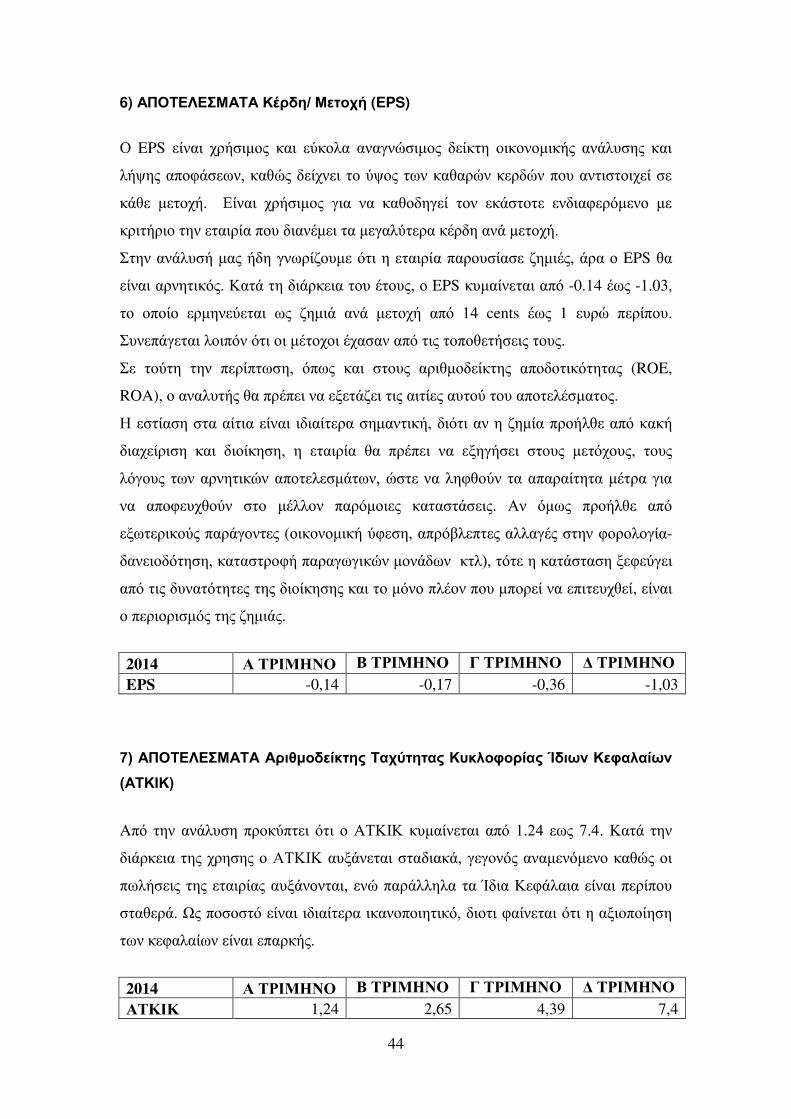
6) ΠΟΣ Λ Μ Σ ΚΫλ βήΝΜ οχάΝ(EPS)
ΟΝEPS έθαδΝ ξλά δηκμ εαδΝ τεκζα αθαΰθυ δηκμ έε βΝ κδεκθκηδεάμΝ αθΪζυ βμΝ εαδΝ
ζάοβμΝαπκφΪ πθ,ΝεαγυμΝ έξθ δΝ κΝτοκμΝ πθΝεαγαλυθΝε λ υθΝπκυΝαθ δ κδξ έΝ Ν
εΪγ Ν η κξάέΝ Ν έθαδΝ ξλά δηκμΝ ΰδαΝ θαΝ εαγκ βΰ έΝ κθΝ εΪ κ Ν θ δαφ λση θκΝ η Ν
ελδ άλδκΝ βθΝ αδλέαΝπκυΝ δαθΫη δΝ αΝη ΰαζτ λαΝεΫλ βΝαθΪΝη κξάέΝ
βθΝαθΪζυ ά ηαμΝά β ΰθπλέακυη σ δΝβΝ αδλέα παλκυ έα αβηδΫμ, Ϊλα κΝEPS γαΝ
έθαδΝαλθβ δεσμέΝΚα ΪΝ βΝ δΪλε δα κυΝΫ κυμ, κΝEPS ευηαέθ αδ απσΝ-0.14 Ϋπμ -1.03,
κΝ κπκέκ ληβθ τ αδ πμΝ αβηδΪ αθΪ η κξά απσΝ 1ζΝ cents Ϋπμ 1 υλυ π λέπκυ.
υθ πΪΰ αδ ζκδπσθ σ δΝκδΝηΫ κξκδ Ϋξα αθ απσΝ δμΝ κπκγ ά δμ κυμέ
Ν κτ β βθΝ π λέπ π β,Ν σππμΝ εαδΝ κυμΝ αλδγηκ έε βμ απκ κ δεσ β αμ (ROE,
ROA), κΝαθαζυ άμ γαΝπλΫπ δ θαΝ ι Ϊα δ δμΝαδ έ μΝαυ κτ κυΝαπκ ζΫ ηα κμ.
Ν έα βΝ αΝαέ δαΝ έθαδ δ δαέ λαΝ βηαθ δεά, δσ δ αθΝβΝαβηέα πλκάζγ απσΝεαεά
δαξ έλδ β εαδΝ δκέεβ β,Ν βΝ αδλέα γαΝ πλΫπ δ θαΝ ιβΰά δΝ κυμΝ η σξκυμ, κυμΝ
ζσΰκυμ πθΝαλθβ δευθ απκ ζ ηΪ πθ,Νυ ΝθαΝζβφγκτθΝ αΝαπαλαέ β α ηΫ λα ΰδαΝ
θαΝ απκφ υξγκτθΝ κΝ ηΫζζκθ παλσηκδ μΝ εα α Ϊ δμέΝ θΝ σηπμΝ πλκάζγ απσΝ
ιπ λδεκτμ παλΪΰκθ μ (κδεκθκηδεά τφ β, απλσίζ π μΝαζζαΰΫμ βθΝφκλκζκΰέα-
αθ δκ σ β β,Νεα α λκφάΝπαλαΰπΰδευθ ηκθΪ πθ ε ζ), σ βΝεα Ϊ α βΝι φ τΰ δΝ
απσΝ δμΝ υθα σ β μ βμΝ δκέεβ βμΝεαδΝ κΝησθκΝπζΫκθΝπκυΝηπκλ έΝθαΝ πδ υξγ έ, έθαδΝ
κΝπ λδκλδ ησμΝ βμΝαβηδΪμέ
2014 ΝΣΡΙΜ ΝΟ ΝΣΡΙΜ ΝΟ ΓΝΣΡΙΜ ΝΟ ΝΣΡΙΜ ΝΟ
EPS -0,14 -0,17 -0,36 -1,03
ιΨΝ ΠΟΣ Λ Μ Σ λδγηο έε βμΝΣαχτ β αμΝΚυεζοφολέαμΝΊ δωθΝΚ φαζαέωθΝΧ ΣΚΙΚΨΝ
πσΝ βθΝαθΪζυ βΝπλκετπ δΝ σ δΝ κΝ ΣΚΙΚΝευηαέθ αδΝ απσΝ1έβζΝ πμΝ ιέζέΝΚα ΪΝ βθΝ
δΪλε δα βμΝξλβ βμ κΝ ΣΚΙΚΝαυιΪθ αδ α δαεΪ, ΰ ΰκθσμ αθαη θση θκ εαγυμ κδΝ
ππζά δμ βμΝ αδλέαμ αυιΪθκθ αδ,Ν θυΝπαλΪζζβζα αΝΊ δα Κ φΪζαδα έθαδΝπ λέπκυ
αγ λΪέΝΩμΝπκ κ σ έθαδΝδ δαέ λα δεαθκπκδβ δεσ,Ν δκ δΝφαέθ αδ σ δΝβΝαιδκπκέβ βΝ
πθΝε φαζαέπθΝ έθαδΝ παλεάμέ
2014 ΝΣΡΙΜ ΝΟ ΝΣΡΙΜ ΝΟ ΓΝΣΡΙΜ ΝΟ ΝΣΡΙΜ ΝΟ
ΣΚΙΚ 1,24 2,65 4,39 7,4
45
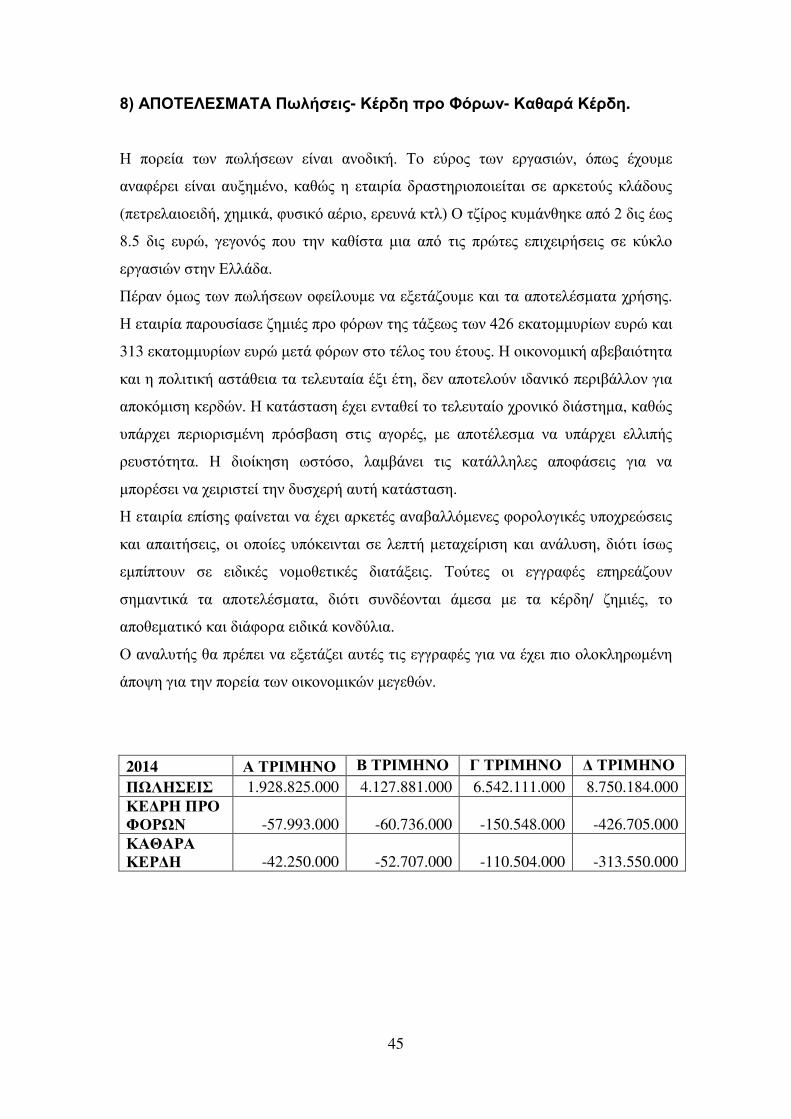
κΨΝ ΠΟΣ Λ Μ Σ ΝΠωζά δμ- ΚΫλ β πλοΝΦσλωθ- ΚαγαλΪ ΚΫλ β.
Ν πκλ έα πθΝ ππζά πθΝ έθαδΝ αθκ δεάέΝ ΣκΝ τλκμ πθΝ λΰα δυθ,Ν σππμΝ Ϋξκυη
αθαφΫλ δ έθαδΝ αυιβηΫθκ, εαγυμ βΝ αδλέα λα βλδκπκδ έ αδ Ν αλε κτμ εζΪ κυμ
(π λ ζαδκ δ ά, ξβηδεΪ, φυ δεσ αΫλδκ, λ υθΪ ε ζ)ΝΟΝ αέλκμ ευηΪθγβε ΝαπσΝβΝ δμΝΫπμ
κέηΝ δμΝ υλυ, ΰ ΰκθσμ πκυΝ βθΝ εαγέ α ηδαΝ απσΝ δμΝ πλυ μ πδξ δλά δμ Ν ετεζκΝ
λΰα δυθ βθΝ ζζΪ α.
ΠΫλαθ σηπμΝ πθΝππζά πθ κφ έζκυη θαΝ ι Ϊακυη εαδΝ αΝαπκ ζΫ ηα α ξλά βμ.
Ν αδλέα παλκυ έα αβηδΫμ πλκΝφσλπθ βμΝ Ϊι πμ πθΝζβθΝ εα κηηυλέπθ υλυ εαδΝ
313 εα κηηυλέπθ υλυ η Ϊ φσλπθ κΝ Ϋζκμ κυΝΫ κυμέΝ Νκδεκθκηδεά αί ίαδσ β α
εαδΝβΝπκζδ δεά α Ϊγ δαΝ αΝ ζ υ αέα Ϋιδ Ϋ β,Ν θΝαπκ ζκτθ δ αθδεσ π λδίΪζζκθ ΰδαΝ
απκεσηδ β ε λ υθέΝ Νεα Ϊ α β Ϋξ δ θ αγ έ κΝ ζ υ αέκ ξλκθδεσ δΪ βηα, εαγυμ
υπΪλξ δ π λδκλδ ηΫθβ πλσ ία β δμ αΰκλΫμ,Ν η Ν απκ Ϋζ ηαΝ θαΝ υπΪλξ δ ζζδπάμΝ
λ υ σ β α. Ν δκέεβ β π σ κ, ζαηίΪθ δ δμΝ εα Ϊζζβζ μΝ απκφΪ δμ ΰδαΝ θαΝ
ηπκλΫ δ θαΝξ δλδ έ βθΝ υ ξ λά αυ άΝεα Ϊ α β.
Ν αδλέα πέ βμ φαέθ αδ θαΝΫξ δ αλε Ϋμ αθαίαζζση θ μ φκλκζκΰδεΫμ υπκξλ υ δμ
εαδΝαπαδ ά δμ,ΝκδΝκπκέ μ υπσε δθ αδΝ Ν ζ π ά η αξ έλδ β εαδΝαθΪζυ β, δσ δ έ πμ
ηπέπ κυθ Ν δ δεΫμ θκηκγ δεΫμ δα Ϊι δμ. Σκτ μ κδΝ ΰΰλαφΫμ πβλ Ϊακυθ
βηαθ δεΪ αΝ απκ ζΫ ηα α, δσ δ υθ Ϋκθ αδ Ϊη α η Ν αΝ εΫλ β/ αβηδΫμ,Ν κΝ
απκγ ηα δεσ εαδΝ δΪφκλα δ δεΪ εκθ τζδα.
ΟΝαθαζυ άμ γαΝπλΫπ δ θαΝ ι Ϊα δ αυ Ϋμ δμΝ ΰΰλαφΫμ ΰδαΝθαΝΫξ δ πδκΝκζκεζβλπηΫθβ
Ϊπκοβ ΰδαΝ βθΝπκλ έα πθΝκδεκθκηδευθ η ΰ γυθ.
2014 ΝΣΡΙΜ ΝΟ ΝΣΡΙΜ ΝΟ ΓΝΣΡΙΜ ΝΟ ΝΣΡΙΜ ΝΟ
ΠΩΛ Ι 1.928.825.000 4.127.881.000 6.542.111.000 8.750.184.000
Κ Ρ ΝΠΡΟΝΦΟΡΩΝ -57.993.000 -60.736.000 -150.548.000 -426.705.000
Κ Θ Ρ ΝΚ Ρ -42.250.000 -52.707.000 -110.504.000 -313.550.000
46
ΤΜΠ Ρ Μ Σ
Οζκεζβλυθκθ αμ βθΝη ζΫ β, εα αζάΰκυη σ δΝ σ κ βΝ ξθδεά σ κ εαδΝβΝγ η ζδυ βμ
αθΪζυ β απκ ζκτθ υκΝία δεΪ εαδΝδ ξυλΪ λΰαζ έα ΰδαΝΫθαθΝαθαζυ ά υ ΝθαΝΫξ δ
κζκεζβλπηΫθβ δεσθα ΰδαΝ βθΝ αδλέα εαδΝ βθΝπκλ έα βμέΝ
ΟδΝ αθαζυ Ϋμ εαδΝ κδΝ τηίκυζκδ υηφπθκτθ σ δΝ πδίΪζζ αδ βΝ ΰθυ β εαδΝ πθΝ υκΝ
ξθδευθ ΰδαΝ βθΝ Ν ιΫ α β πθΝ κδεκθκηδευθ η ΰ γυθ, π σ κ υπΪλξκυθ
αθ δελκυση θ μ απσο δμ σπκυ, ηδαΝ η λέ α υπκ βλέα δ σ δΝ πλΫπ δ θαΝ ία δασηα
π λδ σ λκ βθΝ ξθδεά αθΪζυ β θυΝεΪπκδκδ Ϊζζκδ βθΝΝγ η ζδυ β.
Άπκοβ ηαμΝ σ δ,Ν ΰδαΝ ΫθαθΝ εεκζαπ ση θκΝ αθαζυ ά βΝ πλκ Ϋΰΰδ βΝ θ έεθυ αδΝ θαΝ
ι εδθΪ δΝαπσΝ βθΝγ η ζδυ β αθΪζυ β υ ΝθαΝεα αθκ έ βθΝζ δ κυλΰέα,Ν κΝ εκπσ εαδΝ
κυμΝ σξκυμ βμΝ αδλέαμ ηΫ π πθΝκδεκθκηδευθ εα α Ϊ πθέΝΝΌ αθΝεα αθκβγκτθ
κτ α αΝία δεΪ κδξ έα,Ν κΝ πση θκ Ϊ δκ έθαδΝθαΝΫξ δ βθΝ υθα σ β α θαΝαθ ζ έ
ία δεΫμ πζβλκφκλέ μ απσ κθΝ δ κζκΰδ ησ, αΝ απκ ζΫ ηα α ξλά βμ εαδΝ δμΝ
βη δυ δμ πθΝ ζ ΰε υθ.
ΣκΝ πση θκ ίάηα αφκλΪ βθΝ ξθδεά αθΪζυ β, σπκυ γαΝπλΫπ δ θαΝΰέθ αδ εα αθκβ κ
κΝία δεσΝυπσίαγλκΝεα α ε υάμΝ πθΝ δε υθ, βΝζ δ κυλΰέα κυμ,Ν βΝ ξλά βΝ εαδΝ αΝ
απκ Ϋζ ηαΝ κυμέΝ Ν ζδεσ Ϊ δκ, υθ υΪακθ αδ κδΝ υκΝ ξθδεΫμ ΰδαΝ βθΝ
κζκεζάλπ β βμΝαθΪζυ βμ βμΝ αδλέαμ.
βθΝπαλκυ έα ά ηαμ,Νπλκ παγά αη θαΝ ι τλκυη η λδεκτμ ία δεκτμ έε μ εαδΝ
κδξ έα ΰδαΝ βθΝ αδλέα ζζβθδεΪ Π λΫζαδα. Παλα βλά αη σ δ,Ν αΝ κδεκθκηδεΪ
κδξ έα εαδΝ βΝ η κξά βμΝ παλκυ δΪακυθ εαγκ δεά πκλ έα εαγκζβ βΝ δΪλε δα κυΝ
Ϋ κυμ.
ΟδΝ έε μ ξθδεάμ αθΪζυ βμ Ϋ διαθ σ δΝβΝαΰκλΪ παλκυ δΪα δ π υ β, Ϊλα βΝη κξά
πλΫπ δ θαΝππζβγ έ,ΝπζβθΝ ζαξέ πθ ιαδλΫ πθ εα ΪΝ βΝ δΪλε δα κυΝΫ κυμ σπκυ βΝ
αΰκλΪ βη έπ Ϊθκ κ ΰδαΝ τθ κηα ξλκθδεΪ δα άηα α. πδπζΫκθ,Ν βΝ αδλέα
παλκυ έα αβηδΫμ εαδΝ αΝ Ϋ λα λέηβθα,Ν θυΝκδΝυπκξλ υ δμ βμΝά αθ αυιβηΫθ μ
Ν ξΫ β η Ν αΝ έ δα ε φΪζαδα. Ν λ υ σ β α βμΝ αδλέαμ ά αθ Ν φυ δκζκΰδεΪ
πέπ α, ξπλέμ π σ κ θαΝ έθαδΝ Ν απσζυ β γΫ β θαΝ δαξ δλδ έΝ εαδΝαπκπζβλυ δ
σζ μ δμΝίλαξυπλσγ η μ υπκξλ υ δμ αθΝαυ ΫμΝαπαδ βγκτθ.
Σκτ α αΝ κηΫθα κφ έζκθ αδ ευλέπμ Ν ιπΰ θ έμ παλΪΰκθ μ,Νσππμ βΝπκζδ δεά εαδΝ
κδεκθκηδεά α Ϊγ δα βΝ ξπλΪ,Ν κΝ η αίαζζση θκ φκλκζκΰδεσ π λδίΪζζκθ,Ν κδΝ
αζζαΰΫμ βθΝ θκηκγ έα ε ζέΝ θ κτ κδμ,Ν βΝ αδλέα υθ ξέα δ απλσ εκπ α βθΝ
47
ζ δ κυλΰέα βμ,Ν Ϋξ δ πλσ ία β δμΝ αΰκλΫμ ξπλέμ δ δαέ λ μ υ εκζέ μ,Ν η Ν
απκ Ϋζ ηαΝ θαΝ ηβθΝ πλκετπ κυθΝ ξλβηα κ κ δεΪΝ ε θΪ,Ν θυΝ παλΪζζβζαΝ κΝ ετεζκμΝ
λΰα δυθΝ βμΝ έθαδΝ αυιβηΫθκμέ Σκτ α απκ ζκτθ θ έι δμ σ δΝ βΝ δκέεβ β έθαδΝ
αλε Ϊ απκ ζ ηα δεά, απκ κ δεάΝεαδΝΫηπδ βΝεαδΝΫξ δ ζΪί δ π Ϋμ απκφΪ δμ.
Ι ΛΙΟΓΡ ΦΙ - Ν ΦΟΡ
[1] Γ θδεάΝζκΰδ δεάέΝ(Κκθ ΪεκμΝ λδ κ ΫζβμέΝ ε σ δμΝ ζζβθ- 2006)
[2] Χλβηα κκδεκθκηδεάΝ αθΪζυ βΝ ζκΰδ δευθΝ εα α Ϊ πθέΝ (ΝδΪλξκμΝ Νδεά αμέΝ
ε σ δμΝ αηκυζβμ- 2006)
[γ]ΝΛκΰδ δεάΝΙΝΤΝΙΙέΝ(Κκυ κτεβμΝΚπθ αθ έθκμέΝ ε σ δμΝUniversity Studio Press-
2009)
[ζ]Ν ΝκδεκθκηδεάΝ βμΝ πδξ έλβ βμέΝ(ΠκησθβμΝΝδεσζακμέΝ ε σ δμΝ αηκτζβμ- 2002
[η]ΝΛκΰδ δεάέΝ(EisenΝJέΝPeterέΝ ε σ δμΝΚζ δ Ϊλδγηκμ- 1997)
[6] ΝαθΪζυ β εαδΝβΝξλά β ζκΰδ δευθ εα α Ϊ πθέΝ(ΓεδεαμΝ βηά λδκμέΝ ε σ δμΝ
Μπ θκυΝΓέ- 2002)
[7]ΝΣ ξθδεάΝαθΪζυ βΝεαδΝRisk Management (Πδ ΫζβμΝ ά βμέΝ ε σ δμΝ υΰσμ- 2006)
[κ]ΝΣ ξθδεάΝαθΪζυ βέΝ( βησπκυζκμΝ βηά λβμ. ε σ δμΝEurocapital- 1997)
[λ]ΝΣ ξθδεάΝαθΪζυ βέΝ(ΚκυλκτεζβμΝΧΪλβμέΝ ε σ δμΝεetapublications- 1999)
[10] ΰξ δλέ δκΝ φαληκ ηΫθβμΝΣ ξθδεάμΝ θΪζυ βμ ( λ αίαθβμΝΓ υλΰδκμέΝΝ ε σ δμ
Nomismatus RPI- 2000)
[11] Technical analysis, plain and simple (Kahn Michael. FT Press- 2006)
[12] Technical Analysis of the Financial Markets: A Comprehensive Guide to Trading
Methods and Applications (Murphy John. ε σ δμ New York Institute of Finance-
1999)
www.wikipedia.org
www.stockcharts.com
www.elpe.gr
48
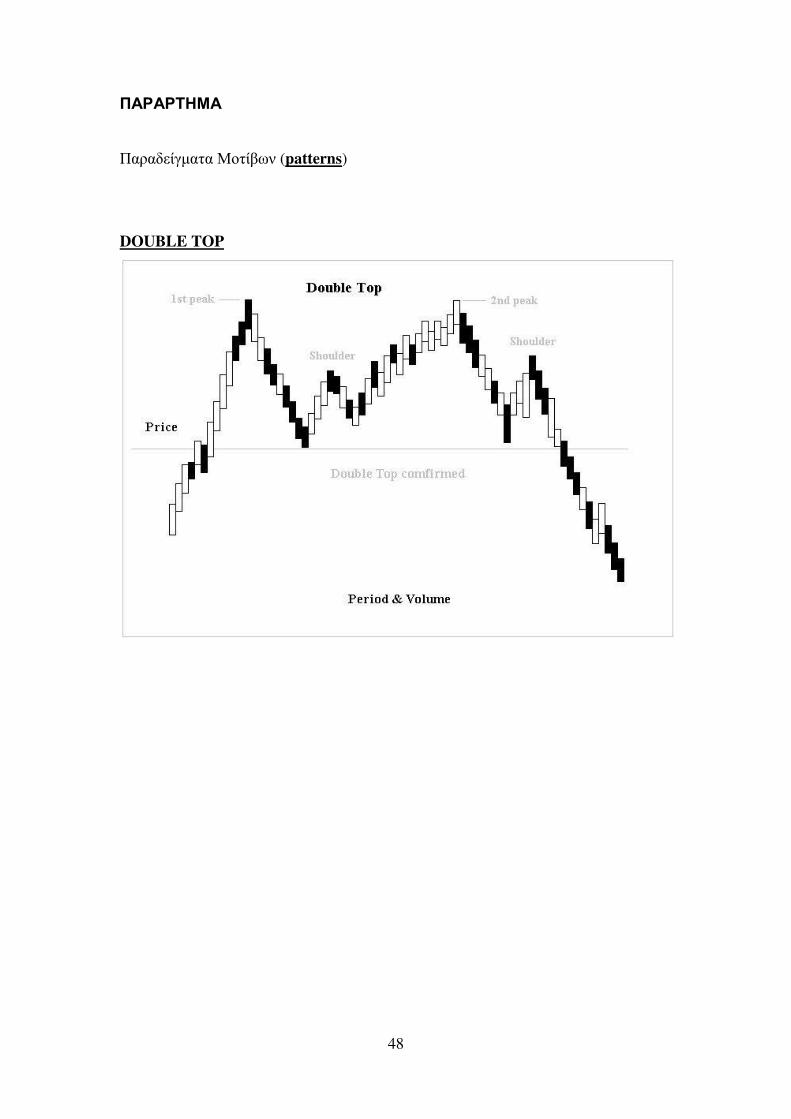
Π Ρ ΡΣΗΜ
Παλα έΰηα α Μκ έίπθ (patterns)
DOUBLE TOP
49
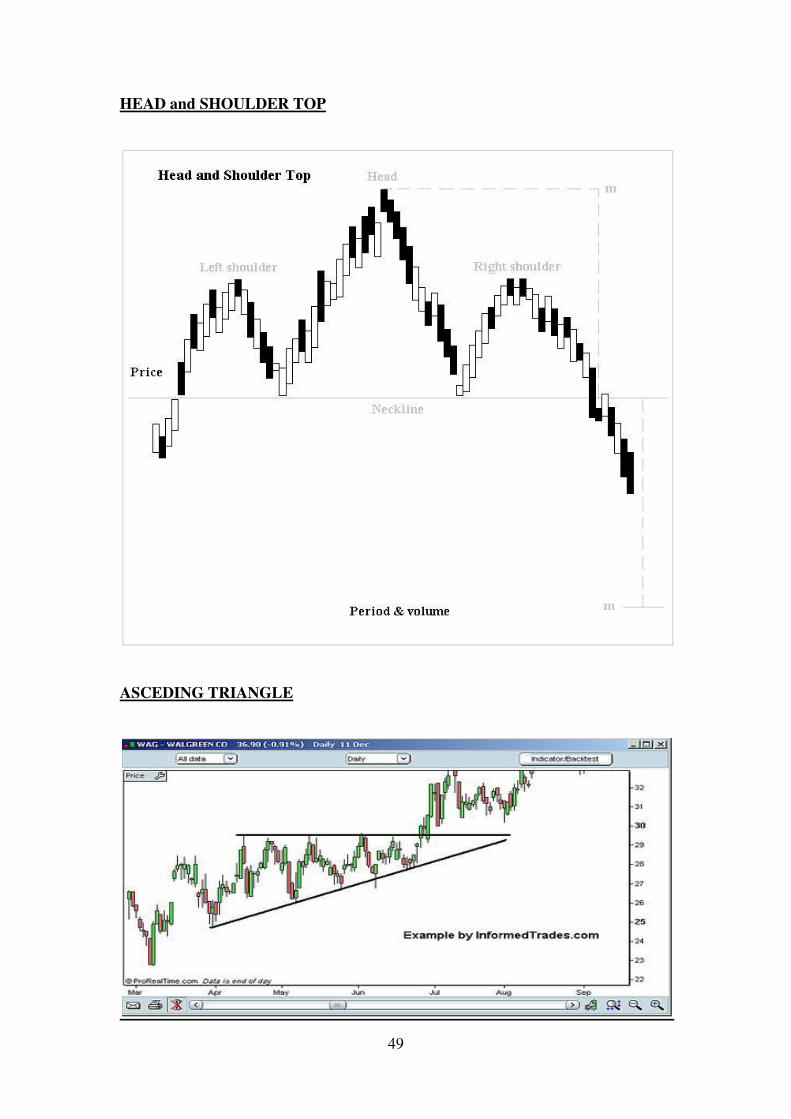
HEAD and SHOULDER TOP
ASCEDING TRIANGLE