![20 04 understanding-sound-experiences epos-report 2020[1]bruit.fr/images/2020/understanding-sound-experiences_epos... · more commonplace and necessary facet of our working lives.](https://static.fdocument.org/doc/165x107/5f90b87b92998726593d06e6/20-04-understanding-sound-experiences-epos-report-20201bruitfrimages2020understanding-sound-experiencesepos.jpg)
WORKING PAPER SERIES 01 2020 · 2020-06-03 · WORKING PAPER SERIES 01‐2020 Πατησίων 76,...
50
WORKING PAPER SERIES 01‐2020 Πατησίων 76, 104 34 Αθήνα.Tηλ.: 210 8203303‐5 / Fax: 210 8203499 76, Patission Street, Athens 104 34, Greece. Tel.: (+30) 210 8203303‐5 / Fax: (+30) 210 8203499 E‐mail: [email protected] / www.aueb.gr “Incubated early stage startuppers and their initiatives in Athens during the Crisis (2010‐2016)” by Ioannis Besis and Ioanna Sapfo Pepelasis
Transcript of WORKING PAPER SERIES 01 2020 · 2020-06-03 · WORKING PAPER SERIES 01‐2020 Πατησίων 76,...
WORKING PAPER SERIES 01‐2020
Πατησίων 76, 104 34 Αθήνα. Tηλ.: 210 8203303‐5 / Fax: 210 8203499 76, Patission Street, Athens 104 34, Greece.
Tel.: (+30) 210 8203303‐5 / Fax: (+30) 210 8203499 E‐mail: [email protected] / www.aueb.gr
“Incubated early stage startuppers and their initiatives in Athens during the Crisis (2010‐2016)”
by
Ioannis Besis and Ioanna Sapfo Pepelasis
2
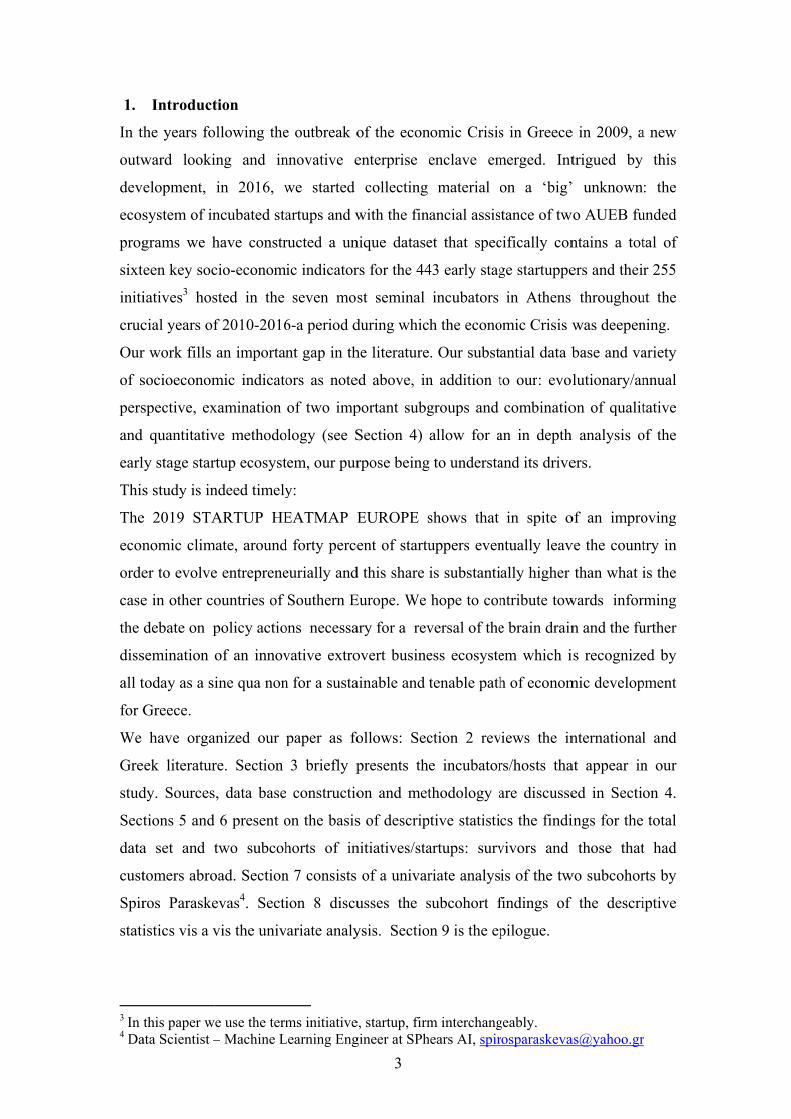
Incubated early stage startuppers and their initiatives in Athens during the Crisis (2010-2016)
Ioannis Besis1 and Ioanna Sapfo Pepelasis2
Abstract This paper is based on a unique dataset that contains sixteen key socio-economic indicators for 443 early stage startuppers and their 255 incubated early stage initiatives/startups in Athens throughout the crucial years of 2010-2016-a period during which the Greek economic crisis was deepening. It maps the key features of this nascent ecosystem and its drivers. This ecosystem was flexible and responded to changing conditions over this seven year period. Incubated startuppers were on the whole young, well educated, cosmopolitan and well rounded (had diversity in skills). As for incubated startups they consisted largely of advanced business activities/processes, b2c was important but b2b was also quite widespread and a little over one in ten was based abroad. Finally, in accordance to the international literature and wider policy expectations regarding the startup ecosystem at the moment in Greece, this paper examines the special features of two subcohorts of initiatives: ‘survivors’ and ‘those that had customers abroad’. Keywords: demography, entrepreneurship, startuppers, early stage initiatives, socio-economic indicators, drivers of success, incubators, Economic Crisis, Athens. JEL Classification: Y10, M13, L26, 052, 033, L29
Acknowledgements: This discussion paper has been funded by the ‘History of Entrepreneurship and Institutions Program’ at the Department of Economics of the Athens University of Economics and Business (AUEB) and the AUEB ‘Program for the Support of Innovative Publications’. We thank the Data Scientist Spiros Paraskevas for his analysis (Section 7). We also thank Dr. Angeliki Karagiannaki for her advice and support. We thank Mara Vidali and Ilias Arvanitakis for valuable research assistance. Moreover, we would like to thank the organizers and participants of the following seminars in which early findings have been presented: ‘A break with the past? The internationalization of Greek Business’ (Ioanna Sapfo Pepelasis with Aimilia Protogerou and Ioannis Besis), University of Turin, Department of Economics and Statistics, 9 May 2018; ‘The Birth of a new Greek entrepreneurial model: An evolutionary Approach’ (Ioanna Sapfo Pepelasis), University of Washington Summer School, Harvard Center of Hellenic Studies at Nafplion, August 2018.
1 Athens Exchange Group, Greece, [email protected] 2 Athens University of Economics and Business, Greece, [email protected]
1.
In th
outw
dev
ecos
prog
sixt
initi
cruc
Our
of s
pers
and
earl
This
The
econ
orde
case
the
diss
all t
for G
We
Gre
stud
Sect
data
cust
Spir
stati
3 In 4 Da
Introduct
he years fo
ward looki
elopment,
system of in
grams we h
een key soc
iatives3 hos
cial years of
r work fills
socioeconom
spective, ex
quantitativ
ly stage star
s study is in
e 2019 STA
nomic clim
er to evolve
e in other co
debate on p
semination
today as a s
Greece.
have orga
eek literatur
dy. Sources
tions 5 and
a set and t
tomers abro
ros Paraske
istics vis a v
this paper w
ata Scientist –
tion
ollowing the
ing and in
in 2016, w
ncubated sta
have constr
cio-econom
sted in the
f 2010-2016
an importan
mic indicato
xamination
ve methodo
rtup ecosyst
ndeed timely
ARTUP HE
mate, around
e entreprene
ountries of
policy actio
of an innov
ine qua non
anized our
re. Section
s, data base
d 6 present o
two subcoh
oad. Section
evas4. Secti
vis the univ
we use the term
– Machine L
e outbreak o
nnovative e
we started
artups and w
ructed a un
ic indicator
seven mos
6-a period d
nt gap in th
ors as note
of two imp
ology (see S
tem, our pur
y:
EATMAP E
d forty perce
eurially and
Southern E
ons necessa
vative extro
n for a susta
paper as fo
3 briefly p
e constructio
on the basis
horts of in
n 7 consists
ion 8 discu
variate analy
ms initiative
Learning Eng
3
of the econ
enterprise e
collecting
with the fin
nique datase
rs for the 44
st seminal
during whic
he literature
ed above, in
portant subg
Section 4)
rpose being
EUROPE s
ent of startu
d this share
Europe. We
ary for a rev
overt busine
ainable and
ollows: Sec
presents th
on and met
s of descrip
nitiatives/sta
of a univar
usses the s
ysis. Sectio
e, startup, firmgineer at SPh
nomic Crisis
enclave em
material o
ancial assis
et that spec
43 early stag
incubators
h the econo
. Our subst
n addition t
groups and
allow for a
g to understa
shows that
uppers even
is substanti
hope to con
versal of the
ess ecosyste
tenable path
ction 2 rev
e incubator
thodology a
ptive statisti
artups: surv
riate analys
subcohort f
on 9 is the ep
m interchanghears AI, spir
s in Greece
merged. Int
on a ‘big’
tance of tw
cifically con
ge startuppe
in Athens
omic Crisis w
antial data b
to our: evol
combinatio
an in depth
and its drive
in spite o
ntually leav
ally higher
ntribute tow
e brain drain
em which i
h of econom
views the in
rs/hosts tha
are discusse
cs the findi
vivors and
is of the tw
findings of
pilogue.
geably. rosparaskeva
e in 2009, a
trigued by
’ unknown
wo AUEB fu
ntains a tot
ers and their
throughou
was deepen
base and va
lutionary/an
on of qualit
h analysis o
ers.
of an impro
ve the count
than what i
wards infor
n and the fu
is recognize
mic develop
nternational
at appear in
ed in Sectio
ings for the
those that
wo subcohor
f the descri
a new
this
: the
unded
tal of
r 255
ut the
ning.
ariety
nnual
tative
of the
oving
try in
is the
rming
urther
ed by
pment
l and
n our
on 4.
total
t had
rts by
iptive
r
2.
2.1.
As m
incu
of t
Rib
wel
data
the
The
exam
Som
Bern
and
the
neg
corr
exp
com
Cef
surv
firm
long
al. (
thei
to b
Oth
For
Ger
The
an i
(201
imp
busi
Literature
.Internation
mentioned
ubators as o
the interna
eiro-Sorian
l-researched
a base and t
literature on
ere are plen
mple, Torte
me studies i
nhardt (200
bank loans
United Stat
ative correl
relation bet
lore Italian
mpanies wit
fis and Mars
vival of firm
ms’ survival
g term, they
(2012) exam
ir findings r
be no better
her studies d
example, C
rmany and
eir findings
internationa
15) analyze
portance. Th
iness envir
e Review
nal Literat
above our d
organization
ational liter
no (2016)).
d topic in t
the selection
n Greece (s
nty studies l
ella & Quir
in particular
03) examine
s. They have
tes and inve
lation betwe
tween havin
n firms that
th strong ca
sili (2003) u
ms in Neth
l and young
y benefit m
mine the su
revealed “th
than the od
discuss start
Coeurderoy
investigate
indicate th
alization str
e the “born
his study li
onment. It
ure
data base e
ns and how
rature (indi
As for earl
the rich and
n of indicato
ee below).
linking entr
roga (eds) (
r have focu
es the relati
e collected
estigate their
een having
ng a non-ba
t were estab
apitalization
use a non-p
erlands. Th
g firms are m
ost of innov
urvival patte
he odds of a
dds of them
ups in relati
et al. (2012
the determ
at young fir
rategy based
n global” p
inks the ris
also under
4
exclusively
they impac
catively se
ly stage sta
d disparate
tors we have
repreneursh
(2013) and
used on wha
ion between
a sample of
r survival in
a bank loan
ank loan an
blished from
n have high
parametric a
hey suggest
most expos
vation to su
erns of new
a firm surviv
surviving fr
ion to intern
2) construc
minants of i
rms are mo
d on resour
phenomeno
se of “born
rlines that
consists of
cted startups
ee: Mian (
rtuppers an
literature. F
e selectively
hip/startups
Cassis & P
at drives su
n the surviv
f small busi
n 1991. The
n and busin
nd survival
m 2009 to
h survival r
approach to
that innov
sed to the ri
urvive in th
w firms for
ving from y
from incepti
nationalizat
ct a dataset
internationa
ore likely to
rce consoli
on of early
n globals” t
technologic
incubees. T
s has attract
1996); Alb
nd their init
For the orga
y consulted
to economi
Pepelasis M
uccess/ surv
val of new s
inesses laun
ey have foun
ness surviva
. Nicolò an
2011 and
rates at a f
estimate th
vation affect
isk of exit. H
e market. F
the period
year one to
on to year o
tion:
for young f
alization an
o survive w
dation. Cav
y stage com
o the conte
cal develop
The functio
ted the atte
bort-Morant
tiatives, this
ganization o
d this as w
ic growth a
Minoglou (2
vival: Asteb
small busin
nched in 19
nd that ther
al, but a pos
nd Nania (2
they found
five-year pe
he probabili
ts positively
However, i
Finally, Co
d 2009-2011
year two ap
one”.
firms in UK
nd firm surv
when they pu
vusgil & K
mpanies an
emporary g
pment may
ns of
ntion
t and
s is a
of our
ell as
as for
006).
bro &
nesses
87 in
re is a
sitive
2017)
d that
eriod.
ity of
y the
in the
ok et
1 and
ppear
K and
vival.
ursue
Knight
nd its
global
be a
5
catalyst for further enhancement in the internalization process of young firms. Finally,
Burgel & Murray (2000) analyzed 398 export decisions taken from a UK survey of
246 technology based startups with international activities in order to determine the
modes of foreign market entry and which the reasons for their choices are.
2.2.Literature on Greece
Turning to the existing literature on the new local startup ecosystem in Greece, it is
divided in two interrelated strands. The first strand focuses on incubators and
technology parks as organizations and the second strand examines startuppers and/or
their initiatives. This strand is only indirectly linked to our topic, the following
academic research has been undertaken: Bakouros, Mardas & Varsakelis, (2002) and
Sofouli and Vonortas (2007) provide a history of the genesis and development of
science & technology parks and business incubators prior to the Crisis. Another study,
that of Ratinho and Mitsopoulos (2017), examines five of the emerging incubators in
Greece during the Crisis and their models of support.
Regarding the second strand it focuses on startups. Apart from articles in the local and
international press (See references to some of these in Pepelasis and Protogerou,
2018), research has been conducted by a variety of organizations. Notably, the annual
Global Entrepreneurship Monitor (GEM) surveys on Greece conducted by the
Foundation of Economic and Industrial Research provide demographic data on early
stage entrepreneurs, qualitative data on their initiatives and the national entrepreneurial
environment. The seed stage fund MARATHON VC (www. Marathon.vc) has referred
to investments in Greek Startups for the period of 2010-2016, (Gasteratos, 2017) some
characteristics of founders (2018) (education level, age, work experience, previous
role) and the investments and exits of successful Greek startups (Gasteratos, 2019).
Enterprise Greece (2019), the official agency of the Greek State to promote investment
in Greece, has written on the startup ecosystem by providing data about the most
funded Greek Startups and Exits, as well as the importance of the new available
funding tools that use Equifund (Public-Private Partnership created through European
and national funds) to help the Greek Startups grow. In addition, the technology hub
Found.ation and the European digital innovation and entrepreneurial education
organization EIT Digital (2019) examined the characteristics of pre-seed and seed
stage Greek startups (those startups that either maintain the headquarters in Greece or
one of its founder is a Greek citizen) while also providing a general view on the
6
incubation ecosystem of startups. Furthermore, the well-known consulting firm BCG
(Athens Office) published a paper (2018) examining the obstacles to boost local
entrepreneurship.
As for academic research it has focused on other issues, not strictly or exclusively
connected to startups such as for example the rise of creative industries (Protogerou et
al., 2015) and the new entrepreneurship model (Pepelasis and Protogerou,2018). There
is an obvious gap in the academic literature in studying exclusively the startup
ecosystem during the Crisis years. However, we should note the following studies
which are of some interest: An unpublished empirical survey at the Laboratory of
Industrial and Energy Economics at NTUA (Lambropoulos, 2015) charts in a power
point the features of 77 startups from 2010 to 2015 based on a questionnaire sent to the
founders with purpose to analyze the characteristics of startups and incubators and to
propose actions to improve the services of the existing incubators. In addition, there
are also four articles that focus on startups for the pre-Crisis period: The structured
survey article of Kanellos (2013) that has examined knowledge based entrepreneurship
in high technology young firms between 2000 and 2010; Vlachos (2016) which
examines the determinants of self-employment/creating start-ups from an occupational
choice point of view, means entering into self-employment for 2001-2008 analyzed on
the basis of a logit model; and lastly, the article of Vliamos & Tzeremes, (2011) that
examines through nonparametric techniques, the factors influencing the
entrepreneurial process, entrepreneurial characteristics and motives in new business
formation in central Greece (the region of Thessaly) on the basis of 164 questionnaires
for the pre-crisis period. Vlachopoulou, Ziakis and Petridis examined some of the
characteristics of Greek Startups, their success factors and their interaction with the
startup ecosystem in Greece. We have constructed a detailed table (see Appendix 4) in
which all the studies that concerned Greek Startups are presented in terms of their
database, time period covered, basic questions and overlapping points with our work.
Finally, indirectly connected to the theme of startups is the study of Apergis and
Fafaliou (2014) who collected data from 1,500 students from 2005 to 2010 in order to
examine the factors that influence Greek University students to shift into establishing a
new business venture.
In a nutshell, there is an interesting and diverse international literature on
entrepreneurship and startups, but for the case of Greece there are important gaps in
kno
the
3.
As
prov
ecos
attem
busi
200
Dur
of a
inst
incu
in A
brie
from
them
owledge on
introduction
The Select
we exclusi
vide some
system that
mpts of the
iness throug
07 and Bako
ring the per
a total of fif
itutional se
ubators for
Athens, not
ef descriptio
m their web
m in alphab
Acein (
major s
EGG (e
Greece)
Ekinisi
Enterpr
only in
and Vo
Iqbility
it provi
MIT E
Enterpr
professi
transfor
changin
the subject.
n.
ted Incuba
ively exami
background
t has emer
e state from
gh the creat
ouros, Mard
iod under re
fteen incub
etting/embed
our sample
sector base
on of each o
bsites. They
etical order
(est. 2014)
trategic goa
est.2013) is
) that also a
Lab (est.
rises and it d
Athens but
los in Thess
y (est. 2013)
des pre seed
Enterprise F
rise Forum
ionals with
rming ideas
ng companie
. We aim to
tors
ine incubat
d informati
rged in Gr
the 1990s o
tion of scie
das, & Varsa
eview the A
ators and th
ddedness a
satisfied th
ed and wer
of these incu
y were all
r.
is based at
al is the tran
the incuba
acts as an ac
2014) is
differs from
t also in two
saly.
) belongs to
d financing
Forum Gree
m founded
h strong en
s of the loc
es”.
7
o fill part of
ted startupp
ion on this
reece durin
onwards to
ence and tec
akelis, 2002
Athenian bu
here was di
and their pr
he following
re exclusive
ubators foll
established
t AUEB the
nsfer of tech
ator of Euro
ccelerator th
the incub
m the other i
o other prom
o the IT bas
via equity f
ece (est. 20
“by a gr
ngineering
cal scientifi
f this gap w
pers/initiativ
form of o
ng the crisi
support sta
chnology p
2).
usiness incu
iversity amo
rimary emp
g three crite
ely focused
ows on the
d between 2
e largest Gr
hnology from
obank (one
hat provides
bator of th
incubators i
minent port
ed business
funding.
013), is a c
roup of en
backgroun
ic/engineeri
with our ana
ves it is im
rganization
s was prec
artups and k
arks (Sofou
ubation ecos
ong them in
phasis. The
eria: they w
on early s
basis of inf
2010 and 20
reek busine
m academia
of the four
s equity fund
he Hellenic
in that it ha
t cities: He
s group Que
chapter of
ntrepreneurs
nds. It focu
ng commun
alysis as not
mportant tha
n. The incu
ceded by f
knowledge b
uli and Von
system cons
n terms of
e seven sel
were all situ
stage startup
formation d
014 and w
ess school a
a to busines
r largest ban
ding to start
c Federatio
as a presenc
eraklion in C
est Holding
the global
s and bus
uses on ra
nity into w
ted in
at we
ubator
failed
based
nortas
sisted
their,
ected
uated
ps. A
drawn
e list
and a
ss.
nk in
tups.
on of
ce not
Crete
s and
MIT
siness
apidly
world-
Am
Iqbi
The
and
Eith
base
VCs
avai
The
ID-G
(200
4.
4.1.
It i
indi
sam
in A
In a
follo
and
gath
cave
entr
are
NBG B
country
are “inn
Orange
Netherl
offering
mong these s
ility had the
ere were als
their initiat
her because
ed and/or w
s, Accelerat
ilable in the
ese organiza
GC (2013);
08); The At
Sources, D
.Sources
s not poss
icators of st
mple we reso
Athens that f
addition, in
owing sour
articles/int
hered some
eat is nece
repreneursh
aspiring ent
Business See
y’s oldest an
novative and
Grove (est
lands in At
g support to
seven incub
e lowest num
so eight oth
tives but we
e they were
were difficu
tors, Co-wo
eir website;
ations are: C
; Invent ICT
thens Startu
Data base C
ible to gau
tartuppers a
orted to the
focused on
n order to e
ces: the we
terviews in
e informatio
essary here
ip entails a
trepreneurs
eds (est.201
nd largest b
d export-ori
t.2013) is an
thens and i
o innovative
bators, Egg
mber.
her organiza
e do not inc
e smaller th
ult to catego
orking space
and/or they
Corallia (20
T (2016); I
up Business
Constructio
uge through
nd their init
websites of
providing s
enrich our
b sites of st
n the press
on from qu
e: The exa
hidden bia
who are pe
8
10) is based
bank) and i
iented” whi
n initiative
it describes
e entreprene
had hosted
ations in A
clude them i
han those w
orize as the
es etc.); and
y focused on
005) and Me
Innovathens
Incubator (
on and Met
h national
tial stage ve
f the seven
services to e
information
tart-ups; soc
on start-u
uestionnaire
amination
as in our res
erhaps best i
d at the Nat
it fosters ne
ile also prov
of the Emb
s itself as “
eurs around
d the largest
Athens at the
in our samp
we selected
ey came un
d/or the nam
n medium s
etavallon (2
s (2014); M
(TH.E.A) (2
thodology
statistics th
entures. Thu
seminal at t
early stage s
n on incub
cial media s
ppers and
es sent to s
here of on
sults as thos
informed an
tional Bank
ew business
viding finan
assy of the
“an internat
Greece”.
t number of
e time assis
ple for a num
d; and/or th
nder several
mes of the s
tage start-up
2011); Aeph
Microsoft Inn
2014).
he demogr
us, in order
the time inc
startuppers.
bees we als
sites (Linke
their enterp
startuppers-
nly early s
se who seek
nd educated
k of Greece
s initiatives
ncial suppor
Kingdom o
ational incu
f startups, w
sting startup
mber of rea
hey were se
al umbrellas
startups wer
ups.
horia.net (2
nnovation C
raphics and
to construc
cubators situ
so consulted
edIn, Faceb
prises. We
‘incubees’.
stage incub
k out incub
d.
, (the
s that
rt.
of the
ubator
while
ppers
asons:
ector-
s (eg.
re not
013);
Center
d key
ct our
uated
d the
ook);
also
One
bated
bation
9
4.2.Database Construction and Methodology
As already mentioned above, our methodology is that of descriptive statistics analysis;
our ultimate purpose being to understand the main features and drivers of success of
early stage startup(er)s in the Greek incubation ecosystem.
There were certain difficulties regarding the construction of the sample. Notably, a
feature of the incubated early stage startup ecosystem is that often one initiative would
receive incubation from more than one incubator (i.e. two or more rarely three
incubators). For this reason, in such cases in order to avoid double counting we took
into consideration only the first incubator ‘visited’ (This was around 20% of our
sample of incubated enterprises).
At one stage an attempt was made with two colleagues to add a probit model to our
statistical survey in order to grasp quantitatively survival (See Poster, Pepelasis, Besis,
Bournakis and Papanastassiou, 2019). By definition modeling has some constraints
given the qualitative nature of the indicators and at this time until we collect more data
(see Epilogue) we refocus on our initial direction of analysis, namely that of a
statistical survey (Sections 5 and 6). However, for the two startup subcohorts we have
selected at this stage (survival and customers abroad, see below in this Section) in
addition to descriptive statistics we also include a filter based selection method
(univariate analysis) by Spiros Paraskevas (Section 7).
Our data base consists of 443 individual entrepreneurs and their first stage 255
incubated young enterprises (nascent ventures) and we examine in total sixteen socio-
economic indicators. These indicators are divided in two groups:
The first group consists of seven startupper/founder specific indicators:
1. Age
2. Gender
3. Level of education
4. Field(s) of education
5. Variety in skills: Whether the there was a diversity between the founders
graduate and post graduate degrees
6. Whether the company sector is related to the founder’s education
7. Whether the founder has experience abroad. (By experience abroad we mean
that the founder has worked abroad for at least one year).
The second group consists of nine startup/firm specific indicators:
10
1. Geographical Location
2. Business Sector
3. High Tech vs Low Tech in terms of Sector (High Tech companies we measure
those which are in the categories of software, hardware, robotics, Internet of
Things (IoT), analytics, Augmented Reality, biotechnology, gamification,
fintech and energy and as low tech: agriculture, agro food, architecture,
education, fashion, art, event services, music, culture, leisure travel and
tourism, maritime, fishing, sports and HR)
4. High Tech vs Low Tech in terms of process of production (As high tech in
terms of process we measure those companies which are either high tech or
low tech but with an advanced production method).
5. Whether the good offered is a Physical Product or Service
6. Whether the good offered is b2c or b2b
7. Whether the startup has customers abroad
8. Number of founders per startup
9. Whether among the founders there exist relatives. Founders who belong in this
category have been detected either because this is obvious (as they have the
same last name) or because although they have different last names, it has been
stated so in interviews or articles.
For each of the aforementioned sixteen socioeconomic indicators we present our
findings both statically (for the period as a whole, 2010-2016) and whenever possible,
given data constraints dynamically (per annum), i.e on the basis of the year of date of
origin of a project /startup (and not the year of its legal formation).
In order to enrich our analysis, we also embrace the focus of the international literature
on two key areas: the drivers of business success and internationalization. For this
reason we have also created two cohorts/ subsamples of the total population of the
sample.
The first cohort consists of the population of survivors: Namely, those startups that
were still in existence in 2018 and we compare the findings for the sixteen socio-
economic indicators of this survivor cohort with the findings for the total population of
our sample (See Section 7 below). This allows for a ‘first understanding’ of the drivers
of business success in the early stage startup ecosystem during the Crisis given our
data constraints. The conventional way of measuring business success is through a
variety of metrics in economic performance: sales/turnover, total assets, number of
emp
poss
The
abro
as a
5.
5.1.
The
Num
colu
5 Fo
ployees etc.
sible and so
e second sub
oad. This is
an indicator
Descriptiv
sample
.Basic demo
e key demog
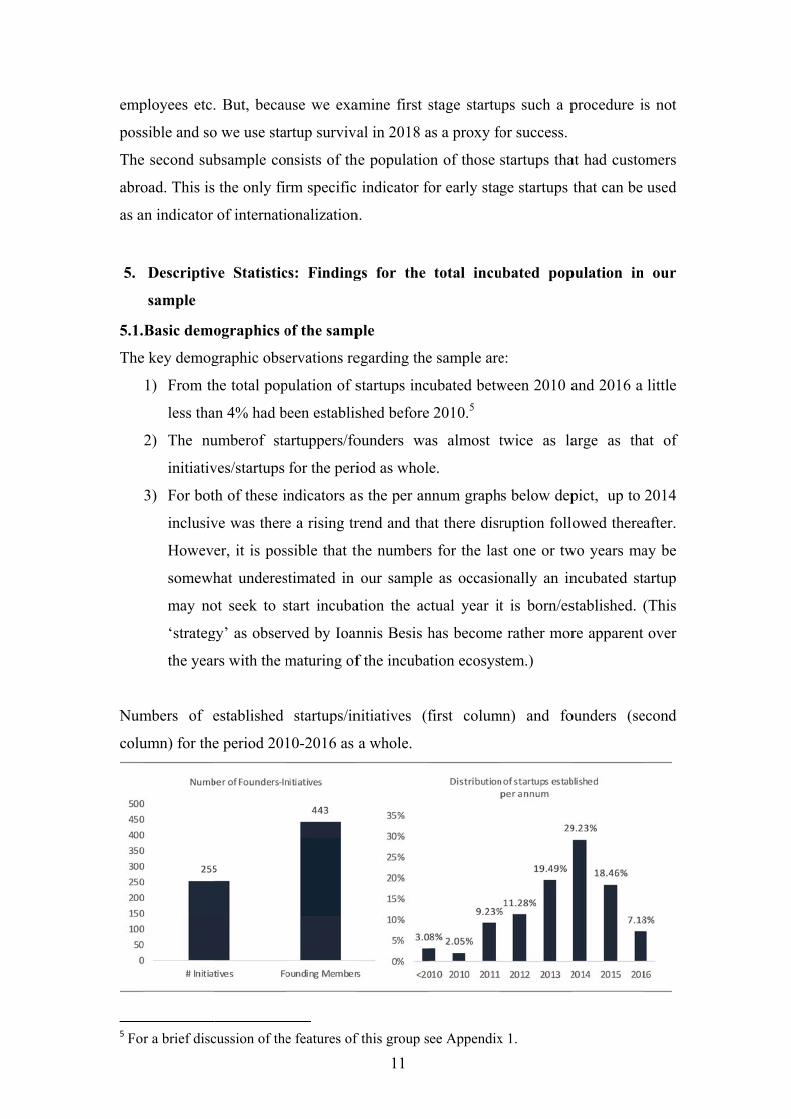
1) From th
less tha
2) The nu
initiativ
3) For bot
inclusiv
Howeve
somewh
may no
‘strateg
the year
mbers of e
umn) for the
r a brief disc
. But, becau
o we use sta
bsample co
the only fir
of internati
ve Statistic
ographics o
graphic obse
he total pop
an 4% had b
umberof sta
ves/startups
th of these i
ve was there
er, it is pos
hat underes
ot seek to s
gy’ as obser
rs with the m
established
e period 201
cussion of the
use we exa
artup surviva
nsists of th
rm specific
ionalization
cs: Finding
of the samp
ervations re
pulation of s
been establis
artuppers/fo
for the peri
indicators as
e a rising tr
ssible that th
stimated in
start incuba
rved by Ioan
maturing of
startups/in
10-2016 as
e features of
11
amine first s
al in 2018 a
he populatio
indicator fo
n.
gs for the
ple
egarding the
startups inc
shed before
ounders wa
iod as whol
s the per an
rend and tha
he numbers
our sample
ation the ac
nnis Besis h
f the incuba
nitiatives (f
a whole.
f this group s
stage startu
as a proxy fo
on of those
for early stag
total incu
e sample are
ubated betw
2010.5
as almost t
e.
nnum graph
at there disr
s for the las
e as occasio
ctual year it
has become
ation ecosys
first colum
ee Appendix
ups such a p
or success.
startups tha
ge startups
ubated pop
e:
ween 2010 a
twice as la
s below dep
ruption follo
st one or tw
onally an in
t is born/es
e rather mor
tem.)
mn) and fo
x 1.
procedure i
at had custo
that can be
pulation in
and 2016 a
arge as tha
pict, up to
owed there
wo years ma
ncubated st
stablished.
re apparent
ounders (se
is not
omers
used
n our
little
at of
2014
after.
ay be
tartup
(This
over
econd
12
5.2.Socio Economic Indicators
5.2.1. Founder specific indicators
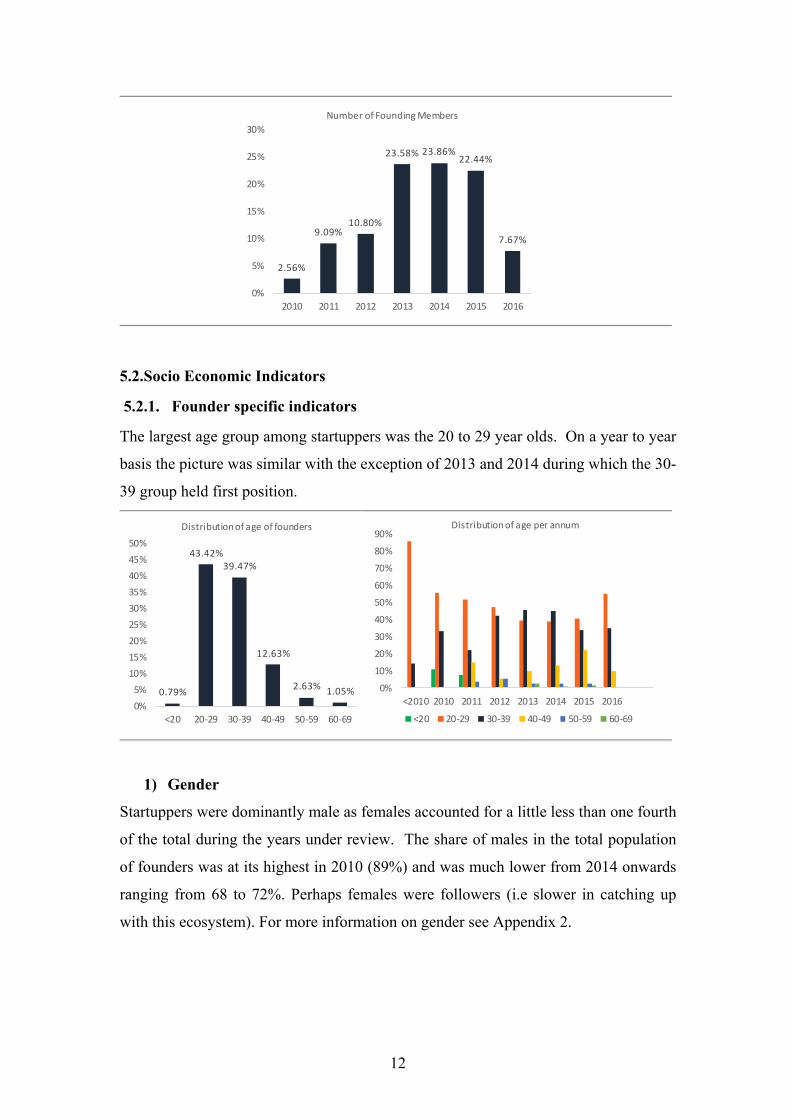
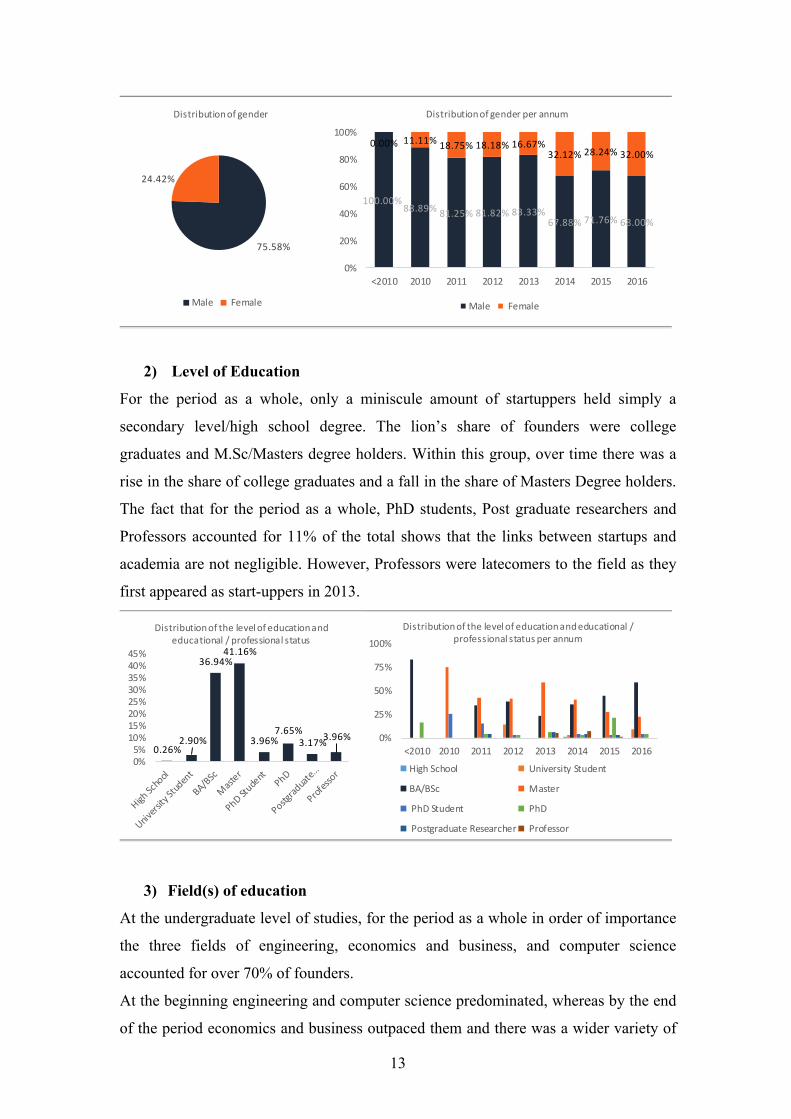
The largest age group among startuppers was the 20 to 29 year olds. On a year to year
basis the picture was similar with the exception of 2013 and 2014 during which the 30-
39 group held first position.
1) Gender
Startuppers were dominantly male as females accounted for a little less than one fourth
of the total during the years under review. The share of males in the total population
of founders was at its highest in 2010 (89%) and was much lower from 2014 onwards
ranging from 68 to 72%. Perhaps females were followers (i.e slower in catching up
with this ecosystem). For more information on gender see Appendix 2.
2.56%
9.09%10.80%
23.58% 23.86%22.44%
7.67%
0%
5%
10%
15%
20%
25%
30%
2010 2011 2012 2013 2014 2015 2016
Number of Founding Members
0.79%
43.42%39.47%
12.63%
2.63% 1.05%
0%
5%
10%
15%
20%
25%
30%
35%
40%
45%
50%
<20 20‐29 30‐39 40‐49 50‐59 60‐69
Distribution of age of founders
0%
10%
20%
30%
40%
50%
60%
70%
80%
90%
<2010 2010 2011 2012 2013 2014 2015 2016
Distribution of age per annum
<20 20‐29 30‐39 40‐49 50‐59 60‐69
13
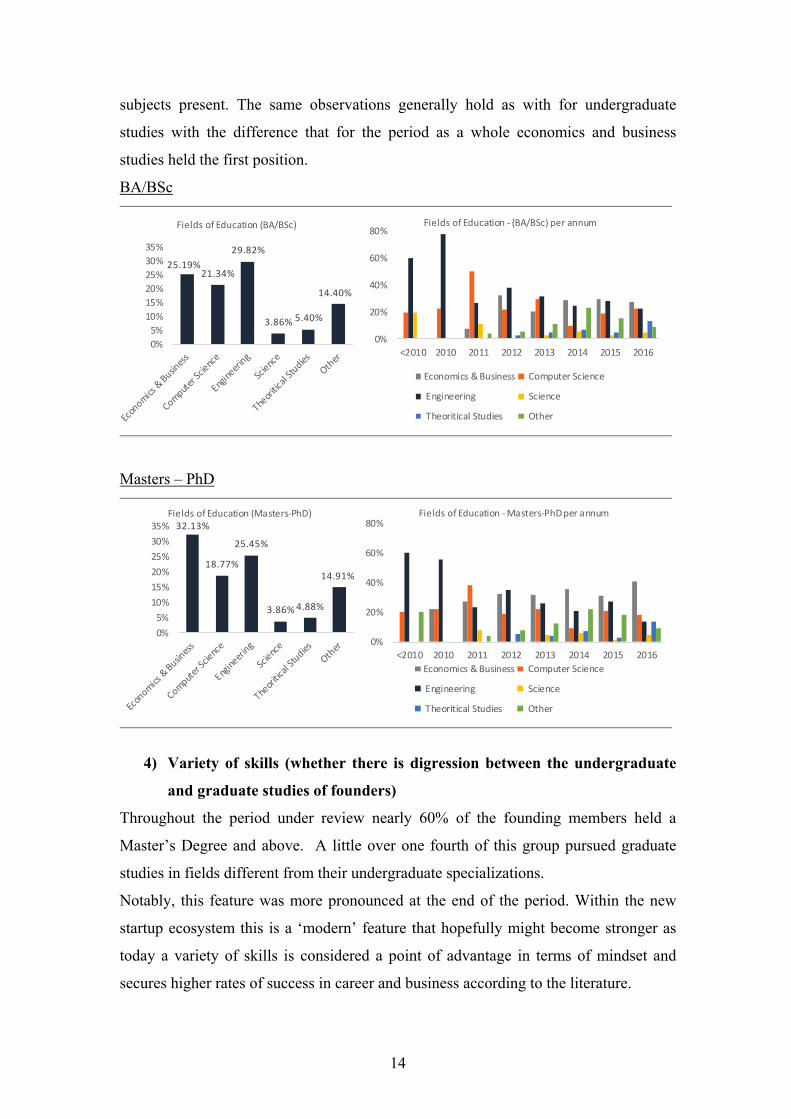
2) Level of Education
For the period as a whole, only a miniscule amount of startuppers held simply a
secondary level/high school degree. The lion’s share of founders were college
graduates and M.Sc/Masters degree holders. Within this group, over time there was a
rise in the share of college graduates and a fall in the share of Masters Degree holders.
The fact that for the period as a whole, PhD students, Post graduate researchers and
Professors accounted for 11% of the total shows that the links between startups and
academia are not negligible. However, Professors were latecomers to the field as they
first appeared as start-uppers in 2013.
3) Field(s) of education
At the undergraduate level of studies, for the period as a whole in order of importance
the three fields of engineering, economics and business, and computer science
accounted for over 70% of founders.
At the beginning engineering and computer science predominated, whereas by the end
of the period economics and business outpaced them and there was a wider variety of
75.58%
24.42%
Distribution of gender
Male Female
100.00%88.89% 81.25% 81.82% 83.33%
67.88% 71.76% 68.00%
0.00% 11.11% 18.75% 18.18% 16.67%32.12% 28.24% 32.00%
0%
20%
40%
60%
80%
100%
<2010 2010 2011 2012 2013 2014 2015 2016
Distribution of gender per annum
Male Female
0.26%2.90%
36.94%41.16%
3.96%7.65%
3.17%3.96%
0%5%10%15%20%25%30%35%40%45%
Distribution of the level of education and educational / professional status
0%
25%
50%
75%
100%
<2010 2010 2011 2012 2013 2014 2015 2016
Distribution of the level of education and educational / professional status per annum
High School University Student
BA/BSc Master
PhD Student PhD
Postgraduate Researcher Professor
14
subjects present. The same observations generally hold as with for undergraduate
studies with the difference that for the period as a whole economics and business
studies held the first position.
BA/BSc
Masters – PhD
4) Variety of skills (whether there is digression between the undergraduate
and graduate studies of founders)
Throughout the period under review nearly 60% of the founding members held a
Master’s Degree and above. A little over one fourth of this group pursued graduate
studies in fields different from their undergraduate specializations.
Notably, this feature was more pronounced at the end of the period. Within the new
startup ecosystem this is a ‘modern’ feature that hopefully might become stronger as
today a variety of skills is considered a point of advantage in terms of mindset and
secures higher rates of success in career and business according to the literature.
25.19%21.34%
29.82%
3.86% 5.40%
14.40%
0%
5%
10%
15%
20%
25%
30%
35%
Fields of Education (BA/BSc)
0%
20%
40%
60%
80%
<2010 2010 2011 2012 2013 2014 2015 2016
Fields of Education ‐ (BA/BSc) per annum
Economics & Business Computer Science
Engineering Science
Theoritical Studies Other
32.13%
18.77%
25.45%
3.86%4.88%
14.91%
0%
5%
10%
15%
20%
25%
30%
35%Fields of Education (Masters‐PhD)
0%
20%
40%
60%
80%
<2010 2010 2011 2012 2013 2014 2015 2016
Fields of Education ‐Masters‐PhD per annum
Economics & Business Computer Science
Engineering Science
Theoritical Studies Other
15
5) Whether the company/startup sector was related to the founder’s
education
For the period as a whole this was not the case for slightly under half of the founders.
Interestingly, there was growing flexibility/open mindness or perhaps a growing
absence of opportunities in their fields of specialization- as the share of founders
whose education was unrelated to the company sector reached its peak in 2016.
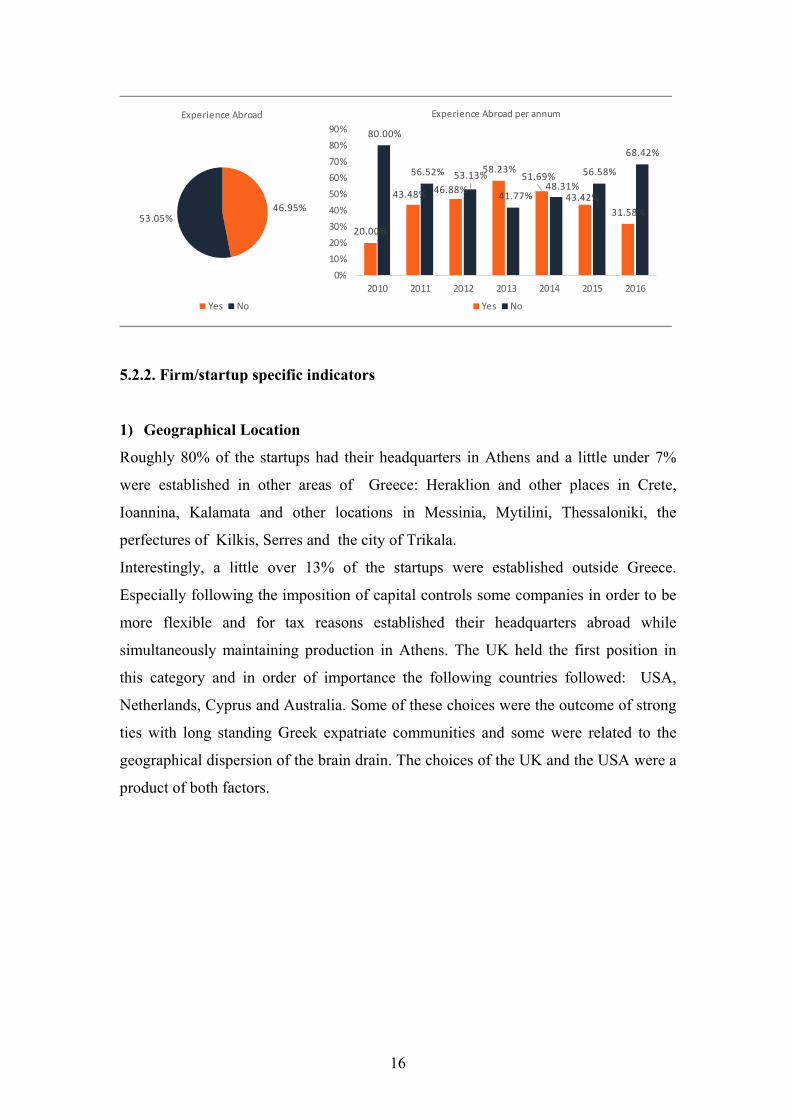
6) Whether the Founder has had Experience Abroad
For the period as a whole about 47% of the founders have had experience abroad.
However, there was a rising trend in this indicator only up to 2014. This suggests that
after that date Greeks living abroad were more reluctant to move to Greece to set up a
startup and/or that startup inclined Greeks living in Greece with experience abroad
shifted away from new enterprising.
26.02%
73.98%
Variety in skills (digression between undergraduate‐
graduate studies)
Yes No
14.29%
40.00%
15.00%
47.54%
27.27%18.75%
50.00%
85.71%
60.00%
85.00%
52.46%
72.73%81.25%
50.00%
0%
20%
40%
60%
80%
100%
2010 2011 2012 2013 2014 2015 2016
Variety in skills per annum
Yes No
50.40%49.60%
Company Sector related to founder's education
Yes No
50.00%64.29%
40.00%
55.26% 53.70% 57.14%
14.29%
50.00%
35.71%
60.00%
44.74% 46.30%42.86%
85.71%
0%
10%
20%
30%
40%
50%
60%
70%
80%
90%
2010 2011 2012 2013 2014 2015 2016
Company Sector related to founder's education per annum
Yes No
16
5.2.2. Firm/startup specific indicators
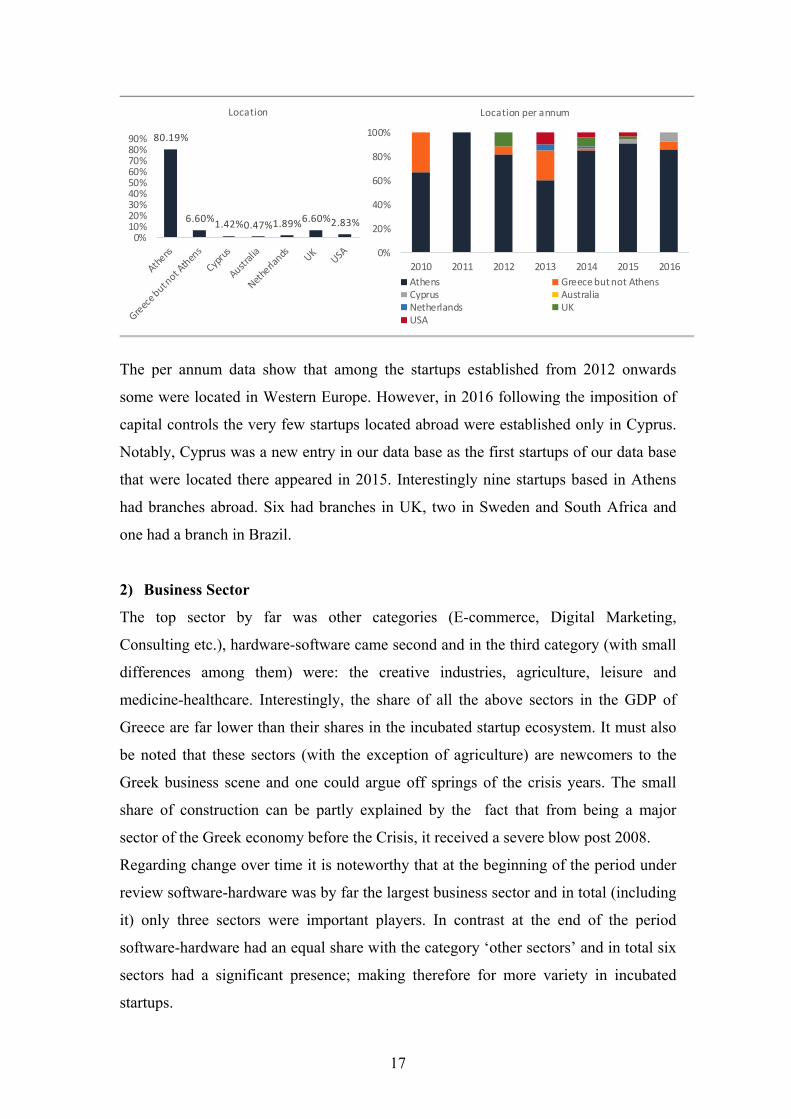
1) Geographical Location
Roughly 80% of the startups had their headquarters in Athens and a little under 7%
were established in other areas of Greece: Heraklion and other places in Crete,
Ioannina, Kalamata and other locations in Messinia, Mytilini, Thessaloniki, the
perfectures of Kilkis, Serres and the city of Trikala.
Interestingly, a little over 13% of the startups were established outside Greece.
Especially following the imposition of capital controls some companies in order to be
more flexible and for tax reasons established their headquarters abroad while
simultaneously maintaining production in Athens. The UK held the first position in
this category and in order of importance the following countries followed: USA,
Netherlands, Cyprus and Australia. Some of these choices were the outcome of strong
ties with long standing Greek expatriate communities and some were related to the
geographical dispersion of the brain drain. The choices of the UK and the USA were a
product of both factors.
46.95%53.05%
Experience Abroad
Yes No
20.00%
43.48% 46.88%
58.23%51.69%
43.42%
31.58%
80.00%
56.52% 53.13%
41.77%48.31%
56.58%
68.42%
0%
10%
20%
30%
40%
50%
60%
70%
80%
90%
2010 2011 2012 2013 2014 2015 2016
Experience Abroad per annum
Yes No
17
The per annum data show that among the startups established from 2012 onwards
some were located in Western Europe. However, in 2016 following the imposition of
capital controls the very few startups located abroad were established only in Cyprus.
Notably, Cyprus was a new entry in our data base as the first startups of our data base
that were located there appeared in 2015. Interestingly nine startups based in Athens
had branches abroad. Six had branches in UK, two in Sweden and South Africa and
one had a branch in Brazil.
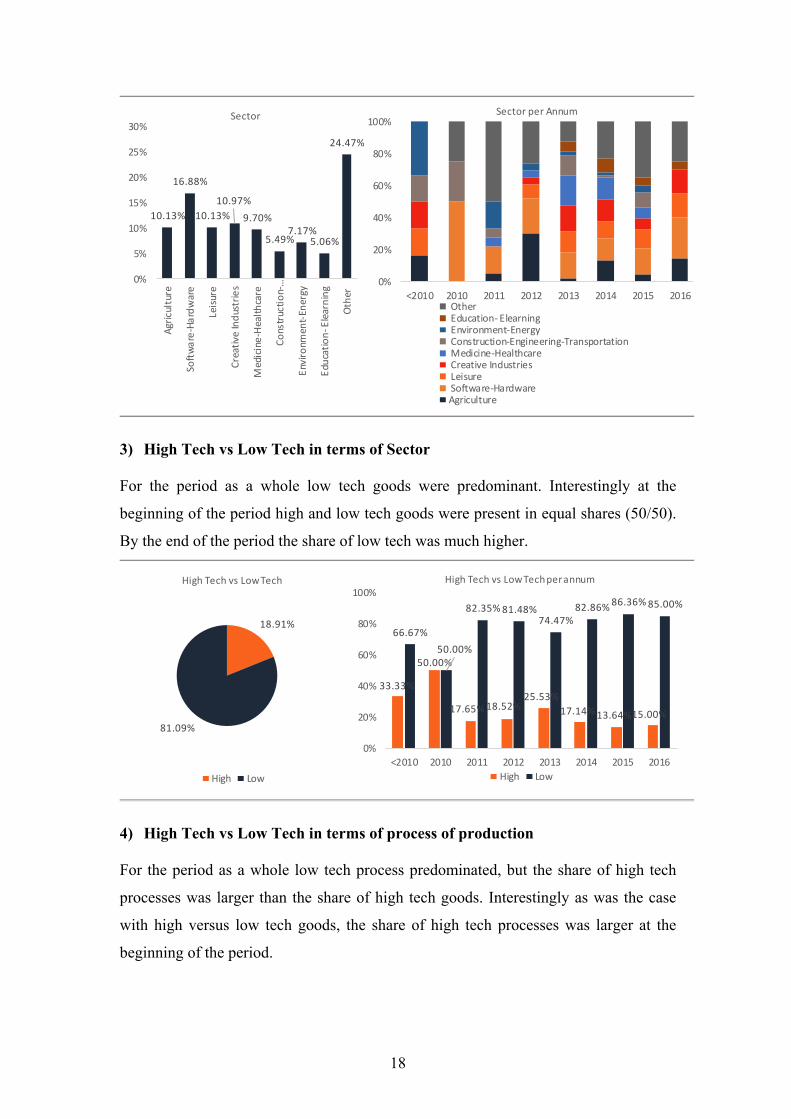
2) Business Sector
The top sector by far was other categories (E-commerce, Digital Marketing,
Consulting etc.), hardware-software came second and in the third category (with small
differences among them) were: the creative industries, agriculture, leisure and
medicine-healthcare. Interestingly, the share of all the above sectors in the GDP of
Greece are far lower than their shares in the incubated startup ecosystem. It must also
be noted that these sectors (with the exception of agriculture) are newcomers to the
Greek business scene and one could argue off springs of the crisis years. Τhe small
share of construction can be partly explained by the fact that from being a major
sector of the Greek economy before the Crisis, it received a severe blow post 2008.
Regarding change over time it is noteworthy that at the beginning of the period under
review software-hardware was by far the largest business sector and in total (including
it) only three sectors were important players. In contrast at the end of the period
software-hardware had an equal share with the category ‘other sectors’ and in total six
sectors had a significant presence; making therefore for more variety in incubated
startups.
80.19%
6.60%1.42%0.47%1.89%
6.60%2.83%
0%10%20%30%40%50%60%70%80%90%
Location
0%
20%
40%
60%
80%
100%
2010 2011 2012 2013 2014 2015 2016
Location per annum
Athens Greece but not AthensCyprus AustraliaNetherlands UKUSA
18
3) High Tech vs Low Tech in terms of Sector For the period as a whole low tech goods were predominant. Interestingly at the
beginning of the period high and low tech goods were present in equal shares (50/50).
By the end of the period the share of low tech was much higher.
4) High Tech vs Low Tech in terms of process of production For the period as a whole low tech process predominated, but the share of high tech
processes was larger than the share of high tech goods. Interestingly as was the case
with high versus low tech goods, the share of high tech processes was larger at the
beginning of the period.
10.13%
16.88%
10.13%
10.97%
9.70%
5.49%7.17%
5.06%
24.47%
0%
5%
10%
15%
20%
25%
30%
Agriculture
Software‐Hardware
Leisure
Creative Industries
Medicine‐Healthcare
Construction‐…
Environm
ent‐Energy
Education‐ Elearning
Other
Sector
0%
20%
40%
60%
80%
100%
<2010 2010 2011 2012 2013 2014 2015 2016
Sector per Annum
Other Education‐ Elearning Environment‐Energy Construction‐Engineering‐Transportation Medicine‐Healthcare Creative Industries Leisure Software‐HardwareAgriculture
18.91%
81.09%
High Tech vs Low Tech
High Low
33.33%
50.00%
17.65%18.52%25.53%
17.14%13.64%15.00%
66.67%
50.00%
82.35%81.48%74.47%
82.86%86.36%85.00%
0%
20%
40%
60%
80%
100%
<2010 2010 2011 2012 2013 2014 2015 2016
High Tech vs Low Tech per annum
High Low
19
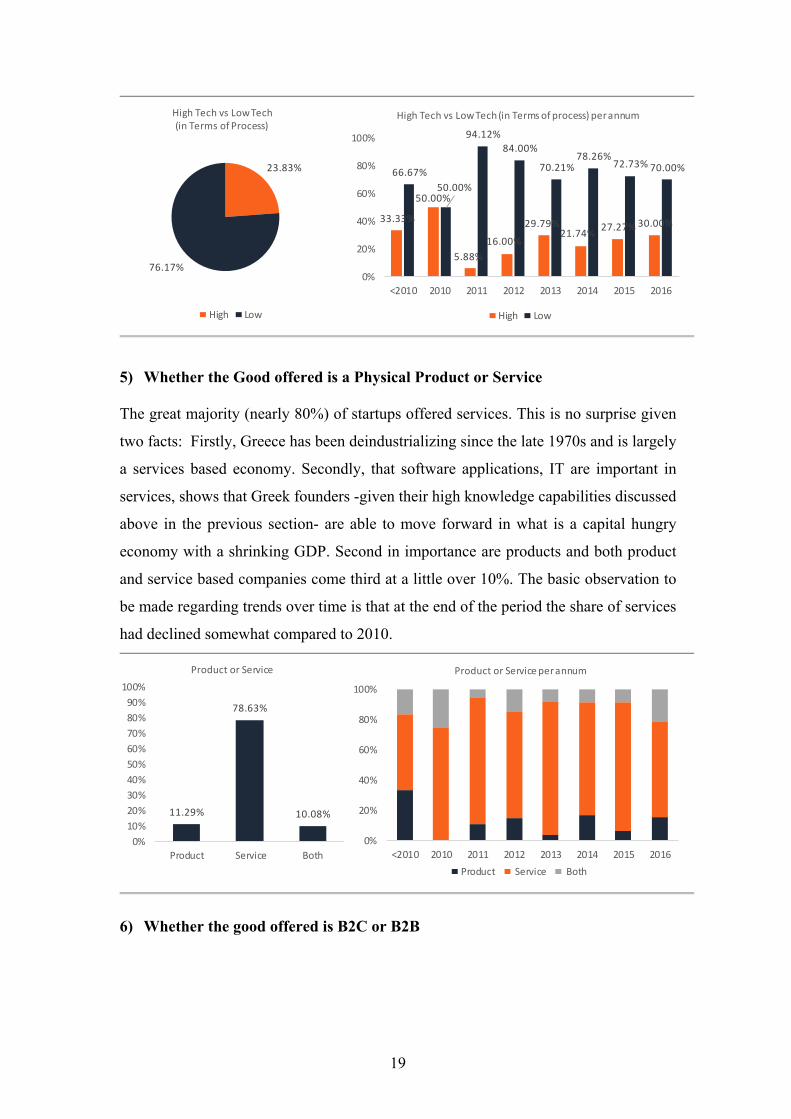
5) Whether the Good offered is a Physical Product or Service The great majority (nearly 80%) of startups offered services. This is no surprise given
two facts: Firstly, Greece has been deindustrializing since the late 1970s and is largely
a services based economy. Secondly, that software applications, IT are important in
services, shows that Greek founders -given their high knowledge capabilities discussed
above in the previous section- are able to move forward in what is a capital hungry
economy with a shrinking GDP. Second in importance are products and both product
and service based companies come third at a little over 10%. The basic observation to
be made regarding trends over time is that at the end of the period the share of services
had declined somewhat compared to 2010.
6) Whether the good offered is B2C or B2B
23.83%
76.17%
High Tech vs Low Tech (in Terms of Process)
High Low
33.33%
50.00%
5.88%
16.00%
29.79%21.74%
27.27% 30.00%
66.67%
50.00%
94.12%
84.00%
70.21%78.26%
72.73% 70.00%
0%
20%
40%
60%
80%
100%
<2010 2010 2011 2012 2013 2014 2015 2016
High Tech vs Low Tech (in Terms of process) per annum
High Low
11.29%
78.63%
10.08%
0%
10%
20%
30%
40%
50%
60%
70%
80%
90%
100%
Product Service Both
Product or Service
0%
20%
40%
60%
80%
100%
<2010 2010 2011 2012 2013 2014 2015 2016
Product or Service per annum
Product Service Both
20
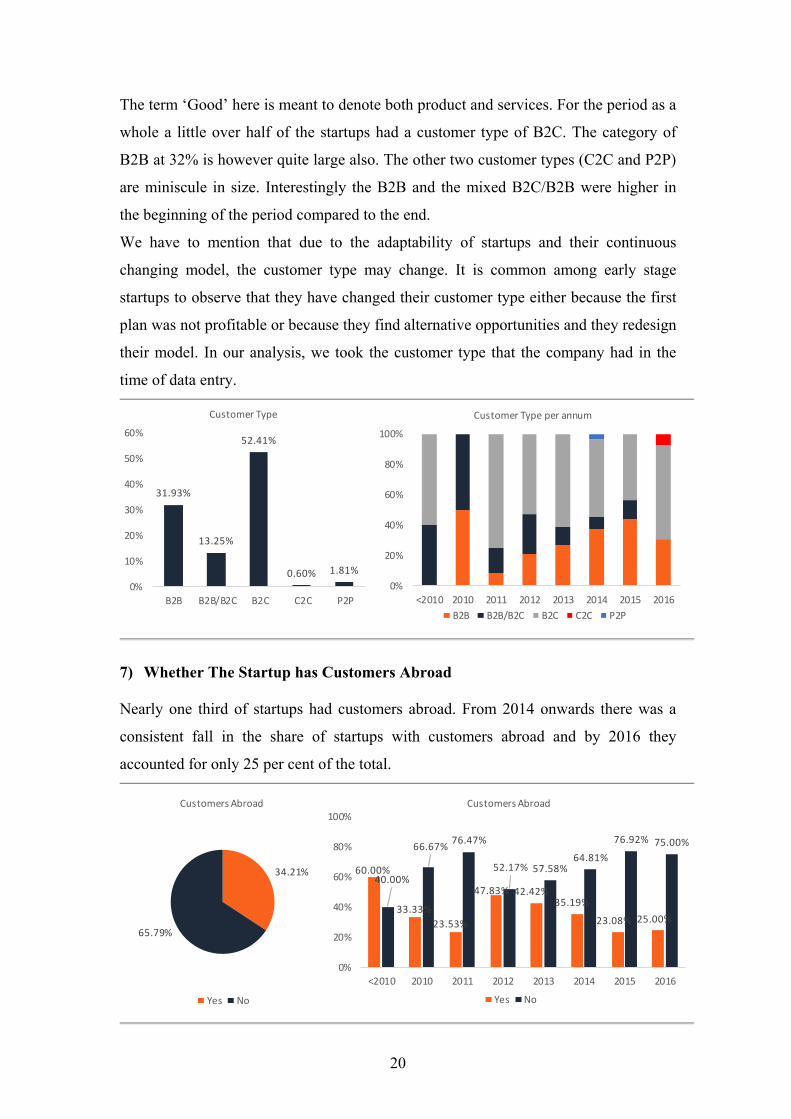
The term ‘Good’ here is meant to denote both product and services. For the period as a
whole a little over half of the startups had a customer type of B2C. The category of
B2B at 32% is however quite large also. The other two customer types (C2C and P2P)
are miniscule in size. Interestingly the B2B and the mixed B2C/B2B were higher in
the beginning of the period compared to the end.
We have to mention that due to the adaptability of startups and their continuous
changing model, the customer type may change. It is common among early stage
startups to observe that they have changed their customer type either because the first
plan was not profitable or because they find alternative opportunities and they redesign
their model. In our analysis, we took the customer type that the company had in the
time of data entry.
7) Whether The Startup has Customers Abroad Nearly one third of startups had customers abroad. From 2014 onwards there was a
consistent fall in the share of startups with customers abroad and by 2016 they
accounted for only 25 per cent of the total.
31.93%
13.25%
52.41%
0.60% 1.81%
0%
10%
20%
30%
40%
50%
60%
B2B B2B/B2C B2C C2C P2P
Customer Type
0%
20%
40%
60%
80%
100%
<2010 2010 2011 2012 2013 2014 2015 2016
Customer Type per annum
B2B B2B/B2C B2C C2C P2P
34.21%
65.79%
Customers Abroad
Yes No
60.00%
33.33%
23.53%
47.83% 42.42%35.19%
23.08% 25.00%
40.00%
66.67%76.47%
52.17% 57.58%64.81%
76.92% 75.00%
0%
20%
40%
60%
80%
100%
<2010 2010 2011 2012 2013 2014 2015 2016
Customers Abroad
Yes No
21
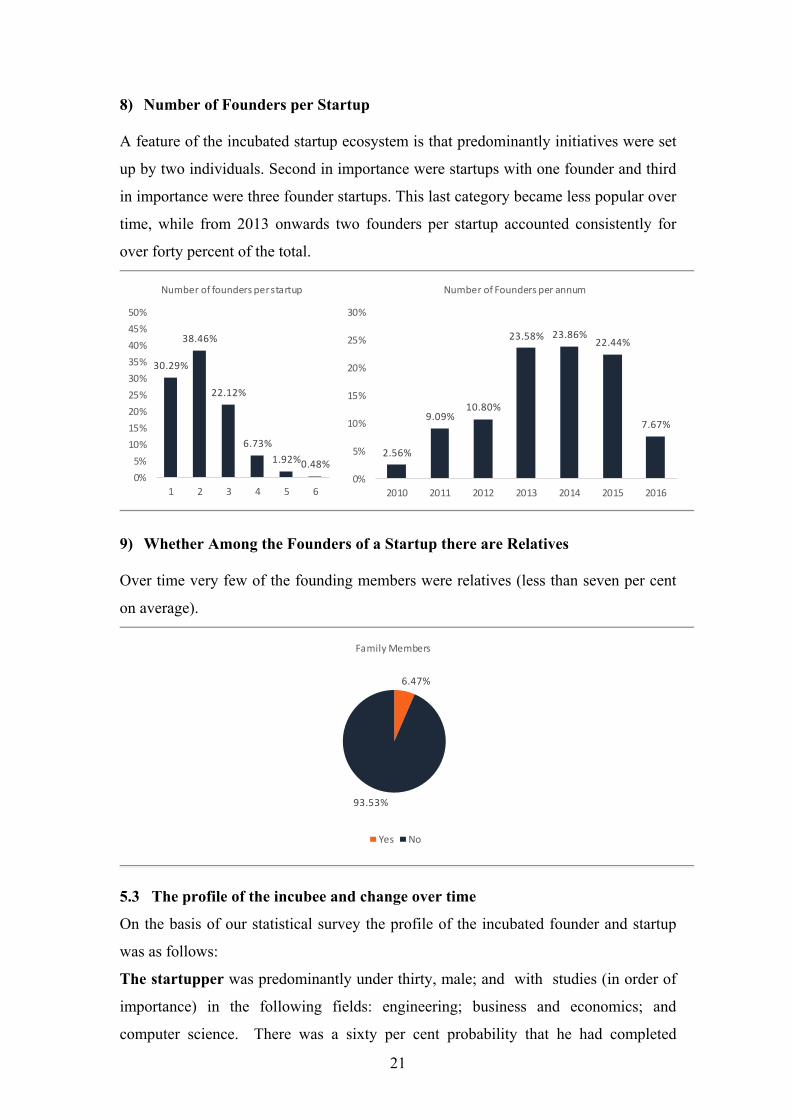
8) Number of Founders per Startup A feature of the incubated startup ecosystem is that predominantly initiatives were set
up by two individuals. Second in importance were startups with one founder and third
in importance were three founder startups. This last category became less popular over
time, while from 2013 onwards two founders per startup accounted consistently for
over forty percent of the total.
9) Whether Among the Founders of a Startup there are Relatives Over time very few of the founding members were relatives (less than seven per cent
on average).
5.3 The profile of the incubee and change over time
On the basis of our statistical survey the profile of the incubated founder and startup
was as follows:
Τhe startupper was predominantly under thirty, male; and with studies (in order of
importance) in the following fields: engineering; business and economics; and
computer science. There was a sixty per cent probability that he had completed
30.29%
38.46%
22.12%
6.73%
1.92%0.48%0%
5%
10%
15%
20%
25%
30%
35%
40%
45%
50%
1 2 3 4 5 6
Number of founders per startup
2.56%
9.09%10.80%
23.58% 23.86%22.44%
7.67%
0%
5%
10%
15%
20%
25%
30%
2010 2011 2012 2013 2014 2015 2016
Number of Founders per annum
6.47%
93.53%
Family Members
Yes No
22
graduate studies. To some extent there was versatility: Among those who had
completed graduate studies for one fourth there was a digression in the field of
education between undergraduate and graduate studies. In addition, there was almost a
fifty percent probability that a startupper had educational expertise unrelated to his
business sector (i.e. adaptability). Finally, there was a significant degree of
cosmopolitanism/openness as almost one in two startuppers had experience abroad.
The initiative/ startup was predominantly established in Athens, but it was also the
case that a little over one in ten was based abroad. The top sectors of startups in order
of importance were: hardware-software; the creative industries; agriculture and
leisure. One in five startups was high tech in terms of products and one in four was
high tech in terms of process of production. The great majority of startups offered
services and nearly one third had customers abroad. The largest category of customer
type was B2C but B2B was quite large also. The number of founders per startup was
on average two, but quite a few had three founders or more rarely even more. The
share of family founders was very low throughout.
Observed trends and shifts over time. In the last two years there was a drastic drop in
the establishment of startups. The imposition of capital controls in 2015 seems to have
brought disruption in the upward trend in the rate of formation of early stage startups.
Regarding the distribution of socioeconomic indicators (for both startuppers and their
initiatives) there were some differences in 2016 compared to 2010:
Notably, among startuppers the share of the 30-39 age group was higher (work
experience became more significant); The gender gap was narrower; Economics and
business degrees were more predominant while degrees in engineering were fewer
(more importance given to the need of understanding the business world); The share of
college graduates was higher and the share of M.Sc holders was lower (i.e lower level
of knowledge resources); There was also a higher digression in the field of education
between undergraduate and graduate studies; and the share of founders whose
education was unrelated to the company sector was higher (greater variety in skills,
greater adaptability); There was less experience abroad among founders (less
internationalization).
Regarding firm specific indicators there were fewer shifts. The slight rise in the share
of products at the end of the period needs to be explained as to whether it was a
23
positive development or not. However, it was obviously the case that at the end of the
period there seemed to be some retrogression on a number of fronts: The share of high
tech goods and high tech processes were lower than at the beginning of the period.
This was also the case with B2B and the mixed B2C/B2B customer types (less
sophistication/lower technology base); and customers abroad (less
internationalization).
What can we make from these observations on change over time? And what was the
specific impact of the 2015 imposition of capital controls on socioeconomic
indicators? Apparently the imposition of 2015 capital controls acted as a catalyst:
There was a partial shift away from knowledge resources, and internationalization for
both founders and startups (post 2014 drops in post graduate degrees; experience
abroad for the first and drops in high tech goods and customers abroad for the second)
These retrogressions were probably related to the brain drain but more research is
needed to reach firm conclusions as the statistical data on total migration does not
allow us. The national statistical surveys (Hellenic Statistical Authority) do not give
clear picture regarding the brain drain of entrepreneurs. However, we notice that for
the age groups 20-25 and 35-39 there is a slight rise in the shares in the total annual
brain drain. Two age groups which figure prominently in our sample (See Appendix
3) had a substantial share table below represents the brain drain effect per year6
(Hellenic Statistical Authority)
The bottom line is that he picture is rather complex. For example, while the shares of
high tech processes actually increased somewhat post 2014, it was also the case that
the falling trend in customers abroad predated by one year the imposition of capital
controls.
In concluding, in order to get closer to understanding of the drivers of this new startup
ecosystem it is necessary to continue our descriptive statistics analysis with the
examination of two subgroups that hold a special position in the literature on
startuppers. These are the cohort of survivor startups (as a proxy for business success)
and the cohort of startups that had customers abroad (as a proxy for
internationalization which is considered as a sine qua non for business success in our
time).
6 The percentages are calculated as actual number per age group per year to the total number in the same age group during that period.
24
6. Descriptive Statistics: Findings for the two selected subgroups/cohorts
6.1. The Survivor Cohort
In this Section we focus on first selected subgroups: the cohort of surviving startups in
2018. We present its basic demographics and examine if and how the distribution of
the socio-economic characteristics of this cohort for the period as a whole differed
substantially from that for the total population of startups in our data base.
1) Basic demographics
The survivor cohort consisted of those initiatives/ startups which in 2018 were: 1)
active (92 in number), 2) had changed ownership (8 in number) and 3) were frozen but
for which we observed signals of potential survival (19 in number).
In total the survivor cohort consisted of 119 startups and 258 founders.
Arithmetically, a little over 50% of the startups that survived were founded in 2013
and 2014.
Regarding the per annum share of survivors to the total number of startups, the two top
years in order of importance were: 2016 (to be expected given its proximity to 2018
our selected year for checking survival) and surprisingly perhaps 2010 the starting date
of our survey.
2) Socio economic indicators
Founder specific
Age distribution: in the survival cohort the share of 20-29 year old founders was
lower and that of 30-39 year old founders was higher compared to the findings for the
total population of founders. This finding is not surprising as it has been noted in the
46.06%53.94%
Survivor and Non survivor Startups in 2018
Yes No
75.00%
27.78%
45.45%
62.16%62.50%
48.57%
85.71%
25.00%
72.22%
54.55%
37.84%37.50%
51.43%
14.29%
0%
10%
20%
30%
40%
50%
60%
70%
80%
90%
2010 2011 2012 2013 2014 2015 2016
Rates of startup survival per annum
Yes No
25
literature (Kauffman Foundation, 2009) that the age of entrepreneurs and the
probability of success are positively related to age.
Gender distribution: There were slightly fewer women in the survival cohort group.
Level of education: In the survival cohort there was as higher presence of graduate
students and holders of Masters degrees. There was also a large share of Ph.D
students, post graduate researchers and Professors. Namely there was a stronger
affiliation of start-ups with academia.
Fields of education: In undergraduate and graduate studies (degrees) as well there
was a significantly higher presence of economics and business, science and theoretical
studies and a significantly lower presence of computer science and engineering in the
survival cohort.
Degree of digression in skills between undergraduate and graduate studies: It was
slightly higher in the cohort group compared to the total population of founders. This
suggests that within the new startup ecosystem this is a ‘modern’ feature that hopefully
might become stronger as today a variety of skills is considered a point of advantage in
terms of mindset and secures higher rates of success in career and business according
to the literature.
Founders’ education related to the company sector: It was noticeably higher in the
cohort. This suggests that founders with a more focused mindset were probably more
successful.
Experience abroad: it was higher in the cohort. It seems more logical that companies
that have survived have founders with experience abroad, since they may be more
familiar with trends as well as business models of companies in different country (ies).
Firm specific
Location. For the period as a whole, the share of Athenian based startups based in the
cohort group was 10 % lower than what its share was for the total population of
incubated startups. Indeed, if we focus on the respective share for the two last years of
the period under review the share of Athens was even lower (perhaps because with the
imposition of the capital controls the establishment of startups outside Greece
appeared as a more attractive scenario).
Sector. The shares was significantly higher in the survivor cohort for the following
sectors: education-eLearning, software-hardware and medicine–healthcare. In contrast
it was significantly lower for the creative industries and the environment-energy.
26
High Tech-Low Tech (in terms of good) and High Tech-Low Tech (in terms of
process).
The shares of high tech in goods and (especially) processes was significantly higher in
the cohort group.
Product or Service. The share of pure/only service based startups was significantly
lower in the cohort group.
Customer Type. The shares of B2B and C2C were significantly higher in the cohort
group.
Customers abroad. The share of customers abroad was exceptionally low in the
cohort group. What is indeed surprising is that the share of companies with customers
abroad was almost nonexistent. How can we explain this? Further research must be
done on this topic but in the meanwhile: this can to some small degree be explained by
the fact that one quarter of the survivor cohort was founded in 2015 and 2016, namely
at a difficult time regarding internationalization due to the imposition of capital
controls.
Number of founding members per startup. The number of founding members per
startup was slightly higher in the cohort group.
Number of family members. The share of family members in startups was somewhat
higher in the cohort group.
In sum.
The findings for the survivor cohort regarding founder specific indicators are more or
less as expected. Compared to the total population of incubated founders a larger share
of founders were: mature (30-39); more educated; linked to academia; educated in
economics and business, science and theoretical studies; holders of degrees related to
the company sector and had experience abroad.
Regarding the findings for the firm specific indicators of the survivor cohort,
compared to those for the total population of incubated founders the situation is more
complex. Notably, as expected B2C customer type was lower and high tech goods and
processes were higher. Whereas, the existence of more family members underlines the
importance of tradition, as does the phenomenon of higher knowledge/capital
resources (more founders per startup). Finally, the reasons for (and significance of) the
divergence of some indicators are not so obvious (e.g. sector, lower share of pure
services, customers abroad) and need to be further researched.
27
To close this section: survival was not a matter of chance, it was a matter of deliberate
choice, being flexible and the differing weights of founder and firm specific socio-
economic indicators made a difference. This finding has implications for policy
making.
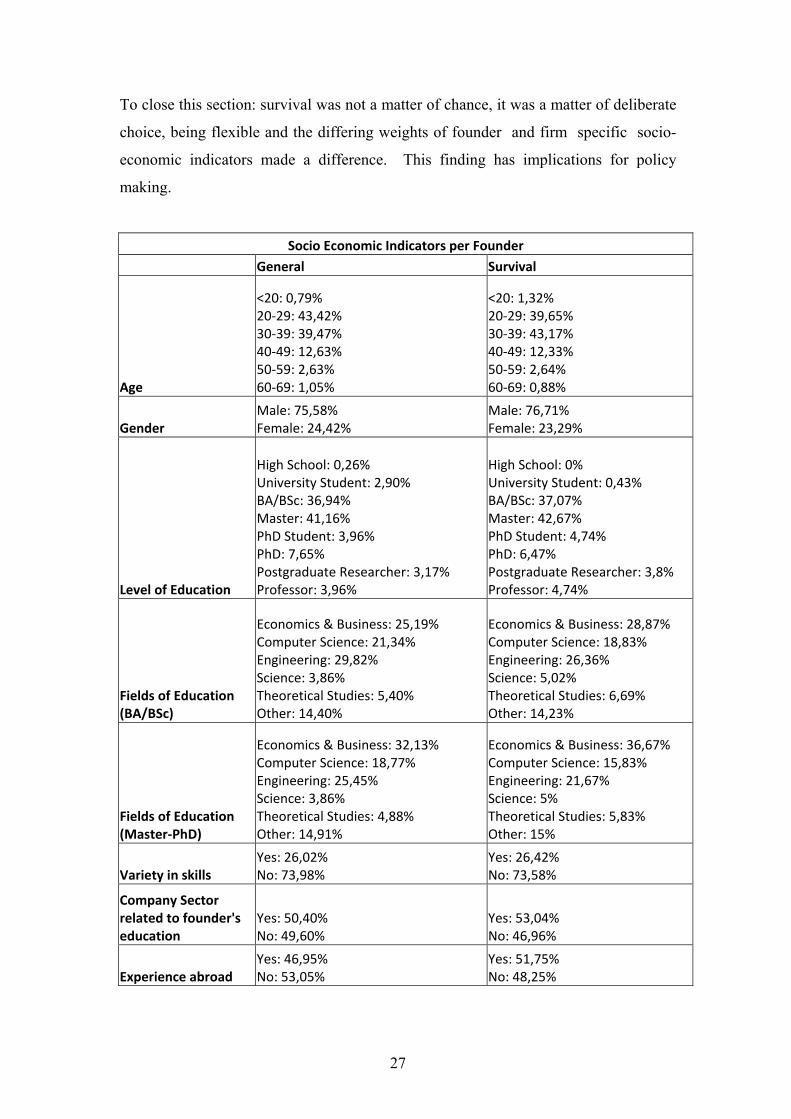
Socio Economic Indicators per Founder
General Survival
Age
<20: 0,79% 20‐29: 43,42% 30‐39: 39,47% 40‐49: 12,63% 50‐59: 2,63% 60‐69: 1,05%
<20: 1,32% 20‐29: 39,65% 30‐39: 43,17% 40‐49: 12,33% 50‐59: 2,64% 60‐69: 0,88%
Gender Male: 75,58% Female: 24,42%
Male: 76,71% Female: 23,29%
Level of Education
High School: 0,26% University Student: 2,90% BA/BSc: 36,94% Master: 41,16% PhD Student: 3,96% PhD: 7,65% Postgraduate Researcher: 3,17% Professor: 3,96%
High School: 0% University Student: 0,43% BA/BSc: 37,07% Master: 42,67% PhD Student: 4,74% PhD: 6,47% Postgraduate Researcher: 3,8% Professor: 4,74%
Fields of Education (BA/BSc)
Economics & Business: 25,19% Computer Science: 21,34% Engineering: 29,82% Science: 3,86% Theoretical Studies: 5,40% Other: 14,40%
Economics & Business: 28,87% Computer Science: 18,83% Engineering: 26,36% Science: 5,02% Theoretical Studies: 6,69% Other: 14,23%
Fields of Education (Master‐PhD)
Economics & Business: 32,13% Computer Science: 18,77% Engineering: 25,45% Science: 3,86% Theoretical Studies: 4,88% Other: 14,91%
Economics & Business: 36,67% Computer Science: 15,83% Engineering: 21,67% Science: 5% Theoretical Studies: 5,83% Other: 15%
Variety in skills Yes: 26,02% No: 73,98%
Yes: 26,42% No: 73,58%
Company Sector related to founder's education
Yes: 50,40% No: 49,60%
Yes: 53,04% No: 46,96%
Experience abroad Yes: 46,95% No: 53,05%
Yes: 51,75% No: 48,25%
28
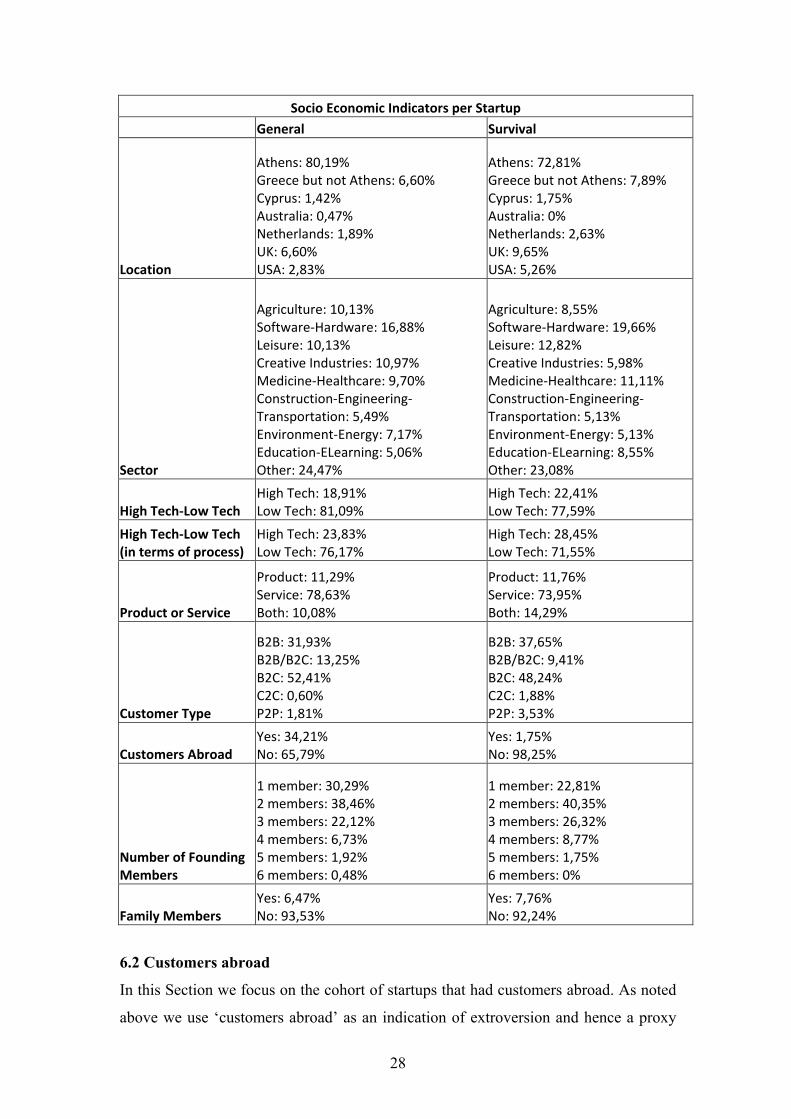
Socio Economic Indicators per Startup
General Survival
Location
Athens: 80,19% Greece but not Athens: 6,60% Cyprus: 1,42% Australia: 0,47% Netherlands: 1,89% UK: 6,60% USA: 2,83%
Athens: 72,81% Greece but not Athens: 7,89% Cyprus: 1,75% Australia: 0% Netherlands: 2,63% UK: 9,65% USA: 5,26%
Sector
Agriculture: 10,13% Software‐Hardware: 16,88% Leisure: 10,13% Creative Industries: 10,97% Medicine‐Healthcare: 9,70% Construction‐Engineering‐Transportation: 5,49% Environment‐Energy: 7,17% Education‐ELearning: 5,06% Other: 24,47%
Agriculture: 8,55% Software‐Hardware: 19,66% Leisure: 12,82% Creative Industries: 5,98% Medicine‐Healthcare: 11,11% Construction‐Engineering‐Transportation: 5,13% Environment‐Energy: 5,13% Education‐ELearning: 8,55% Other: 23,08%
High Tech‐Low Tech High Tech: 18,91% Low Tech: 81,09%
High Tech: 22,41% Low Tech: 77,59%
High Tech‐Low Tech (in terms of process)
High Tech: 23,83% Low Tech: 76,17%
High Tech: 28,45% Low Tech: 71,55%
Product or Service
Product: 11,29% Service: 78,63% Both: 10,08%
Product: 11,76% Service: 73,95% Both: 14,29%
Customer Type
B2B: 31,93% B2B/B2C: 13,25% B2C: 52,41% C2C: 0,60% P2P: 1,81%
B2B: 37,65% B2B/B2C: 9,41% B2C: 48,24% C2C: 1,88% P2P: 3,53%
Customers Abroad Yes: 34,21% No: 65,79%
Yes: 1,75% No: 98,25%
Number of Founding Members
1 member: 30,29% 2 members: 38,46% 3 members: 22,12% 4 members: 6,73% 5 members: 1,92% 6 members: 0,48%
1 member: 22,81% 2 members: 40,35% 3 members: 26,32% 4 members: 8,77% 5 members: 1,75% 6 members: 0%
Family Members Yes: 6,47% No: 93,53%
Yes: 7,76% No: 92,24%
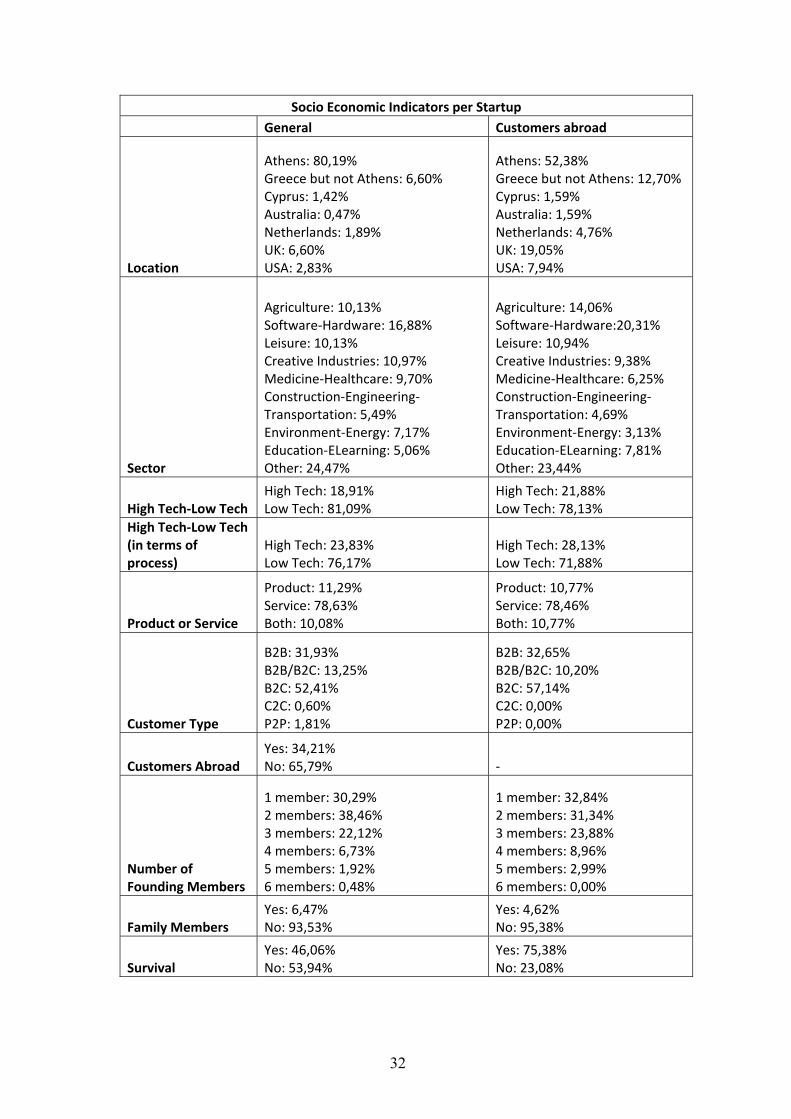
6.2 Customers abroad
In this Section we focus on the cohort of startups that had customers abroad. As noted
above we use ‘customers abroad’ as an indication of extroversion and hence a proxy
29
for internationalization. We follow the same steps of analysis as in the cohort group
for survivors.
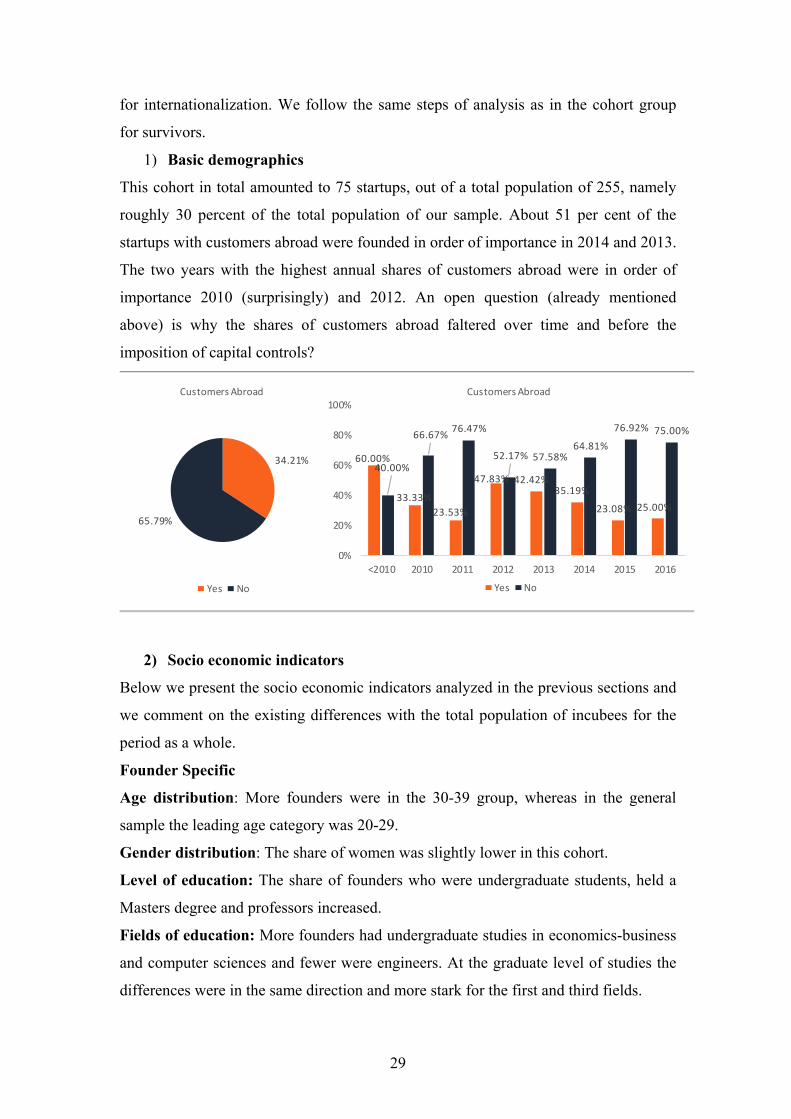
1) Basic demographics
This cohort in total amounted to 75 startups, out of a total population of 255, namely
roughly 30 percent of the total population of our sample. About 51 per cent of the
startups with customers abroad were founded in order of importance in 2014 and 2013.
The two years with the highest annual shares of customers abroad were in order of
importance 2010 (surprisingly) and 2012. An open question (already mentioned
above) is why the shares of customers abroad faltered over time and before the
imposition of capital controls?
2) Socio economic indicators
Below we present the socio economic indicators analyzed in the previous sections and
we comment on the existing differences with the total population of incubees for the
period as a whole.
Founder Specific
Age distribution: More founders were in the 30-39 group, whereas in the general
sample the leading age category was 20-29.
Gender distribution: The share of women was slightly lower in this cohort.
Level of education: The share of founders who were undergraduate students, held a
Masters degree and professors increased.
Fields of education: More founders had undergraduate studies in economics-business
and computer sciences and fewer were engineers. At the graduate level of studies the
differences were in the same direction and more stark for the first and third fields.
34.21%
65.79%
Customers Abroad
Yes No
60.00%
33.33%
23.53%
47.83% 42.42%35.19%
23.08% 25.00%
40.00%
66.67%76.47%
52.17% 57.58%64.81%
76.92% 75.00%
0%
20%
40%
60%
80%
100%
<2010 2010 2011 2012 2013 2014 2015 2016
Customers Abroad
Yes No
30
Degree of digression in skills between undergraduate and graduate studies: There
was a somewhat higher variety in skills.
Company sector related to the Founders education: There was a somewhat lower
share of direct relevance of studies to the company sector.
Experience abroad: This was substantially higher which suggests that experience
abroad made the process easier for founders to search for international clients.
Firm specific
Location: Far fewer startups are based in Athens and the share of Non-Athenian
Greek startups was higher.
Sector: Agriculture, software-hardware and education-E-learning were higher.
High Tech-Low Tech (in terms of good) and High Tech-Low Tech (in terms of
process): High tech was higher both in terms of goods and process.
Product or Service: Services were slightly higher.
Customer type: The presence of B2C was higher.
Number of founding members: There was a larger share of startups founded by three
to five individuals.
Family members: There was a slightly lower share of family members.
Survival: Interestingly, the share of surviving firms within this cohort was
substantially larger. This finding needs to be explored further as in the data above for
the survival cohort the indicator customers abroad is miniscule in size.
In sum, the founder specific indicators of the customers abroad cohort suggest a larger
presence of the 30s age group; a more open and diverse founder body and that
experience abroad was substantially more significant. As for the firm specific
indicators far fewer firms were located in Athens; high technology goods and
production processes were more present (as is to be expected); and finally services
and B2C customer types were more important. It is obvious that further research is
necessary to uncover what policies might enhance those indicators that are associated
with higher shares of customers abroad within the community of incubated startups.
In way of closing the discussion of the two selected cohorts our general comment is
that on the whole both the founder and firm specific characteristics were more
sophisticated aka advanced in these two cohorts. Let it be also underlined that.
31
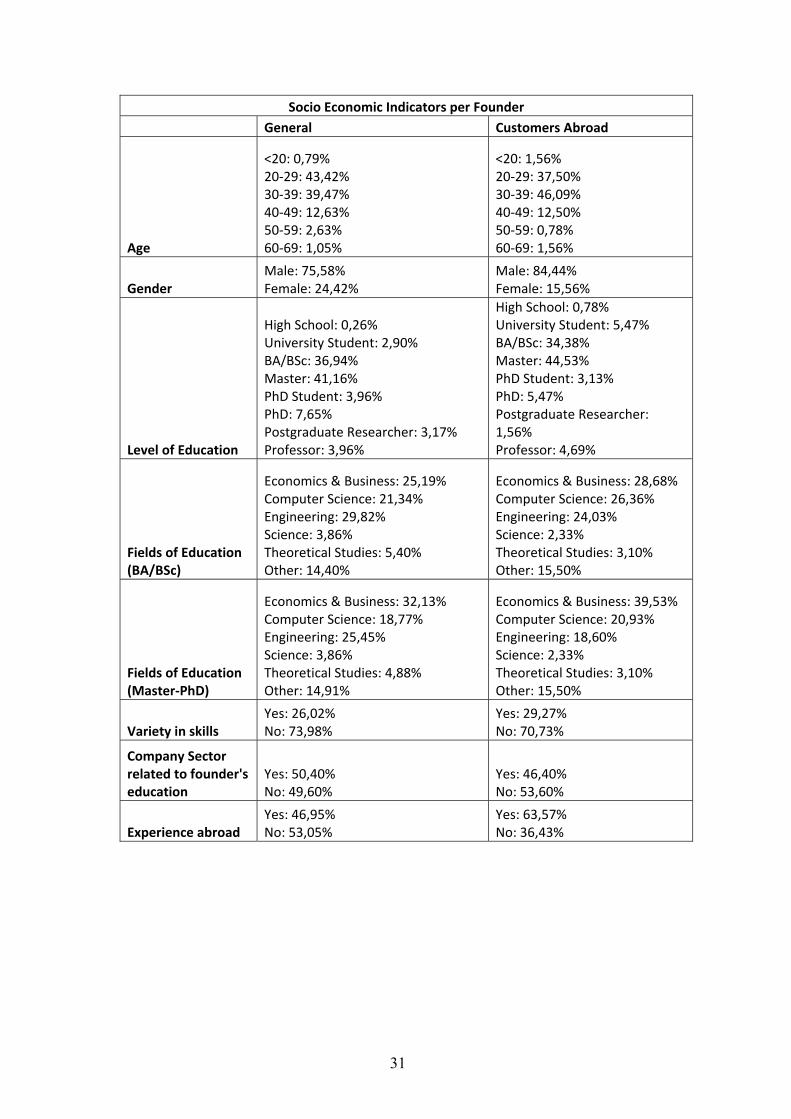
Socio Economic Indicators per Founder
General Customers Abroad
Age
<20: 0,79% 20‐29: 43,42% 30‐39: 39,47% 40‐49: 12,63% 50‐59: 2,63% 60‐69: 1,05%
<20: 1,56% 20‐29: 37,50% 30‐39: 46,09% 40‐49: 12,50% 50‐59: 0,78% 60‐69: 1,56%
Gender Male: 75,58% Female: 24,42%
Male: 84,44% Female: 15,56%
Level of Education
High School: 0,26% University Student: 2,90% BA/BSc: 36,94% Master: 41,16% PhD Student: 3,96% PhD: 7,65% Postgraduate Researcher: 3,17% Professor: 3,96%
High School: 0,78% University Student: 5,47% BA/BSc: 34,38% Master: 44,53% PhD Student: 3,13% PhD: 5,47% Postgraduate Researcher: 1,56% Professor: 4,69%
Fields of Education (BA/BSc)
Economics & Business: 25,19% Computer Science: 21,34% Engineering: 29,82% Science: 3,86% Theoretical Studies: 5,40% Other: 14,40%
Economics & Business: 28,68% Computer Science: 26,36% Engineering: 24,03% Science: 2,33% Theoretical Studies: 3,10% Other: 15,50%
Fields of Education (Master‐PhD)
Economics & Business: 32,13% Computer Science: 18,77% Engineering: 25,45% Science: 3,86% Theoretical Studies: 4,88% Other: 14,91%
Economics & Business: 39,53% Computer Science: 20,93% Engineering: 18,60% Science: 2,33% Theoretical Studies: 3,10% Other: 15,50%
Variety in skills Yes: 26,02% No: 73,98%
Yes: 29,27% No: 70,73%
Company Sector related to founder's education
Yes: 50,40% No: 49,60%
Yes: 46,40% No: 53,60%
Experience abroad Yes: 46,95% No: 53,05%
Yes: 63,57% No: 36,43%
32
Socio Economic Indicators per Startup
General Customers abroad
Location
Athens: 80,19% Greece but not Athens: 6,60% Cyprus: 1,42% Australia: 0,47% Netherlands: 1,89% UK: 6,60% USA: 2,83%
Athens: 52,38% Greece but not Athens: 12,70%Cyprus: 1,59% Australia: 1,59% Netherlands: 4,76% UK: 19,05% USA: 7,94%
Sector
Agriculture: 10,13% Software‐Hardware: 16,88% Leisure: 10,13% Creative Industries: 10,97% Medicine‐Healthcare: 9,70% Construction‐Engineering‐Transportation: 5,49% Environment‐Energy: 7,17% Education‐ELearning: 5,06% Other: 24,47%
Agriculture: 14,06% Software‐Hardware:20,31% Leisure: 10,94% Creative Industries: 9,38% Medicine‐Healthcare: 6,25% Construction‐Engineering‐Transportation: 4,69% Environment‐Energy: 3,13% Education‐ELearning: 7,81% Other: 23,44%
High Tech‐Low Tech High Tech: 18,91% Low Tech: 81,09%
High Tech: 21,88% Low Tech: 78,13%
High Tech‐Low Tech (in terms of process)
High Tech: 23,83% Low Tech: 76,17%
High Tech: 28,13% Low Tech: 71,88%
Product or Service
Product: 11,29% Service: 78,63% Both: 10,08%
Product: 10,77% Service: 78,46% Both: 10,77%
Customer Type
B2B: 31,93% B2B/B2C: 13,25% B2C: 52,41% C2C: 0,60% P2P: 1,81%
B2B: 32,65% B2B/B2C: 10,20% B2C: 57,14% C2C: 0,00% P2P: 0,00%
Customers Abroad Yes: 34,21% No: 65,79% ‐
Number of Founding Members
1 member: 30,29% 2 members: 38,46% 3 members: 22,12% 4 members: 6,73% 5 members: 1,92% 6 members: 0,48%
1 member: 32,84% 2 members: 31,34% 3 members: 23,88% 4 members: 8,96% 5 members: 2,99% 6 members: 0,00%
Family Members Yes: 6,47% No: 93,53%
Yes: 4,62% No: 95,38%
Survival Yes: 46,06% No: 53,94%
Yes: 75,38% No: 23,08%
33
7. Univariate Analysis7: Findings for the two selected subgroups/cohorts (by Spiros Paraskevas)
Method description to identify important factors:
Under the goal of identifying relevant independent variables to this analysis outcome
of interest (i.e. a startup's survival and the acquisition of customers abroad), a filter
based feature selection method8 is applied. Concretely, a filter method evaluates
available predictors prior infusing these in a multivariate model. Based on this
evaluation, a subset of predictors are preselected, as mostly applicable, to model the
chosen dependent variables. This technique is identified as univariate, since a one on
one screening process is used. The metrics chosen to perform this filter based
evaluation are a) Welch’s t-test (also known as unequal variances t-test) for numerical
variables and b) chi-square test for categorical ones. Based on the results of these tests,
the researcher can identify important variables with respect to the desired outcome.
A Welch’s t-test computes the probability of the two sample means (e.g. one falling
under the survived startups class and the other under the startups that failed to survive)
being equal given sample variance. If the test results in a low probability (p-value)
then the sample means are not equal and therefore the variable under scrutiny is useful
in discriminating the objective (i.e. a startup’s survival). A chi square test is the
respective statistical test for the case of categorical variables. It is used to determine
whether there is a statistically significant difference between the expected frequencies
and the observed frequencies in one or more categories of a contingency table. In case
a chi-square test results in a low p-value, this means that there is a low probability that
the observed difference in frequencies, of survivals vs non survivals, for the different
values of the variable under check is attributed to randomness. Therefore, it should be
expected that similar survival rates are to be seen in the future.
Put simply, the resulting p-values of both mentioned tests express the probability of
the variable under check being relevant to the outcome of interest.
7.1.Survival
A startup survivor profile is as follows: a startup that develops in the sectors of
education/eLearning, leisure/tourism, software/hardware and medicine/healthcare
domains. A startup that has more than one or two founding members regardless of age
7 Data Scientist – Machine Learning Engineer at SPhears AI, [email protected] 8 Max Kuhn; Kjell Johnson, Applied Predictive Modeling, May 2013, Springer New York
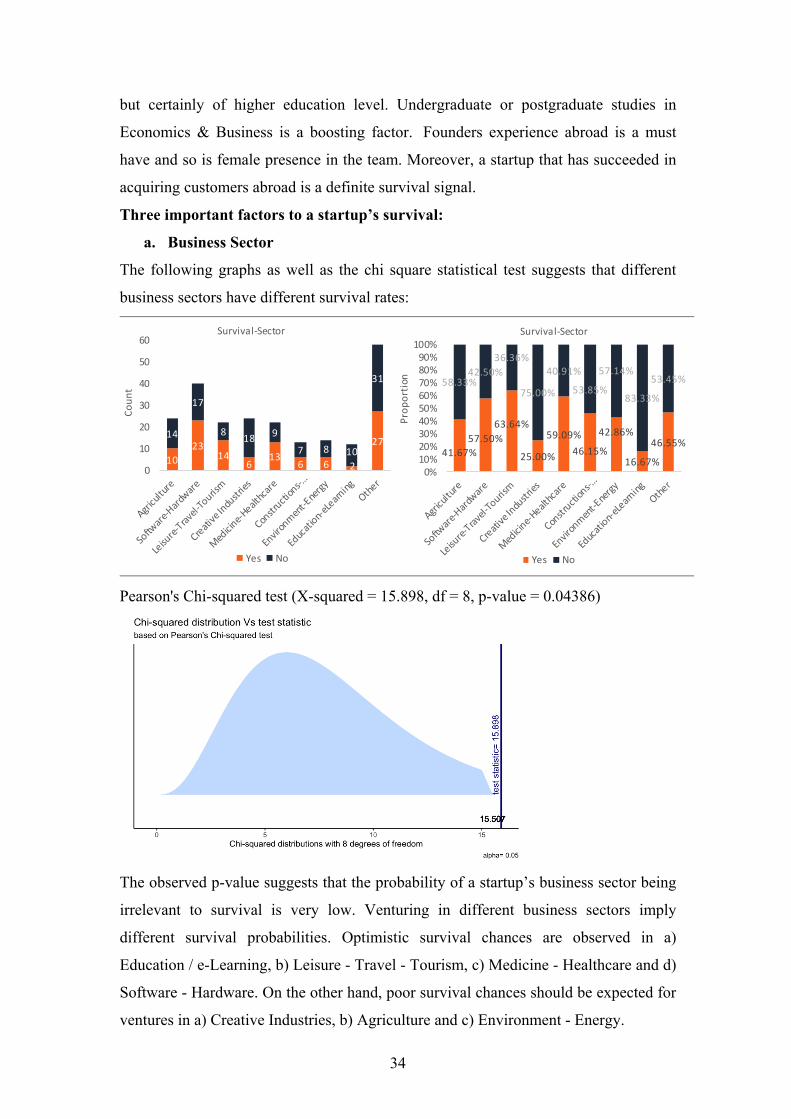
34
but certainly of higher education level. Undergraduate or postgraduate studies in
Economics & Business is a boosting factor. Founders experience abroad is a must
have and so is female presence in the team. Moreover, a startup that has succeeded in
acquiring customers abroad is a definite survival signal.
Three important factors to a startup’s survival:
a. Business Sector
The following graphs as well as the chi square statistical test suggests that different
business sectors have different survival rates:
Pearson's Chi-squared test (X-squared = 15.898, df = 8, p-value = 0.04386)
The observed p-value suggests that the probability of a startup’s business sector being
irrelevant to survival is very low. Venturing in different business sectors imply
different survival probabilities. Optimistic survival chances are observed in a)
Education / e-Learning, b) Leisure - Travel - Tourism, c) Medicine - Healthcare and d)
Software - Hardware. On the other hand, poor survival chances should be expected for
ventures in a) Creative Industries, b) Agriculture and c) Environment - Energy.
10
2314
613
6 6 2
2714
17
818
9
7 8 10
31
0
10
20
30
40
50
60
Count
Survival‐Sector
Yes No
41.67%
57.50%
63.64%
25.00%
59.09%
46.15%
42.86%
16.67%
46.55%
58.33%42.50%
36.36%
75.00%
40.91%
53.85%
57.14%
83.33%
53.45%
0%10%20%30%40%50%60%70%80%90%100%
Proportion
Survival‐Sector
Yes No
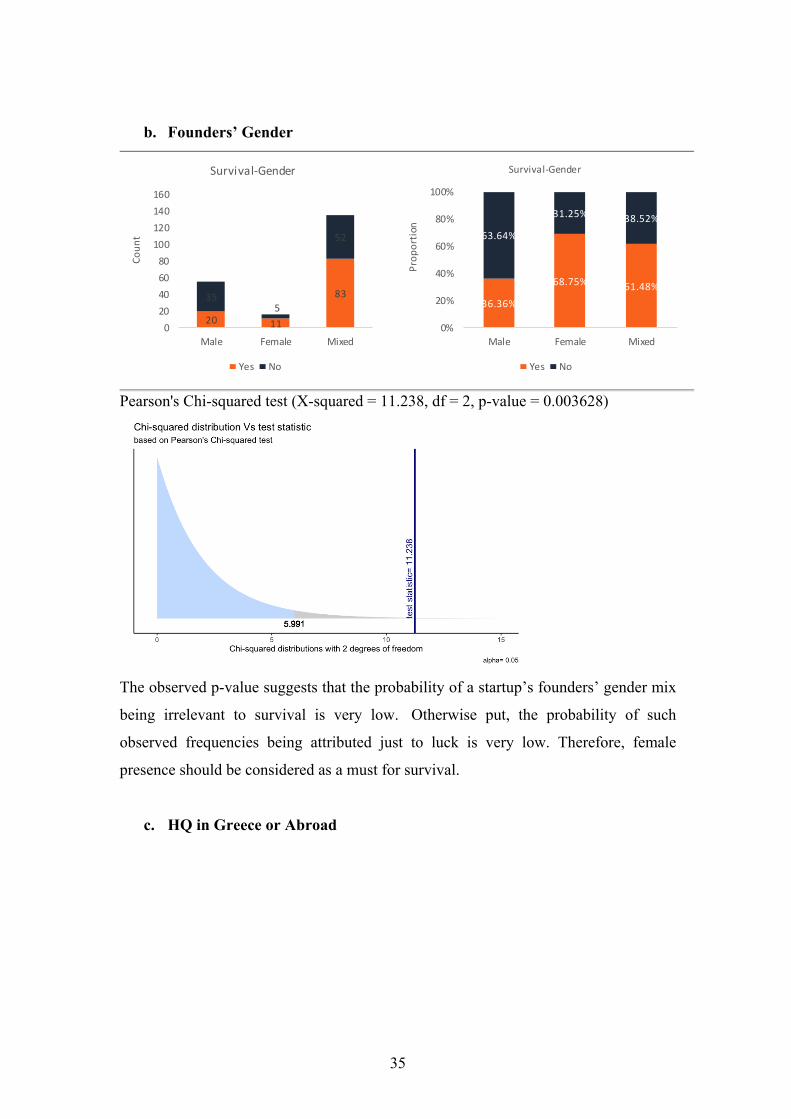
35
b. Founders’ Gender
Pearson's Chi-squared test (X-squared = 11.238, df = 2, p-value = 0.003628)
The observed p-value suggests that the probability of a startup’s founders’ gender mix
being irrelevant to survival is very low. Otherwise put, the probability of such
observed frequencies being attributed just to luck is very low. Therefore, female
presence should be considered as a must for survival.
c. HQ in Greece or Abroad
20 11
83355
52
0
20
40
60
80
100
120
140
160
Male Female Mixed
Count
Survival‐Gender
Yes No
63.64%
31.25% 38.52%
36.36%
68.75% 61.48%
0%
20%
40%
60%
80%
100%
Male Female Mixed
Proportion
Survival‐Gender
Yes No
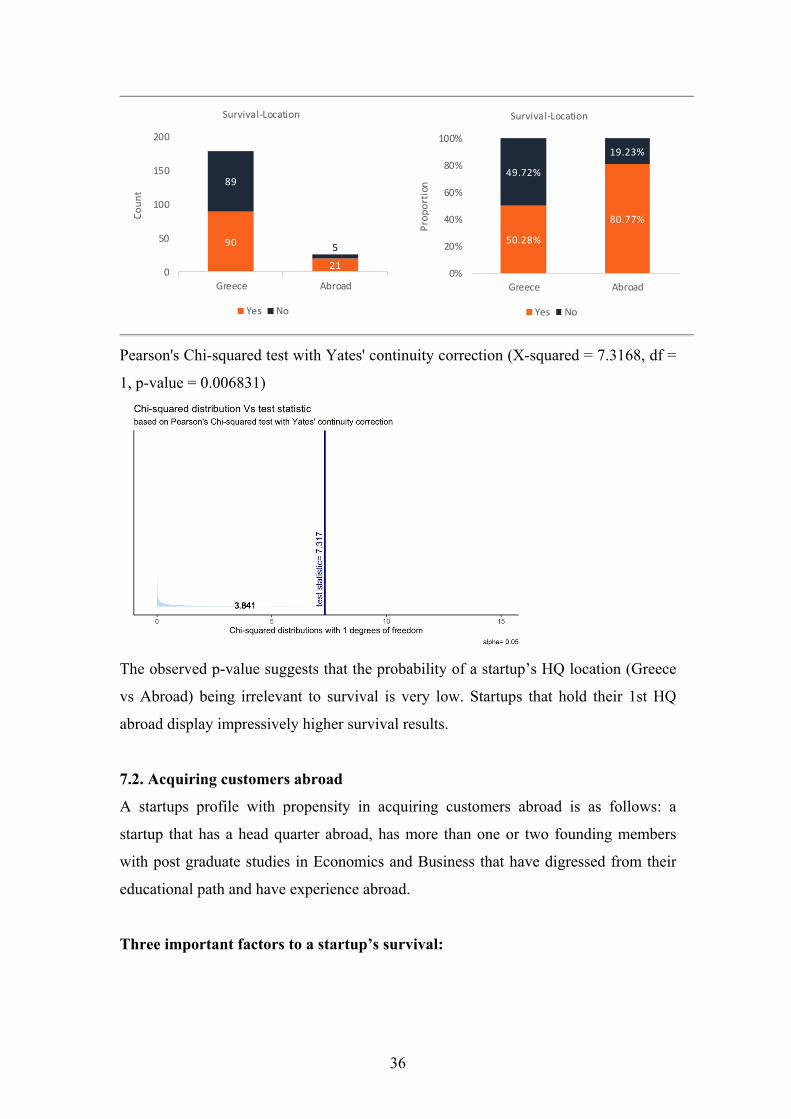
36
Pearson's Chi-squared test with Yates' continuity correction (X-squared = 7.3168, df =
1, p-value = 0.006831)
The observed p-value suggests that the probability of a startup’s HQ location (Greece
vs Abroad) being irrelevant to survival is very low. Startups that hold their 1st HQ
abroad display impressively higher survival results.
7.2. Acquiring customers abroad
A startups profile with propensity in acquiring customers abroad is as follows: a
startup that has a head quarter abroad, has more than one or two founding members
with post graduate studies in Economics and Business that have digressed from their
educational path and have experience abroad.
Three important factors to a startup’s survival:
90
21
89
5
0
50
100
150
200
Greece Abroad
Count
Survival‐Location
Yes No
50.28%
80.77%
49.72%
19.23%
0%
20%
40%
60%
80%
100%
Greece Abroad
Proportion
Survival‐Location
Yes No
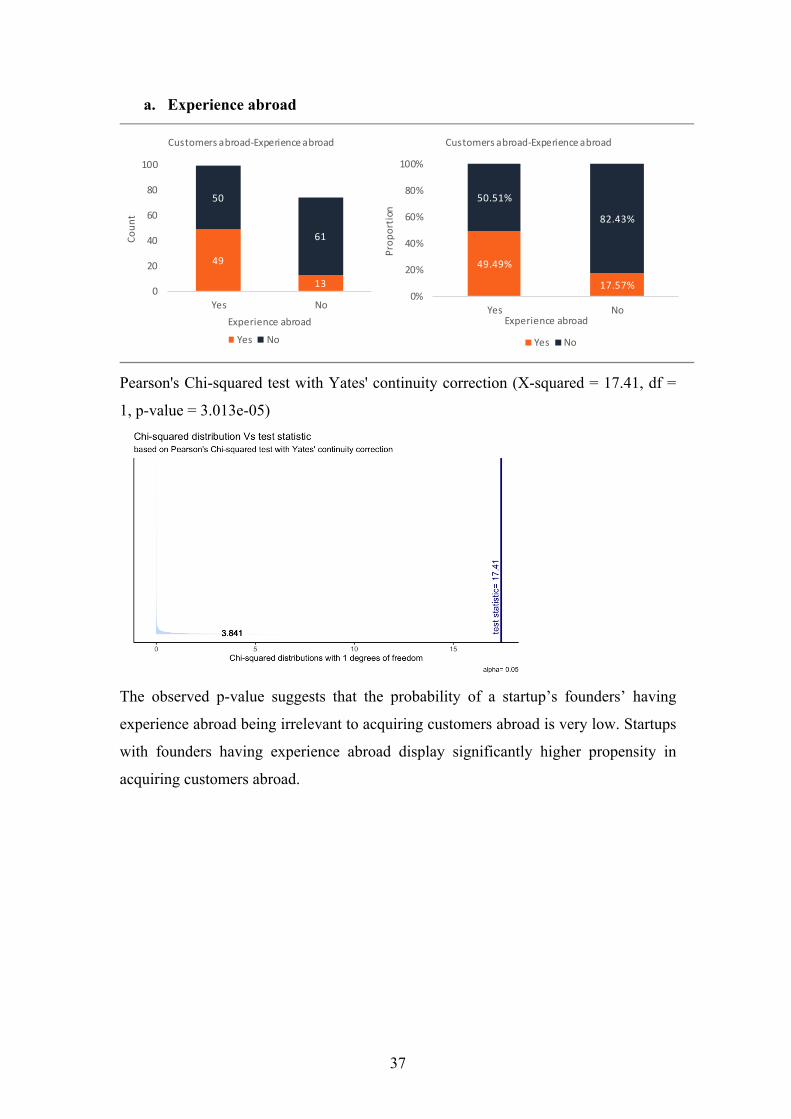
37
a. Experience abroad
Pearson's Chi-squared test with Yates' continuity correction (X-squared = 17.41, df =
1, p-value = 3.013e-05)
The observed p-value suggests that the probability of a startup’s founders’ having
experience abroad being irrelevant to acquiring customers abroad is very low. Startups
with founders having experience abroad display significantly higher propensity in
acquiring customers abroad.
49.49%
17.57%
50.51%
82.43%
0%
20%
40%
60%
80%
100%
Yes No
Proportion
Experience abroad
Customers abroad‐Experience abroad
Yes No
49
13
50
61
0
20
40
60
80
100
Yes No
Count
Experience abroad
Customers abroad‐Experience abroad
Yes No
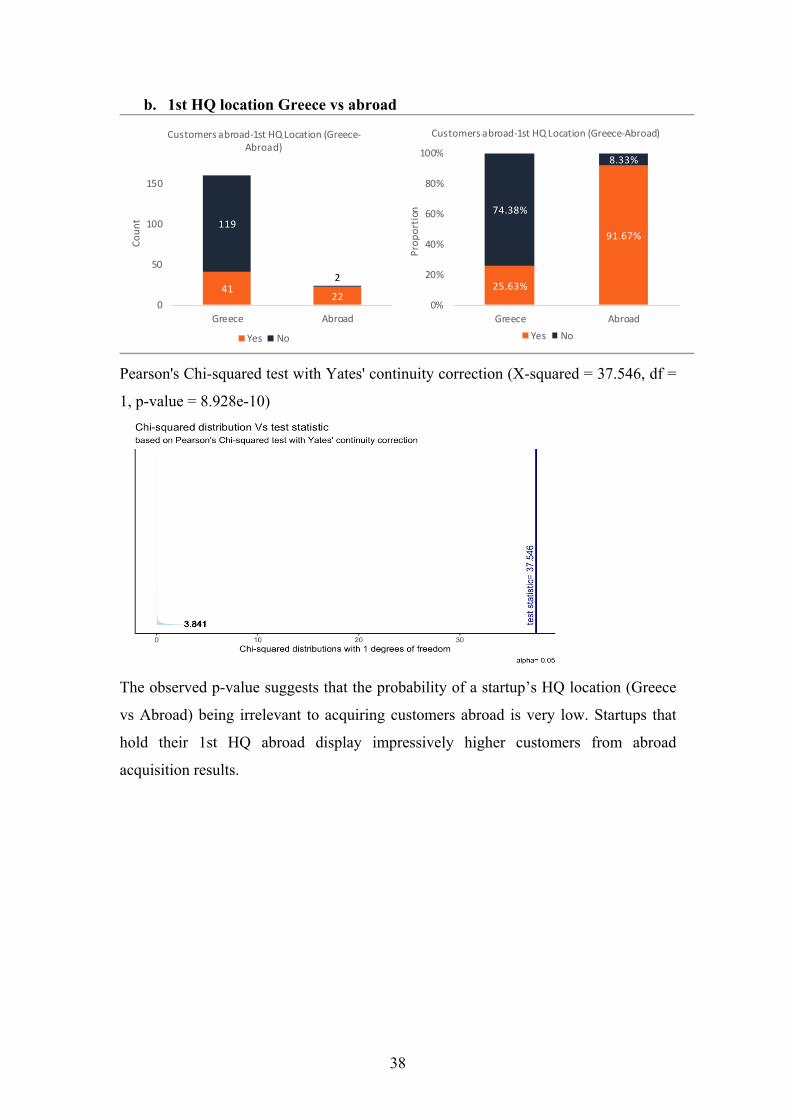
38
b. 1st HQ location Greece vs abroad
Pearson's Chi-squared test with Yates' continuity correction (X-squared = 37.546, df =
1, p-value = 8.928e-10)
The observed p-value suggests that the probability of a startup’s HQ location (Greece
vs Abroad) being irrelevant to acquiring customers abroad is very low. Startups that
hold their 1st HQ abroad display impressively higher customers from abroad
acquisition results.
4122
119
2
0
50
100
150
Greece Abroad
Count
Customers abroad‐1st HQ Location (Greece‐Abroad)
Yes No
25.63%
91.67%
74.38%
8.33%
0%
20%
40%
60%
80%
100%
Greece Abroad
Proportion
Customers abroad‐1st HQ Location (Greece‐Abroad)
Yes No
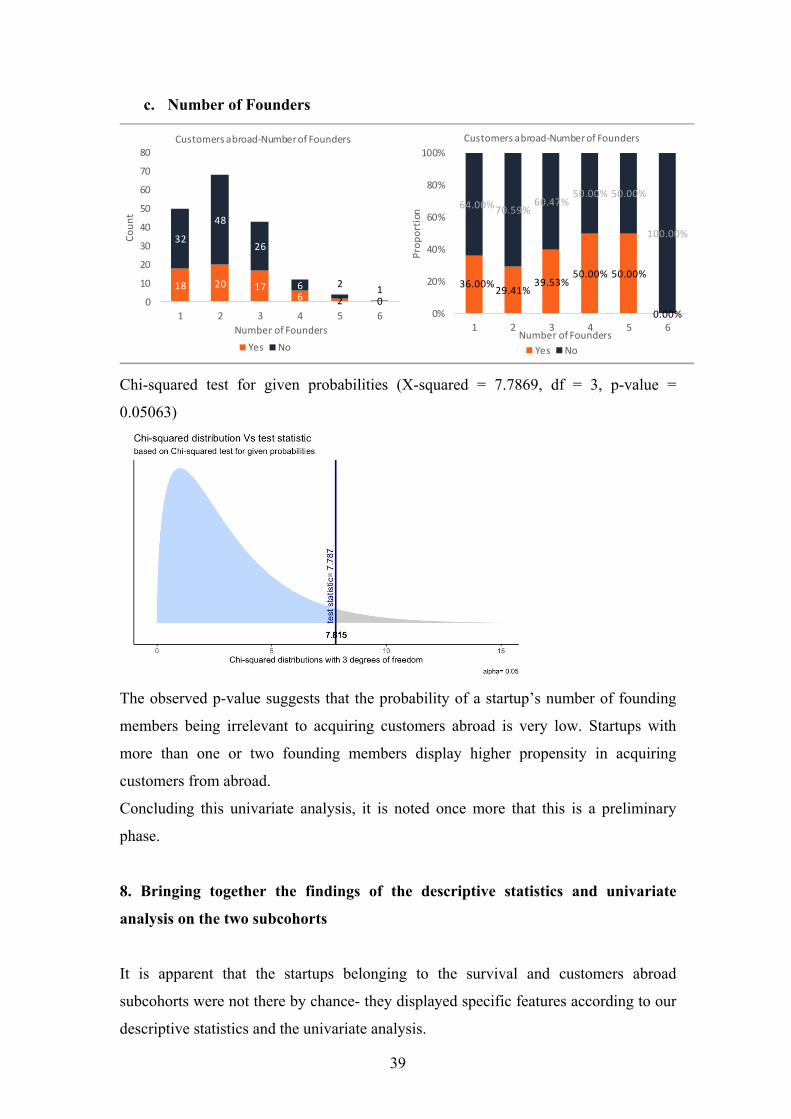
39
c. Number of Founders
Chi-squared test for given probabilities (X-squared = 7.7869, df = 3, p-value =
0.05063)
The observed p-value suggests that the probability of a startup’s number of founding
members being irrelevant to acquiring customers abroad is very low. Startups with
more than one or two founding members display higher propensity in acquiring
customers from abroad.
Concluding this univariate analysis, it is noted once more that this is a preliminary
phase.
8. Bringing together the findings of the descriptive statistics and univariate
analysis on the two subcohorts
It is apparent that the startups belonging to the survival and customers abroad
subcohorts were not there by chance- they displayed specific features according to our
descriptive statistics and the univariate analysis.
18 20 176 2 0
32
48
26
6 21
0
10
20
30
40
50
60
70
80
1 2 3 4 5 6
Count
Number of Founders
Customers abroad‐Number of Founders
Yes No
36.00%29.41%
39.53%50.00% 50.00%
0.00%
64.00%70.59%60.47%
50.00% 50.00%
100.00%
0%
20%
40%
60%
80%
100%
1 2 3 4 5 6
Proportion
Number of Founders
Customers abroad‐Number of Founders
Yes No
40
The survival subcohort
The basic findings of the descriptive statistics for this subcohort (in comparison to the
total population of our data base) show that:
1) A larger share of founders were: mature (30-39); more educated; linked to
academia; educated in economics and business, science and theoretical studies;
holders of degrees related to the company sector and had experience abroad.
2) Among start-ups there was: a lower presence of the B2C customer type; and a
higher presence of high tech goods and processes, family members and
knowledge/capital resources.
According to the univariate analysis the three most important findings regarding the
survival subcohort were in order of importance that: business sector selection mattered
(different business sectors had different survival rates); and having a female member
in the founding team and headquarters abroad were seminal for survival.
The customers’ abroad sub- cohort
The descriptive statistics findings shows that compared to the total population of the
data base:
1) Regarding founders: there was a larger presence of the 30s age group; a more
diverse founder body and that experience abroad was substantially more
significant.
2) As for the firm specific indicators: far fewer firms were located in Athens; high
technology goods and production processes were more present (as is to be
expected); and finally services and B2C customer types were more important.
According to the univariate analysis the three most important findings regarding the
customers abroad subcohort were in order of importance, having: headquarters abroad,
founders with experience abroad and a ‘large’ number of founders.
In sum, there is some coincidence in attributes between the survival and customers
abroad subcohorts and the two diverse analytical methods are partly complementary
highlighting different aspects of these two ‘winner’ subcohorts.
41
9. Epilogue
On the basis of detailed descriptive statistics and univariate analysis (by Spiros
Paraskevas) we have examined in detail the features of early stage incubated
startuppers in Athens at a critical time period.
Our purpose has been to understand the key drivers of this emerging ecosystem as an
entity and in particular the forces making for the subcohorts of the startups group
defined by business success (aka survival) and internationalization (aka customers
abroad). Our findings are presented in summary form in Sections 5.3. and 8.
At the moment, as we are preparing for our next stage of research we would like to
share certain observations resulting from these first findings from our data base
analysis.
Firstly, the emergence of a novel nexus of ‘visionaries’ and (to use the terminology of
GEM report “opportunity” driven entrepreneurship. In Greece traditionally business is
oriented towards the domestic market, low technology processes and products/
services But this ecosystem which we have observed, though small in size diverged
from this pattern …within the sea of despair in the country and deepening
deindustrialization this enclave was a breath of fresh air and an emblem of hope.
Secondly, the existence of an entrepreneurial oriented sophisticated/well educated pool
of talent in Greece committed to high value/opportunity driven entrepreneurship that
actually in part ameliorates that large brain drain during the crisis as it has formed
links with neo-high knowledge emigrants abroad.
Thirdly, the high flexibility of this ecosystem and its ability to detect and unlock new
opportunities. Following the imposition of capital controls there was a slowdown in
startup births and pivoting in terms of headquarters while in the years following our
period of study there was an upturn in startup births as the economic climate
improved, and as a result, more than 150 startups from the selected incubators were
born.
Finally, we would like to note that certain findings are informative for policy makers.
Among them we would like to pinpoint the stronger links with academia in the
survival subcohort as well as the larger presence of female founders in this group.
Also, policy making should be informed by the fact that agricultural startups had a low
survival rate and this is something the country cannot afford given the huge food
deficit trade.

42
Regarding the customers abroad cohort among the most interesting findings are that
fewer startups had their headquarters in Athens, there was a larger presence of the 30s
age group and a higher presence of high technology goods and processes.
As we are writing the final words of this paper Greece, like the whole world is
experiencing the tragic covid-19 pandemic. This tragic development arrived at a
moment when the country was on an upward path exiting the ten year crisis. What can
contemporary startuppers learn from our study? The need for flexibility in a time of
rising nationalism and what are the keys for ‘internationalization (a much desired
objective of policy makers).
Our next step moving forward is clearly defined as we have already started data
collection and discussing the methodology pivoting. We are expanding our data base
so as to include incubees from all the incubators operating in Athens in the time period
examined 2010-2016 and we are also moving towards enhancing our quantitative
methodology with a multivariate analysis.
Of course we cannot cover everything and a number of questions remain unanswered.
Hopefully other researchers might turn to interesting questions such as mapping in
detail the moves towards digitalization, sources of funding for early stage startuppers,
types of innovation and business models.
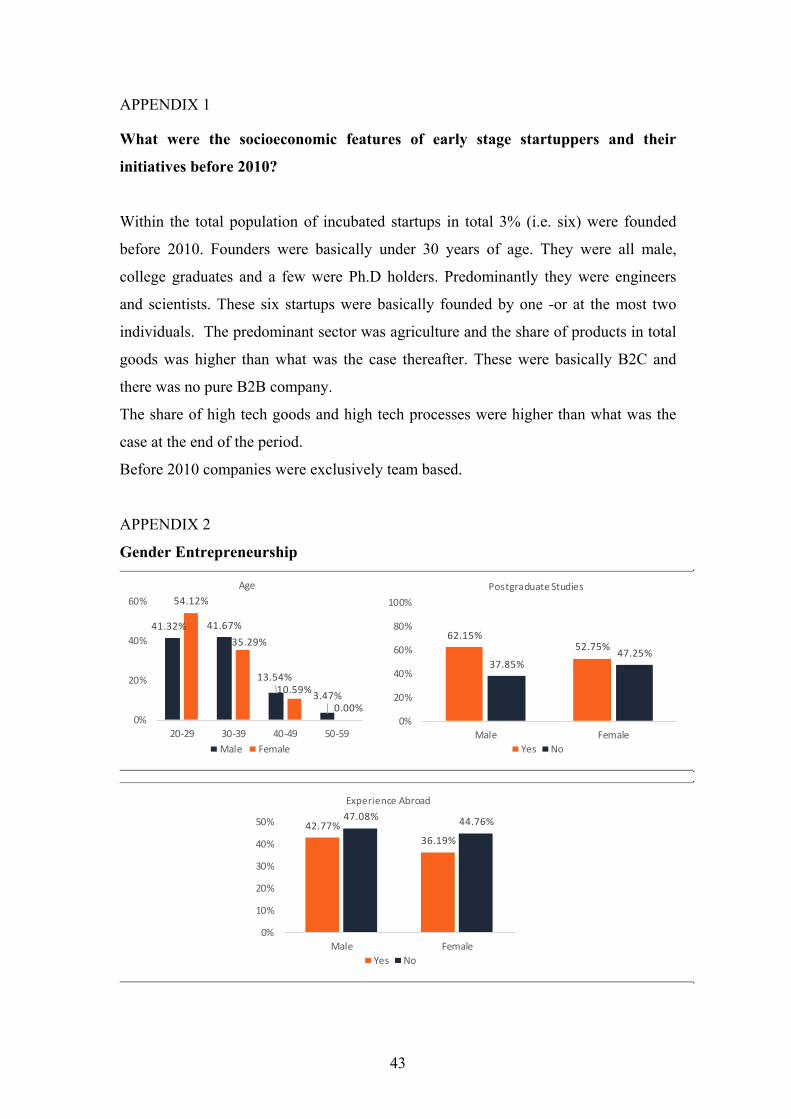
43
APPENDIX 1
What were the socioeconomic features of early stage startuppers and their
initiatives before 2010?
Within the total population of incubated startups in total 3% (i.e. six) were founded
before 2010. Founders were basically under 30 years of age. They were all male,
college graduates and a few were Ph.D holders. Predominantly they were engineers
and scientists. These six startups were basically founded by one -or at the most two
individuals. The predominant sector was agriculture and the share of products in total
goods was higher than what was the case thereafter. These were basically B2C and
there was no pure B2B company.
The share of high tech goods and high tech processes were higher than what was the
case at the end of the period.
Before 2010 companies were exclusively team based.
APPENDIX 2
Gender Entrepreneurship
41.32% 41.67%
13.54%
3.47%
54.12%
35.29%
10.59%
0.00%0%
20%
40%
60%
20‐29 30‐39 40‐49 50‐59
Age
Male Female
62.15%52.75%
37.85%47.25%
0%
20%
40%
60%
80%
100%
Male Female
Postgraduate Studies
Yes No
42.77%
36.19%
47.08% 44.76%
0%
10%
20%
30%
40%
50%
Male Female
Experience Abroad
Yes No
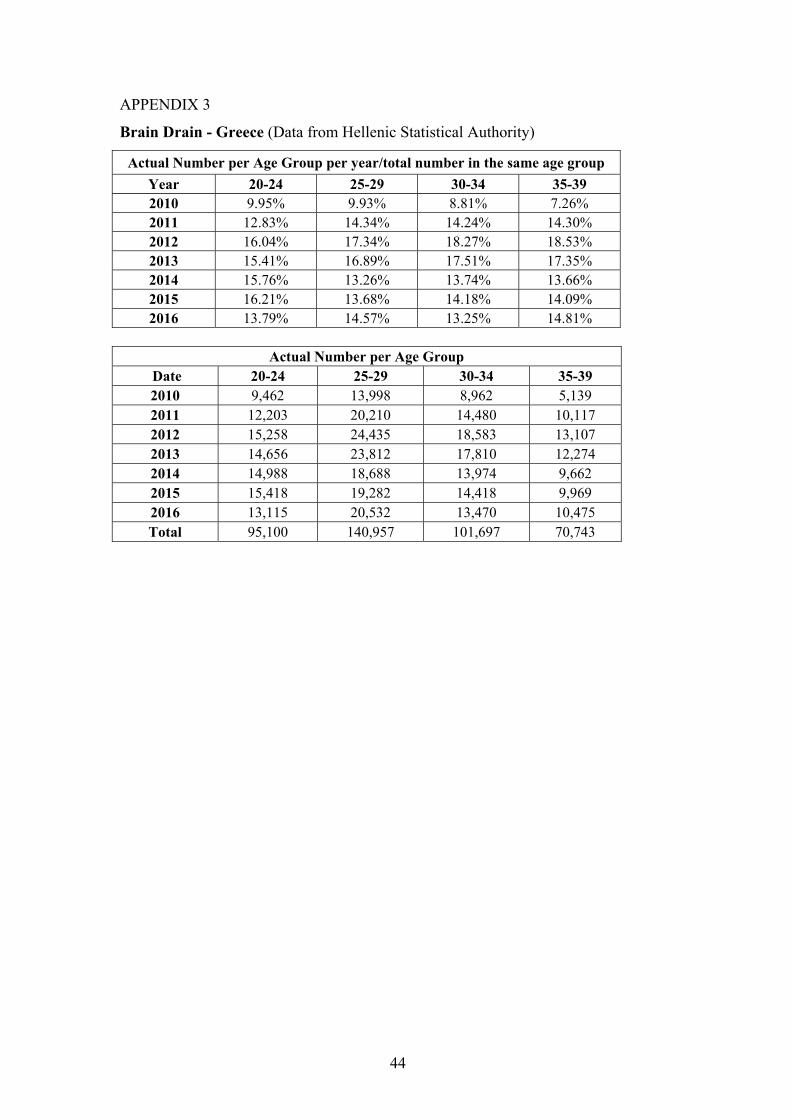
44
APPENDIX 3
Brain Drain - Greece (Data from Hellenic Statistical Authority)
Actual Number per Age Group per year/total number in the same age group
Year 20-24 25-29 30-34 35-39 2010 9.95% 9.93% 8.81% 7.26% 2011 12.83% 14.34% 14.24% 14.30% 2012 16.04% 17.34% 18.27% 18.53% 2013 15.41% 16.89% 17.51% 17.35% 2014 15.76% 13.26% 13.74% 13.66% 2015 16.21% 13.68% 14.18% 14.09% 2016 13.79% 14.57% 13.25% 14.81%
Actual Number per Age Group
Date 20-24 25-29 30-34 35-39 2010 9,462 13,998 8,962 5,139 2011 12,203 20,210 14,480 10,117 2012 15,258 24,435 18,583 13,107 2013 14,656 23,812 17,810 12,274 2014 14,988 18,688 13,974 9,662 2015 15,418 19,282 14,418 9,969 2016 13,115 20,532 13,470 10,475 Total 95,100 140,957 101,697 70,743

45
APPENDIX 4 Comparison of Greek Studies on the Startup Ecosystem (The papers are sorted in chronological order starting with the most recent)
Number Author and title of article/report Data baseTime period covered
Basic questions - Main Categories Other comments Overlapping Points
1
IOBE- Tsakanikas A., Giotopoulos I., Valavanioti E. & Stavraki S. (2019)-" Annual Entrepreneurship Report 2018-2019"
Global Entrepreneurship Monitor
2018-2019
A) Characteristics of early stage entrepreneurship B) The domestic business environment: National Experts' SurveyC) The role of the structural characteristics of the financial system from a business development perspective
Academic
Yes, slight overlapping (Characteristics of early stage entrepreneurship)Very Detailed
2Found.ation, EIT Digital & Velocity Partners (2019) "Startups in Greece: Re-mapping the investments landscape"
Not specified Not specified
A) General Data for the Greek EconomyB) Description of Equifund C) Characteristics of Companies that received funding through Equifund D) Comparison of Pre-Seed and Seed Stage Startups in Greece and Europe (Country, Gender, Size, Focus, Sector) E) FundingF) Mapping of Incubators, Accelerators, Co-Working Spaces and Competitions-HackathonsG) Top 10 funded startupsH) Profile of Early Stage Startups
Non-Academic
Yes, slight overlapping(Mapping, profile of early stage startups)Very Detailed
3Chris Gasteratos-Marathon VC (2019)"The Greek Startup Industry: Investments and Exits, 2010-2018"
301 firms268 VCs
2010-2018
A) Investment AmountsB) Investment RoundsC) Investments amounts per stageD) Investment rounds per stageE) Investment rounds per geographyF) Investment amounts per GeographyG) Average price per seed roundH) Geographical allocation of Greek startupsI) Investment rounds sourceJ) Amounts raised sourceK) Acquisitions and IPOs
Brief SurveyYes, slight overlapping (geographical allocation of Greek Startups)
4Chris Gasteratos-Marathon VC (2018)"Greek Founders Attributes"
143 firms (raised Financing)175 founders110 firms
2010-2017
A) Tech vs Non-TechB) Education LevelC) Education Level vs Startup SuccessD) Starting AgeE) Work Experience vs Startup SuccessF) Previous RoleG) Previous Role vs Startup Success
Brief Survey
Yes, slight overlapping (High Tech vs Low Tech, Education Level, Starting Age)

46
Number Author and title of article/report Data baseTime period covered
Basic questions - Main Categories Other comments Overlapping Points
5BCG-Antoniades V., Giakoumelos M., Petkakis T. & Zacharia Z. (2018) "Greece's Startup Ecosystem"
Used data from several sources
mainly 2012-2018
A) A snapshot of the Greek Startup EcosystemB) Problems that Startups face in GreeceC) BCG's Vision for the Greek StartupD) Introducing Policies to strenthen the Startup EcosystemE) How the policies will achieve their scope
Non-Academic, Policy-Oriented
No overlappingVery Detailed
6Chris Gasteratos-Marathon VC (2017)"Investments in Greek Startups"
137 firms 2010-2016A) Number of Investments RoundsB) Aggregate InvestmentsC) Acquisitions
Brief Survey No overlapping
7
Vlachopoulou, M., Ziakis, C. & Petridis, K. (2017), ICT Innovation Hub, "Startups: Characteristics and their interaction with the Greek startup ecosystem in Greece"
121 firms Not specified
General InformationA) Number of FoundersB) Number of EmployeesC) Legal EntityD) Location & Reasons of ChoiceE) SectorsF) Location of ClientsG) Time FrameCharacteristics of StartupsA) Motivation of creating a startupsB) Startups and Business PlanC) Origin of the IdeaD) Patentization of the idea E) Education of Founders F) Education of EmployeesG) Funding SourcesH) Types of CollaborationsI) Difficulties during InitiationReasons of Success of Startups in GreeceA) Comparative advantages of startupsB) Characteristics of FoundersC) Funding D) SupportE) EducationF) Government SupportG) Prospects of Success
Brief Survey
Yes, Overlapping(Number of Founders, Number of Employees, Location, Sectors, Education of Founders)

47
Number Author and title of article/report Data baseTime period covered
Basic questions - Main Categories Other comments Overlapping Points
8Stavros Lampropoulos (2015) "The startup ecosystem in Greece: An empirical investigation."
77 firms 2016
A)Number of FoundersB)Age of FoundersC)Age and Level of EducationD)Professional Experience per AgeE)Origination of the IdeaF)Average Number of Employees per YearG)Participation in Supporting StructuresH)Evaluation of Supporting StructuresI)FundingJ)Funding SourcesK)Evaluation of Greek Startup EcosystemL)Reasons that Impede the Development of Startups
Academic Workshop Presentation
Yes, slight Overlapping(Number of Founders, Age, Level of Education)
9Nikos Kanellos (2013) "Exploring the characteristics of knowledge-based enterpreneurs in Greece"
100 firms 2000-2010
A) Year of establishment B) Number of Employees C) Number of FoundersD) Highest Educational Attainment of Founders E) Founders' last Occupation Before Firm Establishment F) Main Areas of Expertise of Founders G) Factors Influencing Firm Formation H) Sources of Funding for Setting up the Company
Academic (Article)No overlapping (Different time period)
10
Vliamos, S. & Tzeremes, N. (2012) "Factors Influencing Entrepreneurial Process and Firm Start-Ups: Evidence from Central Greece"
164 firms - Central Greece
2005-2007
A) Factors determining entrepreneurial process and firms' formationB) Background of the EntrepreneurC) Problems Entrepreneur faced to startup businessD) Description of Process
AcademicNo overalapping (only Central Greece)
48
References
1. Albort-Morant, G. & Ribeiro-Soriano, D. (2015). A bibliometric analysis of international impact of business incubators. Journal of Business Research, 69(5), 1775-1779.
2. Antoniades, V., Giakoumelos, M., Petkakis, T. & Zacharia, Z. (2018). Greece’s Startup Ecosystem: A prime opportunity for economic growth. Boston Consulting Group.
3. Apergis, N., & Fafaliou, I. (2014). The determinants of business start-ups in tertiary education: evidence for Greece through a panel data approach. Journal of Economics and Finance, 38(2), 287-301.
4. Åstebro, T., & Bernhardt, I. (2003). Start-up financing, owner characteristics, and survival. Journal of Economics and Business, 55(4), 303-319.
5. Bakouros, Y. L., Mardas, D. C., & Varsakelis, N. C. (2002). Science park, a high tech fantasy?: an analysis of the science parks of Greece. Technovation, 22(2), 123–128
6. Bosma, N. & Kelley, D. (2019). Global Entrepreneurship Monitor Global Report
7. Burgel, O., & Murray, G. C. (2000). The international market entry choices of start-up companies in high-technology industries. Journal of International Marketing, 8(2), 33-62.
8. Cassis, Y. and Pepelasis Minoglou, I. (eds) (2006), Entrepreneurship: Country Studies. A Historical Perspective. Basingstoke, Palgrave Macmillan.
9. Cavusgil, S. T., & Knight, G. (2015). The born global firm: An entrepreneurial and capabilities perspective on early and rapid internationalization. Journal of International Business Studies, 46(1), 3-16.
10. Cefis, E., Marsili, O., (2003). “Survivor: The Role of Innovation in Firms’ Survival”. Discussion paper series 03-18. Tjalling C. Koopmans Research Institute.
11. Coeurderoy, R., Cowling, M., Licht, G., Murray G., (2012). “Young firm internationalization and survival: Empirical tests on a panel of ‘adolescent’ new technology-based firms in Germany and the UK”. International Small Business Journal 30(5): pp. 472–492.
12. Cook, R., Campbell, D., Kelly, C., (2012). “Survival Rates of New Firms: An Exploratory Study”. Small Business Institute Journal 8(2): pp. 35-42.
13. Enterprise Greece (2019). The Greek Start-up Scene: High caliber Greek start-up ecosystem ripe for investment.
14. Found.ation, EIT Digital & Velocity Partners. (2019). Startups in Greece 2019: Re-mapping the investments landscape
15. Tsakanikas, A., Giotopoulos, I., Valavanioti, E. & Stavraki, S. (2019). Annual Entrepreneurship Report 2018-2019: Entrepreneurship is enhanced, Foundation for Economic & Industrial Research
16. Kanellos S. N. (2013). Exploring the Characteristics of Knowledge-based Entrepreneurs in Greece, 73, 337-344
49
17. Lambropoulos, S., (2015). Startup Environment in Greece: An empirical investigation. Laboratory of Industrial and Energy Economy
18. Max Kuhn; Kjell Johnson, Applied Predictive Modeling, May 2013, Springer New York.
19. Mian, S. A. (1996). Assessing value-added contributions of university technology business incubators to tenant firms. Research policy, 25(3), 325-335.
20. Nicolò D., Nania I., (2017). “Risk, Capitalization and Survival of Young Firms: Empirical Survey of Italian Companies” Conference paper. DIEM: Dubrovnik International Economic Meeting, Vol. 3 No. 1.
21. Pepelasis, I.S., Besis, I., Bournakis, I. and Papanastassiou, M. (2019) Taking off through internationalization in the Crisis? Aspiring Entrepreneurs and their start-up initiatives within the incubation ecosystem in Greece: 2010-2016, Poster Session, 7th Reading-UNCTAD International Business Conference, Henley Business School at the University of Reading, UK, April 2019
22. Pepelasis, I. S., & Protogerou, A. (2018). A break with the past? The shift from inward�looking to internationally competitive and born global firms in Greece during the crisis. Managerial and Decision Economics, 39(8), 879-887.
23. Protogerou, A., Caloghirou, Y., & Markou, F. (2015). Entrepreneurial ventures in the creative industries: A case study approach. Paper presented at the 27th EAEPE Conference, Genoa, Italy.
24. Ratinho, T. and Mitsopoulos, M, (2017), Emerging Models of Business Incubation: The Case of Greece, (SSRN)
25. Sofouli, E., & Vonortas, N. S. (2007). S&T Parks and business incubators in middle-sized countries: the case of Greece. The Journal of Technology Transfer, 32(5), 525-544.
26. Tortella, G. & Quiroga, G. (eds) (2013), Entrepreneurship and Growth: An International Historical Perspective. Basingstoke, Palgrave
27. Vlachopoulou, M., Ziakis, C. & Petridis, K. (2017), Greek Startup Ecosystem: "Startups: Characteristics and their interaction with the Greek startup ecosystem in Greece”, ICT Innovation Hub
28. Vliamos, S. J., & Tzeremes, N. G. (2012). Factors influencing entrepreneurial process and firm start-ups: evidence from central Greece. Journal of the Knowledge Economy, 3(3), 250-264.
Web-based Sources 1. General Sources
1.1. Global Entrepreneurship Monitor, www.gemconsortium.org/country-profile 1.2. Hellenic Statistical Authority, https://www.statistics.gr/en/home/ 1.3. EU Startups, https://www.eu-startups.com/
2. Incubators-VCs
2.1. Acein, https://acein.aueb.gr/
50
2.2. Aephoria.net, http://www.aephoria.net 2.3. Athens Startup Business Incubator, http://www.theathensincube.gr/ 2.4. Corallia, http://www.corallia.org/en/ 2.5. EGG, https://www.theegg.gr/el 2.6. Ekinisi Lab, http://ekinisilab-sev.gr/ 2.7. Equifund, https://equifund.gr/ 2.8. Industry Disruptors, http://industrydisruptors.org/ 2.9. Innovathens, https://www.innovathens.gr/ 2.10. Invent ICT, http://inventict.gr/ 2.11. Iqbility, https://www.iqbility.com/ 2.12. Marathon VC, https://marathon.vc/blog/greek-founders-attributes 2.13. Marathon VC, https://marathon.vc/blog/investments-in-greek-startups 2.14. Marathon VC, https://marathon.vc/blog/greek-startup-industry-en 2.15. Metavallon, https://metavallon.vc 2.16. Microsoft Innovation Center, https://www.microsoft.com/el-gr/mic 2.17. STARTUP HEATMAP EUROPE, https://www.eu-startups.com/ 2.18. MIT Enterprise Forum of Greece, https://www.mitefgreece.org/ 2.19. NBG Business Seeds, https://www.nbg.gr/el/nbgseeds 2.20. Orange Grove, https://orangegrove.eu/
3. Other Sources The following electronic sources have also been mined in order to gain information on
the incubated startups and their initiatives in order to proceed in a thorough analysis using Facebook, LinkedIn and selected articles in the Press.
3.1. Facebook, https://el-gr.facebook.com/ 3.2. LinkedIn, https://www.linkedin.com/
Selection of more 100 articles from: 3.3. Emea, https://emea.gr/ 3.4. Epixeiro, https://www.epixeiro.gr/ 3.5. Fortune Greece, https://www.fortunegreece.com/ 3.6. Huffington Post Greece, https://www.huffingtonpost.gr/ 3.7. Kathimerini, https://www.kathimerini.gr/ 3.8. Startupper, https://startupper.gr/