Wind Power on Campus. Overview Started Fall of 2007 with Impact on Society Groups Testing and...
12
Wind Power on Campus
-
date post
19-Dec-2015 -
Category
Documents
-
view
214 -
download
0
Transcript of Wind Power on Campus. Overview Started Fall of 2007 with Impact on Society Groups Testing and...

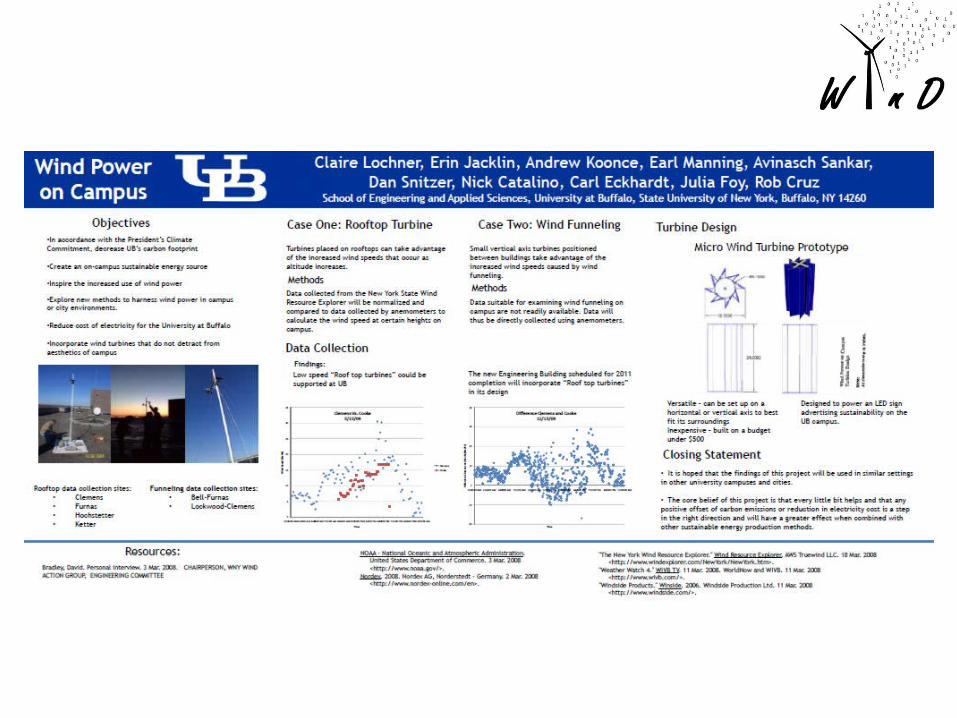
Wind Power on Campus
Overview
• Started Fall of 2007 with Impact on Society Groups
• Testing and comparing:– “Wind Funneling”– Roof top conditions– Commercial turbines
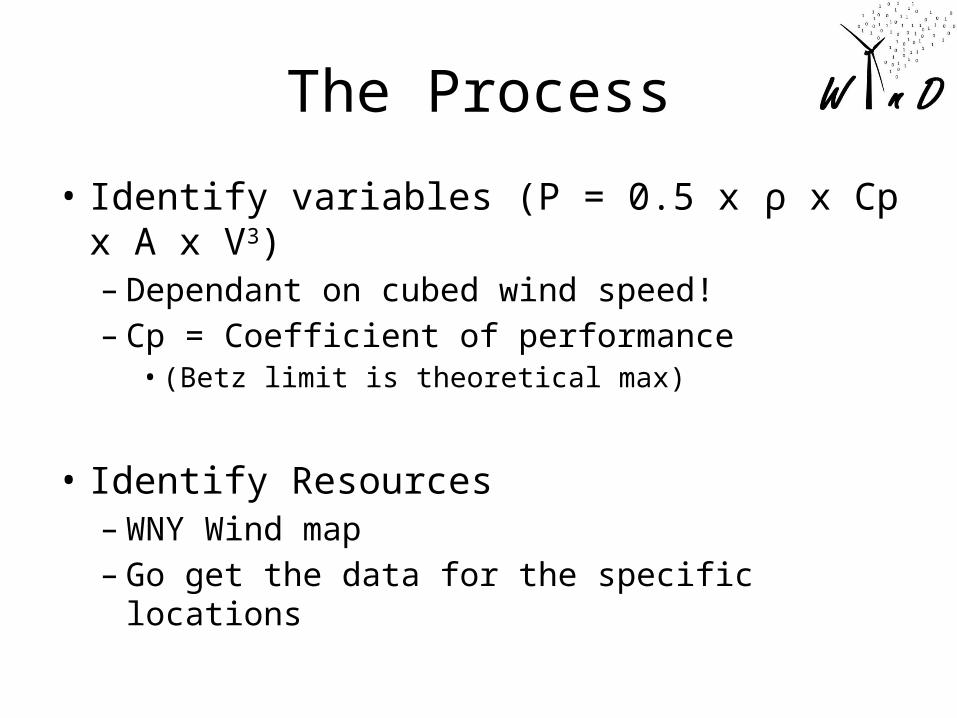
The Process
• Identify variables (P = 0.5 x ρ x Cp x A x V3)– Dependant on cubed wind speed!– Cp = Coefficient of performance• (Betz limit is theoretical max)
• Identify Resources– WNY Wind map– Go get the data for the specific locations
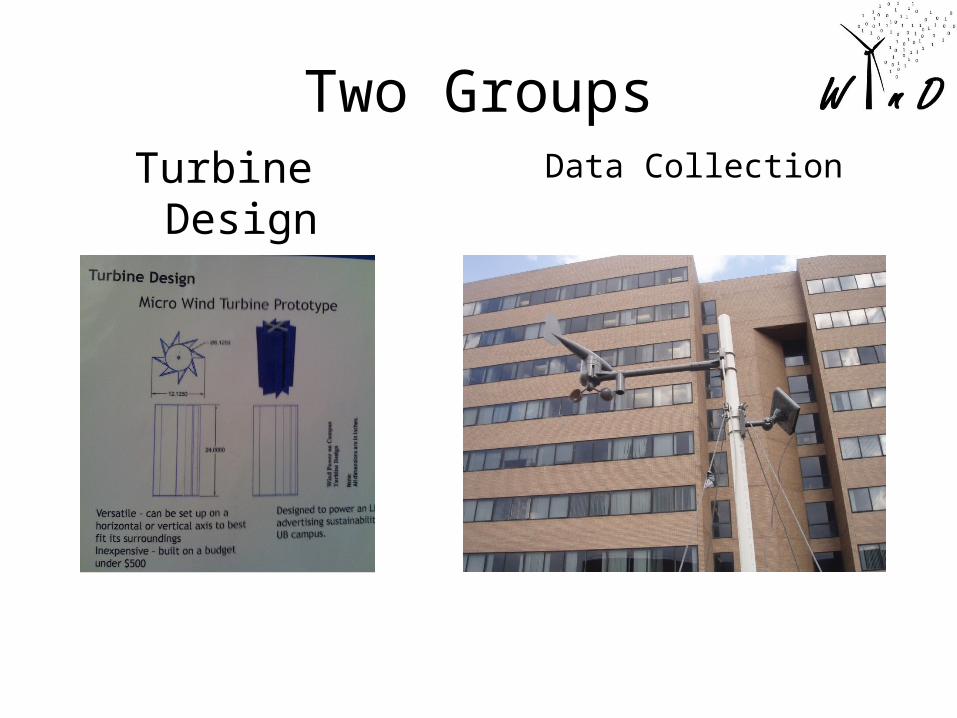
Two GroupsTurbine Design Data Collection
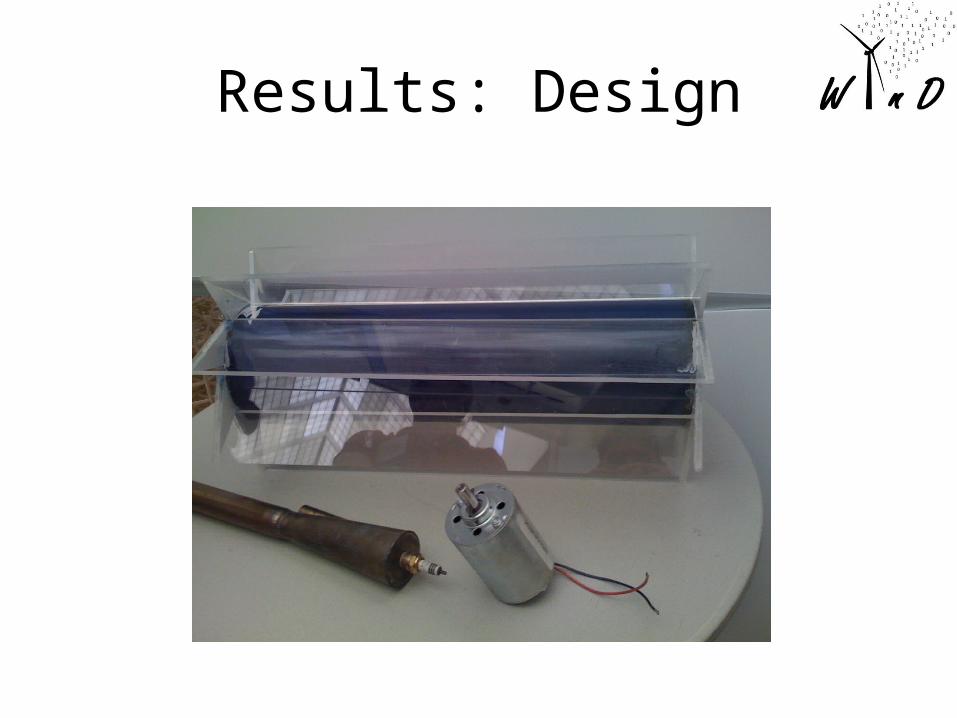
Results: Design
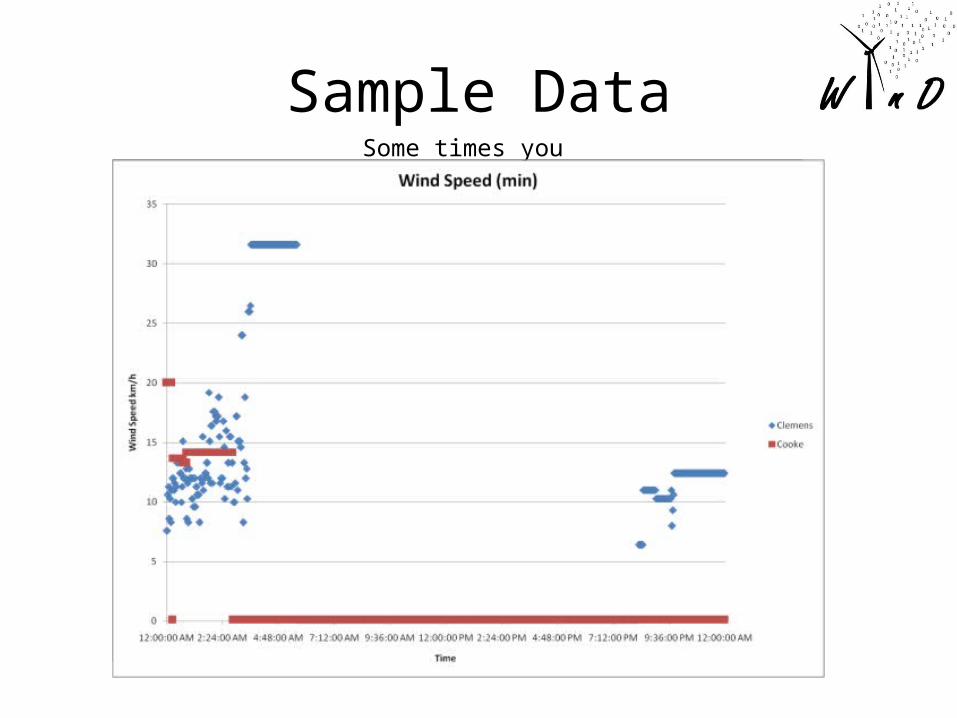
Sample DataSome times you get:
Good
Not so good…
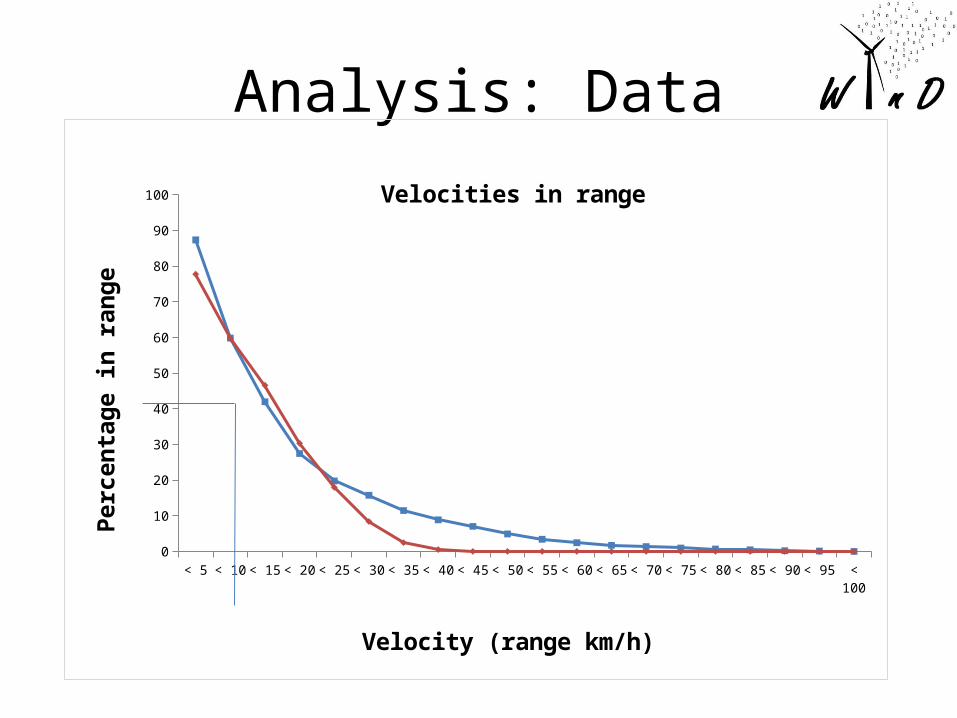
Analysis: Data
< 5 < 10 < 15 < 20 < 25 < 30 < 35 < 40 < 45 < 50 < 55 < 60 < 65 < 70 < 75 < 80 < 85 < 90 < 95 < 1000
10
20
30
40
50
60
70
80
90
100 Velocities in range
Velocity (range km/h)
Perc
enta
ge in
rang
e
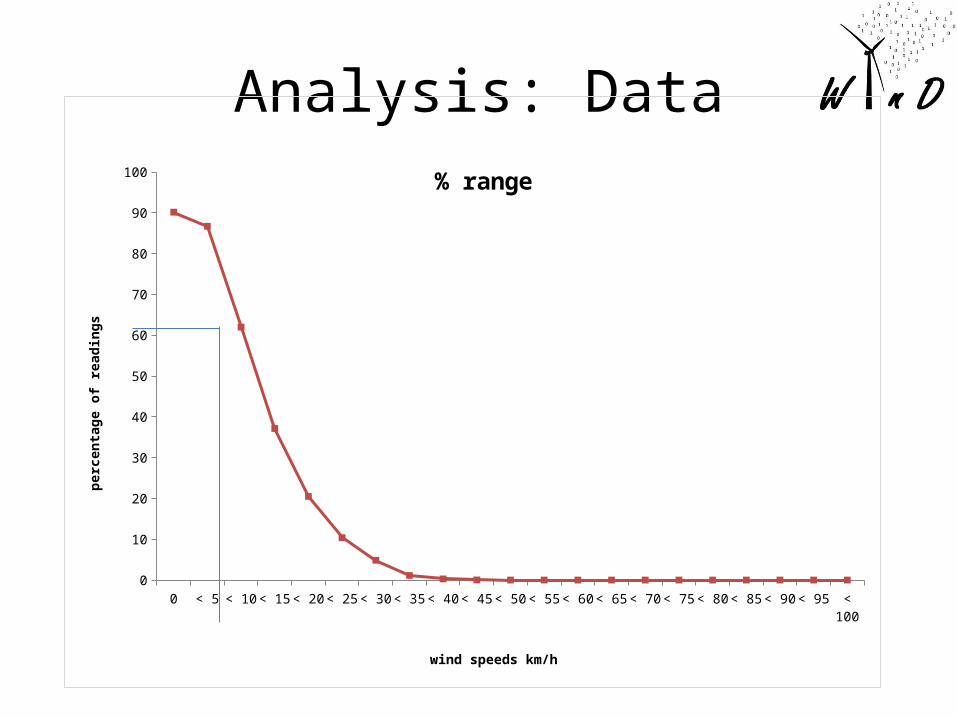
Analysis: Data
0 < 5 < 10 < 15 < 20 < 25 < 30 < 35 < 40 < 45 < 50 < 55 < 60 < 65 < 70 < 75 < 80 < 85 < 90 < 95 < 1000
10
20
30
40
50
60
70
80
90
100 % range
wind speeds km/h
perc
enta
ge o
f rea
ding
s
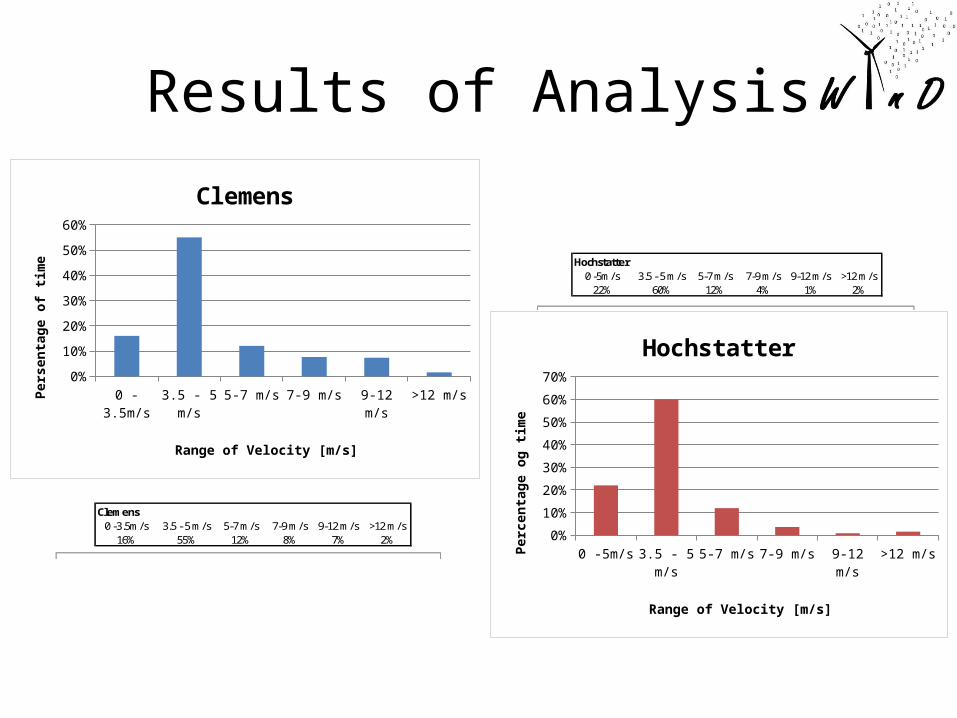
Results of Analysis
Clemens0 -3.5m/s 3.5 - 5 m/s 5-7 m/s 7-9 m/s 9-12 m/s >12 m/s
16% 55% 12% 8% 7% 2%
Clemens
Hochstatter0 -5m/s 3.5 - 5 m/s 5-7 m/s 7-9 m/s 9-12 m/s >12 m/s
22% 60% 12% 4% 1% 2%
0 -3.5m/s 3.5 - 5 m/s 5-7 m/s 7-9 m/s 9-12 m/s >12 m/s0%
10%
20%
30%
40%
50%
60%
Clemens
Range of Velocity [m/s]
Pers
enta
ge o
f tim
e
0 -5m/s 3.5 - 5 m/s 5-7 m/s 7-9 m/s 9-12 m/s >12 m/s0%
10%
20%
30%
40%
50%
60%
70%
Hochstatter
Range of Velocity [m/s]
Perc
enta
ge o
g tim
e
Where can you find data and more information
• Email [email protected]• www.wings.buffalo.edu/~dsnitzer/wind