
Western Blot Antibody Customer Review for β-actin Monoclonal Antibody (STJ96941)

Identification of a novel microRNA-141-3p/Forkhead box C1/β-
catenin axis associated with rheumatoid arthritis synovial fibroblast
function in vivo and in vitro
Jun Wang1, Yin Wang2, Hui Zhang1, Jun Chang3, Ming Lu1, Weilu Gao1,
Wendong Liu4, Yetian Li1, Li Yin1, Xiaohe Wang1, Yuejun Wang5, Mengru
Gao5, Zongsheng Yin1
Correspondence to:
Professor Zongsheng Yin, Department of Orthopaedics, The First
Affiliated Hospital of Anhui Medical University, 218 JiXi Road, Hefei,
Anhui 230022, China.
Tel.: +86 13866757532
E-mail: [email protected]
Author affiliations:
1. Department of Orthopaedics, The First Affiliated Hospital of Anhui
Medical University, Anhui, China
1
1
2
3
4
5
6
7
8
9
10
11
12
13
14
15
12

2. Department of Plastic Surgery, The Fourth Affiliated Hospital of
Anhui Medical University, Anhui, China
3. Department of Orthopaedics, The Fourth Affiliated Hospital of Anhui
Medical University, Anhui, China
4. Department of Radiology, The First Affiliated Hospital of Anhui
Medical University, Anhui, China
5. Department of Pathology, The Fourth Affiliated Hospital of Anhui
Medical University, Anhui, China
Keywords: rheumatoid arthritis, FoxC1, miR-141-3p, synovial
fibroblasts, collagen-induced arthritis
Abstract
Rationale: Rheumatoid arthritis (RA) is a prototype of inflammatory
arthritis in which synovial fibroblasts (SFs) play key roles in cartilage and
bone destruction through tumor-like proliferation, migration, invasion
and inflammation. This study aimed to research forkhead box protein C1
2
16
17
18
19
20
21
22
23
24
25
26
27
28
29
30
34

(FoxC1) and microRNA (miR)-141-3p, which modulate pathological
changes in the synovial membrane, to find possible strategies for treating
RA.
Methods: FoxC1, β-catenin and miR-141-3p gene expression in synovial
tissues and SFs was quantified by real-time PCR; FoxC1 and β-catenin
protein levels were evaluated by immunohistochemistry,
immunofluorescence, and Western blotting. We transiently transfected
human SFs with FoxC1 and β-catenin overexpression and silencing
vectors and assessed proliferation, migration, invasion and inflammation
by cell function and enzyme-linked immunosorbent assays. We also
assessed downstream signaling activation using immunofluorescence,
real-time PCR and Western blotting. Double luciferase,
coimmunoprecipitation and chromatin immunoprecipitation assays were
used to verify miR-141-3p, FoxC1 and β-catenin gene and protein
combinations. Finally, the therapeutic effects of FoxC1 silencing and
miR-141-3p overexpression were evaluated in type II collagen-induced
arthritis (CIA) rats.
Results: We found that FoxC1 expression was significantly upregulated
in synovium and SFs in both RA patients and rats with collagen-induced
arthritis (CIA). FoxC1 overexpression increased β-catenin messenger
RNA (mRNA) and protein levels and upregulated cyclin D1, c-Myc,
fibronectin and matrix metalloproteinase 3 (MMP3) mRNA and protein
3
31
32
33
34
35
36
37
38
39
40
41
42
43
44
45
46
47
48
49
50
51
52
56
expression in RA SFs (RASFs). In contrast, FoxC1 knockdown reduced
β-catenin mRNA and protein levels as well as cyclin D1, c-Myc, and
fibronectin mRNA and protein levels in RASFs. Furthermore, altering
FoxC1 expression did not significantly change GSK3β and pGSK3β
levels. FoxC1 overexpression promoted proliferation, migration, invasion
and proinflammatory cytokine (interleukin (IL)-1β, IL-6, and tumor
necrosis factor-α (TNF-α)) production and reduced anti-inflammatory
cytokine (IL-10) levels in RASFs. FoxC1 bound to the β-catenin
promoter, and β-catenin mediated the FoxC1-induced
pathological changes. We also observed downregulated microRNA
(miR)-141-3p expression in SFs from both RA patients and CIA rats and
further found that miR-141-3p bound to the FoxC1 3′UTR and
suppressed FoxC1 expression. Intra-ankle miR-141-3p agomir or FoxC1-
specific siRNA injection hindered CIA development in rats.
Conclusions FoxC1 and miR-141-3p participate in RA pathogenesis by
mediating inflammation and SF proliferation, migration, and invasion and
thus could be novel targets for RA therapy as a nonimmunosuppressive
approach.
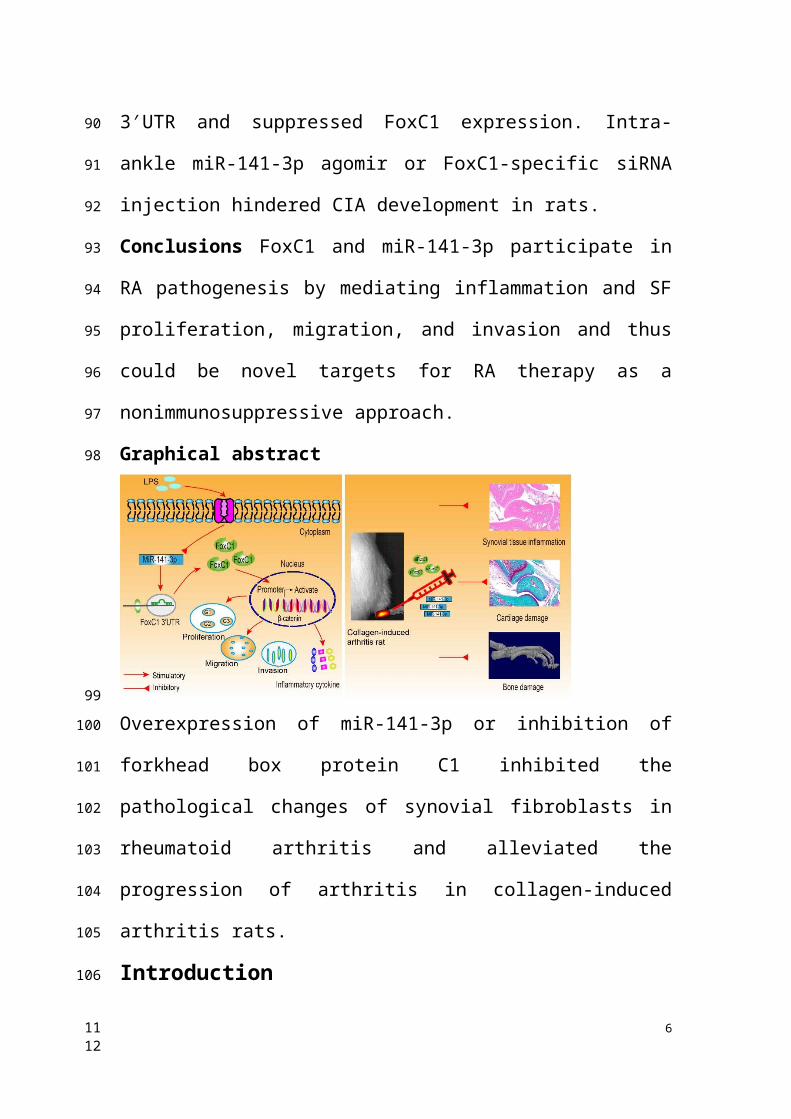
Graphical abstract
4
53
54
55
56
57
58
59
60
61
62
63
64
65
66
67
68
69
70
71
78
Overexpression of miR-141-3p or inhibition of forkhead box protein C1
inhibited the pathological changes of synovial fibroblasts in rheumatoid
arthritis and alleviated the progression of arthritis in collagen-induced
arthritis rats.
Introduction
Rheumatoid arthritis (RA), a prototype disease for the study of
inflammatory arthritis, is characterized by increased synovial
inflammation and progressive cartilage and bone resorption, which lead
to chronic inflammation, poor joint health and unfavorable prognoses [1].
Research on RA has resulted in immunotherapies targeting inflammatory
and immune signaling pathways and pathogenic components, and while
these treatments are effective, few patients with RA are able to maintain
remission without drugs [2]. Innovative treatment options are needed to
gain new insights into the pathogenesis of the disease and identify
potential new treatments.
Synovial inflammation is caused by infiltration of innate and adaptive
5
7273
74
75
76
77
78
79
80
81
82
83
84
85
86
87
88
910
immune cells, including activated resident synovial fibroblasts (SFs), and
is the major pathological change of RA [3-5]. The main role of SFs is to
provide synovial tissue structural support, secrete synovial fluid to
lubricate joints, reduce frictional movements, and nourish avascular
cartilage [6, 7]. However, in the synovial membrane of RA, SFs are
activated and show the characteristics of reduced apoptosis, migration,
and invasion, becoming the main effector cells of invasive pannus and
actively participating in the inflammatory process of RA [8, 9]. These
activated SFs exhibit an aggressive phenotype with a tumor-like
appearance and play major roles in RA by producing proinflammatory
cytokines such as IL-1β [10], TNF-α [11] and IL-6 [12, 13] as well as
matrix metalloproteinases and angiogenic factors [14]. Similar to other
types of cells with malignant tumor phenotypes, RASFs have an inherent
capability to resist a repellent synovial environment, which is rich in
oxygen free radicals and other toxic metabolites under hypoxic conditions
[15, 16]. Thus, changes in the RASF phenotype, which promotes the
formation of synovial pannus and invades adjacent cartilage and bone, are
key to RA formation. The currently available drugs for RA may not
directly target the disordered RASF phenotype, resulting in a lack of
treatments for patients with this phenotype. The specific activation
mechanism of RASFs is still unknown, but recent studies have found that
the Wnt/β-catenin pathway may be involved in the activation of RASFs
6
89
90
91
92
93
94
95
96
97
98
99
100
101
102
103
104
105
106
107
108
109
110
1112
and RA pathogenesis [17, 18]. The Wnt/β-catenin pathway plays an
important role in the regulation of cell growth, proliferation, migration,
differentiation, self-renewal, homeostasis, and embryonic development,
as well as the occurrence and development of various malignant tumors
[19, 20]. In the normal physiological function of tissues and organs,
Wnt/β-catenin is usually inactivate. However, when tissues and organs
are damaged, Wnt/β-catenin is often activated [21, 22]. β-catenin
expression is widely regarded as a sentinel marker under pathological
conditions of the Wnt/β-catenin pathway [23, 24].
The members of the Forkhead box (Fox) transcription factor family
share a 100-amino acid winged helix DNA-binding domain that plays an
important role in metabolism, differentiation, proliferation, apoptosis,
migration, invasion and longevity in cells [25]. Recent studies have
shown that the Fox family member FoxC1 participates in mesoderm,
brain and eye development during embryogenesis [26, 27] and may be
important in cancer pathology [28, 29]. Researchers have found that NF-
κB signaling mediates the function of FoxC1 during basal-like breast
cancer (BLBC) cell proliferation and invasion [30]. IL-8 activates FoxC1
expression via the PI3K/AKT pathway and via hypoxia-inducible factor 1
alpha, and FoxC1 expression induces CXCR1 and CCL2 transactivation
and promotes inflammation in hepatocellular carcinoma (HCC) and the
migration and invasion of HCC cells [31]. FoxC1 also promotes
7
111
112
113
114
115
116
117
118
119
120
121
122
123
124
125
126
127
128
129
130
131
132
1314
proliferation, migration, invasion and drug resistance in HCC [32] and
lung cancer [33]. These findings highlight the role of FoxC1 in tumor
formation and progression; however, the role of FoxC1 in RASFs
remains unclear.
MicroRNAs (miRNAs or miRs) are short (~22 nucleotides long)
noncoding RNAs that, as post-transcriptional regulators, play a key role
in a variety of cellular functions. MiRNAs primarily silence target genes
by binding to the 3' untranslated region (3′UTR) or 5' untranslated region
(5′UTR) of messenger RNA (mRNA) and specifically inhibiting mRNA
translation or inducing mRNA degradation [34]. Thus far, numerous
studies have shown that miRNA dysfunction is associated with
inflammatory and autoimmune diseases [35]. For example, research has
revealed that miR-155 [36], miR-146a [37], miR-20a [38], miR-124 [39]
and miR-223 [40] are differentially expressed in arthritis models,
suggesting the importance of their roles in balancing immune activation
and RA pathogenesis [41]. Therefore, miRNAs have attracted extensive
attention as potential therapeutic targets, and their sequence-specific
patterns enable the simultaneous targeting of multiple genes [42].
In this study, we explored the effects of FoxC1 on tumor-like properties
and inflammatory responses of RASFs and the potential underlying
mechanisms. We found that RASFs exhibited strong proliferation and
migration capabilities that were decreased by FoxC1 knockdown. In
8
133
134
135
136
137
138
139
140
141
142
143
144
145
146
147
148
149
150
151
152
153
154
1516
addition, upon FoxC1 silencing, proinflammatory factors (IL-1β, IL-6,
and TNF-α) were downregulated, while an anti-inflammatory factor (IL-
10) was upregulated. FoxC1 interacted directly with β-catenin to activate
canonical Wnt signaling, and regulating the expression of β-catenin
reverses a series of pathological changes caused by FoxC1. Furthermore,
miR -141-3p was found to bind to the FoxC1 3'UTR and mediates FoxC1
and β-catenin expression. These results show that the miR-141-
3p/FoxC1/β-catenin pathway is associated with RA pathogenesis and
may provide new biomarkers and therapeutic targets for RA research and
treatment.
Materials and methods
Acquisition of synovial specimens of joints
Normal synovium tissues were obtained from amputees (n=4) or patients
requiring arthroscopic knee surgery (n=6). Patients with other
musculoskeletal disorders were excluded. RA-associated human articular
synovium samples were obtained from patients (n=20) who fulfilled the
American College of Rheumatology criteria for the classification of RA
[43] and who were undergoing total knee joint arthroplasty surgery. The
study was conducted under the guidance of the Helsinki and Tokyo
Declarations of Human Rights. All human studies were conducted upon
receiving informed consent from the patients and approved by the
institutional ethics review committee of the First Affiliated Hospital of
9
155
156
157
158
159
160
161
162
163
164
165
166
167
168
169
170
171
172
173
174
175
176
1718
Anhui Medical University. The basic information for the patients is
shown in Table S1.
Cell isolation and culture
SFs were isolated from synovial tissues of patients as previously
described [44]. To ensure good biological function of the SFs, primary
cells were used after 3-5 passages. To confirm the identity of isolated
SFs, antibodies targeting vimentin (BD Bioscience) and CD68 (BD
Bioscience) were used to detect the expression levels via flow cytometry.
Normal SFs (2×10⁵ cells) were stimulated with 1 mL of medium alone or
with medium containing lipopolysaccharide (LPS; 1 μg/mL).
Histological, immunohistochemical and immunofluorescence
analyses
Synovial tissues were fixed in 4% paraformaldehyde (Beyotime,
Shanghai, China) at 4 °C and embedded in paraffin. Six-micrometer-thick
tissue sections were stained with hematoxylin and eosin (HE). The
paraffin-embedded sections were processed, further stained with anti-
FoxC1 antibodies (ab223850, Abcam, Cambridge, UK), β-catenin
(D10A8) XP® rabbit mAbs #8480 (Cell Signaling, Beverly, MA, USA),
anti-IL-1β antibodies (ab9722) (Abcam), anti-IL-6 antibodies (ab9324)
(Abcam), anti-TNF-α antibodies (ab6671) or anti-IL-10 antibodies
(ab192271) (Abcam), and then incubated with secondary antibodies
(ZSGB-BIO, Beijing, China) and immunohistochemical staining
10
177
178
179
180
181
182
183
184
185
186
187
188
189
190
191
192
193
194
195
196
197
198
1920
substrates, as previously described [45]. Imaging was performed using an
Olympus IX81 imaging system. Staining intensity was semiquantitated
using the H-score method as described previously [46-48]. Two
pathologists who were blinded to the clinicopathological information
examined and scored all the immunostained sections. Ten randomly
selected fields of view at a magnification of 400× were observed. The
staining intensity was scored as follows [46-48]: 0, none; 1+, weak; 2+,
medium; and 3+, strong. The total number of cells and the number of
stained cells at each intensity were counted for each field of view. The H-
score was calculated according to the following formula: (Percentage of
cells stained at intensity classification 1 × 1) + (Percentage of cells
stained at intensity classification 2 × 2) + (Percentage of cells stained at
intensity classification 3 × 3). H-scores range from 0 to 300, with 300
indicative of 100% of cells with strong staining (3+). High protein
expression was defined as H-scores of ≥200.
For immunofluorescence analysis, SFs were plated at a density of 10,000
cells/well in a 12-well cell culture plate (Corning Incorporated, Corning,
NY, USA) with coverslips. After treatment, the cells were fixed with 4%
paraformaldehyde (Beyotime) at room temperature for 20 min and
incubated with anti-FoxC1 antibodies (ab223850) (Abcam, Cambridge,
UK) or β-catenin (D10A8) XP® rabbit mAbs #8480 (Cell Signaling,
Beverly, MA, USA) at 4 °C overnight. The cells were then incubated
11
199
200
201
202
203
204
205
206
207
208
209
210
211
212
213
214
215
216
217
218
219
220
2122
with a FITC-conjugated secondary antibody (ZSGB-BIO, Beijing, China)
for 1 h and with DAPI (Beyotime) to stain the nuclei. The fluorescence
was observed under a fluorescence microscope (Olympus IX81, Japan).
Quantitative real-time PCR (qRT-PCR)
Total RNA was extracted from synovial tissues or SFs with 1000 μL of
TRIzol Reagent (Invitrogen, USA) and then treated with DNase (Thermo
Scientific). Next, the RNA concentration was quantified on a NanoDrop
One (Thermo Scientific), and equal amounts of total RNA (500 ng) were
reverse-transcribed to synthesize cDNA in a total reaction volume of 10
μL per sample using a PrimeScriptTM RT Reagent Kit (Takara, Dalian,
China). Then, qRT-PCR analyses of the target genes were performed
using a SYBR® Premix Ex TaqTM II Kit (Takara, Dalian, China) in 20 μL
reactions containing SYBR (10 μL), primers (0.8 μL each of the forward
and reverse primers), cDNA template (2.0 μL) and ddH2O (6.0 μL). The
PCR program included an activation step at 95 °C for 30 s followed by 40
cycles of 5 s at 95 °C and 34 s at 60 °C. Target mRNA expression was
normalized to β-actin expression in each sample and compared to the
control sample.
MiRNA reverse transcription was performed using a TaqMan MicroRNA
RT kit (Life Technologies), and qRT-PCR was performed using TaqMan
Universal Master Mix (Life Technologies) according to the kit
instructions. Each 15 μL RT reaction contained 10 ng of total RNA (5
12
221
222
223
224
225
226
227
228
229
230
231
232
233
234
235
236
237
238
239
240
241
242
2324
μL), 0.15 μL of each dNTP (100 mM total), 1.0 μL of MultiScribe RT (50
U/μL), 50 nM stem-loop reverse transcriptase primers (3.0 μL each), 0.19
μL of RNase inhibitor (20 U/μL), 1.5 μL of 10×RT buffer and 4.16 μL of
nuclease-free water; the reactions were incubated for 30 min at 16 °C, 30
min at 42 °C, and 5 min at 85 °C. For qRT-PCR, 10.0 μL of TaqMan
Universal PCR Master Mix, 1.33 μL of cDNA, 1.0 μL of primer and 7.67
μL of nuclease-free water were combined in 20 μL reactions, and the
reaction program consisted of a single step of 10 min at 95 °C and 40
cycles of 15 s at 95 °C and 60 s at 60 °C.
The relevant primer sequences are shown in Table S2. The relative
quantity for each experiment was calculated automatically using the
comparative quantitation mode of MxPro qRT-PCR system software. The
relative mRNA expression was calculated using the 2-ΔΔCt method. At
least three independent experiments were performed and analyzed.
Western blotting
Synovium and SFs were lysed using RIPA buffer (Beyotime, China)
supplemented with a protease inhibitor cocktail (Beyotime), and the
extraction of SF nuclear proteins was performed according to the method
of the nuclear protein extraction kit (Beyotime). The total and nuclear
protein concentrations were determined using a BCA protein assay kit
(Beyotime) according to the manufacturer’s instructions. Thirty
micrograms of protein per sample was separated by SDS-PAGE, and the
13
243
244
245
246
247
248
249
250
251
252
253
254
255
256
257
258
259
260
261
262
263
264
2526
separated proteins were transferred onto 0.45 μm PVDF membranes
(ImmobilonTM, Millipore Corp, Bedford, MA). After the membrane was
sealed with milk, the corresponding protein bands were cut out according
to the marker and then incubated overnight at 4 °C in the corresponding
primary antibodies as follows: anti-FoxC1 (ab223850, Abcam,
Cambridge, UK); anti-FoxC1 (ChIP grade, ab5079, Abcam); anti-
fibronectin (ab45688, Abcam); anti-MMP3 (ab52915, Abcam) and anti-
histone H3 (ab61251, Abcam); anti-β-catenin (D10A8, Cell Signaling,
Beverly, MA, USA); anti-GSK-3α/β (D75D3, Cell Signaling); anti-c-
Myc (D84C12, Cell Signaling); anti-cyclin D1 (#2922, Cell Signaling);
anti-β-actin (8H10D10, Cell Signaling) and anti-GAPDH (D16H11, Cell
Signaling). The antibodies were detected using HRP-conjugated
secondary antibodies anti-mouse IgG (#7076, Cell Signaling) or anti-
rabbit IgG (#7074, Cell Signaling). A super-sensitive chemiluminescence
(ECL) kit (Tanon, Shanghai, China) was used to detect
chemiluminescence signals. We used ImageJ software (National Institutes
of Health, USA) to quantify the gray values.
SiRNA and miRNA transfection
Small interfering RNAs (siFoxC1 and siβ-catenin) were used to inhibit
the expression of FoxC1 and β-catenin. miR-141-3p mimic and miR-141-
3p inhibitor were used to overexpress and inhibit miR-141-3p. All of
these compounds and the corresponding negative controls (negative
14
265
266
267
268
269
270
271
272
273
274
275
276
277
278
279
280
281
282
283
284
285
286
2728
control siRNA, negative control miRNA) were purchased from RiboBio
(Guangzhou, China). According to the manufacturer's protocol
(RiboBio), the siRNAs, miRNA mimic, miRNA inhibitor and negative
controls were transfected into SFs using the riboFECT™ CP Transfection
Kit (RiboBio) at an effective concentration of 50 nM. The siRNA and
miRNA transfection efficiencies were monitored by qRT-PCR and
Western blot analysis at 48-72 h after transfection. The sequences of
siFoxC1, siβ-catenin, miR-141-3p mimic and miR-141-3p inhibitor are
shown in Table S3.
Transfection of lentiviral vectors that overexpress FoxC1 or β-
catenin
Lentiviral vectors that overexpress full-length human FoxC1 (LVFoxC1)
or β-catenin (LVβ-catenin), and corresponding negative control
(LVcontrol), were purchased from Hanbio (Shanghai, China). The
lentivirus was transfected with SFs at the concentration recommended by
Hanbio (MOI=1:20) and with the corresponding transfection enhancer
polybrene according to the manufacturer’s protocol. The cells were used
for additional assays 72 h after transfection.
Cell proliferation, migration and invasion assays
To assess proliferation, SFs in each group at 48-72 h after transfection
were collected, counted and adjusted to a density of 5×10⁴ cells per 100
μL. Then, the SFs were seeded in a 96-well plate, and subsequent
15
287
288
289
290
291
292
293
294
295
296
297
298
299
300
301
302
303
304
305
306
307
308
2930
experiments were carried out at four time points: 0 h, 24 h, 48 h, and 72
h. A total of 10 μL of Cell Counting Kit-8 (CCK-8, Beyotime) reagent
was added to each well at the corresponding time point, and the cells
were cultured at 37°C for 2 h before the absorbance of each well was
measured at a wavelength of 450 nm on a Thermomax microplate reader
(Bio-Tek-El, USA).
To assess migration, SFs in each group at 48-72 h after transfection
were cultured in a 6-well plate in high-glucose DMEM (HyClone, South
Logan, Utah, USA) containing 10% FBS (CLARK, Richmond, VA,
USA) and incubated at 37 °C (initial cell density 1×10⁵ cells/well) to
100% confluence. Next, a wound was created in the cell monolayer with
a plastic scriber. The cells were then washed and again cultured in high-
glucose DMEM with 10% FBS at 37 °C for 48 h. The wounds were
photographed under a microscope (Olympus IX81), and the wound area
was evaluated with ImageJ software.
Invasion assays were conducted using transwell chambers with 8-μm
pores (Corning Incorporated). After transfection for 48-72 h, 2.5×10⁵ cells
in 200 μL of high-glucose DMEM were seeded in the upper chamber of
membranes precoated with Matrigel (BD Bioscience). Next, 800 μL of
high-glucose DMEM with 10% FBS was added to the lower chamber.
After the cells were incubated at 37 °C for 48 h, those on the upper
surface were gently wiped away, whereas invading cells present on the
16
309
310
311
312
313
314
315
316
317
318
319
320
321
322
323
324
325
326
327
328
329
330
3132
lower membrane were fixed with 4% paraformaldehyde and stained with
a 0.1% crystal violet solution. Finally, we counted five randomly selected
high power fields per well to assess the average number of invading cells.
Enzyme-linked immunosorbent assay (ELISA)
The levels of the cytokines IL-1β, IL-6, TNF-α and IL-10 in the
supernatants obtained from SF cultures were measured using
corresponding ELISA kits (ab46052, ab46027, ab181421, and ab46034,
respectively; Abcam) according to the manufacturer’s protocol. The
optical density values at 450 nm were recorded.
Luciferase reporter assay
To confirm that FoxC1 expression was regulated by binding of miR-141-
3p to the FoxC1 3′UTR, we used a pSI-Check2 reporter vector containing
the miR-binding sequences of the FoxC1 3′UTR (Hanbio) in combination
with a Dual-Luciferase Reporter Assay System (Promega, USA). RASFs
were co-transfected with plasmids carrying miR-141-3p pre-miRNA
(premiR-141-3p), negative control pre-miRNA (premiR-NC), wild-type
3'UTR of FoxC1 (3'UTR wt) and the 3'UTR mutation of FoxC1 (3'UTR
mut). Lipofectamine 3000 (Invitrogen) was used for plasmid transfection
17
331
332
333
334
335
336
337
338
339
340
341
342
343
344
345
346
347
348
3334

according to the manufacturer’s instructions. After 48 h, the Dual-
Luciferase Reporter Assay System was employed to measure the
luciferase activity. Firefly luciferase activity was normalized to the
corresponding Renilla luciferase activity.
The full-length FoxC1 cDNA was cloned into the pcDNA3.1 vector
(Hanbio) to construct the FoxC1-expressing plasmid pcDNA3.1-FoxC1.
Wild-type or mutant regions 2000 bp upstream of the β-catenin promoter
(identified by JASPAR) (BS1, BS2, BS3, and BS4) were cloned into the
pGL3 plasmid (Promega) to construct pGL3-β-catenin reporter plasmids.
RASFs were transfected with pcDNA3.1-FoxC1, pGL3-β-catenin and
Renilla luciferase reporter PRL-TK plasmids using Lipofectamine 3000.
After 48 h, the Dual-Luciferase Reporter Assay System was employed to
measure luciferase activity, and the transfection efficiencies were
normalized to the Renilla activity. The dual-luciferase activity of the
transfected cells was measured on a Thermomax microplate reader.
Coimmunoprecipitation (CoIP)
RASFs were lysed in RIPA at 4 °C for 30 min, the lysates were
centrifuged at 14,000 × g for 15 min, and the supernatants were collected.
A small amount of whole-cell lysate was retained as the input. Next, the
supernatant samples were incubated with the FoxC1 antibody (ab5079),
18
349
350
351
352
353
354
355
356
357
358
359
360
361
362
363
364
365
366
367
368
3536
β-catenin antibody (L87A12) (Cell Signaling) or normal IgG antibody
(Cell Signaling) combined with protein A/G magnetic beads (Thermo
Scientific) on a rotating device at 4 °C overnight. The bead-complexes
were collected by centrifugation at 14,000 × g for 1 min at 4 °C. Finally,
the beads were washed with lysate, and the protein was boiled with 10%
SDS and subjected to immunoblot analyses.
Chromatin immunoprecipitation (ChIP)
SFs (1×10⁷ cells) were crosslinked with 1% formaldehyde (Beyotime) at
37 °C for 10 min. After the cells were washed with PBS, they were
resuspended in 300 μL of lysis buffer (1% SDS, 1 mM PMSF, 50 mM
Tris (pH 8.1) and 10 mM EDTA). The DNA was sheared to lengths
between 200 bp and 1000 bp by sonication. The protein-DNA complexes
were precipitated with a ChIP-grade-FoxC1 antibody, with normal IgG
antibody serving as a negative control and anti-RNA pol-II antibody (Cell
Signaling) serving as a positive control, overnight at 4 °C. Protein A/G
magnetic beads were used to purify the complexes, and the cross-linkages
were reversed at 68 °C for 6 h. Next, the DNA was purified using a PCR
Purification Kit (Qiagen, USA). FoxC1 and RNA polymerase II protein
levels in the ChIP assay products were detected by Western blotting.
Finally, the binding capacity between FoxC1 and the β-Catenin promoter
was detected by qRT-PCR. The β-catenin promoter primer sequences
used in the ChIP-qRT-PCR assay were as follows: 5'-
19
369
370
371
372
373
374
375
376
377
378
379
380
381
382
383
384
385
386
387
388
389
390
3738
TTGTTTACGGTGTCAGTAGGGATTA-3' (sense) and 5'-
CTGCACCATTAGAAGATCTAAAGGA-3' (antisense).
Animal model induction and treatment
Thirty-six specific pathogen-free (SPF) female Lewis rats (weight 180-
220g) were obtained from Zhejiang Vital River Laboratory (Zhejiang,
China), maintained at 21 °C under a 12 h light/dark cycle and given a
standard rodent diet and filtered water ad libitum. The animal
experiments in this study were carried out according to the protocols
approved by the Anhui Medical University Animal Care and Use
Committee (No. LLSC20190547).
Collagen-induced arthritis (CIA) was established by administering bovine
type II collagen emulsified in incomplete Freund’s adjuvant at the base of
the tail (0.1 mL) and at two sites on the back (0.2 mL for each site) on
day 0 and day 7 according to previously described methods [49]. The rats
were divided randomly into six groups (6 rats per group): group 1 (G1),
no treatment (i.e., normal controls); group 2 (G2), CIA model controls
(no other treatments); group 3 (G3), model rats administered siFoxC1 (2'
O-methyl (OMe)+5' cholesterol (chol)+5' Cy5-modified); group 4 (G4),
model rats administered siControl (2' OMe+5' chol-modified) (RiboBio);
group 5 (G5), model rats administered miR-141-3p agomir (2' OMe+5'
chol+5' Cy5-modified); and group 6 (G6), model rats administered
negative control agomir (2' OMe+5' chol-modified) (RiboBio). The
20
391
392
393
394
395
396
397
398
399
400
401
402
403
404
405
406
407
408
409
410
411
412
3940
treatments in rats in groups G3-G6 were administered via intra-articular
injection (5 nmol in 0.9% saline; 30 µL volume) into their left hind ankle
joints once a week for 3 weeks (Supplementary movie). All rats in the
experimental groups were sacrificed on day 35 after the first collagen
immunization. Synovial tissues from the hind knee joints (G1 and G2)
were assessed by HE staining and immunohistochemistry, and rat SFs
were isolated and cultured according to the method described above.
Four-percent paraformaldehyde solution (Beyotime) was used to fix all of
the left hind ankle joints. Micro-CT was used to scan all of the left hind
ankle joints. Inflammation of synovial tissue and destruction of articular
cartilage were evaluated by HE staining and Safranin O/Fast Green
staining according to previous standards [50, 51].
Joint swelling measurements and arthritis clinical scores
For the CIA model, the swelling and clinical scores of the joints were
evaluated daily from the onset of arthritis (day 14) until the animals were
sacrificed. Joint swelling in each rat was evaluated as the average volume
of the left hind paw as measured with a plethysmometer (PV-200,
Techman, China). The clinical arthritis scores for the left hind paws of the
rats were obtained following a standard evaluation process [52] in which
a score of 0 indicated no evidence of erythema or swelling, a score of 1
indicated erythema and mild swelling, a score of 2 indicated erythema
and mild swelling extending from the ankle to the tarsals, a score of 3
21
413
414
415
416
417
418
419
420
421
422
423
424
425
426
427
428
429
430
431
432
433
434
4142
indicated erythema and moderate swelling extending from the ankle to
the metatarsal joints, and a score of 4 indicated erythema and either
severe swelling at the ankle, foot and digits or ankylosis of the limb. The
average clinical scores of the left hind paws were then calculated.
Vivo imaging system
To understand the duration of siFoxC1 and the miR-141-3p agomir in the
articular cavities of the rats, the left hind paws were imaged on day 0 and
day 7 using a Vivo imaging system (PerkinElmer, USA).
Micro-CT assessment
To evaluate bone damage, the left ankle joints of rats sacrificed at day 35
were fixed in 4% paraformaldehyde solution (Beyotime) and scanned in
an ex vivo micro-CT machine (Skyscan1174 X-ray Micro-CT) (Bruker)
for 160 min at 50 kV and 800 μA with a resolution of 14.5 μm. The
dataset was then reconstructed using N-Reconn and CTvox software to
obtain three-dimensional images of the joints and to measure bone
mineral density (BMD) and other morphometric parameters. The left
calcaneus in the rats was assessed for bone destruction, and its BMD was
measured as a comparative indicator of bone damage. The highlighted
ROI in the left calcaneus was analyzed for the following morphometric
parameters [53]: (1) bone volume/total tissue volume (BV/TV), (2)
trabecular number (Tb.N), (3) trabecular thickness (Tb.Th), (4) trabecular
separation (Tb.Sp), and (5) trabecular mesh factor (Tb.Pf).
22
435
436
437
438
439
440
441
442
443
444
445
446
447
448
449
450
451
452
453
454
455
456
4344
Bioinformatics target prediction
MiRNAs that may bind to the 3′UTR of FoxC1 were identified using the
miRanda, miRWalk, miRDB, PITA, Microt4, RNA22, miRMap,
RNAhybrid and TargetScan 6.0 databases. Conserved miRNAs were
selected for further validation if they were predicted by all 9 of the
databases mentioned above. The JASPAR database was used to predict
the binding of FoxC1 with the β-catenin promoter.
Statistical analysis
A student’s unpaired 2-tailed t-test was used to analyze differences
between two groups. One-way analysis of variance (ANOVA) with an
LSD posttest was used for multiple comparisons. All experiments were
performed in triplicate. A two-tailed P value <0.05 was considered to
indicate statistical significance. All analyses were performed using IBM
SPSS Statistics 22 and GraphPad Prism 7.
Results
FoxC1 and β-catenin are significantly upregulated in the synovium
and SFs of RA patients and CIA rats
To clarify the role of FoxC1 and β-catenin in the pathogenesis of RA, we
obtained synovial tissue samples from patients with RA (n=20),
individuals with normal synovium (n=10), normal rats (n=6) and CIA
model rats (n=6). HE staining was performed to confirm that the tissue
was synovial tissue (Figure S1A-B). We analyzed the position and
23
457
458
459
460
461
462
463
464
465
466
467
468
469
470
471
472
473
474
475
476
477
478
4546
expression level of FoxC1 and β-catenin in these synovial tissue samples
by IHC. FoxC1 protein levels were increased (H-score≥200) in 13 (65%)
of 20 RA synovium tissues and in 4 (66.7%) of 6 CIA synovium tissues.
The β-catenin protein levels were also increased (H-score≥200) in 14
(70%) of 20 RA synovium tissues and in 5 (83.3%) of 6 CIA synovium
tissues. As shown in Figure 1A, we found that the expression of FoxC1
and β-catenin was higher in RA patients and CIA rats than in the control
group, and positive staining was localized mainly in the cytoplasm and
nucleus. In contrast, staining for FoxC1 and β-catenin was negative or
weak in the corresponding control groups (Figure 1A). In addition, the
FoxC1 and β-catenin staining scores were significantly higher in the RA
patient and CIA rat synovium tissues than in the respective control tissues
(Figure 1A). Western blotting and qRT-PCR results also showed that
both FoxC1 and β-catenin protein and mRNA levels were higher in the
RA patients and CIA rat groups compared to the respective control
groups (Figure 1B-C).
To verify the successful isolation of RASFs, the expression levels of
vimentin and CD68 were detected by flow cytometry, and the results
suggested that the proportion of third-generation RASFs was very high
(Figure S1C). qRT-PCR showed that FoxC1 mRNA expression
continuously decreased in successive RASF generations. Thus, we used
primary cultured SFs at passages 3-5 (Figure S1D). We observed the
24
479
480
481
482
483
484
485
486
487
488
489
490
491
492
493
494
495
496
497
498
499
500
4748
distribution of FoxC1 and β-catenin in SFs by immunofluorescence and
found that FoxC1 and β-catenin were expressed in both the nucleus and
cytoplasm, but mainly in the nucleus (Figure 1D). Immunofluorescence
also revealed a greater degree of cytoplasmic and nuclear localization of
FoxC1 and β-catenin in RASFs compared to that in control cells (Figure
1D). In addition, we found that FoxC1 was barely expressed in the
cytoplasm in the control group (Figure 1D). Western blotting further
revealed that FoxC1 and β-catenin expression levels were significantly
higher in RASFs and CIA SFs (CIASFs) than in the respective control
cells (Figure 1E-F). qRT-PCR also demonstrated that mRNA levels of
FoxC1 and β-catenin were higher in RASFs and CIA SFs than in the
respective control cells (Figure 1E-F).
These results suggest that the abnormal expression (overexpression) of
FoxC1 and β-catenin may be related to the pathogenesis of RA in the
synovium.
In RASFs, FoxC1 promotes proliferation, migration, and invasion of
the cells, stimulates proinflammatory cytokine production and
reduces anti-inflammatory cytokine levels
To investigate the role of FoxC1 in RASFs, LVFoxC1 and SiFoxC1 were
transfected into cells to construct RASFs that overexpressed and knocked
down FoxC1, respectively. First, we evaluated cell proliferation by the
CCK-8 assay. We found that the proliferation of RASFs increased after
25
501
502
503
504
505
506
507
508
509
510
511
512
513
514
515
516
517
518
519
520
521
522
4950
LVFoxC1 transfection (Figure 2A). In contrast, the proliferation of
RASFs was reduced after SiFoxC1 transfection (Figure 2A). Next, we
assessed the migration and invasion of LVFoxC1- and SiFoxC1-
transfected RASFs with wound healing and transwell assays,
respectively. LVFoxC1-transfected RASFs exhibited better migration and
invasion than did control cells (Figure 2B-C), while SiFoxC1-transfected
RASFs exhibited poorer migration and invasion than did control cells
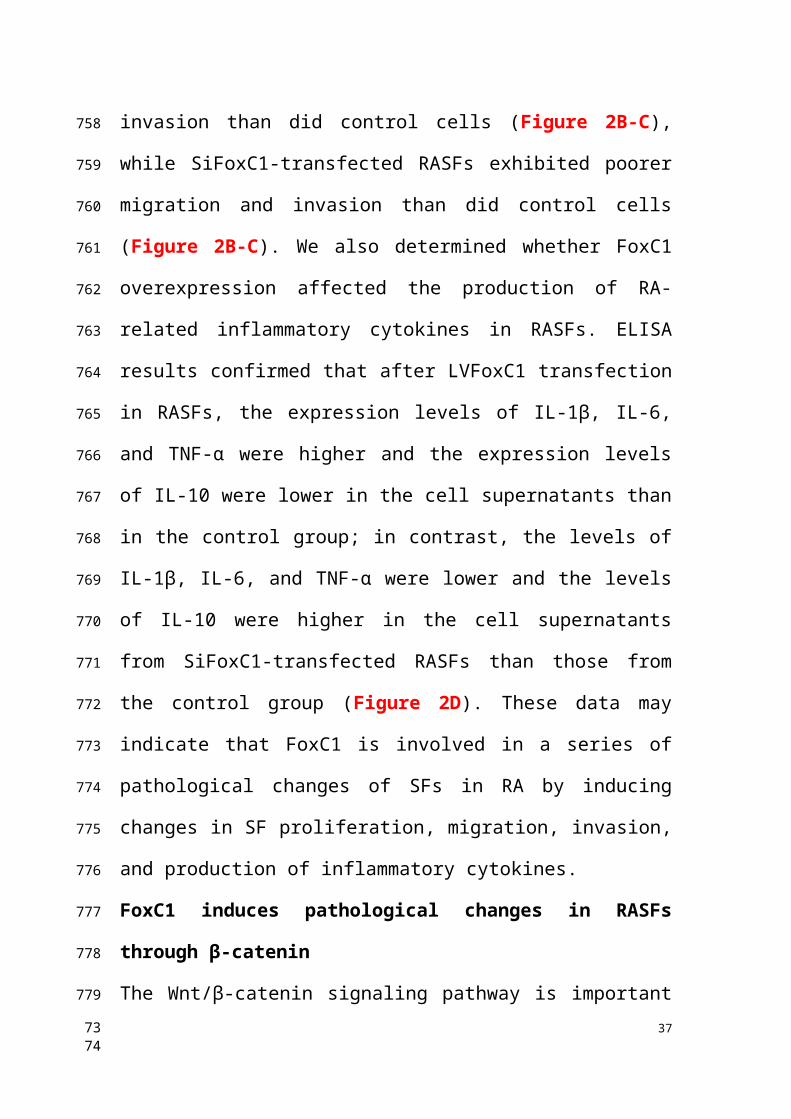
(Figure 2B-C). We also determined whether FoxC1 overexpression
affected the production of RA-related inflammatory cytokines in RASFs.
ELISA results confirmed that after LVFoxC1 transfection in RASFs, the
expression levels of IL-1β, IL-6, and TNF-α were higher and the
expression levels of IL-10 were lower in the cell supernatants than in the
control group; in contrast, the levels of IL-1β, IL-6, and TNF-α were
lower and the levels of IL-10 were higher in the cell supernatants from
SiFoxC1-transfected RASFs than those from the control group (Figure
2D). These data may indicate that FoxC1 is involved in a series of
pathological changes of SFs in RA by inducing changes in SF
proliferation, migration, invasion, and production of inflammatory
cytokines.
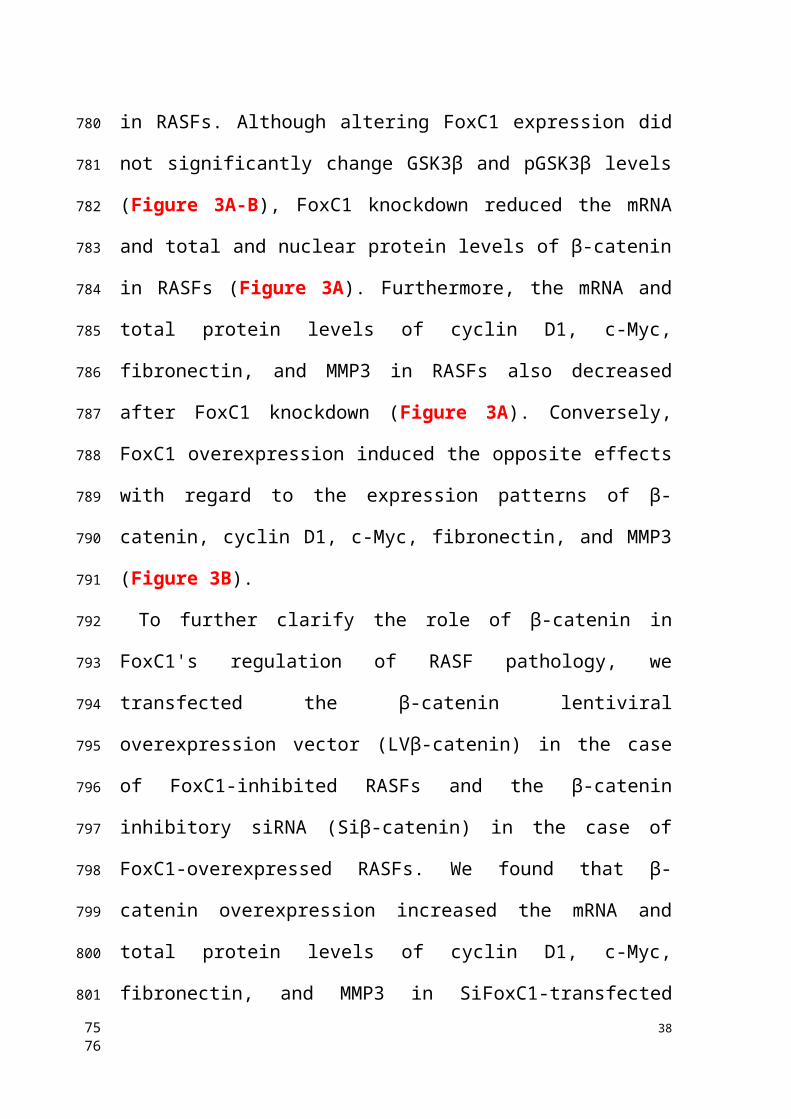
FoxC1 induces pathological changes in RASFs through β-catenin
The Wnt/β-catenin signaling pathway is important in RASFs. Although
altering FoxC1 expression did not significantly change GSK3β and
26
523
524
525
526
527
528
529
530
531
532
533
534
535
536
537
538
539
540
541
542
543
544
5152
pGSK3β levels (Figure 3A-B), FoxC1 knockdown reduced the mRNA
and total and nuclear protein levels of β-catenin in RASFs (Figure 3A).
Furthermore, the mRNA and total protein levels of cyclin D1, c-Myc,
fibronectin, and MMP3 in RASFs also decreased after FoxC1 knockdown
(Figure 3A). Conversely, FoxC1 overexpression induced the opposite
effects with regard to the expression patterns of β-catenin, cyclin D1, c-
Myc, fibronectin, and MMP3 (Figure 3B).
To further clarify the role of β-catenin in FoxC1's regulation of RASF
pathology, we transfected the β-catenin lentiviral overexpression vector
(LVβ-catenin) in the case of FoxC1-inhibited RASFs and the β-catenin
inhibitory siRNA (Siβ-catenin) in the case of FoxC1-overexpressed
RASFs. We found that β-catenin overexpression increased the mRNA
and total protein levels of cyclin D1, c-Myc, fibronectin, and MMP3 in
SiFoxC1-transfected RASFs (Figure 3C). Conversely, β-catenin
knockdown induced opposite changes with regard to the expression
patterns of cyclin D1, c-Myc, fibronectin, and MMP3 in LVFoxC1-
transfected RASFs (Figure 3D). Moreover, with regard to the viability,
migration and invasion of RASFs, β-catenin overexpression attenuated
the inhibitory effects of SiFoxC1, whereas β-catenin knockdown
attenuated the enhancing effects of LVFoxC1 (Figure 4A-C). β-Catenin
overexpression enhanced IL-1β, IL-6, and TNF-α production and
decreased IL-10 production in SiFoxC1-transfected RASFs (Figure 4D),
27
545
546
547
548
549
550
551
552
553
554
555
556
557
558
559
560
561
562
563
564
565
566
5354
whereas β-catenin knockdown induced the opposite effects in LVFoxC1-
transfected RASFs (Figure 4D).
FoxC1 binds to the β-catenin promoter and activates β-catenin
transcription in RASFs
Because FoxC1 and β-catenin are closely related to each other in RASFs,
we further investigated their relationship. First, the results of CoIP
experiments indicate that there may be an interaction between FoxC1 and
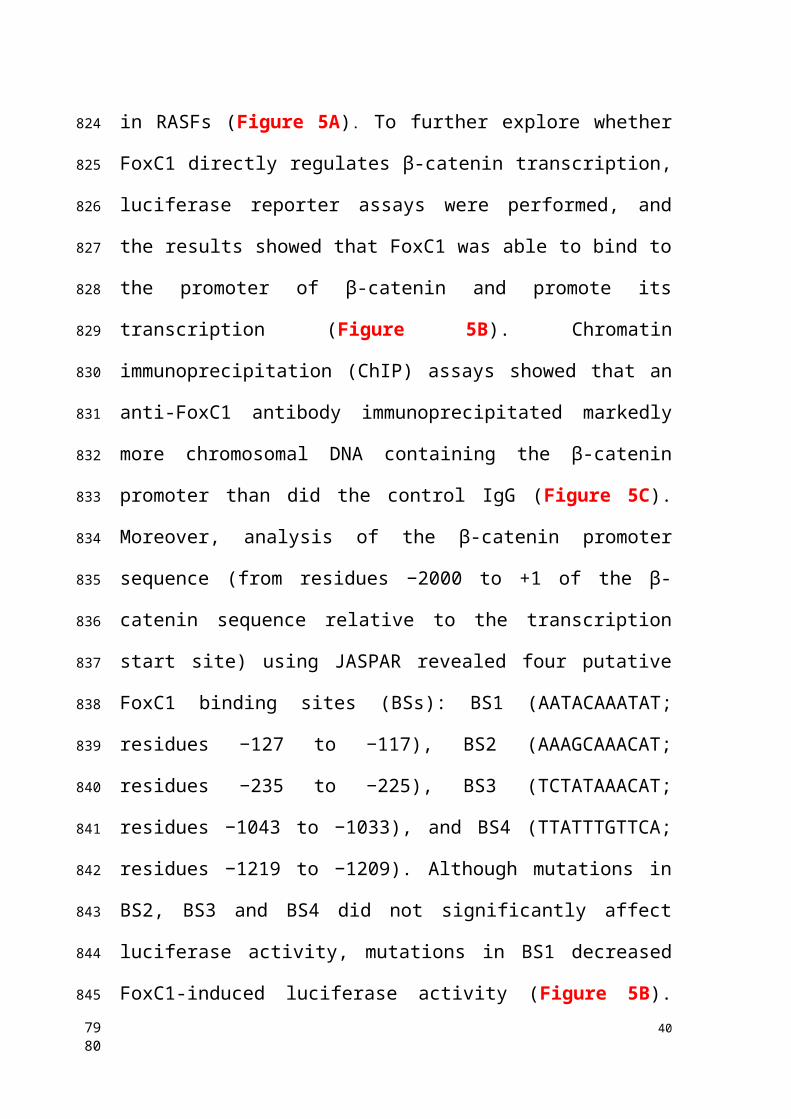
β-catenin proteins in RASFs (Figure 5A). To further explore whether
FoxC1 directly regulates β-catenin transcription, luciferase reporter
assays were performed, and the results showed that FoxC1 was able to
bind to the promoter of β-catenin and promote its transcription (Figure
5B). Chromatin immunoprecipitation (ChIP) assays showed that an anti-
FoxC1 antibody immunoprecipitated markedly more chromosomal DNA
containing the β-catenin promoter than did the control IgG (Figure 5C).
Moreover, analysis of the β-catenin promoter sequence (from residues
−2000 to +1 of the β-catenin sequence relative to the transcription start
site) using JASPAR revealed four putative FoxC1 binding sites (BSs):
BS1 (AATACAAATAT; residues −127 to −117), BS2
(AAAGCAAACAT; residues −235 to −225), BS3 (TCTATAAACAT;
residues −1043 to −1033), and BS4 (TTATTTGTTCA; residues −1219 to
−1209). Although mutations in BS2, BS3 and BS4 did not significantly
affect luciferase activity, mutations in BS1 decreased FoxC1-induced
28
567
568
569
570
571
572
573
574
575
576
577
578
579
580
581
582
583
584
585
586
587
588
5556
luciferase activity (Figure 5B). The ChIP-qRT-PCR analysis confirmed
the immunoprecipitation of FoxC1 and BS1, indicating that FoxC1
protein binds to the β-catenin promoter and exerts a significantly stronger
effect in RASFs than in normal SFs (Figure 5C). These results suggested
that FoxC1 directly activated β-catenin transcription in human SFs.
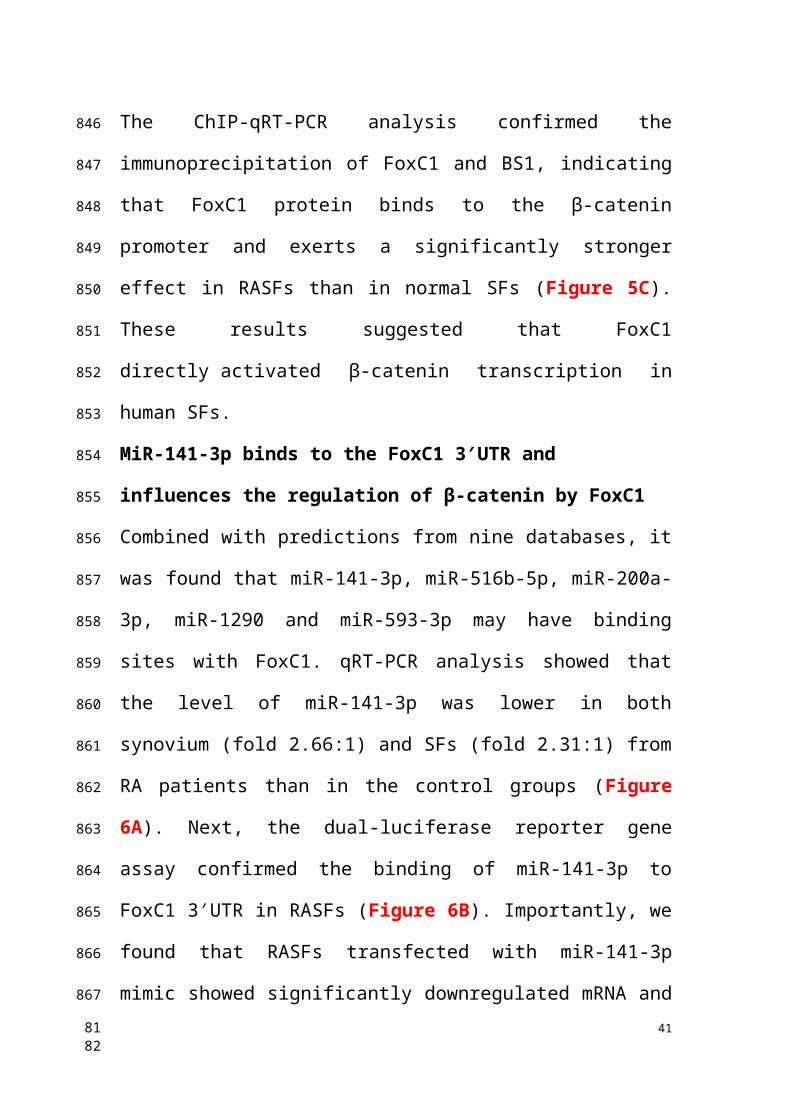
MiR-141-3p binds to the FoxC1 3′UTR and influences the regulation
of β-catenin by FoxC1
Combined with predictions from nine databases, it was found that miR-
141-3p, miR-516b-5p, miR-200a-3p, miR-1290 and miR-593-3p may
have binding sites with FoxC1. qRT-PCR analysis showed that the level
of miR-141-3p was lower in both synovium (fold 2.66:1) and SFs (fold
2.31:1) from RA patients than in the control groups (Figure 6A). Next,
the dual-luciferase reporter gene assay confirmed the binding of miR-
141-3p to FoxC1 3′UTR in RASFs (Figure 6B). Importantly, we found
that RASFs transfected with miR-141-3p mimic showed significantly
downregulated mRNA and protein expression levels of FoxC1 and β-
catenin, whereas transfection with miR-141-3p inhibitor resulted in
significantly upregulated mRNA and protein expression levels of these
molecules (Figure 6C).
To investigate whether miR-141-3p mediates β-catenin in RASFs by
FoxC1, LVFoxC1 was used to upregulate the expression of FoxC1
expression in miR-141-3p mimic-treated RASFs, and SiFoxC1 was used
29
589
590
591
592
593
594
595
596
597
598
599
600
601
602
603
604
605
606
607
608
609
610
5758
to reduce the expression of FoxC1 in miR-141-3p inhibitor-treated
RASFs. FoxC1 overexpression upregulated the expression of β-catenin
mRNA and total protein in miR-141-3p mimic-treated RASFs, while
FoxC1 knockdown caused the opposite changes in miR-141-3p inhibitor-
treated RASFs (Figure 6D).
Based on the above research results, we surmised that the miR-141-
3p/FoxC1/β-catenin axis plays a crucial role in the pathological
mechanism of RA.
Role of the miR-141-3p/FoxC1/β-catenin axis in LPS-induced
inflammatory SFs
We induced normal SFs with LPS and similarly found that miR-141-3p
was significantly decreased at the gene level (Figure 7A). In contrast,
levels of FoxC1, β-catenin, cyclin D1, c-Myc, fibronectin, and MMP3
mRNA and total protein were increased (Figure 7B). However, these
adverse effects were alleviated by miR-141-3p overexpression, FoxC1
knockdown or β-catenin knockdown (Figure 7C-D). Importantly, the
levels of the inflammatory cytokines IL-1β, IL-6, and TNF-α were
significantly increased, while that of IL-10 was decreased, after LPS
induction (Figure 7E). Data detected by ChIP and qRT-PCR assays
indicated the presence of FoxC1 binding to the β-catenin promoter and
exerted a significantly stronger effect in LPS-induced SFs than in normal
SFs; furthermore, this binding capacity was inhibited by miR-141-3p
30
611
612
613
614
615
616
617
618
619
620
621
622
623
624
625
626
627
628
629
630
631
632
5960
overexpression, FoxC1 knockdown or β-catenin knockdown (Figure 8).
These data suggest that miR-141-3p/FoxC1/β-catenin may still be present
in the LPS-induced inflammatory SFs model.
Intra-ankle injection of a miR-141-3p agomir/FoxC1-specific siRNA
hinders CIA development in rats
To clarify whether FoxC1 or miR-141-3p could be a therapeutic target for
RA in vivo, we evaluated the potential clinical efficacy of FoxC1
knockdown and miR-141-3p overexpression using a rat model of RA
(CIA). The rats received intra-articular injections of sicontrol, negative
control miRNA, siFoxC1, or miR-141-3p agomir into their left hind ankle
joints. To determine the duration of FoxC1 or miR-141-3p agomir in the
ankle, we used in vivo imaging to confirm that siFoxC1 and miR-141-3p
were still expressed 7 days after the first injection (Figure 9A). Intra-
articular injection of siFoxC1 or miR-141-3p agomir significantly
improved both the clinical arthritis score and ankle joint swelling in
arthritic rats compared with those in control rats (Figure 9B). Micro-CT
data showed that bone erosion was significantly reduced in rats injected
with siFoxC1 or miR-141-3p agomir compared with the control groups
(Figure 9C). The calcaneus was selected as the ROI, and related
parameters including BMD percentage (Figure 9C), BV/TV, Tb.N,
Tb.Th, Tb.Sp, and Tb.Pf were analyzed. The analysis results showed that
both siFoxC1 and miR-141-3p agomir groups showed improvements in
31
633
634
635
636
637
638
639
640
641
642
643
644
645
646
647
648
649
650
651
652
653
654
6162
all parameters compared with the control group (Figure 10). IHC results
showed that the expression of FoxC1 and β-catenin in the synovial tissue
of the ankle joint cavity was significantly decreased in the CIA rats
injected with siFoxC1 or miR-141-3p agomir compared with the control
group (Figure 11). Surprisingly, the siFoxC1 and miR-141-3p agomir
groups exhibited thinner synovial membranes and less cell infiltration in
contrast to the synovitis aggravation in the control group (Figure 12A).
Moreover, siFoxC1 and miR-141-3p agomir significantly decreased
cartilage destruction compared with that observed with the control
compounds (Figure 12B). IHC also confirmed that the levels of the
proinflammatory cytokines IL-1β, IL-6, and TNF-α were lower and those
of the anti-inflammatory cytokine IL-10 were higher in the siFoxC1- or
miR-141-3p agomir-injected rats compared with the corresponding levels
in the control compound rats (Figure 13, 14).
Discussion
Although FoxC1 is known as an essential factor in cancer pathology, its
regulatory contribution to tumor-like characteristics and its role in the
pathological progression of RA have not been thoroughly discussed.
Now, we have studied these topics in detail in vivo and in vitro and
revealed a new molecular mechanism. Our results demonstrate, for the
first time, a novel role of the miR-141-3p/FoxC1/β-catenin axis in
regulating RA functional plasticity in vivo and in vitro.
32
655
656
657
658
659
660
661
662
663
664
665
666
667
668
669
670
671
672
673
674
675
676
6364
RASFs display an aggressive phenotype with a tumor-like appearance
and play key roles in tissue destruction during the pathogenesis of RA by
producing inflammatory cytokines [54-56] and ECM-degrading
proteases[57, 58]. Our data show for the first time that FoxC1 is highly
expressed in the synovium and SFs of RA patients and CIA rats and may
metastasize to the nucleus. Previous studies have indicated that FoxC1 is
overexpressed in human cancer and acts as an oncogene to promote
proliferation and metastasis. Additionally, it is well known that
inflammatory cytokines, such as IL-1β, IL-6 and TNF-α, are upregulated
and that the anti-inflammatory cytokine IL-10 is downregulated during
the pathogenesis of RA. Moreover, in our study, inhibition of FoxC1
expression resulted in decreased IL-1β, IL-6, and TNF-α production and
increased IL-10 production, while FoxC1 overexpression induced the
opposite effects. A recent study revealed that FoxC1 promotes cell
proliferation by upregulating PI3K/AKT signaling in RA in an
inflammation-dependent manner; unfortunately, the inflammatory
cytokine-associated mechanism has not been explored [59]. Therefore,
our data support an underappreciated role of FoxC1 in promoting
proliferation, migration, and proinflammatory cytokine (IL-1β, IL-6,
TNF-α) production and inhibiting anti-inflammatory cytokine secretion
(IL-10) in RASFs.
Next, we explored the molecular mechanism underlying the regulatory
33
677
678
679
680
681
682
683
684
685
686
687
688
689
690
691
692
693
694
695
696
697
698
6566
effects of FoxC1 on RASF properties. The Wnt/β-catenin signaling
pathway has been proven to be associated with the occurrence and
development of various diseases in a number of previous studies [60-62],
and it also plays an important role in the pathological mechanism of RA
[63-65]. When this pathway is activated, large amounts of β-catenin enter
the nucleus, and nuclear β-catenin forms complexes with TCF/LEF to
regulate target gene expression [66, 67]. Interestingly, our current results
revealed that FoxC1 knockdown reduced β-catenin levels and
downregulated cyclin D1, c-Myc, fibronectin, and MMP3 expression in
RASFs and suggested that these regulatory effects are unrelated to
GSK3β. Moreover, we found that β-catenin overexpression reversed the
inhibitory effects of FoxC1 knockdown on cyclin D1, c-Myc, fibronectin,
and MMP3 expression and on RASF proliferation, migration, invasion
and inflammatory response (by decreasing IL-1β, IL-6, and TNF-α and
increasing IL-10 levels). Cyclin D1 and c-Myc are common downstream
molecules of the β-catenin/TCF4 complex and are related to cell
proliferation, migration and invasion in a variety of tumor mechanisms
[68-70]. In addition, as components of the ECM, fibronectin and MMP3
are highly expressed during cell migration and invasion, chronic
inflammation and tissue destruction, as observed in autoimmune
disorders such as RA [65, 71, 72]. A previous study on podocyte injury
found that shRNA-mediated knockdown of β-catenin abolished the
34
699
700
701
702
703
704
705
706
707
708
709
710
711
712
713
714
715
716
717
718
719
720
6768
upregulation of fibronectin and matrix metalloproteinase-9 (MMP9)
induced by advanced oxidation protein products [73]. Imai et al. found
that β-catenin nuclear translocation can immediately cause the
upregulated expression of catabolic genes (MMP3, ADAMTS-4) in
chondrocytes [74]. These findings suggest that β-catenin is closely related
to the production of fibronectin and MMP3. There is also evidence of
correlations between inflammatory cytokine expression and β-catenin.
Lin JC et al. found that overexpression of β-catenin led to an increase in
the inflammatory cytokines TNF-α and IL-8 and activated
cardiomyocytes through the NF-κB signaling pathway [75]. β-catenin
molecular targeted therapy is an underlying inflammatory and fibrotic
cardiomyocyte [75]. Furthermore, Bo Gao et al. found that MALAT1
significantly downregulated the expression of IL-6, IL-1β and TNF-α and
upregulated the expression of IL-10 in RASFs by promoting β-catenin
promoter methylation and inhibiting β-catenin expression [76]. All of
these findings indicate that β-catenin might play an important role in the
proliferation, migration, invasion, and secretion of inflammatory factors
in RASFs.
The luciferase reporter assays in this study revealed that FoxC1 promoted
β-catenin expression in RASFs by enhancing β-catenin promoter activity.
The CoIP assays confirmed the existence of binding between the FoxC1
and β-catenin proteins in RASFs, and the ChIP and qRT-PCR assays
35
721
722
723
724
725
726
727
728
729
730
731
732
733
734
735
736
737
738
739
740
741
742
6970
confirmed the binding of FoxC1 to the β-catenin promoter (from sites
−127 to −117) in RASFs. Thus, our data further suggest that FoxC1
causes a series of pathological changes in RASFs by regulating β-catenin
via FoxC1 binding to the β-catenin promoter to promote the transcription
of β-catenin. In this manner, FoxC1 may stabilize β-catenin and has a
positive effect on Wnt/β-catenin signaling.
MiR-141-3p is a member of the miR-200 family, which is considered to
include important negative regulators of cancer cell proliferation,
migration and invasion, and has been found to regulate immune cells
during the inflammatory response [77, 78]. Our data showed for the first
time that miR-141-3p expression levels were significantly reduced in
both synovium and SFs in RA patients. More importantly, our results
showed that miR-141-3p overexpression reduced the expression of
FoxC1, β-catenin, cyclin D1, c-Myc, fibronectin, and MMP3, decreased
the secretion of the proinflammatory cytokines IL-1β, IL-6, and TNF-α
and increased the production of IL-10 in RASFs, while miR-141-3p
knockdown reversed these effects. The dual-luciferase reporter assay
results showed that FoxC1 was a target gene of miR-141-3p. These
results show, for the first time, that miR-141-3p may affect the
proliferation, migration, invasion, and secretion of inflammatory
cytokines in RASFs by regulating FoxC1. LPS, a natural immune
reaction regulator, has been used extensively to study the mechanisms
36
743
744
745
746
747
748
749
750
751
752
753
754
755
756
757
758
759
760
761
762
763
764
7172
and regulation of immune reactions [79, 80]. Our results also indicated
that LPS can induce an artificial RA cell model and that the miR-141-
3p/FoxC1/β-catenin axis regulates the underlying pathological changes.
Silencing FoxC1 or enhancing miR-141-3p through intra-articular
injection of siFoxC1/miR-141-3p agomir suppressed experimentally
induced arthritis in rats by inhibiting SF proliferation and inflammation.
The fact that siFoxC1 or miR-141-3p agomir could reduce inflammation
of synovial tissue and prevent further destruction of articular cartilage and
bone suggests that FoxC1 and miR-141-3p are potential therapeutic
targets for RA. Although the contribution of FoxC1 and miR-141-3p to
the immune system as a whole is unclear, inhibiting FoxC1 or inducing
miR-141-3p could be a potential treatment for RA. However, we must
recognize that systemic inhibition of FoxC1 or miR-141-3p may result in
more severe dysfunction, and complete blockade of the signaling proteins
with specific chemical inhibitors is impossible.
Of course, our research has certain limitations. Although synovial tissues
from RA patients diagnosed based on the criteria of the American
College of Rheumatology were included, we cannot completely exclude
the possibility that these tissues were from osteoarthritis patients to some
extent. The mechanism underlying how all of the effectors downstream of
β-catenin (cyclin D1, c-Myc, fibronectin, MMP3, IL-1β, IL-6, TNF-α and
IL-10) are regulated in RA still needs to be explored in the future. In
37
765
766
767
768
769
770
771
772
773
774
775
776
777
778
779
780
781
782
783
784
785
786
7374
addition, it should be recognized that the joint cavity contains a variety of
cells and tissues and that siFoxC1 or miR-141-3p agomir may also
alleviate the progression of arthritis in CIA rats by acting on other cells in
the joint such as chondrocytes and osteocytes.
In this study, our results suggest that the miR-141-3p/FoxC1/β-catenin
signaling axis may contribute to the pathogenesis of RA by regulating the
proliferation of, migration of and inflammatory cytokine production from
SFs. Thus, we propose that FoxC1 and miR-141-3p might be potential
novel targets for nonimmunosuppressive-based RA therapies. Further
studies are needed to clarify whether FoxC1 and mir-141-3p can be used
as diagnostic markers and prognostic indicators for RA, and how to apply
FoxC1 and miR-141-3p to clinical treatment.
Abbreviations
RA, rheumatoid arthritis; SFs, synovial fibroblasts; FoxC1: Forkhead box
protein C1; microRNA (miR)-141-3p: (miR)-141-3p; MMP3: matrix
metalloproteinase 3; IL-1β: interleukin-1β; mRNA: messenger RNA;
TNF-α: tumor necrosis factor-α; H&E: hematoxylin and eosin; CCK-8,
Counting Kit-8 assays; ROI, the region of interest; ChIP: chromatin
immunoprecipitation; CoIP: coimmunoprecipitation; CIA: collagen-
induced arthritis; LVFoxC1: overexpression of FoxC1; siFoxC1:
inhibition of FoxC1; LVβ-catenin: overexpression of β-catenin; siβ-
catenin: inhibition of β-catenin; miR-141-3p mimic: overexpression of
38
787
788
789
790
791
792
793
794
795
796
797
798
799
800
801
802
803
804
805
806
807
808
7576

miR-141-3p; miR-141-3p inhibitor: inhibition of miR-141-3p.
Acknowledgments
This study was supported by combined grants from the National Natural
Science Foundation of China (Nos. 81672161 and 81871785).
Conflict of interest
The authors have no conflicts of interest regarding this work.
Contributors
ZSY and JW designed and checked the experiments; YW, JW, HZ, JC,
YTL, LY, YJW and MRG completed the experiments; WLG, WDL, ML,
YJW, MRG and XHW analyzed the data; and JW and ZSY edited the
manuscript. All authors drafted and reviewed the manuscript and
approved the final version to be published.
References1. Firestein GS. Evolving concepts of rheumatoid arthritis. Nature. 2003; 423: 356-61.2. Falconer J, Murphy AN, Young SP, Clark AR, Tiziani S, Guma M, et al. Review: Synovial Cell Metabolism and Chronic Inflammation in Rheumatoid Arthritis. Arthritis Rheumatol. 2018; 70: 984-99.3. Bartok B, Firestein GS. Fibroblast-like synoviocytes: key effector cells in rheumatoid arthritis. Immunol Rev. 2010; 233: 233-55.4. Muller-Ladner U, Pap T, Gay RE, Neidhart M, Gay S. Mechanisms of disease: the molecular and cellular basis of joint destruction in rheumatoid arthritis. Nat Clin Pract Rheumatol. 2005; 1: 102-10.5. Malemud CJ. Intracellular Signaling Pathways in Rheumatoid Arthritis. J Clin Cell Immunol. 2013; 4: 160.6. Noss EH, Brenner MB. The role and therapeutic implications of fibroblast-like synoviocytes in inflammation and cartilage erosion in rheumatoid arthritis. Immunol Rev. 2008; 223: 252-70.7. Turner JD, Filer A. The role of the synovial fibroblast in rheumatoid arthritis pathogenesis. Curr Opin Rheumatol. 2015; 27: 175-82.8. Feldmann M, Brennan FM, Maini RN. Rheumatoid arthritis. Cell. 1996; 85: 307-
39
809
810
811
812
813
814
815
816
817
818
819
820
821822823824825826827828829830831832833834835836837838839
7778
10.9. Dulos J, Wijnands FP, van den Hurk-van Alebeek JA, van Vugt MJ, Rullmann JA, Schot JJ, et al. p38 inhibition and not MK2 inhibition enhances the secretion of chemokines from TNF-alpha activated rheumatoid arthritis fibroblast-like synoviocytes. Clin Exp Rheumatol. 2013; 31: 515-25.10. Santiago L, Menaa C, Arias M, Martin P, Jaime-Sanchez P, Metkar S, et al. Granzyme A Contributes to Inflammatory Arthritis in Mice Through Stimulation of Osteoclastogenesis. Arthritis Rheumatol. 2017; 69: 320-34.11. Yeremenko N, Zwerina K, Rigter G, Pots D, Fonseca JE, Zwerina J, et al. Tumor necrosis factor and interleukin-6 differentially regulate Dkk-1 in the inflamed arthritic joint. Arthritis Rheumatol. 2015; 67: 2071-5.12. Koga T, Yamasaki S, Migita K, Kita J, Okada A, Kawashiri S, et al. Post-transcriptional regulation of IL-6 production by Zc3h12a in fibroblast-like synovial cells. Clin Exp Rheumatol. 2011; 29: 906-12.13. Kontny E, Janicka I, Skalska U, Maslinski W. The effect of multimeric adiponectin isoforms and leptin on the function of rheumatoid fibroblast-like synoviocytes. Scand J Rheumatol. 2015; 44: 363-8.14. Fava RA, Olsen NJ, Spencer-Green G, Yeo KT, Yeo TK, Berse B, et al. Vascular permeability factor/endothelial growth factor (VPF/VEGF): accumulation and expression in human synovial fluids and rheumatoid synovial tissue. J Exp Med. 1994; 180: 341-6.15. Janczi T, Bohm BB, Fehrl Y, DeGiacomo P, Kinne RW, Burkhardt H. ADAM15 in Apoptosis Resistance of Synovial Fibroblasts: Converting Fas/CD95 Death Signals Into the Activation of Prosurvival Pathways by Calmodulin Recruitment. Arthritis Rheumatol. 2019; 71: 63-72.16. Muller-Ladner U, Ospelt C, Gay S, Distler O, Pap T. Cells of the synovium in rheumatoid arthritis. Synovial fibroblasts. Arthritis Res Ther. 2007; 9: 223.17. Rabelo Fde S, da Mota LM, Lima RA, Lima FA, Barra GB, de Carvalho JF, et al. The Wnt signaling pathway and rheumatoid arthritis. Autoimmun Rev. 2010; 9: 207-10.18. Imai K, Morikawa M, D'Armiento J, Matsumoto H, Komiya K, Okada Y. Differential expression of WNTs and FRPs in the synovium of rheumatoid arthritis and osteoarthritis. Biochem Biophys Res Commun. 2006; 345: 1615-20.19. Logan CY, Nusse R. The Wnt signaling pathway in development and disease. Annu Rev Cell Dev Biol. 2004; 20: 781-810.20. Moon RT, Brown JD, Torres M. WNTs modulate cell fate and behavior during vertebrate development. Trends Genet. 1997; 13: 157-62.21. Kurimoto S, Jung J, Tapadia M, Lengfeld J, Agalliu D, Waterman M, et al. Activation of the Wnt/beta-catenin signaling cascade after traumatic nerve injury. Neuroscience. 2015; 294: 101-8.22. Xiao L, Zhou D, Tan RJ, Fu H, Zhou L, Hou FF, et al. Sustained Activation of Wnt/beta-Catenin Signaling Drives AKI to CKD Progression. J Am Soc Nephrol. 2016; 27: 1727-40.23. Spranger S, Bao R, Gajewski TF. Melanoma-intrinsic beta-catenin signalling
40
840841842843844845846847848849850851852853854855856857858859860861862863864865866867868869870871872873874875876877878879880881882883
7980
prevents anti-tumour immunity. Nature. 2015; 523: 231-5.24. Schneider S, Thurnher D, Seemann R, Brunner M, Kadletz L, Ghanim B, et al. The prognostic significance of beta-catenin, cyclin D1 and PIN1 in minor salivary gland carcinoma: beta-catenin predicts overall survival. Eur Arch Otorhinolaryngol. 2016; 273: 1283-92.25. Nishimura DY, Swiderski RE, Alward WL, Searby CC, Patil SR, Bennet SR, et al. The forkhead transcription factor gene FKHL7 is responsible for glaucoma phenotypes which map to 6p25. Nat Genet. 1998; 19: 140-7.26. Kume T, Deng KY, Winfrey V, Gould DB, Walter MA, Hogan BL. The forkhead/winged helix gene Mf1 is disrupted in the pleiotropic mouse mutation congenital hydrocephalus. Cell. 1998; 93: 985-96.27. Maclean K, Smith J, St Heaps L, Chia N, Williams R, Peters GB, et al. Axenfeld-Rieger malformation and distinctive facial features: Clues to a recognizable 6p25 microdeletion syndrome. Am J Med Genet A. 2005; 132a: 381-5.28. Jensen TW, Ray T, Wang J, Li X, Naritoku WY, Han B, et al. Diagnosis of Basal-Like Breast Cancer Using a FOXC1-Based Assay. J Natl Cancer Inst. 2015; 107.29. Ray PS, Wang J, Qu Y, Sim MS, Shamonki J, Bagaria SP, et al. FOXC1 is a potential prognostic biomarker with functional significance in basal-like breast cancer. Cancer Res. 2010; 70: 3870-6.30. Wang J, Ray PS, Sim MS, Zhou XZ, Lu KP, Lee AV, et al. FOXC1 regulates the functions of human basal-like breast cancer cells by activating NF-kappaB signaling. Oncogene. 2012; 31: 4798-802.31. Huang W, Chen Z, Zhang L, Tian D, Wang D, Fan D, et al. Interleukin-8 Induces Expression of FOXC1 to Promote Transactivation of CXCR1 and CCL2 in Hepatocellular Carcinoma Cell Lines and Formation of Metastases in Mice. Gastroenterology. 2015; 149: 1053-67.e14.32. Wei LX, Zhou RS, Xu HF, Wang JY, Yuan MH. High expression of FOXC1 is associated with poor clinical outcome in non-small cell lung cancer patients. Tumour Biol. 2013; 34: 941-6.33. Xia L, Huang W, Tian D, Zhu H, Qi X, Chen Z, et al. Overexpression of forkhead box C1 promotes tumor metastasis and indicates poor prognosis in hepatocellular carcinoma. Hepatology. 2013; 57: 610-24.34. Bartel DP. MicroRNAs: genomics, biogenesis, mechanism, and function. Cell. 2004; 116: 281-97.35. O'Connell RM, Rao DS, Baltimore D. microRNA regulation of inflammatory responses. Annu Rev Immunol. 2012; 30: 295-312.36. Kurowska-Stolarska M, Alivernini S, Ballantine LE, Asquith DL, Millar NL, Gilchrist DS, et al. MicroRNA-155 as a proinflammatory regulator in clinical and experimental arthritis. Proc Natl Acad Sci U S A. 2011; 108: 11193-8.37. Nakasa T, Shibuya H, Nagata Y, Niimoto T, Ochi M. The inhibitory effect of microRNA-146a expression on bone destruction in collagen-induced arthritis. Arthritis Rheum. 2011; 63: 1582-90.38. Philippe L, Alsaleh G, Pichot A, Ostermann E, Zuber G, Frisch B, et al. MiR-20a regulates ASK1 expression and TLR4-dependent cytokine release in rheumatoid
41
884885886887888889890891892893894895896897898899900901902903904905906907908909910911912913914915916917918919920921922923924925926927
8182
fibroblast-like synoviocytes. Ann Rheum Dis. 2013; 72: 1071-9.39. Hao F, Lee RJ, Zhong L, Dong S, Yang C, Teng L, et al. Hybrid micelles containing methotrexate-conjugated polymer and co-loaded with microRNA-124 for rheumatoid arthritis therapy. Theranostics. 2019; 9: 5282-97.40. Li YT, Chen SY, Wang CR, Liu MF, Lin CC, Jou IM, et al. Brief report: amelioration of collagen-induced arthritis in mice by lentivirus-mediated silencing of microRNA-223. Arthritis Rheum. 2012; 64: 3240-5.41. Luo X, Ranade K, Talker R, Jallal B, Shen N, Yao Y. microRNA-mediated regulation of innate immune response in rheumatic diseases. Arthritis Res Ther. 2013; 15: 210.42. Montgomery RL, van Rooij E. MicroRNA regulation as a therapeutic strategy for cardiovascular disease. Curr Drug Targets. 2010; 11: 936-42.43. Aletaha D, Neogi T, Silman AJ, Funovits J, Felson DT, Bingham CO, 3rd, et al. 2010 Rheumatoid arthritis classification criteria: an American College of Rheumatology/European League Against Rheumatism collaborative initiative. Arthritis Rheum. 2010; 62: 2569-81.44. Liu XZ, Fan J, Qi K, Liu SP, Xu WD, Gao Y, et al. Dishevelled2 promotes apoptosis and inhibits inflammatory cytokine secretion in rheumatoid arthritis fibroblast-like synoviocytes through crosstalk with the NF-kappaB pathway. Oncotarget. 2017; 8: 12649-63.45. Chen SY, Shiau AL, Li YT, Lin CC, Jou IM, Liu MF, et al. Transcription factor snail regulates tumor necrosis factor alpha-mediated synovial fibroblast activation in the rheumatoid joint. Arthritis Rheumatol. 2015; 67: 39-50.46. Fruh M, Pless M. EGFR IHC score for selection of cetuximab treatment: Ready for clinical practice? Transl Lung Cancer Res. 2012; 1: 145-6.47. Li J, Gao JZ, Du JL, Huang ZX, Wei LX. Increased CDC20 expression is associated with development and progression of hepatocellular carcinoma. Int J Oncol. 2014; 45: 1547-55.48. Tan P, Xu Y, Du Y, Wu L, Guo B, Huang S, et al. SPOP suppresses pancreatic cancer progression by promoting the degradation of NANOG. Cell Death Dis. 2019; 10: 794.49. Kim YH, Kang JS. Effect of methotrexate on collagen-induced arthritis assessed by micro-computed tomography and histopathological examination in female rats. Biomol Ther (Seoul). 2015; 23: 195-200.50. Camps M, Ruckle T, Ji H, Ardissone V, Rintelen F, Shaw J, et al. Blockade of PI3Kgamma suppresses joint inflammation and damage in mouse models of rheumatoid arthritis. Nat Med. 2005; 11: 936-43.51. Yan X, Cen Y, Wang Q. Mesenchymal stem cells alleviate experimental rheumatoid arthritis through microRNA-regulated IkappaB expression. Sci Rep. 2016; 6: 28915.52. Lee SM, Kim HJ, Ha YJ, Park YN, Lee SK, Park YB, et al. Targeted chemo-photothermal treatments of rheumatoid arthritis using gold half-shell multifunctional nanoparticles. ACS Nano. 2013; 7: 50-7.53. Liang H, Peng B, Dong C, Liu L, Mao J, Wei S, et al. Cationic nanoparticle as an
42
928929930931932933934935936937938939940941942943944945946947948949950951952953954955956957958959960961962963964965966967968969970971
8384
inhibitor of cell-free DNA-induced inflammation. Nat Commun. 2018; 9: 4291.54. Klimiuk PA, Goronzy JJ, Bjor nsson J, Beckenbaugh RD, Weyand CM. Tissue cytokine patterns distinguish variants of rheumatoid synovitis. Am J Pathol. 1997; 151: 1311-9.55. Firestein GS, Zvaifler NJ. How important are T cells in chronic rheumatoid synovitis?: II. T cell-independent mechanisms from beginning to end. Arthritis Rheum. 2002; 46: 298-308.56. Marinova-Mutafchieva L, Williams RO, Funa K, Maini RN, Zvaifler NJ. Inflammation is preceded by tumor necrosis factor-dependent infiltration of mesenchymal cells in experimental arthritis. Arthritis Rheum. 2002; 46: 507-13.57. Yamanaka H, Matsuda Y, Tanaka M, Sendo W, Nakajima H, Taniguchi A, et al. Serum matrix metalloproteinase 3 as a predictor of the degree of joint destruction during the six months after measurement, in patients with early rheumatoid arthritis. Arthritis Rheum. 2000; 43: 852-8.58. Green MJ, Gough AK, Devlin J, Smith J, Astin P, Taylor D, et al. Serum MMP-3 and MMP-1 and progression of joint damage in early rheumatoid arthritis. Rheumatology (Oxford). 2003; 42: 83-8.59. Yu Z, Xu H, Wang H, Wang Y. Foxc1 promotes the proliferation of fibroblast-like synoviocytes in rheumatoid arthritis via PI3K/AKT signalling pathway. Tissue Cell. 2018; 53: 15-22.60. Gough NR. Focus issue: Wnt and beta-catenin signaling in development and disease. Sci Signal. 2012; 5: eg2.61. Nelson WJ, Nusse R. Convergence of Wnt, beta-catenin, and cadherin pathways. Science. 2004; 303: 1483-7.62. Moon RT, Kohn AD, De Ferrari GV, Kaykas A. WNT and beta-catenin signalling: diseases and therapies. Nat Rev Genet. 2004; 5: 691-701.63. Sen M, Lauterbach K, El-Gabalawy H, Firestein GS, Corr M, Carson DA. Expression and function of wingless and frizzled homologs in rheumatoid arthritis. Proc Natl Acad Sci U S A. 2000; 97: 2791-6.64. Sen M, Chamorro M, Reifert J, Corr M, Carson DA. Blockade of Wnt-5A/frizzled 5 signaling inhibits rheumatoid synoviocyte activation. Arthritis Rheum. 2001; 44: 772-81.65. Sen M, Reifert J, Lauterbach K, Wolf V, Rubin JS, Corr M, et al. Regulation of fibronectin and metalloproteinase expression by Wnt signaling in rheumatoid arthritis synoviocytes. Arthritis Rheum. 2002; 46: 2867-77.66. Miao C, Chang J, Zhang G, Yu H, Zhou L, Zhou G, et al. CUL4B promotes the pathology of adjuvant-induced arthritis in rats through the canonical Wnt signaling. J Mol Med (Berl). 2018; 96: 495-511.67. Logan CY, Nusse R. The Wnt signaling pathway in development and disease. Annu Rev Cell Dev Biol. 2004; 20: 781-810.68. Zhang JG, Shi Y, Hong DF, Song M, Huang D, Wang CY, et al. MiR-148b suppresses cell proliferation and invasion in hepatocellular carcinoma by targeting WNT1/beta-catenin pathway. Sci Rep. 2015; 5: 8087.69. Shi Q, Shi X, Zuo G, Xiong W, Li H, Guo P, et al. Anticancer effect of 20(S)-
43
972973974975976977978979980981982983984985986987988989990991992993994995996997998999
1000100110021003100410051006100710081009101010111012101310141015
8586
ginsenoside Rh2 on HepG2 liver carcinoma cells: Activating GSK-3beta and degrading beta-catenin. Oncol Rep. 2016; 36: 2059-70.70. Lu Z, Chang L, Zhou H, Liu X, Li Y, Mi T, et al. Arctigenin Attenuates Tumor Metastasis Through Inhibiting Epithelial-Mesenchymal Transition in Hepatocellular Carcinoma via Suppressing GSK3beta-Dependent Wnt/beta-Catenin Signaling Pathway In Vivo and In Vitro. Front Pharmacol. 2019; 10: 937.71. Mehta BB, Tiwari A, Sharma S, Shukla A, Sharma M, Vasishta RK, et al. Amelioration of collagen antibody induced arthritis in mice by an antibody directed against the fibronectin type III repeats of tenascin-C: Targeting fibronectin type III repeats of tenascin-C in rheumatoid arthritis. Int Immunopharmacol. 2018; 58: 15-23.72. Araki Y, Tsuzuki Wada T, Aizaki Y, Sato K, Yokota K, Fujimoto K, et al. Histone Methylation and STAT-3 Differentially Regulate Interleukin-6-Induced Matrix Metalloproteinase Gene Activation in Rheumatoid Arthritis Synovial Fibroblasts. Arthritis Rheumatol. 2016; 68: 1111-23.73. Zhou L, Chen X, Lu M, Wu Q, Yuan Q, Hu C, et al. Wnt/beta-catenin links oxidative stress to podocyte injury and proteinuria. Kidney Int. 2019; 95: 830-45.74. Thomas RS, Clarke AR, Duance VC, Blain EJ. Effects of Wnt3A and mechanical load on cartilage chondrocyte homeostasis. Arthritis Res Ther. 2011; 13: R203.75. Lin JC, Chang RL, Chen YF, Yang JJ, Baskaran R, Chung LC, et al. beta-Catenin overexpression causes an increase in inflammatory cytokines and NF-kappaB activation in cardiomyocytes. Cell Mol Biol (Noisy-le-grand). 2016; 63: 17-22.76. Li GQ, Fang YX, Liu Y, Meng FR, Wu X, Zhang CW, et al. MALAT1-Driven Inhibition of Wnt Signal Impedes Proliferation and Inflammation in Fibroblast-Like Synoviocytes Through CTNNB1 Promoter Methylation in Rheumatoid Arthritis. Hum Gene Ther. 2019; 30: 1008-22.77. Manwani B, Liu F, Scranton V, Hammond MD, Sansing LH, McCullough LD. Differential effects of aging and sex on stroke induced inflammation across the lifespan. Exp Neurol. 2013; 249: 120-31.78. Shen WS, Xu XQ, Zhai NN, Zhou ZS, Shao J, Yu YH. Potential mechanisms of microRNA-141-3p to alleviate chronic inflammatory pain by downregulation of downstream target gene HMGB1: in vitro and in vivo studies. Gene Ther. 2017; 24: 353-60.79. Zhang HJ, Wei QF, Wang SJ, Zhang HJ, Zhang XY, Geng Q, et al. LncRNA HOTAIR alleviates rheumatoid arthritis by targeting miR-138 and inactivating NF-kappaB pathway. Int Immunopharmacol. 2017; 50: 283-90.80. Campo GM, Avenoso A, Campo S, D'Ascola A, Nastasi G, Calatroni A. Molecular size hyaluronan differently modulates toll-like receptor-4 in LPS-induced inflammation in mouse chondrocytes. Biochimie. 2010; 92: 204-15.
Figure and Figure Legends
44
101610171018101910201021102210231024102510261027102810291030103110321033103410351036103710381039104010411042104310441045104610471048104910501051105210531054
1055
8788
Figure 1. FoxC1 and β-catenin are significantly upregulated in the synovium and
SFs of RA patients and CIA rats. (A) The expression of FoxC1 and β-catenin in
synovial tissues of RA patients (n=20) and CIA rats (n=6) was detected by
immunohistochemistry, and corresponding control groups (control patients (n=10),
normal rats (n=6)) were set up. Typical images and IHC scores were shown. Original 45
1056
1057
1058
1059
1060
10618990
magnification ×200, original magnification ×400. (B) The protein expression of
FoxC1 and β-catenin in synovial tissues of RA patients (n=20) and CIA rats (n=6)
was detected by WB, and corresponding control groups (control patients (n=10),
normal rats (n=6)) were set up. (C) The mRNA expression of FoxC1 and β-catenin in
synovial tissues of RA patients (n=20) and CIA rats (n=6) was detected by RT-PCR,
and corresponding control groups (control patients (n=10), normal rats (n=6)) were
set up. (D) The expression sites of FoxC1 and β-catenin in RASFs were observed by
immunofluorescence and the corresponding control SFs (n=4) were set up. Original
magnification ×200. (E) The protein and mRNA expression of FoxC1 and β-catenin
in SFs of RA patients (n=6) were analyzed by western blotting and qRT-PCR and the
corresponding control SFs (n=6) were set up. (F) The protein and mRNA expression
of FoxC1 and β-catenin in SFs of CIA rats (n=6) were analyzed by western blotting
and qRT-PCR and the corresponding normal SFs (n=6) were set up. Experiments
were independently repeated three times. The data were expressed as mean ± SD.
*p<0.05, **p<0.01, ***p<0.001, t-test. Scale bars: 50 μm.
46
1062
1063
1064
1065
1066
1067
1068
1069
1070
1071
1072
1073
1074
1075
1076
9192
Figure 2. In RASFs, FoxC1 promotes proliferation, migration, and invasion of
the cells, stimulates proinflammatory cytokine production and reduces anti-
inflammatory cytokine levels. (A) The CCK-8 assay was used to evaluate cell
proliferation after overexpression (LVFoxC1, n=4) or inhibition (SiFoxC1, n=4) of
FoxC1 in RASFs, and corresponding control groups (n=8) were set up. (B) Wound
healing through RASFs (LVFoxC1 (n=4), SiFoxC1 (n=4) and control (n=8))
migration was observed sequentially (0 h, 24 h and 48 h) by microscopy. Original
magnification ×100. The black lines were used to mark the general area of the wound.
47
1077
1078
1079
1080
1081
1082
1083
1084
1085
9394
Wound area was quantified by Image J. (C) Invasion of RASFs (LVFoxC1 (n=3),
SiFoxC1 (n=3) and control (n=6)) was determined by transwell assays (48 h).
Original magnification ×200. (D) Inflammatory cytokines concentration in culture
supernatant of RASFs (LVFoxC1 (n=4), SiFoxC1 (n=4) and control (n=8)) was
measured by ELISA. Experiments were independently repeated three times. The data
were expressed as mean ± SD. *p<0.05, **p<0.01, ***p<0.001, ****p<0.0001, t-test.
Scale bars: 100 μm.
48
1086
1087
1088
1089
1090
1091
1092
9596
Figure 3. FoxC1 induces pathological changes in RASFs through β-Catenin. (A)
WB and qRT-PCR methods were used to detect protein and gene changes in FoxC1,
β-catenin, GSK3β, cyclin D1, c-Myc, fibronectin, and MMP3 in FoxC1 inhibited
49
1093
1094
1095
1096
9798
RASFs (SiFoxC1, n=6), and corresponding control group (n=6) was set. (B) WB and
qRT-PCR methods were used to detect protein and gene changes in FoxC1, β-catenin,
GSK3β, cyclin D1, c-Myc, fibronectin, and MMP3 in FoxC1 overexpressed RASFs
(LVFoxC1, n=6), and corresponding control group (n=6) was set. (C) WB and qRT-
PCR methods were used to detect protein and gene changes in β-catenin, cyclin D1, c-
Myc, fibronectin, and MMP3 in overexpression β-catenin SiFoxC1-RASFs (n=5), and
corresponding control group (n=5) was set. (D) WB and qRT-PCR methods were
used to detect protein and gene changes in β-catenin, cyclin D1, c-Myc, fibronectin,
and MMP3 in β-catenin-knockdown LVFoxC1-RASFs (n=5), and corresponding
control group (n=5) was set. Experiments were independently repeated three times.
The data were expressed as mean ± SD. *p<0.05, **p<0.01, ***p<0.001, t-test.
50
1097
1098
1099
1100
1101
1102
1103
1104
1105
1106
1107
99100
Figure 4. FoxC1 induces pathological changes in RASFs through β-Catenin. (A)
The CCK-8 assay was used to evaluate cell proliferation after overexpression β-
catenin SiFoxC1-RASFs (n=4), β-catenin- knockdown LVFoxC1-RASFs (n=4) in
RASFs, and corresponding control groups (n=8) were set up. (B) Wound healing
through RASFs (overexpression β-catenin SiFoxC1-RASFs (n=4), β-catenin-
51
1108
1109
1110
1111
1112
1113
101102
knockdown LVFoxC1-RASFs (n=4) and corresponding control groups (n=8)
migration were observed sequentially (0 h, 24 h and 48 h) by microscopy. Original
magnification ×100. The black lines were used to mark the general area of the wound.
(C) Invasion of RASFs (overexpression β-catenin SiFoxC1-RASFs (n=3), β-catenin-
knockdown LVFoxC1-RASFs (n=3) and corresponding control groups (n=6)) was
determined by transwell assays (48 h). Original magnification ×200. (D)
Inflammatory cytokines concentration in culture supernatant of RASFs
(overexpression β-catenin SiFoxC1-RASFs (n=4), β-catenin-knockdown LVFoxC1-
RASFs (n=4) and corresponding control groups (n=8)) was measured by ELISA.
Experiments were independently repeated three times. The data were expressed as
mean ± SD. *p<0.05, **p<0.01, ***p<0.001, ****p<0.0001, t-test. Scale bars: 100
μm.
Figure 5. FoxC1 binds to the β-catenin promoter and induces
52
1114
1115
1116
1117
1118
1119
1120
1121
1122
1123
1124
1125
1126
1127
103104
pathological changes in RASFs. (A)The co-immunoprecipitation assay was used to
detect the interaction of FoxC1 and β-catenin in RASFs (n=3). (B) Luciferase reporter
assays were used to prove that the relationship between FoxC1 and β-catenin
promoter in RASFs (n=3). (C) ChIP-qRT-PCR analysis confirmed the
immunoprecipitation of FoxC1 and BS1 (n=3). Experiments were independently
repeated three times. The data were expressed as mean ± SD. *p<0.05, **p<0.01, t-
test, one-way ANOVA.
53
1128
1129
1130
1131
1132
1133
1134
105106
Figure 6. MiR-141-3p binds to the FoxC1 3′UTR and influences the regulation of β-
catenin by FoxC1. (A) The expression of miRNAs in synovial tissues of RA patients
(n=20) and RASFs (n=6) was detected by qRT-PCR, and corresponding control
groups (control patients synovial tissue (n=10), control SFs (n=6)) were set up. (B)
Dual-luciferase assay confirmed the binding of MiR-141-3p to FoxC1 3′UTR (n=3).
54
1135
1136
1137
1138
1139
1140
107108
(C) WB and qRT-PCR methods were used to detect protein and gene changes in
FoxC1, β-catenin in overexpression miR-141-3p RASFs (n=5), miR-141-3p
knockdown RASFs (n=5), and corresponding control groups (n=10) were set. (D) WB
and qRT-PCR methods were used to detect protein and gene changes in FoxC1, β-
catenin in overexpression miR-141-3p LVFoxC1-RASFs (n=5), miR-141-3p
knockdown SiFoxC1-RASFs (n=5), and corresponding control groups (n=10) were
set. Experiments were independently repeated three times. The data were expressed as
mean ± SD. *p<0.05, **p<0.01, ***p<0.001, t-test, one-way ANOVA.
55
1141
1142
1143
1144
1145
1146
1147
1148
109110
Figure 7. Role of the miR-141-3p/FoxC1/β-catenin axis in LPS-induced
inflammatory SFs. (A) qRT-PCR was used to detect gene changes in miR-141-3p in
LPS-induced SFs (n=6), and the corresponding control group (n=6) was set. (B) WB
and qRT-PCR methods were used to detect protein and gene changes in FoxC1, β-
catenin, cyclin D1, c-Myc, fibronectin, and MMP3 in LPS-induced SFs (n=6), and
56
1149
1150
1151
1152
1153
1154
111112
corresponding control group (n=6) was set. (C-D) WB and qRT-PCR methods were
used to detect protein and gene changes in FoxC1, β-catenin, cyclin D1, c-Myc,
fibronectin, and MMP3 in LPS-induced SFs (n=5), overexpression miR-141-3p LPS-
induced SFs (n=5), FoxC1 knockdown LPS-induced SFs (n=5). (E) ELISA assay was
used to evaluate the expression of inflammatory factors in SFs medium (n=4).
Experiments were independently repeated three times. The data were expressed as
mean ± SD. *p<0.05, **p<0.01, ***p<0.001, t-test.
Figure 8. FoxC1 binds to the β-catenin promoter and also had a significantly
stronger effect in LPS-induced SFs. ChIP and real-time PCR assays were used to
measure FoxC1 bound to the β-catenin promoter in LPS-induced SFs (n=3),
overexpression miR-141-3p LPS-induced SFs (n=3) and FoxC1 knockdown LPS-
induced SFs (n=3). Experiments were independently repeated three times. The data
57
1155
1156
1157
1158
1159
1160
1161
1162
1163
1164
1165
1166
1167
113114

were expressed as mean ± SD. *p<0.05, **p<0.01, ***p<0.001, t-test
Figure 9. Intra-ankle injection of a miR-141-3p agomir /FoxC1-specific siRNA
hinders CIA development in rats. (A) In vivo imaging results showed that miR-141-
3p agomir and FoxC1-specific siRNA could be expressed in the ankle joint of rats for
at least 7 days. (B) Clinical arthritis score and ankle joint swelling in the arthritic rats
were evaluated (n=6). (C) Micro-CT was used to measure bone destruction and bone
density (n=6). The data were expressed as mean ± SD. *p<0.05, **p<0.01,
***p<0.001,****p<0.0001 versus the normal group, ### p<0.001 versus the model
group. one-way ANOVA.
58
1168
1169
1170
1171
1172
1173
1174
1175
1176
1177
115116
Figure 10. Morphology and iconography study of rat treatment by miR-141-3p
agomir/FoxC1-specific siRNA. The bone trabecular of the left calcaneus was chosen
as region of interest (ROI). Micro-CT was used to measure ankle bone parameters.
The data were expressed as mean ± SD. *p<0.05, **p<0.01, ***p<0.001 versus the
normal group, #p<0.05, ##p<0.01, ###p<0.001 versus the model group. One-way
ANOVA.
59
1178
1179
1180
1181
1182
1183
1184
117118

Figure 11. Expression levels of FoxC1 and β-catenin after injection of miR-141-3p
agomir/FoxC1-specific siRNA in CIA rats. Immunohistochemistry and IHC scores
were used to evaluate the expression of FoxC1 and β-catenin after injection of miR-
141-3p agomir/FoxC1-specific siRNA. Original magnification ×200, original
magnification ×400. Experiments were independently repeated three times. The data
were expressed as mean ± SD. *p<0.05, **p<0.01, **** p<0.0001 versus the normal
group, ##p<0.01 versus the model group. One-way ANOVA. Scale bars: 50μm.
60
1185
1186
1187
1188
1189
1190
1191
1192
119120
Figure 12. Intra-ankle injection of a miR-141-3p agomir /FoxC1-specific siRNA
hinders CIA development in rats. (A) HE staining and synovial inflammation score
were used to assess synovial proliferation and inflammation (n=6). The black arrow
was used to mark the synovial position of the ankle. (B) The degree of cartilage
damage in the ankle was evaluated by Safranin O/Fast Green staining and cartilage
erosion score (n=6). The arrows were used to mark the cartilage position. Black
arrows were used to mark the cartilage surface of the ankle. All values were expressed
as mean ± SD. **p<0.01, ****p<0.0001 versus the normal group, #p<0.05, ##p<0.01
versus the model group. one-way ANOVA. Original magnification ×20. Scale bars:
500 μm.
61
1193
1194
1195
1196
1197
1198
1199
1200
1201
1202
1203
121122
Figure 13. IL-1β and IL-6 expression in CIA rats after treatment by miR-141-3p
agomir/FoxC1-specific siRNA. Immunohistochemistry and IHC scores were used to
evaluate the expression of IL-1β and IL-6 after injection of miR-141-3p
agomir/FoxC1-specific siRNA. Original magnification ×200, original magnification
×400. Experiments were independently repeated three times. The data were expressed
as mean ± SD. ***p<0.001, **** p<0.0001 versus the normal group, ###p<0.001,
####p<0.0001 versus the model group. One-way ANOVA. Scale bars: 50μm.
62
1204
1205
1206
1207
1208
1209
1210
1211
123124
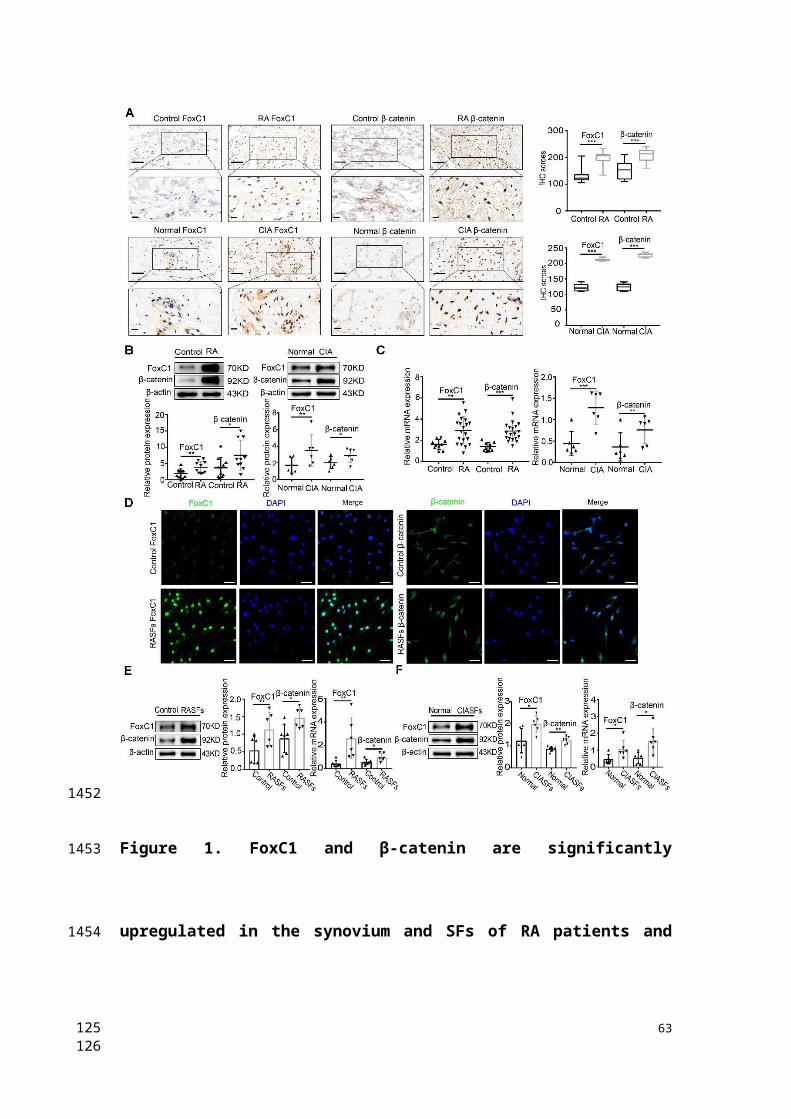
Figure 14. TNF-α and IL-10 expression in CIA rats after treatment by FoxC1-
specific siRNA/miR-141-3p agomir. Immunohistochemistry and IHC scores were
used to evaluate the expression of TNF-α and IL-10 after the injection of miR-141-3p
agomir/FoxC1-specific siRNA. Original magnification ×200, original magnification
×400. Experiments were independently repeated three times. The data were expressed
as mean ± SD. ***p<0.001, **** p<0.0001 versus the normal group, ###p<0.001,
####p<0.0001 versus the model group. One-way ANOVA. Scale bars: 50μm.
63
1212
1213
1214
1215
1216
1217
1218
1219
1220
125126


![[XLS] · Web viewCatNo ProductName Package Size GTX100001 GPR30 antibody 100μl GTX100003 Melatonin Receptor 1A antibody GTX100004 GPR18 antibody [N2C1], Internal GTX100005 GPR37L1](https://static.fdocument.org/doc/165x107/5abf76f37f8b9ab02d8e33f0/xls-viewcatno-productname-package-size-gtx100001-gpr30-antibody-100l-gtx100003.jpg)