vwruk.vwr-cmd.com/ex/downloads/life_science/biomarke/0509/biomarke... · 400 x 25 μl, (1 x 5 ml)...
48
Issue 22 Spring 2009 vwr.com New VWRbioMarke partners Cayman, Corning, G-Biosciences and SoluLinK Great NEW products including VWR Collection Cryopro, Wheaton’s CRIMPenstein TM , Spectrum’s Tube-A-Lyzer TM Novel applications include papers from BTX Harvard Apparatus Thermo Scientific Nunc
Transcript of vwruk.vwr-cmd.com/ex/downloads/life_science/biomarke/0509/biomarke... · 400 x 25 μl, (1 x 5 ml)...

Issue 22 Spring 2009
vwr.com
New VWRbioMarke partnersCayman, Corning, G-Biosciences and SoluLinK
Great NEW products includingVWR Collection Cryopro, Wheaton’s CRIMPensteinTM, Spectrum’s Tube-A-LyzerTM
Novel applications include papers fromBTX Harvard ApparatusThermo Scientific Nunc
VWR I n t e r n a t i o n a l VWRbioMarke Issue 22 S p r i n g 2 0 0 92
This first edition of VWRbioMarke is our biggest journal yet with:
New partners, new products and lots of applications to help you in your life sciences work.
Joining us in 2009 are Cayman, G-Biosciences and SoluLinK – all highly specialist reagent companies offering unique cutting edge technology products. We welcome Corning back to the programme and are pleased to focus on their excellent microwell technology. Our long standing members have plenty to contribute too – with some new innovations in some interesting areas such as sample preparation by Spectrum and the labour-saving ingenuity of CrimpensteinTM crimper and capper from Wheaton. Pall enhance their chromatography range whilst BTX offer an innovative method of transgenesis. We’re also proud to launch the VWR Collection range of Cryopreservation vessels – an extensive portfolio that will suit most activities.
Included with this issue of the VWRbioMarke magazine is the VWRbioMarke Shop, the tabloid filled with special offers on key products – often linked to the magazine articles. This year everyone is feeling the pinch of rising prices and spending restrictions so make sure that you have a look through this flyer to help you get the most out of your budget!
Very best regards The VWRbioMarke Team
P.S To make sure that you get all the news about these and other new items as well as special offers and new catalogues check out the life sciences microsite at www.vwr.com. You can register for the life sciences e-newsletter there too!.
editorial
table of contents
EditorVWR International Europe bvbaResearchpark Haasrode 2020Geldenaaksebaan 4643001 LeuvenBelgium
CopywritingVWR International Europe bvba
Layout and typesettingMarketing Services VWR
PrintingStork, Bruchsal, GermanyNo part of this publication may be reproduced or copied without prior permission by writing of VWR International Europe.
Run72 250 copiesPublication date: May 2009
Due to the high sales volume of promoted articles some items may be temporarily out of stock - VWR Terms and Conditions of Sale apply.
Molecular biologyExperience blue - QPCR master mixes from Thermo Scientific . . . . . . . . . . . . . . . . . . . . . . . . . . . . . . . . . . . . . . . . . . . . . . . . . . . . . 3New application from BTX - Transgenesis via permanent integration of genes in repopulating spermatogonial cells . . 45 PRIME FastPlasmid Mini Kit - a faster way to plasmid DNA . . . . . . . . . . . . . . . . . . . . . . . . . . . . . . . . . . . . . . . . . . . . . . . . . . . . . 6Quanta PerfeCTa™ qPCR SuperMixes . . . . . . . . . . . . . . . . . . . . . . . . . . . . . . . . . . . . . . . . . . . . . . . . . . . . . . . . . . . . . . . . . . . . . . . . . . . 8Magnetic Bead-Based Total RNA Isolation from tissue, culture cells and whole blood from Omega Bio-tek . . . . . . . . . . 10GE healthcare’s enzymatic purification of PCR Products ExoSAP-IT - rapid and efficient . . . . . . . . . . . . . . . . . . . . . . . . . . . . 12
Cell biologyCayman’s new assay quantifies oxidative DNA damage quickly and affordably . . . . . . . . . . . . . . . . . . . . . . . . . . . . . . . . . . . . 14VWR Collection Cryopro cryogenic vessels . . . . . . . . . . . . . . . . . . . . . . . . . . . . . . . . . . . . . . . . . . . . . . . . . . . . . . . . . . . . . . . . . . . . . . 16Real-time measurement of cell migration and invasion –with BD FluoroBlokTM Insert Systems . . . . . . . . . . . . . . . . . . . . . . 18A comparative performance study with MF75 filter units from Thermo Scientific . . . . . . . . . . . . . . . . . . . . . . . . . . . . . . . . . . . 20Impact of assay miniaturisation on HTRF® performance with Corning . . . . . . . . . . . . . . . . . . . . . . . . . . . . . . . . . . . . . . . . . . . . 22Cell Harvesting by temperature reduction using Thermo Scientific temperature-responsive cell cultureware . . . . . . . . . 24BRANDplates® cellGradeTM line, proliferation and adhesion of HepG2 cells on different cell culture surfaces . . . . . . . . 26
ElectrophoresisApplichem run a comparison of SDS polyacrylamide gel electrophoresis according to Laemmli and Ahn et al. . . . . . . . 28ClearPAGE Precast Gels from CBS Scientific . . . . . . . . . . . . . . . . . . . . . . . . . . . . . . . . . . . . . . . . . . . . . . . . . . . . . . . . . . . . . . . . . . . . . 30
ProteomicsCustom polyclonal peptide antibodies from Thermo Biopolymers . . . . . . . . . . . . . . . . . . . . . . . . . . . . . . . . . . . . . . . . . . . . . . . . . 32Pall’s new unique chromatography tools promote rapid and efficient protein purification . . . . . . . . . . . . . . . . . . . . . . . . . . 34ProteaseArrestTM protease inhibitor cocktail from G-Biosciences for >95% protease inhibition . . . . . . . . . . . . . . . . . . . . . 36How to Biotinylate with Quantifiable Results by SoluLinK . . . . . . . . . . . . . . . . . . . . . . . . . . . . . . . . . . . . . . . . . . . . . . . . . . . . . . . . 38
Liquid handlingUnique enhancements for the Thermo Scientific Multidrop Combi reagent dispensers . . . . . . . . . . . . . . . . . . . . . . . . . . . . . . 40Thermo Scientific Finnpipette F1 . . . . . . . . . . . . . . . . . . . . . . . . . . . . . . . . . . . . . . . . . . . . . . . . . . . . . . . . . . . . . . . . . . . . . . . . . . . . . . . 42Molecular BioProducts ART® Reload Pipette Tip System . . . . . . . . . . . . . . . . . . . . . . . . . . . . . . . . . . . . . . . . . . . . . . . . . . . . . . . . . 43
Sample preparationCRIMPenstein™ electric crimper/decapper from Wheaton . . . . . . . . . . . . . . . . . . . . . . . . . . . . . . . . . . . . . . . . . . . . . . . . . . . . . . . 44Spectrum introduces a new ready to use ‘dynamic’ dialysis device . . . . . . . . . . . . . . . . . . . . . . . . . . . . . . . . . . . . . . . . . . . . . . . . 46
5 Prime
ABgene
Applichem
BD Biosciences
BDH Prolabo
Bertin Technologies
Brand
BTX Harvard Apparatus
Cayman Chemical
C.B.S. Scientific
Corning
G-Biosciences
GE Healthcare
Mole Genetics
Nalgene
Nunc
Omega Bio-Tek
Pall Life Sciences
Quanta Biosciences
Sartorius Stedim Biotech
SoluLinK
Spectrum Laboratories
Thermo Biopolymers
Thermo Scientific
VWR Collection
Wheaton Science Products
VWR I n t e r n a t i o n a l VWRbioMarke Issue 22 S p r i n g 2 0 0 9 3
For more information on these products contact your local VWR sales office, send an e-mail to [email protected] or visit our website www.vwr.comMolecular biology
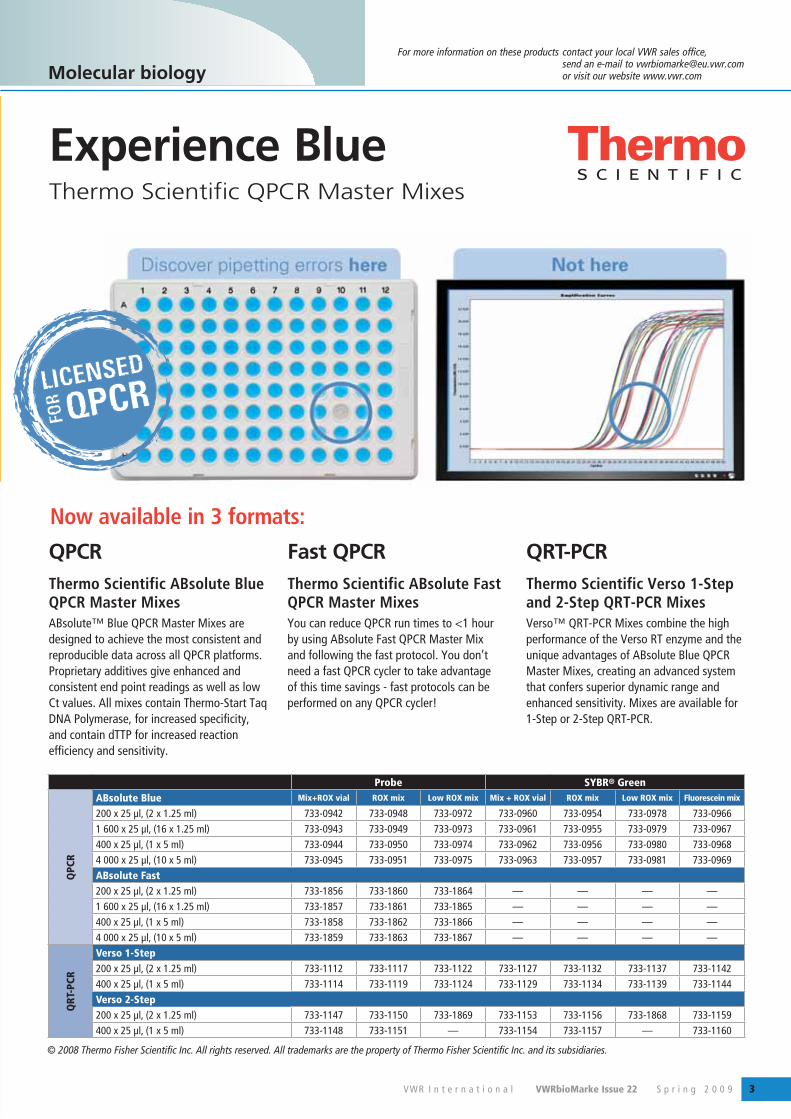
Experience Blue Thermo Scientific QPCR Master Mixes
QPCRThermo Scientific ABsolute Blue QPCR Master MixesABsolute™ Blue QPCR Master Mixes are designed to achieve the most consistent and reproducible data across all QPCR platforms. Proprietary additives give enhanced and consistent end point readings as well as low Ct values. All mixes contain Thermo-Start Taq DNA Polymerase, for increased specificity, and contain dTTP for increased reaction efficiency and sensitivity.
Fast QPCRThermo Scientific ABsolute Fast QPCR Master MixesYou can reduce QPCR run times to <1 hour by using ABsolute Fast QPCR Master Mix and following the fast protocol. You don’t need a fast QPCR cycler to take advantage of this time savings - fast protocols can be performed on any QPCR cycler!
QRT-PCRThermo Scientific Verso 1-Step and 2-Step QRT-PCR MixesVerso™ QRT-PCR Mixes combine the high performance of the Verso RT enzyme and the unique advantages of ABsolute Blue QPCR Master Mixes, creating an advanced system that confers superior dynamic range and enhanced sensitivity. Mixes are available for 1-Step or 2-Step QRT-PCR.
Probe SYBR® Green
QPC
R
ABsolute Blue Mix+ROX vial ROX mix Low ROX mix Mix + ROX vial ROX mix Low ROX mix Fluorescein mix
200 x 25 μl, (2 x 1.25 ml) 733-0942 733-0948 733-0972 733-0960 733-0954 733-0978 733-09661 600 x 25 μl, (16 x 1.25 ml) 733-0943 733-0949 733-0973 733-0961 733-0955 733-0979 733-0967400 x 25 μl, (1 x 5 ml) 733-0944 733-0950 733-0974 733-0962 733-0956 733-0980 733-09684 000 x 25 μl, (10 x 5 ml) 733-0945 733-0951 733-0975 733-0963 733-0957 733-0981 733-0969ABsolute Fast200 x 25 μl, (2 x 1.25 ml) 733-1856 733-1860 733-1864 — — — —1 600 x 25 μl, (16 x 1.25 ml) 733-1857 733-1861 733-1865 — — — —400 x 25 μl, (1 x 5 ml) 733-1858 733-1862 733-1866 — — — —4 000 x 25 μl, (10 x 5 ml) 733-1859 733-1863 733-1867 — — — —
QRT
-PCR
Verso 1-Step200 x 25 μl, (2 x 1.25 ml) 733-1112 733-1117 733-1122 733-1127 733-1132 733-1137 733-1142400 x 25 μl, (1 x 5 ml) 733-1114 733-1119 733-1124 733-1129 733-1134 733-1139 733-1144Verso 2-Step200 x 25 μl, (2 x 1.25 ml) 733-1147 733-1150 733-1869 733-1153 733-1156 733-1868 733-1159400 x 25 μl, (1 x 5 ml) 733-1148 733-1151 — 733-1154 733-1157 — 733-1160
© 2008 Thermo Fisher Scientific Inc. All rights reserved. All trademarks are the property of Thermo Fisher Scientific Inc. and its subsidiaries.
Now available in 3 formats:
VWR I n t e r n a t i o n a l VWRbioMarke Issue 22 S p r i n g 2 0 0 94
Presently production of transgenic mice is a labour intensive process. Requiring skilled personnel, costly infrastructure and the
expense of numerous animals. The collection of many zygotes from mice results in the necessary termination of the animals. This technique describes a simple reproducible nonterminal method for transfecting genes in undifferentiated
spermatogonia through in vivo electroporation of the testis: about 94% of male mice electroporated with different transgenes successfully sired transgenic pups. Such electroporated males provide a valuable resource for continuous production of transgenic founders for more than a year. The technique solves many of the issues regarding cost, simplicity and avoids the termination of animals.
MethodsUsing FVB mice, various amount of linearised DNA were injected into the interstitium of one testis in varying areas. Using tweezertrode electrodes the testis was electroporated. The fore founder electroporated males were naturally mated with females and the offspring were screened for the presence of the transgene by PCR. The PCR results for all transgenic lines confirmed genomic integration of transgene.
ResultsSeventeen mice were electroporated using four different constructs and all except one produced transgenic pups, indicating a success rate of >94% for our method. The first transgenic progeny can be generated within 60 days of electroporation as compared to 82-177 days after in vivo viral transfection. Notably one of the fore founders produced transgenic offspring as long as 384 days
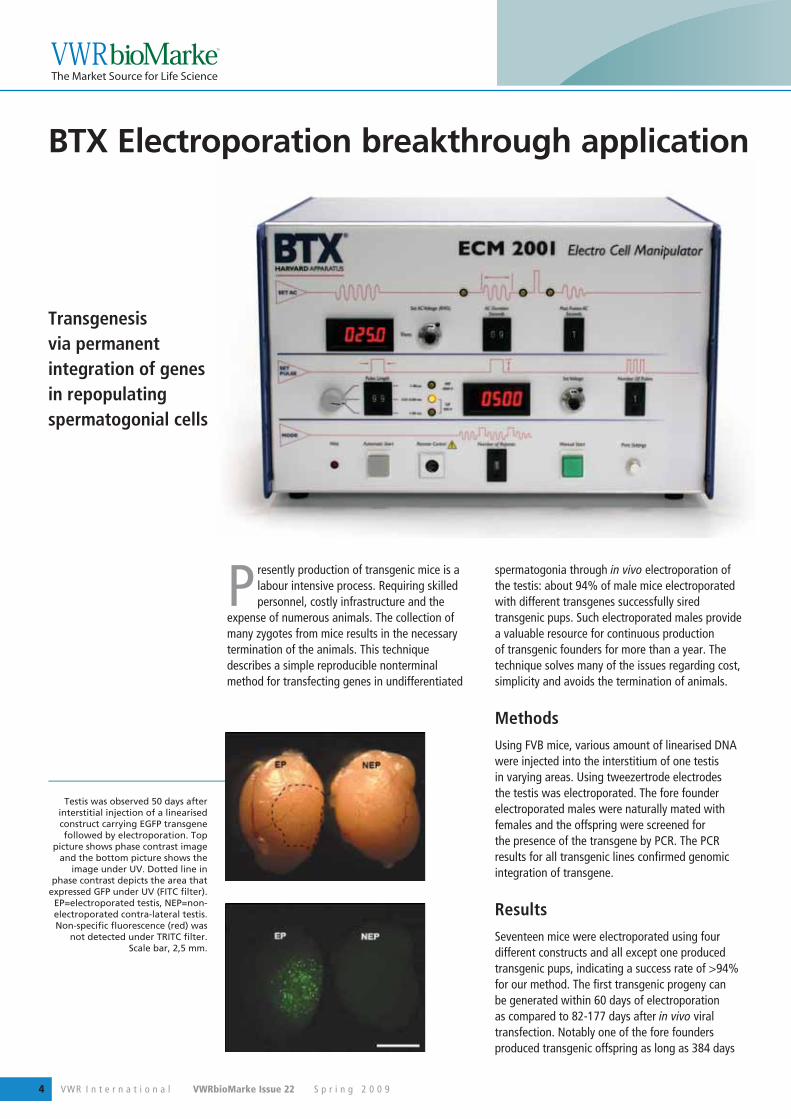
Transgenesis via permanent integration of genes in repopulating spermatogonial cells
BTX Electroporation breakthrough application
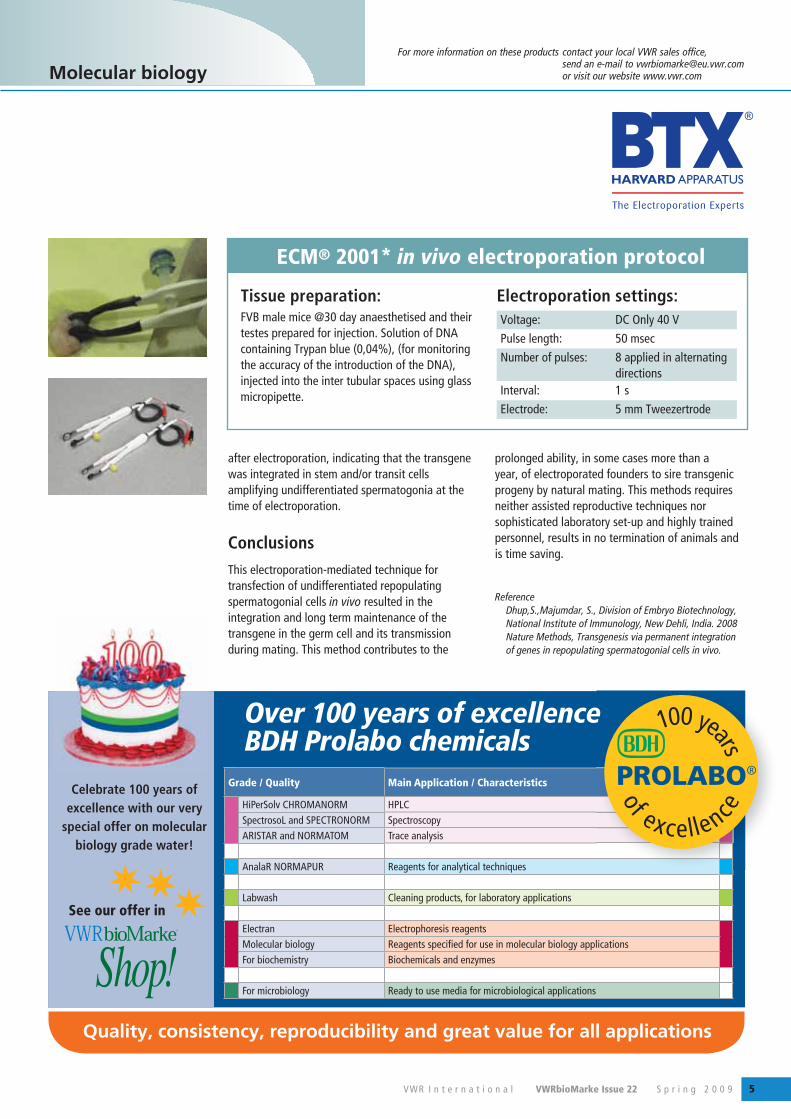
Testis was observed 50 days after interstitial injection of a linearised construct carrying EGFP transgene followed by electroporation. Top
picture shows phase contrast image and the bottom picture shows the
image under UV. Dotted line in phase contrast depicts the area that
expressed GFP under UV (FITC filter). EP=electroporated testis, NEP=non-electroporated contra-lateral testis. Non-specific fluorescence (red) was
not detected under TRITC filter. Scale bar, 2,5 mm.
VWR I n t e r n a t i o n a l VWRbioMarke Issue 22 S p r i n g 2 0 0 9 5
For more information on these products contact your local VWR sales office, send an e-mail to [email protected] or visit our website www.vwr.comMolecular biology
after electroporation, indicating that the transgene was integrated in stem and/or transit cells amplifying undifferentiated spermatogonia at the time of electroporation.
ConclusionsThis electroporation-mediated technique for transfection of undifferentiated repopulating spermatogonial cells in vivo resulted in the integration and long term maintenance of the transgene in the germ cell and its transmission during mating. This method contributes to the
prolonged ability, in some cases more than a year, of electroporated founders to sire transgenic progeny by natural mating. This methods requires neither assisted reproductive techniques nor sophisticated laboratory set-up and highly trained personnel, results in no termination of animals and is time saving.
Reference Dhup,S.,Majumdar, S., Division of Embryo Biotechnology,
National Institute of Immunology, New Dehli, India. 2008 Nature Methods, Transgenesis via permanent integration of genes in repopulating spermatogonial cells in vivo.
Tissue preparation:FVB male mice @30 day anaesthetised and their testes prepared for injection. Solution of DNA containing Trypan blue (0,04%), (for monitoring the accuracy of the introduction of the DNA), injected into the inter tubular spaces using glass micropipette.
Electroporation settings:Voltage: DC Only 40 V
Pulse length: 50 msec
Number of pulses: 8 applied in alternating directions
Interval: 1 s
Electrode: 5 mm Tweezertrode
ECM® 2001* in vivo electroporation protocol
Over 100 years of excellence BDH Prolabo chemicals
Grade / Quality Main Application / Characteristics
HiPerSolv CHROMANORM HPLCSpectrosoL and SPECTRONORM SpectroscopyARISTAR and NORMATOM Trace analysis
AnalaR NORMAPUR Reagents for analytical techniques
Labwash Cleaning products, for laboratory applications
Electran Electrophoresis reagentsMolecular biology Reagents specified for use in molecular biology applicationsFor biochemistry Biochemicals and enzymes
For microbiology Ready to use media for microbiological applications
e
Celebrate 100 years of excellence with our very
special offer on molecular biology grade water!
Quality, consistency, reproducibility and great value for all applications
VWR I n t e r n a t i o n a l VWRbioMarke Issue 22 S p r i n g 2 0 0 96
The 5 PRIME FastPlasmid Mini Kit provides a very rapid, non-organic means of isolating high-copy plasmid DNA from bacterial culture. This innovative technology reduces the time required by more than 50% compared to conventional plasmid purification by eliminating multiple solutions and time-consuming centrifugation steps.The eluted DNA is very pure and suitable in downstream applications such as restriction digestion and sequencing without any further purification. Comparisons between several commercial alkaline lysis purification kits and the 5 PRIME FastPlasmid chemistry show that DNA purified with the FastPlasmid Mini Kit performs at least as well in downstream applications while processing time is greatly reduced.
FastPlasmid Mini Kit - a faster way to plasmid DNA
Since 1979 the alkaline lysis technology (Birnboim & Doly, 1979) has been widely used to isolate plasmid DNA from E. coli.
This method was also the method of choice for all commercially available kits: three buffers to lyse the cells and a lengthy centrifugation step resulting in a clear lysate, from which the plasmid DNA can then be purified through binding to a suitable matrix or membrane.
In contrast, the FastPlasmid Mini Kit uses a single solution to resuspend and to lyse the bacteria, forming a clear, aqueous lysate without additional centrifugation. Plasmid DNA is then bound to a specialised membrane, washed, and eluted.
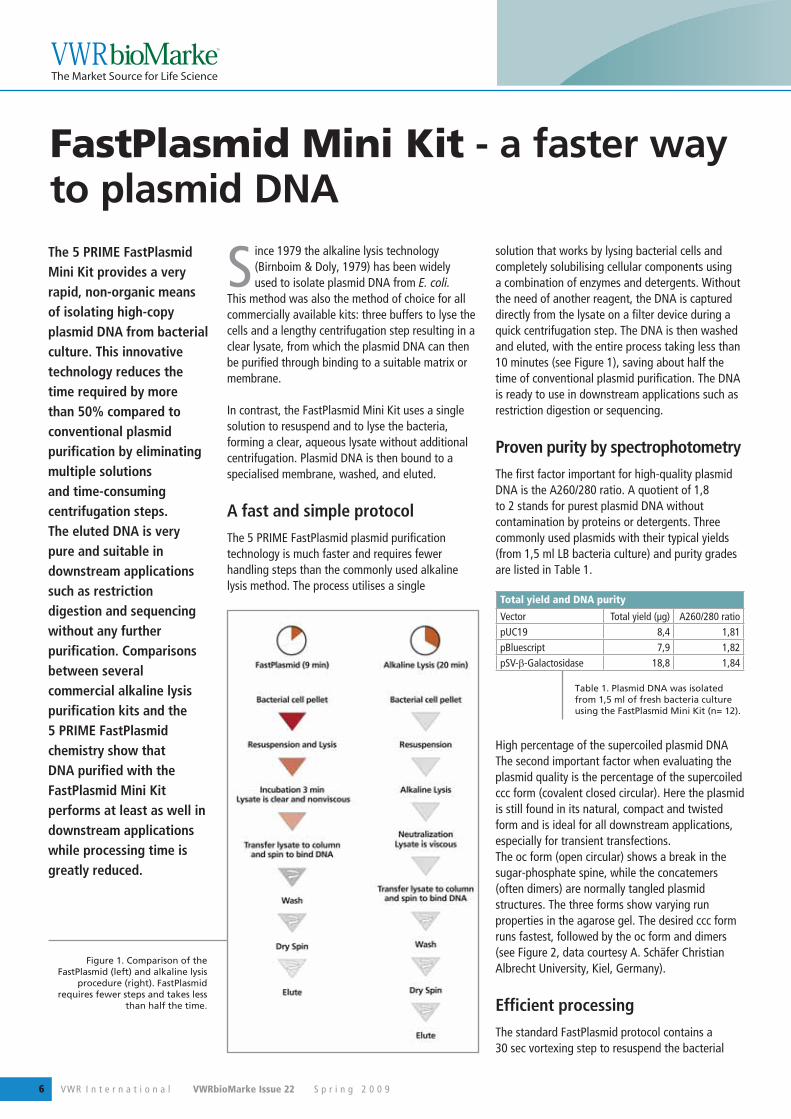
A fast and simple protocolThe 5 PRIME FastPlasmid plasmid purification technology is much faster and requires fewer handling steps than the commonly used alkaline lysis method. The process utilises a single
solution that works by lysing bacterial cells and completely solubilising cellular components using a combination of enzymes and detergents. Without the need of another reagent, the DNA is captured directly from the lysate on a filter device during a quick centrifugation step. The DNA is then washed and eluted, with the entire process taking less than 10 minutes (see Figure 1), saving about half the time of conventional plasmid purification. The DNA is ready to use in downstream applications such as restriction digestion or sequencing.
Proven purity by spectrophotometryThe first factor important for high-quality plasmid DNA is the A260/280 ratio. A quotient of 1,8 to 2 stands for purest plasmid DNA without contamination by proteins or detergents. Three commonly used plasmids with their typical yields (from 1,5 ml LB bacteria culture) and purity grades are listed in Table 1.
High percentage of the supercoiled plasmid DNAThe second important factor when evaluating the plasmid quality is the percentage of the supercoiled ccc form (covalent closed circular). Here the plasmid is still found in its natural, compact and twisted form and is ideal for all downstream applications, especially for transient transfections. The oc form (open circular) shows a break in the sugar-phosphate spine, while the concatemers (often dimers) are normally tangled plasmid structures. The three forms show varying run properties in the agarose gel. The desired ccc form runs fastest, followed by the oc form and dimers (see Figure 2, data courtesy A. Schäfer Christian Albrecht University, Kiel, Germany).
Efficient processingThe standard FastPlasmid protocol contains a 30 sec vortexing step to resuspend the bacterial
Figure 1. Comparison of the FastPlasmid (left) and alkaline lysis
procedure (right). FastPlasmid requires fewer steps and takes less
than half the time.
Total yield and DNA purity
Vector Total yield (μg) A260/280 ratiopUC19 8,4 1,81pBluescript 7,9 1,82pSV-β-Galactosidase 18,8 1,84
Table 1. Plasmid DNA was isolated from 1,5 ml of fresh bacteria culture using the FastPlasmid Mini Kit (n= 12).
VWR I n t e r n a t i o n a l VWRbioMarke Issue 22 S p r i n g 2 0 0 9 7
For more information on these products contact your local VWR sales office, send an e-mail to [email protected] or visit our website www.vwr.com
pellet and mix the sample thoroughly. When a large number of samples are processed concurrently, this vortexing step can be time consuming and is often abbreviated resulting in reduced yields. Alternatively, a 3 min incubation with rapid agitation using an multi-tube thermomixer (e.g. Eppendorf thermomixer) can be substituted to resuspend bacterial pellets. This alternative protocol provides an obvious advantage over the standard FastPlasmid protocol by decreasing processing time and insuring reproducible results for each sample.
Downstream applicationsThe quality of the plasmid DNA becomes evident in the reproducibility and excellence of the
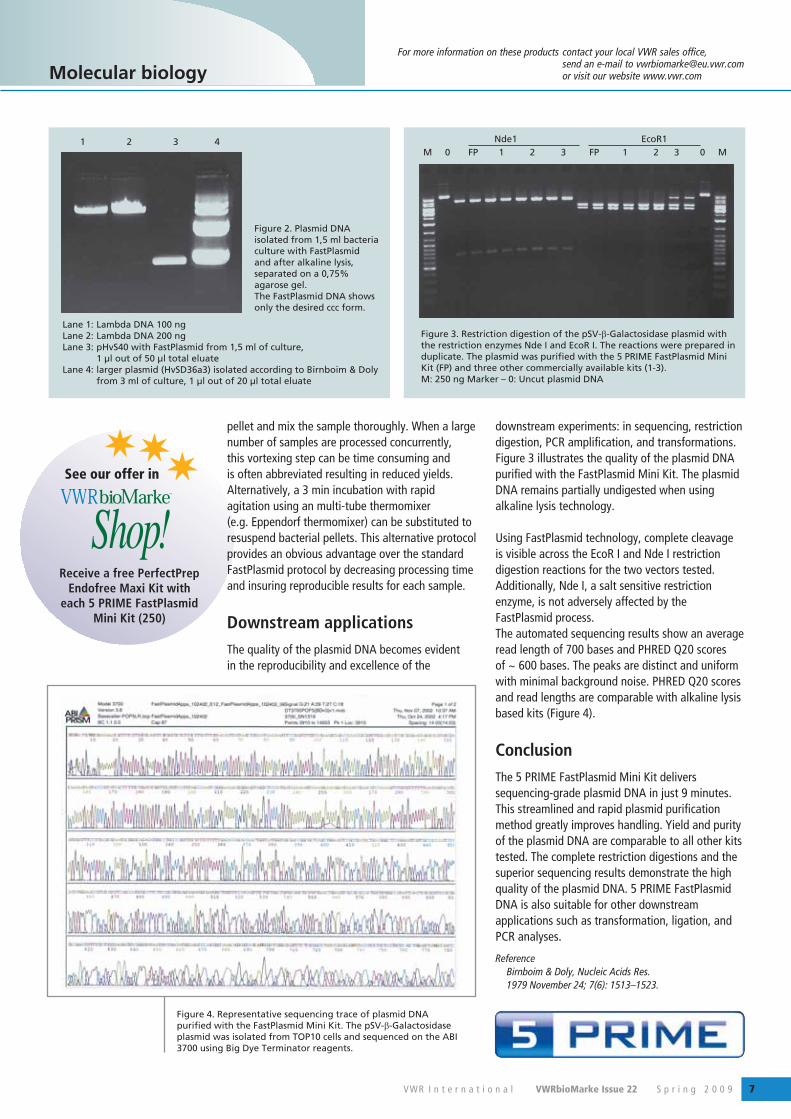
downstream experiments: in sequencing, restriction digestion, PCR amplification, and transformations.Figure 3 illustrates the quality of the plasmid DNA purified with the FastPlasmid Mini Kit. The plasmid DNA remains partially undigested when using alkaline lysis technology.
Using FastPlasmid technology, complete cleavage is visible across the EcoR I and Nde I restriction digestion reactions for the two vectors tested. Additionally, Nde I, a salt sensitive restriction enzyme, is not adversely affected by the FastPlasmid process. The automated sequencing results show an average read length of 700 bases and PHRED Q20 scores of ~ 600 bases. The peaks are distinct and uniform with minimal background noise. PHRED Q20 scores and read lengths are comparable with alkaline lysis based kits (Figure 4).
ConclusionThe 5 PRIME FastPlasmid Mini Kit delivers sequencing-grade plasmid DNA in just 9 minutes. This streamlined and rapid plasmid purification method greatly improves handling. Yield and purity of the plasmid DNA are comparable to all other kits tested. The complete restriction digestions and the superior sequencing results demonstrate the high quality of the plasmid DNA. 5 PRIME FastPlasmid DNA is also suitable for other downstream applications such as transformation, ligation, and PCR analyses.
Reference Birnboim & Doly, Nucleic Acids Res. 1979 November 24; 7(6): 1513–1523.
Molecular biology
Figure 4. Representative sequencing trace of plasmid DNA purified with the FastPlasmid Mini Kit. The pSV-β-Galactosidase plasmid was isolated from TOP10 cells and sequenced on the ABI 3700 using Big Dye Terminator reagents.
Nde1 EcoR1M 0 FP 1 2 3 FP 1 2 3 0 M
Figure 3. Restriction digestion of the pSV-β-Galactosidase plasmid with the restriction enzymes Nde I and EcoR I. The reactions were prepared in duplicate. The plasmid was purified with the 5 PRIME FastPlasmid Mini Kit (FP) and three other commercially available kits (1-3).M: 250 ng Marker – 0: Uncut plasmid DNA
Figure 2. Plasmid DNA isolated from 1,5 ml bacteria culture with FastPlasmid and after alkaline lysis, separated on a 0,75% agarose gel. The FastPlasmid DNA shows only the desired ccc form.
1 2 3 4
Lane 1: Lambda DNA 100 ngLane 2: Lambda DNA 200 ngLane 3: pHvS40 with FastPlasmid from 1,5 ml of culture,
1 μl out of 50 μl total eluateLane 4: larger plasmid (HvSD36a3) isolated according to Birnboim & Doly
from 3 ml of culture, 1 μl out of 20 μl total eluate
Receive a free PerfectPrep Endofree Maxi Kit with
each 5 PRIME FastPlasmid Mini Kit (250)
VWR I n t e r n a t i o n a l VWRbioMarke Issue 22 S p r i n g 2 0 0 98
PerfeCTa™ qPCR SuperMixesMore robust, specific and economic SNP genotyping
Single-nucleotide polymorphisms (SNPs) are the most common type of genetic variation in the human genome with over 6.5 million
validated SNPs, and close to 15 million non-redundant variations reported in dsSNP build 129. These genetically stable, single-base biallelic substitutions can occur both within and outside of genes and directly influence or associate with a variety of phenotypic traits including drug response and disease susceptibility and resistance. These properties make SNPs ideal genetic tools for mapping and studying the effects of genetic variations on biological functions at the cellular and organism level. Hence there is a need for the development of tools for the detection and quantification of SNPs that improve throughput and reduce assay costs.
One of the most widely used methods for SNP genotyping is the 5’-nuclease or TaqMan® assay (Livak et al., 1995, Nature Genetics 9: 341-312). The SNP region of interest is amplified by PCR using primers that flank the SNP sequence and two oligonucleotide probes, labelled with different fluorophores, that are complementary to each variant allele. Hybridisation and cleavage of each probe during PCR amplification allows discrimination of each SNP allele. Recent improvements in hydrolysis
probe design coupled with the availability of real-time PCR instruments, commercial SNP genotyping assays and software analysis packages have helped advance TaqMan allelic discrimination performance. Quanta Biosciences’ qPCR SuperMixes enable scientists interested in these genotyping applications to realise the most in terms of accuracy, throughput and economy, yielding the best possible cost per genotype on available real-time PCR platforms.
Cost per genotype can be reduced through enhanced sensitivity, speed and accuracy. Quanta’s PerfeCTaTM qPCR SuperMixes’ superior sensitivity requires one-half the primer and probe concentration as other leading products (see Figure 1) meaning twice as many experimental or patient samples can be run per assay kit. This can save up to a Euro (€1) per genotype. Capital equipment expenditures and instrument availability can also limit the scope or scale of genotyping projects. By reducing total cycling time (see Table 1) PerfeCTaTM qPCR SuperMixes enable larger projects without additional capital equipment expenditures. PerfeCTaTM SuperMixes suppress cross-reactivity between homologous sequences, improving detection and discrimination in SNP applications, providing well-separated clusters for clear genotyping results. Difficult genotypes are
Alle
le Y
(FA
M)
0.5
1.0
1.5
2.0
2.5
3.0
3.5
4.0
0.00.0
0.8 1.6 2.40.4 1.2 2.0
Allele X (VIC)
Allele X Allele Y Both NTC Undetermined
PerfeCTa™ qPCR SuperMixTaqMan® Genotyping Master Mix
5.0
12.0
0.0
2.0
4.0
6.0
8.0
10.0
0.0 1.0 2.0 3.0 4.0A
llele
Y (F
AM
)
Allele X (VIC)Allele X Allele Y Both NTC Undetermined
PerfeCTa™ qPCR SuperMixTaqMan® Genotyping Master Mix
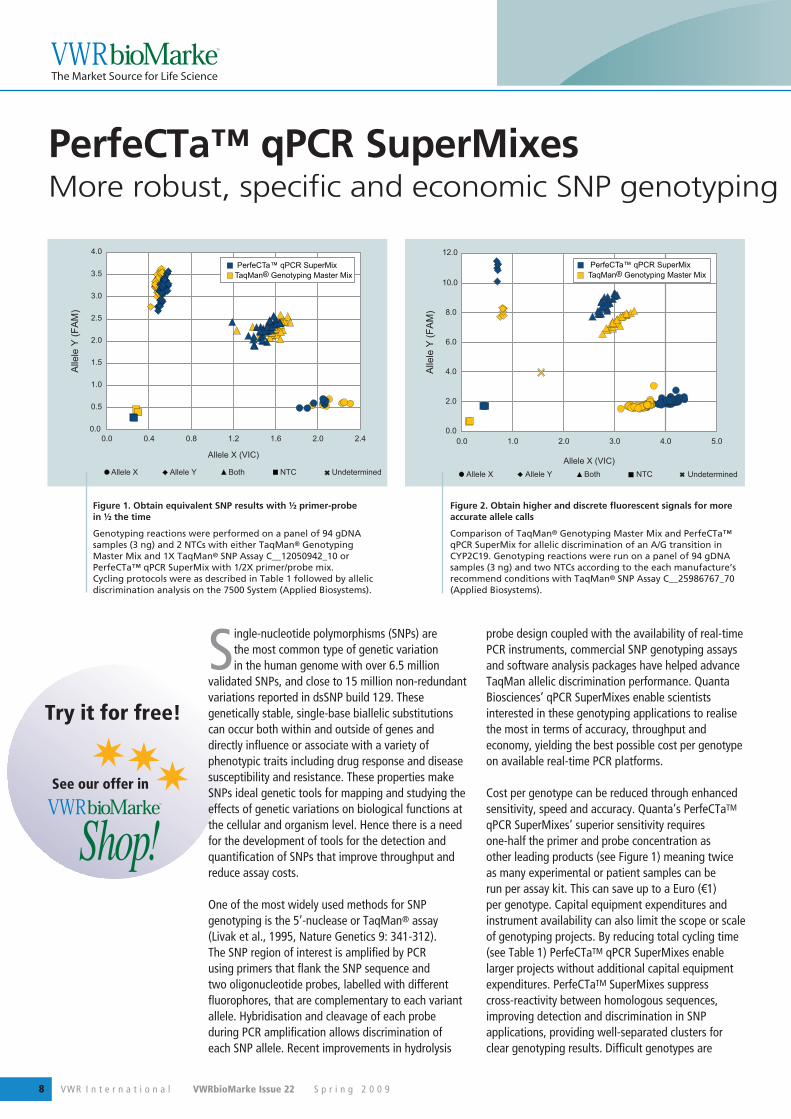
Figure 1. Obtain equivalent SNP results with ½ primer-probe in ½ the time
Genotyping reactions were performed on a panel of 94 gDNA samples (3 ng) and 2 NTCs with either TaqMan® Genotyping Master Mix and 1X TaqMan® SNP Assay C__12050942_10 or PerfeCTa™ qPCR SuperMix with 1/2X primer/probe mix. Cycling protocols were as described in Table 1 followed by allelic discrimination analysis on the 7500 System (Applied Biosystems).
Figure 2. Obtain higher and discrete fluorescent signals for more accurate allele calls
Comparison of TaqMan® Genotyping Master Mix and PerfeCTa™ qPCR SuperMix for allelic discrimination of an A/G transition in CYP2C19. Genotyping reactions were run on a panel of 94 gDNA samples (3 ng) and two NTCs according to the each manufacture’s recommend conditions with TaqMan® SNP Assay C__25986767_70 (Applied Biosystems).
Try it for free!
VWR I n t e r n a t i o n a l VWRbioMarke Issue 22 S p r i n g 2 0 0 9 9
For more information on these products contact your local VWR sales office, send an e-mail to [email protected] or visit our website www.vwr.com
with hydrolysis probe assays
accurately called (see Figure 2) leading to savings through fewer repeats, and getting your answer the first time.
High-throughput or automated facilities will often perform PCR in a standard thermal cycler and scan the completed assay in a real-time fluorescent cycler at a later time. Additionally, robotic liquid-handling workstations may be used for reaction assembly.
Stability of reagents and assays before and after thermal cycling are critical in enabling high-throughput genotyping. Quanta’s AccuStart™ Taq polymerase is a tightly controlled antibody-mediated hot-start enzyme which conveys exceptional pre-PCR stability up to 3 days at room temperature (see Figure 3). Stability of fluorescent signal in PerfeCTaTM qPCR SuperMixes also allows scanning of results up to 5 days post-PCR (see Figure 4) without compromising performance.
In conclusion, PerfeCTaTM qPCR SuperMixes from Quanta Biosciences can enable larger and more efficient TaqMan genotyping studies to be performed or decrease the cost per genotype of existing studies. This is achieved through shorter run-times, lower primer and probe requirements and enhanced accuracy. Stability of both the reagents and fluorescent signal allow for flexible scheduling of experiments and automation. In addition to lowering consumable costs, increased throughput could eliminate the need for additional thermal cyclers saving capital expenses. PerfeCTaTM qPCR SuperMixes are ideally suited for any TaqMan genotyping application including SNPs, copy number and drug metabolism for both commercial and homebrew assays.
Molecular biology
0.0
0.5
1.0
1.5
2.0
2.5
3.0
3.5
4.0
2.42.01.61.20.80.40.0
Alle
le Y
(FA
M)
Allele X (VIC)
Allele X Allele Y Both NTC
0 hr3 d
Undetermined
0.0
0.5
1.0
1.5
2.0
2.5
3.0
3.5
4.0
2.42.01.61.20.80.40.0A
llele
Y (F
AM
)
Allele X (VIC)
Allele X Allele Y Both NTC
0 hr5 d
Undetermined
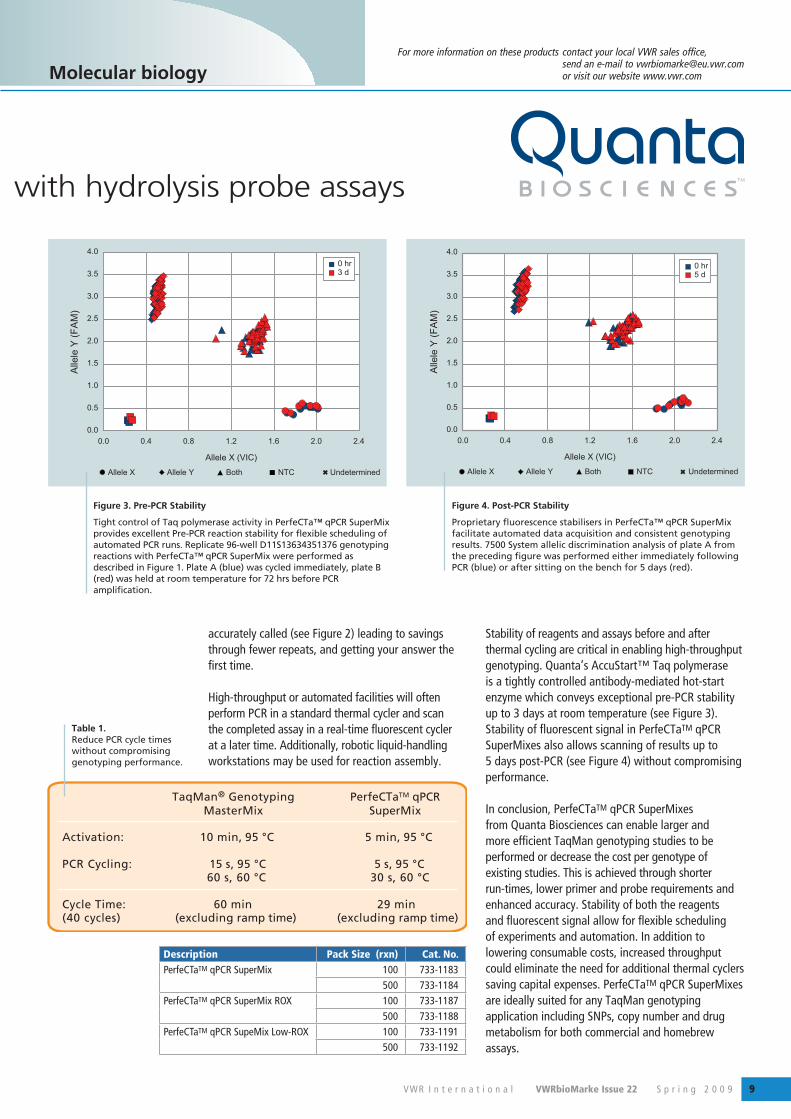
Figure 3. Pre-PCR Stability
Tight control of Taq polymerase activity in PerfeCTa™ qPCR SuperMix provides excellent Pre-PCR reaction stability for flexible scheduling of automated PCR runs. Replicate 96-well D11S13634351376 genotyping reactions with PerfeCTa™ qPCR SuperMix were performed as described in Figure 1. Plate A (blue) was cycled immediately, plate B (red) was held at room temperature for 72 hrs before PCR amplification.
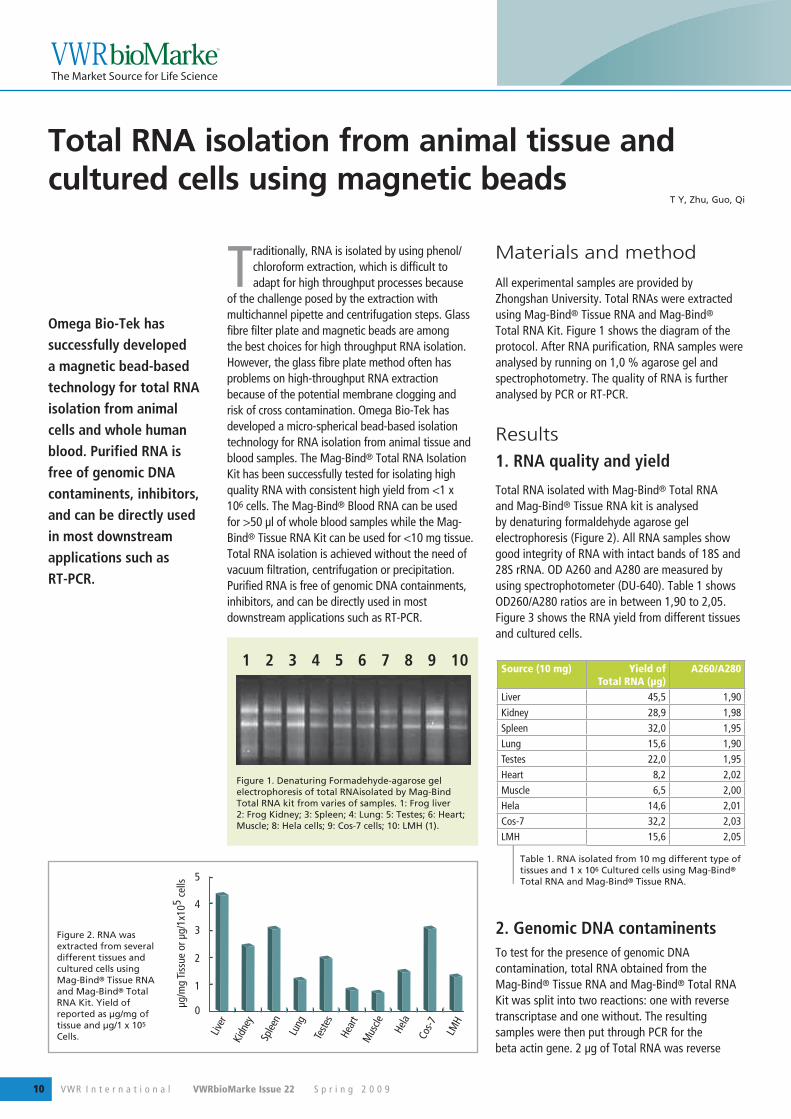
Figure 4. Post-PCR Stability
Proprietary fluorescence stabilisers in PerfeCTa™ qPCR SuperMix facilitate automated data acquisition and consistent genotyping results. 7500 System allelic discrimination analysis of plate A from the preceding figure was performed either immediately following PCR (blue) or after sitting on the bench for 5 days (red).
Activation:
PCR Cycling:
Cycle Time:(40 cycles)
TaqMan® GenotypingMasterMix
10 min, 95 °C
15 s, 95 °C60 s, 60 °C
60 min (excluding ramp time)
PerfeCTaTM qPCRSuperMix
5 min, 95 °C
5 s, 95 °C30 s, 60 °C
29 min(excluding ramp time)
Table 1. Reduce PCR cycle times without compromising genotyping performance.
Description Pack Size (rxn) Cat. No. PerfeCTaTM qPCR SuperMix 100 733-1183
500 733-1184PerfeCTaTM qPCR SuperMix ROX 100 733-1187
500 733-1188PerfeCTaTM qPCR SupeMix Low-ROX 100 733-1191
500 733-1192
VWR I n t e r n a t i o n a l VWRbioMarke Issue 22 S p r i n g 2 0 0 910
Traditionally, RNA is isolated by using phenol/chloroform extraction, which is difficult to adapt for high throughput processes because
of the challenge posed by the extraction with multichannel pipette and centrifugation steps. Glass fibre filter plate and magnetic beads are among the best choices for high throughput RNA isolation. However, the glass fibre plate method often has problems on high-throughput RNA extraction because of the potential membrane clogging and risk of cross contamination. Omega Bio-Tek has developed a micro-spherical bead-based isolation technology for RNA isolation from animal tissue and blood samples. The Mag-Bind® Total RNA Isolation Kit has been successfully tested for isolating high quality RNA with consistent high yield from <1 x 10⁶ cells. The Mag-Bind® Blood RNA can be used for >50 μl of whole blood samples while the Mag-Bind® Tissue RNA Kit can be used for <10 mg tissue. Total RNA isolation is achieved without the need of vacuum filtration, centrifugation or precipitation. Purified RNA is free of genomic DNA containments, inhibitors, and can be directly used in most downstream applications such as RT-PCR.
Materials and method
All experimental samples are provided by Zhongshan University. Total RNAs were extracted using Mag-Bind® Tissue RNA and Mag-Bind® Total RNA Kit. Figure 1 shows the diagram of the protocol. After RNA purification, RNA samples were analysed by running on 1,0 % agarose gel and spectrophotometry. The quality of RNA is further analysed by PCR or RT-PCR.
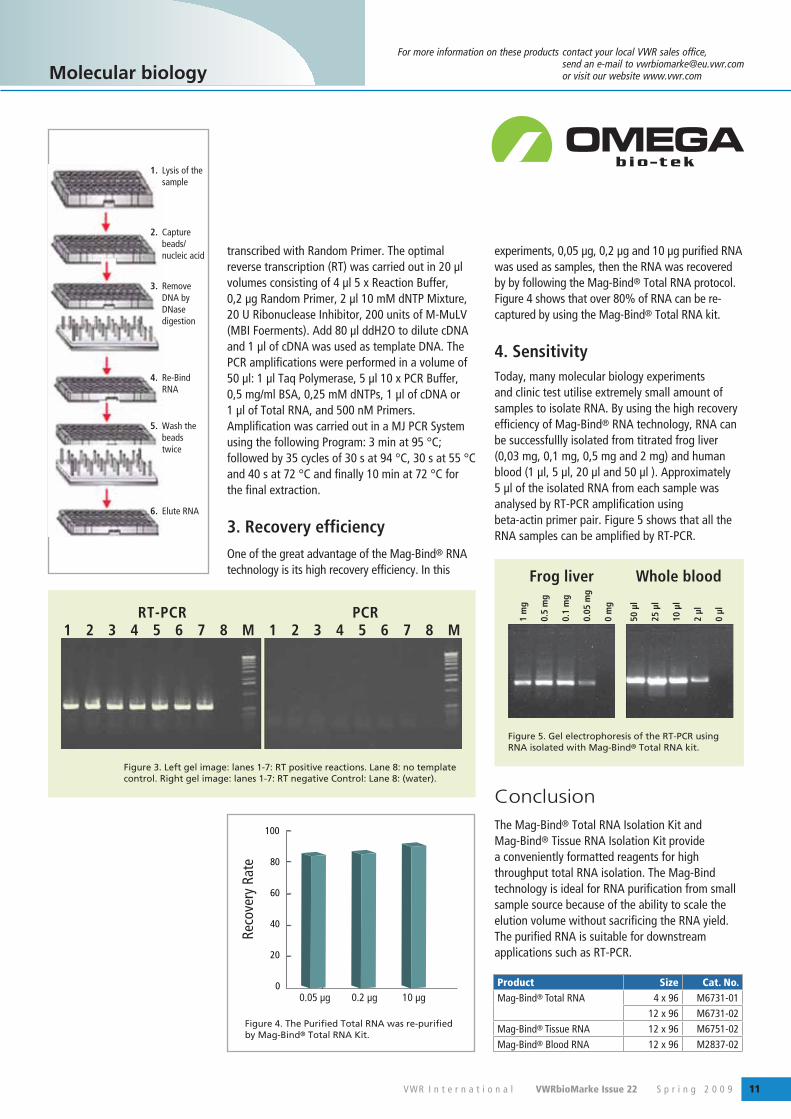
Results1. RNA quality and yield
Total RNA isolated with Mag-Bind® Total RNA and Mag-Bind® Tissue RNA kit is analysed by denaturing formaldehyde agarose gel electrophoresis (Figure 2). All RNA samples show good integrity of RNA with intact bands of 18S and 28S rRNA. OD A260 and A280 are measured by using spectrophotometer (DU-640). Table 1 shows OD260/A280 ratios are in between 1,90 to 2,05. Figure 3 shows the RNA yield from different tissues and cultured cells.
2. Genomic DNA contaminentsTo test for the presence of genomic DNA contamination, total RNA obtained from the Mag-Bind® Tissue RNA and Mag-Bind® Total RNA Kit was split into two reactions: one with reverse transcriptase and one without. The resulting samples were then put through PCR for the beta actin gene. 2 μg of Total RNA was reverse
Omega Bio-Tek has successfully developed a magnetic bead-based technology for total RNA isolation from animal cells and whole human blood. Purified RNA is free of genomic DNA contaminents, inhibitors, and can be directly used in most downstream applications such as RT-PCR.
Total RNA isolation from animal tissue and cultured cells using magnetic beads
T Y, Zhu, Guo, Qi
Figure 1. Denaturing Formadehyde-agarose gel electrophoresis of total RNAisolated by Mag-Bind Total RNA kit from varies of samples. 1: Frog liver 2: Frog Kidney; 3: Spleen; 4: Lung: 5: Testes; 6: Heart; Muscle; 8: Hela cells; 9: Cos-7 cells; 10: LMH (1).
1 2 3 4 5 6 7 8 9 10
5
4
3
2
1
0μg/m
g Ti
ssue
or μ
g/1x
105 c
ells
Figure 2. RNA was extracted from several different tissues and cultured cells using Mag-Bind® Tissue RNA and Mag-Bind® Total RNA Kit. Yield of reported as μg/mg of tissue and μg/1 x 105 Cells.
Source (10 mg) Yield of Total RNA (μg)
A260/A280
Liver 45,5 1,90
Kidney 28,9 1,98Spleen 32,0 1,95Lung 15,6 1,90Testes 22,0 1,95Heart 8,2 2,02Muscle 6,5 2,00Hela 14,6 2,01Cos-7 32,2 2,03LMH 15,6 2,05
Table 1. RNA isolated from 10 mg different type of tissues and 1 x 10⁶ Cultured cells using Mag-Bind® Total RNA and Mag-Bind® Tissue RNA.
VWR I n t e r n a t i o n a l VWRbioMarke Issue 22 S p r i n g 2 0 0 9 11
For more information on these products contact your local VWR sales office, send an e-mail to [email protected] or visit our website www.vwr.com
transcribed with Random Primer. The optimal reverse transcription (RT) was carried out in 20 μl volumes consisting of 4 μl 5 x Reaction Buffer, 0,2 μg Random Primer, 2 μl 10 mM dNTP Mixture, 20 U Ribonuclease Inhibitor, 200 units of M-MuLV (MBI Foerments). Add 80 μl ddH2O to dilute cDNA and 1 μl of cDNA was used as template DNA. The PCR amplifications were performed in a volume of 50 μl: 1 μl Taq Polymerase, 5 μl 10 x PCR Buffer, 0,5 mg/ml BSA, 0,25 mM dNTPs, 1 μl of cDNA or 1 μl of Total RNA, and 500 nM Primers. Amplification was carried out in a MJ PCR System using the following Program: 3 min at 95 °C; followed by 35 cycles of 30 s at 94 °C, 30 s at 55 °C and 40 s at 72 °C and finally 10 min at 72 °C for the final extraction.
3. Recovery efficiencyOne of the great advantage of the Mag-Bind® RNA technology is its high recovery efficiency. In this
experiments, 0,05 μg, 0,2 μg and 10 μg purified RNA was used as samples, then the RNA was recovered by by following the Mag-Bind® Total RNA protocol. Figure 4 shows that over 80% of RNA can be re-captured by using the Mag-Bind® Total RNA kit.
4. Sensitivity Today, many molecular biology experiments and clinic test utilise extremely small amount of samples to isolate RNA. By using the high recovery efficiency of Mag-Bind® RNA technology, RNA can be successfullly isolated from titrated frog liver (0,03 mg, 0,1 mg, 0,5 mg and 2 mg) and human blood (1 μl, 5 μl, 20 μl and 50 μl ). Approximately 5 μl of the isolated RNA from each sample was analysed by RT-PCR amplification using beta-actin primer pair. Figure 5 shows that all the RNA samples can be amplified by RT-PCR.
ConclusionThe Mag-Bind® Total RNA Isolation Kit and Mag-Bind® Tissue RNA Isolation Kit provide a conveniently formatted reagents for high throughput total RNA isolation. The Mag-Bind technology is ideal for RNA purification from small sample source because of the ability to scale the elution volume without sacrificing the RNA yield. The purified RNA is suitable for downstream applications such as RT-PCR.
Molecular biology
6. Elute RNA
1. Lysis of the sample
2. Capture beads/nucleic acid
3. Remove DNA by DNase digestion
4. Re-Bind RNA
5. Wash the beads twice
Figure 3. Left gel image: lanes 1-7: RT positive reactions. Lane 8: no template control. Right gel image: lanes 1-7: RT negative Control: Lane 8: (water).
RT-PCR1 2 3 4 5 6 7 8 M
PCR1 2 3 4 5 6 7 8 M
80
60
40
20
0
100
Reco
very
Rat
e
0.05 μg 0.2 μg 10 μg
Figure 4. The Purified Total RNA was re-purified by Mag-Bind® Total RNA Kit.
Figure 5. Gel electrophoresis of the RT-PCR using RNA isolated with Mag-Bind® Total RNA kit.
1 m
g
0.5
mg
0.1
mg
0.05
mg
0 m
g
50 μ
l
25 μ
l
10 μ
l
2 μl
0 μl
Frog liver Whole blood
Product Size Cat. No.Mag-Bind® Total RNA 4 x 96 M6731-01
12 x 96 M6731-02Mag-Bind® Tissue RNA 12 x 96 M6751-02Mag-Bind® Blood RNA 12 x 96 M2837-02
VWR I n t e r n a t i o n a l VWRbioMarke Issue 22 S p r i n g 2 0 0 912
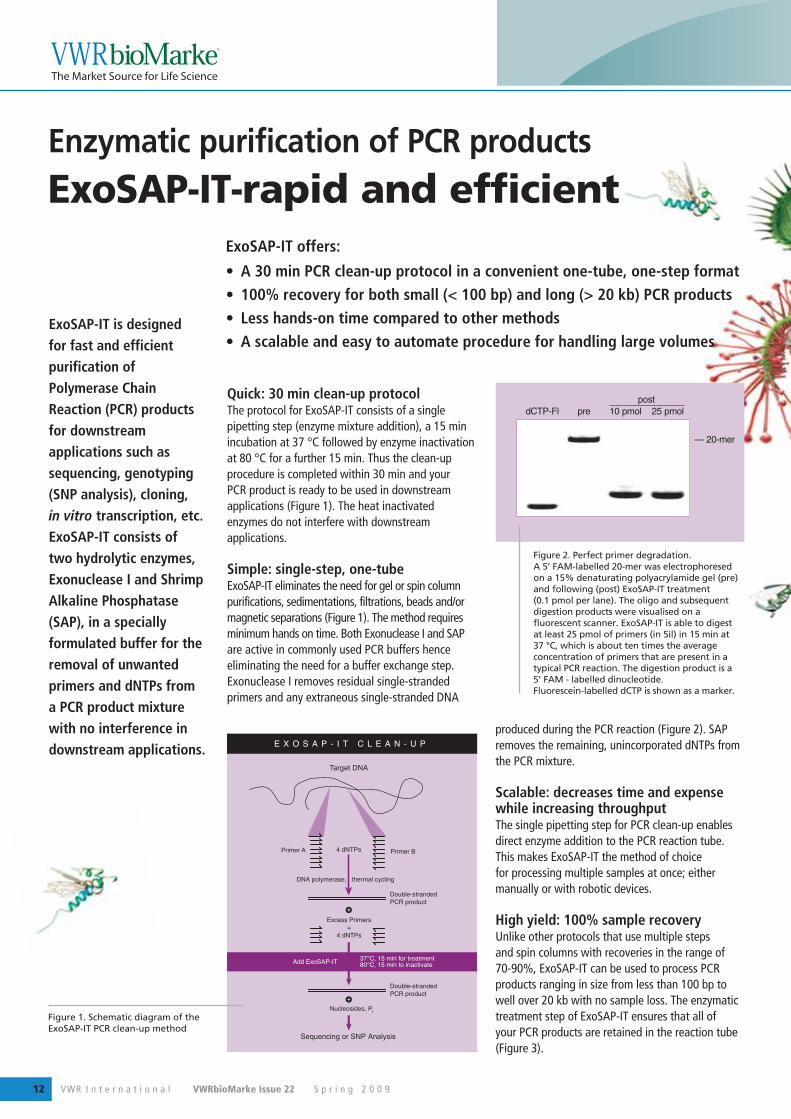
Quick: 30 min clean-up protocolThe protocol for ExoSAP-IT consists of a single pipetting step (enzyme mixture addition), a 15 min incubation at 37 °C followed by enzyme inactivation at 80 °C for a further 15 min. Thus the clean-up procedure is completed within 30 min and your PCR product is ready to be used in downstream applications (Figure 1). The heat inactivated enzymes do not interfere with downstream applications.
Simple: single-step, one-tubeExoSAP-IT eliminates the need for gel or spin column purifications, sedimentations, filtrations, beads and/or magnetic separations (Figure 1). The method requires minimum hands on time. Both Exonuclease I and SAP are active in commonly used PCR buffers hence eliminating the need for a buffer exchange step. Exonuclease I removes residual single-stranded primers and any extraneous single-stranded DNA
produced during the PCR reaction (Figure 2). SAP removes the remaining, unincorporated dNTPs from the PCR mixture.
Scalable: decreases time and expense while increasing throughputThe single pipetting step for PCR clean-up enables direct enzyme addition to the PCR reaction tube. This makes ExoSAP-IT the method of choice for processing multiple samples at once; either manually or with robotic devices.
High yield: 100% sample recoveryUnlike other protocols that use multiple steps and spin columns with recoveries in the range of 70-90%, ExoSAP-IT can be used to process PCR products ranging in size from less than 100 bp to well over 20 kb with no sample loss. The enzymatic treatment step of ExoSAP-IT ensures that all of your PCR products are retained in the reaction tube (Figure 3).
Enzymatic purification of PCR products
ExoSAP-IT-rapid and efficient
ExoSAP-IT is designed for fast and efficient purification of Polymerase Chain Reaction (PCR) products for downstream applications such as sequencing, genotyping (SNP analysis), cloning, in vitro transcription, etc.ExoSAP-IT consists of two hydrolytic enzymes, Exonuclease I and Shrimp Alkaline Phosphatase (SAP), in a specially formulated buffer for the removal of unwanted primers and dNTPs from a PCR product mixture with no interference in downstream applications.
ExoSAP-IT offers:
• A 30 min PCR clean-up protocol in a convenient one-tube, one-step format• 100% recovery for both small (< 100 bp) and long (> 20 kb) PCR products• Less hands-on time compared to other methods• A scalable and easy to automate procedure for handling large volumes
Figure 1. Schematic diagram of the ExoSAP-IT PCR clean-up method
Figure 2. Perfect primer degradation. A 5’ FAM-labelled 20-mer was electrophoresed on a 15% denaturating polyacrylamide gel (pre) and following (post) ExoSAP-IT treatment (0.1 pmol per lane). The oligo and subsequent digestion products were visualised on a fluorescent scanner. ExoSAP-IT is able to digest at least 25 pmol of primers (in 5ìl) in 15 min at 37 °C, which is about ten times the average concentration of primers that are present in a typical PCR reaction. The digestion product is a 5’ FAM - labelled dinucleotide. Fluorescein-labelled dCTP is shown as a marker.
VWR I n t e r n a t i o n a l VWRbioMarke Issue 22 S p r i n g 2 0 0 9 13
For more information on these products contact your local VWR sales office, send an e-mail to [email protected] or visit our website www.vwr.com
Sequence-grade: obtain high-quality sequencing results with PCR productsEnzymatic treatment to remove excess primers and nucleotides yields templates that can be easily sequenced. Problems with leftover PCR primers leading to background bands are virtually eliminated. ExoSAP-IT can be used as an effective clean-up method prior to any fluorescent or radioactive DNA sequencing protocol (Figures 4 and 5).
ApplicationsExoSAP-IT is used in an increasing range of applications including sequencing (manual and automated), genotyping (SNP analysis), cloning, in vitro transcription, nested PCR, etc.
ComponentsExonuclease I from E. coli and Shrimp Alkaline Phosphatase (arctic Pandalus borealis) in a specially formulated buffer compatible with commonly used buffers for PCR.
Storage and stabilityShipped on dry ice. Store at -20 °C and keep on ice during pipetting. ExoSAP-IT retains 75%
of its activity after 8 hours incubation at room temperature and > 50% of its activity after one week at 4 °C in its storage buffer. ExoSAP-IT can be frozen and thawed up to 4 times without significant loss of activity. Product can be subaliquoted for more convenient storage, if required.
References1. Dugan, K. A. et al. An improved method for post-PCR
purification for mtDNA sequence. analysis. J. Forensic Sci. 47, 811-818 (2002)
2. Hanke, M. et al. Direct DNA sequencing of PCR-amplified vector inserts following enzymatic degradation of primer and dNTPs. BioTechniques. 17, 858-860 (1994)
3. Mu, J. et al. Chromosome-wide SNPs reveal an ancient origin for Plasmodium falciparum. Nature. 418, 323-326 (2002)
4. Silva, J.R., et al. PCR template preparation for capillary DNA sequencing. BioTechniques. 30, 537-542 (2001)
5. Werle, E. et al. Convenient single-step, one tube purification of PCR products for direct sequencing. Nucleic Acids Res. 22, 4354-4355 (1994)
6. Hoppe, B. et al. Description of a novel HLA-B allele, B*5613, identified during HLA typing using sequence-specific oligonucleotide hybridization and sequence-specific amplification. Tissue Antigens. 64, 616-617 (2004)
Molecular biology
ExoSAP-IT One Step PCR Clean-upPack Cat. No.100 reactions GEHEUS78200500 reactions GEHEUS782012000 reactions GEHEUS78202
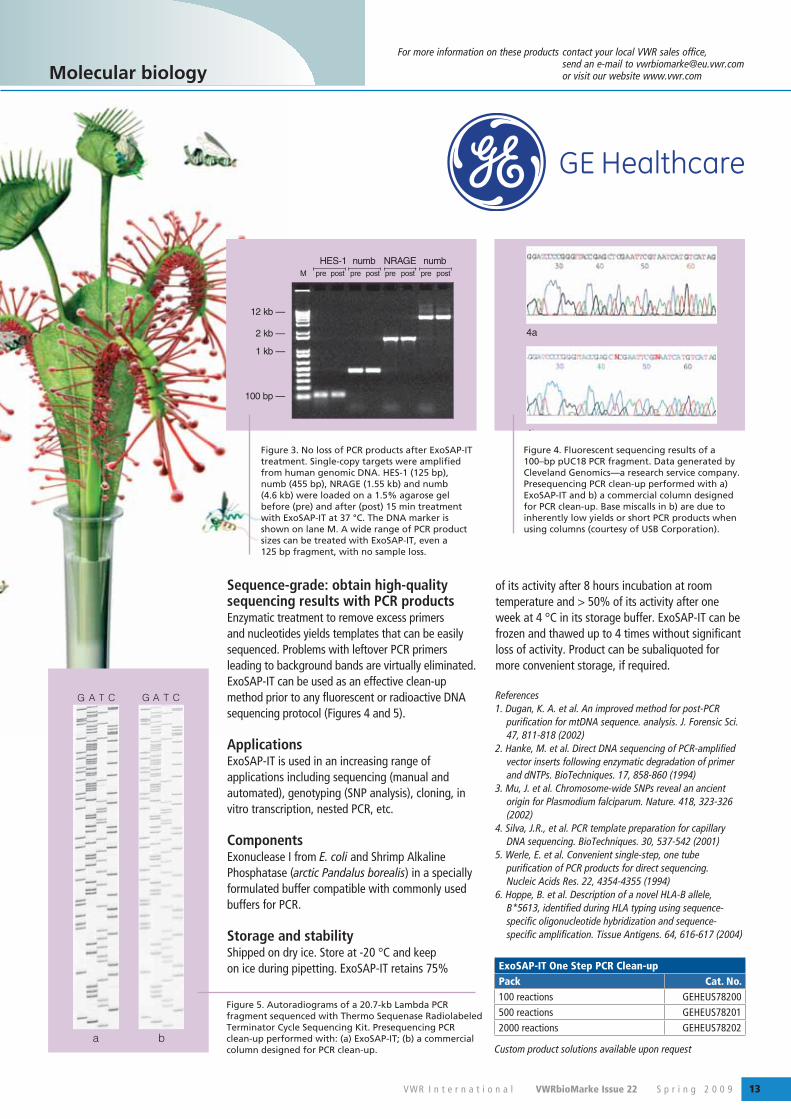
Figure 3. No loss of PCR products after ExoSAP-IT treatment. Single-copy targets were amplified from human genomic DNA. HES-1 (125 bp), numb (455 bp), NRAGE (1.55 kb) and numb (4.6 kb) were loaded on a 1.5% agarose gel before (pre) and after (post) 15 min treatment with ExoSAP-IT at 37 °C. The DNA marker is shown on lane M. A wide range of PCR product sizes can be treated with ExoSAP-IT, even a 125 bp fragment, with no sample loss.
Figure 4. Fluorescent sequencing results of a 100–bp pUC18 PCR fragment. Data generated by Cleveland Genomics—a research service company. Presequencing PCR clean-up performed with a) ExoSAP-IT and b) a commercial column designed for PCR clean-up. Base miscalls in b) are due to inherently low yields or short PCR products when using columns (courtesy of USB Corporation).
Figure 5. Autoradiograms of a 20.7-kb Lambda PCR fragment sequenced with Thermo Sequenase Radiolabeled Terminator Cycle Sequencing Kit. Presequencing PCR clean-up performed with: (a) ExoSAP-IT; (b) a commercial column designed for PCR clean-up. Custom product solutions available upon request
VWR I n t e r n a t i o n a l VWRbioMarke Issue 22 S p r i n g 2 0 0 914
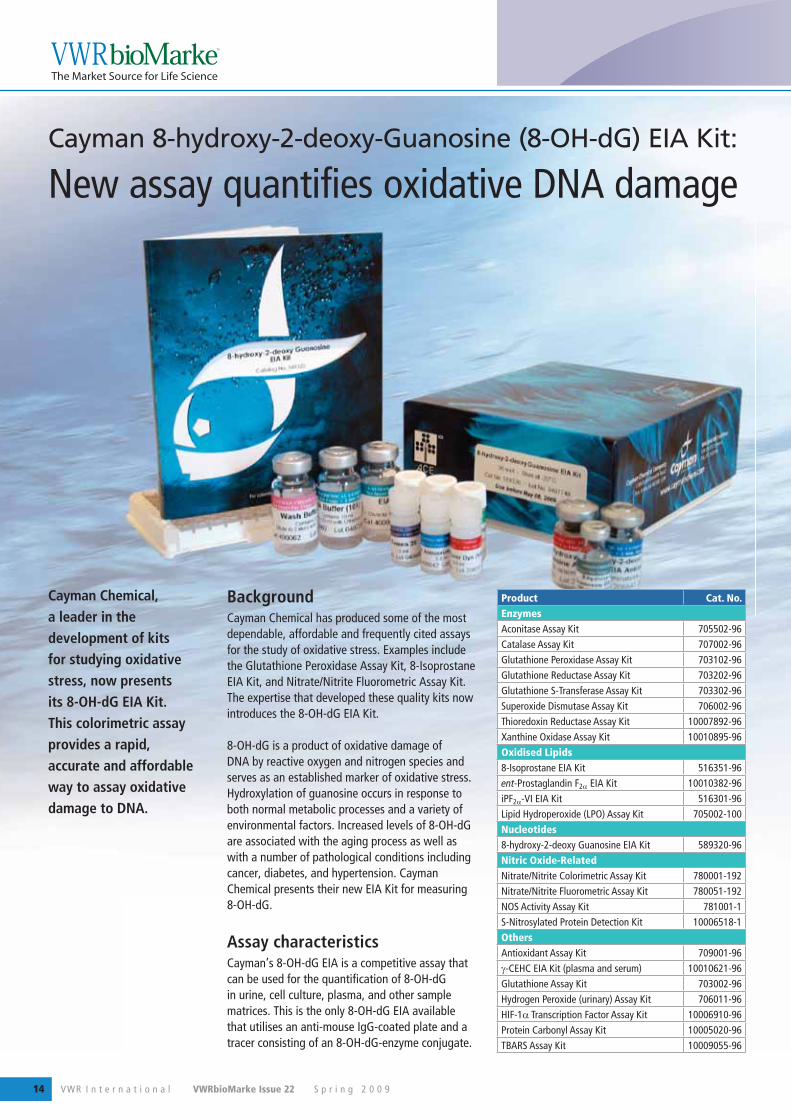
Cayman Chemical, a leader in the development of kits for studying oxidative stress, now presents its 8-OH-dG EIA Kit. This colorimetric assay provides a rapid, accurate and affordable way to assay oxidative damage to DNA.
Background Cayman Chemical has produced some of the most dependable, affordable and frequently cited assays for the study of oxidative stress. Examples include the Glutathione Peroxidase Assay Kit, 8-Isoprostane EIA Kit, and Nitrate/Nitrite Fluorometric Assay Kit. The expertise that developed these quality kits now introduces the 8-OH-dG EIA Kit.
8-OH-dG is a product of oxidative damage of DNA by reactive oxygen and nitrogen species and serves as an established marker of oxidative stress. Hydroxylation of guanosine occurs in response to both normal metabolic processes and a variety of environmental factors. Increased levels of 8-OH-dG are associated with the aging process as well as with a number of pathological conditions including cancer, diabetes, and hypertension. Cayman Chemical presents their new EIA Kit for measuring 8-OH-dG.
Assay characteristicsCayman’s 8-OH-dG EIA is a competitive assay that can be used for the quantification of 8-OH-dG in urine, cell culture, plasma, and other sample matrices. This is the only 8-OH-dG EIA available that utilises an anti-mouse IgG-coated plate and a tracer consisting of an 8-OH-dG-enzyme conjugate.
Product Cat. No.EnzymesAconitase Assay Kit 705502-96Catalase Assay Kit 707002-96Glutathione Peroxidase Assay Kit 703102-96Glutathione Reductase Assay Kit 703202-96Glutathione S-Transferase Assay Kit 703302-96Superoxide Dismutase Assay Kit 706002-96Thioredoxin Reductase Assay Kit 10007892-96Xanthine Oxidase Assay Kit 10010895-96Oxidised Lipids8-Isoprostane EIA Kit 516351-96ent-Prostaglandin F2α EIA Kit 10010382-96iPF2α-VI EIA Kit 516301-96Lipid Hydroperoxide (LPO) Assay Kit 705002-100Nucleotides8-hydroxy-2-deoxy Guanosine EIA Kit 589320-96Nitric Oxide-RelatedNitrate/Nitrite Colorimetric Assay Kit 780001-192Nitrate/Nitrite Fluorometric Assay Kit 780051-192NOS Activity Assay Kit 781001-1S-Nitrosylated Protein Detection Kit 10006518-1OthersAntioxidant Assay Kit 709001-96γ-CEHC EIA Kit (plasma and serum) 10010621-96Glutathione Assay Kit 703002-96Hydrogen Peroxide (urinary) Assay Kit 706011-96HIF-1α Transcription Factor Assay Kit 10006910-96Protein Carbonyl Assay Kit 10005020-96TBARS Assay Kit 10009055-96
Cayman 8-hydroxy-2-deoxy-Guanosine (8-OH-dG) EIA Kit:
New assay quantifies oxidative DNA damage
VWR I n t e r n a t i o n a l VWRbioMarke Issue 22 S p r i n g 2 0 0 9 15
For more information on these products contact your local VWR sales office, send an e-mail to [email protected] or visit our website www.vwr.com
This format has the advantage of providing low variability and increased sensitivity compared to assays that utilise an antigen-coated plate.
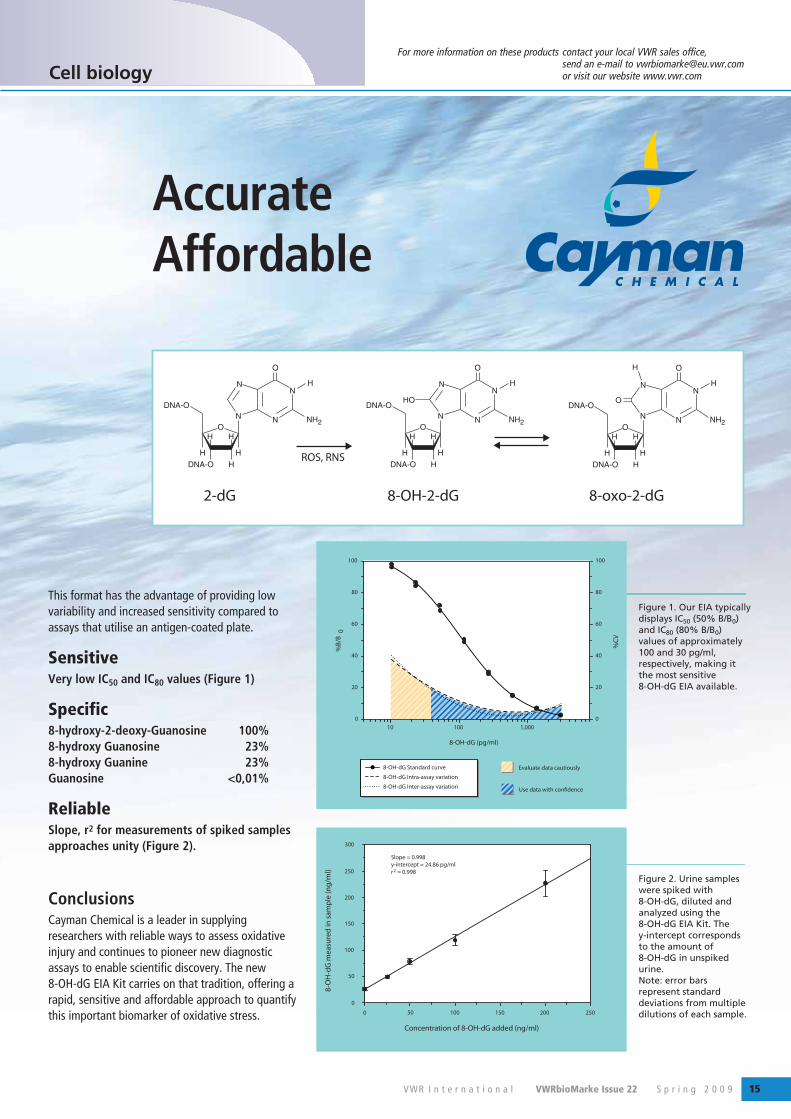
SensitiveVery low IC50 and IC80 values (Figure 1)
Specific8-hydroxy-2-deoxy-Guanosine 100%8-hydroxy Guanosine 23%8-hydroxy Guanine 23%Guanosine <0,01%
ReliableSlope, r2 for measurements of spiked samples approaches unity (Figure 2).
ConclusionsCayman Chemical is a leader in supplying researchers with reliable ways to assess oxidative injury and continues to pioneer new diagnostic assays to enable scientific discovery. The new 8-OH-dG EIA Kit carries on that tradition, offering a rapid, sensitive and affordable approach to quantify this important biomarker of oxidative stress.
Cell biology
Figure 1. Our EIA typically displays IC50 (50% B/B0) and IC80 (80% B/B0) values of approximately 100 and 30 pg/ml, respectively, making it the most sensitive 8-OH-dG EIA available.
Figure 2. Urine samples were spiked with 8-OH-dG, diluted and analyzed using the 8-OH-dG EIA Kit. The y-intercept corresponds to the amount of 8-OH-dG in unspiked urine. Note: error bars represent standard deviations from multiple dilutions of each sample.
AccurateAffordable
VWR I n t e r n a t i o n a l VWRbioMarke Issue 22 S p r i n g 2 0 0 916
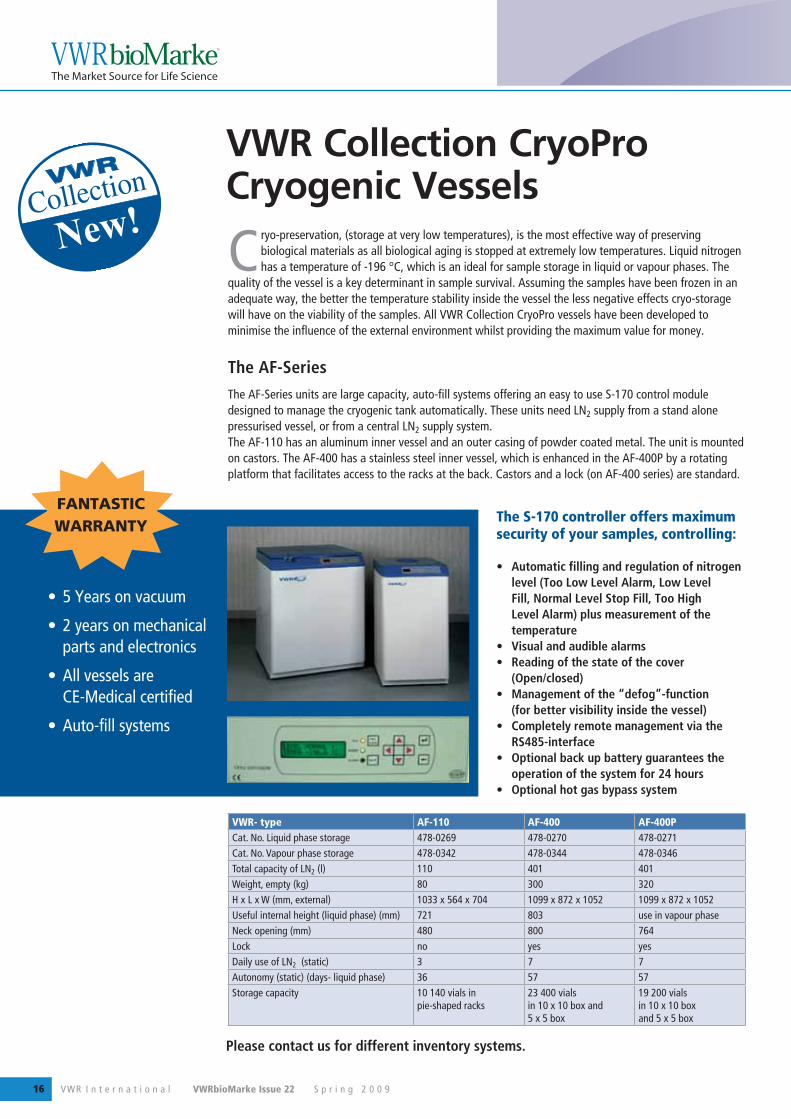
VWR Collection CryoPro Cryogenic Vessels
The S-170 controller offers maximum security of your samples, controlling:
• Automatic filling and regulation of nitrogen level (Too Low Level Alarm, Low Level Fill, Normal Level Stop Fill, Too High Level Alarm) plus measurement of the temperature
• Visual and audible alarms• Reading of the state of the cover
(Open/closed)• Management of the “defog”-function
(for better visibility inside the vessel)• Completely remote management via the
RS485-interface• Optional back up battery guarantees the
operation of the system for 24 hours• Optional hot gas bypass system
• 5 Years on vacuum
• 2 years on mechanical parts and electronics
• All vessels are CE-Medical certified
• Auto-fill systems
VWR- type AF-110 AF-400 AF-400PCat. No. Liquid phase storage 478-0269 478-0270 478-0271Cat. No. Vapour phase storage 478-0342 478-0344 478-0346Total capacity of LN2 (l) 110 401 401Weight, empty (kg) 80 300 320H x L x W (mm, external) 1033 x 564 x 704 1099 x 872 x 1052 1099 x 872 x 1052Useful internal height (liquid phase) (mm) 721 803 use in vapour phaseNeck opening (mm) 480 800 764Lock no yes yesDaily use of LN2 (static) 3 7 7Autonomy (static) (days- liquid phase) 36 57 57Storage capacity 10 140 vials in
pie-shaped racks23 400 vials in 10 x 10 box and 5 x 5 box
19 200 vials in 10 x 10 box and 5 x 5 box
Please contact us for different inventory systems.
FANTASTICWARRANTY
Cryo-preservation, (storage at very low temperatures), is the most effective way of preserving biological materials as all biological aging is stopped at extremely low temperatures. Liquid nitrogen has a temperature of -196 °C, which is an ideal for sample storage in liquid or vapour phases. The
quality of the vessel is a key determinant in sample survival. Assuming the samples have been frozen in an adequate way, the better the temperature stability inside the vessel the less negative effects cryo-storage will have on the viability of the samples. All VWR Collection CryoPro vessels have been developed to minimise the influence of the external environment whilst providing the maximum value for money.
The AF-Series The AF-Series units are large capacity, auto-fill systems offering an easy to use S-170 control module designed to manage the cryogenic tank automatically. These units need LN2 supply from a stand alone pressurised vessel, or from a central LN2 supply system. The AF-110 has an aluminum inner vessel and an outer casing of powder coated metal. The unit is mounted on castors. The AF-400 has a stainless steel inner vessel, which is enhanced in the AF-400P by a rotating platform that facilitates access to the racks at the back. Castors and a lock (on AF-400 series) are standard.
New!
VWR I n t e r n a t i o n a l VWRbioMarke Issue 22 S p r i n g 2 0 0 9 17
For more information on these products contact your local VWR sales office, send an e-mail to [email protected] or visit our website www.vwr.com
VWR Collection box storage system
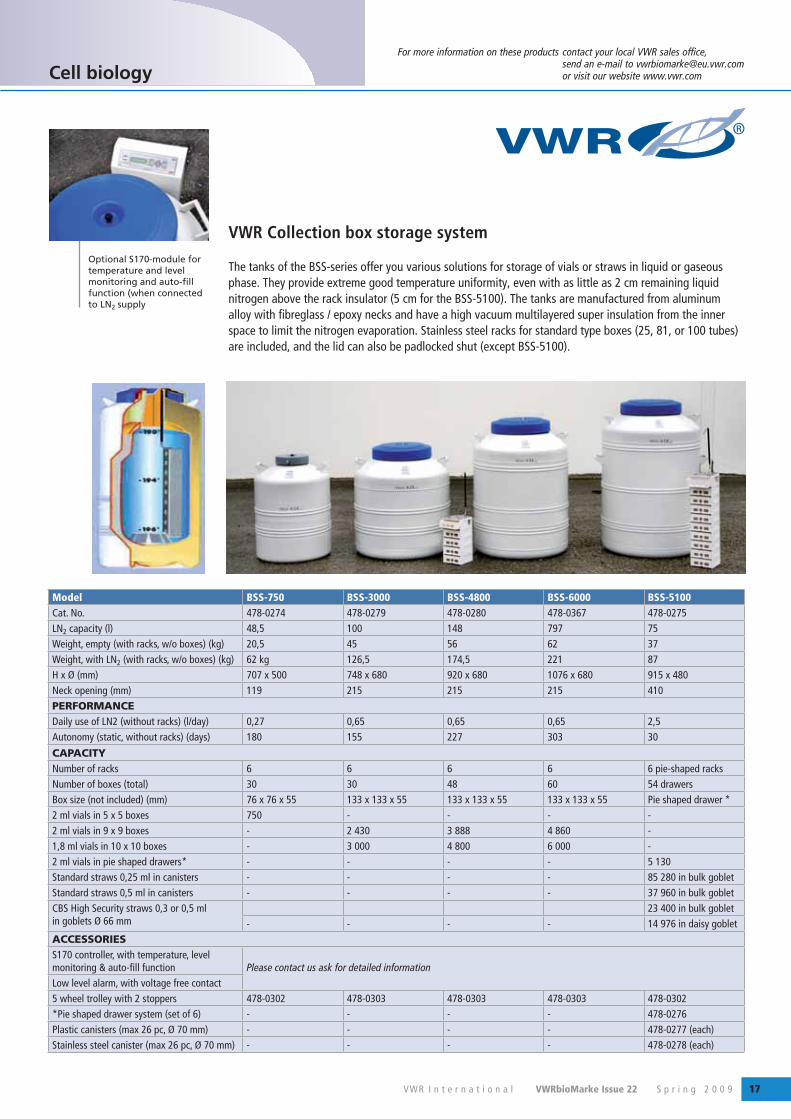
The tanks of the BSS-series offer you various solutions for storage of vials or straws in liquid or gaseous phase. They provide extreme good temperature uniformity, even with as little as 2 cm remaining liquid nitrogen above the rack insulator (5 cm for the BSS-5100). The tanks are manufactured from aluminum alloy with fibreglass / epoxy necks and have a high vacuum multilayered super insulation from the inner space to limit the nitrogen evaporation. Stainless steel racks for standard type boxes (25, 81, or 100 tubes) are included, and the lid can also be padlocked shut (except BSS-5100).
Cell biology
Model BSS-750 BSS-3000 BSS-4800 BSS-6000 BSS-5100Cat. No. 478-0274 478-0279 478-0280 478-0367 478-0275LN2 capacity (l) 48,5 100 148 797 75 Weight, empty (with racks, w/o boxes) (kg) 20,5 45 56 62 37Weight, with LN2 (with racks, w/o boxes) (kg) 62 kg 126,5 174,5 221 87H x Ø (mm) 707 x 500 748 x 680 920 x 680 1076 x 680 915 x 480Neck opening (mm) 119 215 215 215 410PERFORMANCEDaily use of LN2 (without racks) (l/day) 0,27 0,65 0,65 0,65 2,5Autonomy (static, without racks) (days) 180 155 227 303 30
CAPACITYNumber of racks 6 6 6 6 6 pie-shaped racksNumber of boxes (total) 30 30 48 60 54 drawersBox size (not included) (mm) 76 x 76 x 55 133 x 133 x 55 133 x 133 x 55 133 x 133 x 55 Pie shaped drawer *2 ml vials in 5 x 5 boxes 750 - - - -2 ml vials in 9 x 9 boxes - 2 430 3 888 4 860 -1,8 ml vials in 10 x 10 boxes - 3 000 4 800 6 000 -2 ml vials in pie shaped drawers* - - - - 5 130Standard straws 0,25 ml in canisters - - - - 85 280 in bulk gobletStandard straws 0,5 ml in canisters - - - - 37 960 in bulk gobletCBS High Security straws 0,3 or 0,5 ml in goblets Ø 66 mm
23 400 in bulk goblet- - - - 14 976 in daisy goblet
ACCESSORIESS170 controller, with temperature, level monitoring & auto-fill function Please contact us ask for detailed informationLow level alarm, with voltage free contact5 wheel trolley with 2 stoppers 478-0302 478-0303 478-0303 478-0303 478-0302*Pie shaped drawer system (set of 6) - - - - 478-0276Plastic canisters (max 26 pc, Ø 70 mm) - - - - 478-0277 (each)Stainless steel canister (max 26 pc, Ø 70 mm) - - - - 478-0278 (each)
Optional S170-module for temperature and level monitoring and auto-fill function (when connected to LN2 supply
VWR I n t e r n a t i o n a l VWRbioMarke Issue 22 S p r i n g 2 0 0 918
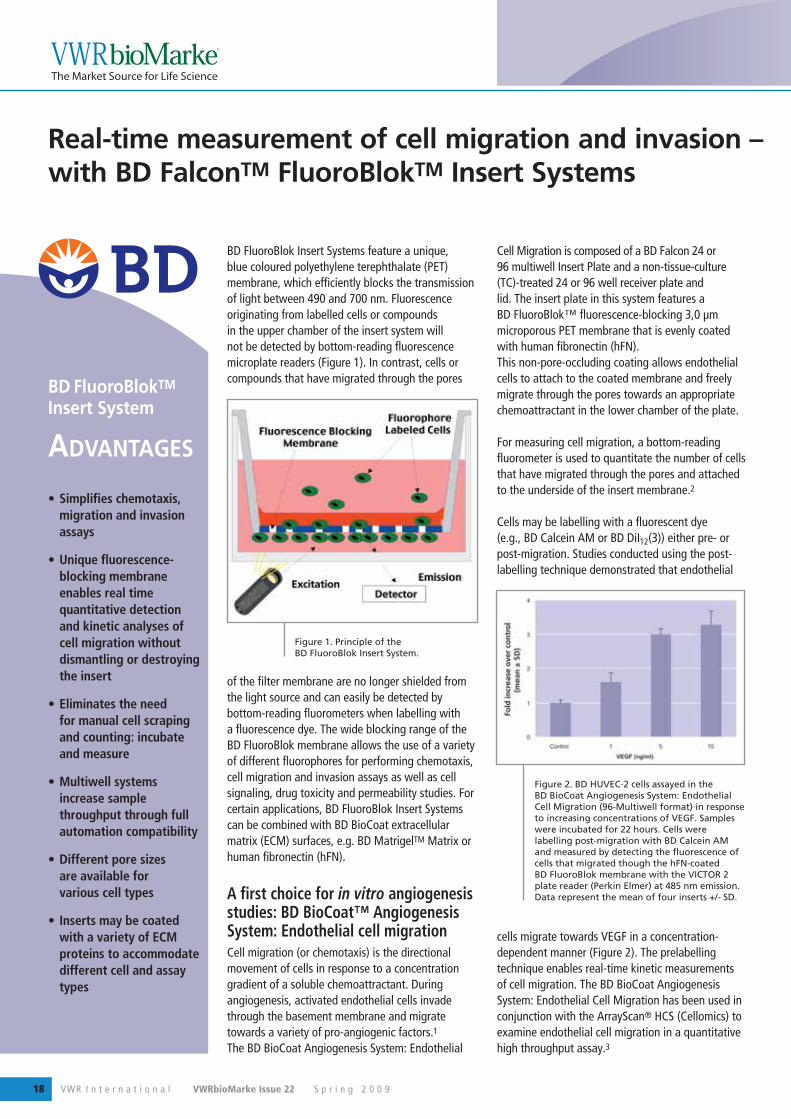
BD FluoroBlok Insert Systems feature a unique, blue coloured polyethylene terephthalate (PET) membrane, which efficiently blocks the transmission of light between 490 and 700 nm. Fluorescence originating from labelled cells or compounds in the upper chamber of the insert system will not be detected by bottom-reading fluorescence microplate readers (Figure 1). In contrast, cells or compounds that have migrated through the pores
of the filter membrane are no longer shielded from the light source and can easily be detected by bottom-reading fluorometers when labelling with a fluorescence dye. The wide blocking range of the BD FluoroBlok membrane allows the use of a variety of different fluorophores for performing chemotaxis, cell migration and invasion assays as well as cell signaling, drug toxicity and permeability studies. For certain applications, BD FluoroBlok Insert Systems can be combined with BD BioCoat extracellular matrix (ECM) surfaces, e.g. BD MatrigelTM Matrix or human fibronectin (hFN).
A first choice for in vitro angiogenesis studies: BD BioCoat™ Angiogenesis System: Endothelial cell migrationCell migration (or chemotaxis) is the directional movement of cells in response to a concentration gradient of a soluble chemoattractant. During angiogenesis, activated endothelial cells invade through the basement membrane and migrate towards a variety of pro-angiogenic factors.1The BD BioCoat Angiogenesis System: Endothelial
Cell Migration is composed of a BD Falcon 24 or 96 multiwell Insert Plate and a non-tissue-culture (TC)-treated 24 or 96 well receiver plate and lid. The insert plate in this system features a BD FluoroBlok™ fluorescence-blocking 3,0 μm microporous PET membrane that is evenly coated with human fibronectin (hFN). This non-pore-occluding coating allows endothelial cells to attach to the coated membrane and freely migrate through the pores towards an appropriate chemoattractant in the lower chamber of the plate.
For measuring cell migration, a bottom-reading fluorometer is used to quantitate the number of cells that have migrated through the pores and attached to the underside of the insert membrane.2
Cells may be labelling with a fluorescent dye (e.g., BD Calcein AM or BD DiI12(3)) either pre- or post-migration. Studies conducted using the post-labelling technique demonstrated that endothelial
cells migrate towards VEGF in a concentration-dependent manner (Figure 2). The prelabelling technique enables real-time kinetic measurements of cell migration. The BD BioCoat Angiogenesis System: Endothelial Cell Migration has been used in conjunction with the ArrayScan® HCS (Cellomics) to examine endothelial cell migration in a quantitative high throughput assay.3
Real-time measurement of cell migration and invasion – with BD FalconTM FluoroBlokTM Insert Systems
BD FluoroBlokTM
Insert System
ADVANTAGES
• Simplifies chemotaxis, migration and invasion assays
• Unique fluorescence-blocking membrane enables real time quantitative detection and kinetic analyses of cell migration without dismantling or destroying the insert
• Eliminates the need for manual cell scraping and counting: incubate and measure
• Multiwell systems increase sample throughput through full automation compatibility
• Different pore sizes are available for various cell types
• Inserts may be coated with a variety of ECM proteins to accommodate different cell and assay types
Figure 1. Principle of the BD FluoroBlok Insert System.
Figure 2. BD HUVEC-2 cells assayed in the BD BioCoat Angiogenesis System: Endothelial Cell Migration (96-Multiwell format) in response to increasing concentrations of VEGF. Samples were incubated for 22 hours. Cells were labelling post-migration with BD Calcein AM and measured by detecting the fluorescence of cells that migrated though the hFN-coated BD FluoroBlok membrane with the VICTOR 2 plate reader (Perkin Elmer) at 485 nm emission. Data represent the mean of four inserts +/- SD.
VWR I n t e r n a t i o n a l VWRbioMarke Issue 22 S p r i n g 2 0 0 9 19
For more information on these products contact your local VWR sales office, send an e-mail to [email protected] or visit our website www.vwr.com
The BD BioCoat Angiogenesis System: Endothelial Cell Invasion is also available to assess the invasive property of endothelial cells in vitro. Inserts in this system feature a 3,0 μm BD FluoroBlok membrane that is uniformly coated with BD MatrigelTM Matrix. The coating in this case occludes the pores of the membrane, providing an authentic barrier to non-invasive cells while endothelial cells are able to migrate through.
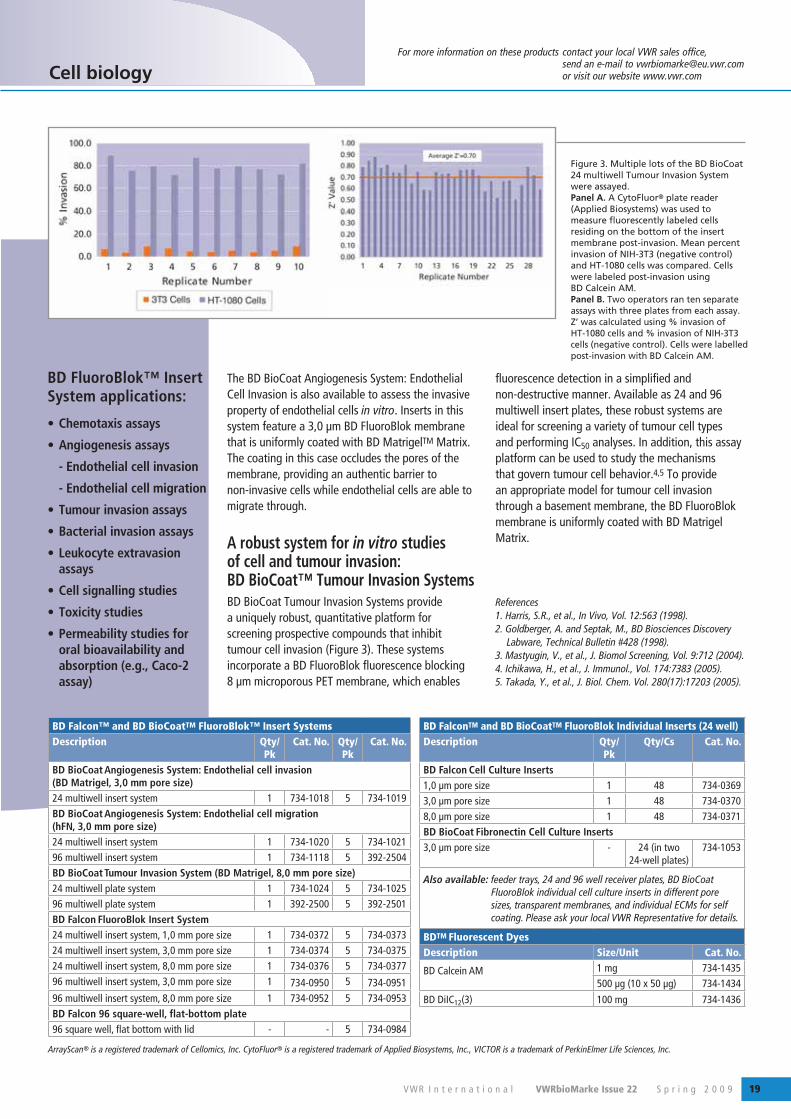
A robust system for in vitro studies of cell and tumour invasion: BD BioCoat™ Tumour Invasion SystemsBD BioCoat Tumour Invasion Systems provide a uniquely robust, quantitative platform for screening prospective compounds that inhibit tumour cell invasion (Figure 3). These systems incorporate a BD FluoroBlok fluorescence blocking 8 μm microporous PET membrane, which enables
fluorescence detection in a simplified and non-destructive manner. Available as 24 and 96 multiwell insert plates, these robust systems are ideal for screening a variety of tumour cell types and performing IC50 analyses. In addition, this assay platform can be used to study the mechanisms that govern tumour cell behavior.4,5 To provide an appropriate model for tumour cell invasion through a basement membrane, the BD FluoroBlok membrane is uniformly coated with BD Matrigel Matrix.
References1. Harris, S.R., et al., In Vivo, Vol. 12:563 (1998).2. Goldberger, A. and Septak, M., BD Biosciences Discovery
Labware, Technical Bulletin #428 (1998).3. Mastyugin, V., et al., J. Biomol Screening, Vol. 9:712 (2004).4. Ichikawa, H., et al., J. Immunol., Vol. 174:7383 (2005).5. Takada, Y., et al., J. Biol. Chem. Vol. 280(17):17203 (2005).
Cell biology
BD FalconTM and BD BioCoatTM FluoroBlok Individual Inserts (24 well)Description Qty/
PkQty/Cs Cat. No.
BD Falcon Cell Culture Inserts1,0 μm pore size 1 48 734-03693,0 μm pore size 1 48 734-03708,0 μm pore size 1 48 734-0371BD BioCoat Fibronectin Cell Culture Inserts3,0 μm pore size - 24 (in two
24-well plates)734-1053
Also available: feeder trays, 24 and 96 well receiver plates, BD BioCoat FluoroBlok individual cell culture inserts in different pore sizes, transparent membranes, and individual ECMs for self coating. Please ask your local VWR Representative for details.
BDTM Fluorescent DyesDescription Size/Unit Cat. No.
BD Calcein AM 1 mg 734-1435500 μg (10 x 50 μg) 734-1434
BD DiIC12(3) 100 mg 734-1436
Figure 3. Multiple lots of the BD BioCoat 24 multiwell Tumour Invasion System were assayed. Panel A. A CytoFluor® plate reader (Applied Biosystems) was used to measure fluorescently labeled cells residing on the bottom of the insert membrane post-invasion. Mean percent invasion of NIH-3T3 (negative control) and HT-1080 cells was compared. Cells were labeled post-invasion using BD Calcein AM. Panel B. Two operators ran ten separate assays with three plates from each assay. Z’ was calculated using % invasion of HT-1080 cells and % invasion of NIH-3T3 cells (negative control). Cells were labelled post-invasion with BD Calcein AM.
BD FluoroBlok™ Insert System applications:
• Chemotaxis assays
• Angiogenesis assays
- Endothelial cell invasion
- Endothelial cell migration
• Tumour invasion assays
• Bacterial invasion assays
• Leukocyte extravasion assays
• Cell signalling studies
• Toxicity studies
• Permeability studies for oral bioavailability and absorption (e.g., Caco-2 assay)
ArrayScan® is a registered trademark of Cellomics, Inc. CytoFluor® is a registered trademark of Applied Biosystems, Inc., VICTOR is a trademark of PerkinElmer Life Sciences, Inc.
BD Falcon™ and BD BioCoatTM FluoroBlok™ Insert SystemsDescription Qty/
PkCat. No. Qty/
PkCat. No.
BD BioCoat Angiogenesis System: Endothelial cell invasion (BD Matrigel, 3,0 mm pore size)24 multiwell insert system 1 734-1018 5 734-1019BD BioCoat Angiogenesis System: Endothelial cell migration (hFN, 3,0 mm pore size)24 multiwell insert system 1 734-1020 5 734-102196 multiwell insert system 1 734-1118 5 392-2504BD BioCoat Tumour Invasion System (BD Matrigel, 8,0 mm pore size)24 multiwell plate system 1 734-1024 5 734-102596 multiwell plate system 1 392-2500 5 392-2501BD Falcon FluoroBlok Insert System24 multiwell insert system, 1,0 mm pore size 1 734-0372 5 734-037324 multiwell insert system, 3,0 mm pore size 1 734-0374 5 734-037524 multiwell insert system, 8,0 mm pore size 1 734-0376 5 734-037796 multiwell insert system, 3,0 mm pore size 1 734-0950 5 734-095196 multiwell insert system, 8,0 mm pore size 1 734-0952 5 734-0953BD Falcon 96 square-well, flat-bottom plate96 square well, flat bottom with lid - - 5 734-0984
VWR I n t e r n a t i o n a l VWRbioMarke Issue 22 S p r i n g 2 0 0 920
Nalge Nunc International developed the first vacuum filter unit in 1964. Now filter units and bottle-top filters have become an indispensable standard method for sterilising and clarifying cell culture media and other fluids in the laboratory. The purpose of this study was to compare the performance of Nalgene MF75 filter units made with new Supor machV 0,2 μm PES membrane with equivalent devices made by Corning and Millipore.
Thermo Scientific Nalgene MF75 filter units fitted with the Pall Supor® machV 0,2 μm PES membrane A comparative performance study
PES (polyethersulphone) has emerged as the best membrane for sterile filtration of cell culture media. Fast flow rates and high throughput plus protein binding so there is less chance of removing critical protein components. Extremely low extractables mean little if anything is added to the filtrate.
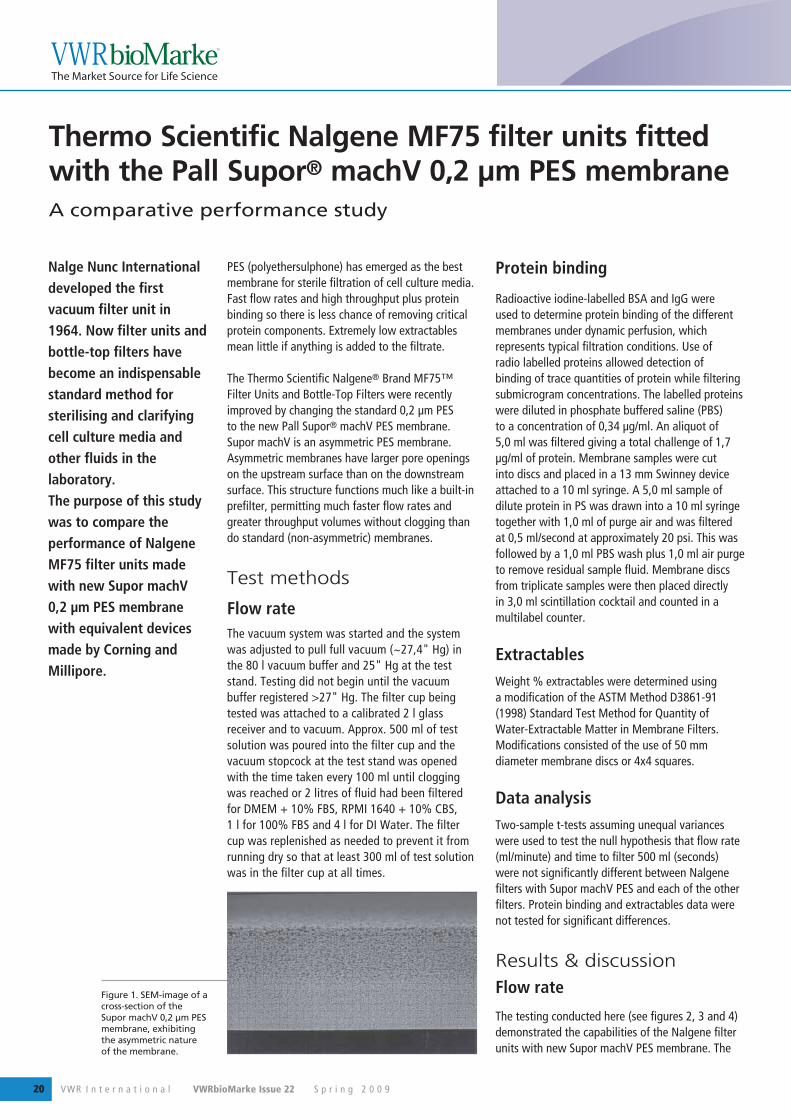
The Thermo Scientific Nalgene® Brand MF75™ Filter Units and Bottle-Top Filters were recently improved by changing the standard 0,2 μm PES to the new Pall Supor® machV PES membrane. Supor machV is an asymmetric PES membrane. Asymmetric membranes have larger pore openings on the upstream surface than on the downstream surface. This structure functions much like a built-in prefilter, permitting much faster flow rates and greater throughput volumes without clogging than do standard (non-asymmetric) membranes.
Test methods
Flow rate The vacuum system was started and the system was adjusted to pull full vacuum (~27,4" Hg) in the 80 l vacuum buffer and 25" Hg at the test stand. Testing did not begin until the vacuum buffer registered >27" Hg. The filter cup being tested was attached to a calibrated 2 l glass receiver and to vacuum. Approx. 500 ml of test solution was poured into the filter cup and the vacuum stopcock at the test stand was opened with the time taken every 100 ml until clogging was reached or 2 litres of fluid had been filtered for DMEM + 10% FBS, RPMI 1640 + 10% CBS, 1 l for 100% FBS and 4 l for DI Water. The filter cup was replenished as needed to prevent it from running dry so that at least 300 ml of test solution was in the filter cup at all times.
Protein binding
Radioactive iodine-labelled BSA and IgG were used to determine protein binding of the different membranes under dynamic perfusion, which represents typical filtration conditions. Use of radio labelled proteins allowed detection of binding of trace quantities of protein while filtering submicrogram concentrations. The labelled proteins were diluted in phosphate buffered saline (PBS) to a concentration of 0,34 μg/ml. An aliquot of 5,0 ml was filtered giving a total challenge of 1,7 μg/ml of protein. Membrane samples were cut into discs and placed in a 13 mm Swinney device attached to a 10 ml syringe. A 5,0 ml sample of dilute protein in PS was drawn into a 10 ml syringe together with 1,0 ml of purge air and was filtered at 0,5 ml/second at approximately 20 psi. This was followed by a 1,0 ml PBS wash plus 1,0 ml air purge to remove residual sample fluid. Membrane discs from triplicate samples were then placed directly in 3,0 ml scintillation cocktail and counted in a multilabel counter.
ExtractablesWeight % extractables were determined using a modification of the ASTM Method D3861-91 (1998) Standard Test Method for Quantity of Water-Extractable Matter in Membrane Filters. Modifications consisted of the use of 50 mm diameter membrane discs or 4x4 squares.
Data analysisTwo-sample t-tests assuming unequal variances were used to test the null hypothesis that flow rate (ml/minute) and time to filter 500 ml (seconds) were not significantly different between Nalgene filters with Supor machV PES and each of the other filters. Protein binding and extractables data were not tested for significant differences.
Results & discussionFlow rate
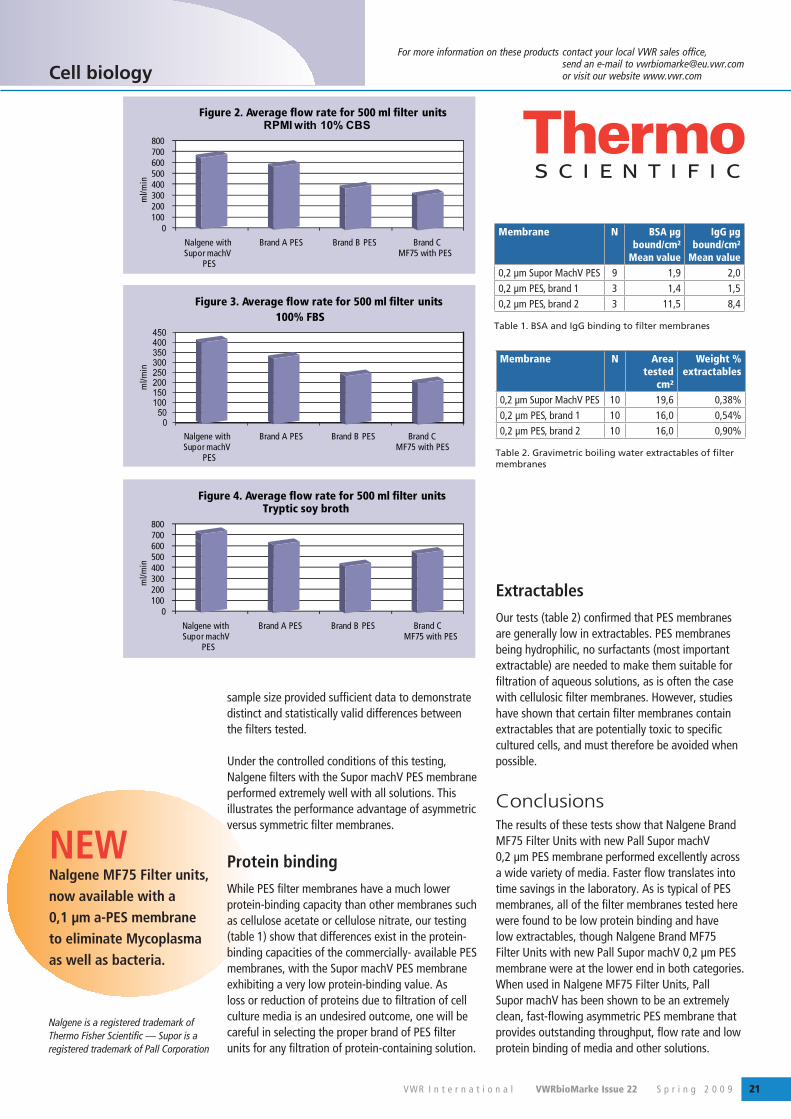
The testing conducted here (see figures 2, 3 and 4) demonstrated the capabilities of the Nalgene filter units with new Supor machV PES membrane. The
Figure 1. SEM-image of a cross-section of the Supor machV 0,2 μm PES membrane, exhibiting the asymmetric nature of the membrane.
VWR I n t e r n a t i o n a l VWRbioMarke Issue 22 S p r i n g 2 0 0 9 21
For more information on these products contact your local VWR sales office, send an e-mail to [email protected] or visit our website www.vwr.com
NEWNalgene MF75 Filter units, now available with a 0,1 μm a-PES membrane to eliminate Mycoplasma as well as bacteria.
sample size provided sufficient data to demonstrate distinct and statistically valid differences between the filters tested.
Under the controlled conditions of this testing, Nalgene filters with the Supor machV PES membrane performed extremely well with all solutions. This illustrates the performance advantage of asymmetric versus symmetric filter membranes.
Protein bindingWhile PES filter membranes have a much lower protein-binding capacity than other membranes such as cellulose acetate or cellulose nitrate, our testing (table 1) show that differences exist in the protein-binding capacities of the commercially- available PES membranes, with the Supor machV PES membrane exhibiting a very low protein-binding value. As loss or reduction of proteins due to filtration of cell culture media is an undesired outcome, one will be careful in selecting the proper brand of PES filter units for any filtration of protein-containing solution.
ExtractablesOur tests (table 2) confirmed that PES membranes are generally low in extractables. PES membranes being hydrophilic, no surfactants (most important extractable) are needed to make them suitable for filtration of aqueous solutions, as is often the case with cellulosic filter membranes. However, studies have shown that certain filter membranes contain extractables that are potentially toxic to specific cultured cells, and must therefore be avoided when possible.
ConclusionsThe results of these tests show that Nalgene Brand MF75 Filter Units with new Pall Supor machV 0,2 μm PES membrane performed excellently across a wide variety of media. Faster flow translates into time savings in the laboratory. As is typical of PES membranes, all of the filter membranes tested here were found to be low protein binding and have low extractables, though Nalgene Brand MF75 Filter Units with new Pall Supor machV 0,2 μm PES membrane were at the lower end in both categories.When used in Nalgene MF75 Filter Units, Pall Supor machV has been shown to be an extremely clean, fast-flowing asymmetric PES membrane that provides outstanding throughput, flow rate and low protein binding of media and other solutions.
Cell biology
Membrane N Area tested
cm²
Weight % extractables
0,2 μm Supor MachV PES 10 19,6 0,38%0,2 μm PES, brand 1 10 16,0 0,54%0,2 μm PES, brand 2 10 16,0 0,90%
Table 2. Gravimetric boiling water extractables of filter membranes
Membrane N BSA μg bound/cm²
Mean value
IgG μg bound/cm²
Mean value0,2 μm Supor MachV PES 9 1,9 2,00,2 μm PES, brand 1 3 1,4 1,50,2 μm PES, brand 2 3 11,5 8,4
Table 1. BSA and IgG binding to filter membranes
Nalgene is a registered trademark of Thermo Fisher Scientific — Supor is a registered trademark of Pall Corporation
0100200300400500600700800
Nalgene with Supor machV
PES
Brand A PES Brand B PES Brand C MF75 with PES
ml/m
in
Figure 2. Average flow rate for 500 ml filter units RPMI with 10% CBS
050
100150200250300350400450
100% FBS Figure 3. Average flow rate for 500 ml filter units
ml/m
in
Nalgene with Supor machV
PES
Brand A PES Brand B PES Brand C MF75 with PES
0100200300400500600700800
Nalgene with Supor machV
PES
Brand A PES Brand B PES Brand C MF75 with PES
ml/m
in
Figure 4. Average flow rate for 500 ml filter units Tryptic soy broth
VWR I n t e r n a t i o n a l VWRbioMarke Issue 22 S p r i n g 2 0 0 922
Title
body
introduction
Impact of assay miniaturisation on HTRF® performance
Mark E. Rothenberg1, Alice Gao2, Michael Briggs1 and Todd Upton1
1Technical Applications and 2Science and Technology, Corning Life Sciences
selected plates buy 3 boxes but pay for only 2!
Introduction and purpose
The HTRF (Homogeneous Time-Resolved Fluorescence) assay has become an integral tool for scientists interested in studying close molecular interactions. The assay combines the techniques of fluorescence resonance energy transfer (FRET) and time resolved fluorescence (TRF). The TRFRET combination and homogenous format allow for (1) increased flexibility, (2) an increase in sensitivity and (3) more stable fluorophores. The assay format also provides higher throughput and fewer confounding results.
The HTRF assay requires both a donor and acceptor fluorophore which are brought together by a biomolecular interaction (e.g., receptorligand binding). FRET energy from the donor fluorophore (Europium Cryptate) (620 nm) is transferred to the acceptor fluorophore (XL665) which is then released at 665 nm. Due to the fluorescent energy exchange, interactions between molecular entities can be measured by coupling each partner with a fluorescent label and measuring the level of transfer (for a more indepth review: http://www.htrf.com/).
The closer or greater degree of interaction, the greater the amount of FRETenergy transferred between donor and acceptor molecules.
Assay miniaturisation is an important goal for those wishing to reduce costs and save on reagents. To assess the impact of miniaturisation on HTRF assay performance, the Reader Calibration Kit from CisBio was utilised. Several different comparisons were made including a reduction in assay volume and a difference in microplate geometry (low volume [LV] vs. normal volume [NV] and round vs. flat bottom). Finally, cost reduction was demonstrated using 384 LV and 1536 microplates.
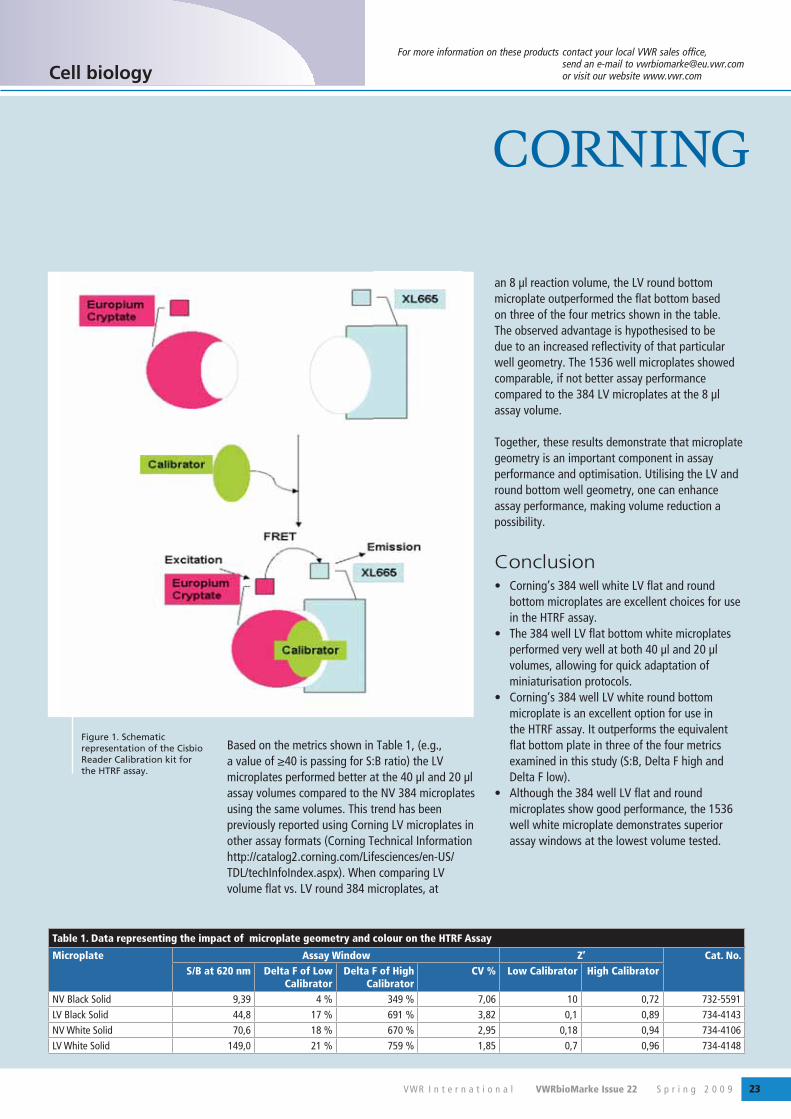
Methods and results The Cisbio Reader Calibration Kit was used to compare microplate geometry (LV vs. NV and round vs. flat bottom) and determine the impact of assay volume (40 μl vs. 20 μl vs. 8 μl) on the performance of the HTRF assay. The kit is normally used to validate plate readers for the HTRF assay, but it can also be used to validate microplate performance. It uses a sandwich configuration for the assay format (Figure 1). Two concentrations of calibrator, high and low, are used to couple the donor (Europium Cryptate) with the acceptor (XL665) fluorophores. The following metrics were used in the study: Signal:Background (S/B), Delta F (correlates the signal to background of the assay calculated by using the fluorescence ratio values) and %CV.
Using the protocol supplied by the vendor, the assay was performed by comparing 384 well white NV (40 μl) (Cat. No. 734-4106); 384 well white LV flat bottom (20 or 8 μl) (Cat. No. 734-4148) and 384 well white LV round bottom (Cat. No. 732-5532) microplates. As a comparison, HTRF assay performance was also examined using a 1536 well white Corning microplate (Cat. No. 734-4127) and an equivalent competitor brand using the 8 μl LV assay format. The Reader Calibration Kit was miniaturised from the standard 40 μl reaction volume to 20 μl (1/2 volume of all reagents) and 8 μl (1/5 volume of all reagents), and data were collected using a Tecan Ultra Reader containing Cisbio approved filters.
VWR I n t e r n a t i o n a l VWRbioMarke Issue 22 S p r i n g 2 0 0 9 23
For more information on these products contact your local VWR sales office, send an e-mail to [email protected] or visit our website www.vwr.com
Based on the metrics shown in Table 1, (e.g., a value of ≥40 is passing for S:B ratio) the LV microplates performed better at the 40 μl and 20 μl assay volumes compared to the NV 384 microplates using the same volumes. This trend has been previously reported using Corning LV microplates in other assay formats (Corning Technical Information http://catalog2.corning.com/Lifesciences/en-US/TDL/techInfoIndex.aspx). When comparing LV volume flat vs. LV round 384 microplates, at
an 8 μl reaction volume, the LV round bottom microplate outperformed the flat bottom based on three of the four metrics shown in the table. The observed advantage is hypothesised to be due to an increased reflectivity of that particular well geometry. The 1536 well microplates showed comparable, if not better assay performance compared to the 384 LV microplates at the 8 μl assay volume.
Together, these results demonstrate that microplate geometry is an important component in assay performance and optimisation. Utilising the LV and round bottom well geometry, one can enhance assay performance, making volume reduction a possibility.
Conclusion • Corning’s 384 well white LV flat and round
bottom microplates are excellent choices for use in the HTRF assay.
• The 384 well LV flat bottom white microplates performed very well at both 40 μl and 20 μl volumes, allowing for quick adaptation of miniaturisation protocols.
• Corning’s 384 well LV white round bottom microplate is an excellent option for use in the HTRF assay. It outperforms the equivalent flat bottom plate in three of the four metrics examined in this study (S:B, Delta F high and Delta F low).
• Although the 384 well LV flat and round microplates show good performance, the 1536 well white microplate demonstrates superior assay windows at the lowest volume tested.
Cell biology
Table 1. Data representing the impact of microplate geometry and colour on the HTRF Assay
Microplate Assay Window Z’ Cat. No.S/B at 620 nm Delta F of Low
CalibratorDelta F of High
CalibratorCV % Low Calibrator High Calibrator
NV Black Solid 9,39 4 % 349 % 7,06 10 0,72 732-5591LV Black Solid 44,8 17 % 691 % 3,82 0,1 0,89 734-4143NV White Solid 70,6 18 % 670 % 2,95 0,18 0,94 734-4106LV White Solid 149,0 21 % 759 % 1,85 0,7 0,96 734-4148
Figure 1. Schematic representation of the Cisbio Reader Calibration kit for the HTRF assay.
VWR I n t e r n a t i o n a l VWRbioMarke Issue 22 S p r i n g 2 0 0 924
Extracellular matrix is harvested with the cells
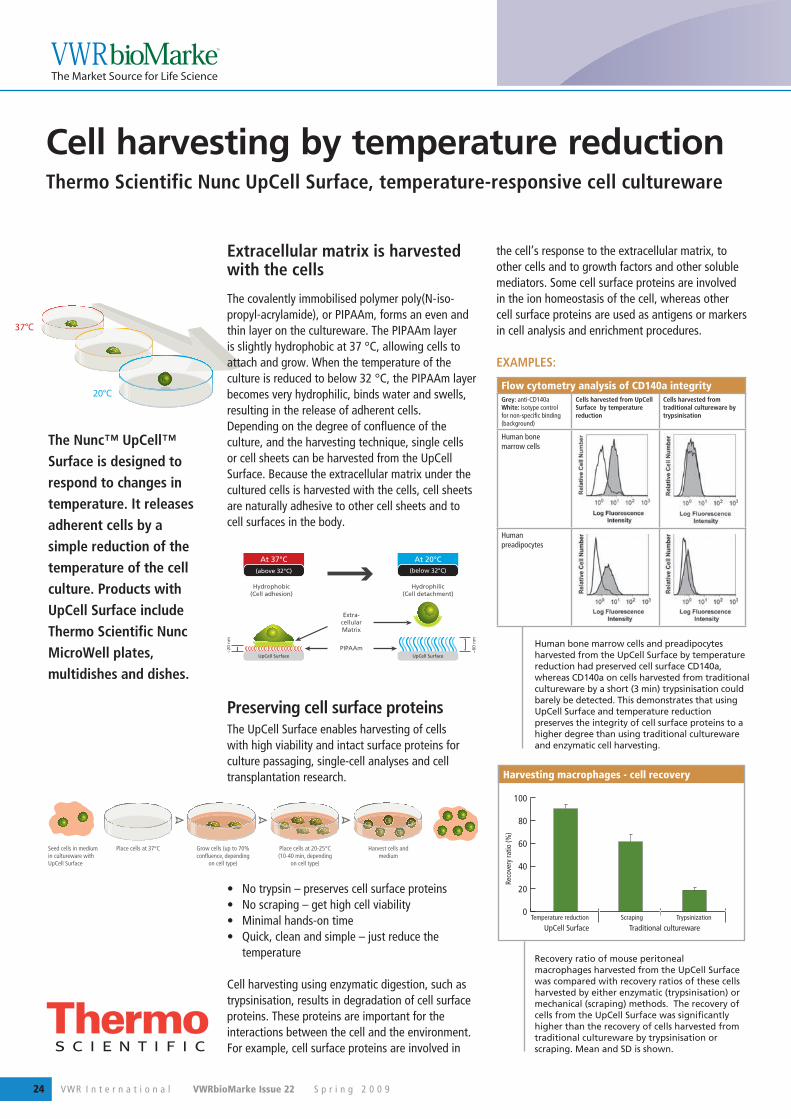
The covalently immobilised polymer poly(N- iso-propyl-acrylamide), or PIPAAm, forms an even and thin layer on the cultureware. The PIPAAm layer is slightly hydrophobic at 37 °C, allowing cells to attach and grow. When the temperature of the culture is reduced to below 32 °C, the PIPAAm layer becomes very hydrophilic, binds water and swells, resulting in the release of adherent cells. Depending on the degree of confluence of the culture, and the harvesting technique, single cells or cell sheets can be harvested from the UpCell Surface. Because the extracellular matrix under the cultured cells is harvested with the cells, cell sheets are naturally adhesive to other cell sheets and to cell surfaces in the body.
Preserving cell surface proteins The UpCell Surface enables harvesting of cells with high viability and intact surface proteins for culture passaging, single-cell analyses and cell transplantation research.
• No trypsin – preserves cell surface proteins• No scraping – get high cell viability• Minimal hands-on time• Quick, clean and simple – just reduce the
temperature
Cell harvesting using enzymatic digestion, such as trypsinisation, results in degradation of cell surface proteins. These proteins are important for the interactions between the cell and the environment. For example, cell surface proteins are involved in
the cell’s response to the extracellular matrix, to other cells and to growth factors and other soluble mediators. Some cell surface proteins are involved in the ion homeostasis of the cell, whereas other cell surface proteins are used as antigens or markers in cell analysis and enrichment procedures.
EXAMPLES:
Cell harvesting by temperature reductionThermo Scientific Nunc UpCell Surface, temperature-responsive cell cultureware
The Nunc™ UpCell™ Surface is designed to respond to changes in temperature. It releases adherent cells by a simple reduction of the temperature of the cell culture. Products with UpCell Surface include Thermo Scientific Nunc MicroWell plates, multidishes and dishes.
Extra-cellularMatrix
PIPAAm
Hydrophilic(Cell detachment)
~60
nm
(below 32°C)
UpCell Surface
At 20°C
~20
nm
UpCell Surface
Hydrophobic(Cell adhesion)
(above 32°C)
At 37°C
Seed cells in medium in cultureware with UpCell Surface
Place cells at 37°C Grow cells (up to 70% confluence, depending
on cell type)
Place cells at 20-25°C (10-40 min, depending
on cell type)
Harvest cells and medium
Flow cytometry analysis of CD140a integrityGrey: anti-CD140aWhite: isotype control for non-specific binding (background)
Cells harvested from UpCell Surface by temperature reduction
Cells harvested from traditional cultureware by trypsinisation
Human bone marrow cells
Human preadipocytes
Human bone marrow cells and preadipocytes harvested from the UpCell Surface by temperature reduction had preserved cell surface CD140a, whereas CD140a on cells harvested from traditional cultureware by a short (3 min) trypsinisation could barely be detected. This demonstrates that using UpCell Surface and temperature reduction preserves the integrity of cell surface proteins to a higher degree than using traditional cultureware and enzymatic cell harvesting.
Recovery ratio of mouse peritoneal macrophages harvested from the UpCell Surface was compared with recovery ratios of these cells harvested by either enzymatic (trypsinisation) or mechanical (scraping) methods. The recovery of cells from the UpCell Surface was significantly higher than the recovery of cells harvested from traditional cultureware by trypsinisation or scraping. Mean and SD is shown.
Harvesting macrophages - cell recovery
0
20
40
60
80
100
Traditional culturewareUpCell Surface
Reco
very
ratio
(%)
Temperature reduction Scraping Trypsinization
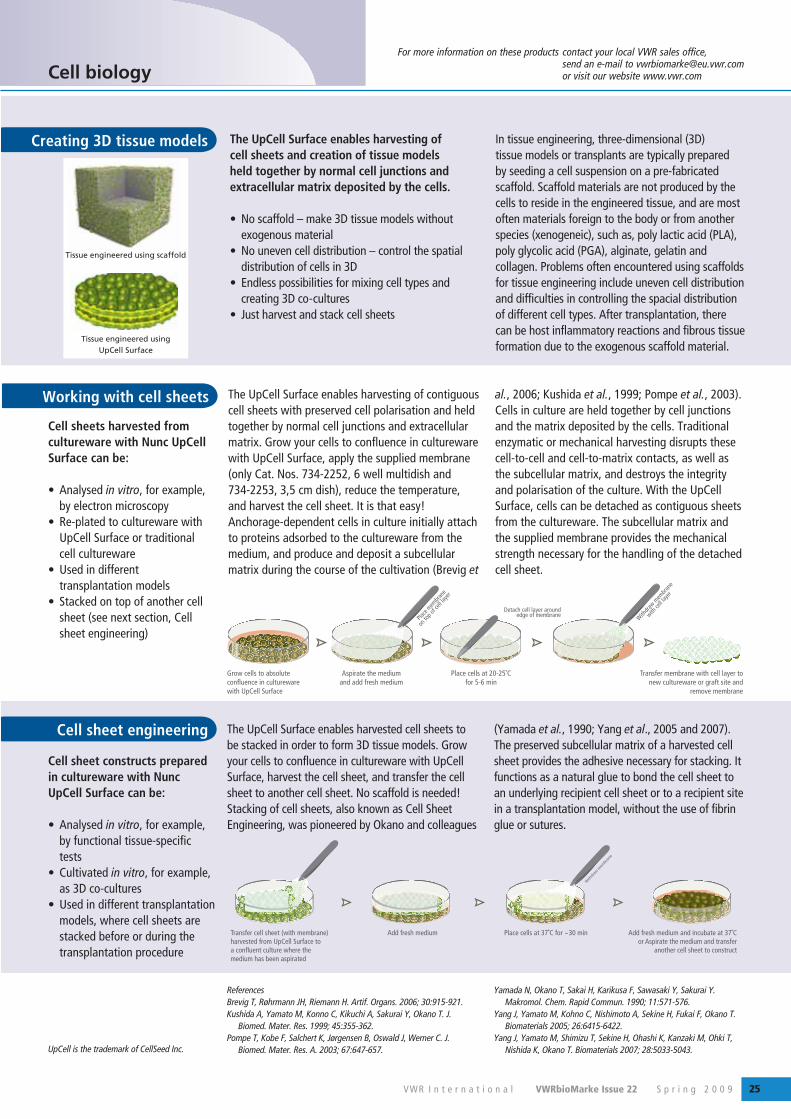
VWR I n t e r n a t i o n a l VWRbioMarke Issue 22 S p r i n g 2 0 0 9 25
For more information on these products contact your local VWR sales office, send an e-mail to [email protected] or visit our website www.vwr.comCell biology
The UpCell Surface enables harvesting of contiguous cell sheets with preserved cell polarisation and held together by normal cell junctions and extracellular matrix. Grow your cells to confluence in cultureware with UpCell Surface, apply the supplied membrane (only Cat. Nos. 734-2252, 6 well multidish and 734-2253, 3,5 cm dish), reduce the temperature, and harvest the cell sheet. It is that easy!Anchorage-dependent cells in culture initially attach to proteins adsorbed to the cultureware from the medium, and produce and deposit a subcellular matrix during the course of the cultivation (Brevig et
al., 2006; Kushida et al., 1999; Pompe et al., 2003). Cells in culture are held together by cell junctions and the matrix deposited by the cells. Traditional enzymatic or mechanical harvesting disrupts these cell-to-cell and cell-to-matrix contacts, as well as the subcellular matrix, and destroys the integrity and polarisation of the culture. With the UpCell Surface, cells can be detached as contiguous sheets from the cultureware. The subcellular matrix and the supplied membrane provides the mechanical strength necessary for the handling of the detached cell sheet.
The UpCell Surface enables harvesting of cell sheets and creation of tissue models held together by normal cell junctions and extracellular matrix deposited by the cells.
• No scaffold – make 3D tissue models without exogenous material
• No uneven cell distribution – control the spatial distribution of cells in 3D
• Endless possibilities for mixing cell types and creating 3D co - cultures
• Just harvest and stack cell sheets
In tissue engineering, three-dimensional (3D) tissue models or transplants are typically prepared by seeding a cell suspension on a pre-fabricated scaffold. Scaffold materials are not produced by the cells to reside in the engineered tissue, and are most often materials foreign to the body or from another species (xenogeneic), such as, poly lactic acid (PLA), poly glycolic acid (PGA), alginate, gelatin and collagen. Problems often encountered using scaffolds for tissue engineering include uneven cell distribution and difficulties in controlling the spacial distribution of different cell types. After transplantation, there can be host inflammatory reactions and fibrous tissue formation due to the exogenous scaffold material.
The UpCell Surface enables harvested cell sheets to be stacked in order to form 3D tissue models. Grow your cells to confluence in cultureware with UpCell Surface, harvest the cell sheet, and transfer the cell sheet to another cell sheet. No scaffold is needed!Stacking of cell sheets, also known as Cell Sheet Engineering, was pioneered by Okano and colleagues
(Yamada et al., 1990; Yang et al., 2005 and 2007). The preserved subcellular matrix of a harvested cell sheet provides the adhesive necessary for stacking. It functions as a natural glue to bond the cell sheet to an underlying recipient cell sheet or to a recipient site in a transplantation model, without the use of fibrin glue or sutures.
Cell sheets harvested from cultureware with Nunc UpCell Surface can be:
• Analysed in vitro, for example, by electron microscopy
• Re-plated to cultureware with UpCell Surface or traditional cell cultureware
• Used in different transplantation models
• Stacked on top of another cell sheet (see next section, Cell sheet engineering)
Cell sheet constructs prepared in cultureware with Nunc UpCell Surface can be:
• Analysed in vitro, for example, by functional tissue-specific tests
• Cultivated in vitro, for example, as 3D co-cultures
• Used in different transplantation models, where cell sheets are stacked before or during the transplantation procedure
Grow cells to absolute confluence in cultureware with UpCell Surface
Transfer membrane with cell layer to new cultureware or graft site and
remove membrane
Aspirate the medium and add fresh medium
Place
mem
brane
on to
p of c
ell la
yer
Withdra
w mem
brane
with ce
ll lay
erPlace cells at 20-25˚C
for 5-6 min
Detach cell layer aroundedge of membrane
ReferencesBrevig T, Røhrmann JH, Riemann H. Artif. Organs. 2006; 30:915-921.Kushida A, Yamato M, Konno C, Kikuchi A, Sakurai Y, Okano T. J.
Biomed. Mater. Res. 1999; 45:355-362. Pompe T, Kobe F, Salchert K, Jørgensen B, Oswald J, Werner C. J.
Biomed. Mater. Res. A. 2003; 67:647-657.
Yamada N, Okano T, Sakai H, Karikusa F, Sawasaki Y, Sakurai Y. Makromol. Chem. Rapid Commun. 1990; 11:571-576.
Yang J, Yamato M, Kohno C, Nishimoto A, Sekine H, Fukai F, Okano T. Biomaterials 2005; 26:6415-6422.
Yang J, Yamato M, Shimizu T, Sekine H, Ohashi K, Kanzaki M, Ohki T, Nishida K, Okano T. Biomaterials 2007; 28:5033-5043.UpCell is the trademark of CellSeed Inc.
Creating 3D tissue models
Working with cell sheets
Cell sheet engineering
Tissue engineered using scaffold
Tissue engineered using UpCell Surface
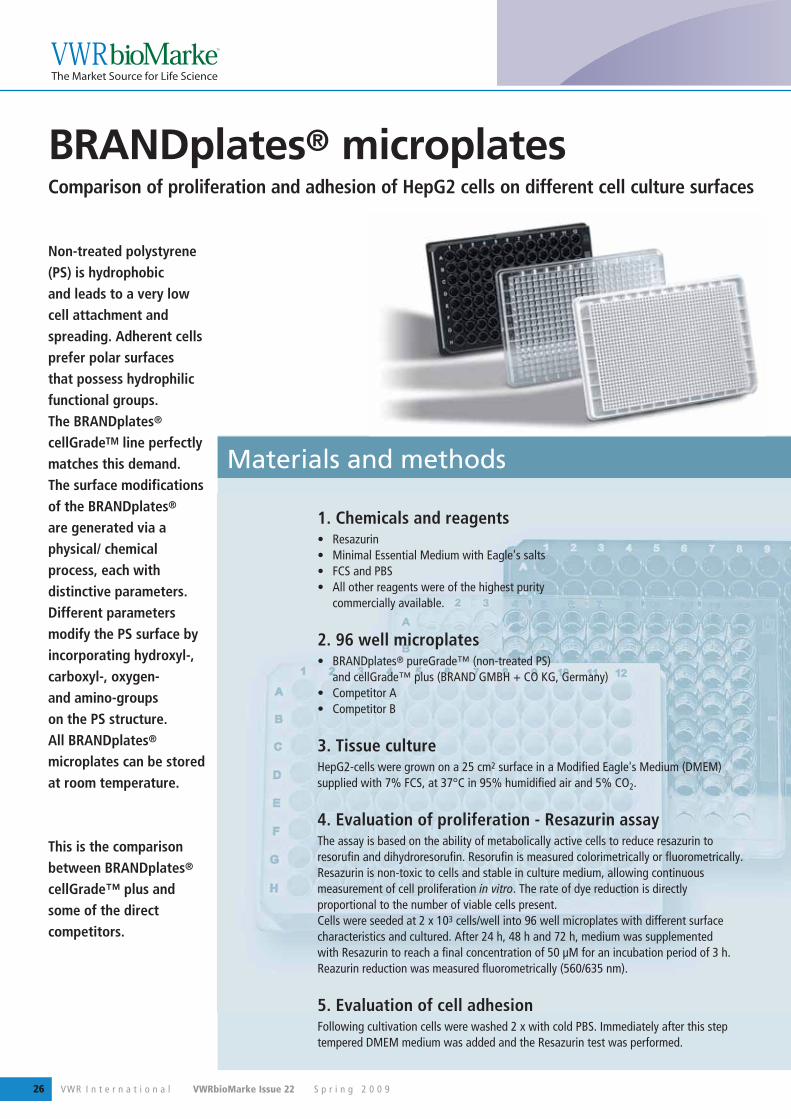
VWR I n t e r n a t i o n a l VWRbioMarke Issue 22 S p r i n g 2 0 0 926
Non-treated polystyrene (PS) is hydrophobic and leads to a very low cell attachment and spreading. Adherent cells prefer polar surfaces that possess hydrophilic functional groups. The BRANDplates® cellGradeTM line perfectly matches this demand. The surface modifications of the BRANDplates® are generated via a physical/ chemical process, each with distinctive parameters. Different parameters modify the PS surface by incorporating hydroxyl-, carboxyl-, oxygen- and amino-groups on the PS structure. All BRANDplates® microplates can be stored at room temperature.
This is the comparison between BRANDplates® cellGrade™ plus and some of the direct competitors.
BRANDplates® microplates Comparison of proliferation and adhesion of HepG2 cells on different cell culture surfaces
1. Chemicals and reagents• Resazurin • Minimal Essential Medium with Eagle's salts • FCS and PBS • All other reagents were of the highest purity
commercially available.
2. 96 well microplates• BRANDplates® pureGrade™ (non-treated PS)
and cellGrade™ plus (BRAND GMBH + CO KG, Germany)• Competitor A • Competitor B
3. Tissue cultureHepG2-cells were grown on a 25 cm2 surface in a Modified Eagle's Medium (DMEM) supplied with 7% FCS, at 37°C in 95% humidified air and 5% CO2.
4. Evaluation of proliferation - Resazurin assayThe assay is based on the ability of metabolically active cells to reduce resazurin to resorufin and dihydroresorufin. Resorufin is measured colorimetrically or fluorometrically. Resazurin is non-toxic to cells and stable in culture medium, allowing continuous measurement of cell proliferation in vitro. The rate of dye reduction is directly proportional to the number of viable cells present. Cells were seeded at 2 x 10³ cells/well into 96 well microplates with different surface characteristics and cultured. After 24 h, 48 h and 72 h, medium was supplemented with Resazurin to reach a final concentration of 50 μM for an incubation period of 3 h. Reazurin reduction was measured fluorometrically (560/635 nm).
5. Evaluation of cell adhesion Following cultivation cells were washed 2 x with cold PBS. Immediately after this step tempered DMEM medium was added and the Resazurin test was performed.
Materials and methods
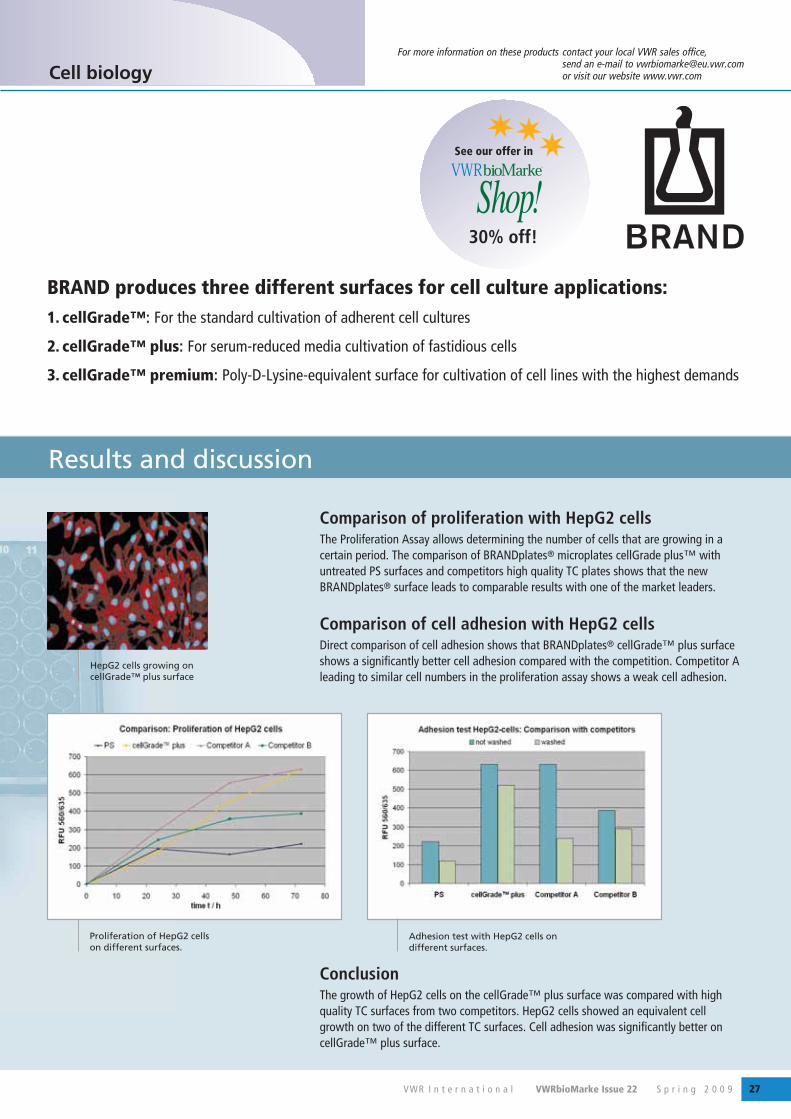
VWR I n t e r n a t i o n a l VWRbioMarke Issue 22 S p r i n g 2 0 0 9 27
For more information on these products contact your local VWR sales office, send an e-mail to [email protected] or visit our website www.vwr.comCell biology
Comparison of proliferation with HepG2 cellsThe Proliferation Assay allows determining the number of cells that are growing in a certain period. The comparison of BRANDplates® microplates cellGrade plus™ with untreated PS surfaces and competitors high quality TC plates shows that the new BRANDplates® surface leads to comparable results with one of the market leaders.
Comparison of cell adhesion with HepG2 cellsDirect comparison of cell adhesion shows that BRANDplates® cellGrade™ plus surface shows a significantly better cell adhesion compared with the competition. Competitor A leading to similar cell numbers in the proliferation assay shows a weak cell adhesion.
Proliferation of HepG2 cells on different surfaces.
Adhesion test with HepG2 cells on different surfaces.
Results and discussion
ConclusionThe growth of HepG2 cells on the cellGrade™ plus surface was compared with high quality TC surfaces from two competitors. HepG2 cells showed an equivalent cell growth on two of the different TC surfaces. Cell adhesion was significantly better on cellGrade™ plus surface.
HepG2 cells growing on cellGrade™ plus surface
30% off!
BRAND produces three different surfaces for cell culture applications:1. cellGrade™: For the standard cultivation of adherent cell cultures
2. cellGrade™ plus: For serum-reduced media cultivation of fastidious cells
3. cellGrade™ premium: Poly-D-Lysine-equivalent surface for cultivation of cell lines with the highest demands
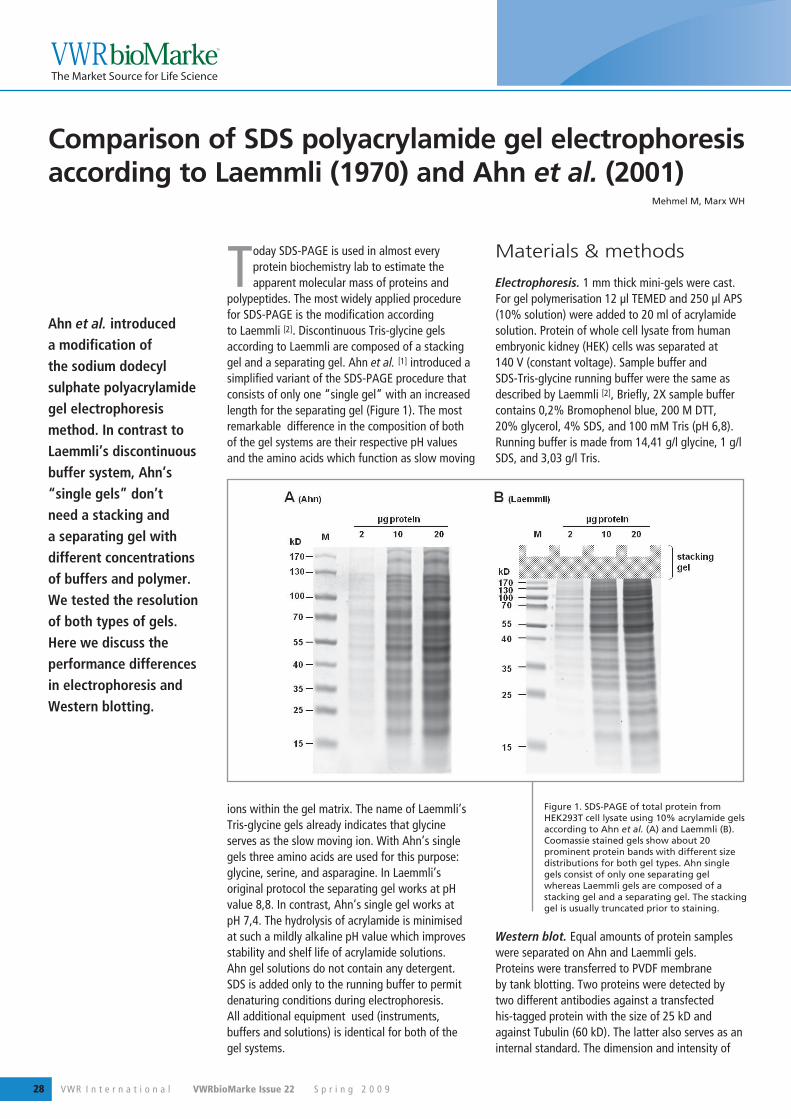
VWR I n t e r n a t i o n a l VWRbioMarke Issue 22 S p r i n g 2 0 0 928
Ahn et al. introduced a modification of the sodium dodecyl sulphate polyacrylamide gel electrophoresis method. In contrast to Laemmli’s discontinuous buffer system, Ahn’s “single gels” don’t need a stacking and a separating gel with different concentrations of buffers and polymer. We tested the resolution of both types of gels. Here we discuss the performance differences in electrophoresis and Western blotting.
Comparison of SDS polyacrylamide gel electrophoresis according to Laemmli (1970) and Ahn et al. (2001)
Mehmel M, Marx WH
Today SDS-PAGE is used in almost every protein biochemistry lab to estimate the apparent molecular mass of proteins and
polypeptides. The most widely applied procedure for SDS-PAGE is the modification according to Laemmli [2]. Discontinuous Tris-glycine gels according to Laemmli are composed of a stacking gel and a separating gel. Ahn et al. [1] introduced a simplified variant of the SDS-PAGE procedure that consists of only one “single gel” with an increased length for the separating gel (Figure 1). The most remarkable difference in the composition of both of the gel systems are their respective pH values and the amino acids which function as slow moving
ions within the gel matrix. The name of Laemmli’s Tris-glycine gels already indicates that glycine serves as the slow moving ion. With Ahn’s single gels three amino acids are used for this purpose: glycine, serine, and asparagine. In Laemmli’s original protocol the separating gel works at pH value 8,8. In contrast, Ahn’s single gel works at pH 7,4. The hydrolysis of acrylamide is minimised at such a mildly alkaline pH value which improves stability and shelf life of acrylamide solutions. Ahn gel solutions do not contain any detergent. SDS is added only to the running buffer to permit denaturing conditions during electrophoresis.All additional equipment used (instruments, buffers and solutions) is identical for both of the gel systems.
Materials & methods
Electrophoresis. 1 mm thick mini-gels were cast. For gel polymerisation 12 μl TEMED and 250 μl APS (10% solution) were added to 20 ml of acrylamide solution. Protein of whole cell lysate from human embryonic kidney (HEK) cells was separated at 140 V (constant voltage). Sample buffer and SDS-Tris-glycine running buffer were the same as described by Laemmli [2], Briefly, 2X sample buffer contains 0,2% Bromophenol blue, 200 M DTT, 20% glycerol, 4% SDS, and 100 mM Tris (pH 6,8). Running buffer is made from 14,41 g/l glycine, 1 g/l SDS, and 3,03 g/l Tris.
Western blot. Equal amounts of protein samples were separated on Ahn and Laemmli gels. Proteins were transferred to PVDF membrane by tank blotting. Two proteins were detected by two different antibodies against a transfected his-tagged protein with the size of 25 kD and against Tubulin (60 kD). The latter also serves as an internal standard. The dimension and intensity of
Figure 1. SDS-PAGE of total protein from HEK293T cell lysate using 10% acrylamide gels according to Ahn et al. (A) and Laemmli (B). Coomassie stained gels show about 20 prominent protein bands with different size distributions for both gel types. Ahn single gels consist of only one separating gel whereas Laemmli gels are composed of a stacking gel and a separating gel. The stacking gel is usually truncated prior to staining.
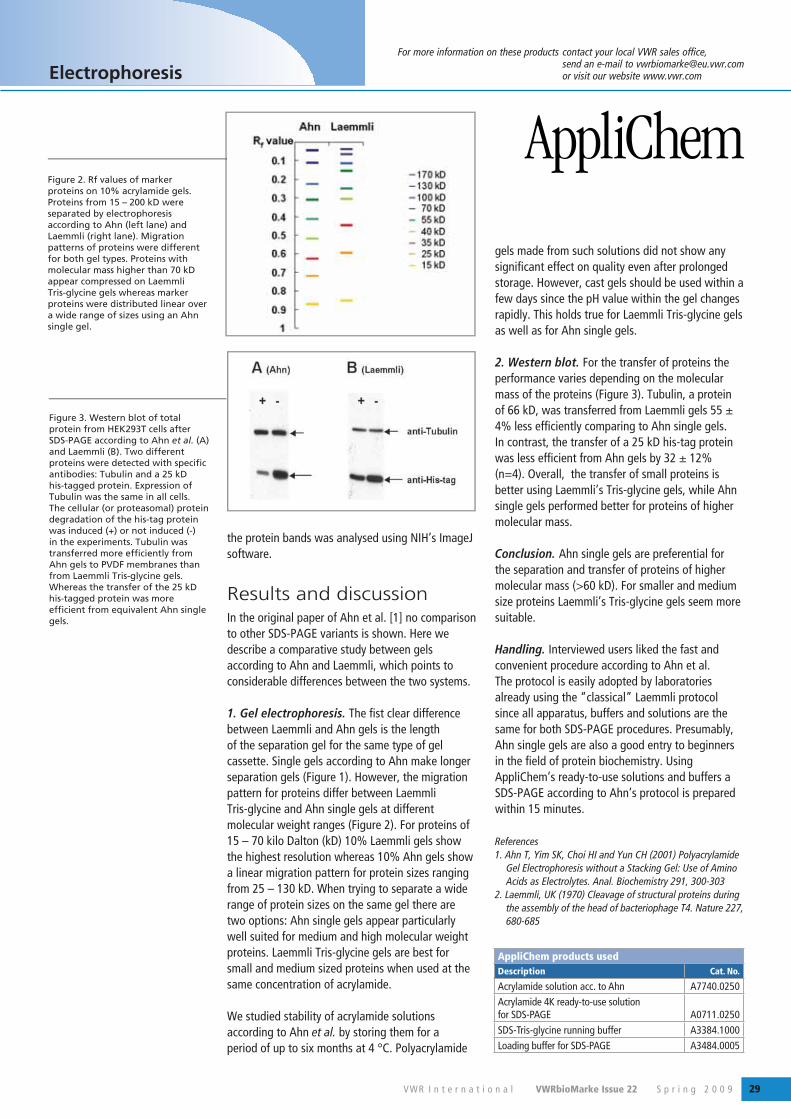
VWR I n t e r n a t i o n a l VWRbioMarke Issue 22 S p r i n g 2 0 0 9 29
For more information on these products contact your local VWR sales office, send an e-mail to [email protected] or visit our website www.vwr.com
the protein bands was analysed using NIH’s ImageJ software.
Results and discussionIn the original paper of Ahn et al. [1] no comparison to other SDS-PAGE variants is shown. Here we describe a comparative study between gels according to Ahn and Laemmli, which points to considerable differences between the two systems.
1. Gel electrophoresis. The fist clear difference between Laemmli and Ahn gels is the length of the separation gel for the same type of gel cassette. Single gels according to Ahn make longer separation gels (Figure 1). However, the migration pattern for proteins differ between Laemmli Tris-glycine and Ahn single gels at different molecular weight ranges (Figure 2). For proteins of 15 – 70 kilo Dalton (kD) 10% Laemmli gels show the highest resolution whereas 10% Ahn gels show a linear migration pattern for protein sizes ranging from 25 – 130 kD. When trying to separate a wide range of protein sizes on the same gel there are two options: Ahn single gels appear particularly well suited for medium and high molecular weight proteins. Laemmli Tris-glycine gels are best for small and medium sized proteins when used at the same concentration of acrylamide.
We studied stability of acrylamide solutions according to Ahn et al. by storing them for a period of up to six months at 4 °C. Polyacrylamide
gels made from such solutions did not show any significant effect on quality even after prolonged storage. However, cast gels should be used within a few days since the pH value within the gel changes rapidly. This holds true for Laemmli Tris-glycine gels as well as for Ahn single gels.
2. Western blot. For the transfer of proteins the performance varies depending on the molecular mass of the proteins (Figure 3). Tubulin, a protein of 66 kD, was transferred from Laemmli gels 55 ± 4% less efficiently comparing to Ahn single gels. In contrast, the transfer of a 25 kD his-tag protein was less efficient from Ahn gels by 32 ± 12% (n=4). Overall, the transfer of small proteins is better using Laemmli’s Tris-glycine gels, while Ahn single gels performed better for proteins of higher molecular mass.
Conclusion. Ahn single gels are preferential for the separation and transfer of proteins of higher molecular mass (>60 kD). For smaller and medium size proteins Laemmli’s Tris-glycine gels seem more suitable.
Handling. Interviewed users liked the fast and convenient procedure according to Ahn et al.The protocol is easily adopted by laboratories already using the “classical” Laemmli protocol since all apparatus, buffers and solutions are the same for both SDS-PAGE procedures. Presumably, Ahn single gels are also a good entry to beginners in the field of protein biochemistry. Using AppliChem’s ready-to-use solutions and buffers a SDS-PAGE according to Ahn’s protocol is prepared within 15 minutes.
References1. Ahn T, Yim SK, Choi HI and Yun CH (2001) Polyacrylamide
Gel Electrophoresis without a Stacking Gel: Use of Amino Acids as Electrolytes. Anal. Biochemistry 291, 300-303
2. Laemmli, UK (1970) Cleavage of structural proteins during the assembly of the head of bacteriophage T4. Nature 227, 680-685
Electrophoresis
AppliChem products usedDescription Cat. No.
Acrylamide solution acc. to Ahn A7740.0250Acrylamide 4K ready-to-use solution for SDS-PAGE A0711.0250SDS-Tris-glycine running buffer A3384.1000Loading buffer for SDS-PAGE A3484.0005
Figure 2. Rf values of marker proteins on 10% acrylamide gels. Proteins from 15 – 200 kD were separated by electrophoresis according to Ahn (left lane) and Laemmli (right lane). Migration patterns of proteins were different for both gel types. Proteins with molecular mass higher than 70 kD appear compressed on Laemmli Tris-glycine gels whereas marker proteins were distributed linear over a wide range of sizes using an Ahn single gel.
Figure 3. Western blot of total protein from HEK293T cells after SDS-PAGE according to Ahn et al. (A) and Laemmli (B). Two different proteins were detected with specific antibodies: Tubulin and a 25 kD his-tagged protein. Expression of Tubulin was the same in all cells. The cellular (or proteasomal) protein degradation of the his-tag protein was induced (+) or not induced (-) in the experiments. Tubulin was transferred more efficiently from Ahn gels to PVDF membranes than from Laemmli Tris-glycine gels. Whereas the transfer of the 25 kD his-tagged protein was more efficient from equivalent Ahn single gels.
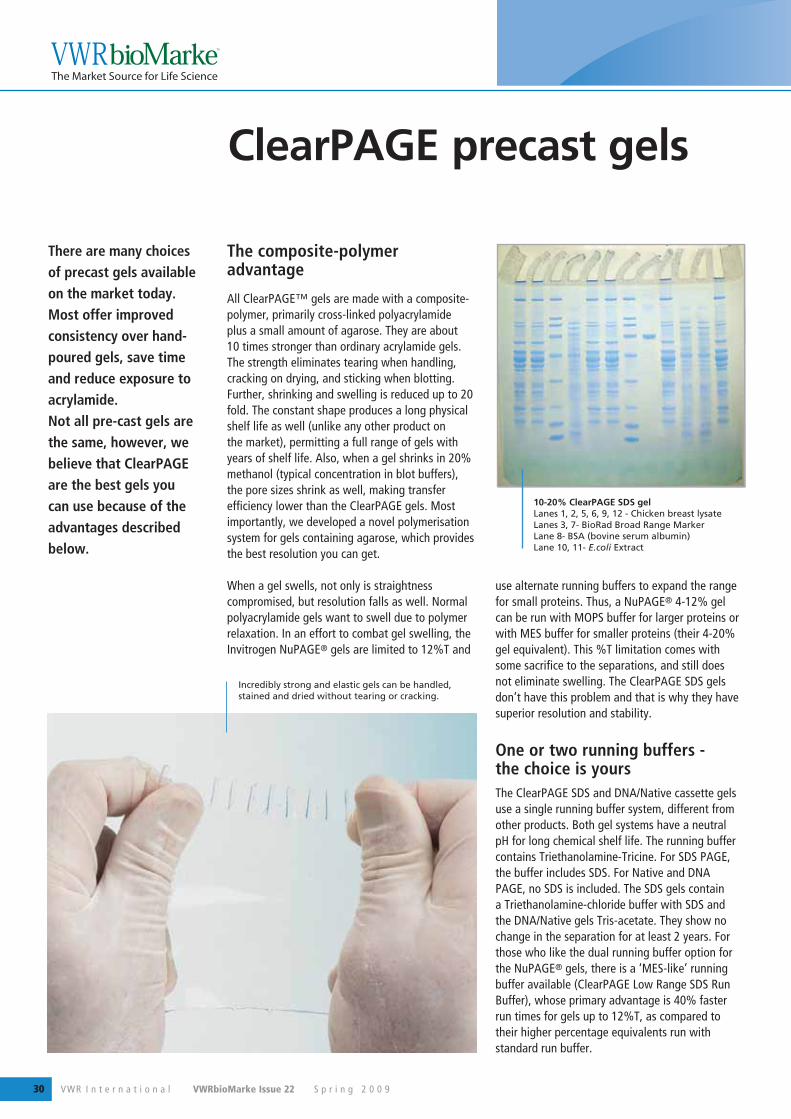
VWR I n t e r n a t i o n a l VWRbioMarke Issue 22 S p r i n g 2 0 0 930
There are many choices of precast gels available on the market today. Most offer improved consistency over hand-poured gels, save time and reduce exposure to acrylamide. Not all pre-cast gels are the same, however, we believe that ClearPAGE are the best gels you can use because of the advantages described below.
ClearPAGE precast gels
The composite-polymer advantage
All ClearPAGE™ gels are made with a composite-polymer, primarily cross-linked polyacrylamide plus a small amount of agarose. They are about 10 times stronger than ordinary acrylamide gels. The strength eliminates tearing when handling, cracking on drying, and sticking when blotting. Further, shrinking and swelling is reduced up to 20 fold. The constant shape produces a long physical shelf life as well (unlike any other product on the market), permitting a full range of gels with years of shelf life. Also, when a gel shrinks in 20% methanol (typical concentration in blot buffers), the pore sizes shrink as well, making transfer efficiency lower than the ClearPAGE gels. Most importantly, we developed a novel polymerisation system for gels containing agarose, which provides the best resolution you can get.
When a gel swells, not only is straightness compromised, but resolution falls as well. Normal polyacrylamide gels want to swell due to polymer relaxation. In an effort to combat gel swelling, the Invitrogen NuPAGE® gels are limited to 12%T and
use alternate running buffers to expand the range for small proteins. Thus, a NuPAGE® 4-12% gel can be run with MOPS buffer for larger proteins or with MES buffer for smaller proteins (their 4-20% gel equivalent). This %T limitation comes with some sacrifice to the separations, and still does not eliminate swelling. The ClearPAGE SDS gels don’t have this problem and that is why they have superior resolution and stability.
One or two running buffers - the choice is yours The ClearPAGE SDS and DNA/Native cassette gels use a single running buffer system, different from other products. Both gel systems have a neutral pH for long chemical shelf life. The running buffer contains Triethanolamine-Tricine. For SDS PAGE, the buffer includes SDS. For Native and DNA PAGE, no SDS is included. The SDS gels contain a Triethanolamine-chloride buffer with SDS and the DNA/Native gels Tris-acetate. They show no change in the separation for at least 2 years. For those who like the dual running buffer option for the NuPAGE® gels, there is a ‘MES-like’ running buffer available (ClearPAGE Low Range SDS Run Buffer), whose primary advantage is 40% faster run times for gels up to 12%T, as compared to their higher percentage equivalents run with standard run buffer.
10-20% ClearPAGE SDS gelLanes 1, 2, 5, 6, 9, 12 - Chicken breast lysateLanes 3, 7- BioRad Broad Range MarkerLane 8- BSA (bovine serum albumin)Lane 10, 11- E.coli Extract
Incredibly strong and elastic gels can be handled, stained and dried without tearing or cracking.
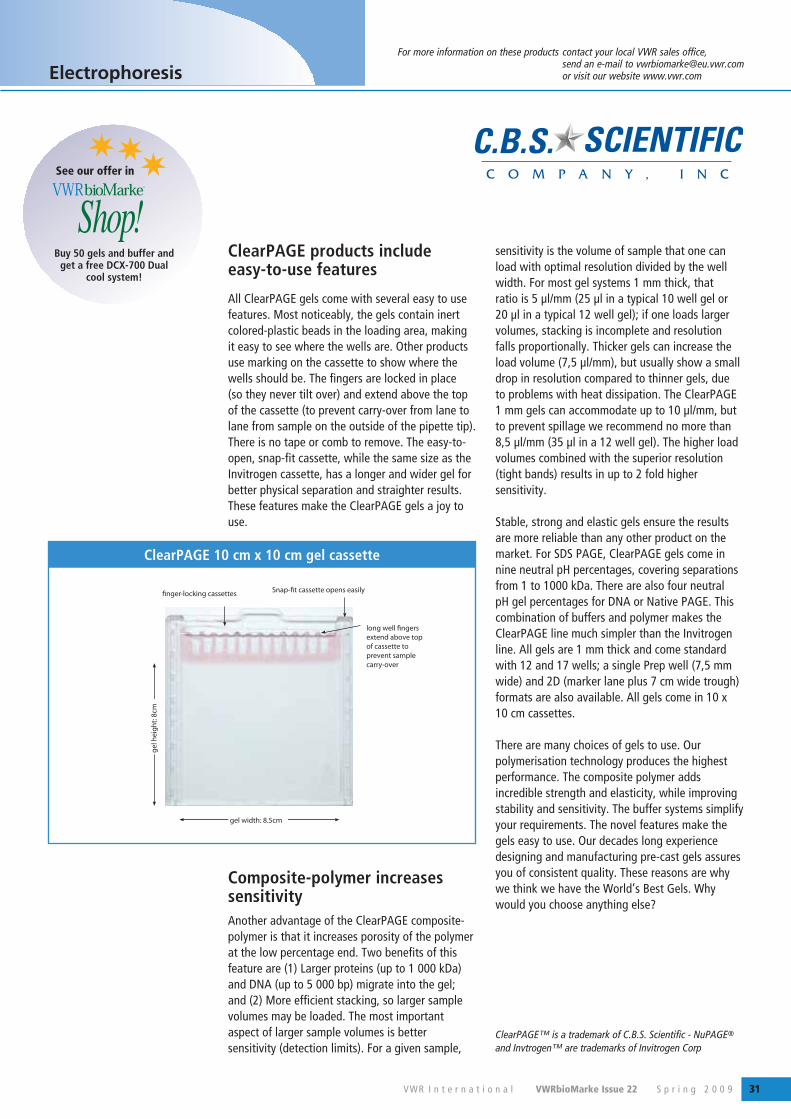
VWR I n t e r n a t i o n a l VWRbioMarke Issue 22 S p r i n g 2 0 0 9 31
For more information on these products contact your local VWR sales office, send an e-mail to [email protected] or visit our website www.vwr.com
ClearPAGE products include easy-to-use features
All ClearPAGE gels come with several easy to use features. Most noticeably, the gels contain inert colored-plastic beads in the loading area, making it easy to see where the wells are. Other products use marking on the cassette to show where the wells should be. The fingers are locked in place (so they never tilt over) and extend above the top of the cassette (to prevent carry-over from lane to lane from sample on the outside of the pipette tip). There is no tape or comb to remove. The easy-to-open, snap-fit cassette, while the same size as the Invitrogen cassette, has a longer and wider gel for better physical separation and straighter results. These features make the ClearPAGE gels a joy to use.
Composite-polymer increases sensitivity Another advantage of the ClearPAGE composite-polymer is that it increases porosity of the polymer at the low percentage end. Two benefits of this feature are (1) Larger proteins (up to 1 000 kDa) and DNA (up to 5 000 bp) migrate into the gel; and (2) More efficient stacking, so larger sample volumes may be loaded. The most important aspect of larger sample volumes is better sensitivity (detection limits). For a given sample,
sensitivity is the volume of sample that one can load with optimal resolution divided by the well width. For most gel systems 1 mm thick, that ratio is 5 μl/mm (25 μl in a typical 10 well gel or 20 μl in a typical 12 well gel); if one loads larger volumes, stacking is incomplete and resolution falls proportionally. Thicker gels can increase the load volume (7,5 μl/mm), but usually show a small drop in resolution compared to thinner gels, due to problems with heat dissipation. The ClearPAGE 1 mm gels can accommodate up to 10 μl/mm, but to prevent spillage we recommend no more than 8,5 μl/mm (35 μl in a 12 well gel). The higher load volumes combined with the superior resolution (tight bands) results in up to 2 fold higher sensitivity.
Stable, strong and elastic gels ensure the results are more reliable than any other product on the market. For SDS PAGE, ClearPAGE gels come in nine neutral pH percentages, covering separations from 1 to 1000 kDa. There are also four neutral pH gel percentages for DNA or Native PAGE. This combination of buffers and polymer makes the ClearPAGE line much simpler than the Invitrogen line. All gels are 1 mm thick and come standard with 12 and 17 wells; a single Prep well (7,5 mm wide) and 2D (marker lane plus 7 cm wide trough) formats are also available. All gels come in 10 x 10 cm cassettes.
There are many choices of gels to use. Our polymerisation technology produces the highest performance. The composite polymer adds incredible strength and elasticity, while improving stability and sensitivity. The buffer systems simplify your requirements. The novel features make the gels easy to use. Our decades long experience designing and manufacturing pre-cast gels assures you of consistent quality. These reasons are why we think we have the World’s Best Gels. Why would you choose anything else?
Electrophoresis
ClearPAGE 10 cm x 10 cm gel cassette
ClearPAGE™ is a trademark of C.B.S. Scientific - NuPAGE® and Invtrogen™ are trademarks of Invitrogen Corp
Buy 50 gels and buffer and get a free DCX-700 Dual
cool system!
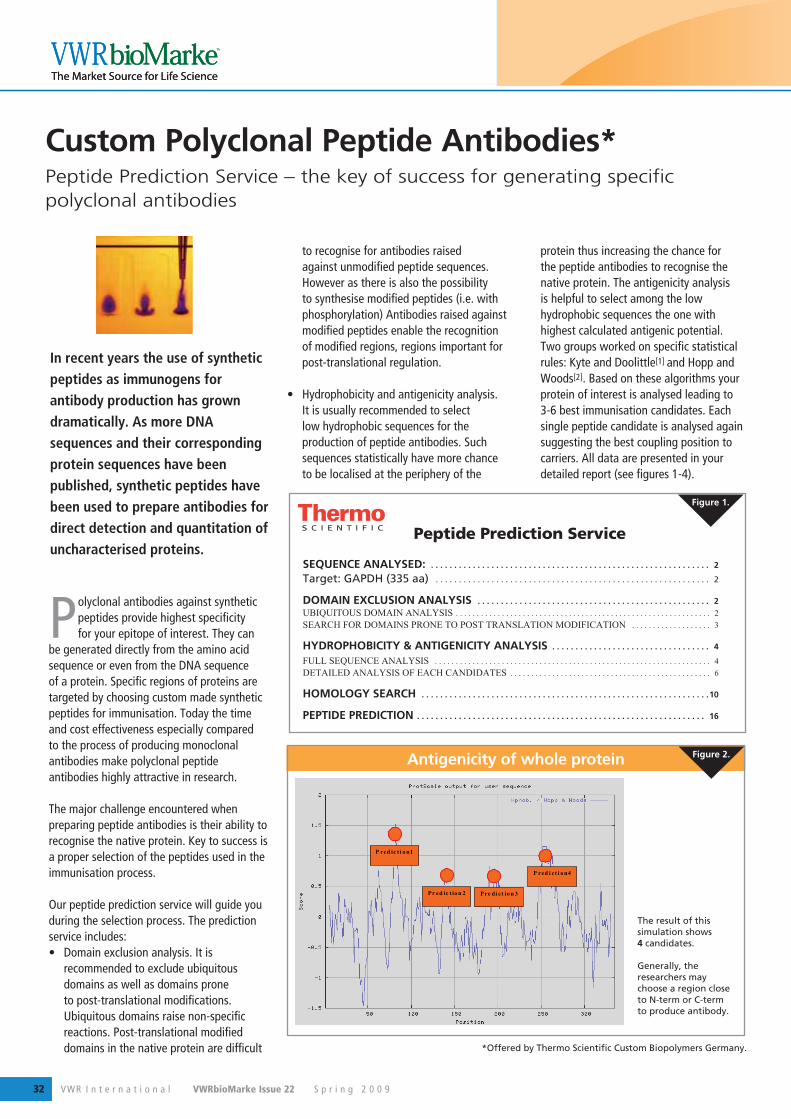
VWR I n t e r n a t i o n a l VWRbioMarke Issue 22 S p r i n g 2 0 0 932
Polyclonal antibodies against synthetic peptides provide highest specificity for your epitope of interest. They can
be generated directly from the amino acid sequence or even from the DNA sequence of a protein. Specific regions of proteins are targeted by choosing custom made synthetic peptides for immunisation. Today the time and cost effectiveness especially compared to the process of producing monoclonal antibodies make polyclonal peptide antibodies highly attractive in research.
The major challenge encountered when preparing peptide antibodies is their ability to recognise the native protein. Key to success is a proper selection of the peptides used in the immunisation process.
Our peptide prediction service will guide you during the selection process. The prediction service includes:• Domain exclusion analysis. It is
recommended to exclude ubiquitous domains as well as domains prone to post-translational modifications. Ubiquitous domains raise non-specific reactions. Post-translational modified domains in the native protein are difficult
to recognise for antibodies raised against unmodified peptide sequences. However as there is also the possibility to synthesise modified peptides (i.e. with phosphorylation) Antibodies raised against modified peptides enable the recognition of modified regions, regions important for post-translational regulation.
• Hydrophobicity and antigenicity analysis. It is usually recommended to select low hydrophobic sequences for the production of peptide antibodies. Such sequences statistically have more chance to be localised at the periphery of the
protein thus increasing the chance for the peptide antibodies to recognise the native protein. The antigenicity analysis is helpful to select among the low hydrophobic sequences the one with highest calculated antigenic potential. Two groups worked on specific statistical rules: Kyte and Doolittle[1] and Hopp and Woods[2]. Based on these algorithms your protein of interest is analysed leading to 3-6 best immunisation candidates. Each single peptide candidate is analysed again suggesting the best coupling position to carriers. All data are presented in your detailed report (see figures 1-4).
Custom Polyclonal Peptide Antibodies*Peptide Prediction Service – the key of success for generating specific polyclonal antibodies
In recent years the use of synthetic peptides as immunogens for antibody production has grown dramatically. As more DNA sequences and their corresponding protein sequences have been published, synthetic peptides have been used to prepare antibodies for direct detection and quantitation of uncharacterised proteins.
Antigenicity of whole protein
The result of this simulation shows 4 candidates.
Generally, the researchers may choose a region close to N-term or C-term to produce antibody.
Figure 2.
Peptide Prediction Service
SEQUENCE ANALYSED: . . . . . . . . . . . . . . . . . . . . . . . . . . . . . . . . . . . . . . . . . . . . . . . . . . . . . . . . . . . . 2
Target: GAPDH (335 aa) . . . . . . . . . . . . . . . . . . . . . . . . . . . . . . . . . . . . . . . . . . . . . . . . . . . . . . . . . . . 2
DOMAIN EXCLUSION ANALYSIS . . . . . . . . . . . . . . . . . . . . . . . . . . . . . . . . . . . . . . . . . . . . . . . . . . 2UBIQUITOUS DOMAIN ANALYSIS . . . . . . . . . . . . . . . . . . . . . . . . . . . . . . . . . . . . . . . . . . . . . . . . . . . . . . . . . . . . . 2SEARCH FOR DOMAINS PRONE TO POST TRANSLATION MODIFICATION . . . . . . . . . . . . . . . . . . . 3
HYDROPHOBICITY & ANTIGENICITY ANALYSIS . . . . . . . . . . . . . . . . . . . . . . . . . . . . . . . . . . 4
FULL SEQUENCE ANALYSIS . . . . . . . . . . . . . . . . . . . . . . . . . . . . . . . . . . . . . . . . . . . . . . . . . . . . . . . . . . . . . . . . . . 4DETAILED ANALYSIS OF EACH CANDIDATES . . . . . . . . . . . . . . . . . . . . . . . . . . . . . . . . . . . . . . . . . . . . . . . . 6
HOMOLOGY SEARCH . . . . . . . . . . . . . . . . . . . . . . . . . . . . . . . . . . . . . . . . . . . . . . . . . . . . . . . . . . . . . .10
PEPTIDE PREDICTION . . . . . . . . . . . . . . . . . . . . . . . . . . . . . . . . . . . . . . . . . . . . . . . . . . . . . . . . . . . . . . 16
Figure 1.
*Offered by Thermo Scientific Custom Biopolymers Germany.
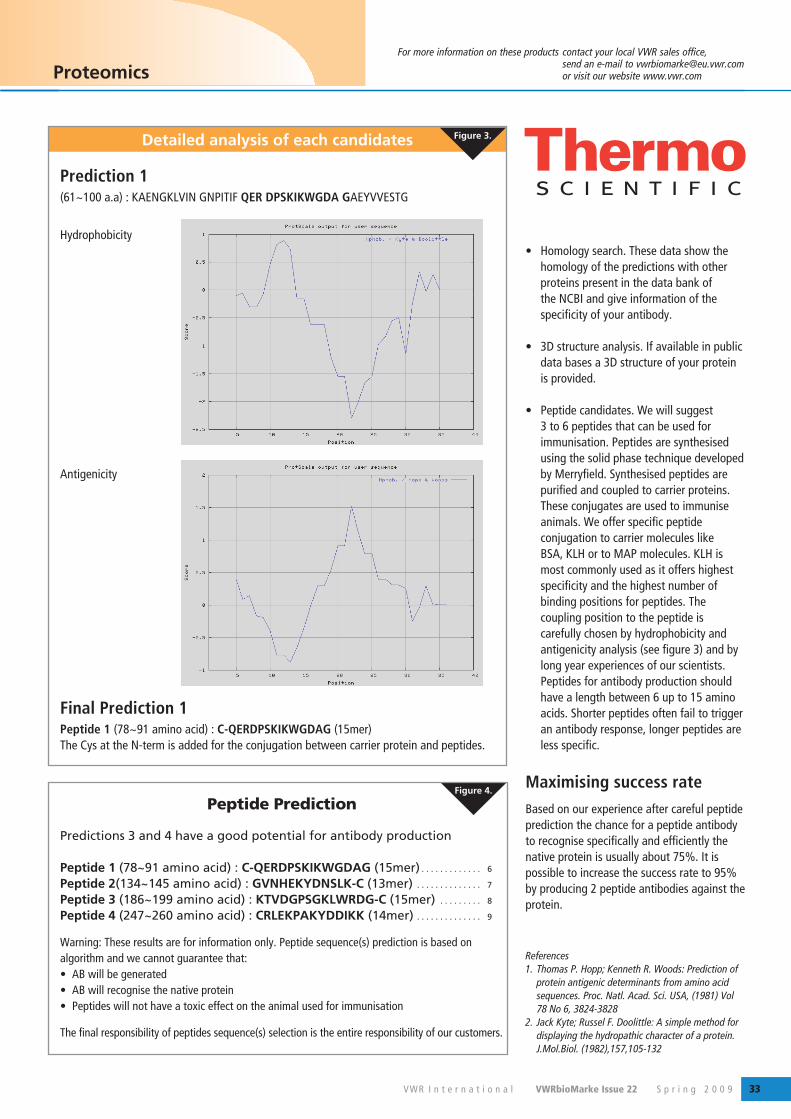
VWR I n t e r n a t i o n a l VWRbioMarke Issue 22 S p r i n g 2 0 0 9 33
For more information on these products contact your local VWR sales office, send an e-mail to [email protected] or visit our website www.vwr.com Proteomics
• Homology search. These data show the homology of the predictions with other proteins present in the data bank of the NCBI and give information of the specificity of your antibody.
• 3D structure analysis. If available in public data bases a 3D structure of your protein is provided.
• Peptide candidates. We will suggest 3 to 6 peptides that can be used for immunisation. Peptides are synthesised using the solid phase technique developed by Merryfield. Synthesised peptides are purified and coupled to carrier proteins. These conjugates are used to immunise animals. We offer specific peptide conjugation to carrier molecules like BSA, KLH or to MAP molecules. KLH is most commonly used as it offers highest specificity and the highest number of binding positions for peptides. The coupling position to the peptide is carefully chosen by hydrophobicity and antigenicity analysis (see figure 3) and by long year experiences of our scientists. Peptides for antibody production should have a length between 6 up to 15 amino acids. Shorter peptides often fail to trigger an antibody response, longer peptides are less specific.
Maximising success rateBased on our experience after careful peptide prediction the chance for a peptide antibody to recognise specifically and efficiently the native protein is usually about 75%. It is possible to increase the success rate to 95% by producing 2 peptide antibodies against the protein.
References1. Thomas P. Hopp; Kenneth R. Woods: Prediction of
protein antigenic determinants from amino acid sequences. Proc. Natl. Acad. Sci. USA, (1981) Vol 78 No 6, 3824-3828
2. Jack Kyte; Russel F. Doolittle: A simple method for displaying the hydropathic character of a protein. J.Mol.Biol. (1982),157,105-132
Detailed analysis of each candidates Figure 3.
Prediction 1(61~100 a.a) : KAENGKLVIN GNPITIF QER DPSKIKWGDA GAEYVVESTG
Hydrophobicity
Antigenicity
Final Prediction 1Peptide 1 (78~91 amino acid) : C-QERDPSKIKWGDAG (15mer)The Cys at the N-term is added for the conjugation between carrier protein and peptides.
Peptide Prediction
Predictions 3 and 4 have a good potential for antibody production
Peptide 1 (78~91 amino acid) : C-QERDPSKIKWGDAG (15mer) . . . . . . . . . . . . . 6 Peptide 2 (134~145 amino acid) : GVNHEKYDNSLK-C (13mer) . . . . . . . . . . . . . . 7
Peptide 3 (186~199 amino acid) : KTVDGPSGKLWRDG-C (15mer) . . . . . . . . . 8
Peptide 4 (247~260 amino acid) : CRLEKPAKYDDIKK (14mer) . . . . . . . . . . . . . . 9
Warning: These results are for information only. Peptide sequence(s) prediction is based on algorithm and we cannot guarantee that:• AB will be generated• AB will recognise the native protein• Peptides will not have a toxic effect on the animal used for immunisation
The final responsibility of peptides sequence(s) selection is the entire responsibility of our customers.
Figure 4.
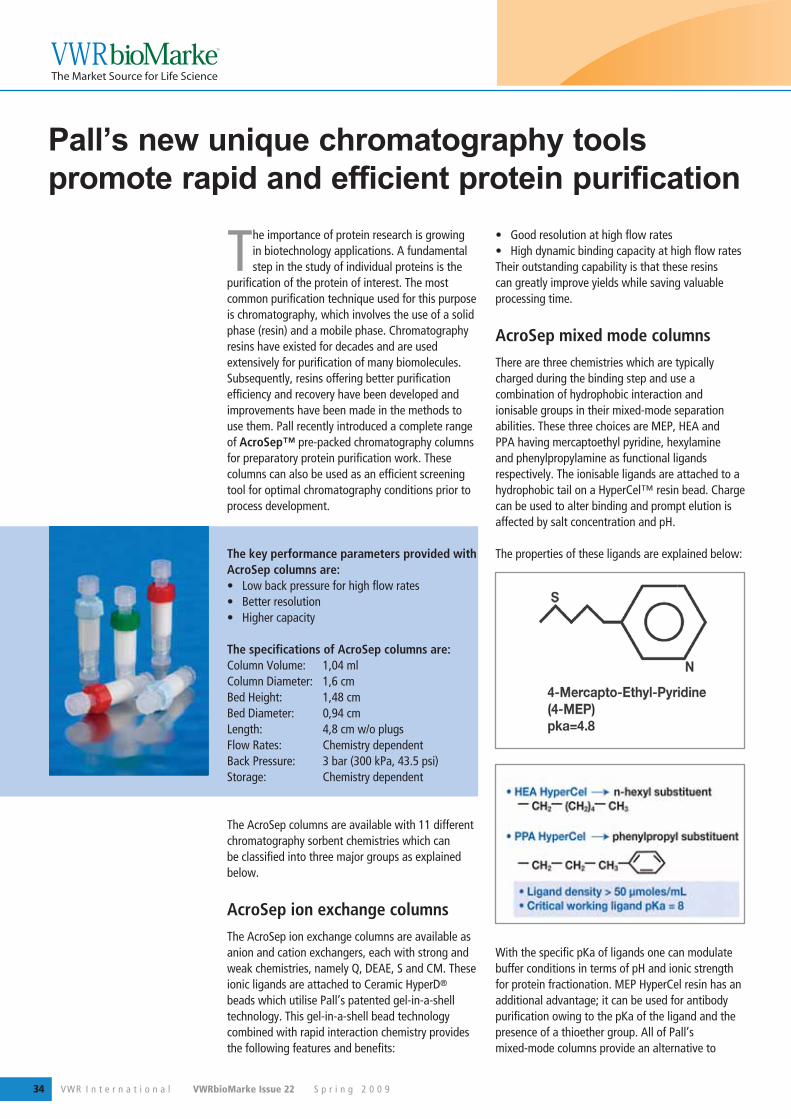
VWR I n t e r n a t i o n a l VWRbioMarke Issue 22 S p r i n g 2 0 0 934
Pall’s new unique chromatography tools promote rapid and efficient protein purification
The importance of protein research is growing in biotechnology applications. A fundamental step in the study of individual proteins is the
purification of the protein of interest. The most common purification technique used for this purpose is chromatography, which involves the use of a solid phase (resin) and a mobile phase. Chromatography resins have existed for decades and are used extensively for purification of many biomolecules. Subsequently, resins offering better purification efficiency and recovery have been developed and improvements have been made in the methods to use them. Pall recently introduced a complete range of AcroSep™ pre-packed chromatography columns for preparatory protein purification work. These columns can also be used as an efficient screening tool for optimal chromatography conditions prior to process development.
The key performance parameters provided with AcroSep columns are:• Low back pressure for high flow rates• Better resolution• Higher capacity
The specifications of AcroSep columns are:Column Volume: 1,04 mlColumn Diameter: 1,6 cmBed Height: 1,48 cmBed Diameter: 0,94 cmLength: 4,8 cm w/o plugsFlow Rates: Chemistry dependentBack Pressure: 3 bar (300 kPa, 43.5 psi)Storage: Chemistry dependent
The AcroSep columns are available with 11 different chromatography sorbent chemistries which can be classified into three major groups as explained below.
AcroSep ion exchange columnsThe AcroSep ion exchange columns are available as anion and cation exchangers, each with strong and weak chemistries, namely Q, DEAE, S and CM. These ionic ligands are attached to Ceramic HyperD® beads which utilise Pall’s patented gel-in-a-shell technology. This gel-in-a-shell bead technology combined with rapid interaction chemistry provides the following features and benefits:
• Good resolution at high flow rates• High dynamic binding capacity at high flow rates Their outstanding capability is that these resins can greatly improve yields while saving valuable processing time.
AcroSep mixed mode columnsThere are three chemistries which are typically charged during the binding step and use a combination of hydrophobic interaction and ionisable groups in their mixed-mode separation abilities. These three choices are MEP, HEA and PPA having mercaptoethyl pyridine, hexylamine and phenylpropylamine as functional ligands respectively. The ionisable ligands are attached to a hydrophobic tail on a HyperCel™ resin bead. Charge can be used to alter binding and prompt elution is affected by salt concentration and pH.
The properties of these ligands are explained below:
With the specific pKa of ligands one can modulate buffer conditions in terms of pH and ionic strength for protein fractionation. MEP HyperCel resin has an additional advantage; it can be used for antibody purification owing to the pKa of the ligand and the presence of a thioether group. All of Pall’s mixed-mode columns provide an alternative to
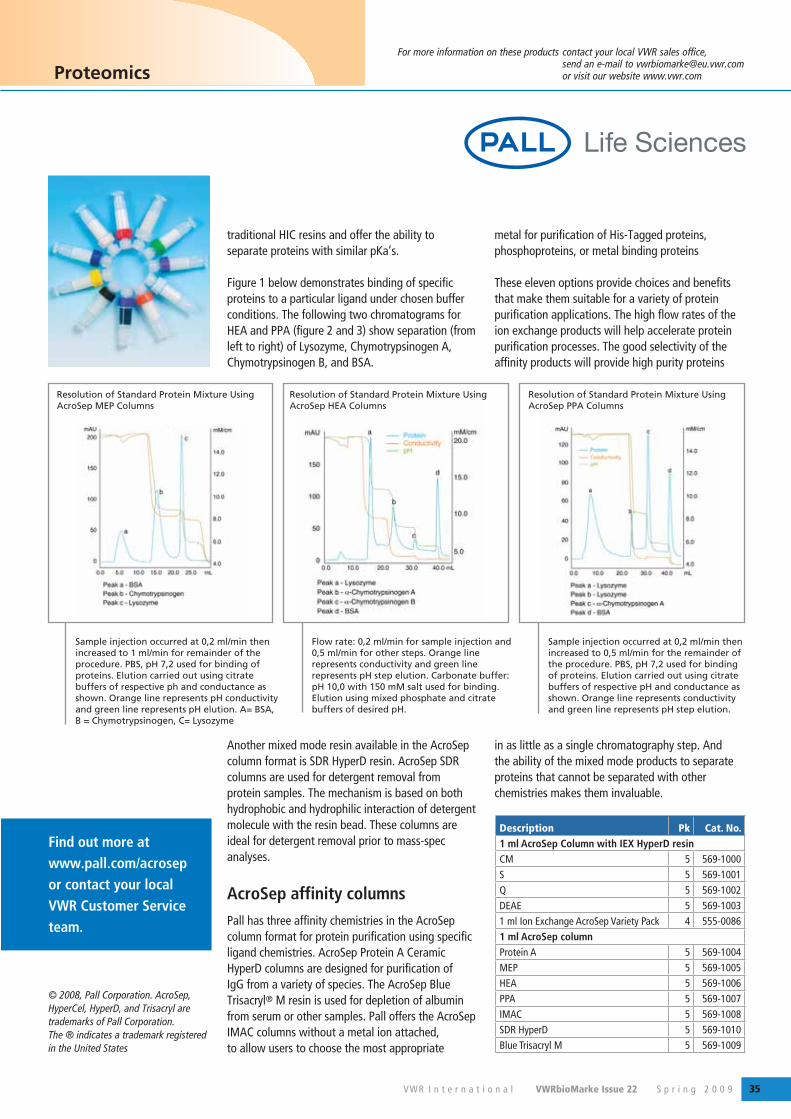
VWR I n t e r n a t i o n a l VWRbioMarke Issue 22 S p r i n g 2 0 0 9 35
For more information on these products contact your local VWR sales office, send an e-mail to [email protected] or visit our website www.vwr.com
traditional HIC resins and offer the ability to separate proteins with similar pKa’s.
Figure 1 below demonstrates binding of specific proteins to a particular ligand under chosen buffer conditions. The following two chromatograms for HEA and PPA (figure 2 and 3) show separation (from left to right) of Lysozyme, Chymotrypsinogen A, Chymotrypsinogen B, and BSA.
Another mixed mode resin available in the AcroSep column format is SDR HyperD resin. AcroSep SDR columns are used for detergent removal from protein samples. The mechanism is based on both hydrophobic and hydrophilic interaction of detergent molecule with the resin bead. These columns are ideal for detergent removal prior to mass-spec analyses.
AcroSep affinity columnsPall has three affinity chemistries in the AcroSep column format for protein purification using specific ligand chemistries. AcroSep Protein A Ceramic HyperD columns are designed for purification of IgG from a variety of species. The AcroSep Blue Trisacryl® M resin is used for depletion of albumin from serum or other samples. Pall offers the AcroSep IMAC columns without a metal ion attached, to allow users to choose the most appropriate
metal for purification of His-Tagged proteins, phosphoproteins, or metal binding proteins
These eleven options provide choices and benefits that make them suitable for a variety of protein purification applications. The high flow rates of the ion exchange products will help accelerate protein purification processes. The good selectivity of the affinity products will provide high purity proteins
in as little as a single chromatography step. And the ability of the mixed mode products to separate proteins that cannot be separated with other chemistries makes them invaluable.
Proteomics
Description Pk Cat. No.1 ml AcroSep Column with IEX HyperD resin CM 5 569-1000S 5 569-1001Q 5 569-1002DEAE 5 569-10031 ml Ion Exchange AcroSep Variety Pack 4 555-00861 ml AcroSep column Protein A 5 569-1004MEP 5 569-1005HEA 5 569-1006PPA 5 569-1007IMAC 5 569-1008SDR HyperD 5 569-1010Blue Trisacryl M 5 569-1009
© 2008, Pall Corporation. AcroSep, HyperCel, HyperD, and Trisacryl are trademarks of Pall Corporation. The ® indicates a trademark registered in the United States
Find out more at www.pall.com/acrosep or contact your local VWR Customer Service team.
Resolution of Standard Protein Mixture Using AcroSep MEP Columns
Resolution of Standard Protein Mixture Using AcroSep HEA Columns
Resolution of Standard Protein Mixture Using AcroSep PPA Columns
Sample injection occurred at 0,2 ml/min then increased to 1 ml/min for remainder of the procedure. PBS, pH 7,2 used for binding of proteins. Elution carried out using citrate buffers of respective ph and conductance as shown. Orange line represents pH conductivity and green line represents pH elution. A= BSA, B = Chymotrypsinogen, C= Lysozyme
Flow rate: 0,2 ml/min for sample injection and 0,5 ml/min for other steps. Orange line represents conductivity and green line represents pH step elution. Carbonate buffer: pH 10,0 with 150 mM salt used for binding. Elution using mixed phosphate and citrate buffers of desired pH.
Sample injection occurred at 0,2 ml/min then increased to 0,5 ml/min for the remainder of the procedure. PBS, pH 7,2 used for binding of proteins. Elution carried out using citrate buffers of respective pH and conductance as shown. Orange line represents conductivity and green line represents pH step elution.
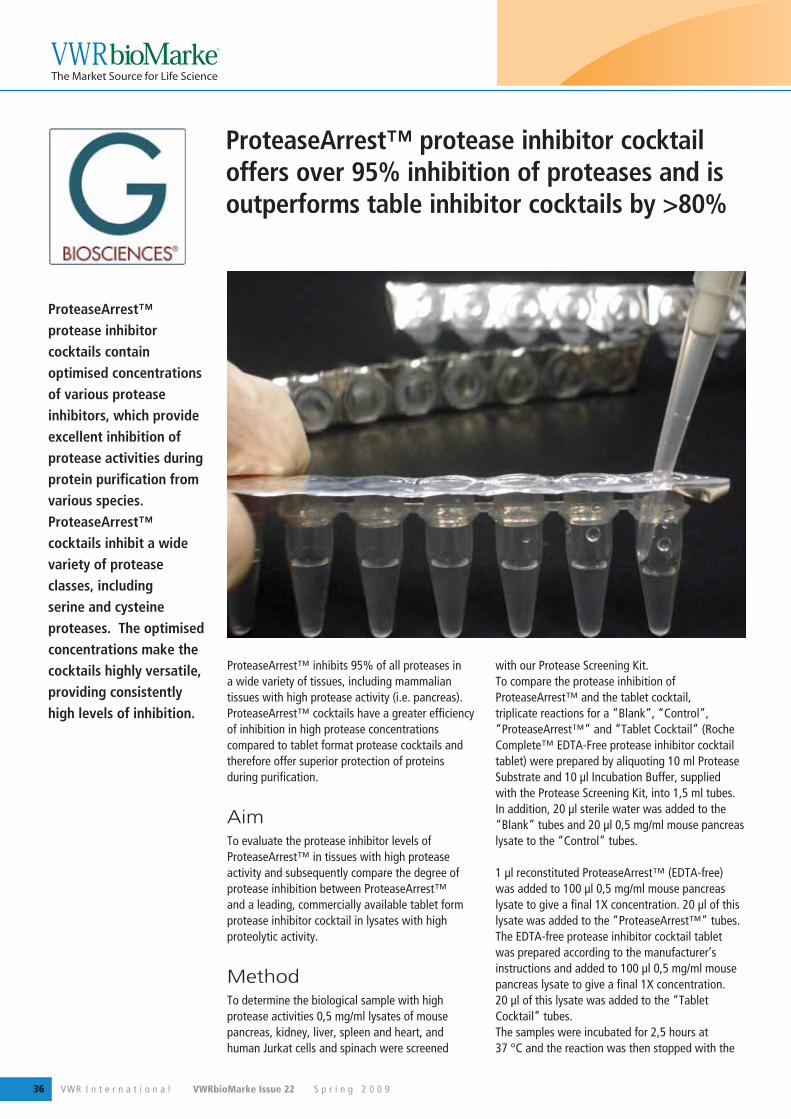
VWR I n t e r n a t i o n a l VWRbioMarke Issue 22 S p r i n g 2 0 0 936
ProteaseArrest™ protease inhibitor cocktail offers over 95% inhibition of proteases and is outperforms table inhibitor cocktails by >80%
ProteaseArrest™ protease inhibitor cocktails contain optimised concentrations of various protease inhibitors, which provide excellent inhibition of protease activities during protein purification from various species.ProteaseArrest™ cocktails inhibit a wide variety of protease classes, including serine and cysteine proteases. The optimised concentrations make the cocktails highly versatile, providing consistently high levels of inhibition.
ProteaseArrest™ inhibits 95% of all proteases in a wide variety of tissues, including mammalian tissues with high protease activity (i.e. pancreas).ProteaseArrest™ cocktails have a greater efficiency of inhibition in high protease concentrations compared to tablet format protease cocktails and therefore offer superior protection of proteins during purification.
AimTo evaluate the protease inhibitor levels of ProteaseArrest™ in tissues with high protease activity and subsequently compare the degree of protease inhibition between ProteaseArrest™ and a leading, commercially available tablet form protease inhibitor cocktail in lysates with high proteolytic activity.
MethodTo determine the biological sample with high protease activities 0,5 mg/ml lysates of mouse pancreas, kidney, liver, spleen and heart, and human Jurkat cells and spinach were screened
with our Protease Screening Kit. To compare the protease inhibition of ProteaseArrest™ and the tablet cocktail, triplicate reactions for a “Blank”, “Control”, “ProteaseArrest™” and “Tablet Cocktail” (Roche Complete™ EDTA-Free protease inhibitor cocktail tablet) were prepared by aliquoting 10 ml Protease Substrate and 10 μl Incubation Buffer, supplied with the Protease Screening Kit, into 1,5 ml tubes. In addition, 20 μl sterile water was added to the “Blank” tubes and 20 μl 0,5 mg/ml mouse pancreas lysate to the “Control” tubes.
1 μl reconstituted ProteaseArrest™ (EDTA-free) was added to 100 μl 0,5 mg/ml mouse pancreas lysate to give a final 1X concentration. 20 μl of this lysate was added to the “ProteaseArrest™” tubes. The EDTA-free protease inhibitor cocktail tablet was prepared according to the manufacturer’s instructions and added to 100 μl 0,5 mg/ml mouse pancreas lysate to give a final 1X concentration. 20 μl of this lysate was added to the “Tablet Cocktail” tubes.The samples were incubated for 2,5 hours at 37 °C and the reaction was then stopped with the
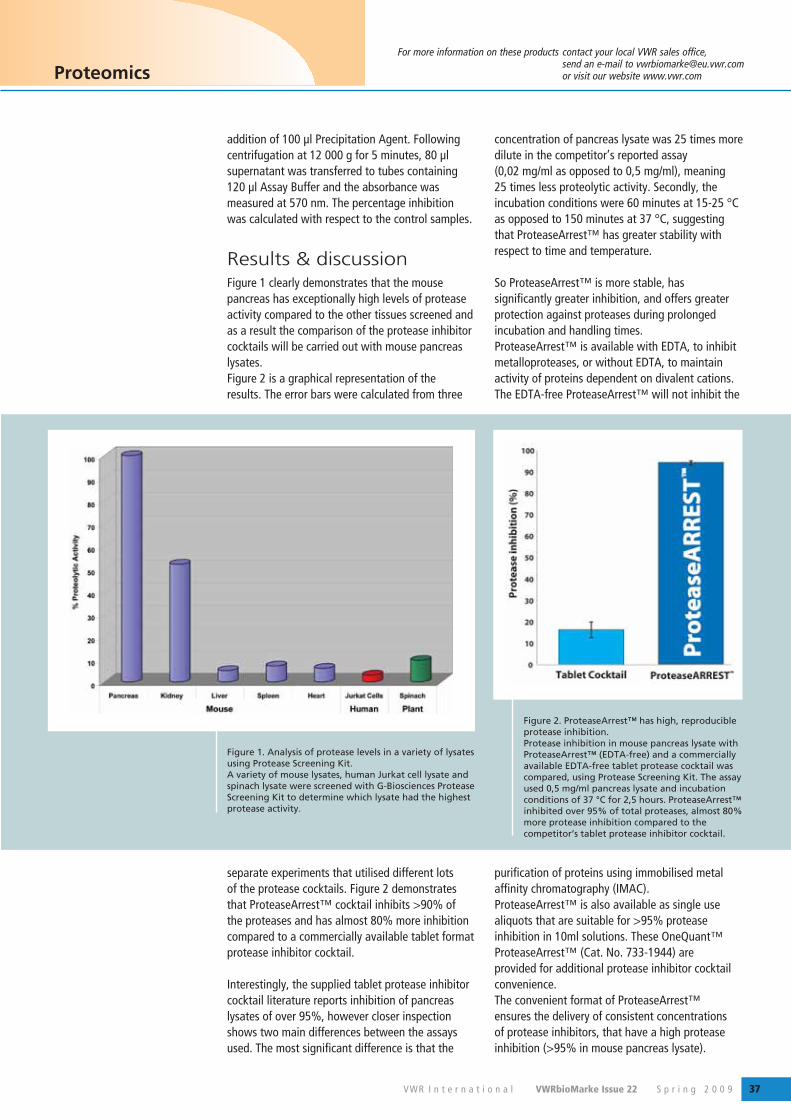
VWR I n t e r n a t i o n a l VWRbioMarke Issue 22 S p r i n g 2 0 0 9 37
For more information on these products contact your local VWR sales office, send an e-mail to [email protected] or visit our website www.vwr.com
addition of 100 μl Precipitation Agent. Following centrifugation at 12 000 g for 5 minutes, 80 μl supernatant was transferred to tubes containing 120 μl Assay Buffer and the absorbance was measured at 570 nm. The percentage inhibition was calculated with respect to the control samples.
Results & discussionFigure 1 clearly demonstrates that the mouse pancreas has exceptionally high levels of protease activity compared to the other tissues screened and as a result the comparison of the protease inhibitor cocktails will be carried out with mouse pancreas lysates.Figure 2 is a graphical representation of the results. The error bars were calculated from three
separate experiments that utilised different lots of the protease cocktails. Figure 2 demonstrates that ProteaseArrest™ cocktail inhibits >90% of the proteases and has almost 80% more inhibition compared to a commercially available tablet format protease inhibitor cocktail.
Interestingly, the supplied tablet protease inhibitor cocktail literature reports inhibition of pancreas lysates of over 95%, however closer inspection shows two main differences between the assays used. The most significant difference is that the
concentration of pancreas lysate was 25 times more dilute in the competitor’s reported assay (0,02 mg/ml as opposed to 0,5 mg/ml), meaning 25 times less proteolytic activity. Secondly, the incubation conditions were 60 minutes at 15-25 °C as opposed to 150 minutes at 37 °C, suggesting that ProteaseArrest™ has greater stability with respect to time and temperature.
So ProteaseArrest™ is more stable, has significantly greater inhibition, and offers greater protection against proteases during prolonged incubation and handling times.ProteaseArrest™ is available with EDTA, to inhibit metalloproteases, or without EDTA, to maintain activity of proteins dependent on divalent cations. The EDTA-free ProteaseArrest™ will not inhibit the
purification of proteins using immobilised metal affinity chromatography (IMAC).ProteaseArrest™ is also available as single use aliquots that are suitable for >95% protease inhibition in 10ml solutions. These OneQuant™ ProteaseArrest™ (Cat. No. 733-1944) are provided for additional protease inhibitor cocktail convenience. The convenient format of ProteaseArrest™ ensures the delivery of consistent concentrations of protease inhibitors, that have a high protease inhibition (>95% in mouse pancreas lysate).
Proteomics
Figure 1. Analysis of protease levels in a variety of lysates using Protease Screening Kit. A variety of mouse lysates, human Jurkat cell lysate and spinach lysate were screened with G-Biosciences Protease Screening Kit to determine which lysate had the highest protease activity.
Figure 2. ProteaseArrest™ has high, reproducible protease inhibition. Protease inhibition in mouse pancreas lysate with ProteaseArrest™ (EDTA-free) and a commercially available EDTA-free tablet protease cocktail was compared, using Protease Screening Kit. The assay used 0,5 mg/ml pancreas lysate and incubation conditions of 37 °C for 2,5 hours. ProteaseArrest™ inhibited over 95% of total proteases, almost 80% more protease inhibition compared to the competitor’s tablet protease inhibitor cocktail.
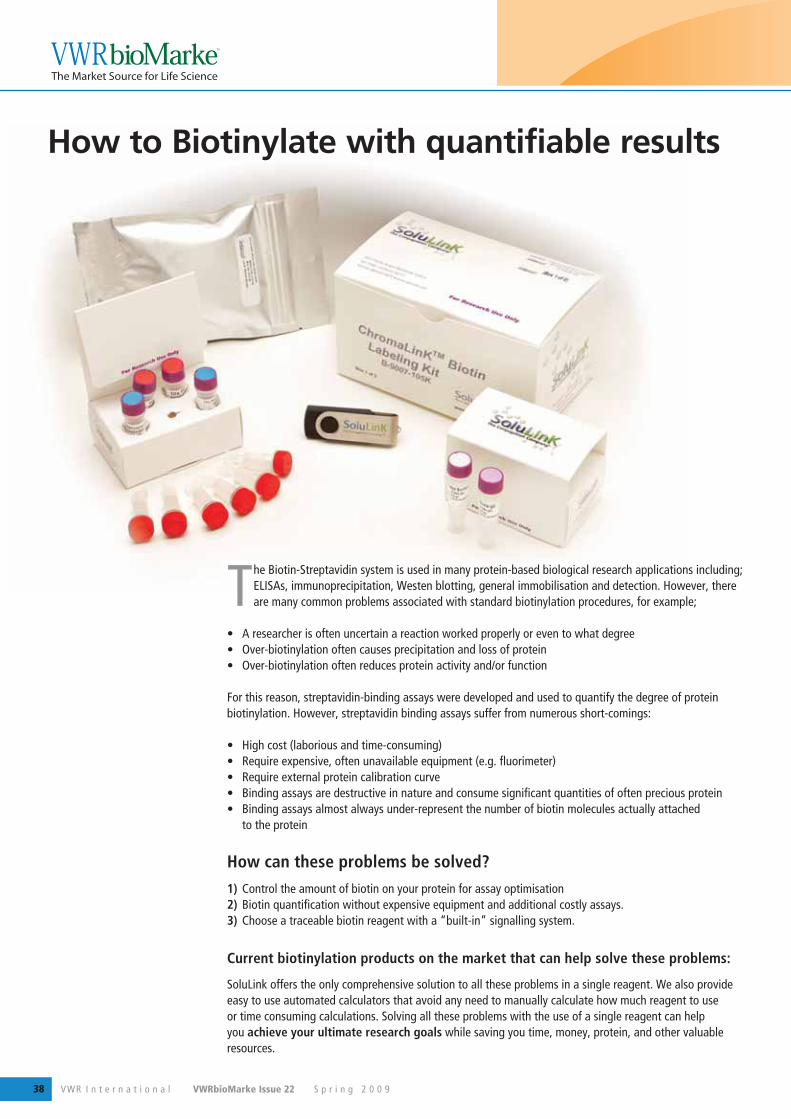
VWR I n t e r n a t i o n a l VWRbioMarke Issue 22 S p r i n g 2 0 0 938
The Biotin-Streptavidin system is used in many protein-based biological research applications including; ELISAs, immunoprecipitation, Westen blotting, general immobilisation and detection. However, there are many common problems associated with standard biotinylation procedures, for example;
• A researcher is often uncertain a reaction worked properly or even to what degree• Over-biotinylation often causes precipitation and loss of protein • Over-biotinylation often reduces protein activity and/or function
For this reason, streptavidin-binding assays were developed and used to quantify the degree of protein biotinylation. However, streptavidin binding assays suffer from numerous short-comings:
• High cost (laborious and time-consuming)• Require expensive, often unavailable equipment (e.g. fluorimeter)• Require external protein calibration curve• Binding assays are destructive in nature and consume significant quantities of often precious protein• Binding assays almost always under-represent the number of biotin molecules actually attached
to the protein
How can these problems be solved? 1) Control the amount of biotin on your protein for assay optimisation 2) Biotin quantification without expensive equipment and additional costly assays.3) Choose a traceable biotin reagent with a “built-in” signalling system.
Current biotinylation products on the market that can help solve these problems:
SoluLink offers the only comprehensive solution to all these problems in a single reagent. We also provide easy to use automated calculators that avoid any need to manually calculate how much reagent to use or time consuming calculations. Solving all these problems with the use of a single reagent can help you achieve your ultimate research goals while saving you time, money, protein, and other valuable resources.
How to Biotinylate with quantifiable results
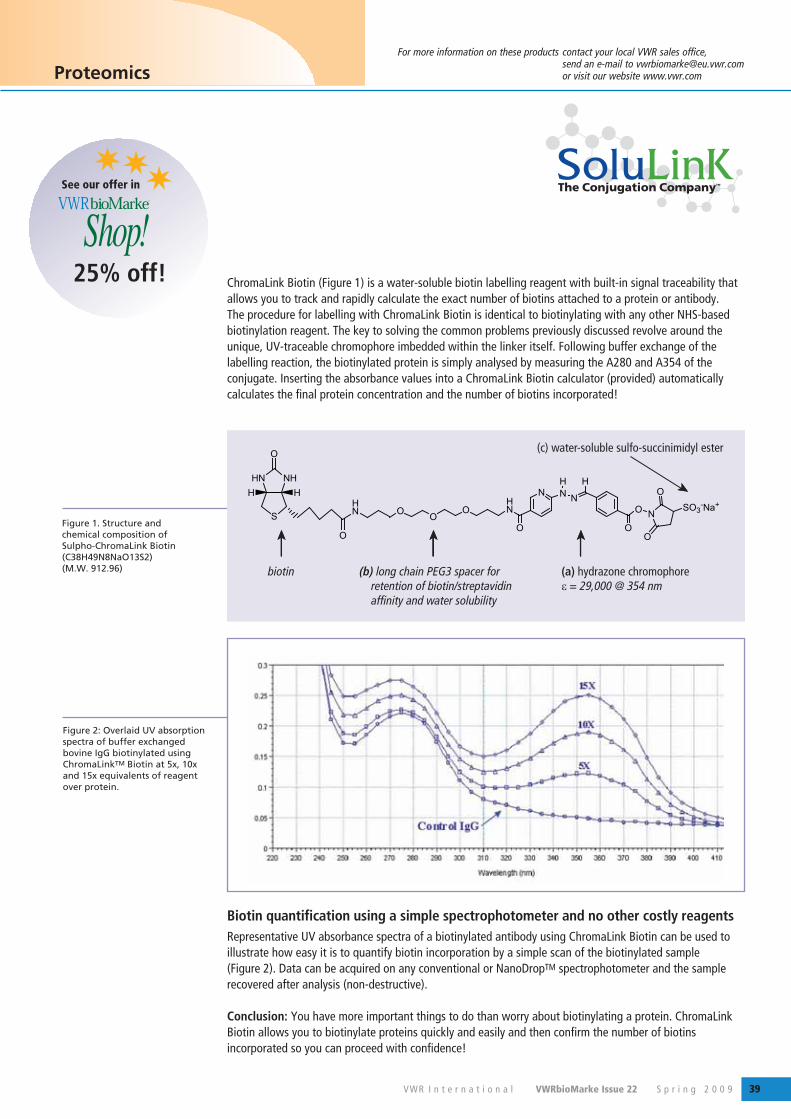
VWR I n t e r n a t i o n a l VWRbioMarke Issue 22 S p r i n g 2 0 0 9 39
For more information on these products contact your local VWR sales office, send an e-mail to [email protected] or visit our website www.vwr.com Proteomics
ChromaLink Biotin (Figure 1) is a water-soluble biotin labelling reagent with built-in signal traceability that allows you to track and rapidly calculate the exact number of biotins attached to a protein or antibody. The procedure for labelling with ChromaLink Biotin is identical to biotinylating with any other NHS-based biotinylation reagent. The key to solving the common problems previously discussed revolve around the unique, UV-traceable chromophore imbedded within the linker itself. Following buffer exchange of the labelling reaction, the biotinylated protein is simply analysed by measuring the A280 and A354 of the conjugate. Inserting the absorbance values into a ChromaLink Biotin calculator (provided) automatically calculates the final protein concentration and the number of biotins incorporated!
Biotin quantification using a simple spectrophotometer and no other costly reagents Representative UV absorbance spectra of a biotinylated antibody using ChromaLink Biotin can be used to illustrate how easy it is to quantify biotin incorporation by a simple scan of the biotinylated sample (Figure 2). Data can be acquired on any conventional or NanoDropTM spectrophotometer and the sample recovered after analysis (non-destructive).
Conclusion: You have more important things to do than worry about biotinylating a protein. ChromaLink Biotin allows you to biotinylate proteins quickly and easily and then confirm the number of biotins incorporated so you can proceed with confidence!
Figure 1. Structure and chemical composition of Sulpho-ChromaLink Biotin (C38H49N8NaO13S2) (M.W. 912.96)
Figure 2: Overlaid UV absorption spectra of buffer exchanged bovine IgG biotinylated using ChromaLinkTM Biotin at 5x, 10x and 15x equivalents of reagent over protein.
25% off!
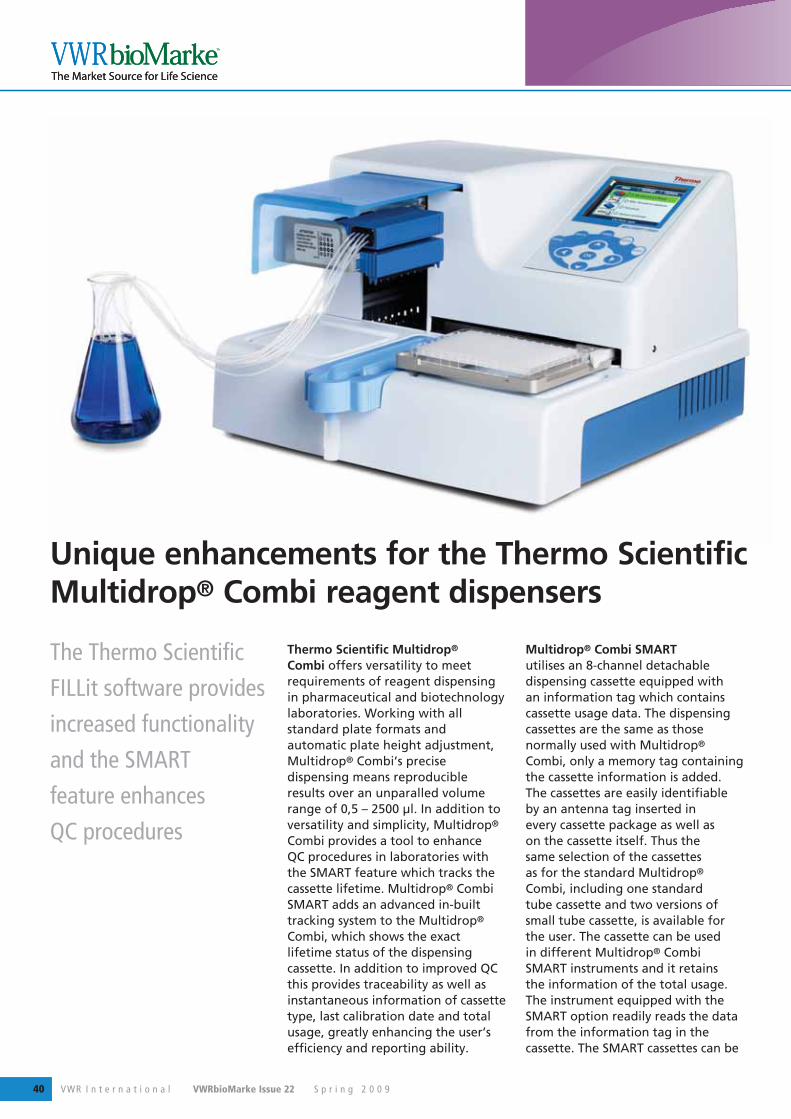
VWR I n t e r n a t i o n a l VWRbioMarke Issue 22 S p r i n g 2 0 0 940
Unique enhancements for the Thermo Scientific Multidrop® Combi reagent dispensers
Thermo Scientific Multidrop® Combi offers versatility to meet requirements of reagent dispensing in pharmaceutical and biotechnology laboratories. Working with all standard plate formats and automatic plate height adjustment, Multidrop® Combi’s precise dispensing means reproducible results over an unparalled volume range of 0,5 – 2500 μl. In addition to versatility and simplicity, Multidrop® Combi provides a tool to enhance QC procedures in laboratories with the SMART feature which tracks the cassette lifetime. Multidrop® Combi SMART adds an advanced in-built tracking system to the Multidrop® Combi, which shows the exact lifetime status of the dispensing cassette. In addition to improved QC this provides traceability as well as instantaneous information of cassette type, last calibration date and total usage, greatly enhancing the user’s efficiency and reporting ability.
Multidrop® Combi SMART utilises an 8-channel detachable dispensing cassette equipped with an information tag which contains cassette usage data. The dispensing cassettes are the same as those normally used with Multidrop® Combi, only a memory tag containing the cassette information is added. The cassettes are easily identifiable by an antenna tag inserted in every cassette package as well as on the cassette itself. Thus the same selection of the cassettes as for the standard Multidrop® Combi, including one standard tube cassette and two versions of small tube cassette, is available for the user. The cassette can be used in different Multidrop® Combi SMART instruments and it retains the information of the total usage. The instrument equipped with the SMART option readily reads the data from the information tag in the cassette. The SMART cassettes can be
The Thermo Scientific
FILLit software provides
increased functionality
and the SMART
feature enhances
QC procedures
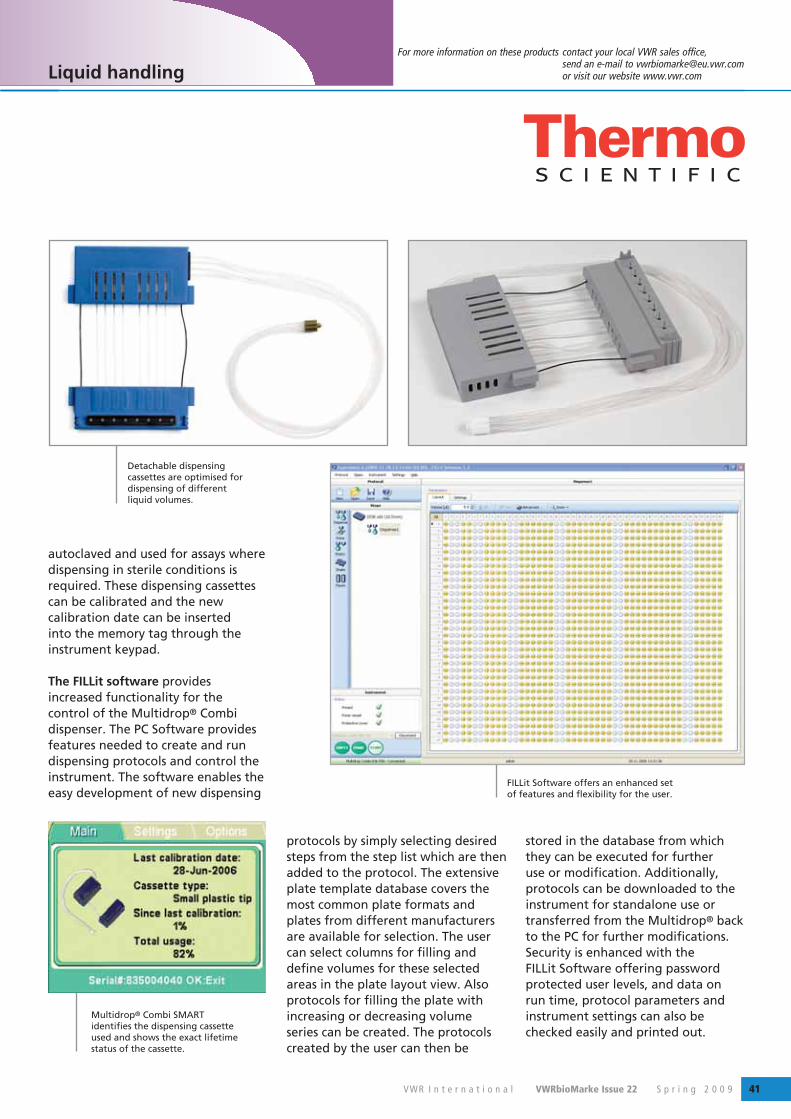
VWR I n t e r n a t i o n a l VWRbioMarke Issue 22 S p r i n g 2 0 0 9 41
For more information on these products contact your local VWR sales office, send an e-mail to [email protected] or visit our website www.vwr.com
autoclaved and used for assays where dispensing in sterile conditions is required. These dispensing cassettes can be calibrated and the new calibration date can be inserted into the memory tag through the instrument keypad.
The FILLit software provides increased functionality for the control of the Multidrop® Combi dispenser. The PC Software provides features needed to create and run dispensing protocols and control the instrument. The software enables the easy development of new dispensing
Liquid handling
protocols by simply selecting desired steps from the step list which are then added to the protocol. The extensive plate template database covers the most common plate formats and plates from different manufacturers are available for selection. The user can select columns for filling and define volumes for these selected areas in the plate layout view. Also protocols for filling the plate with increasing or decreasing volume series can be created. The protocols created by the user can then be
stored in the database from which they can be executed for further use or modification. Additionally, protocols can be downloaded to the instrument for standalone use or transferred from the Multidrop® back to the PC for further modifications. Security is enhanced with the FILLit Software offering password protected user levels, and data on run time, protocol parameters and instrument settings can also be checked easily and printed out.
FILLit Software offers an enhanced set of features and flexibility for the user.
Detachable dispensing cassettes are optimised for dispensing of different liquid volumes.
Multidrop® Combi SMART identifies the dispensing cassette used and shows the exact lifetime status of the cassette.
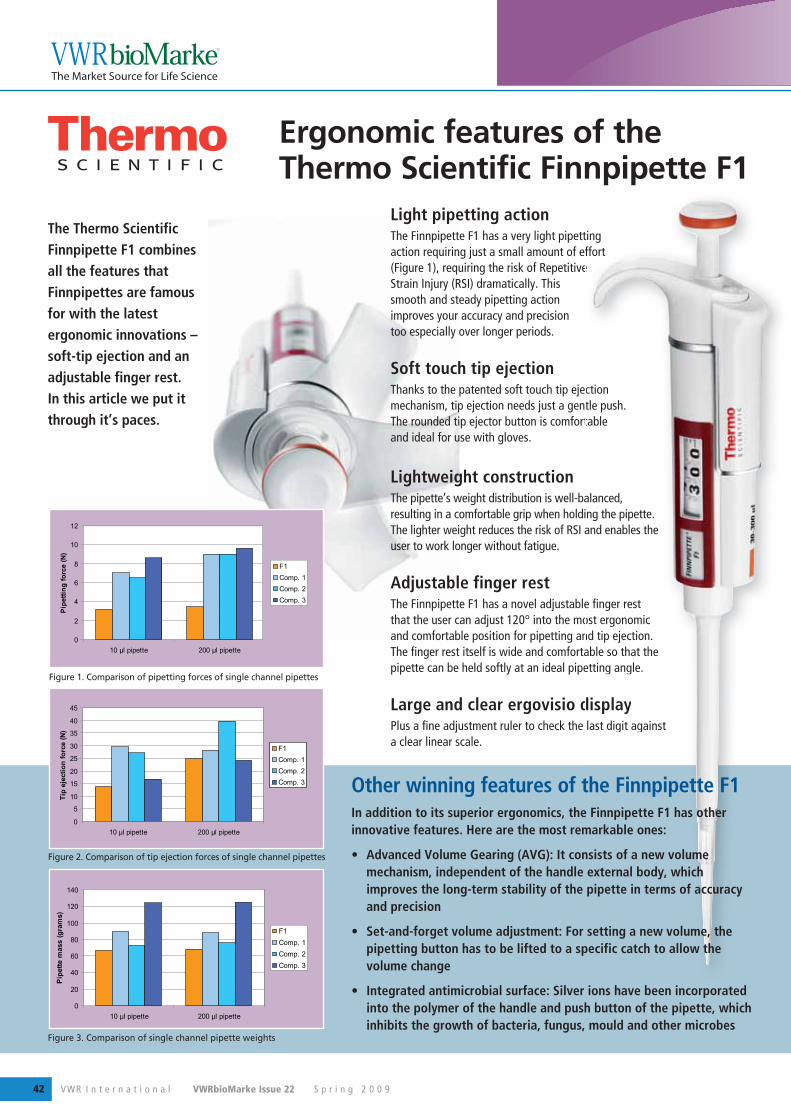
VWR I n t e r n a t i o n a l VWRbioMarke Issue 22 S p r i n g 2 0 0 942
The Thermo Scientific Finnpipette F1 combines all the features that Finnpipettes are famous for with the latest ergonomic innovations – soft-tip ejection and an adjustable finger rest. In this article we put it through it’s paces.
Figure 2. Comparison of tip ejection forces of single channel pipettes
Figure 1. Comparison of pipetting forces of single channel pipettes
Figure 3. Comparison of single channel pipette weights
Light pipetting actionThe Finnpipette F1 has a very light pipetting action requiring just a small amount of effort (Figure 1), requiring the risk of Repetitive Strain Injury (RSI) dramatically. This smooth and steady pipetting action improves your accuracy and precision too especially over longer periods.
Soft touch tip ejectionThanks to the patented soft touch tip ejection mechanism, tip ejection needs just a gentle push. The rounded tip ejector button is comfortable and ideal for use with gloves.
Lightweight constructionThe pipette’s weight distribution is well-balanced, resulting in a comfortable grip when holding the pipette. The lighter weight reduces the risk of RSI and enables the user to work longer without fatigue.
Adjustable finger restThe Finnpipette F1 has a novel adjustable finger rest that the user can adjust 120° into the most ergonomic and comfortable position for pipetting and tip ejection. The finger rest itself is wide and comfortable so that the pipette can be held softly at an ideal pipetting angle.
Large and clear ergovisio displayPlus a fine adjustment ruler to check the last digit against a clear linear scale.
ting ffort
e
ction tle push. table
alanced,ng the pipette. and enables the
e finger rest ost ergonomicnd tip ejection.able so that the etting angle.
displaylast digit against
Ergonomic features of the Thermo Scientific Finnpipette F1
Other winning features of the Finnpipette F1In addition to its superior ergonomics, the Finnpipette F1 has other innovative features. Here are the most remarkable ones:
• Advanced Volume Gearing (AVG): It consists of a new volume mechanism, independent of the handle external body, which improves the long-term stability of the pipette in terms of accuracy and precision
• Set-and-forget volume adjustment: For setting a new volume, the pipetting button has to be lifted to a specific catch to allow the volume change
• Integrated antimicrobial surface: Silver ions have been incorporated into the polymer of the handle and push button of the pipette, which inhibits the growth of bacteria, fungus, mould and other microbes
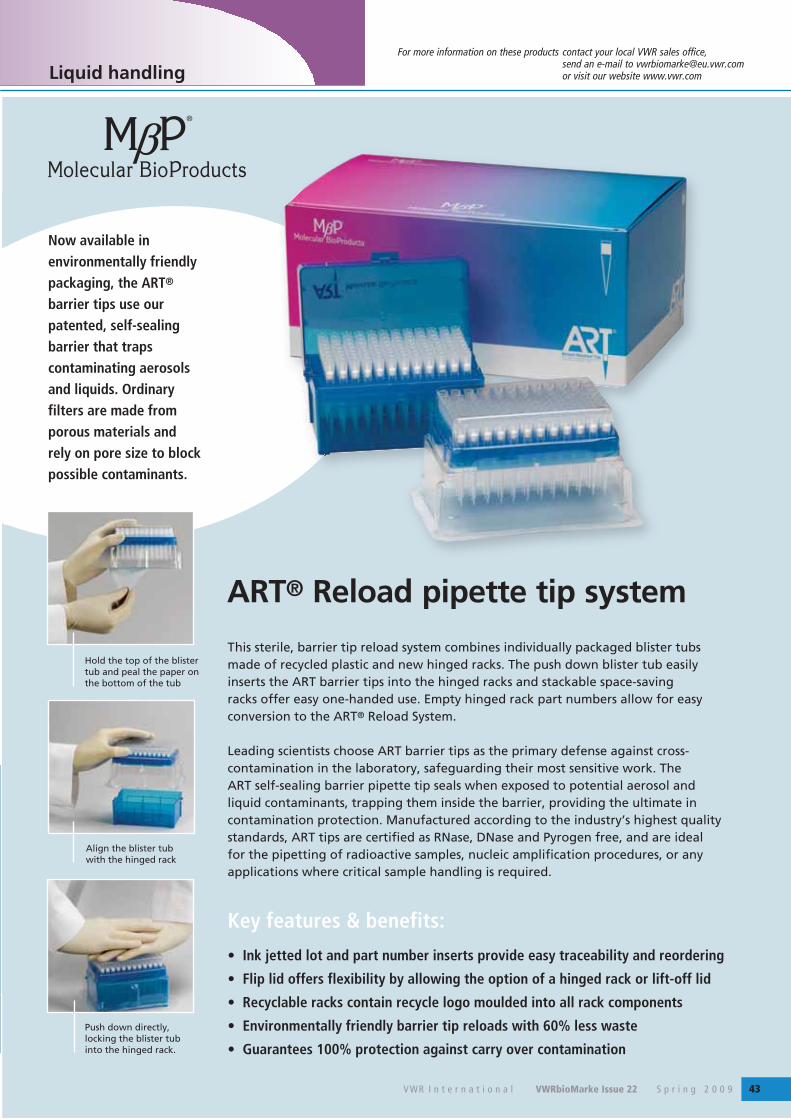
VWR I n t e r n a t i o n a l VWRbioMarke Issue 22 S p r i n g 2 0 0 9 43
For more information on these products contact your local VWR sales office, send an e-mail to [email protected] or visit our website www.vwr.comLiquid handling
Now available in environmentally friendly packaging, the ART® barrier tips use our patented, self-sealing barrier that traps contaminating aerosols and liquids. Ordinary filters are made from porous materials and rely on pore size to block possible contaminants.
Hold the top of the blister tub and peal the paper on the bottom of the tub
Align the blister tub with the hinged rack
Push down directly, locking the blister tub into the hinged rack.
ART® Reload pipette tip system
This sterile, barrier tip reload system combines individually packaged blister tubs made of recycled plastic and new hinged racks. The push down blister tub easily inserts the ART barrier tips into the hinged racks and stackable space-saving racks offer easy one-handed use. Empty hinged rack part numbers allow for easy conversion to the ART® Reload System.
Leading scientists choose ART barrier tips as the primary defense against cross-contamination in the laboratory, safeguarding their most sensitive work. The ART self-sealing barrier pipette tip seals when exposed to potential aerosol and liquid contaminants, trapping them inside the barrier, providing the ultimate in contamination protection. Manufactured according to the industry’s highest quality standards, ART tips are certified as RNase, DNase and Pyrogen free, and are ideal for the pipetting of radioactive samples, nucleic amplification procedures, or any applications where critical sample handling is required.
Key features & benefits:
• Ink jetted lot and part number inserts provide easy traceability and reordering
• Flip lid offers flexibility by allowing the option of a hinged rack or lift-off lid
• Recyclable racks contain recycle logo moulded into all rack components
• Environmentally friendly barrier tip reloads with 60% less waste
• Guarantees 100% protection against carry over contamination
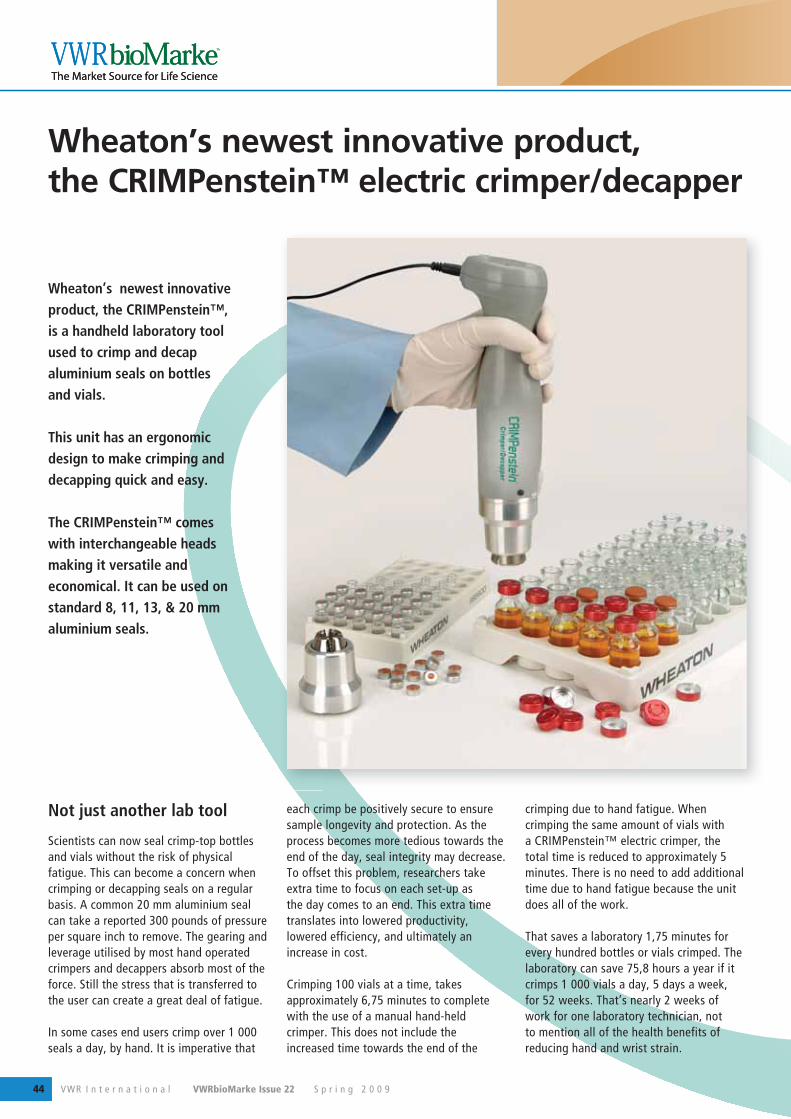
VWR I n t e r n a t i o n a l VWRbioMarke Issue 22 S p r i n g 2 0 0 944
Wheaton’s newest innovative product, the CRIMPenstein™, is a handheld laboratory tool used to crimp and decap aluminium seals on bottles and vials. This unit has an ergonomic design to make crimping and decapping quick and easy. The CRIMPenstein™ comes with interchangeable heads making it versatile and economical. It can be used on standard 8, 11, 13, & 20 mm aluminium seals.
Wheaton’s newest innovative product, the CRIMPenstein™ electric crimper/decapper
Not just another lab tool
Scientists can now seal crimp-top bottles and vials without the risk of physical fatigue. This can become a concern when crimping or decapping seals on a regular basis. A common 20 mm aluminium seal can take a reported 300 pounds of pressure per square inch to remove. The gearing and leverage utilised by most hand operated crimpers and decappers absorb most of the force. Still the stress that is transferred to the user can create a great deal of fatigue.
In some cases end users crimp over 1 000 seals a day, by hand. It is imperative that
each crimp be positively secure to ensure sample longevity and protection. As the process becomes more tedious towards the end of the day, seal integrity may decrease. To offset this problem, researchers take extra time to focus on each set-up as the day comes to an end. This extra time translates into lowered productivity, lowered efficiency, and ultimately an increase in cost.
Crimping 100 vials at a time, takes approximately 6,75 minutes to complete with the use of a manual hand-held crimper. This does not include the increased time towards the end of the
crimping due to hand fatigue. When crimping the same amount of vials with a CRIMPenstein™ electric crimper, the total time is reduced to approximately 5 minutes. There is no need to add additional time due to hand fatigue because the unit does all of the work.
That saves a laboratory 1,75 minutes for every hundred bottles or vials crimped. The laboratory can save 75,8 hours a year if it crimps 1 000 vials a day, 5 days a week, for 52 weeks. That’s nearly 2 weeks of work for one laboratory technician, not to mention all of the health benefits of reducing hand and wrist strain.
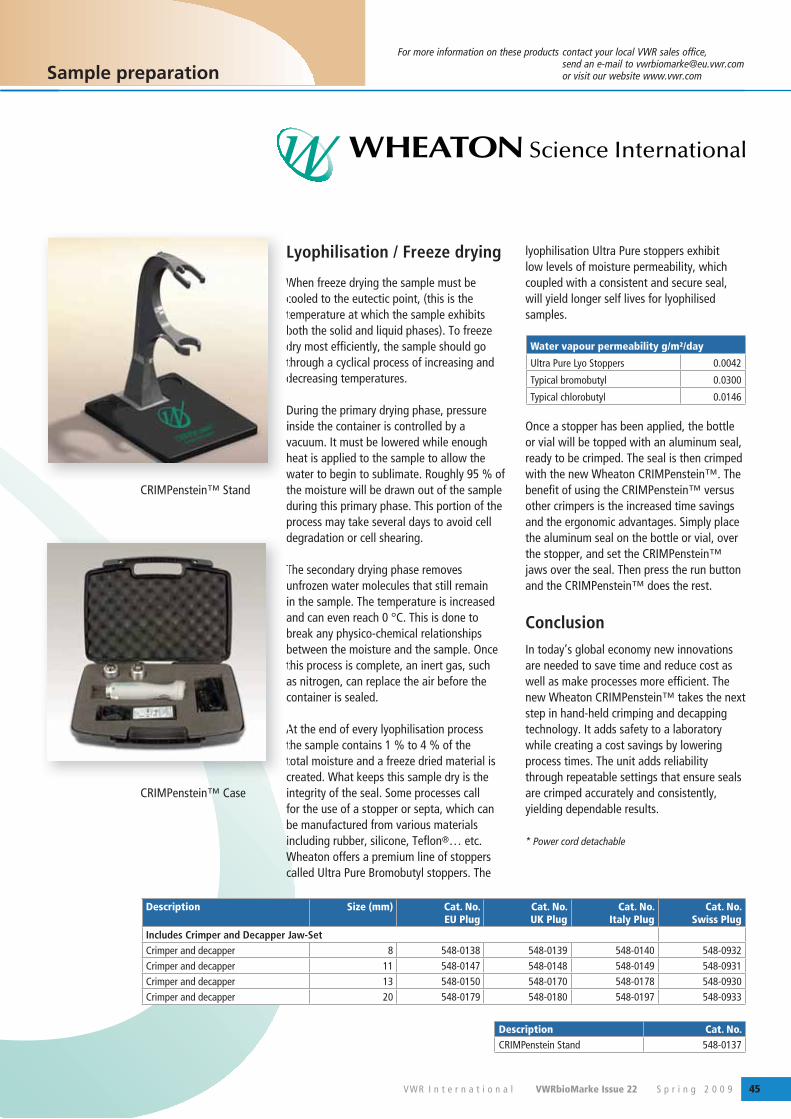
VWR I n t e r n a t i o n a l VWRbioMarke Issue 22 S p r i n g 2 0 0 9 45
For more information on these products contact your local VWR sales office, send an e-mail to [email protected] or visit our website www.vwr.com
Lyophilisation / Freeze drying
When freeze drying the sample must be cooled to the eutectic point, (this is the temperature at which the sample exhibits both the solid and liquid phases). To freeze dry most efficiently, the sample should go through a cyclical process of increasing and decreasing temperatures.
During the primary drying phase, pressure inside the container is controlled by a vacuum. It must be lowered while enough heat is applied to the sample to allow the water to begin to sublimate. Roughly 95 % of the moisture will be drawn out of the sample during this primary phase. This portion of the process may take several days to avoid cell degradation or cell shearing.
The secondary drying phase removes unfrozen water molecules that still remain in the sample. The temperature is increased and can even reach 0 °C. This is done to break any physico-chemical relationships between the moisture and the sample. Once this process is complete, an inert gas, such as nitrogen, can replace the air before the container is sealed.
At the end of every lyophilisation process the sample contains 1 % to 4 % of the total moisture and a freeze dried material is created. What keeps this sample dry is the integrity of the seal. Some processes call for the use of a stopper or septa, which can be manufactured from various materials including rubber, silicone, Teflon®… etc. Wheaton offers a premium line of stoppers called Ultra Pure Bromobutyl stoppers. The
lyophilisation Ultra Pure stoppers exhibit low levels of moisture permeability, which coupled with a consistent and secure seal, will yield longer self lives for lyophilised samples.
Once a stopper has been applied, the bottle or vial will be topped with an aluminum seal, ready to be crimped. The seal is then crimped with the new Wheaton CRIMPenstein™. The benefit of using the CRIMPenstein™ versus other crimpers is the increased time savings and the ergonomic advantages. Simply place the aluminum seal on the bottle or vial, over the stopper, and set the CRIMPenstein™ jaws over the seal. Then press the run button and the CRIMPenstein™ does the rest.
Conclusion In today’s global economy new innovations are needed to save time and reduce cost as well as make processes more efficient. The new Wheaton CRIMPenstein™ takes the next step in hand-held crimping and decapping technology. It adds safety to a laboratory while creating a cost savings by lowering process times. The unit adds reliability through repeatable settings that ensure seals are crimped accurately and consistently, yielding dependable results.
* Power cord detachable
Sample preparation
Water vapour permeability g/m²/day
Ultra Pure Lyo Stoppers 0.0042
Typical bromobutyl 0.0300
Typical chlorobutyl 0.0146
Description Size (mm) Cat. No. EU Plug
Cat. No. UK Plug
Cat. No. Italy Plug
Cat. No. Swiss Plug
Includes Crimper and Decapper Jaw-SetCrimper and decapper 8 548-0138 548-0139 548-0140 548-0932Crimper and decapper 11 548-0147 548-0148 548-0149 548-0931Crimper and decapper 13 548-0150 548-0170 548-0178 548-0930Crimper and decapper 20 548-0179 548-0180 548-0197 548-0933
Description Cat. No.CRIMPenstein Stand 548-0137
L
Wctbdtd
Divhw
CRIMPenstein™ Stand
d
Tuiabbtac
Attc
CRIMPenstein™ Case
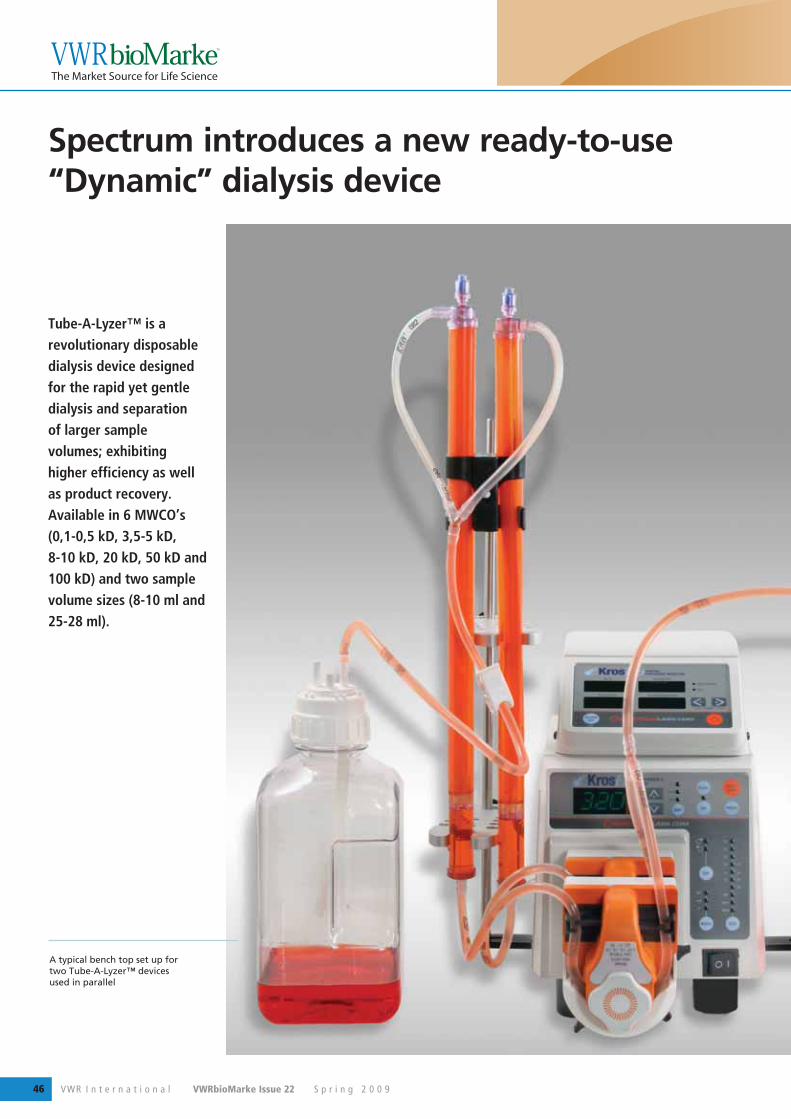
VWR I n t e r n a t i o n a l VWRbioMarke Issue 22 S p r i n g 2 0 0 946
Tube-A-Lyzer™ is a revolutionary disposable dialysis device designed for the rapid yet gentle dialysis and separation of larger sample volumes; exhibiting higher efficiency as well as product recovery. Available in 6 MWCO’s (0,1-0,5 kD, 3,5-5 kD, 8-10 kD, 20 kD, 50 kD and 100 kD) and two sample volume sizes (8-10 ml and 25-28 ml).
Spectrum introduces a new ready-to-use “Dynamic” dialysis device
A typical bench top set up for two Tube-A-Lyzer™ devices used in parallel
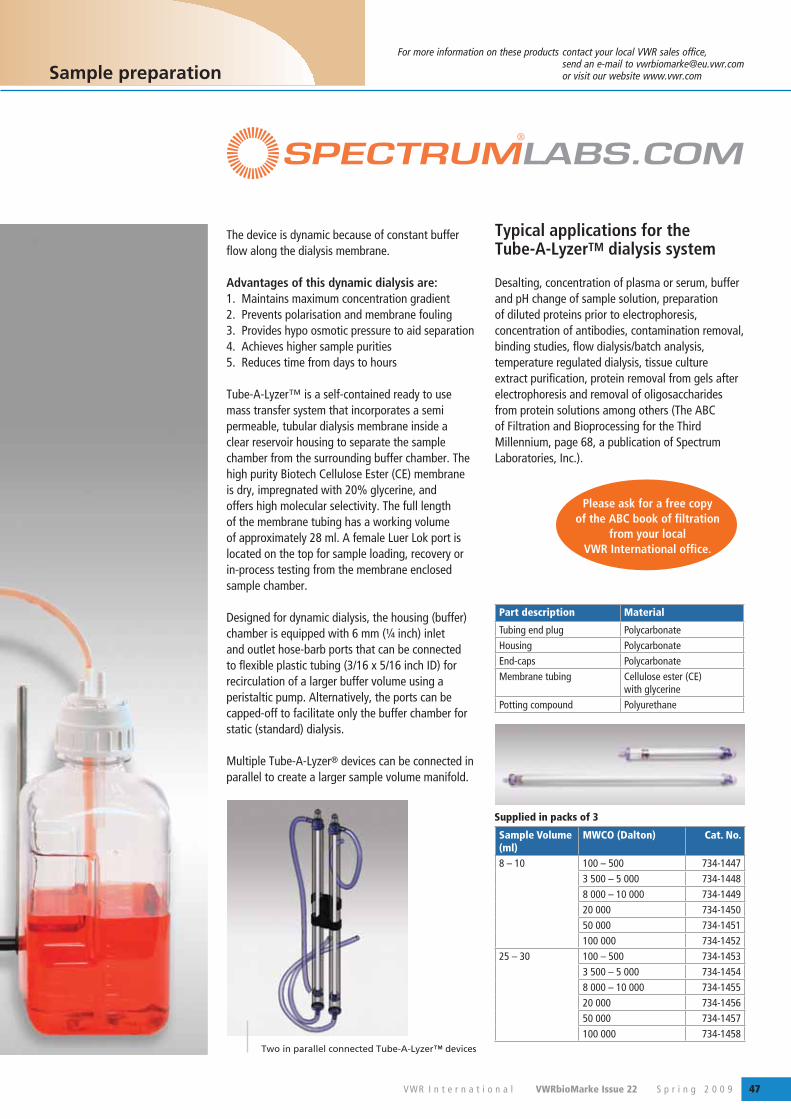
VWR I n t e r n a t i o n a l VWRbioMarke Issue 22 S p r i n g 2 0 0 9 47
For more information on these products contact your local VWR sales office, send an e-mail to [email protected] or visit our website www.vwr.com
The device is dynamic because of constant buffer flow along the dialysis membrane.
Advantages of this dynamic dialysis are:1. Maintains maximum concentration gradient2. Prevents polarisation and membrane fouling3. Provides hypo osmotic pressure to aid separation4. Achieves higher sample purities5. Reduces time from days to hours
Tube-A-Lyzer™ is a self-contained ready to use mass transfer system that incorporates a semi permeable, tubular dialysis membrane inside a clear reservoir housing to separate the sample chamber from the surrounding buffer chamber. The high purity Biotech Cellulose Ester (CE) membrane is dry, impregnated with 20% glycerine, and offers high molecular selectivity. The full length of the membrane tubing has a working volume of approximately 28 ml. A female Luer Lok port is located on the top for sample loading, recovery or in-process testing from the membrane enclosed sample chamber.
Designed for dynamic dialysis, the housing (buffer) chamber is equipped with 6 mm (¼ inch) inlet and outlet hose-barb ports that can be connected to flexible plastic tubing (3/16 x 5/16 inch ID) for recirculation of a larger buffer volume using a peristaltic pump. Alternatively, the ports can be capped-off to facilitate only the buffer chamber for static (standard) dialysis.
Multiple Tube-A-Lyzer® devices can be connected in parallel to create a larger sample volume manifold.
Typical applications for the Tube-A-LyzerTM dialysis system
Desalting, concentration of plasma or serum, buffer and pH change of sample solution, preparation of diluted proteins prior to electrophoresis, concentration of antibodies, contamination removal, binding studies, flow dialysis/batch analysis, temperature regulated dialysis, tissue culture extract purification, protein removal from gels after electrophoresis and removal of oligosaccharides from protein solutions among others (The ABC of Filtration and Bioprocessing for the Third Millennium, page 68, a publication of Spectrum Laboratories, Inc.).
Sample preparation
Sample Volume(ml)
MWCO (Dalton) Cat. No.
8 – 10 100 – 500 734-14473 500 – 5 000 734-14488 000 – 10 000 734-144920 000 734-145050 000 734-1451100 000 734-1452
25 – 30 100 – 500 734-14533 500 – 5 000 734-14548 000 – 10 000 734-145520 000 734-145650 000 734-1457100 000 734-1458
Two in parallel connected Tube-A-Lyzer™ devices
Part description Material
Tubing end plug PolycarbonateHousing PolycarbonateEnd-caps PolycarbonateMembrane tubing Cellulose ester (CE)
with glycerinePotting compound Polyurethane
Please ask for a free copy of the ABC book of filtration
from your local VWR International office.
Supplied in packs of 3
Your European Distribution Partner
AustriaVWR International GmbHGraumanngasse 71150 WienTel.: 01 97 002 0Fax: 01 97 002 600E-mail: [email protected]
BelgiumVWR International bvbaResearchpark Haasrode 2020Geldenaaksebaan 4643001 LeuvenTel.: 016 385 011Fax: 016 385 385E-mail:[email protected]
DenmarkVWR - Bie & BerntsenTransformervej 82730 HerlevTel.: 43 86 87 88Fax: 43 86 87 90E-mail: [email protected]
FinlandVWR International OyPihatörmä 1 C 1FI - 02240 EspooTel.: 09 80 45 51Fax: 09 80 45 52 00E-mail: [email protected]
FranceVWR International S.A.S.Le Périgares – Bâtiment B201, rue Carnot94126 Fontenay-sous-Bois cedexTel.: 0 825 02 30 30 (0,15 EUR TTC/min)
Fax: 0 825 02 30 35 (0,15 EUR TTC/min)
E-mail: [email protected]
GermanyVWR International GmbHHilpertstrasse 20aD - 64295 DarmstadtTel.: 0180 570 20 00*Fax: 0180 570 22 22*E-mail: [email protected]*14 Cent/Minute aus d. dt. Festnetzggf. abweichende Mobilfunktarife
HungarySpektrum-3D Ltd.A VWR International CompanySimon László u. 4.4034 DebrecenTel.: (52) 521-131Fax: (52) 470-069E-mail: [email protected]
IrelandVWR International LtdOrion Business CampusNorthwest Business ParkBallycoolinDublin 15Tel.: 01 88 22 222Fax: 01 88 22 333E-mail [email protected]
Northern IrelandVWR International LtdA10 Harbour Court, 7 Heron RdSydenham Business ParkBelfast BT3 9HBTel.: 028 9058 5800Fax: 028 9080 7812Email: [email protected]
ItalyVWR International s.r.l.Via Stephenson 9420157 Milano (MI)Tel.: 02 332 03 11Fax: 800 152 999E-mail: [email protected]
The NetherlandsVWR International B.V.Postbus 81981005 AD AmsterdamTel.: 020 4808 400Fax: 020 4808 480E-mail: [email protected]
NorwayVWR International ASHaavard Martinsensvei 300978 OsloTel.: 02290Fax: 815 00 940 E-mail: [email protected]
PortugalVWR International - Material de Laboratório, LdaEdifício NeoparkAv. Tomás Ribeiro, 43- 3 D2790-221 CarnaxideTel.: 21 3600 770Fax: 21 3600 798/9E-mail: [email protected]
SpainVWR International Eurolab S.L.Ronda Can Fatjó, nº 11 Edifici Tecnopark, 3 Parc Tecnològic del Vallés 08290 Cerdanyola del Vallés (Barcelona)Tel.: 902 222 897Fax: 902 430 657E-mail: [email protected]
SwedenVWR International ABFagerstagatan 18a163 94 StockholmTel.: 08 621 34 00Fax: 08 621 34 66E-mail: [email protected]
SwitzerlandVWR International AGLerzenstrasse 16/188953 DietikonTel.: 044 745 13 13Fax: 044 745 13 10E-mail: [email protected]
UKVWR International LtdCustomer Service CentreHunter BoulevardMagna ParkLutterworthLeicestershireLE17 4XNTel.: 0800 22 33 44Fax: 01455 55 85 86E-mail: [email protected]
Go to www.vwr.com for the latest news, special offers and details of your local VWR distribution partner.
Over 100 years of excellence – BDH Prolabo chemicals
2009 is a very exciting year for our BDH Prolabo brand – the BDH part is 100 years old and Prolabo is now over 106 years old! We were very proud to merge these two fine brands in 2007. Combining the best quality and price competitive characteristics of existing BDH and Prolabo products yet still retaining our molecular biology grade basics that have proven so useful to life scientists with it’s guarantee of reliability and high performance.ce.
Throughout the year, watch out for special promotions and competitions as we celebrate this very special event.
Quality, consistency, reproducibility and great value for all applications


![JIG CYLINDERS WITH GUIDES 12~φ63 · 3/3/2019 · Sensor Switches 733 ... adhesive. Always confirm that the rod end plate and hexagon socket head bolts ... [41°F] could freeze,](https://static.fdocument.org/doc/165x107/60b34d35e55a32784a7e37c5/jig-cylinders-with-guides-12i63-332019-sensor-switches-733-adhesive.jpg)