UNIVERSITY OF CALIFORNIA, IRVINE Merger Histories …stewartk/files/thesis.pdf · UNIVERSITY OF...
174
UNIVERSITY OF CALIFORNIA, IRVINE Merger Histories of Dark Matter Halos in ΛCDM and Implications for the Evolution of Milky Way-size Galaxies DISSERTATION submitted in partial satisfaction of the requirements for the degree of DOCTOR OF PHILOSOPHY in Physics by Kyle Robert Stewart Dissertation Committee: Professor James Bullock, Chair Professor Elizabeth Barton Professor Manoj Kaplinghat 2009
Transcript of UNIVERSITY OF CALIFORNIA, IRVINE Merger Histories …stewartk/files/thesis.pdf · UNIVERSITY OF...
UNIVERSITY OF CALIFORNIA,IRVINE
Merger Histories of Dark Matter Halos in ΛCDMand Implications for the Evolution of Milky Way-size Galaxies
DISSERTATION
submitted in partial satisfaction of the requirementsfor the degree of
DOCTOR OF PHILOSOPHY
in Physics
by
Kyle Robert Stewart
Dissertation Committee:Professor James Bullock, Chair
Professor Elizabeth BartonProfessor Manoj Kaplinghat
2009
Chapter 2 c© 2008 The American Astronomical SocietyChapter 3 c© 2009 The American Astronomical SocietyChapter 4 c© 2009 The American Astronomical Society
All other materials c© 2009 Kyle Robert Stewart

DEDICATION
To God.
I can do all things through Him who gives me strength.
To my parents,
who always encouraged me to “reach for the stars.”
(Though I doubt they realized I would “reach for the stars” quite so... literally.)
To my wife, Tania,
whose love makes me strong when I am weak.
The heavens declare the glory of God;
the skies proclaim the work of his hands.
Day after day they pour forth speech;
night after night they display knowledge.
There is no speech or language
where their voice is not heard.
Their voice goes out into all the earth,
their words to the ends of the world.
– Psalms 19:1-4 (NIV)
i
TABLE OF CONTENTS
Page
LIST OF FIGURES vi
LIST OF TABLES vii
ACKNOWLEDGMENTS viii
CURRICULUM VITAE x
ABSTRACT OF THE DISSERTATION xiv
1 Introduction 1
2 Merger Histories of DM Halos and Implications for Disk Survival 42.1 Chapter Abstract . . . . . . . . . . . . . . . . . . . . . . . . . . . . . 42.2 Introduction . . . . . . . . . . . . . . . . . . . . . . . . . . . . . . . . 52.3 The Simulation . . . . . . . . . . . . . . . . . . . . . . . . . . . . . . 82.4 Results . . . . . . . . . . . . . . . . . . . . . . . . . . . . . . . . . . . 15
2.4.1 Accretion Histories and Mass Functions . . . . . . . . . . . . . 152.4.2 Merger Statistics . . . . . . . . . . . . . . . . . . . . . . . . . 21
2.5 Discussion . . . . . . . . . . . . . . . . . . . . . . . . . . . . . . . . . 262.5.1 Milky Way Comparison . . . . . . . . . . . . . . . . . . . . . 262.5.2 Morphological Fractions and Thick Disks . . . . . . . . . . . . 272.5.3 Morphology–Luminosity Trends . . . . . . . . . . . . . . . . . 302.5.4 Successive Minor Mergers . . . . . . . . . . . . . . . . . . . . 312.5.5 Gas-rich Mergers . . . . . . . . . . . . . . . . . . . . . . . . . 322.5.6 Comparison to Previous Work . . . . . . . . . . . . . . . . . . 33
2.6 Conclusion . . . . . . . . . . . . . . . . . . . . . . . . . . . . . . . . . 342.7 Corollary: Merger Mass Ratio Statistics . . . . . . . . . . . . . . . . 372.8 Acknowledgements . . . . . . . . . . . . . . . . . . . . . . . . . . . . 41
3 Mergers in LCDM: Mass, Redshift, and Mass-Ratio Dependence 433.1 Chapter Abstract . . . . . . . . . . . . . . . . . . . . . . . . . . . . . 433.2 Introduction . . . . . . . . . . . . . . . . . . . . . . . . . . . . . . . . 443.3 Simulation . . . . . . . . . . . . . . . . . . . . . . . . . . . . . . . . . 483.4 Dark Matter Halo Merger Rates . . . . . . . . . . . . . . . . . . . . . 50
ii
3.5 Associating Halos with Galaxies . . . . . . . . . . . . . . . . . . . . . 573.6 Galaxy Merger Predictions . . . . . . . . . . . . . . . . . . . . . . . . 61
3.6.1 Merger Rates . . . . . . . . . . . . . . . . . . . . . . . . . . . 613.6.2 Merger Fractions . . . . . . . . . . . . . . . . . . . . . . . . . 633.6.3 Merger-driven starbursts . . . . . . . . . . . . . . . . . . . . . 643.6.4 Morphological signatures . . . . . . . . . . . . . . . . . . . . . 673.6.5 High Redshift Expectations . . . . . . . . . . . . . . . . . . . 70
3.7 Conclusion . . . . . . . . . . . . . . . . . . . . . . . . . . . . . . . . . 713.8 Acknowledgements . . . . . . . . . . . . . . . . . . . . . . . . . . . . 73
4 Gas-Rich Mergers and Disk Survivability 744.1 Chapter Abstract . . . . . . . . . . . . . . . . . . . . . . . . . . . . . 744.2 Introduction . . . . . . . . . . . . . . . . . . . . . . . . . . . . . . . . 754.3 Method . . . . . . . . . . . . . . . . . . . . . . . . . . . . . . . . . . 79
4.3.1 The Simulation . . . . . . . . . . . . . . . . . . . . . . . . . . 794.3.2 Assigning Stars . . . . . . . . . . . . . . . . . . . . . . . . . . 814.3.3 Assigning Gas . . . . . . . . . . . . . . . . . . . . . . . . . . . 82
4.4 Results and Implications . . . . . . . . . . . . . . . . . . . . . . . . . 864.4.1 Galaxy Morphology . . . . . . . . . . . . . . . . . . . . . . . . 864.4.2 Alternative definitions for major merger . . . . . . . . . . . . 904.4.3 Gas Delivery Via Mergers . . . . . . . . . . . . . . . . . . . . 934.4.4 Redshift Evolution . . . . . . . . . . . . . . . . . . . . . . . . 974.4.5 Comparison to Previous Work . . . . . . . . . . . . . . . . . . 100
4.5 Conclusion . . . . . . . . . . . . . . . . . . . . . . . . . . . . . . . . . 1024.6 Acknowledgements . . . . . . . . . . . . . . . . . . . . . . . . . . . . 105
5 Invisible Major Mergers: Defining Galaxy “Merger Ratios” 1065.1 Chapter Abstract . . . . . . . . . . . . . . . . . . . . . . . . . . . . . 1065.2 Introduction . . . . . . . . . . . . . . . . . . . . . . . . . . . . . . . . 1075.3 Assigning Baryons and Defining Masses . . . . . . . . . . . . . . . . . 1085.4 Mapping Between Mass Ratios . . . . . . . . . . . . . . . . . . . . . . 1105.5 Example Consequence: Measuring the Merger Rate . . . . . . . . . . 112
6 Stealth Galaxies in the Halo of the Milky Way 1146.1 Chapter Abstract . . . . . . . . . . . . . . . . . . . . . . . . . . . . . 1146.2 Introduction . . . . . . . . . . . . . . . . . . . . . . . . . . . . . . . . 1156.3 Motivations . . . . . . . . . . . . . . . . . . . . . . . . . . . . . . . . 1196.4 Model . . . . . . . . . . . . . . . . . . . . . . . . . . . . . . . . . . . 1246.5 Results . . . . . . . . . . . . . . . . . . . . . . . . . . . . . . . . . . . 1306.6 Conclusions and Discussion . . . . . . . . . . . . . . . . . . . . . . . 1346.7 Acknowledgements . . . . . . . . . . . . . . . . . . . . . . . . . . . . 136
7 Future Work 1377.1 A Systematic Approach to Cosmological Hydrodynamic Simulations . 1377.2 Example Simulation: “Via Lactea II” with SPH code “GASOLINE” . 140
iii
8 Summary and Concluding Remarks 142
Bibliography 145
iv
LIST OF FIGURES
Page
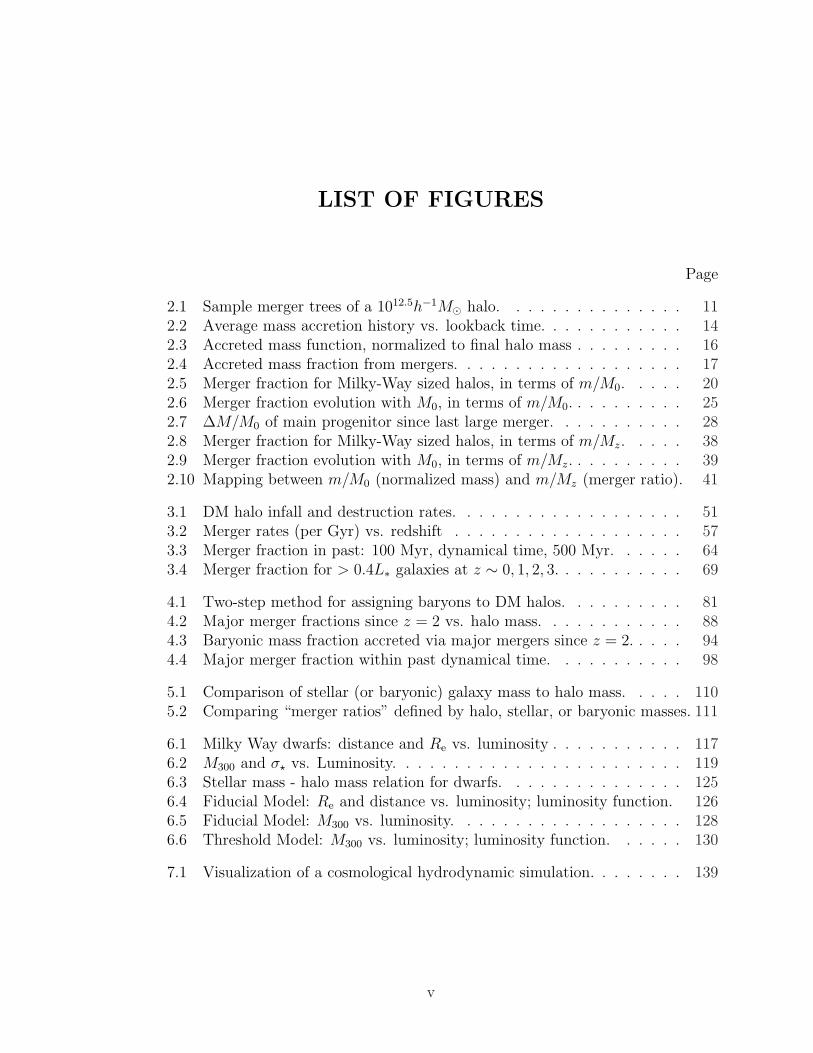
2.1 Sample merger trees of a 1012.5h−1M¯ halo. . . . . . . . . . . . . . . 112.2 Average mass accretion history vs. lookback time. . . . . . . . . . . . 142.3 Accreted mass function, normalized to final halo mass . . . . . . . . . 162.4 Accreted mass fraction from mergers. . . . . . . . . . . . . . . . . . . 172.5 Merger fraction for Milky-Way sized halos, in terms of m/M0. . . . . 202.6 Merger fraction evolution with M0, in terms of m/M0. . . . . . . . . . 252.7 ∆M/M0 of main progenitor since last large merger. . . . . . . . . . . 282.8 Merger fraction for Milky-Way sized halos, in terms of m/Mz. . . . . 382.9 Merger fraction evolution with M0, in terms of m/Mz. . . . . . . . . . 392.10 Mapping between m/M0 (normalized mass) and m/Mz (merger ratio). 41
3.1 DM halo infall and destruction rates. . . . . . . . . . . . . . . . . . . 513.2 Merger rates (per Gyr) vs. redshift . . . . . . . . . . . . . . . . . . . 573.3 Merger fraction in past: 100 Myr, dynamical time, 500 Myr. . . . . . 643.4 Merger fraction for > 0.4L∗ galaxies at z ∼ 0, 1, 2, 3. . . . . . . . . . . 69
4.1 Two-step method for assigning baryons to DM halos. . . . . . . . . . 814.2 Major merger fractions since z = 2 vs. halo mass. . . . . . . . . . . . 884.3 Baryonic mass fraction accreted via major mergers since z = 2. . . . . 944.4 Major merger fraction within past dynamical time. . . . . . . . . . . 98
5.1 Comparison of stellar (or baryonic) galaxy mass to halo mass. . . . . 1105.2 Comparing “merger ratios” defined by halo, stellar, or baryonic masses. 111
6.1 Milky Way dwarfs: distance and Re vs. luminosity . . . . . . . . . . . 1176.2 M300 and σ? vs. Luminosity. . . . . . . . . . . . . . . . . . . . . . . . 1196.3 Stellar mass - halo mass relation for dwarfs. . . . . . . . . . . . . . . 1256.4 Fiducial Model: Re and distance vs. luminosity; luminosity function. 1266.5 Fiducial Model: M300 vs. luminosity. . . . . . . . . . . . . . . . . . . 1286.6 Threshold Model: M300 vs. luminosity; luminosity function. . . . . . 130
7.1 Visualization of a cosmological hydrodynamic simulation. . . . . . . . 139
v
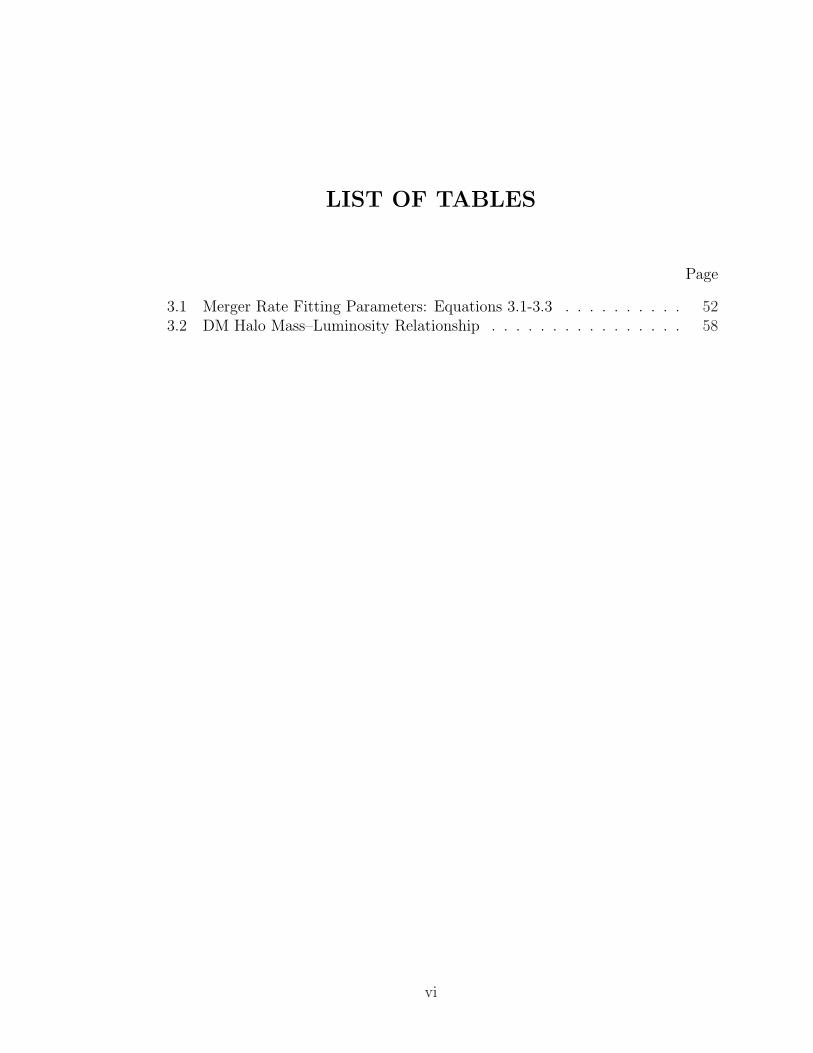
LIST OF TABLES
Page
3.1 Merger Rate Fitting Parameters: Equations 3.1-3.3 . . . . . . . . . . 523.2 DM Halo Mass–Luminosity Relationship . . . . . . . . . . . . . . . . 58
vi
ACKNOWLEDGMENTS
I have had the privilege to work with many wonderful and talented people duringmy graduate career at University of California, Irvine. First and foremost, I wouldlike to thank my advisor, James Bullock, whose incredible enthusiasm for science ismatched by his genuine and heartfelt concern for his students’ welfare and growth.James has the incredible ability to encourage students to develop projects that matchtheir personal interests, while simultaneously molding such projects so that theyare as scientifically relevant as possible. I would also like to thank Betsy Barton,who has continually challenged me to expand my scientific horizons and explore newtopics of study. Much of this thesis attempts to bridge theoretical expectations withobservations: a task that would have been impossible without Betsy’s input andadvice. I would like to thank Risa Wechsler at Stanford University, who provided thecosmological simulations’ merger trees utilized in most of the work presented here.Her willingness to share her merger tree data, as well as her overall expertise andinput over the years has been vital to much of this work.
I would also like to thank postdoc Jeff Cooke for many useful conversations, andpostdoc Tobias Kaufmann for his invaluable expertise in recent months, helping memake a transition into a related subfield of galaxy formation simulations. The workpresented here also benefitted from contributions of many others, and I would liketo thank collaborators Ari Maller, Andrew Zentner, Manoj Kaplinghat, Joel Berrier,Chris Purcell, and Erik Tollerud for their numerous insights and advice.
I would like to thank all of my fellow graduate students, and all the postdocs in theastronomy group at UCI for countless conversations over lunches and astro-coffees, orwhile passing by each other in the hallway, etc. I would especially like to thank myoffice mate Chris Purcell for his constant willingness to pause whatever he’s doing todiscuss computer bugs, programming tips, or scientific topics with me over the years.I’d also like to thank Erik Tollerud, Devdeep Sarkar and Jonelle Walsh for actingas my “lifeline” to the various departmental activities and social functions. Withouttheir outgoing and friendly efforts to keep me involved in the astronomy group’s socialactivities, I would have no doubt spent my graduate years secluded in the corner ofmy office, doing research whilst interacting with no one.
I would like to thank the National Science Foundation for its support, as the bulk ofwork presented here was funded by NSF grant AST 05− 07916. I also like to thankthe Center for Cosmology for its support, and the American Astronomical Society forpermitting me to present published material as part of this thesis. Chapter 2, Chapter3 and Chapter 4 have been published in The Astrophysics Journal as Stewart et al.(2008, 2009a,b) respectively.
I thank my parents for supporting me, both financially and otherwise, throughoutmy life. They have done more for me than I can ever list here, and they have alwaysencouraged me to follow my dreams. Without their guidance and encouragement, I
vii
would never have developed into the person I am today, nor could I have come thisfar. Finally, I thank my wife, Tania. Without her love and support, I could neverhave survived the rigors of graduate school. She has taught me so much about life,and about myself, and I am a better person today, thanks to her. I cannot imaginelife without her.
viii
CURRICULUM VITAE
Kyle Robert Stewart
CONTACT INFORMATION
2140 Frederick Reines Hall Office: (949) 824-2892Department of Physics and Astronomy Email: stewartkuci.eduUniversity of California, Irvine Web: www.physics.uci.edu/∼stewartkIrvine, CA 92697 USA Citizenship: United States
RESEARCH INTERESTS
Theoretical Cosmology; Galaxy Formation & Evolution; Dark Matter; CosmologicalSimulations; Galaxy Simulations; Galaxy Mergers
EDUCATION
Doctor of Philosophy in Physics 2009University of California, Irvine Irvine, California
Master of Science in Physics 2006University of California, Irvine Irvine, California
Bachelor of Science in Astrophysics 2004University of California, Los Angeles Los Angeles, California
RESEARCH EXPERIENCE
Graduate Student Researcher 2005–2009University of California, Irvine Irvine, CaliforniaPI: James Bullock, Ph.D.
Undergraduate Research Assistant 2003–2004University of California, Los Angeles Los Angeles, CaliforniaPI: Matt Malkan, Ph.D.
TECHNICAL SKILLS
Operating Systems:Proficient in: Windows, Linux
Programming & Software:Proficient in: IDL, TIPSYFamiliar with: C++, Java, Mathematica, PKDGRAV, GASOLINE
ix
TEACHING EXPERIENCE
Teaching Assistant: Introduction to Astronomy Spring 2006University of California, Irvine: Course 20A Irvine, California3 discussion sections, grading, office hours
Teaching Assistant: Cosmology Winter 2006University of California, Irvine: Course 20B Irvine, California4 discussion sections, grading, office hours
Teaching Assistant: Classical Physics Spring 2005University of California, Irvine: Courses 7B, 7LB Irvine, California2 discussion sections, grading, office hours3 tutorial labs, office hours, tutorial center
Teaching Assistant: Basic Physics Lab II Winter 2005University of California, Irvine: Course 3LB Irvine, California3 experimental laboratory sections, grading, office hours
Teaching Assistant: Fundamentals of Experimental Physics Fall 2004University of California, Irvine: Course 52A Irvine, California3 experimental laboratory sections, grading, office hours
OUTREACH
University of California, Irvine 2008Participated in presentations to local elementary schools
SELECTED HONORS AND AWARDS
NASA Postdoctoral Program (NPP) Fellowship 2009
PUBLICATIONS AND PRE-PRINTS
Mg II Absorption Systems in a Cosmological Context K.R. Stewart, T. Kaufmann,J. Bullock, E. Barton, J. Diemand, L. Mayer, P. Madau, J. Wadsley, A. Maller (ten-tative title and author list), in prep.
Stealth Galaxies in the Halo of the Milky Way J.S. Bullock, K.R. Stewart, M.Kaplinghat, E.J. Tollerud, in prep.
Mergers and Bulge Formation in Lambda-CDM: Which Mergers Matter? P. Hopkins,K. Bundy, D. Croton, L. Hernquist, D. Keres, S. Kochfar, K.R. Stewart, A. Wetzel,and J. Younger, MNRAS submitted, 2009
Invisible Major Mergers: Why the Definition of a Galaxy “Merger Ratio” Matters
x
K.R. Stewart, ArXiv:0902.2214 [astro-ph], to appear in proceedings of “GalaxyEvolution: Emerging Insights and Future Challenges,” 2009
Gas-rich Mergers in LCDM: Disk Survivability and the Baryonic Assembly of Galax-ies K.R. Stewart, J.S. Bullock, R.H. Wechsler, and A.H. Maller, ApJ, 702, 307,2009
The Effects of Gas on Morphological Transformation in Mergers: Implications forBulge and Disk Demographics P.F. Hopkins, R.S. Somerville, T.J. Cox, L. Hernquist,S. Jogee, D. Keres, C.P. Ma, B. Robertson, and K.R. Stewart, MNRAS, 397, 802,2009
Galaxy Mergers and Dark Matter Halo Mergers in LCDM: Mass, Redshift, and Mass-Ratio Dependence K.R. Stewart, J.S. Bullock, E.J. Barton, R.H. Wechsler, ApJ,702, 1005, 2009
Mergers and Disk Survival in LCDM J.S. Bullock, K.R. Stewart, and C.W. Purcell,Invited Contribution, IAU Symposium 254, 2008
The Assembly of Galaxy Clusters J.C. Berrier, K.R. Stewart, C.W. Purcell, E.J.Barton, and R.H. Wechsler, ApJ, 690, 1292, 2008
A Candidate Brightest Proto-Cluster Galaxy at z = 3.03 J. Cooke, E.J. Barton, J.S.Bullock, K.R. Stewart, and A.M. Wolfe, ApJ, 681, 57, 2008
Merger Histories of Galaxy Halos and Implications for Disk Survival K.R. Stewart,J.S. Bullock, R.H. Wechsler, A.H. Maller, and A.R. Zentner, ApJ, 653, 597, 2008
SEMINARS AND COLLOQUIA
Merger Histories of LCDM Galaxies: Disk Survivability and the Deposition of ColdGas via Mergers, Kavli Institute for Cosmological Physics, Open Group Seminar, TheUniversity of Chicago. Nov. 2008.
Merger Histories of LCDM Galaxies: Disk Survivability and the Deposition of ColdGas via Mergers, Center for Cosmology and AstroParticle Physics Seminar, the OhioState University, Oct. 2008.
Merger Histories of LCDM Galaxies: Disk Survivability and the Deposition of ColdGas via Mergers, Berkeley Cosmology Group Seminar, University of California, Berke-ley, Sept. 2008.
Merger Histories of LCDM Galaxies: Disk Survivability and the Deposition of ColdGas via Mergers, KIPAC tea talk, Kavli Institute for Particle Astrophysics and Cos-mology, Stanford University, Aug. 2008.
xi
CONTRIBUTED CONFERENCE TALKS (OR POSTERS)
Cloud Formation in a Cosmological Context and Implications for Absorption-SelectedGalaxies, Hunting for the Dark: the Hidden Side of Galaxy Formation, Malta, Oct.2009 (Poster)
Cool Halo Gas in a Cosmological Context, Galaxy Formation Workshop, Universityof California, Santa Cruz, Aug. 2009.
Merger Histories of LCDM Galaxies: Disk Survivability and the Deposition of ColdGas via Mergers, 213th AAS Meeting, Long Beach, CA, Jan. 2009.
Merger Histories of LCDM Galaxies: Gas Fractions and Disk Survivability, 8th An-nual Theoretical Astrophysics in Southern California Meeting, University of Califor-nia, Irvine, Oct. 2008.
Galaxy Merger Fractions and Disk Survivability, Back to the Galaxy II (ScientificHightlights Section), University of California, Santa Barbara, Oct. 2008.
Merger Histories of DM Halos and the Baryonic Assembly of Galaxies, Galaxy For-mation Workshop, University of California, Santa Cruz, Aug. 2008.
Merger Histories of Galaxy Halos, and Implications for Disk Survival, Galactic Struc-ture and Structure of Galaxies Workshop, Ensenada, Baja California, Mexico, Mar.2008 (Poster)
Merger Histories of Galaxy-sized Dark Matter Halos, and Implications for Disk Sur-vival, 7th Annual Theoretical Astrophysics in Southern California Meeting, Universityof California, Los Angeles, Nov. 2007
Merger Histories of Galaxy-sized Dark Matter Halos, Galaxy Formation Workshop,University of California, Santa Cruz, Aug. 2007
xii
ABSTRACT OF THE DISSERTATION
Merger Histories of Dark Matter Halos in ΛCDMand Implications for the Evolution of Milky Way-size Galaxies
By
Kyle Robert Stewart
Doctor of Philosophy in Physics
University of California, Irvine, 2009
Professor James Bullock, Chair
There is a concern in galaxy formation that mergers are too common in ΛCDM to
explain the prominence of thin disk-dominated galaxies in the local universe. In my
dissertation, I analyze merger histories of dark matter halos from high resolution N-
body simulations and compare dark halo merger statistics to the observable properties
of galaxies, in order to study the implications of cosmologically motivated merger
histories. I use empirical relations between a galaxy’s dark matter halo mass, stellar
mass, and cold gas mass to investigate these merger histories in the context of galaxy
evolution, focusing on a dark matter mass regime within an order of magnitude of
the Milky Way.
The principle results of this dissertation may be summarized as follows. Firstly, 70%
of Milky Way-size halos have accreted an object with more than twice the mass of the
Milky-Way’s disk in the past 10 Gyr. To meet the observed fraction of disk dominated
galaxies, mergers of this size must not always destroy galactic disks. Secondly, The
merger rate of dark halos increases strongly with redshift. A simple ‘universal’ fitting
formula describes these merger rates as a function of halo mass, merger mass ratio,
and redshift. Thirdly, the fraction of halos have ever experienced a gas poor major
xiii
merger roughly matches the observed early-type morphological fractions within the
regime M = 1011−13M¯, providing a possible solution to disk survivability, if gas
rich mergers do not destroy disk-dominated morphologies. Fourthly, because the
mapping between dark matter halo mass and galaxy stellar mass (or baryonic mass)
is a non-trivial function, it is important to distinguish between definitions of a merger
“mass ratio” that use dark matter, stellar, or galaxy baryonic masses as a means of
comparison. For example, major dark matter mergers in smaller galaxies (MDM <
1011M¯) typically corresponds to very minor stellar mergers. Finally, we use a higher
resolution simulation to focus on the substructure of Milky Way-sized galaxies. We
predict a population of “stealth” galaxies: low-luminosity dwarf galaxies in the halo
of the Milky Way with surface brightnesses so low they are unobservable with current
methods.
xiv

Chapter 1
Introduction
In the current Λ Cold Dark Matter (CDM) paradigm, dark matter (DM) constitutes
∼ 83% of the matter density of the universe (Spergel et al., 2007), so that the large
scale structures in the universe are not dominated by normal “baryonic” matter,
but by the behavior of dark matter (and dark energy, in the form of a cosmological
constant, Λ, which causes the observed acceleration in the universe at later times.)
The term “cold” in describing dark matter refers to non-relativistic particle velocities,
which allows dark matter to clump gravitationally on small scales first. Thus, in
CDM cosmologies, the universe forms hierarchically, with less massive dark matter
halos forming first, and halos merging together to form more massive halos over time.
In this paradigm, since dark matter dominates the matter density of the universe, all
baryonic matter (galaxies) are expected to reside within the centers of massive dark
matter halos.
In this picture of galaxy formation, it is important to understand the implications
of dark matter halo mergers (galaxy mergers). The gravitational impact of so called
“major mergers” (in which the ratio of dark matter halo masses & 1/3) are believed to
1
play an important role in shaping galaxy morphologies (e.g., Toomre & Toomre, 1972;
Bournaud et al., 2007). They also drive large supplies of gas (when gas is present
in the progenitor galaxies) into the central regions, triggering star formation, fueling
supermassive black holes and Active Galactic Nuclei (AGN) activity (e.g., Mihos &
Hernquist, 1996; Barton et al., 2007). They also contribute to the direct deposition of
gas and stars into the “main” galaxy (usually defined as the most massive progenitor).
So called “minor mergers” (typically with merger mass ratios between ∼ 1/10− 1/3)
may aid in the creation of thick disk components in disk-dominated galaxies (e.g.
Quinn et al., 1993; Purcell et al., 2009), cause anti-truncation (Younger et al., 2007),
add angular momentum to the main galaxy, and contribute to extended diffuse light
components around galaxies (e.g., Purcell et al., 2007).
However, there is concern that mergers may in fact be too common in ΛCDM to
explain the observed fractions of disk-type systems (with stellar dynamics dominated
by ordered rotation) and bulge-type galaxies (with dynamics dominated by random
motions). Since mergers are relatively common, and mergers are expected to disrupt
or even destroy disk-dominated morphologies, it is difficult to explain how ∼ 70% of
Milky Way-size galaxies are morphologically classified as “disk-dominated.” There is
also a concern that the ΛCDM model predicts thousands of subhalos within the halo
of the Milky Way that should host galaxies, which have not been observed.
The goal of this thesis is to use cosmological simulations of dark matter structure in
order to derive theoretical expectations for galaxy evolution, specifically in roughly
Milky Way-sized galaxies (MDM ∼ 1012M¯). The structure of the thesis is as follows.
In Chapter 2 we analyze thousands of cosmological merger histories for existing Milky
Way-sized halos at z = 0 in the simulation, then apply these statistics to the issue of
disk-galaxy survivability, comparing to observed morphological fractions of galaxies in
the local universe. In Chapter 3 we focus on more instantaneous merger rates of dark
2
matter halos as a function of redshift, merger mass ratio, and halo mass. We compare
our theoretical findings to observational indications of the merger rate, such as the
morphologically disturbed fraction or close-pair count statistics of massive galaxies
as a function of redshift. In Chapter 4 we revisit dark matter halo merger statistics
in light of disk survival, but we used empirically motivated techniques for approxi-
mating the stellar mass and cold gas mass within a dark matter halo, as a function of
halo mass. We then investigate the cosmologically expected fractions of major gas-
poor mergers (galactic cold gas fractions < 50%), based on recent simulation results
indicating that gas-rich mergers may preserve disk-dominated morphologies (Brook
et al., 2004; Robertson et al., 2006a; Governato et al., 2009). In Chapter 5 we take
a brief look at how varying definitions of a merger “mass ratio” (defined either by
dark matter halo masses, galaxy stellar masses, or total galaxy baryonic masses) may
impact comparisons between observations and theory. Finally, in Chapter 6 we an-
alyze a much higher resolution simulation, “Via Lactea II” (Diemand et al., 2008),
that allows us to accurately describe the substructure of a single Milky Way-size halo.
Using a similar model as in previous chapters to assign a central galaxy’s stellar mass
as a function of halo mass, we develop a model from this simulation that is consistent
with the observed dwarf galaxies around the Milky Way, and predicts a population
of heretofore undiscovered “stealth” galaxies in the Milky Way, which have surface
brightnesses too low to be observed with current methods. We touch upon avenues of
future work in Chapter 7 and summarize our findings with some concluding remarks
in Chapter 8.
3
Chapter 2
Merger Histories of DM Halos and
Implications for Disk Survival
2.1 Chapter Abstract
We study the merger histories of galaxy dark matter halos using a high resolution
ΛCDM N -body simulation. Our merger trees follow ∼ 17, 000 halos with masses
M0 = (1011 − 1013)M¯ at z = 0 and track accretion events involving objects as
small as m ' 1010M¯. We find that mass assembly is remarkably self-similar in
m/M0, and dominated by mergers that are ∼ 10% of the final halo mass. While very
large mergers, m & 0.4 M0, are quite rare, sizeable accretion events, m ∼ 0.1 M0,
are common. Over the last ∼ 10 Gyr, an overwhelming majority (∼ 95%) of Milky
Way-sized halos with M0 = 1012M¯ have accreted at least one object with greater
total mass than the Milky Way disk (m > 5 × 10¹⁰M¯), and approximately 70%
have accreted an object with more than twice that mass (m > 1011M¯). Our results
raise serious concerns about the survival of thin-disk dominated galaxies within the
4
current paradigm for galaxy formation in a ΛCDM universe. In order to achieve a
∼ 70% disk-dominated fraction in Milky Way-sized ΛCDM halos, mergers involving
m ' 2 × 10¹¹M¯ objects must not destroy disks. Considering that most thick disks
and bulges contain old stellar populations, the situation is even more restrictive: these
mergers must not heat disks or drive gas into their centers to create young bulges.
2.2 Introduction
In the cold dark matter (CDM) model of structure formation, dark matter halos form
via the continuous accretion of smaller systems (Peebles, 1982; Blumenthal et al.,
1984; Davis et al., 1985; Fakhouri & Ma, 2008; Neistein & Dekel, 2008; Cole et al.,
2008a). Mergers of the type predicted can help explain many properties of the ob-
served universe. Major mergers are believed to play an important role in shaping
the Hubble sequence (Toomre & Toomre, 1972; Barnes, 1988; Hernquist, 1993; Naab
& Burkert, 2003; Khochfar & Burkert, 2005; Cox et al., 2006a; Robertson et al.,
2006b,a,c; Maller et al., 2006; Jesseit et al., 2007; Bournaud et al., 2007) and trig-
gering star formation and AGN activity (Mihos & Hernquist, 1996; Kolatt et al.,
1999; Cox et al., 2006a; Woods et al., 2006; Barton et al., 2007). Minor mergers
may help explain the origin of thick disks (Quinn et al., 1993; Walker et al., 1996;
Abadi et al., 2003; Brook et al., 2004; Dalcanton et al., 2005; Kazantzidis et al., 2008;
Hayashi & Chiba, 2006), cause anti-truncation (Younger et al., 2007), and produce
extended diffuse light components around galaxies (Johnston et al., 1996; Helmi &
White, 1999; Bullock et al., 2001b; Bullock & Johnston, 2005; Purcell et al., 2007;
Bell et al., 2008). However, there is lingering concern that mergers are too common
in CDM cosmologies for thin disk-dominated systems to survive (Toth & Ostriker,
1992; Wyse, 2001; Kormendy & Fisher, 2005; Kautsch et al., 2006). In this chapter
5
we present the merger statistics necessary for addressing this issue.
The formation of disk galaxies within hydrodynamic simulations in hierarchical CDM
cosmologies has proven problematic (e.g. Navarro & Steinmetz, 2000). While there
have been some successes in forming galaxies with disks in cosmological simulations
(Abadi et al., 2003; Sommer-Larsen et al., 2003; Brook et al., 2004; Robertson et al.,
2004; Kaufmann et al., 2007a; Governato et al., 2007), the general problem is far from
resolved. The resultant disks are often fairly thick and accompanied by large bulges,
and the systems that form disks tend to have special merger histories. The resultant
thick disk and bulge stars also tend towards a broad range of stellar ages, instead of
being dominated by predominantly old stars. Moreover, the successes depend strongly
on effective models that describe physics on scales far below the simulation resolution,
which are poorly understood. Given the current difficulties in understanding ab initio
disk formation, one can consider a less ambitious, but more well-posed question. Even
if disk galaxies can form within CDM halos, can they survive the predicted merger
histories?
Unfortunately, the prevalence of thin-disk or even disk-dominated galaxies in the
universe is difficult to quantify with large observational samples. Some promising
approaches use asymmetry vs. concentration to define morphological type (e.g., Ilbert
et al., 2006), and some use a combination color and concentration indicators (e.g.
Choi et al., 2007; Park et al., 2007). Despite the wide range of definitions, the general
consensus in the literature is that ∼ 70% of ∼ 1012h−1M¯ halos host disk-dominated,
late-type galaxies (e.g. Weinmann et al., 2006; van den Bosch et al., 2007; Ilbert et
al., 2006; Choi et al., 2007; Park et al., 2007). We adopt this number for the sake
of discussion in what follows, but none of our primary results on merger statistics
depend on this number.
Also relevant to the discussion of galaxy merger histories is the prevalence of pure
6
disk galaxies in the universe. Kautsch et al. (2006) have compiled a statistically
meaningful sample of edge-on disk galaxies and found that ∼ 16% of these objects are
“simple disks” with no observable bulge component. In principle, this statistic places
strong constraints on the merger histories of galaxies. Moreover, a large fraction of
disk galaxies with bulges contain pseudo-bulges, which may be the products of secular
processes and not the remnants of an early merger event (e.g. Kormendy & Kennicutt,
2004; Carollo et al., 2007). These cases provide further motivation to quantify the
predicted merger histories of galaxy halos in the favored CDM cosmology.
Here we use a large dissipationless cosmological ΛCDM N-body simulation to track
the merger histories of an ensemble of ∼ 17, 000 halos with z = 0 masses M0 = 1011−1013h−1M¯. We focus on halos of fixed mass at z = 0, and concentrate specifically on
Milky Way-sized systems, M0 ' 1012h−1M¯. We categorize the accretion of objects
as small as m ' 1010h−1M¯ and focus on the infall statistics into main progenitors of
z = 0 halos as a function of lookback time. As discussed below, the main progenitor
is defined to be the most massive progenitor of a z = 0 halo tracked continuously
back in time.
A merger is defined here to occur when an infalling halo first crosses within the virial
radius of the main progenitor. In most cases we do not track subhalo evolution after
accretion. We have chosen to track mergers in this way in order to provide a robust
prediction. An understanding of an accreted halo’s subsequent orbital evolution and
impact with the central disk region is essential for any complete understanding of
galaxy merger statistics. However, this evolution will be sensitive to the baryonic
distribution within both the main progenitor halo and the satellites themselves. The
halo merger rate we present is a relatively clean measure that can be used as a starting
point for more detailed investigations of galaxy–galaxy encounters. Still, it is worth
pointing out that for most of the mergers we consider, impacts with the central disk
7
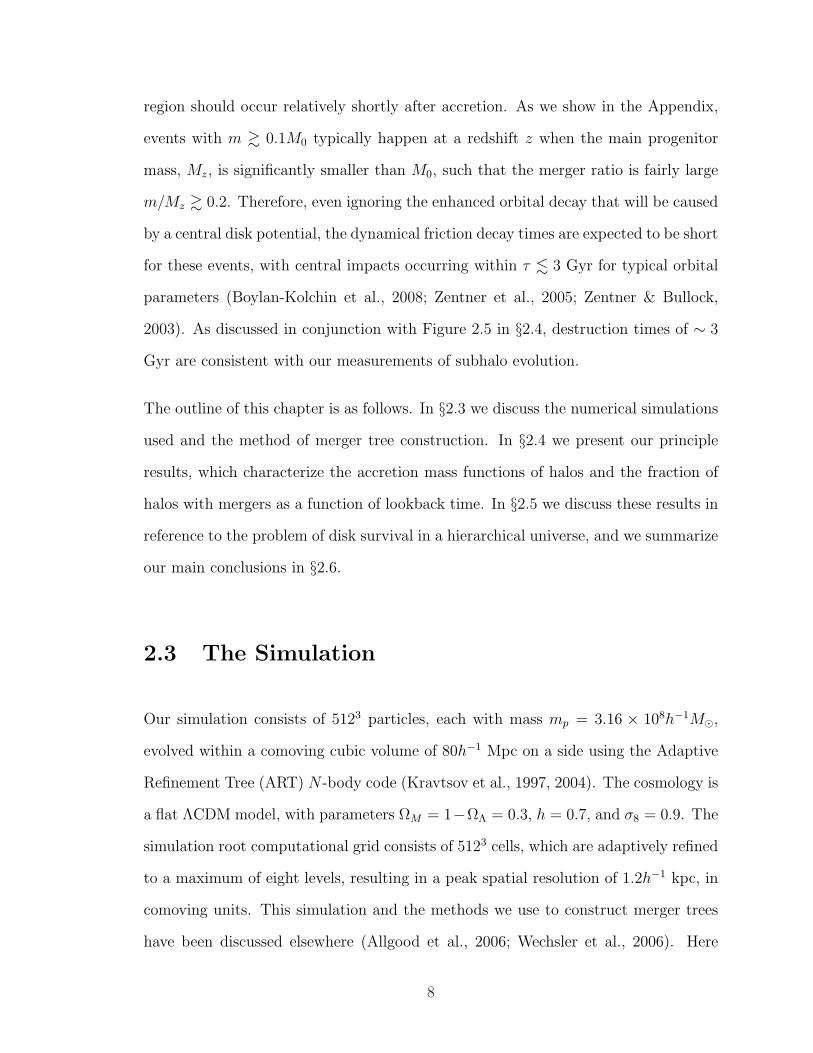
region should occur relatively shortly after accretion. As we show in the Appendix,
events with m & 0.1M0 typically happen at a redshift z when the main progenitor
mass, Mz, is significantly smaller than M0, such that the merger ratio is fairly large
m/Mz & 0.2. Therefore, even ignoring the enhanced orbital decay that will be caused
by a central disk potential, the dynamical friction decay times are expected to be short
for these events, with central impacts occurring within τ . 3 Gyr for typical orbital
parameters (Boylan-Kolchin et al., 2008; Zentner et al., 2005; Zentner & Bullock,
2003). As discussed in conjunction with Figure 2.5 in §2.4, destruction times of ∼ 3
Gyr are consistent with our measurements of subhalo evolution.
The outline of this chapter is as follows. In §2.3 we discuss the numerical simulations
used and the method of merger tree construction. In §2.4 we present our principle
results, which characterize the accretion mass functions of halos and the fraction of
halos with mergers as a function of lookback time. In §2.5 we discuss these results in
reference to the problem of disk survival in a hierarchical universe, and we summarize
our main conclusions in §2.6.
2.3 The Simulation
Our simulation consists of 5123 particles, each with mass mp = 3.16 × 10⁸h−1M¯,
evolved within a comoving cubic volume of 80h−1 Mpc on a side using the Adaptive
Refinement Tree (ART) N -body code (Kravtsov et al., 1997, 2004). The cosmology is
a flat ΛCDM model, with parameters ΩM = 1−ΩΛ = 0.3, h = 0.7, and σ8 = 0.9. The
simulation root computational grid consists of 5123 cells, which are adaptively refined
to a maximum of eight levels, resulting in a peak spatial resolution of 1.2h−1 kpc, in
comoving units. This simulation and the methods we use to construct merger trees
have been discussed elsewhere (Allgood et al., 2006; Wechsler et al., 2006). Here
8
we give a brief overview and refer the reader to those papers for a more complete
discussion.
Field dark matter halos and subhalos are identified using a variant of the bound
density maxima algorithm (Klypin et al., 1999a). A subhalo is defined as a dark matter
halo whose center is positioned within the virial radius of another, more massive halo.
Conversely, we define a field halo to be a dark matter halo that does not lie within the
virial radius of a larger halo. The virial radius is defined as the radius of a collapsed
self gravitating dark matter halo within which the average density is ∆vir times the
mean density of the universe. For the family of flat cosmologies (Ωm + ΩΛ = 1) the
value of ∆vir can be approximated by (Bryan & Norman, 1998):
∆vir =18π2 + 82(Ωm(z)− 1)− 39(Ωm(z)− 1)2
Ωm(z). (2.1)
Masses, M , are defined for field halos as the mass enclosed within the virial radius,
so that M = (4π/3)R3Ωmρc∆vir. With these definitions, the virial radius for halos of
mass M at z = 0 is given by:
R ' 205h−1kpc
(M
1012h−1M¯
)1/3
. (2.2)
Note that this mass definition based on a fixed overdensity is largely conventional,
and is traditionally used as a rough approximation for the radius within which the
halos are virialized. We refer the reader to the recent work of Cuesta et al. (2008) for
further discussion of this issue.
Halo masses become more difficult to define in crowded environments. For example, if
two halos are located within two virial radii of each other, mass double-counting can
become a problem. Also, subhalos can become tidally stripped if they are accreted
into a larger halo. While the stripped material typically remains bound to the larger
9
host halo, it is no longer bound to the smaller subhalo and should not be included in
the subhalo’s mass. In these cases, the standard virial over-density definitions are not
appropriate. In order to overcome this ambiguity, we always define a halo’s radius
and mass as the minimum of the virial mass and a “truncation mass” – defined as the
mass within the radius where the log-slope of the halo density profile becomes flatter
than −0.5. This definition of truncation mass is a relatively standard practice when
dealing with simulations of this kind (e.g. Klypin & Holtzman, 1997; Kravtsov et al.,
2004; Zentner et al., 2005), and we follow this convention to remain consistent with
other work in this field. In practice, our field halos have masses and radii defined by
the standard virial relations (∼ 98% of all non- subhalos). It is fair then to interpret
our merger rates as infall rates into halo virial radii. The masses of objects just prior
to infall are more likely affected by this definition, but the overall effect on our results
is not large. As a test, we have redone our main analysis using an (extrapolated)
virial mass for infalling halos. The results on fractional merger rates change only at
the ∼ 5% level.
In the event that a halo experiences a close pass with another halo—entering within
the virial radius for a short time, then exiting the virial radius never to return—the
two halos are considered isolated, even though one may lie within the virial radius
of the other. Conversely, if the smaller halo falls back within the virial radius and
the two halos subsequently merge together, then we continue to consider the smaller
halo a subhalo even during the time when it lies outside the virial radius of its host.
This has been referred to as the “stitching” method—as opposed to “snipping,” which
would count the above example as two separate mergers (Fakhouri & Ma, 2008).
By constructing mass functions, we find that these halo catalogs are complete to
a minimum mass 1010h−1M¯. This allows us to measure the accretion of objects
10 times smaller than 1011h−1M¯ halos, or objects up to 1000 times smaller than
10
0.01 0.02 0.03 0.05 0.06 0.07 0.09 0.10 0.13 0.14 0.16 0.17 0.19 0.21 0.31 0.34 0.38 0.42 0.46 0.51 0.55 0.60 0.65 0.71 0.77 0.84 0.91 0.98 1.06 1.15 1.25 1.36 1.47 1.60 1.74 1.90 2.08 2.29 2.52 2.78 3.09 3.46 3.89 4.43 5.09 7.05 redshift
Halo 810, 3.10e+12
0.01 0.02 0.03 0.05 0.06 0.07 0.09 0.10 0.13 0.14 0.16 0.17 0.19 0.21 0.31 0.34 0.38 0.42 0.46 0.51 0.55 0.60 0.65 0.71 0.77 0.84 0.91 0.98 1.06 1.15 1.25 1.36 1.47 1.60 1.74 1.90 2.08 2.29 2.52 2.78 3.09 3.46 3.89 4.43 5.09 7.05 redshift
Halo 853, 3.13e+12
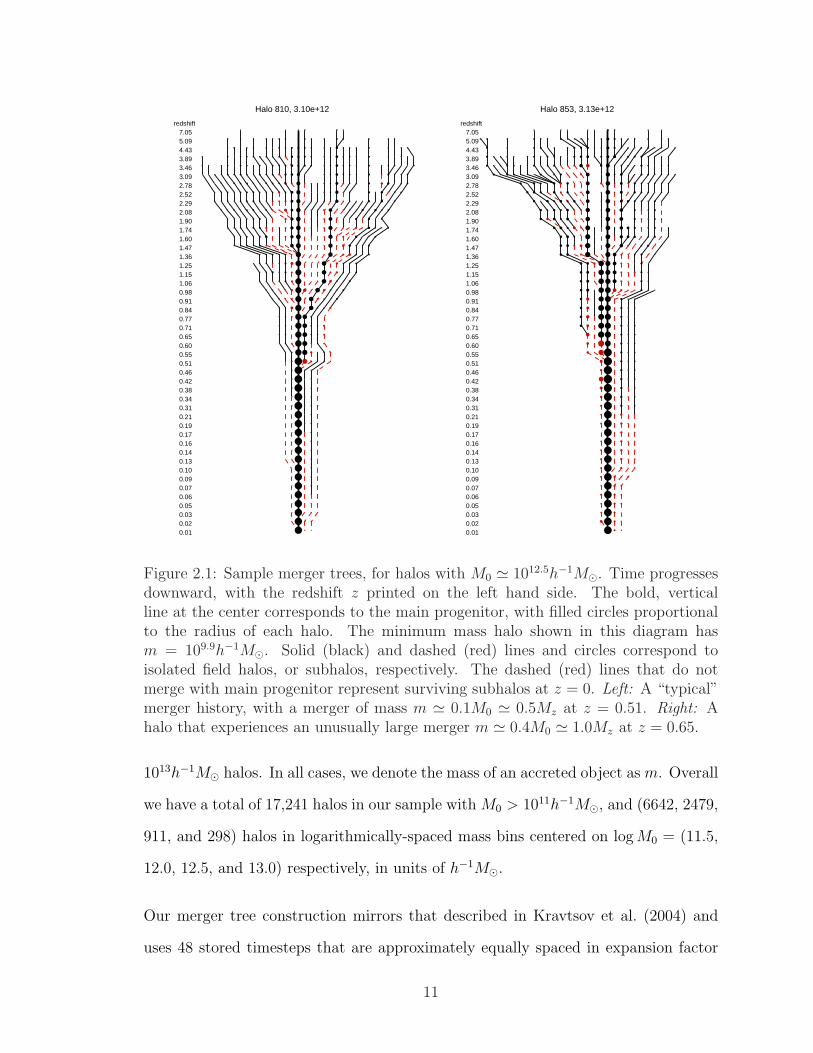
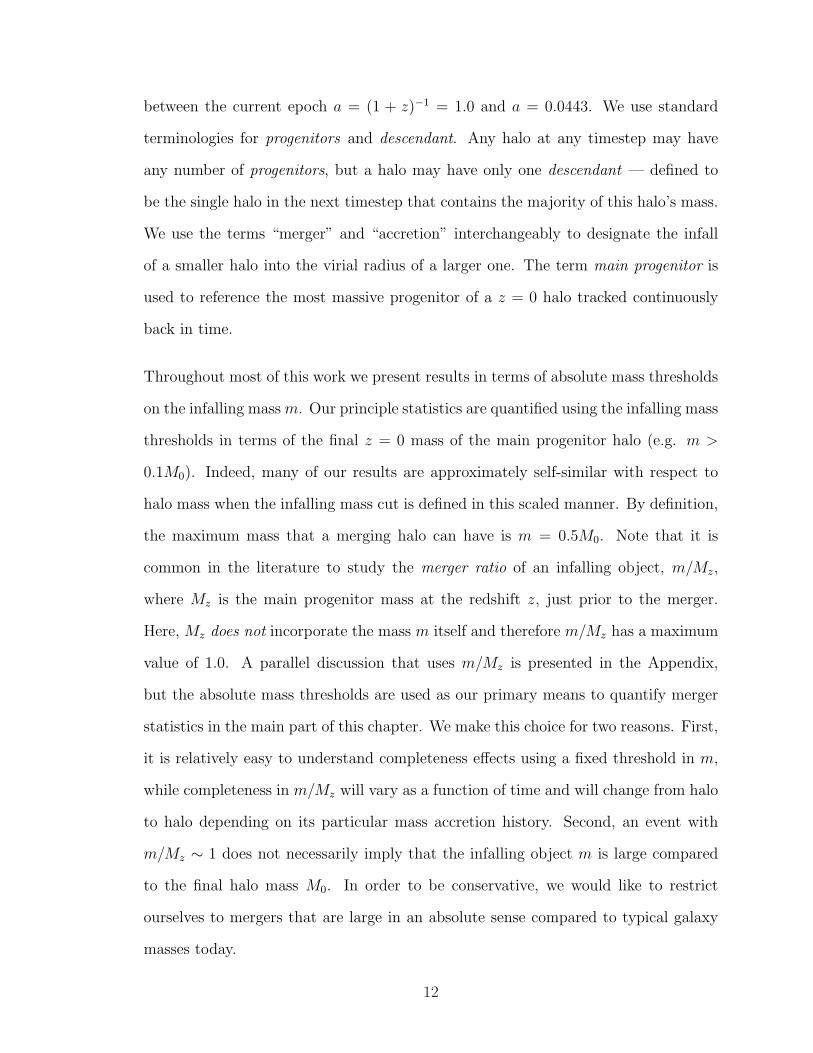
Figure 2.1: Sample merger trees, for halos with M0 ' 1012.5h−1M¯. Time progressesdownward, with the redshift z printed on the left hand side. The bold, verticalline at the center corresponds to the main progenitor, with filled circles proportionalto the radius of each halo. The minimum mass halo shown in this diagram hasm = 109.9h−1M¯. Solid (black) and dashed (red) lines and circles correspond toisolated field halos, or subhalos, respectively. The dashed (red) lines that do notmerge with main progenitor represent surviving subhalos at z = 0. Left: A “typical”merger history, with a merger of mass m ' 0.1M0 ' 0.5Mz at z = 0.51. Right: Ahalo that experiences an unusually large merger m ' 0.4M0 ' 1.0Mz at z = 0.65.
1013h−1M¯ halos. In all cases, we denote the mass of an accreted object as m. Overall
we have a total of 17,241 halos in our sample with M0 > 1011h−1M¯, and (6642, 2479,
911, and 298) halos in logarithmically-spaced mass bins centered on log M0 = (11.5,
12.0, 12.5, and 13.0) respectively, in units of h−1M¯.
Our merger tree construction mirrors that described in Kravtsov et al. (2004) and
uses 48 stored timesteps that are approximately equally spaced in expansion factor
11
between the current epoch a = (1 + z)−1 = 1.0 and a = 0.0443. We use standard
terminologies for progenitors and descendant. Any halo at any timestep may have
any number of progenitors, but a halo may have only one descendant — defined to
be the single halo in the next timestep that contains the majority of this halo’s mass.
We use the terms “merger” and “accretion” interchangeably to designate the infall
of a smaller halo into the virial radius of a larger one. The term main progenitor is
used to reference the most massive progenitor of a z = 0 halo tracked continuously
back in time.
Throughout most of this work we present results in terms of absolute mass thresholds
on the infalling mass m. Our principle statistics are quantified using the infalling mass
thresholds in terms of the final z = 0 mass of the main progenitor halo (e.g. m >
0.1M0). Indeed, many of our results are approximately self-similar with respect to
halo mass when the infalling mass cut is defined in this scaled manner. By definition,
the maximum mass that a merging halo can have is m = 0.5M0. Note that it is
common in the literature to study the merger ratio of an infalling object, m/Mz,
where Mz is the main progenitor mass at the redshift z, just prior to the merger.
Here, Mz does not incorporate the mass m itself and therefore m/Mz has a maximum
value of 1.0. A parallel discussion that uses m/Mz is presented in the Appendix,
but the absolute mass thresholds are used as our primary means to quantify merger
statistics in the main part of this chapter. We make this choice for two reasons. First,
it is relatively easy to understand completeness effects using a fixed threshold in m,
while completeness in m/Mz will vary as a function of time and will change from halo
to halo depending on its particular mass accretion history. Second, an event with
m/Mz ∼ 1 does not necessarily imply that the infalling object m is large compared
to the final halo mass M0. In order to be conservative, we would like to restrict
ourselves to mergers that are large in an absolute sense compared to typical galaxy
masses today.
12
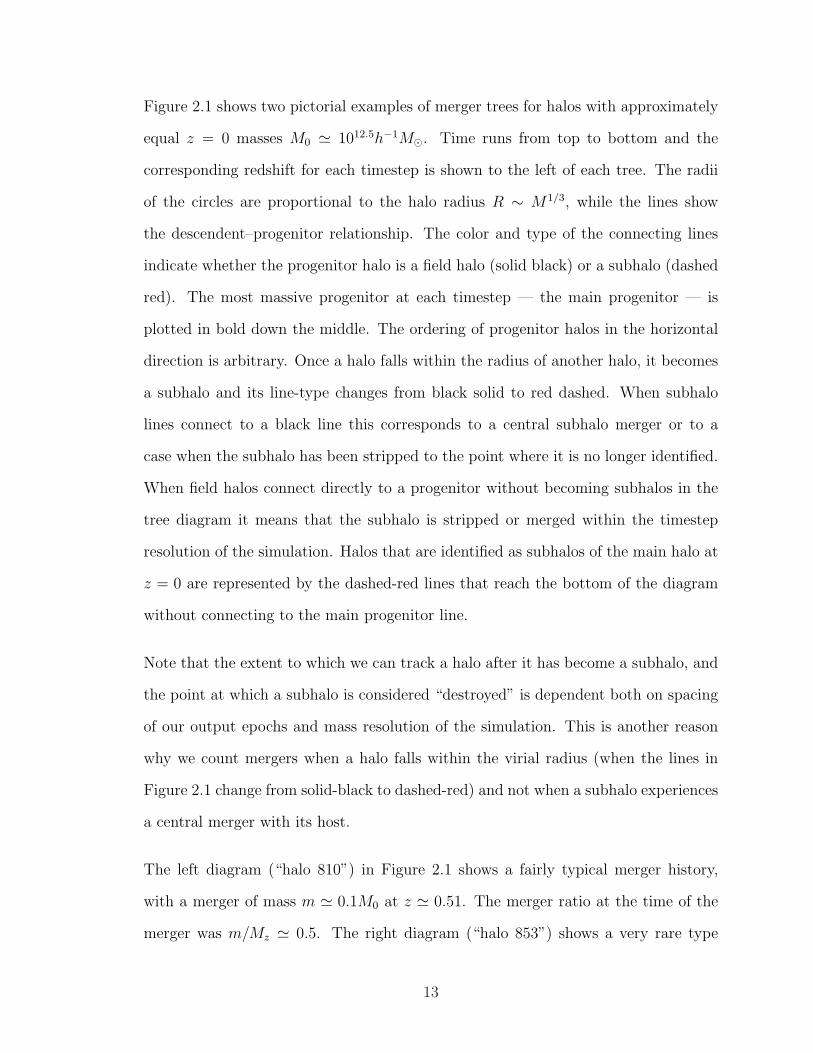
Figure 2.1 shows two pictorial examples of merger trees for halos with approximately
equal z = 0 masses M0 ' 1012.5h−1M¯. Time runs from top to bottom and the
corresponding redshift for each timestep is shown to the left of each tree. The radii
of the circles are proportional to the halo radius R ∼ M1/3, while the lines show
the descendent–progenitor relationship. The color and type of the connecting lines
indicate whether the progenitor halo is a field halo (solid black) or a subhalo (dashed
red). The most massive progenitor at each timestep — the main progenitor — is
plotted in bold down the middle. The ordering of progenitor halos in the horizontal
direction is arbitrary. Once a halo falls within the radius of another halo, it becomes
a subhalo and its line-type changes from black solid to red dashed. When subhalo
lines connect to a black line this corresponds to a central subhalo merger or to a
case when the subhalo has been stripped to the point where it is no longer identified.
When field halos connect directly to a progenitor without becoming subhalos in the
tree diagram it means that the subhalo is stripped or merged within the timestep
resolution of the simulation. Halos that are identified as subhalos of the main halo at
z = 0 are represented by the dashed-red lines that reach the bottom of the diagram
without connecting to the main progenitor line.
Note that the extent to which we can track a halo after it has become a subhalo, and
the point at which a subhalo is considered “destroyed” is dependent both on spacing
of our output epochs and mass resolution of the simulation. This is another reason
why we count mergers when a halo falls within the virial radius (when the lines in
Figure 2.1 change from solid-black to dashed-red) and not when a subhalo experiences
a central merger with its host.
The left diagram (“halo 810”) in Figure 2.1 shows a fairly typical merger history,
with a merger of mass m ' 0.1M0 at z ' 0.51. The merger ratio at the time of the
merger was m/Mz ' 0.5. The right diagram (“halo 853”) shows a very rare type
13
of merger history with a massive event m ' 0.4M0 at z ' 0.65. This was a nearly
equal-mass accretion event at the time of the merger, m/Mz ' 1.0. Note that neither
of these large mergers survive for long as resolved subhalos — they quickly lose mass
and merge with the central halo. Each of these halos has two ∼ 1010h−1M¯ subhalos
that survive at z = 0.
Figure 2.2: Average mass accretion histories for three bins in halo mass, as a functionof lookback time. Each bin gives the average for bins of size logM0 = 0.5, centeredon the stated value. More massive halos accreted a larger fraction of their mass atlate times.
14
2.4 Results
2.4.1 Accretion Histories and Mass Functions
The literature is rich with work on the cumulative mass accretion histories of halos
as a function of redshift (e.g Wechsler et al., 2002; Zhao et al., 2003; Tasitsiomi et al.,
2004; Li et al., 2007, and references therein). We begin by re-examining this topic for
the sake of completeness. Figure 2.2 shows average main progenitor mass accretion
histories, Mz = M(z), for halos of three characteristic final masses, M0 = M(z =
0). We confirm previous results that halo mass accretion histories are characterized
by an initial rapid accretion phase followed by a slower accretion phase, and that
more massive halos experience the rapid accretion phase later than less massive halos
(Wechsler et al., 2002). Milky Way-sized halos with M0 = 1012h−1M¯ will, on average,
accrete half of their mass by z ' 1.3, corresponding to a lookback time of ∼ 8.6 Gyr.
While Figure 2.2 provides some insight into when mass is accreted into halos, we
are also interested in characterizing how this mass is accreted. (Ultimately, we will
present merger statistics for a joint distribution of both time and mass ratio.) Now
we investigate the mass function n(m) of objects larger than m that have merged
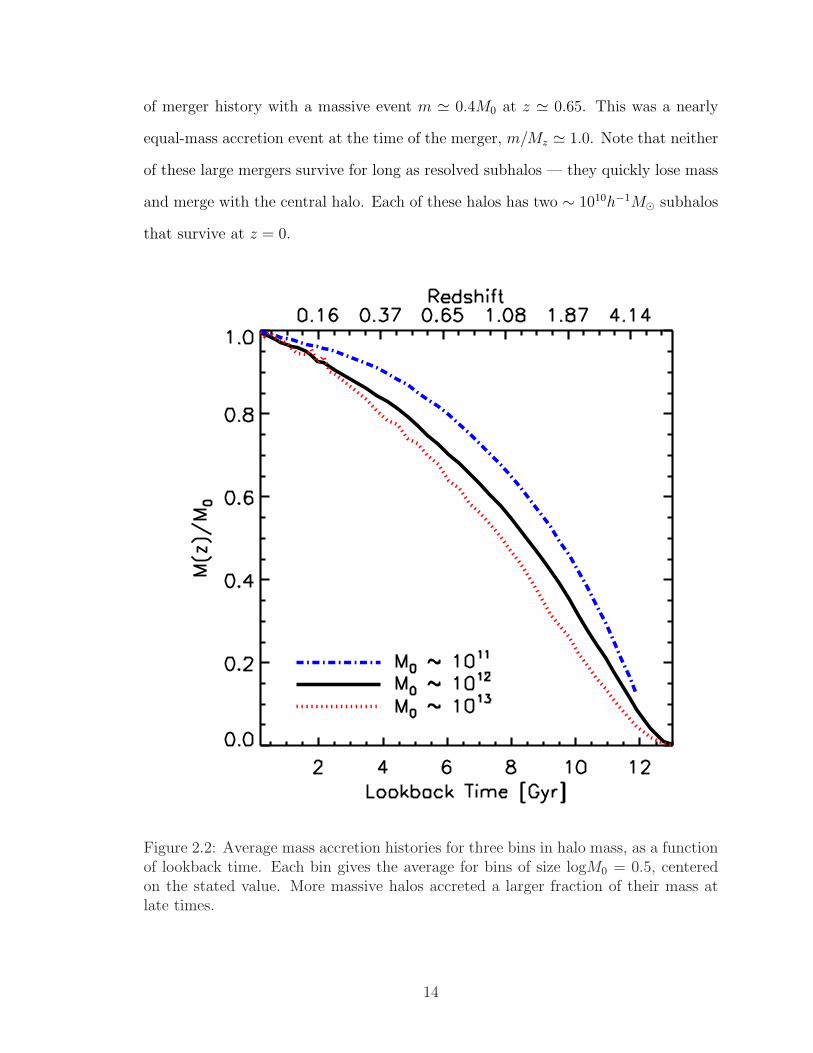
into the main progenitor over its history. The solid line in Figure 2.3 shows n(m)
averaged over halos in the M0 = 1012h−1M¯ bin, plotted as a function of m/M0.
On average, Milky Way-sized halos with M0 ' 1012h−1M¯ experience ∼ 1 merger
with objects larger than m ∼ 1011h−1M¯, and ∼ 7 mergers with objects larger than
m ∼ 1010h−1M¯ over the course of their lives.
For some purposes, an analytic characterization of the accreted mass function will be
useful. We have investigated the average n(m) function for halos in the mass range
M0 = 1011.5 − 1013h−1M¯ and find that the shape of this function is remarkably
15
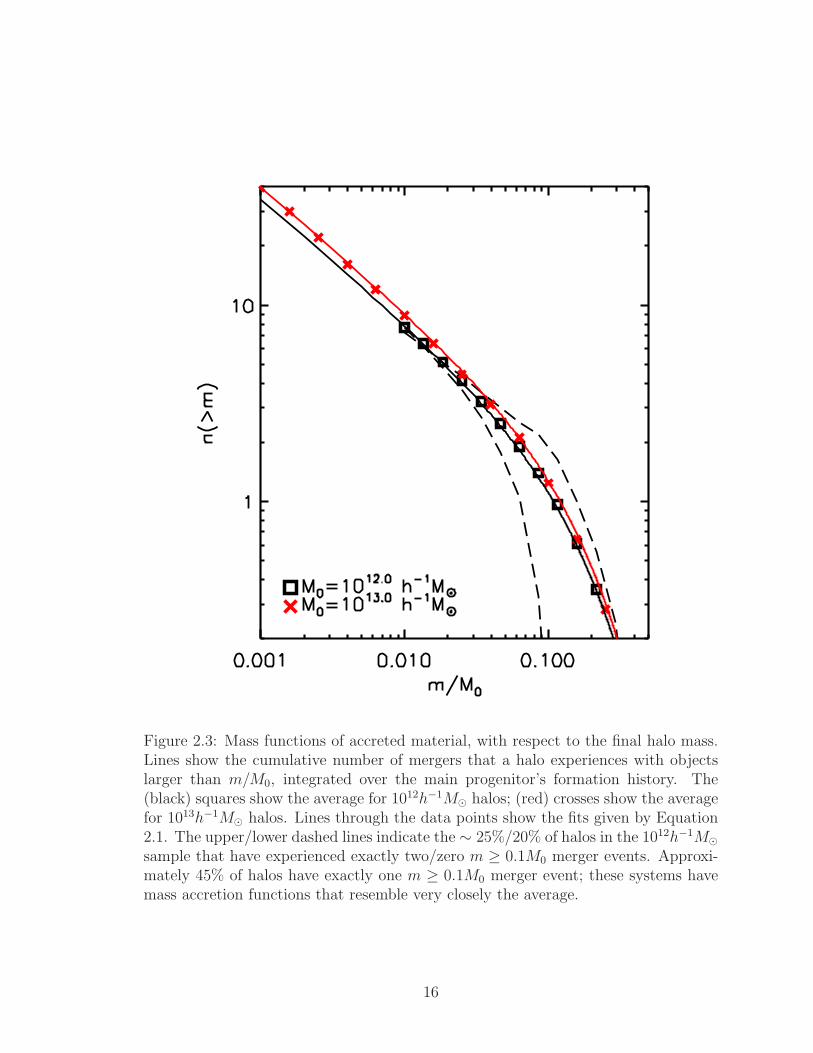
Figure 2.3: Mass functions of accreted material, with respect to the final halo mass.Lines show the cumulative number of mergers that a halo experiences with objectslarger than m/M0, integrated over the main progenitor’s formation history. The(black) squares show the average for 1012h−1M¯ halos; (red) crosses show the averagefor 1013h−1M¯ halos. Lines through the data points show the fits given by Equation2.1. The upper/lower dashed lines indicate the ∼ 25%/20% of halos in the 1012h−1M¯sample that have experienced exactly two/zero m ≥ 0.1M0 merger events. Approxi-mately 45% of halos have exactly one m ≥ 0.1M0 merger event; these systems havemass accretion functions that resemble very closely the average.
16
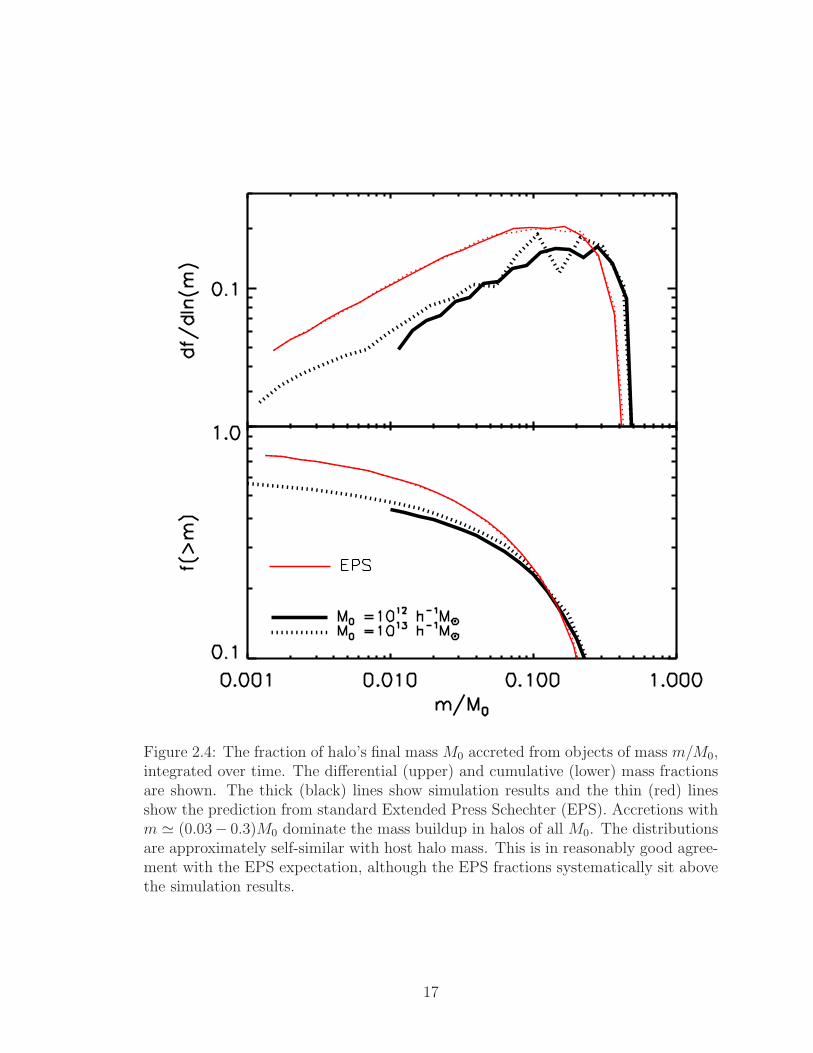
Figure 2.4: The fraction of halo’s final mass M0 accreted from objects of mass m/M0,integrated over time. The differential (upper) and cumulative (lower) mass fractionsare shown. The thick (black) lines show simulation results and the thin (red) linesshow the prediction from standard Extended Press Schechter (EPS). Accretions withm ' (0.03− 0.3)M0 dominate the mass buildup in halos of all M0. The distributionsare approximately self-similar with host halo mass. This is in reasonably good agree-ment with the EPS expectation, although the EPS fractions systematically sit abovethe simulation results.
17
similar over this range (smaller M0 were neglected in order to achieve a reasonable
range in m/M0). Specifically, we find that n(m) is well-characterized by a simple
function of x ≡ m/M0:
n(> x) = Ax−α (0.5− x)β, (2.3)
with β = 2.3, α = 0.61, and x ≤ 0.5 by construction. Interestingly, we find that the
overall normalization increases monotonically with halo mass, and that the trend
can be approximated as A(M0) ' 0.47 log10(M0) − 3.2, where M0 is in units of
h−1M¯. This mass-dependent normalization, together with Equation 2.3, reproduces
our measured n(m) functions quite well — to better than 5% at all m in smaller
halos (M0 = 1011.5 − 1012h−1M¯), and (somewhat worse) to 15% at higher masses
(M0 = 1012.5 − 1013h−1M¯). 1
We would also like to understand the scatter in the accreted mass function from halo
to halo at fixed M0. It is not appropriate to simply describe the variation in n(m) at a
fixed mass, because the total mass accreted is constrained to integrate to less than M0.
This means that the number of small objects accreted may be anti-correlated with
the number of large objects accreted. With this in mind, we provide an illustration
of the scatter with the two dashed lines in Figure 2.3. The upper dashed line shows
the average n(m) for the ∼ 25% of halos that have experienced exactly two accretion
events larger than m = 0.1M0. The lower dashed line shows the average n(m) for
the ∼ 20% of halos that have experienced exactly zero m > 0.1M0 accretion events.
Approximately ∼ 45% of halos have exactly one m > 0.1M0 event, and these have an
average accreted mass function that is very similar to the overall average shown by
solid (black) line in Figure 2.3. Halos with fewer large mergers show a slight tendency
to have more small mergers, but the effect is not large.
1The quoted errors are restricted to n > 0.05.
18
Figure 2.4 presents some of the same information shown in Figure 2.3, but now in
terms of the mass fraction, f(m), accreted in objects larger than m for M0 = 1012
and 1013h−1M¯ halos (thick lines, see legend). The upper panel in Figure 2.3 shows
the differential fraction, df/d ln m = (−m2/M0)dn/dm, while the lower panel plots
the integrated fraction f(m). As before, we have normalized the accreted masses, m,
by the final z = 0 main progenitor mass M0. We find that f(> m) is also well fit
by Equation 2.3 (to better than 10% across all masses M0 = 1012 − 1014h−1M¯)2.
As before, x ≡ m/M0, but now A(M0) ' 0.17 log10(M0) − 0.36, with M0 still in
units of h−1M¯. The best fit parameters are α = 0.05, and β = 2.3. The lines are
truncated at m/M0 = 0.01 and 0.001, corresponding to our fixed resolution limit at
m = 1010h−1M¯. The thin (red) lines of the same line types show the same quantities
predicted from Extended Press Schechter (EPS Lacey & Cole, 1993) Monte-Carlo
merger trees. Each of these lines is based on 5000 trees generated using the Somerville
& Kolatt (1999) algorithm.
In broad terms, the mass spectrum of accreted objects agrees fairly well with the EPS
expectations, especially considering the relative ambiguity associated with defining
halo masses in simulations (e.g. Cohn & White, 2008; Diemand et al., 2007; Cuesta
et al., 2008). However, it is worth discussing the similarities and differences in some
detail. It is a well-known expectation from EPS that the total mass accreted into a
halo of mass M0 is dominated by objects of mass m ∼ 0.1M0 (Lacey & Cole, 1993;
Zentner & Bullock, 2003; Purcell et al., 2007; Zentner, 2007). Our simulations reveal
that indeed m ' (0.03 − 0.3)M0 objects are the most important contributors to the
final halo mass.
EPS trees predict self-similar mass fractions across all halo masses. Our more massive
halos, however, show a slight tendency to have more of their mass accreted in collapsed
2The quoted errors are restricted to f > 0.1.
19
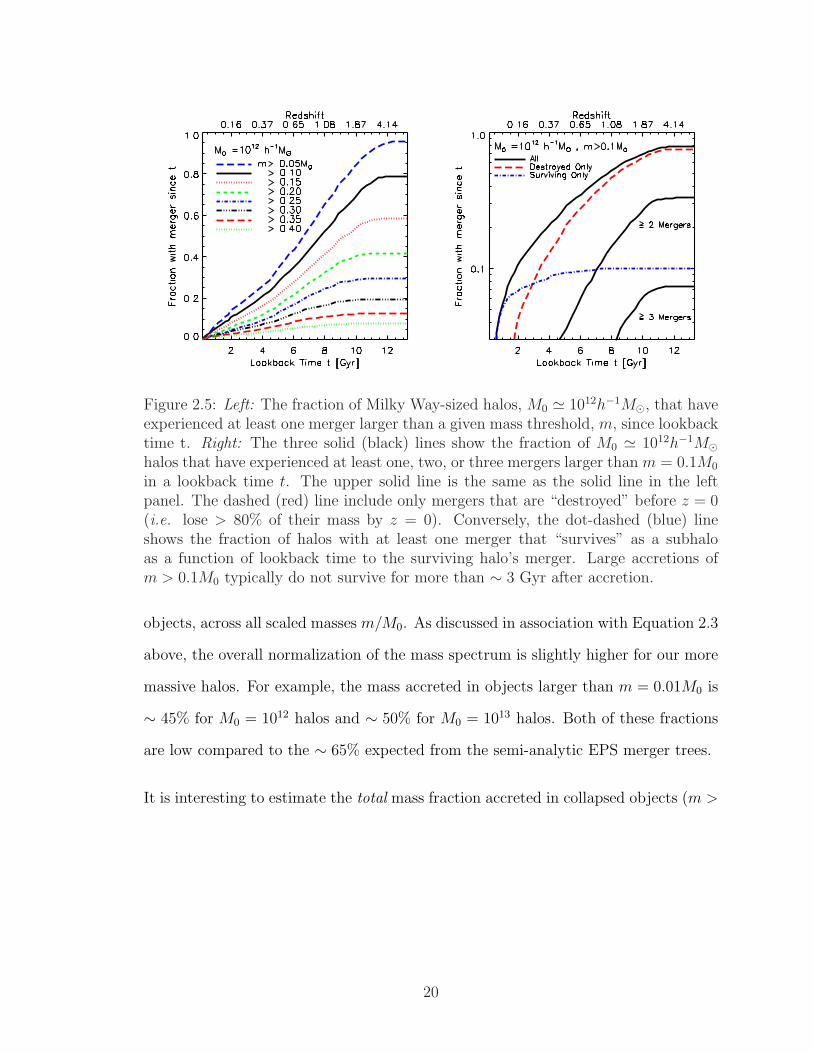
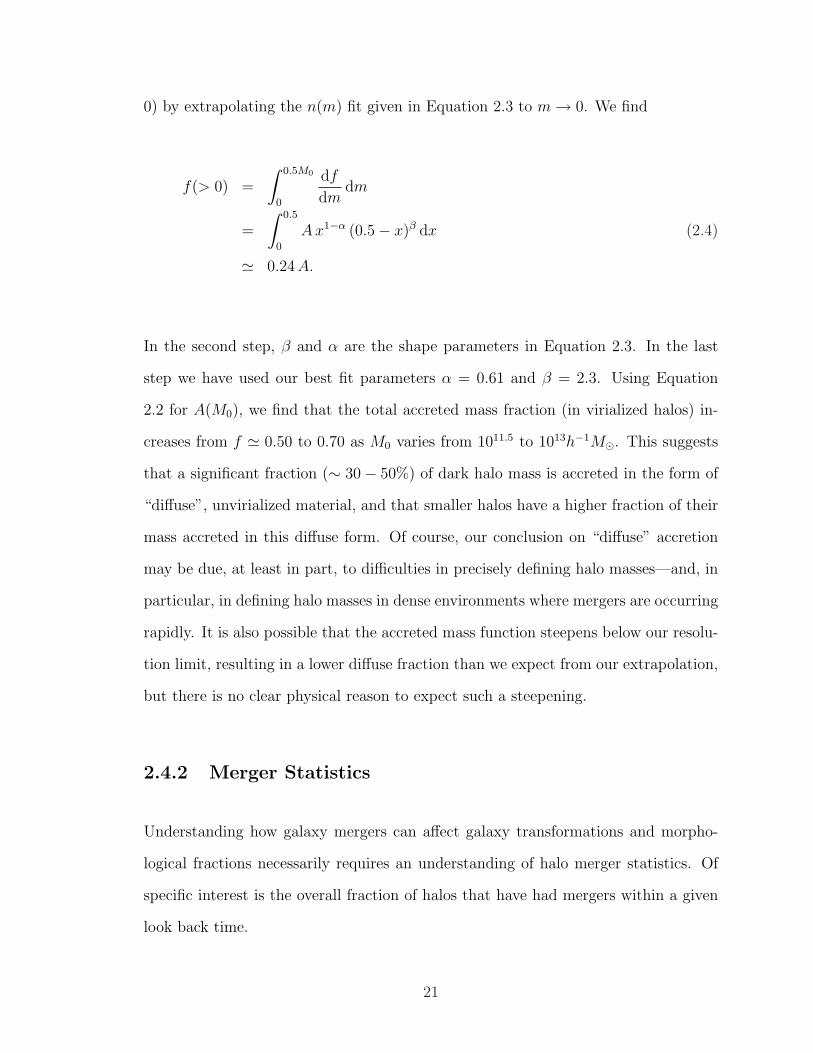
Figure 2.5: Left: The fraction of Milky Way-sized halos, M0 ' 1012h−1M¯, that haveexperienced at least one merger larger than a given mass threshold, m, since lookbacktime t. Right: The three solid (black) lines show the fraction of M0 ' 1012h−1M¯halos that have experienced at least one, two, or three mergers larger than m = 0.1M0
in a lookback time t. The upper solid line is the same as the solid line in the leftpanel. The dashed (red) line include only mergers that are “destroyed” before z = 0(i.e. lose > 80% of their mass by z = 0). Conversely, the dot-dashed (blue) lineshows the fraction of halos with at least one merger that “survives” as a subhaloas a function of lookback time to the surviving halo’s merger. Large accretions ofm > 0.1M0 typically do not survive for more than ∼ 3 Gyr after accretion.
objects, across all scaled masses m/M0. As discussed in association with Equation 2.3
above, the overall normalization of the mass spectrum is slightly higher for our more
massive halos. For example, the mass accreted in objects larger than m = 0.01M0 is
∼ 45% for M0 = 1012 halos and ∼ 50% for M0 = 1013 halos. Both of these fractions
are low compared to the ∼ 65% expected from the semi-analytic EPS merger trees.
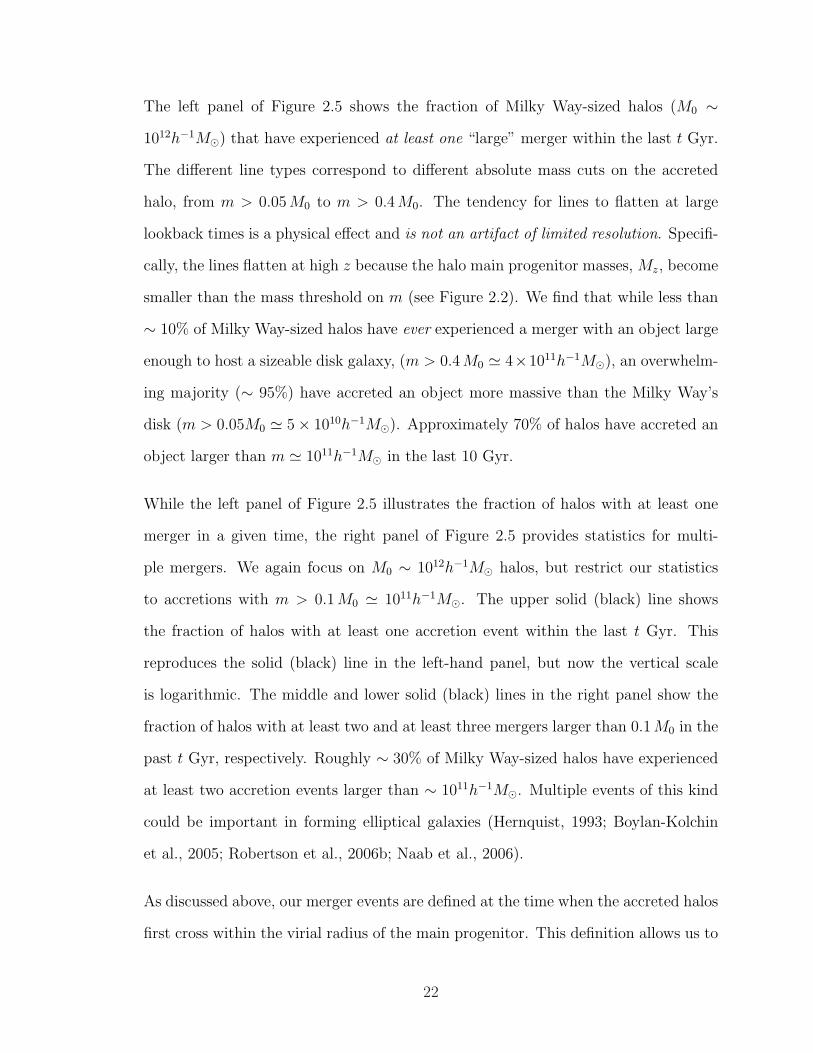
It is interesting to estimate the total mass fraction accreted in collapsed objects (m >
20
0) by extrapolating the n(m) fit given in Equation 2.3 to m → 0. We find
f(> 0) =
∫ 0.5M0
0
df
dmdm
=
∫ 0.5
0
Ax1−α (0.5− x)β dx (2.4)
' 0.24 A.
In the second step, β and α are the shape parameters in Equation 2.3. In the last
step we have used our best fit parameters α = 0.61 and β = 2.3. Using Equation
2.2 for A(M0), we find that the total accreted mass fraction (in virialized halos) in-
creases from f ' 0.50 to 0.70 as M0 varies from 1011.5 to 1013h−1M¯. This suggests
that a significant fraction (∼ 30− 50%) of dark halo mass is accreted in the form of
“diffuse”, unvirialized material, and that smaller halos have a higher fraction of their
mass accreted in this diffuse form. Of course, our conclusion on “diffuse” accretion
may be due, at least in part, to difficulties in precisely defining halo masses—and, in
particular, in defining halo masses in dense environments where mergers are occurring
rapidly. It is also possible that the accreted mass function steepens below our resolu-
tion limit, resulting in a lower diffuse fraction than we expect from our extrapolation,
but there is no clear physical reason to expect such a steepening.
2.4.2 Merger Statistics
Understanding how galaxy mergers can affect galaxy transformations and morpho-
logical fractions necessarily requires an understanding of halo merger statistics. Of
specific interest is the overall fraction of halos that have had mergers within a given
look back time.
21
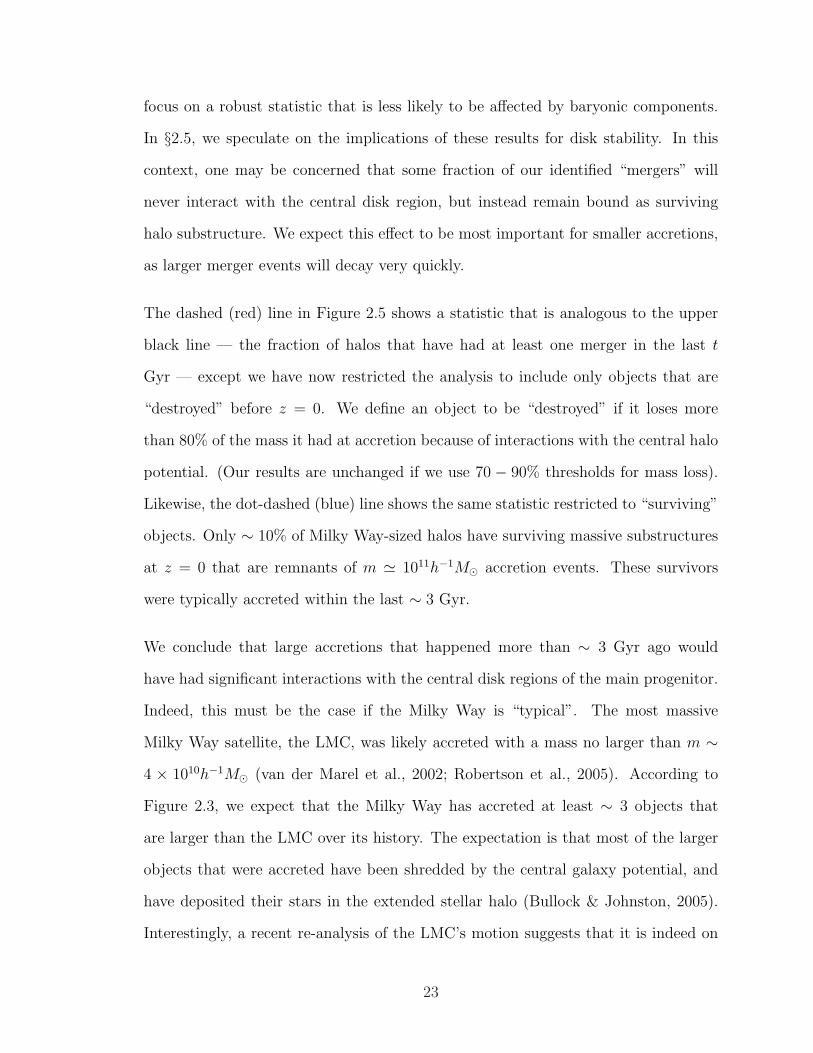
The left panel of Figure 2.5 shows the fraction of Milky Way-sized halos (M0 ∼1012h−1M¯) that have experienced at least one “large” merger within the last t Gyr.
The different line types correspond to different absolute mass cuts on the accreted
halo, from m > 0.05 M0 to m > 0.4 M0. The tendency for lines to flatten at large
lookback times is a physical effect and is not an artifact of limited resolution. Specifi-
cally, the lines flatten at high z because the halo main progenitor masses, Mz, become
smaller than the mass threshold on m (see Figure 2.2). We find that while less than
∼ 10% of Milky Way-sized halos have ever experienced a merger with an object large
enough to host a sizeable disk galaxy, (m > 0.4 M0 ' 4×10¹¹h−1M¯), an overwhelm-
ing majority (∼ 95%) have accreted an object more massive than the Milky Way’s
disk (m > 0.05M0 ' 5× 10¹⁰h−1M¯). Approximately 70% of halos have accreted an
object larger than m ' 1011h−1M¯ in the last 10 Gyr.
While the left panel of Figure 2.5 illustrates the fraction of halos with at least one
merger in a given time, the right panel of Figure 2.5 provides statistics for multi-
ple mergers. We again focus on M0 ∼ 1012h−1M¯ halos, but restrict our statistics
to accretions with m > 0.1 M0 ' 1011h−1M¯. The upper solid (black) line shows
the fraction of halos with at least one accretion event within the last t Gyr. This
reproduces the solid (black) line in the left-hand panel, but now the vertical scale
is logarithmic. The middle and lower solid (black) lines in the right panel show the
fraction of halos with at least two and at least three mergers larger than 0.1 M0 in the
past t Gyr, respectively. Roughly ∼ 30% of Milky Way-sized halos have experienced
at least two accretion events larger than ∼ 1011h−1M¯. Multiple events of this kind
could be important in forming elliptical galaxies (Hernquist, 1993; Boylan-Kolchin
et al., 2005; Robertson et al., 2006b; Naab et al., 2006).
As discussed above, our merger events are defined at the time when the accreted halos
first cross within the virial radius of the main progenitor. This definition allows us to
22
focus on a robust statistic that is less likely to be affected by baryonic components.
In §2.5, we speculate on the implications of these results for disk stability. In this
context, one may be concerned that some fraction of our identified “mergers” will
never interact with the central disk region, but instead remain bound as surviving
halo substructure. We expect this effect to be most important for smaller accretions,
as larger merger events will decay very quickly.
The dashed (red) line in Figure 2.5 shows a statistic that is analogous to the upper
black line — the fraction of halos that have had at least one merger in the last t
Gyr — except we have now restricted the analysis to include only objects that are
“destroyed” before z = 0. We define an object to be “destroyed” if it loses more
than 80% of the mass it had at accretion because of interactions with the central halo
potential. (Our results are unchanged if we use 70 − 90% thresholds for mass loss).
Likewise, the dot-dashed (blue) line shows the same statistic restricted to “surviving”
objects. Only ∼ 10% of Milky Way-sized halos have surviving massive substructures
at z = 0 that are remnants of m ' 1011h−1M¯ accretion events. These survivors
were typically accreted within the last ∼ 3 Gyr.
We conclude that large accretions that happened more than ∼ 3 Gyr ago would
have had significant interactions with the central disk regions of the main progenitor.
Indeed, this must be the case if the Milky Way is “typical”. The most massive
Milky Way satellite, the LMC, was likely accreted with a mass no larger than m ∼4 × 10¹⁰h−1M¯ (van der Marel et al., 2002; Robertson et al., 2005). According to
Figure 2.3, we expect that the Milky Way has accreted at least ∼ 3 objects that
are larger than the LMC over its history. The expectation is that most of the larger
objects that were accreted have been shredded by the central galaxy potential, and
have deposited their stars in the extended stellar halo (Bullock & Johnston, 2005).
Interestingly, a recent re-analysis of the LMC’s motion suggests that it is indeed on
23
its first passage about the Milky Way (Besla et al., 2007), as we would expect for
surviving, massive satellites.
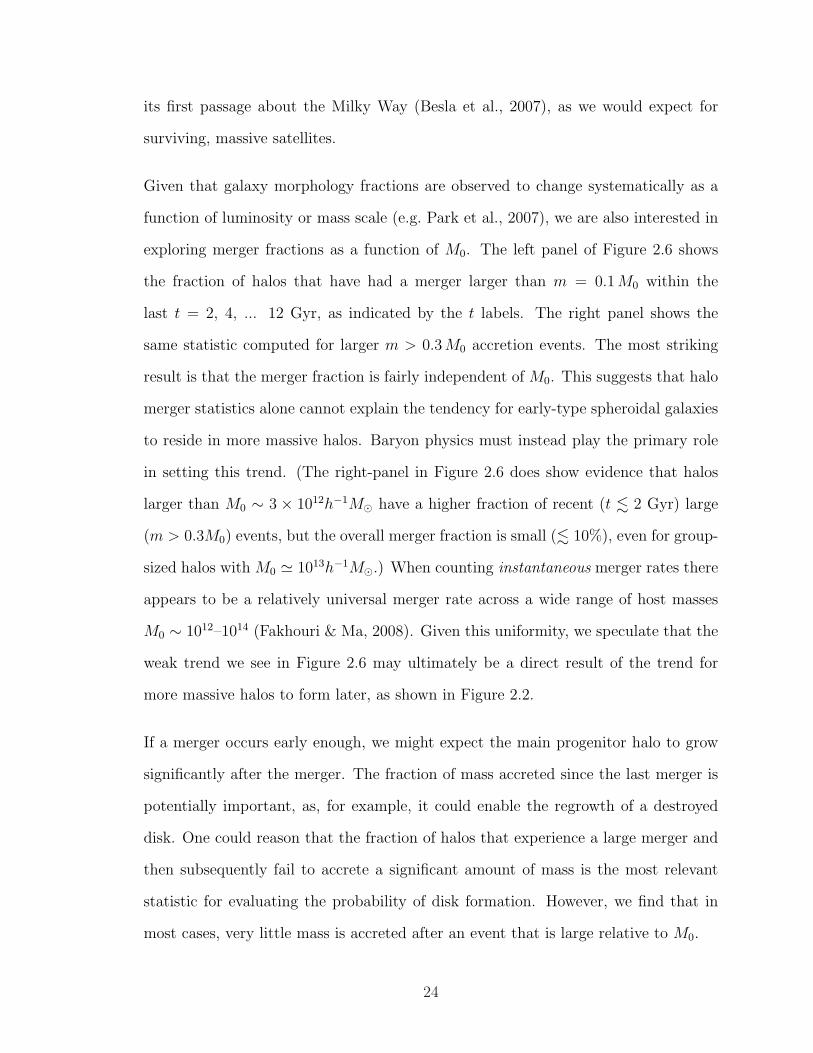
Given that galaxy morphology fractions are observed to change systematically as a
function of luminosity or mass scale (e.g. Park et al., 2007), we are also interested in
exploring merger fractions as a function of M0. The left panel of Figure 2.6 shows
the fraction of halos that have had a merger larger than m = 0.1 M0 within the
last t = 2, 4, ... 12 Gyr, as indicated by the t labels. The right panel shows the
same statistic computed for larger m > 0.3 M0 accretion events. The most striking
result is that the merger fraction is fairly independent of M0. This suggests that halo
merger statistics alone cannot explain the tendency for early-type spheroidal galaxies
to reside in more massive halos. Baryon physics must instead play the primary role
in setting this trend. (The right-panel in Figure 2.6 does show evidence that halos
larger than M0 ∼ 3 × 10¹²h−1M¯ have a higher fraction of recent (t . 2 Gyr) large
(m > 0.3M0) events, but the overall merger fraction is small (. 10%), even for group-
sized halos with M0 ' 1013h−1M¯.) When counting instantaneous merger rates there
appears to be a relatively universal merger rate across a wide range of host masses
M0 ∼ 1012–1014 (Fakhouri & Ma, 2008). Given this uniformity, we speculate that the
weak trend we see in Figure 2.6 may ultimately be a direct result of the trend for
more massive halos to form later, as shown in Figure 2.2.
If a merger occurs early enough, we might expect the main progenitor halo to grow
significantly after the merger. The fraction of mass accreted since the last merger is
potentially important, as, for example, it could enable the regrowth of a destroyed
disk. One could reason that the fraction of halos that experience a large merger and
then subsequently fail to accrete a significant amount of mass is the most relevant
statistic for evaluating the probability of disk formation. However, we find that in
most cases, very little mass is accreted after an event that is large relative to M0.
24
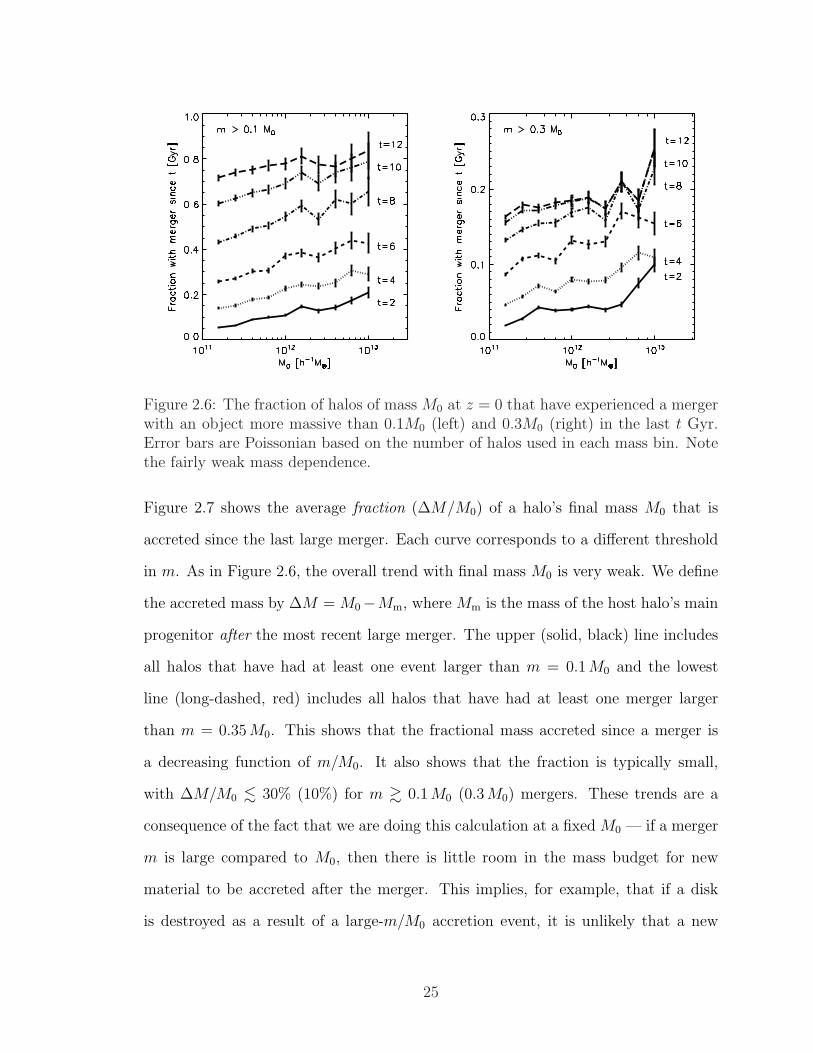
Figure 2.6: The fraction of halos of mass M0 at z = 0 that have experienced a mergerwith an object more massive than 0.1M0 (left) and 0.3M0 (right) in the last t Gyr.Error bars are Poissonian based on the number of halos used in each mass bin. Notethe fairly weak mass dependence.
Figure 2.7 shows the average fraction (∆M/M0) of a halo’s final mass M0 that is
accreted since the last large merger. Each curve corresponds to a different threshold
in m. As in Figure 2.6, the overall trend with final mass M0 is very weak. We define
the accreted mass by ∆M = M0−Mm, where Mm is the mass of the host halo’s main
progenitor after the most recent large merger. The upper (solid, black) line includes
all halos that have had at least one event larger than m = 0.1 M0 and the lowest
line (long-dashed, red) includes all halos that have had at least one merger larger
than m = 0.35 M0. This shows that the fractional mass accreted since a merger is
a decreasing function of m/M0. It also shows that the fraction is typically small,
with ∆M/M0 . 30% (10%) for m & 0.1 M0 (0.3 M0) mergers. These trends are a
consequence of the fact that we are doing this calculation at a fixed M0 — if a merger
m is large compared to M0, then there is little room in the mass budget for new
material to be accreted after the merger. This implies, for example, that if a disk
is destroyed as a result of a large-m/M0 accretion event, it is unlikely that a new
25
“disk-dominated” system can be regrown from material that is accreted into the host
halo after the merger. However, gaseous material involved in the merger may re-form
a disk (see e.g. Zurek et al., 1988; Robertson et al., 2006b).
2.5 Discussion
2.5.1 Milky Way Comparison
The Milky Way has a dark matter halo of mass M0 ' 1012h−1M¯ (Klypin et al.,
2002), and its stellar mass is dominated by a thin disk of mass ' 3.5 × 10¹⁰M¯
(Klypin et al., 2002; Widrow & Dubinski, 2005). The thin disk has vertical scale
height that is just ∼ 10% of its radial scale length (Siegel et al., 2002; Juric et. al,
2008; Newberg et al., 2006), and contains stars as old as ∼ 10 Gyr (Nordstrom et al.,
2004). Moreover, stars in the local thick disk are predominantly older than ∼ 10
Gyr, and the bulge is old as well. This suggests that there was not significant merger
activity in the Milky Way to drive gas towards the bulge or to thicken the disk in the
past ∼ 10 Gyr (Wyse, 2001).
Based on our results, a galaxy like the Milky Way would seem rare in a ΛCDM uni-
verse. Roughly 70% of dark matter halos of mass M0 ' 1012h−1M¯ have experienced
a merger with a halo of mass 1011h−1M¯ in the past ∼ 10 Gyr. A merger of this size
should thicken the existing disk and drive gas into the center of the galaxy to create
a bulge (Kazantzidis et al., 2008). If the Milky Way has not experienced a merger
of this magnitude, that would make our galaxy a rare occurrence (. 30% of halos).
On the other hand, if the Milky Way has experienced such a merger, it is difficult to
understand its observed late-type morphology and thin-disk properties.
26
2.5.2 Morphological Fractions and Thick Disks
The degree to which the Milky Way halo is typical for its mass is becoming better
understood thanks to the advent of large, homogeneous astronomical sky surveys. As
mentioned in the introduction, broad-brush categorizations of “late type” vs. “early
type” suggest that ∼ 70% of Milky Way-sized halos host late-type galaxies (e.g.
Weinmann et al., 2006; van den Bosch et al., 2007; Ilbert et al., 2006; Choi et al.,
2007; Park et al., 2007). The degree to which “late-type” is synonymous with “thin
disk-dominated” is difficult to quantify with current data sets, but for the sake of
this discussion, we will assume that this is the case. Also discussed earlier were the
results of Kautsch et al. (2006), who found that ∼ 16% of disk galaxies are bulgeless
systems. This suggests that ∼ (0.7)(0.16) ∼ 11% of Milky Way-sized halos host pure
disk galaxies.
The observed morphological fractions may be compared to the halo merger fractions
presented in Figure 2.5. These results show that an overwhelming majority of Milky
Way-sized halos (∼ 95%) experience at least one merger larger than the current
mass of the Milky Way disk (& 5 × 10¹⁰h−1M¯). Figure 2.3 shows that a typical
M0 ' 1012h−1M¯ halo has merged with ∼ 2−3 objects of this size over its history. It
is possible that mergers of this characteristic mass are responsible for creating thick
disk components in most galaxies (Walker et al., 1996; Dalcanton & Bernstein, 2002).
More detailed simulations will be required to test whether disks are destroyed or
overly thickened by the predicted infall of m ∼ 5× 10¹⁰h−1M¯ objects, and whether
these thickening events happen too late to explain thick disks as old as those observed
(Dalcanton & Bernstein, 2002). Understanding how bulgeless galaxies could exist in
halos with mergers of this kind is a more difficult puzzle.
Perhaps more disturbing for the survival of thin disks are the statistics of more sub-
27

Figure 2.7: The average fractional change in a halo’s main progenitor mass ∆M/M0
since its last large merger, shown as a function of the halo’s z = 0 mass M0. Each lineincludes only halos that have had a merger larger than the m value indicated (i.e.only halos that have had a m > 0.35M0 accretion event are included in the lowestline). Error bars shown are Poisson on the number of halos used in the average.
stantial merger events. Figure 2.5 shows that m & 1011h−1M¯ accretions are quite
common in Milky Way-sized halos, with ∼ 70% of M0 ' 1012h−1M¯ objects experi-
encing such a merger in the past ∼ 10 Gyr. Of course, the impact that these events
will have on a central disk will depend on orbital properties, gas fractions, and star
formation in the merging systems. Generally, however, a merger with an object ∼ 4
28
times as massive as the Milky Way thin disk would seem problematic for its survival.
We find that a small fraction of a halo’s final mass is typically accreted into the main
progenitor subsequent to m ∼ 0.1M0 mergers — this suggests that the regrowth
of a dominant disk from material accreted after such a merger will be difficult (see
Figure 2.7). We conclude that if ∼ 70% of Milky Way-sized halos contain disk-
dominated galaxies, and if the adopted ΛCDM cosmology is the correct one, then
mergers involving m ' 1011h−1M¯ objects must not result in the destruction of
galaxy disks. This is a fairly conservative conclusion because if we naively match the
percentages of mergers with an early-type fraction of ∼ 30%, then Figure 2.5 suggest
that the critical mass scale for disk survival is significantly larger, m & 2×10¹¹h−1M¯.
Specifically, mergers involving objects that are ∼ 5 times the current Milky Way disk
mass must not (always) destroy disks.
We remind the reader that the lookback times depicted in Figures 2.5 and 2.6 cor-
respond specifically to the times when infalling halos first fall within the main pro-
genitor’s virial radius. Our estimates suggest that the corresponding central impacts
should occur ∼3 Gyr later for the mass ratios we consider. Therefore, when we quote
merger fractions to a lookback time of ∼10 Gyr, this will correspond to an actual
impact ∼7 Gyr ago. Of course, the infalling systems will also lose mass as they fall
towards the central galaxy. As we have emphasized, the detailed evolution of merg-
ing objects can only be determined with focused simulations, and the outcome of the
subsequent mergers will depend on the baryonic components and orbital properties
of the systems involved.
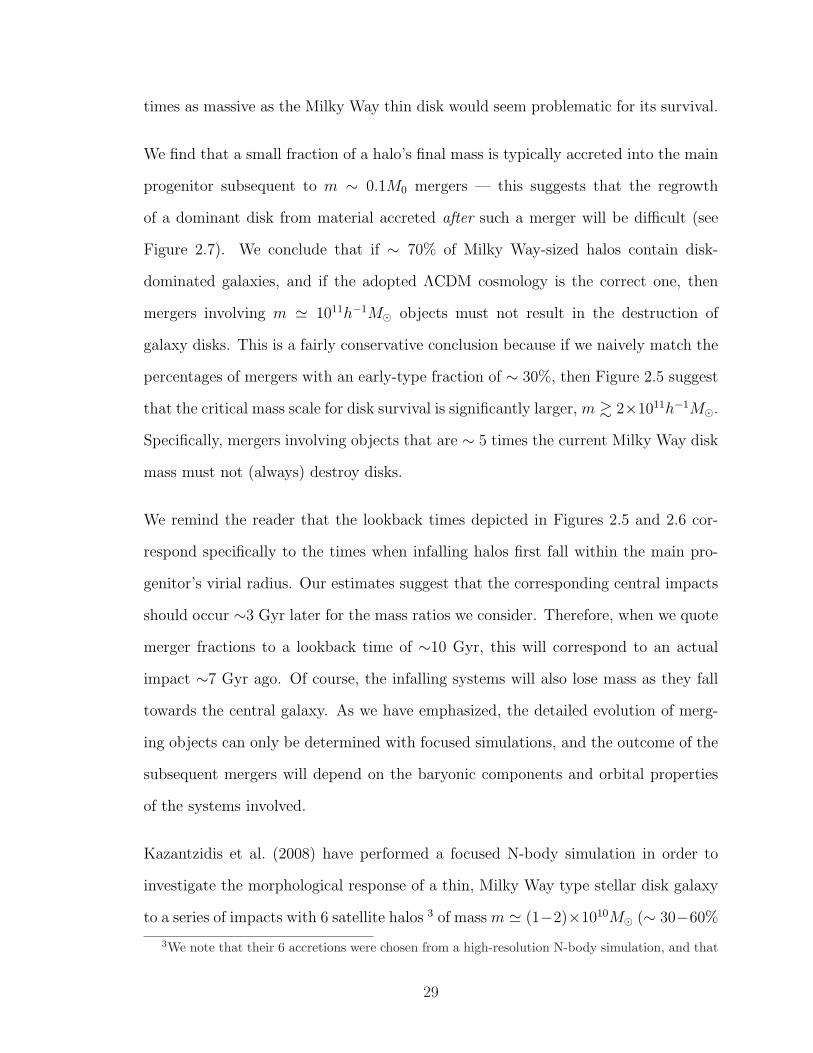
Kazantzidis et al. (2008) have performed a focused N-body simulation in order to
investigate the morphological response of a thin, Milky Way type stellar disk galaxy
to a series of impacts with 6 satellite halos 3 of mass m ' (1−2)×1010M¯ (∼ 30−60%
3We note that their 6 accretions were chosen from a high-resolution N-body simulation, and that
29
of the disk mass). They find that a dominant “thin” stellar disk component survives
the bombardment, although its scale-height was seen to increase from 250 pc to ∼ 400
pc, and a second ∼ 1.5 kpc “thick” component was also created. In addition, a new
central bar / bulge component was also generated in these fairly small encounters.
While it is encouraging to see that a thin disk can survive some bombardment, mergers
with objects ∼ 6 times as massive as those considered by Kazantzidis et al. should
be very common in Milky Way-sized halos. It remains to be seen how the infall of
m ' 1011h−1M¯ objects will affect the morphologies of thin, ∼ 4 × 10¹⁰M¯ stellar
disks. Moreover, the merger history considered by Kazantzidis et al. extended to
fairly recent events. While there was no explicit star formation prescription in these
simulations, one would expect a broad range of stellar ages in the thickened disk stars
in this case, instead of a predominantly old population—as seems to be observed in
actual galaxies.
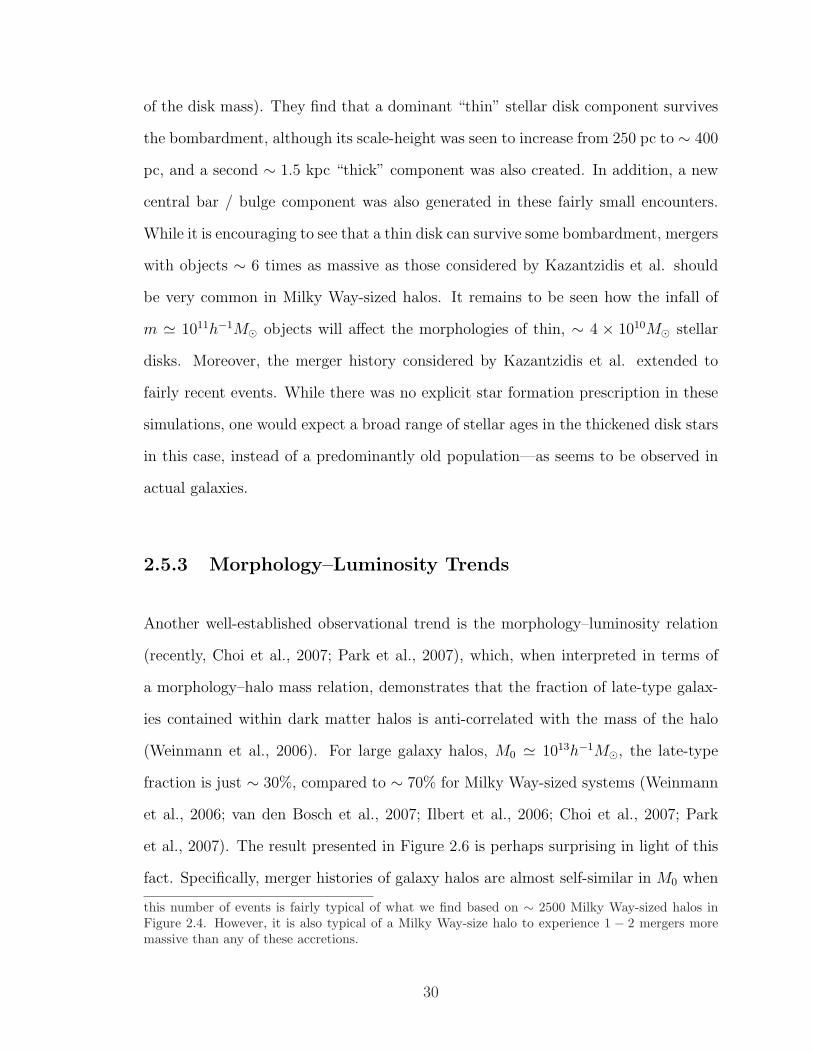
2.5.3 Morphology–Luminosity Trends
Another well-established observational trend is the morphology–luminosity relation
(recently, Choi et al., 2007; Park et al., 2007), which, when interpreted in terms of
a morphology–halo mass relation, demonstrates that the fraction of late-type galax-
ies contained within dark matter halos is anti-correlated with the mass of the halo
(Weinmann et al., 2006). For large galaxy halos, M0 ' 1013h−1M¯, the late-type
fraction is just ∼ 30%, compared to ∼ 70% for Milky Way-sized systems (Weinmann
et al., 2006; van den Bosch et al., 2007; Ilbert et al., 2006; Choi et al., 2007; Park
et al., 2007). The result presented in Figure 2.6 is perhaps surprising in light of this
fact. Specifically, merger histories of galaxy halos are almost self-similar in M0 when
this number of events is fairly typical of what we find based on ∼ 2500 Milky Way-sized halos inFigure 2.4. However, it is also typical of a Milky Way-size halo to experience 1 − 2 mergers moremassive than any of these accretions.
30
the infalling mass m is selected to be a fixed fraction of M0. For example, ∼ 18%
(70%) of M0 ' 1012h−1M¯ halos have experienced an m > 0.3M0 (0.1M0) merger
event in the last 10 Gyr. This fraction grows only marginally to ∼ 25% (80%) for
M0 ' 1013h−1M¯ halos. The implication is that dark matter halo merger histories
alone cannot explain the observed correlation between early-type fraction and halo
mass. Specifically, baryon physics must play the primary role in setting the observed
trend between galaxy morphology and halo mass.
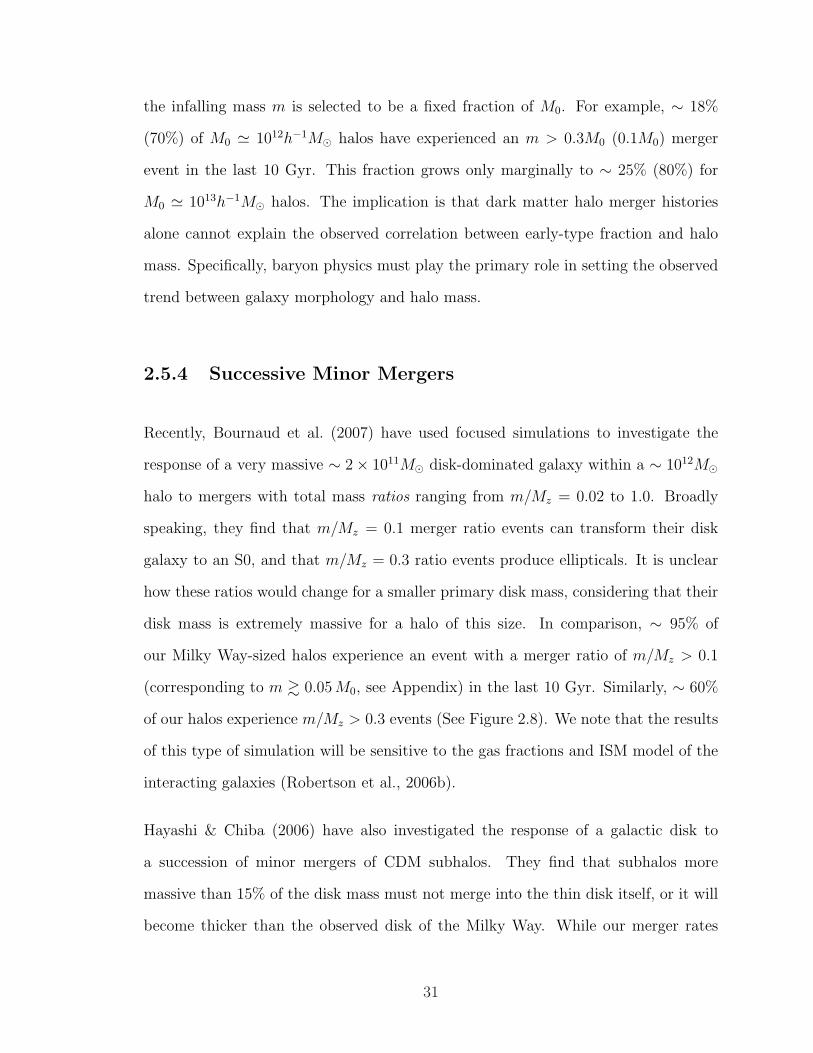
2.5.4 Successive Minor Mergers
Recently, Bournaud et al. (2007) have used focused simulations to investigate the
response of a very massive ∼ 2× 10¹¹M¯ disk-dominated galaxy within a ∼ 1012M¯
halo to mergers with total mass ratios ranging from m/Mz = 0.02 to 1.0. Broadly
speaking, they find that m/Mz = 0.1 merger ratio events can transform their disk
galaxy to an S0, and that m/Mz = 0.3 ratio events produce ellipticals. It is unclear
how these ratios would change for a smaller primary disk mass, considering that their
disk mass is extremely massive for a halo of this size. In comparison, ∼ 95% of
our Milky Way-sized halos experience an event with a merger ratio of m/Mz > 0.1
(corresponding to m & 0.05 M0, see Appendix) in the last 10 Gyr. Similarly, ∼ 60%
of our halos experience m/Mz > 0.3 events (See Figure 2.8). We note that the results
of this type of simulation will be sensitive to the gas fractions and ISM model of the
interacting galaxies (Robertson et al., 2006b).
Hayashi & Chiba (2006) have also investigated the response of a galactic disk to
a succession of minor mergers of CDM subhalos. They find that subhalos more
massive than 15% of the disk mass must not merge into the thin disk itself, or it will
become thicker than the observed disk of the Milky Way. While our merger rates
31
are for subhalos entering the virial radius of the halo, not when it penetrates the
disk, we expect the fraction of disk mergers involving objects of mass 6 × 10⁹Modot
to be quite high. Recall that 95% of halos experience an accretion event larger than
5 × 10¹⁰Modot. Even if these halos lose 90% of their mass before disk impact (which
seems unlikely) they still meet the Hayashi and Chiba criterion. Note, however, that
a detailed thin/thick decomposition may be required in order to fully evaluate this
limit (Kazantzidis et al., 2008). A more detailed study of large mergers, including
the necessary baryon physics, is required to fully explore this issue.
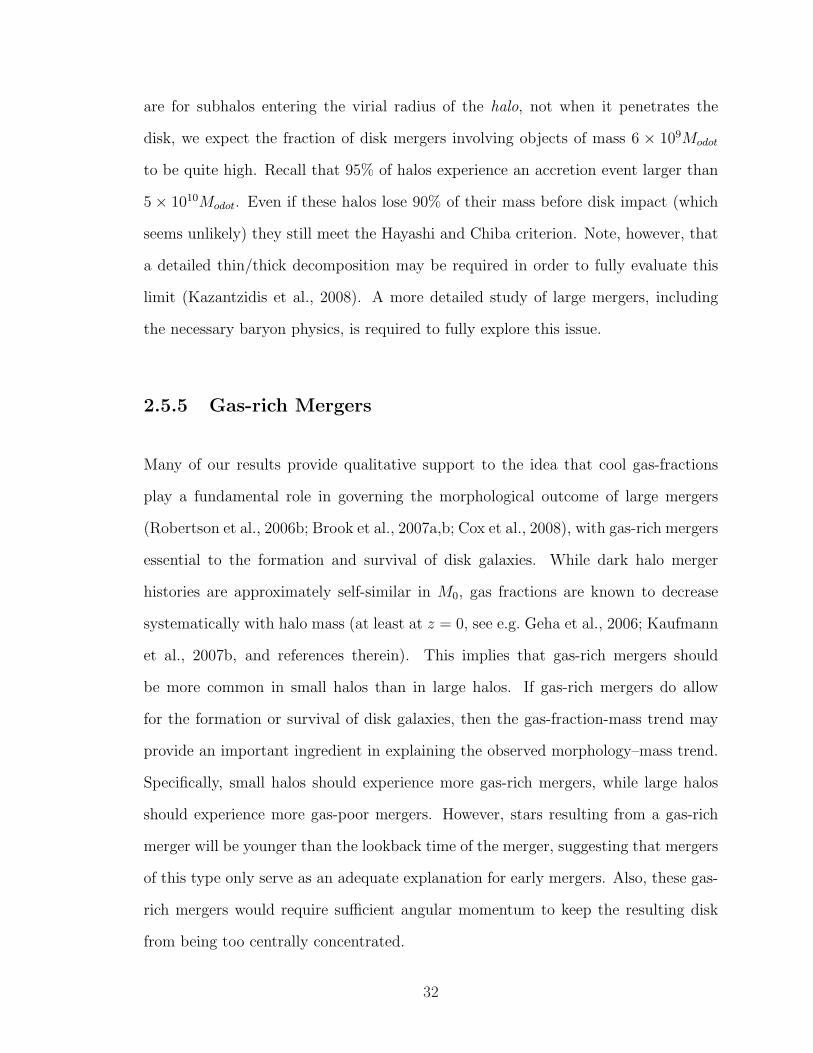
2.5.5 Gas-rich Mergers
Many of our results provide qualitative support to the idea that cool gas-fractions
play a fundamental role in governing the morphological outcome of large mergers
(Robertson et al., 2006b; Brook et al., 2007a,b; Cox et al., 2008), with gas-rich mergers
essential to the formation and survival of disk galaxies. While dark halo merger
histories are approximately self-similar in M0, gas fractions are known to decrease
systematically with halo mass (at least at z = 0, see e.g. Geha et al., 2006; Kaufmann
et al., 2007b, and references therein). This implies that gas-rich mergers should
be more common in small halos than in large halos. If gas-rich mergers do allow
for the formation or survival of disk galaxies, then the gas-fraction-mass trend may
provide an important ingredient in explaining the observed morphology–mass trend.
Specifically, small halos should experience more gas-rich mergers, while large halos
should experience more gas-poor mergers. However, stars resulting from a gas-rich
merger will be younger than the lookback time of the merger, suggesting that mergers
of this type only serve as an adequate explanation for early mergers. Also, these gas-
rich mergers would require sufficient angular momentum to keep the resulting disk
from being too centrally concentrated.
32
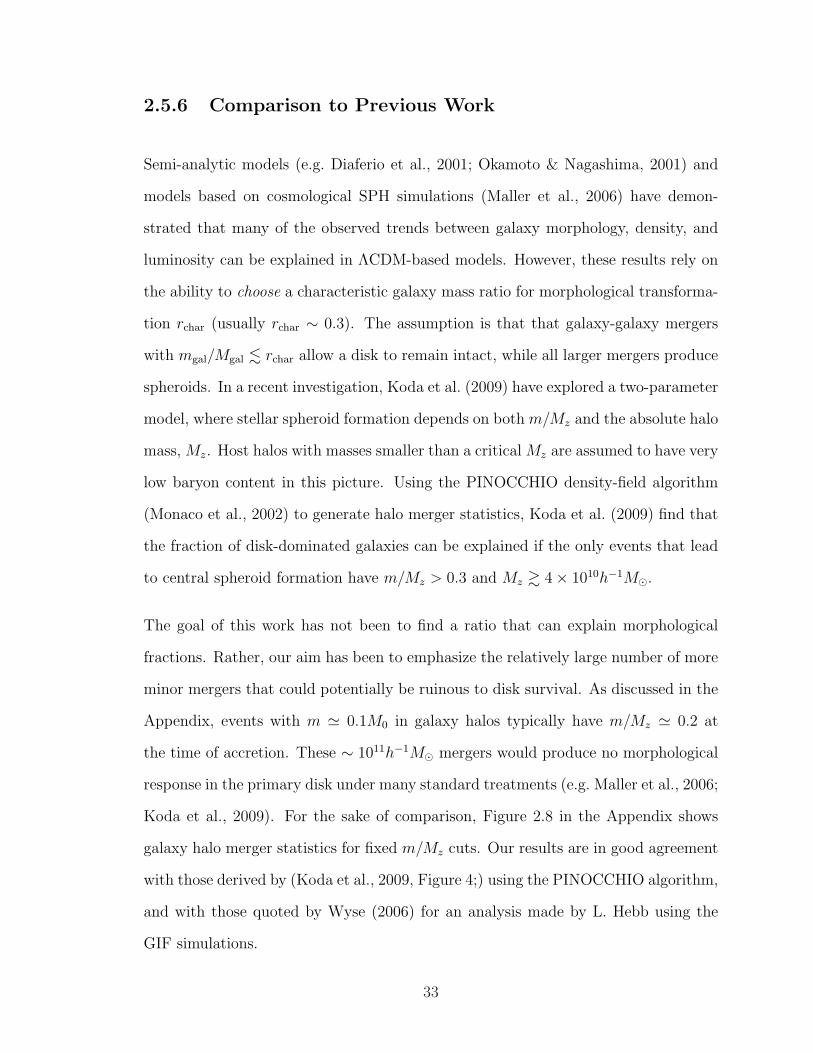
2.5.6 Comparison to Previous Work
Semi-analytic models (e.g. Diaferio et al., 2001; Okamoto & Nagashima, 2001) and
models based on cosmological SPH simulations (Maller et al., 2006) have demon-
strated that many of the observed trends between galaxy morphology, density, and
luminosity can be explained in ΛCDM-based models. However, these results rely on
the ability to choose a characteristic galaxy mass ratio for morphological transforma-
tion rchar (usually rchar ∼ 0.3). The assumption is that that galaxy-galaxy mergers
with mgal/Mgal . rchar allow a disk to remain intact, while all larger mergers produce
spheroids. In a recent investigation, Koda et al. (2009) have explored a two-parameter
model, where stellar spheroid formation depends on both m/Mz and the absolute halo
mass, Mz. Host halos with masses smaller than a critical Mz are assumed to have very
low baryon content in this picture. Using the PINOCCHIO density-field algorithm
(Monaco et al., 2002) to generate halo merger statistics, Koda et al. (2009) find that
the fraction of disk-dominated galaxies can be explained if the only events that lead
to central spheroid formation have m/Mz > 0.3 and Mz & 4× 10¹⁰h−1M¯.
The goal of this work has not been to find a ratio that can explain morphological
fractions. Rather, our aim has been to emphasize the relatively large number of more
minor mergers that could potentially be ruinous to disk survival. As discussed in the
Appendix, events with m ' 0.1M0 in galaxy halos typically have m/Mz ' 0.2 at
the time of accretion. These ∼ 1011h−1M¯ mergers would produce no morphological
response in the primary disk under many standard treatments (e.g. Maller et al., 2006;
Koda et al., 2009). For the sake of comparison, Figure 2.8 in the Appendix shows
galaxy halo merger statistics for fixed m/Mz cuts. Our results are in good agreement
with those derived by (Koda et al., 2009, Figure 4;) using the PINOCCHIO algorithm,
and with those quoted by Wyse (2006) for an analysis made by L. Hebb using the
GIF simulations.
33
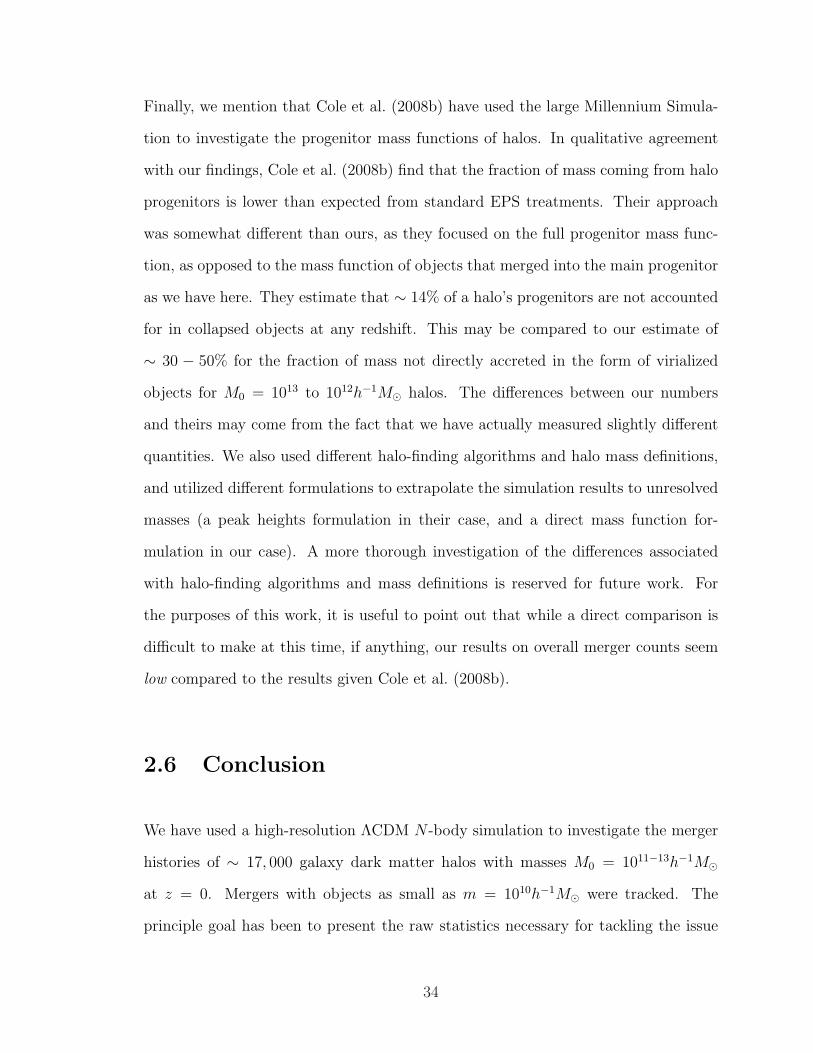
Finally, we mention that Cole et al. (2008b) have used the large Millennium Simula-
tion to investigate the progenitor mass functions of halos. In qualitative agreement
with our findings, Cole et al. (2008b) find that the fraction of mass coming from halo
progenitors is lower than expected from standard EPS treatments. Their approach
was somewhat different than ours, as they focused on the full progenitor mass func-
tion, as opposed to the mass function of objects that merged into the main progenitor
as we have here. They estimate that ∼ 14% of a halo’s progenitors are not accounted
for in collapsed objects at any redshift. This may be compared to our estimate of
∼ 30 − 50% for the fraction of mass not directly accreted in the form of virialized
objects for M0 = 1013 to 1012h−1M¯ halos. The differences between our numbers
and theirs may come from the fact that we have actually measured slightly different
quantities. We also used different halo-finding algorithms and halo mass definitions,
and utilized different formulations to extrapolate the simulation results to unresolved
masses (a peak heights formulation in their case, and a direct mass function for-
mulation in our case). A more thorough investigation of the differences associated
with halo-finding algorithms and mass definitions is reserved for future work. For
the purposes of this work, it is useful to point out that while a direct comparison is
difficult to make at this time, if anything, our results on overall merger counts seem
low compared to the results given Cole et al. (2008b).
2.6 Conclusion
We have used a high-resolution ΛCDM N -body simulation to investigate the merger
histories of ∼ 17, 000 galaxy dark matter halos with masses M0 = 1011−13h−1M¯
at z = 0. Mergers with objects as small as m = 1010h−1M¯ were tracked. The
principle goal has been to present the raw statistics necessary for tackling the issue
34
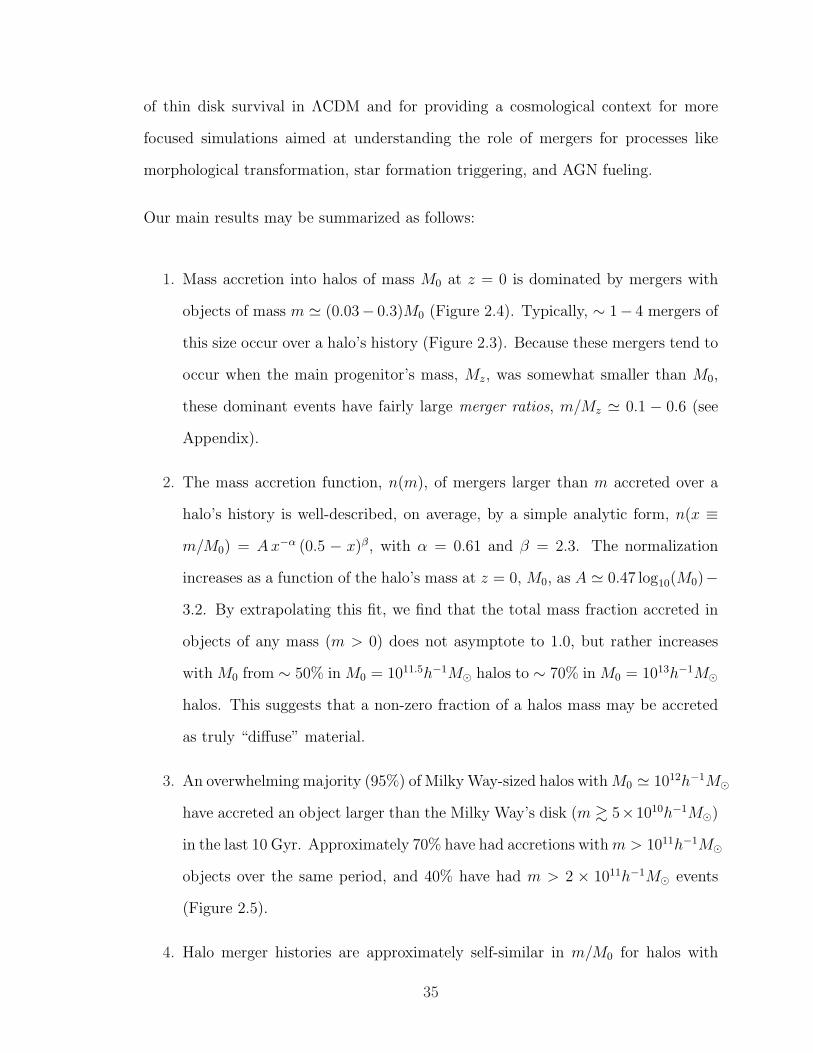
of thin disk survival in ΛCDM and for providing a cosmological context for more
focused simulations aimed at understanding the role of mergers for processes like
morphological transformation, star formation triggering, and AGN fueling.
Our main results may be summarized as follows:
1. Mass accretion into halos of mass M0 at z = 0 is dominated by mergers with
objects of mass m ' (0.03− 0.3)M0 (Figure 2.4). Typically, ∼ 1− 4 mergers of
this size occur over a halo’s history (Figure 2.3). Because these mergers tend to
occur when the main progenitor’s mass, Mz, was somewhat smaller than M0,
these dominant events have fairly large merger ratios, m/Mz ' 0.1 − 0.6 (see
Appendix).
2. The mass accretion function, n(m), of mergers larger than m accreted over a
halo’s history is well-described, on average, by a simple analytic form, n(x ≡m/M0) = Ax−α (0.5 − x)β, with α = 0.61 and β = 2.3. The normalization
increases as a function of the halo’s mass at z = 0, M0, as A ' 0.47 log10(M0)−3.2. By extrapolating this fit, we find that the total mass fraction accreted in
objects of any mass (m > 0) does not asymptote to 1.0, but rather increases
with M0 from ∼ 50% in M0 = 1011.5h−1M¯ halos to ∼ 70% in M0 = 1013h−1M¯
halos. This suggests that a non-zero fraction of a halos mass may be accreted
as truly “diffuse” material.
3. An overwhelming majority (95%) of Milky Way-sized halos with M0 ' 1012h−1M¯
have accreted an object larger than the Milky Way’s disk (m & 5×10¹⁰h−1M¯)
in the last 10 Gyr. Approximately 70% have had accretions with m > 1011h−1M¯
objects over the same period, and 40% have had m > 2 × 10¹¹h−1M¯ events
(Figure 2.5).
4. Halo merger histories are approximately self-similar in m/M0 for halos with
35
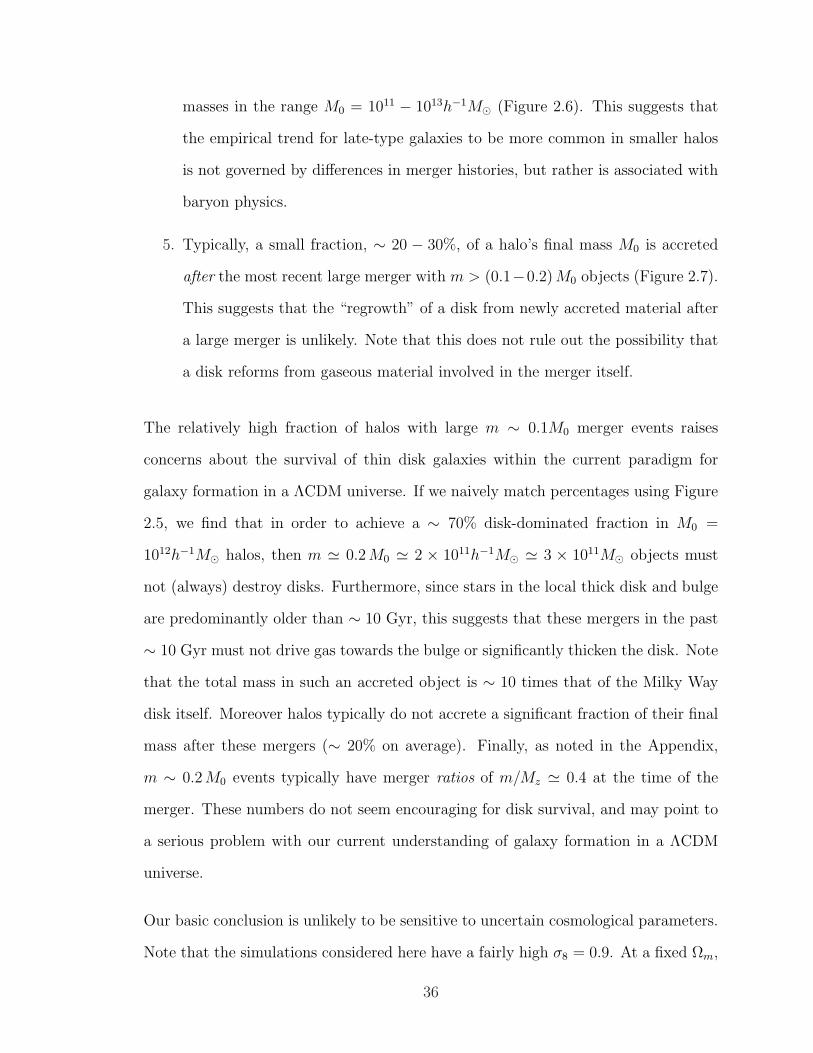
masses in the range M0 = 1011 − 1013h−1M¯ (Figure 2.6). This suggests that
the empirical trend for late-type galaxies to be more common in smaller halos
is not governed by differences in merger histories, but rather is associated with
baryon physics.
5. Typically, a small fraction, ∼ 20 − 30%, of a halo’s final mass M0 is accreted
after the most recent large merger with m > (0.1−0.2) M0 objects (Figure 2.7).
This suggests that the “regrowth” of a disk from newly accreted material after
a large merger is unlikely. Note that this does not rule out the possibility that
a disk reforms from gaseous material involved in the merger itself.
The relatively high fraction of halos with large m ∼ 0.1M0 merger events raises
concerns about the survival of thin disk galaxies within the current paradigm for
galaxy formation in a ΛCDM universe. If we naively match percentages using Figure
2.5, we find that in order to achieve a ∼ 70% disk-dominated fraction in M0 =
1012h−1M¯ halos, then m ' 0.2 M0 ' 2 × 10¹¹h−1M¯ ' 3 × 10¹¹M¯ objects must
not (always) destroy disks. Furthermore, since stars in the local thick disk and bulge
are predominantly older than ∼ 10 Gyr, this suggests that these mergers in the past
∼ 10 Gyr must not drive gas towards the bulge or significantly thicken the disk. Note
that the total mass in such an accreted object is ∼ 10 times that of the Milky Way
disk itself. Moreover halos typically do not accrete a significant fraction of their final
mass after these mergers (∼ 20% on average). Finally, as noted in the Appendix,
m ∼ 0.2 M0 events typically have merger ratios of m/Mz ' 0.4 at the time of the
merger. These numbers do not seem encouraging for disk survival, and may point to
a serious problem with our current understanding of galaxy formation in a ΛCDM
universe.
Our basic conclusion is unlikely to be sensitive to uncertain cosmological parameters.
Note that the simulations considered here have a fairly high σ8 = 0.9. At a fixed Ωm,
36
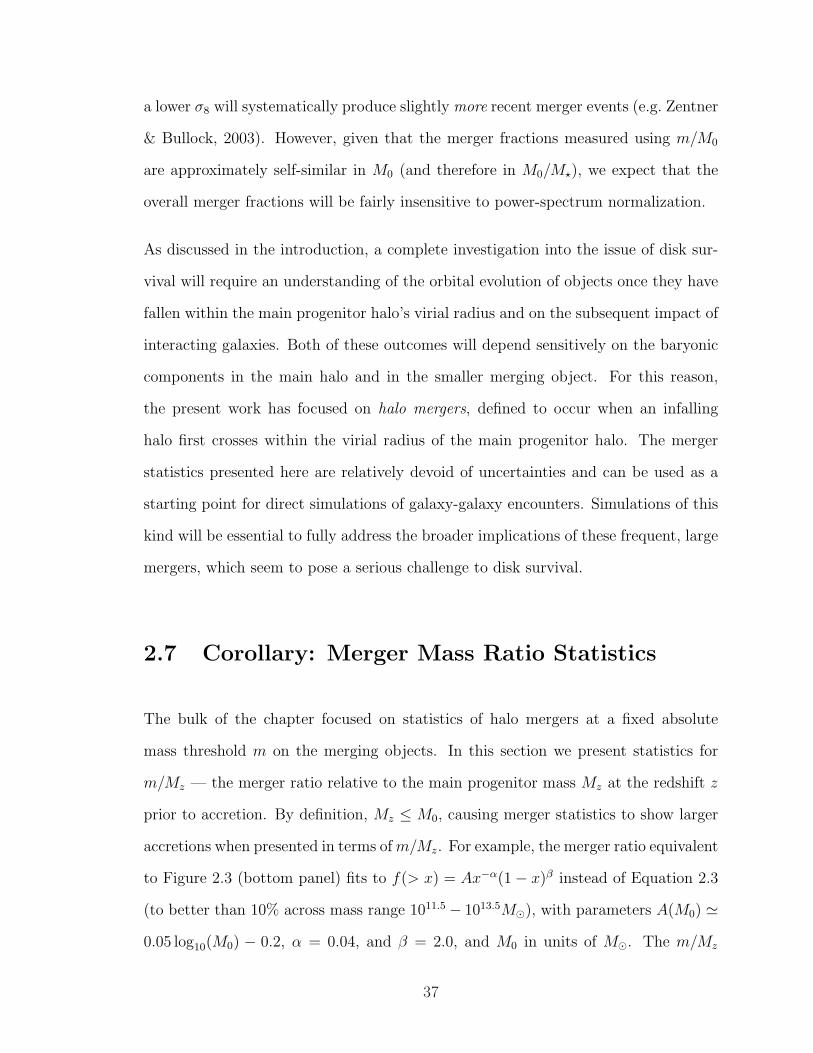
a lower σ8 will systematically produce slightly more recent merger events (e.g. Zentner
& Bullock, 2003). However, given that the merger fractions measured using m/M0
are approximately self-similar in M0 (and therefore in M0/M?), we expect that the
overall merger fractions will be fairly insensitive to power-spectrum normalization.
As discussed in the introduction, a complete investigation into the issue of disk sur-
vival will require an understanding of the orbital evolution of objects once they have
fallen within the main progenitor halo’s virial radius and on the subsequent impact of
interacting galaxies. Both of these outcomes will depend sensitively on the baryonic
components in the main halo and in the smaller merging object. For this reason,
the present work has focused on halo mergers, defined to occur when an infalling
halo first crosses within the virial radius of the main progenitor halo. The merger
statistics presented here are relatively devoid of uncertainties and can be used as a
starting point for direct simulations of galaxy-galaxy encounters. Simulations of this
kind will be essential to fully address the broader implications of these frequent, large
mergers, which seem to pose a serious challenge to disk survival.
2.7 Corollary: Merger Mass Ratio Statistics
The bulk of the chapter focused on statistics of halo mergers at a fixed absolute
mass threshold m on the merging objects. In this section we present statistics for
m/Mz — the merger ratio relative to the main progenitor mass Mz at the redshift z
prior to accretion. By definition, Mz ≤ M0, causing merger statistics to show larger
accretions when presented in terms of m/Mz. For example, the merger ratio equivalent
to Figure 2.3 (bottom panel) fits to f(> x) = Ax−α(1− x)β instead of Equation 2.3
(to better than 10% across mass range 1011.5− 1013.5M¯), with parameters A(M0) '0.05 log10(M0) − 0.2, α = 0.04, and β = 2.0, and M0 in units of M¯. The m/Mz
37
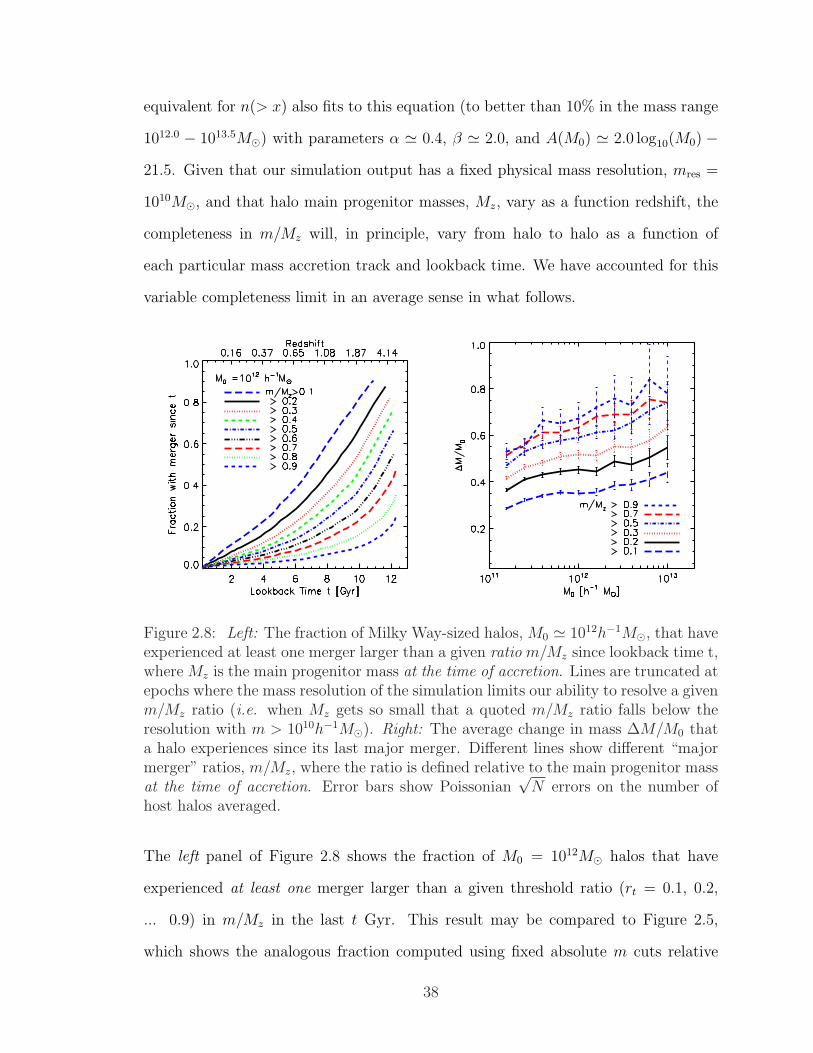
equivalent for n(> x) also fits to this equation (to better than 10% in the mass range
1012.0 − 1013.5M¯) with parameters α ' 0.4, β ' 2.0, and A(M0) ' 2.0 log10(M0) −21.5. Given that our simulation output has a fixed physical mass resolution, mres =
1010M¯, and that halo main progenitor masses, Mz, vary as a function redshift, the
completeness in m/Mz will, in principle, vary from halo to halo as a function of
each particular mass accretion track and lookback time. We have accounted for this
variable completeness limit in an average sense in what follows.
Figure 2.8: Left: The fraction of Milky Way-sized halos, M0 ' 1012h−1M¯, that haveexperienced at least one merger larger than a given ratio m/Mz since lookback time t,where Mz is the main progenitor mass at the time of accretion. Lines are truncated atepochs where the mass resolution of the simulation limits our ability to resolve a givenm/Mz ratio (i.e. when Mz gets so small that a quoted m/Mz ratio falls below theresolution with m > 1010h−1M¯). Right: The average change in mass ∆M/M0 thata halo experiences since its last major merger. Different lines show different “majormerger” ratios, m/Mz, where the ratio is defined relative to the main progenitor massat the time of accretion. Error bars show Poissonian
√N errors on the number of
host halos averaged.
The left panel of Figure 2.8 shows the fraction of M0 = 1012M¯ halos that have
experienced at least one merger larger than a given threshold ratio (rt = 0.1, 0.2,
... 0.9) in m/Mz in the last t Gyr. This result may be compared to Figure 2.5,
which shows the analogous fraction computed using fixed absolute m cuts relative
38
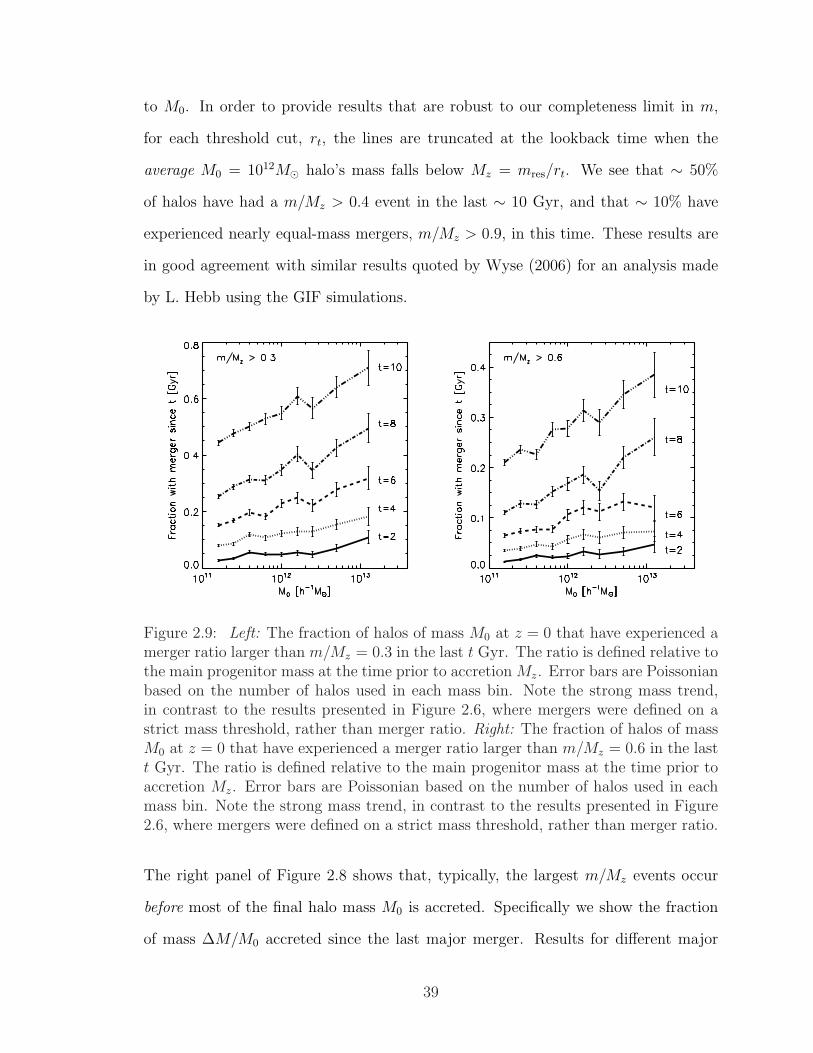
to M0. In order to provide results that are robust to our completeness limit in m,
for each threshold cut, rt, the lines are truncated at the lookback time when the
average M0 = 1012M¯ halo’s mass falls below Mz = mres/rt. We see that ∼ 50%
of halos have had a m/Mz > 0.4 event in the last ∼ 10 Gyr, and that ∼ 10% have
experienced nearly equal-mass mergers, m/Mz > 0.9, in this time. These results are
in good agreement with similar results quoted by Wyse (2006) for an analysis made
by L. Hebb using the GIF simulations.
Figure 2.9: Left: The fraction of halos of mass M0 at z = 0 that have experienced amerger ratio larger than m/Mz = 0.3 in the last t Gyr. The ratio is defined relative tothe main progenitor mass at the time prior to accretion Mz. Error bars are Poissonianbased on the number of halos used in each mass bin. Note the strong mass trend,in contrast to the results presented in Figure 2.6, where mergers were defined on astrict mass threshold, rather than merger ratio. Right: The fraction of halos of massM0 at z = 0 that have experienced a merger ratio larger than m/Mz = 0.6 in the lastt Gyr. The ratio is defined relative to the main progenitor mass at the time prior toaccretion Mz. Error bars are Poissonian based on the number of halos used in eachmass bin. Note the strong mass trend, in contrast to the results presented in Figure2.6, where mergers were defined on a strict mass threshold, rather than merger ratio.
The right panel of Figure 2.8 shows that, typically, the largest m/Mz events occur
before most of the final halo mass M0 is accreted. Specifically we show the fraction
of mass ∆M/M0 accreted since the last major merger. Results for different major
39
merger ratio thresholds are shown as different line types. Each line presents the
average ∆M/M0 at fixed M0 and we only include halos that have actually had a
merger of a given ratio (within the last ∼ 11 Gyr) in this figure. Among halos that
have had nearly equal-mass merger events, m/Mz & 0.9, the fraction of mass that is
accreted since that time is significant, with ∆M/M0 ∼ 70% for M0 = 1012M¯ halos.
If we associate post-merger accretion with the potential “regrowth” of a galactic disk,
then, by comparison with Figure 2.7, high merger-ratio events are less of a concern
for disk formation than high m/M0 ratio events. Unlike most high m/Mz events,
mergers that are large relative to M0 typically have very little (. 20%) fractional
mass accretion after the merger.
The left panel of Figure 2.9 shows the fraction of halos that have had a merger
larger than m/Mz = 0.3 within the last t = 2, 4, ... 10 Gyr, as a function of halo
mass M0. The right panel shows the same statistic computed for larger m/Mz > 0.6
mergers. Unlike the result shown in Figure 2.6, there is a fairly significant mass trend,
with more massive halos more likely to have experienced a major merger at a fixed
lookback time. Note, however, that most of these “major mergers” involve relatively
small objects in an absolute sense. Much of this trend is driven by the fact that Mz
falls off more rapidly with z for high M0 halos compared to low M0 halos.
The previous discussions lead to explore the relationship between an accreted halo’s
absolute mass m and the mass-ratio it had when it was accreted, m/Mz. The two
panels of Figure 2.10 illustrate this relationship for objects accreted into M0 = 1012M¯
halos. The thick, solid line in the left panel shows the median merger ratio, m/Mz,
that a halo of mass m/M0 has when it was accreted. Specifically, we plot m/Mz given
m/M0 in this diagram. We see that typically m/Mz ' 2 m/M0, as shown by the
dashed line in the figure. The dotted lines show the 68 % spread in the distribution
of m/Mz given m/M0. The opposite relationship is shown in the right panel of Figure
40
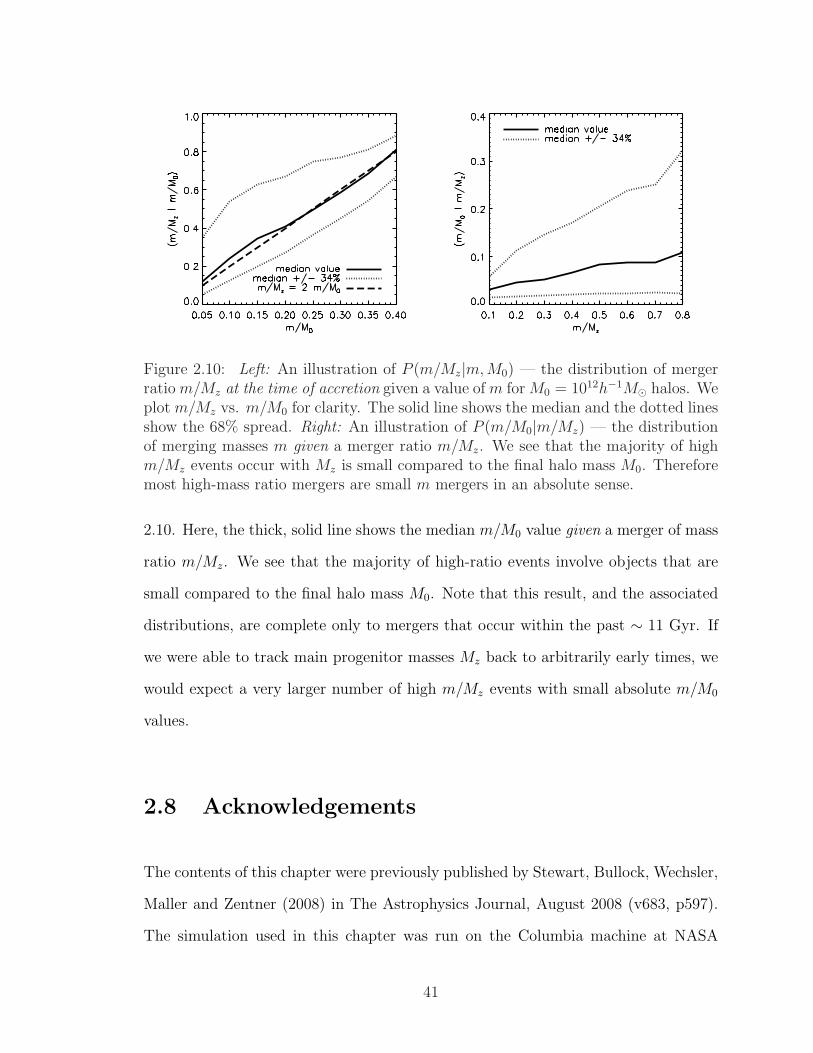
Figure 2.10: Left: An illustration of P (m/Mz|m,M0) — the distribution of mergerratio m/Mz at the time of accretion given a value of m for M0 = 1012h−1M¯ halos. Weplot m/Mz vs. m/M0 for clarity. The solid line shows the median and the dotted linesshow the 68% spread. Right: An illustration of P (m/M0|m/Mz) — the distributionof merging masses m given a merger ratio m/Mz. We see that the majority of highm/Mz events occur with Mz is small compared to the final halo mass M0. Thereforemost high-mass ratio mergers are small m mergers in an absolute sense.
2.10. Here, the thick, solid line shows the median m/M0 value given a merger of mass
ratio m/Mz. We see that the majority of high-ratio events involve objects that are
small compared to the final halo mass M0. Note that this result, and the associated
distributions, are complete only to mergers that occur within the past ∼ 11 Gyr. If
we were able to track main progenitor masses Mz back to arbitrarily early times, we
would expect a very larger number of high m/Mz events with small absolute m/M0
values.
2.8 Acknowledgements
The contents of this chapter were previously published by Stewart, Bullock, Wechsler,
Maller and Zentner (2008) in The Astrophysics Journal, August 2008 (v683, p597).
The simulation used in this chapter was run on the Columbia machine at NASA
41
Ames. We would like to thank Anatoly Klypin for running the simulation and making
it available to us. We are also indebted to Brandon Allgood for providing the merger
trees. We thank Chris Brook, T. J. Cox, Fabio Governato, Christian Maulbetsch,
Brant Robertson, Matias Steinmetz, Jerry Sellwood, and Rosemary Wyse for helpful
comments on this work, and Onsi Fakhouri and Chung-Pei Ma for useful discussions
about halo merger rates.
42
Chapter 3
Mergers in LCDM: Mass, Redshift,
and Mass-Ratio Dependence
3.1 Chapter Abstract
We employ a high-resolution LCDM N-body simulation to present merger rate predic-
tions for dark matter halos and investigate how common merger-related observables
for galaxies—such as close pair counts, starburst counts, and the morphologically
disturbed fraction—likely scale with luminosity, stellar mass, merger mass ratio, and
redshift from z = 0 to z = 4. We investigate both rate at which subhalos first enter
the virial radius of a larger halo (the “infall rate”), and the rate at which subhalos
become destroyed, losing 90% of the mass they had at infall (the “destruction rate”).
For both merger rate definitions, we provide a simple ‘universal’ fitting formula that
describes our derived merger rates for dark matter halos a function of dark halo mass,
merger mass ratio, and redshift, and go on to predict galaxy merger rates using num-
ber density-matching to associate halos with galaxies. For example, we find that the
43
instantaneous (destruction) merger rate of m/M > 0.3 mass ratio events into typical
L & f L∗ galaxies follows the simple relation dN/dt ' 0.03(1+f) Gyr−1 (1+z)2.1. De-
spite the rapid increase in merger rate with redshift, only a small fraction of > 0.4L∗
high-redshift galaxies (∼ 3% at z = 2) should have experienced a major merger
(m/M > 0.3) in the very recent past (t < 100 Myr). This suggests that short-lived,
merger-induced bursts of star formation should not contribute significantly to the
global star formation rate at early times, in agreement with several observational
indications. In contrast, a fairly high fraction (∼ 20%) of those z = 2 galaxies should
have experienced a morphologically transformative merger within a virial dynamical
time (∼ 500 Myr at z = 2). We compare our results to observational merger rate
estimates from both morphological indicators and pair-fraction based determinations
between z = 0− 2 and show that they are consistent with our predictions. However,
we emphasize that great care must be made in these comparisons because the pre-
dicted observables depend very sensitively on galaxy luminosity, redshift, overall mass
ratio, and uncertain relaxation timescales for merger remnants. We show that the
majority of bright galaxies at z = 3 should have undergone a major merger (> 0.3) in
the previous 700 Myr and conclude that mergers almost certainly play an important
role in delivering baryons and influencing the kinematic properties of Lyman Break
Galaxies (LBGs).
3.2 Introduction
In the current theory of hierarchical structure formation (LCDM), dark matter halos
and the galaxies within them are assembled from the continuous accretion of smaller
objects (Peebles, 1982; Blumenthal et al., 1984; Davis et al., 1985; Wechsler et al.,
2002; Fakhouri & Ma, 2008; Stewart et al., 2008; Cole et al., 2008a; Neistein & Dekel,
44
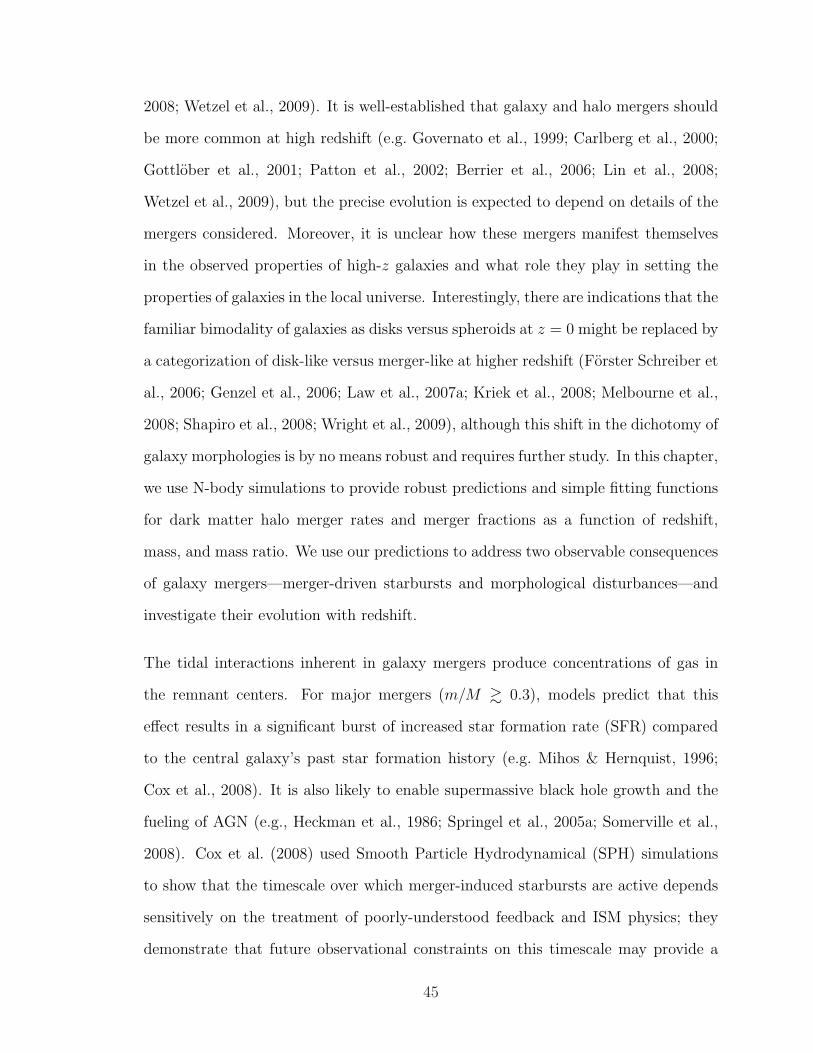
2008; Wetzel et al., 2009). It is well-established that galaxy and halo mergers should
be more common at high redshift (e.g. Governato et al., 1999; Carlberg et al., 2000;
Gottlober et al., 2001; Patton et al., 2002; Berrier et al., 2006; Lin et al., 2008;
Wetzel et al., 2009), but the precise evolution is expected to depend on details of the
mergers considered. Moreover, it is unclear how these mergers manifest themselves
in the observed properties of high-z galaxies and what role they play in setting the
properties of galaxies in the local universe. Interestingly, there are indications that the
familiar bimodality of galaxies as disks versus spheroids at z = 0 might be replaced by
a categorization of disk-like versus merger-like at higher redshift (Forster Schreiber et
al., 2006; Genzel et al., 2006; Law et al., 2007a; Kriek et al., 2008; Melbourne et al.,
2008; Shapiro et al., 2008; Wright et al., 2009), although this shift in the dichotomy of
galaxy morphologies is by no means robust and requires further study. In this chapter,
we use N-body simulations to provide robust predictions and simple fitting functions
for dark matter halo merger rates and merger fractions as a function of redshift,
mass, and mass ratio. We use our predictions to address two observable consequences
of galaxy mergers—merger-driven starbursts and morphological disturbances—and
investigate their evolution with redshift.
The tidal interactions inherent in galaxy mergers produce concentrations of gas in
the remnant centers. For major mergers (m/M & 0.3), models predict that this
effect results in a significant burst of increased star formation rate (SFR) compared
to the central galaxy’s past star formation history (e.g. Mihos & Hernquist, 1996;
Cox et al., 2008). It is also likely to enable supermassive black hole growth and the
fueling of AGN (e.g., Heckman et al., 1986; Springel et al., 2005a; Somerville et al.,
2008). Cox et al. (2008) used Smooth Particle Hydrodynamical (SPH) simulations
to show that the timescale over which merger-induced starbursts are active depends
sensitively on the treatment of poorly-understood feedback and ISM physics; they
demonstrate that future observational constraints on this timescale may provide a
45
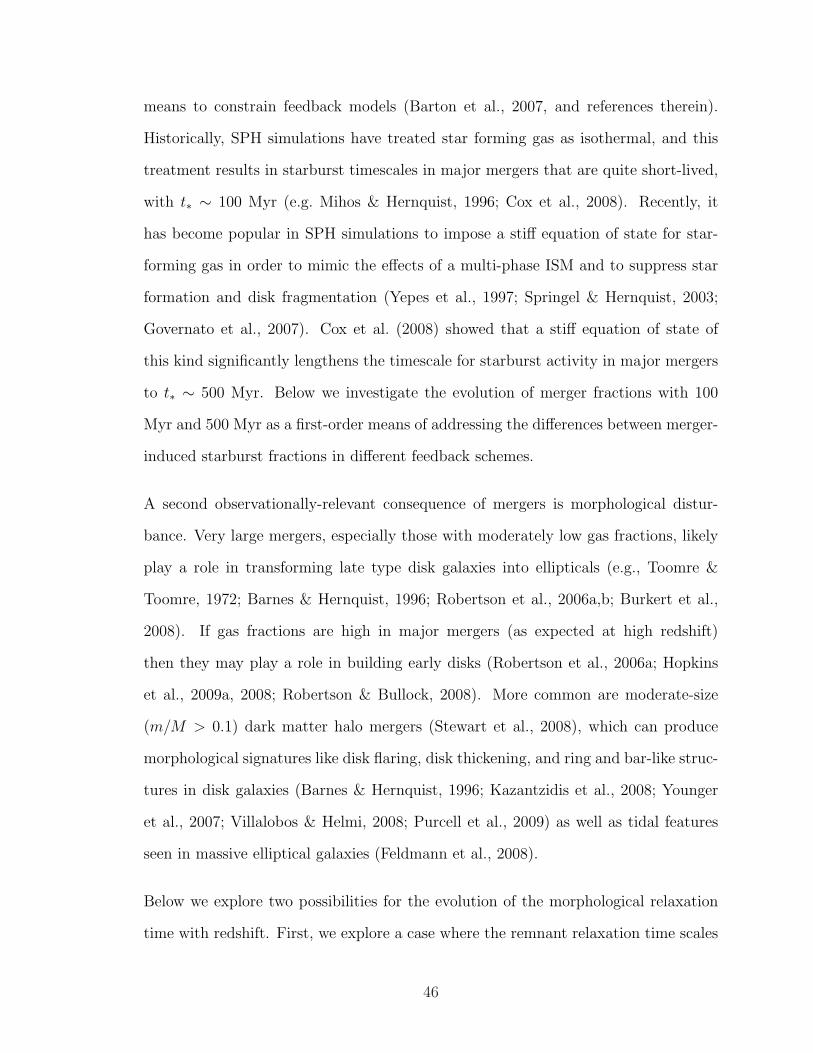
means to constrain feedback models (Barton et al., 2007, and references therein).
Historically, SPH simulations have treated star forming gas as isothermal, and this
treatment results in starburst timescales in major mergers that are quite short-lived,
with t∗ ∼ 100 Myr (e.g. Mihos & Hernquist, 1996; Cox et al., 2008). Recently, it
has become popular in SPH simulations to impose a stiff equation of state for star-
forming gas in order to mimic the effects of a multi-phase ISM and to suppress star
formation and disk fragmentation (Yepes et al., 1997; Springel & Hernquist, 2003;
Governato et al., 2007). Cox et al. (2008) showed that a stiff equation of state of
this kind significantly lengthens the timescale for starburst activity in major mergers
to t∗ ∼ 500 Myr. Below we investigate the evolution of merger fractions with 100
Myr and 500 Myr as a first-order means of addressing the differences between merger-
induced starburst fractions in different feedback schemes.
A second observationally-relevant consequence of mergers is morphological distur-
bance. Very large mergers, especially those with moderately low gas fractions, likely
play a role in transforming late type disk galaxies into ellipticals (e.g., Toomre &
Toomre, 1972; Barnes & Hernquist, 1996; Robertson et al., 2006a,b; Burkert et al.,
2008). If gas fractions are high in major mergers (as expected at high redshift)
then they may play a role in building early disks (Robertson et al., 2006a; Hopkins
et al., 2009a, 2008; Robertson & Bullock, 2008). More common are moderate-size
(m/M > 0.1) dark matter halo mergers (Stewart et al., 2008), which can produce
morphological signatures like disk flaring, disk thickening, and ring and bar-like struc-
tures in disk galaxies (Barnes & Hernquist, 1996; Kazantzidis et al., 2008; Younger
et al., 2007; Villalobos & Helmi, 2008; Purcell et al., 2009) as well as tidal features
seen in massive elliptical galaxies (Feldmann et al., 2008).
Below we explore two possibilities for the evolution of the morphological relaxation
time with redshift. First, we explore a case where the remnant relaxation time scales
46
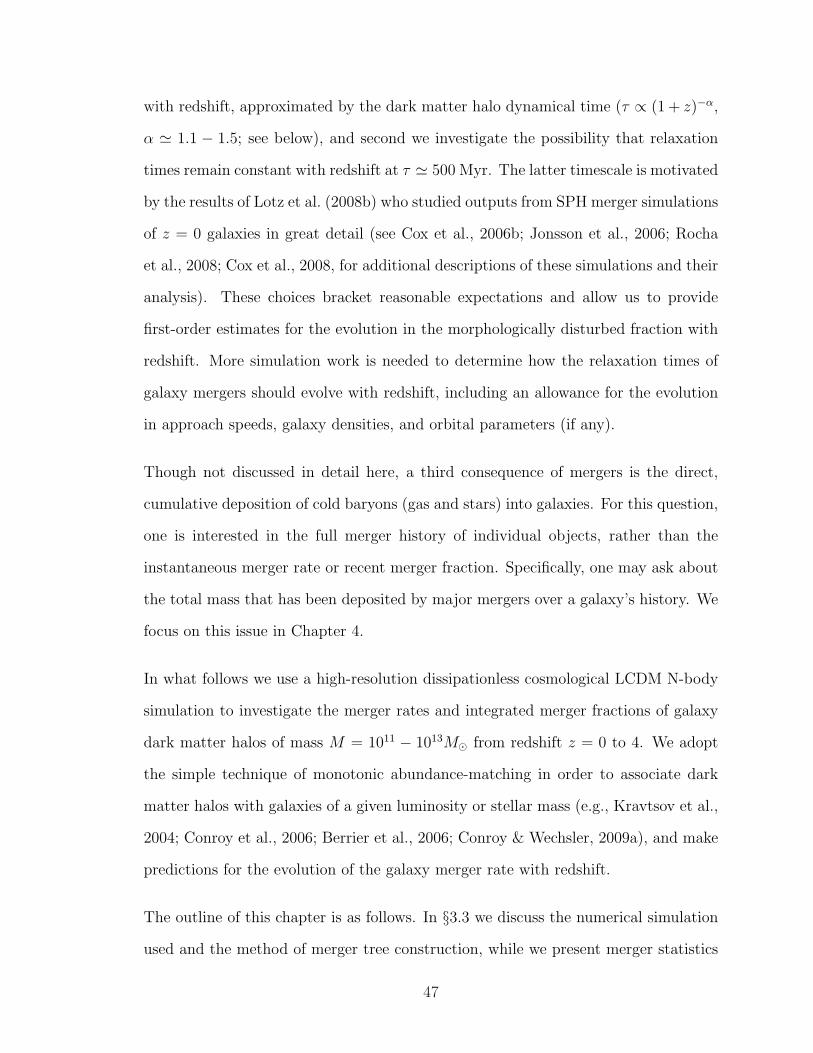
with redshift, approximated by the dark matter halo dynamical time (τ ∝ (1 + z)−α,
α ' 1.1 − 1.5; see below), and second we investigate the possibility that relaxation
times remain constant with redshift at τ ' 500 Myr. The latter timescale is motivated
by the results of Lotz et al. (2008b) who studied outputs from SPH merger simulations
of z = 0 galaxies in great detail (see Cox et al., 2006b; Jonsson et al., 2006; Rocha
et al., 2008; Cox et al., 2008, for additional descriptions of these simulations and their
analysis). These choices bracket reasonable expectations and allow us to provide
first-order estimates for the evolution in the morphologically disturbed fraction with
redshift. More simulation work is needed to determine how the relaxation times of
galaxy mergers should evolve with redshift, including an allowance for the evolution
in approach speeds, galaxy densities, and orbital parameters (if any).
Though not discussed in detail here, a third consequence of mergers is the direct,
cumulative deposition of cold baryons (gas and stars) into galaxies. For this question,
one is interested in the full merger history of individual objects, rather than the
instantaneous merger rate or recent merger fraction. Specifically, one may ask about
the total mass that has been deposited by major mergers over a galaxy’s history. We
focus on this issue in Chapter 4.
In what follows we use a high-resolution dissipationless cosmological LCDM N-body
simulation to investigate the merger rates and integrated merger fractions of galaxy
dark matter halos of mass M = 1011 − 1013M¯ from redshift z = 0 to 4. We adopt
the simple technique of monotonic abundance-matching in order to associate dark
matter halos with galaxies of a given luminosity or stellar mass (e.g., Kravtsov et al.,
2004; Conroy et al., 2006; Berrier et al., 2006; Conroy & Wechsler, 2009a), and make
predictions for the evolution of the galaxy merger rate with redshift.
The outline of this chapter is as follows. In §3.3 we discuss the numerical simulation
used and the method of merger tree construction, while we present merger statistics
47
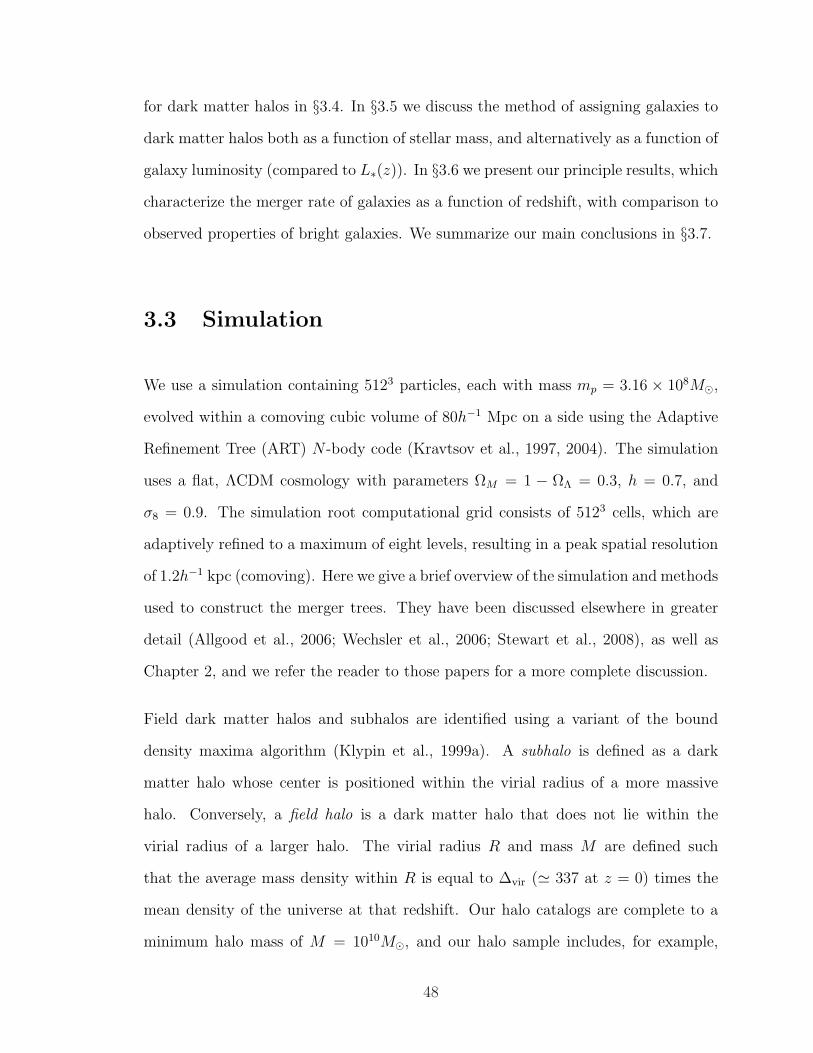
for dark matter halos in §3.4. In §3.5 we discuss the method of assigning galaxies to
dark matter halos both as a function of stellar mass, and alternatively as a function of
galaxy luminosity (compared to L∗(z)). In §3.6 we present our principle results, which
characterize the merger rate of galaxies as a function of redshift, with comparison to
observed properties of bright galaxies. We summarize our main conclusions in §3.7.
3.3 Simulation
We use a simulation containing 5123 particles, each with mass mp = 3.16 × 10⁸M¯,
evolved within a comoving cubic volume of 80h−1 Mpc on a side using the Adaptive
Refinement Tree (ART) N -body code (Kravtsov et al., 1997, 2004). The simulation
uses a flat, ΛCDM cosmology with parameters ΩM = 1 − ΩΛ = 0.3, h = 0.7, and
σ8 = 0.9. The simulation root computational grid consists of 5123 cells, which are
adaptively refined to a maximum of eight levels, resulting in a peak spatial resolution
of 1.2h−1 kpc (comoving). Here we give a brief overview of the simulation and methods
used to construct the merger trees. They have been discussed elsewhere in greater
detail (Allgood et al., 2006; Wechsler et al., 2006; Stewart et al., 2008), as well as
Chapter 2, and we refer the reader to those papers for a more complete discussion.
Field dark matter halos and subhalos are identified using a variant of the bound
density maxima algorithm (Klypin et al., 1999a). A subhalo is defined as a dark
matter halo whose center is positioned within the virial radius of a more massive
halo. Conversely, a field halo is a dark matter halo that does not lie within the
virial radius of a larger halo. The virial radius R and mass M are defined such
that the average mass density within R is equal to ∆vir (' 337 at z = 0) times the
mean density of the universe at that redshift. Our halo catalogs are complete to a
minimum halo mass of M = 1010M¯, and our halo sample includes, for example,
48
∼ 15, 000(10, 000) and 2, 000(500) field halos at z = 0(3) in the mass bins 1011−12 and
1012−13M¯, respectively.
We use the same merger trees described in Chapter 2 (Stewart et al., 2008), con-
structed using the techniques described in Wechsler et al. (2002) and Wechsler et al.
(2006). Our algorithm uses 48 stored timesteps that are approximately equally spaced
in expansion factor between a = (1 + z)−1 = 1.0 and a = 0.0443. We use standard
terminologies for progenitor and descendant. Any halo at any timestep may have
any number of progenitors, but a halo may have a single descendant — defined to
be the halo in the next timestep that contains the majority of this halo’s mass. The
term main progenitor is used to reference the most massive progenitor of a given halo,
tracked back in time.
Throughout this work we present results in terms of the merger ratio of an infalling
object, m/M , where we always define m as the mass of the smaller object just prior
to the merger and M is the mass main progenitor of the larger object at the same
epoch. Specifically, M in the ratio does not incorporate the mass m and therefore
m/M has a maximum value of 1.0. Except when explicitly stated otherwise, we
always use dark matter halo masses to define the merger ratio of any given merger
event, and we always define the merger ratio as the mass ratio just before the smaller
halo falls into the virial radius of the larger one. Because there is not a simple linear
relation between halo mass and galaxy stellar (or baryonic) mass, this is an important
distinction. For example, our major mergers, defined by halo mass ratios, may not
always correspond to major galaxy mergers as defined by stellar or baryonic mass
ratios (see e.g. Stewart, 2009). We will discuss this in more detail in Chapter 5.
In what follows we investigate two types of mergers. The first and most robust of our
predicted rates is the infall rate: the rate at which infalling halos become subhalos, as
they first fall within the virial radius of the main progenitor. These are the results we
49
present in §3.4, which describes our ‘universal’ merger rate function for dark matter
halos. The second rate is aimed more closely at confronting observations and is
associated with central mergers between galaxies themselves. Specifically we define
the destruction rate by counting instances when each infalling subhalo loses 90% of
the mass it had prior to entering the virial radius of the larger halo. 1 We are unable
to measure central crossings directly because the time resolution in our snapshot
outputs (typically ∆t ' 250 Myr) is comparable to a galaxy-galaxy crossing time
at the centers of halos, however, for mergers with mass ratios > 1/3(1/10), subhalo
destruction typically takes place ∼ 2(3) Gyr after infall to the virial radius. Based on
simulations of galaxy mergers, this definition leads to subhalo ”destruction” sometime
after its first pericenter (and likely after second pericenter), but probably before final
coalescence (Boylan-Kolchin et al., 2008). Note that this second rate (destruction)
is more uncertain than the first (infall) because, in principle, the orbital evolution
of infalling galaxies will depend upon the baryonic composition of both the primary
and secondary objects. Fortunately, as presented in detail below (see Table 3.1) for
the relatively high mass-ratio merger events we consider, the merger rates (and their
evolution with redshift) do not depend strongly on whether we define a merger to
occur at halo infall or at this central mass-loss epoch.
3.4 Dark Matter Halo Merger Rates
We begin by investigating infall and destruction merger rates as a function of mass,
merger ratio, and redshift. Merger rates are shown for several of these choices in
the four panels of Figure 3.1. The upper panels show merger rates per unit time
for > m/M mass ratio objects falling into host halos of mass 1012 (black lines and
1Subhalo masses are defined to be the mass within a truncation radius Rt, which is set to be theminimum of the virial radius and the radius where the subhalo density profile begins to encounterthe background halo density.
50
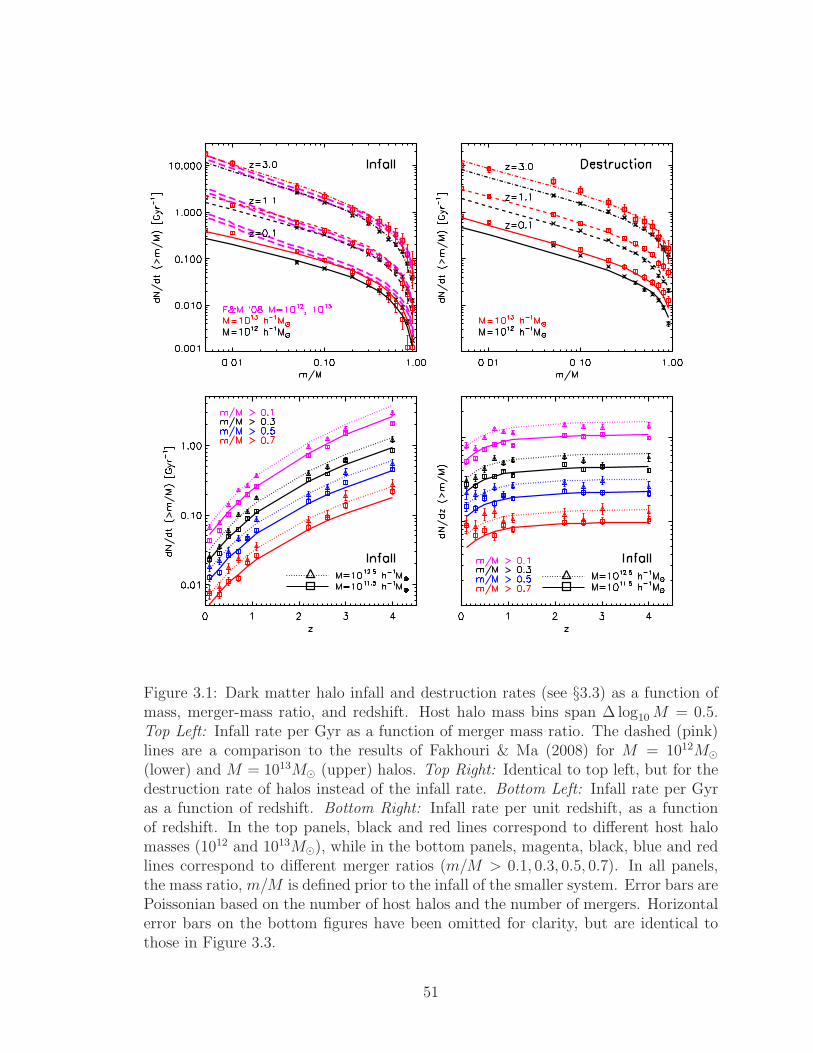
Figure 3.1: Dark matter halo infall and destruction rates (see §3.3) as a function ofmass, merger-mass ratio, and redshift. Host halo mass bins span ∆ log10 M = 0.5.Top Left: Infall rate per Gyr as a function of merger mass ratio. The dashed (pink)lines are a comparison to the results of Fakhouri & Ma (2008) for M = 1012M¯(lower) and M = 1013M¯ (upper) halos. Top Right: Identical to top left, but for thedestruction rate of halos instead of the infall rate. Bottom Left: Infall rate per Gyras a function of redshift. Bottom Right: Infall rate per unit redshift, as a functionof redshift. In the top panels, black and red lines correspond to different host halomasses (1012 and 1013M¯), while in the bottom panels, magenta, black, blue and redlines correspond to different merger ratios (m/M > 0.1, 0.3, 0.5, 0.7). In all panels,the mass ratio, m/M is defined prior to the infall of the smaller system. Error bars arePoissonian based on the number of host halos and the number of mergers. Horizontalerror bars on the bottom figures have been omitted for clarity, but are identical tothose in Figure 3.3.
51
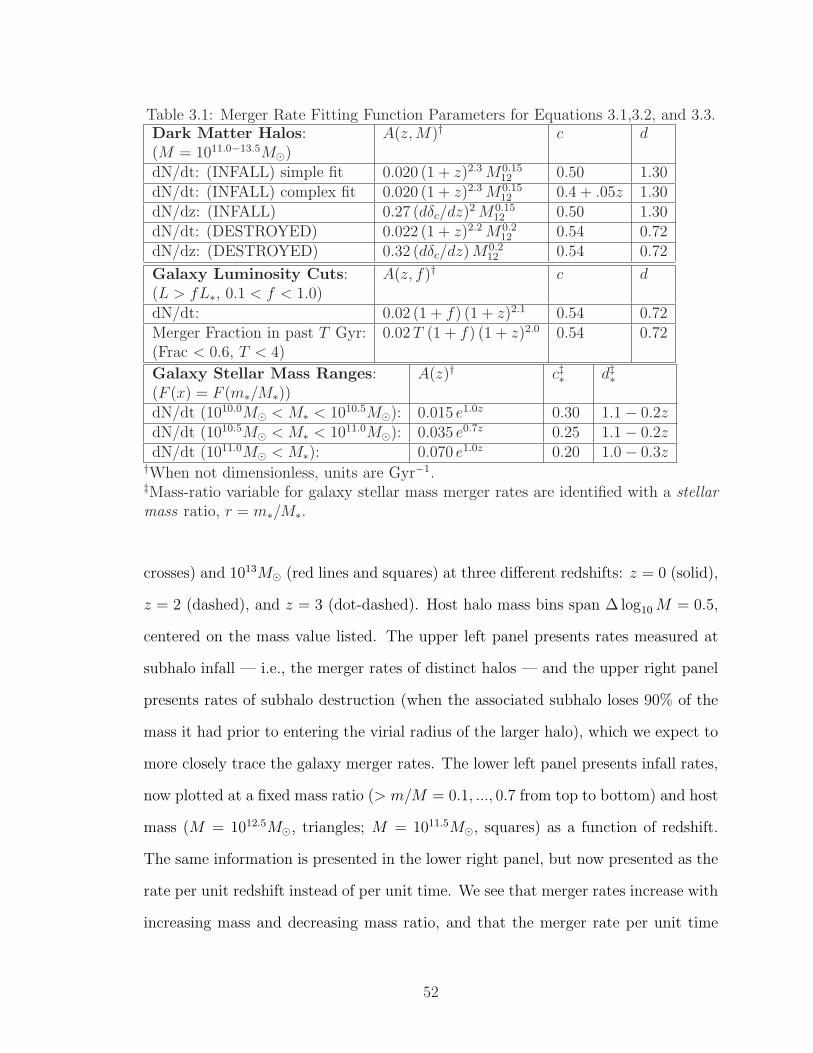
Table 3.1: Merger Rate Fitting Function Parameters for Equations 3.1,3.2, and 3.3.Dark Matter Halos: A(z, M)† c d(M = 1011.0−13.5M¯)dN/dt: (INFALL) simple fit 0.020 (1 + z)2.3 M0.15
12 0.50 1.30dN/dt: (INFALL) complex fit 0.020 (1 + z)2.3 M0.15
12 0.4 + .05z 1.30dN/dz: (INFALL) 0.27 (dδc/dz)2 M0.15
12 0.50 1.30dN/dt: (DESTROYED) 0.022 (1 + z)2.2 M0.2
12 0.54 0.72dN/dz: (DESTROYED) 0.32 (dδc/dz) M0.2
12 0.54 0.72
Galaxy Luminosity Cuts: A(z, f)† c d(L > fL∗, 0.1 < f < 1.0)dN/dt: 0.02 (1 + f) (1 + z)2.1 0.54 0.72Merger Fraction in past T Gyr: 0.02 T (1 + f) (1 + z)2.0 0.54 0.72(Frac < 0.6, T < 4)
Galaxy Stellar Mass Ranges: A(z)† c‡∗ d‡∗(F (x) = F (m∗/M∗))dN/dt (1010.0M¯ < M∗ < 1010.5M¯): 0.015 e1.0z 0.30 1.1− 0.2zdN/dt (1010.5M¯ < M∗ < 1011.0M¯): 0.035 e0.7z 0.25 1.1− 0.2zdN/dt (1011.0M¯ < M∗): 0.070 e1.0z 0.20 1.0− 0.3z
†When not dimensionless, units are Gyr−1.‡Mass-ratio variable for galaxy stellar mass merger rates are identified with a stellarmass ratio, r = m∗/M∗.
crosses) and 1013M¯ (red lines and squares) at three different redshifts: z = 0 (solid),
z = 2 (dashed), and z = 3 (dot-dashed). Host halo mass bins span ∆ log10 M = 0.5,
centered on the mass value listed. The upper left panel presents rates measured at
subhalo infall — i.e., the merger rates of distinct halos — and the upper right panel
presents rates of subhalo destruction (when the associated subhalo loses 90% of the
mass it had prior to entering the virial radius of the larger halo), which we expect to
more closely trace the galaxy merger rates. The lower left panel presents infall rates,
now plotted at a fixed mass ratio (> m/M = 0.1, ..., 0.7 from top to bottom) and host
mass (M = 1012.5M¯, triangles; M = 1011.5M¯, squares) as a function of redshift.
The same information is presented in the lower right panel, but now presented as the
rate per unit redshift instead of per unit time. We see that merger rates increase with
increasing mass and decreasing mass ratio, and that the merger rate per unit time
52
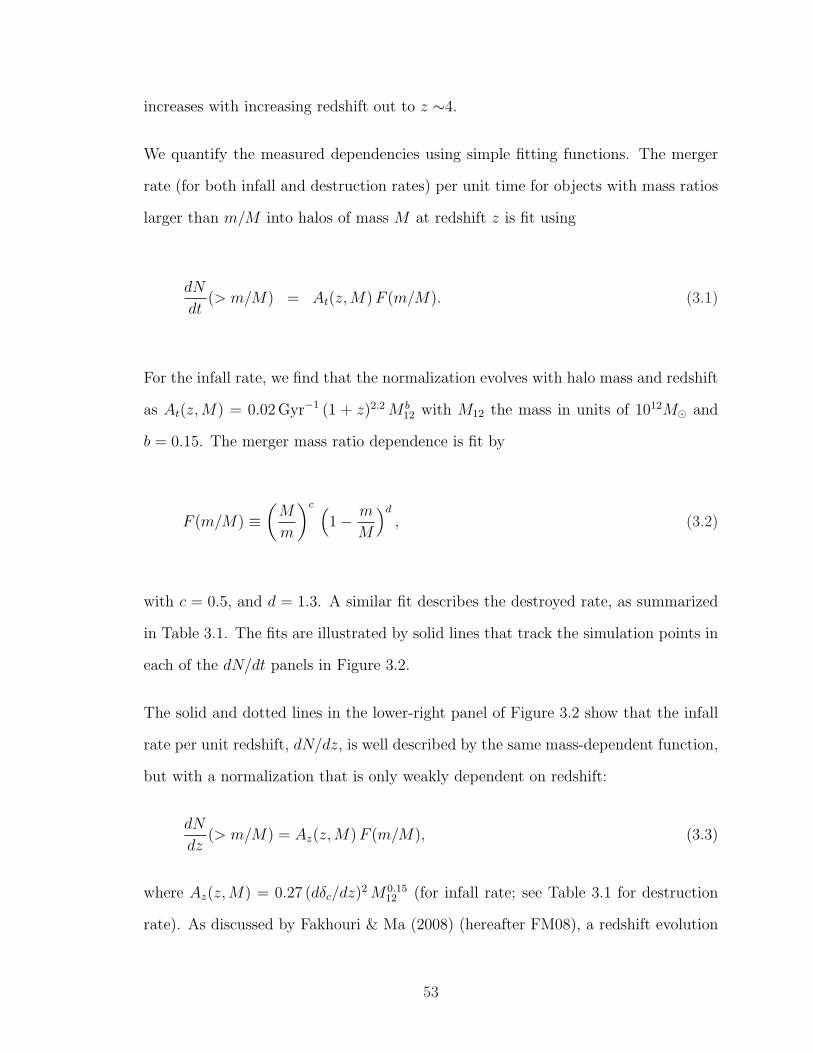
increases with increasing redshift out to z ∼4.
We quantify the measured dependencies using simple fitting functions. The merger
rate (for both infall and destruction rates) per unit time for objects with mass ratios
larger than m/M into halos of mass M at redshift z is fit using
dN
dt(> m/M) = At(z, M) F (m/M). (3.1)
For the infall rate, we find that the normalization evolves with halo mass and redshift
as At(z, M) = 0.02 Gyr−1 (1 + z)2.2 M b12 with M12 the mass in units of 1012M¯ and
b = 0.15. The merger mass ratio dependence is fit by
F (m/M) ≡(
M
m
)c (1− m
M
)d
, (3.2)
with c = 0.5, and d = 1.3. A similar fit describes the destroyed rate, as summarized
in Table 3.1. The fits are illustrated by solid lines that track the simulation points in
each of the dN/dt panels in Figure 3.2.
The solid and dotted lines in the lower-right panel of Figure 3.2 show that the infall
rate per unit redshift, dN/dz, is well described by the same mass-dependent function,
but with a normalization that is only weakly dependent on redshift:
dN
dz(> m/M) = Az(z, M) F (m/M), (3.3)
where Az(z,M) = 0.27 (dδc/dz)2 M0.1512 (for infall rate; see Table 3.1 for destruction
rate). As discussed by Fakhouri & Ma (2008) (hereafter FM08), a redshift evolution
53
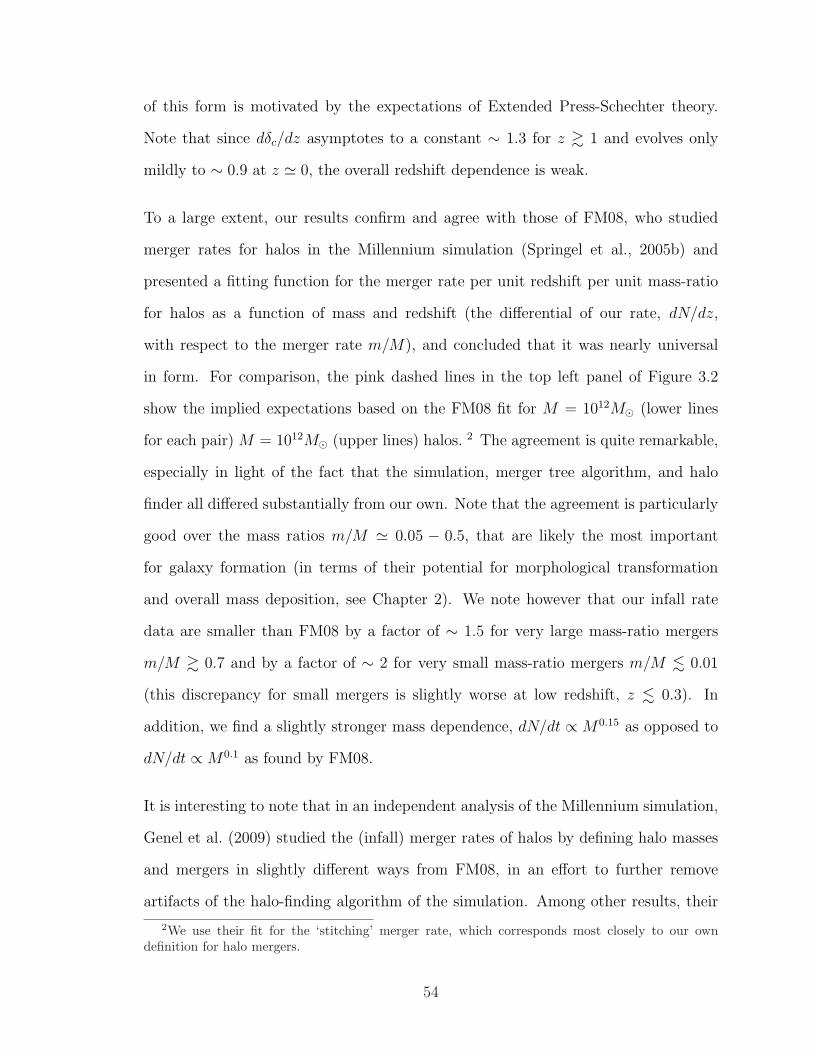
of this form is motivated by the expectations of Extended Press-Schechter theory.
Note that since dδc/dz asymptotes to a constant ∼ 1.3 for z & 1 and evolves only
mildly to ∼ 0.9 at z ' 0, the overall redshift dependence is weak.
To a large extent, our results confirm and agree with those of FM08, who studied
merger rates for halos in the Millennium simulation (Springel et al., 2005b) and
presented a fitting function for the merger rate per unit redshift per unit mass-ratio
for halos as a function of mass and redshift (the differential of our rate, dN/dz,
with respect to the merger rate m/M), and concluded that it was nearly universal
in form. For comparison, the pink dashed lines in the top left panel of Figure 3.2
show the implied expectations based on the FM08 fit for M = 1012M¯ (lower lines
for each pair) M = 1012M¯ (upper lines) halos. 2 The agreement is quite remarkable,
especially in light of the fact that the simulation, merger tree algorithm, and halo
finder all differed substantially from our own. Note that the agreement is particularly
good over the mass ratios m/M ' 0.05 − 0.5, that are likely the most important
for galaxy formation (in terms of their potential for morphological transformation
and overall mass deposition, see Chapter 2). We note however that our infall rate
data are smaller than FM08 by a factor of ∼ 1.5 for very large mass-ratio mergers
m/M & 0.7 and by a factor of ∼ 2 for very small mass-ratio mergers m/M . 0.01
(this discrepancy for small mergers is slightly worse at low redshift, z . 0.3). In
addition, we find a slightly stronger mass dependence, dN/dt ∝ M0.15 as opposed to
dN/dt ∝ M0.1 as found by FM08.
It is interesting to note that in an independent analysis of the Millennium simulation,
Genel et al. (2009) studied the (infall) merger rates of halos by defining halo masses
and mergers in slightly different ways from FM08, in an effort to further remove
artifacts of the halo-finding algorithm of the simulation. Among other results, their
2We use their fit for the ‘stitching’ merger rate, which corresponds most closely to our owndefinition for halo mergers.
54
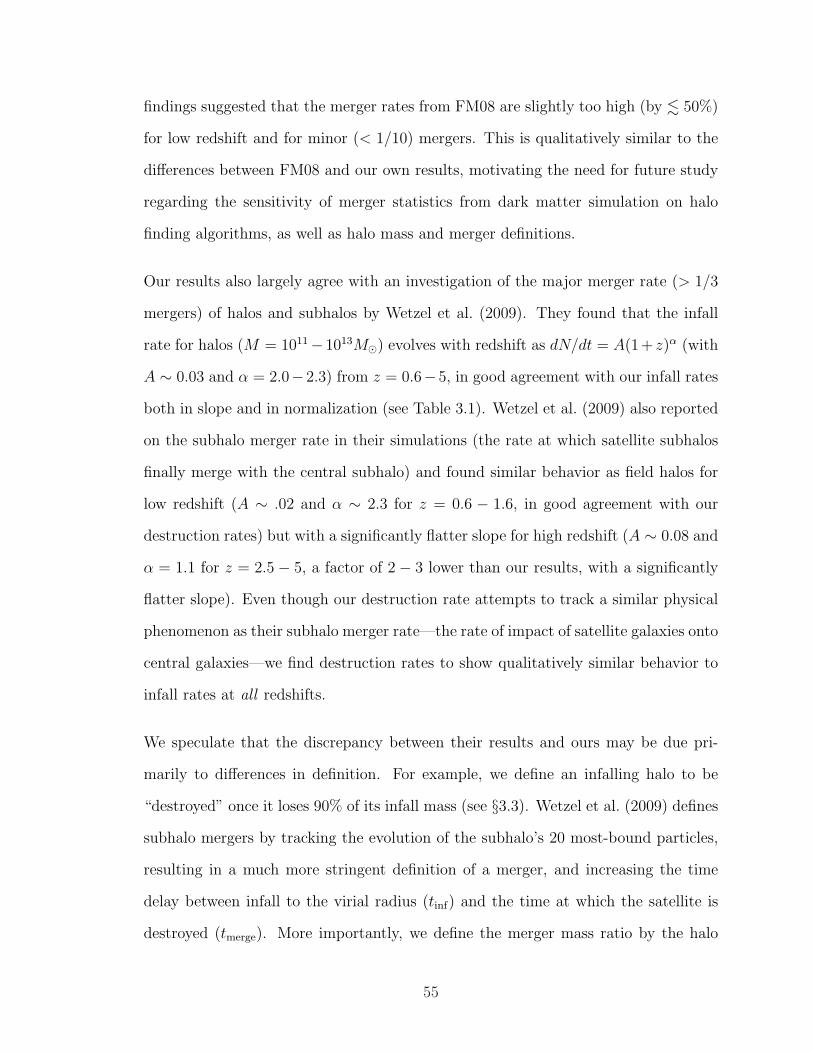
findings suggested that the merger rates from FM08 are slightly too high (by . 50%)
for low redshift and for minor (< 1/10) mergers. This is qualitatively similar to the
differences between FM08 and our own results, motivating the need for future study
regarding the sensitivity of merger statistics from dark matter simulation on halo
finding algorithms, as well as halo mass and merger definitions.
Our results also largely agree with an investigation of the major merger rate (> 1/3
mergers) of halos and subhalos by Wetzel et al. (2009). They found that the infall
rate for halos (M = 1011−1013M¯) evolves with redshift as dN/dt = A(1+ z)α (with
A ∼ 0.03 and α = 2.0−2.3) from z = 0.6−5, in good agreement with our infall rates
both in slope and in normalization (see Table 3.1). Wetzel et al. (2009) also reported
on the subhalo merger rate in their simulations (the rate at which satellite subhalos
finally merge with the central subhalo) and found similar behavior as field halos for
low redshift (A ∼ .02 and α ∼ 2.3 for z = 0.6 − 1.6, in good agreement with our
destruction rates) but with a significantly flatter slope for high redshift (A ∼ 0.08 and
α = 1.1 for z = 2.5− 5, a factor of 2 − 3 lower than our results, with a significantly
flatter slope). Even though our destruction rate attempts to track a similar physical
phenomenon as their subhalo merger rate—the rate of impact of satellite galaxies onto
central galaxies—we find destruction rates to show qualitatively similar behavior to
infall rates at all redshifts.
We speculate that the discrepancy between their results and ours may be due pri-
marily to differences in definition. For example, we define an infalling halo to be
“destroyed” once it loses 90% of its infall mass (see §3.3). Wetzel et al. (2009) defines
subhalo mergers by tracking the evolution of the subhalo’s 20 most-bound particles,
resulting in a much more stringent definition of a merger, and increasing the time
delay between infall to the virial radius (tinf) and the time at which the satellite is
destroyed (tmerge). More importantly, we define the merger mass ratio by the halo
55
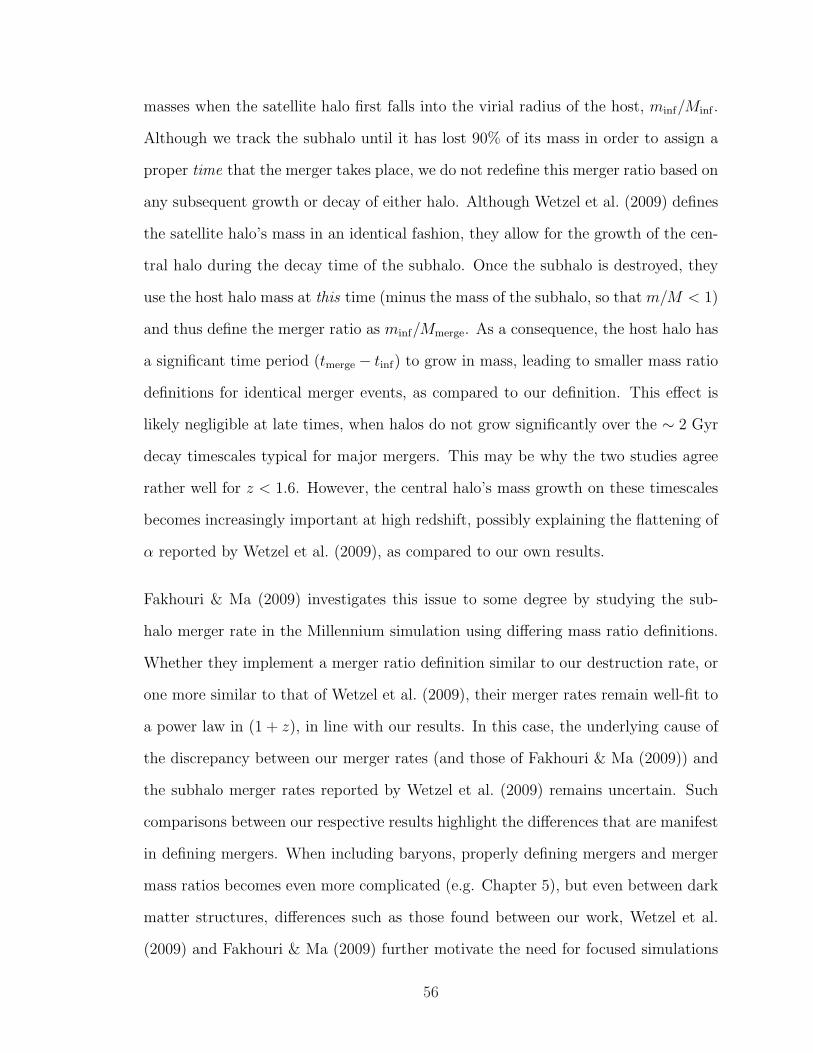
masses when the satellite halo first falls into the virial radius of the host, minf/Minf .
Although we track the subhalo until it has lost 90% of its mass in order to assign a
proper time that the merger takes place, we do not redefine this merger ratio based on
any subsequent growth or decay of either halo. Although Wetzel et al. (2009) defines
the satellite halo’s mass in an identical fashion, they allow for the growth of the cen-
tral halo during the decay time of the subhalo. Once the subhalo is destroyed, they
use the host halo mass at this time (minus the mass of the subhalo, so that m/M < 1)
and thus define the merger ratio as minf/Mmerge. As a consequence, the host halo has
a significant time period (tmerge − tinf) to grow in mass, leading to smaller mass ratio
definitions for identical merger events, as compared to our definition. This effect is
likely negligible at late times, when halos do not grow significantly over the ∼ 2 Gyr
decay timescales typical for major mergers. This may be why the two studies agree
rather well for z < 1.6. However, the central halo’s mass growth on these timescales
becomes increasingly important at high redshift, possibly explaining the flattening of
α reported by Wetzel et al. (2009), as compared to our own results.
Fakhouri & Ma (2009) investigates this issue to some degree by studying the sub-
halo merger rate in the Millennium simulation using differing mass ratio definitions.
Whether they implement a merger ratio definition similar to our destruction rate, or
one more similar to that of Wetzel et al. (2009), their merger rates remain well-fit to
a power law in (1 + z), in line with our results. In this case, the underlying cause of
the discrepancy between our merger rates (and those of Fakhouri & Ma (2009)) and
the subhalo merger rates reported by Wetzel et al. (2009) remains uncertain. Such
comparisons between our respective results highlight the differences that are manifest
in defining mergers. When including baryons, properly defining mergers and merger
mass ratios becomes even more complicated (e.g. Chapter 5), but even between dark
matter structures, differences such as those found between our work, Wetzel et al.
(2009) and Fakhouri & Ma (2009) further motivate the need for focused simulations
56
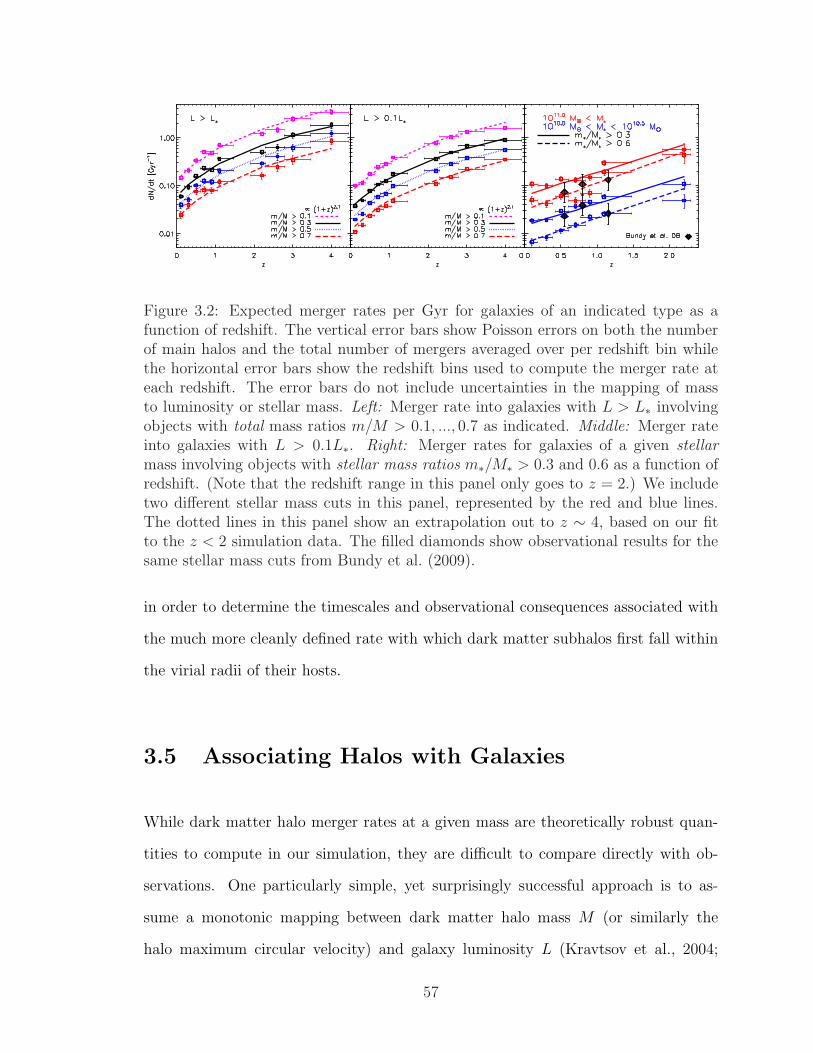
Figure 3.2: Expected merger rates per Gyr for galaxies of an indicated type as afunction of redshift. The vertical error bars show Poisson errors on both the numberof main halos and the total number of mergers averaged over per redshift bin whilethe horizontal error bars show the redshift bins used to compute the merger rate ateach redshift. The error bars do not include uncertainties in the mapping of massto luminosity or stellar mass. Left: Merger rate into galaxies with L > L∗ involvingobjects with total mass ratios m/M > 0.1, ..., 0.7 as indicated. Middle: Merger rateinto galaxies with L > 0.1L∗. Right: Merger rates for galaxies of a given stellarmass involving objects with stellar mass ratios m∗/M∗ > 0.3 and 0.6 as a function ofredshift. (Note that the redshift range in this panel only goes to z = 2.) We includetwo different stellar mass cuts in this panel, represented by the red and blue lines.The dotted lines in this panel show an extrapolation out to z ∼ 4, based on our fitto the z < 2 simulation data. The filled diamonds show observational results for thesame stellar mass cuts from Bundy et al. (2009).
in order to determine the timescales and observational consequences associated with
the much more cleanly defined rate with which dark matter subhalos first fall within
the virial radii of their hosts.
3.5 Associating Halos with Galaxies
While dark matter halo merger rates at a given mass are theoretically robust quan-
tities to compute in our simulation, they are difficult to compare directly with ob-
servations. One particularly simple, yet surprisingly successful approach is to as-
sume a monotonic mapping between dark matter halo mass M (or similarly the
halo maximum circular velocity) and galaxy luminosity L (Kravtsov et al., 2004;
57
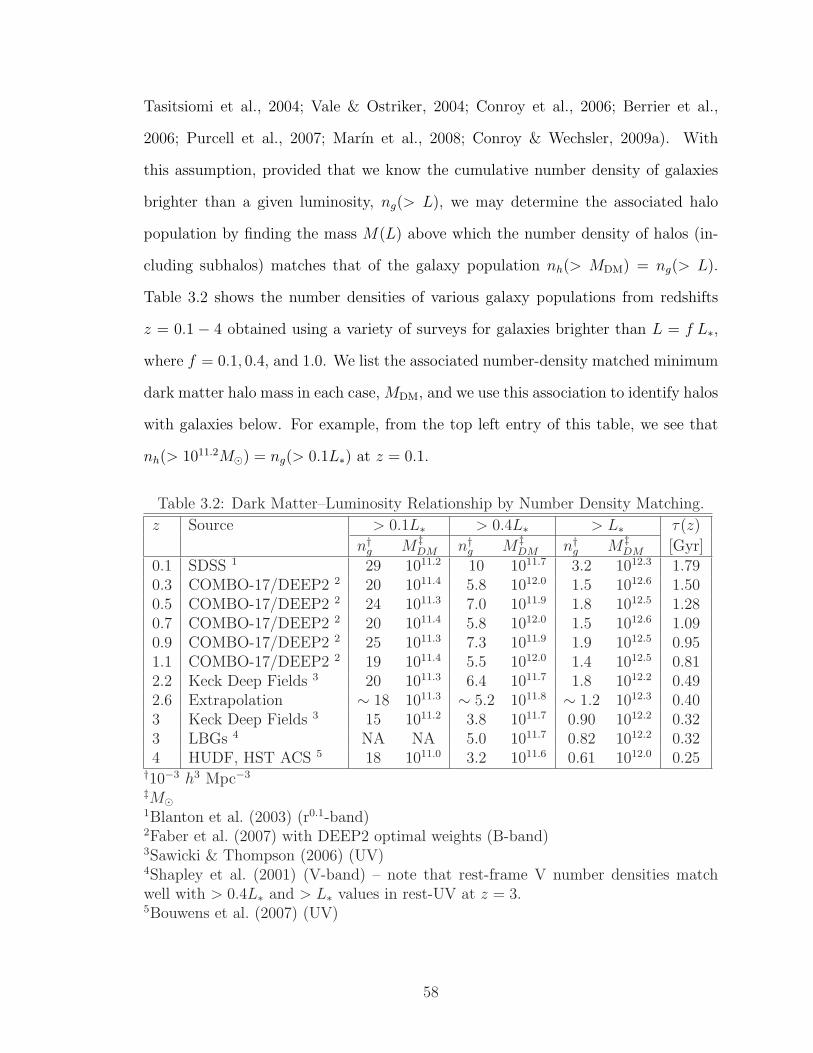
Tasitsiomi et al., 2004; Vale & Ostriker, 2004; Conroy et al., 2006; Berrier et al.,
2006; Purcell et al., 2007; Marın et al., 2008; Conroy & Wechsler, 2009a). With
this assumption, provided that we know the cumulative number density of galaxies
brighter than a given luminosity, ng(> L), we may determine the associated halo
population by finding the mass M(L) above which the number density of halos (in-
cluding subhalos) matches that of the galaxy population nh(> MDM) = ng(> L).
Table 3.2 shows the number densities of various galaxy populations from redshifts
z = 0.1 − 4 obtained using a variety of surveys for galaxies brighter than L = f L∗,
where f = 0.1, 0.4, and 1.0. We list the associated number-density matched minimum
dark matter halo mass in each case, MDM, and we use this association to identify halos
with galaxies below. For example, from the top left entry of this table, we see that
nh(> 1011.2M¯) = ng(> 0.1L∗) at z = 0.1.
Table 3.2: Dark Matter–Luminosity Relationship by Number Density Matching.
z Source > 0.1L∗ > 0.4L∗ > L∗ τ(z)
n†g M ‡DM n†g M ‡
DM n†g M ‡DM [Gyr]
0.1 SDSS 1 29 1011.2 10 1011.7 3.2 1012.3 1.790.3 COMBO-17/DEEP2 2 20 1011.4 5.8 1012.0 1.5 1012.6 1.500.5 COMBO-17/DEEP2 2 24 1011.3 7.0 1011.9 1.8 1012.5 1.280.7 COMBO-17/DEEP2 2 20 1011.4 5.8 1012.0 1.5 1012.6 1.090.9 COMBO-17/DEEP2 2 25 1011.3 7.3 1011.9 1.9 1012.5 0.951.1 COMBO-17/DEEP2 2 19 1011.4 5.5 1012.0 1.4 1012.5 0.812.2 Keck Deep Fields 3 20 1011.3 6.4 1011.7 1.8 1012.2 0.492.6 Extrapolation ∼ 18 1011.3 ∼ 5.2 1011.8 ∼ 1.2 1012.3 0.403 Keck Deep Fields 3 15 1011.2 3.8 1011.7 0.90 1012.2 0.323 LBGs 4 NA NA 5.0 1011.7 0.82 1012.2 0.324 HUDF, HST ACS 5 18 1011.0 3.2 1011.6 0.61 1012.0 0.25
†10−3 h3 Mpc−3
‡M¯1Blanton et al. (2003) (r0.1-band)2Faber et al. (2007) with DEEP2 optimal weights (B-band)3Sawicki & Thompson (2006) (UV)4Shapley et al. (2001) (V-band) – note that rest-frame V number densities matchwell with > 0.4L∗ and > L∗ values in rest-UV at z = 3.5Bouwens et al. (2007) (UV)
58
One important point of caution is that the luminosity functions used to make these
assignments at different redshifts vary in rest-frame band, as indicated in Column
2. Specifically, one concern might be that UV luminosity at low redshift is not
strongly correlated with dark matter halo mass, so assuming such a correlation for
high redshift galaxies is not valid. Unlike their low redshift counterparts, however,
there is a strong correlation in high redshift (z > 2) galaxies between star formation
and total baryonic mass, as well as a trend for more UV luminous galaxies to be more
strongly clustered, suggesting that connecting UV luminosity to halo mass at these
redshifts is a valid technique (see discussion in Conroy et al., 2008, and references
therein). Encouragingly, as shown in the two z = 3 rows, the number density of f L∗
galaxies from Sawicki & Thompson (2006; rest-frame UV) and Shapley et al. (2001;
rest-frame V) are quite similar.
We also note that the data from these various sources will contain uncertainties
in the number counts of galaxies from, e.g. cosmic variance. For example, the
COMBO17/DEEP2 data fluctuates about a nearly constant value (∼ 0.02−0.03h3Mpc−3)
from z = 0.3 − 1.1, suggesting a ∼ 30% uncertainty in these values. We find that a
30% error in the observed number density typically translates into a similar 30% error
in the assigned minimum halo mass in our simulation. Since dark matter halo merger
rates are only weakly dependent on halo mass (∝ M0.2DM), this should result in only a
∼ 10% uncertainty in our merger rates. Thus, the merger rates we present here should
be relatively robust to small errors in observational uncertainties. For example, if we
adopt minimum halo masses (regardless of redshift) of MDM = 1011.2, 1011.7, 1012.3M¯
as corresponding to > 0.1, 0.4, 1.0L∗ galaxies, respectively, our resulting merger rates
change by < 25% (typically 5− 15%).
A related approach is to use observationally-derived stellar mass functions and to
assume a monotonic relationship between halo mass and stellar mass M∗. Though a
59
monotonic relationship between total stellar mass and dark matter mass avoids the
issue of color band that arises in luminosity mapping, we cannot use it explore merger
rates as a function of stellar mass above z ∼ 2 because the stellar mass function
is poorly constrained beyond moderate redshifts. For our analysis, we will adopt
the relation advocated by Conroy & Wechsler (2009a, hereafter CW09; interpolated
from the data shown in their Figure 2). For example, CW09 find that the halo
mass M associated with stellar masses of M∗ = (1, 3, 10) × 1010M¯ at z = 0, 1, 2
are M(z = 0) ' (2.5, 7.0, 47) × 1011M¯; M(z = 1) = (4.0, 9.6, 41) × 1011; and
M(z = 2) = (2.1, 3.9, 10) × 1012M¯. We note that because this mapping between
stellar mass and halo mass is not well fit by a constant ratio, M∗ = fMDM, merger
rates in terms of stellar mass ratios show qualitatively different evolution with redshift
(see §3.6.1). This is primarily because mergers of a fixed dark matter mass ratio do
not typically correspond to the same stellar mass ratio (Stewart, 2009).
Note that while the dark matter halo merger rates presented in §3.4 give robust
theoretical predictions, the merger rates we will present in terms of luminosity (or
stellar mass) are sensitive to these mappings between halo mass and L (or M∗). In
addition, it is difficult to perform a detailed investigation into the errors associated
with these mappings, as there are inherent uncertainties in the luminosity and stellar
mass functions, especially at z > 1. It is also possible that the monotonic mapping
between halo mass and L (or M∗) may break down at z > 1 (see discussion in CW09).
These uncertainties must be kept in mind when comparing our predicted merger rates
(in terms of L or M∗) to observations, especially at high redshift. Nevertheless, the
halo masses we have associated with a given relative brightness should be indicative.
60
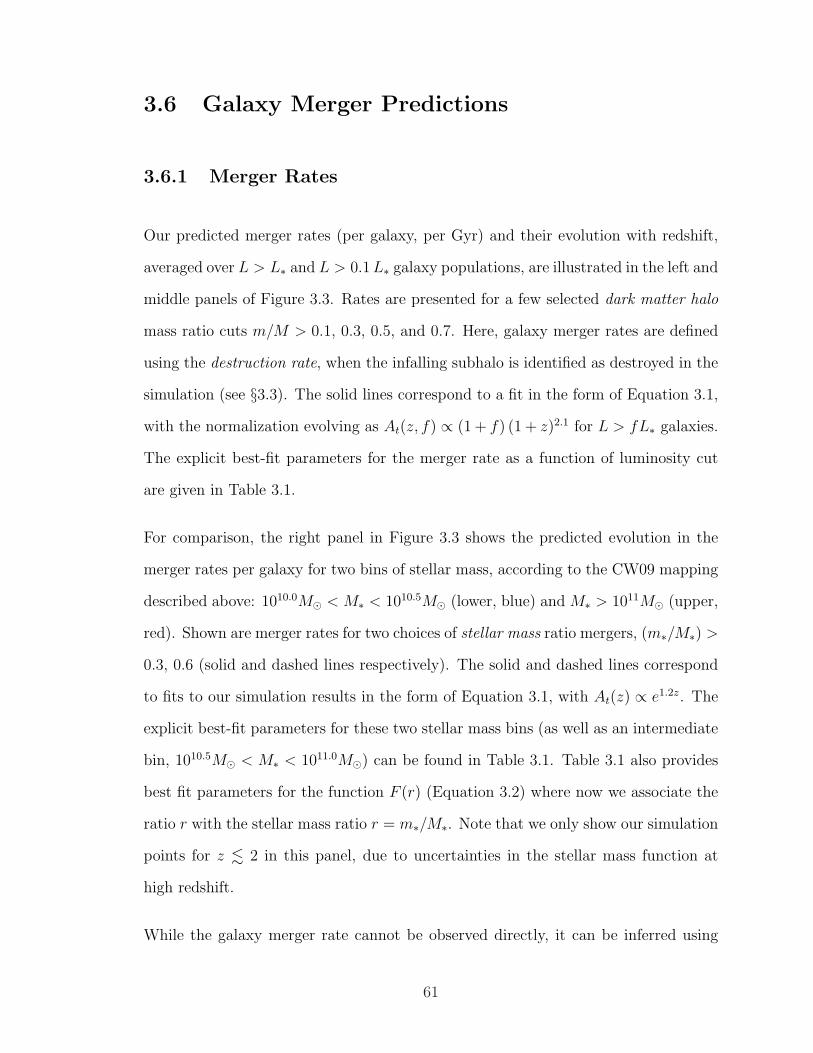
3.6 Galaxy Merger Predictions
3.6.1 Merger Rates
Our predicted merger rates (per galaxy, per Gyr) and their evolution with redshift,
averaged over L > L∗ and L > 0.1 L∗ galaxy populations, are illustrated in the left and
middle panels of Figure 3.3. Rates are presented for a few selected dark matter halo
mass ratio cuts m/M > 0.1, 0.3, 0.5, and 0.7. Here, galaxy merger rates are defined
using the destruction rate, when the infalling subhalo is identified as destroyed in the
simulation (see §3.3). The solid lines correspond to a fit in the form of Equation 3.1,
with the normalization evolving as At(z, f) ∝ (1 + f) (1 + z)2.1 for L > fL∗ galaxies.
The explicit best-fit parameters for the merger rate as a function of luminosity cut
are given in Table 3.1.
For comparison, the right panel in Figure 3.3 shows the predicted evolution in the
merger rates per galaxy for two bins of stellar mass, according to the CW09 mapping
described above: 1010.0M¯ < M∗ < 1010.5M¯ (lower, blue) and M∗ > 1011M¯ (upper,
red). Shown are merger rates for two choices of stellar mass ratio mergers, (m∗/M∗) >
0.3, 0.6 (solid and dashed lines respectively). The solid and dashed lines correspond
to fits to our simulation results in the form of Equation 3.1, with At(z) ∝ e1.2z. The
explicit best-fit parameters for these two stellar mass bins (as well as an intermediate
bin, 1010.5M¯ < M∗ < 1011.0M¯) can be found in Table 3.1. Table 3.1 also provides
best fit parameters for the function F (r) (Equation 3.2) where now we associate the
ratio r with the stellar mass ratio r = m∗/M∗. Note that we only show our simulation
points for z . 2 in this panel, due to uncertainties in the stellar mass function at
high redshift.
While the galaxy merger rate cannot be observed directly, it can be inferred using
61
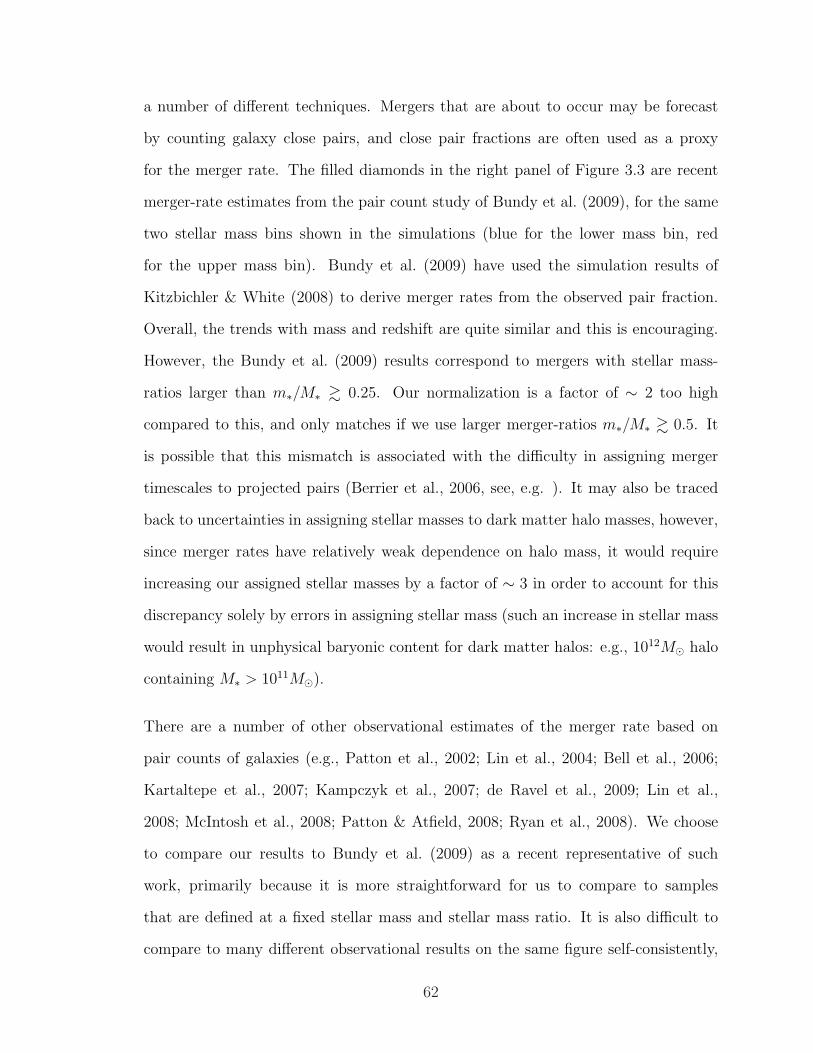
a number of different techniques. Mergers that are about to occur may be forecast
by counting galaxy close pairs, and close pair fractions are often used as a proxy
for the merger rate. The filled diamonds in the right panel of Figure 3.3 are recent
merger-rate estimates from the pair count study of Bundy et al. (2009), for the same
two stellar mass bins shown in the simulations (blue for the lower mass bin, red
for the upper mass bin). Bundy et al. (2009) have used the simulation results of
Kitzbichler & White (2008) to derive merger rates from the observed pair fraction.
Overall, the trends with mass and redshift are quite similar and this is encouraging.
However, the Bundy et al. (2009) results correspond to mergers with stellar mass-
ratios larger than m∗/M∗ & 0.25. Our normalization is a factor of ∼ 2 too high
compared to this, and only matches if we use larger merger-ratios m∗/M∗ & 0.5. It
is possible that this mismatch is associated with the difficulty in assigning merger
timescales to projected pairs (Berrier et al., 2006, see, e.g. ). It may also be traced
back to uncertainties in assigning stellar masses to dark matter halo masses, however,
since merger rates have relatively weak dependence on halo mass, it would require
increasing our assigned stellar masses by a factor of ∼ 3 in order to account for this
discrepancy solely by errors in assigning stellar mass (such an increase in stellar mass
would result in unphysical baryonic content for dark matter halos: e.g., 1012M¯ halo
containing M∗ > 1011M¯).
There are a number of other observational estimates of the merger rate based on
pair counts of galaxies (e.g., Patton et al., 2002; Lin et al., 2004; Bell et al., 2006;
Kartaltepe et al., 2007; Kampczyk et al., 2007; de Ravel et al., 2009; Lin et al.,
2008; McIntosh et al., 2008; Patton & Atfield, 2008; Ryan et al., 2008). We choose
to compare our results to Bundy et al. (2009) as a recent representative of such
work, primarily because it is more straightforward for us to compare to samples
that are defined at a fixed stellar mass and stellar mass ratio. It is also difficult to
compare to many different observational results on the same figure self-consistently,
62
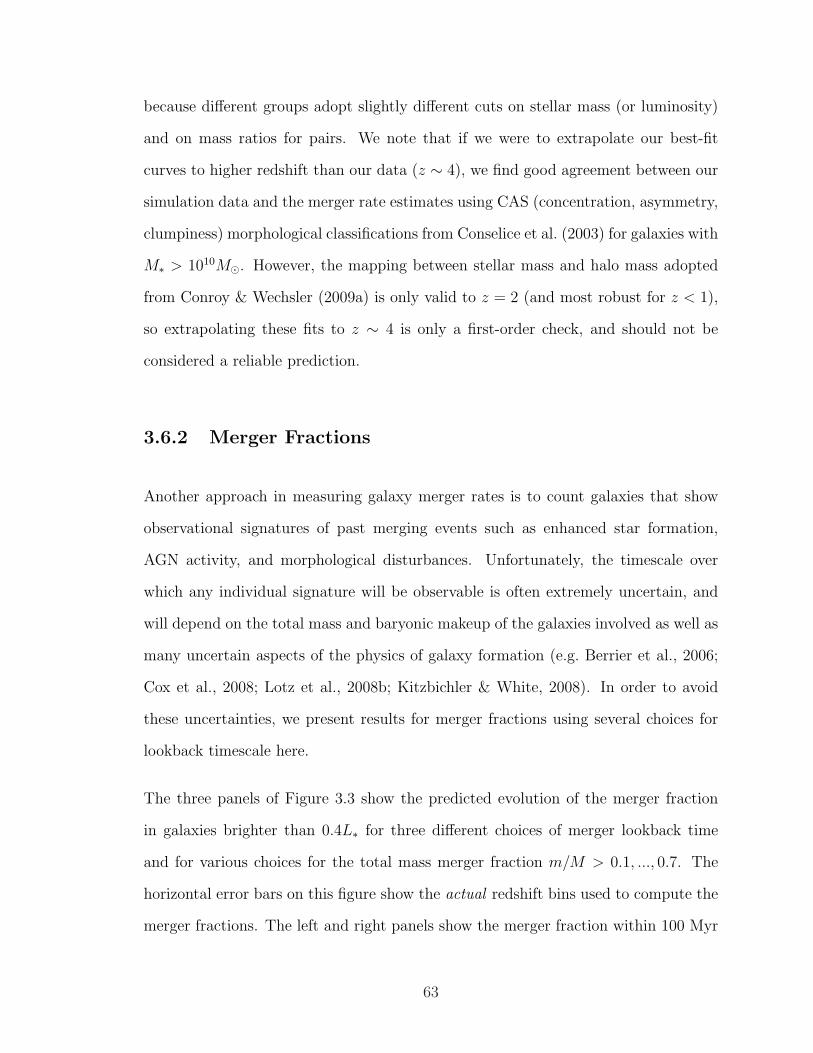
because different groups adopt slightly different cuts on stellar mass (or luminosity)
and on mass ratios for pairs. We note that if we were to extrapolate our best-fit
curves to higher redshift than our data (z ∼ 4), we find good agreement between our
simulation data and the merger rate estimates using CAS (concentration, asymmetry,
clumpiness) morphological classifications from Conselice et al. (2003) for galaxies with
M∗ > 1010M¯. However, the mapping between stellar mass and halo mass adopted
from Conroy & Wechsler (2009a) is only valid to z = 2 (and most robust for z < 1),
so extrapolating these fits to z ∼ 4 is only a first-order check, and should not be
considered a reliable prediction.
3.6.2 Merger Fractions
Another approach in measuring galaxy merger rates is to count galaxies that show
observational signatures of past merging events such as enhanced star formation,
AGN activity, and morphological disturbances. Unfortunately, the timescale over
which any individual signature will be observable is often extremely uncertain, and
will depend on the total mass and baryonic makeup of the galaxies involved as well as
many uncertain aspects of the physics of galaxy formation (e.g. Berrier et al., 2006;
Cox et al., 2008; Lotz et al., 2008b; Kitzbichler & White, 2008). In order to avoid
these uncertainties, we present results for merger fractions using several choices for
lookback timescale here.
The three panels of Figure 3.3 show the predicted evolution of the merger fraction
in galaxies brighter than 0.4L∗ for three different choices of merger lookback time
and for various choices for the total mass merger fraction m/M > 0.1, ..., 0.7. The
horizontal error bars on this figure show the actual redshift bins used to compute the
merger fractions. The left and right panels show the merger fraction within 100 Myr
63
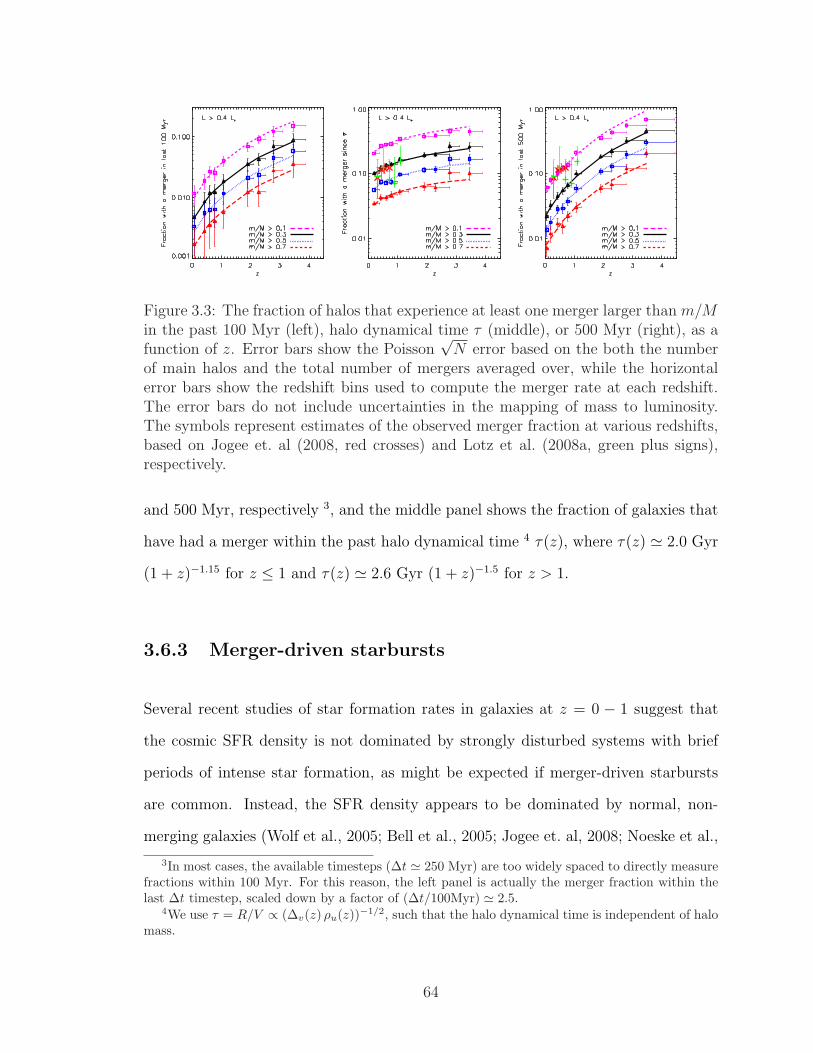
Figure 3.3: The fraction of halos that experience at least one merger larger than m/Min the past 100 Myr (left), halo dynamical time τ (middle), or 500 Myr (right), as afunction of z. Error bars show the Poisson
√N error based on the both the number
of main halos and the total number of mergers averaged over, while the horizontalerror bars show the redshift bins used to compute the merger rate at each redshift.The error bars do not include uncertainties in the mapping of mass to luminosity.The symbols represent estimates of the observed merger fraction at various redshifts,based on Jogee et. al (2008, red crosses) and Lotz et al. (2008a, green plus signs),respectively.
and 500 Myr, respectively 3, and the middle panel shows the fraction of galaxies that
have had a merger within the past halo dynamical time 4 τ(z), where τ(z) ' 2.0 Gyr
(1 + z)−1.15 for z ≤ 1 and τ(z) ' 2.6 Gyr (1 + z)−1.5 for z > 1.
3.6.3 Merger-driven starbursts
Several recent studies of star formation rates in galaxies at z = 0 − 1 suggest that
the cosmic SFR density is not dominated by strongly disturbed systems with brief
periods of intense star formation, as might be expected if merger-driven starbursts
are common. Instead, the SFR density appears to be dominated by normal, non-
merging galaxies (Wolf et al., 2005; Bell et al., 2005; Jogee et. al, 2008; Noeske et al.,
3In most cases, the available timesteps (∆t ' 250 Myr) are too widely spaced to directly measurefractions within 100 Myr. For this reason, the left panel is actually the merger fraction within thelast ∆t timestep, scaled down by a factor of (∆t/100Myr) ' 2.5.
4We use τ = R/V ∝ (∆v(z) ρu(z))−1/2, such that the halo dynamical time is independent of halomass.
64

2007). That is, < 30% of the instantaneous SFR density at a given redshift (from
z = 0−1) is derived from morphologically disturbed galaxies, which may be currently
undergoing a merger-induced starburst. Even at high redshift (z ∼ 2), a comparison
of the clustering of star-forming galaxies to that of dark matter halos suggests that
these galaxies are consistent with massive galaxies (in massive DM halos) quiescently
forming stars, as opposed to less massive galaxies (less massive DM halos) in the midst
of merger-induced starbursts (Conroy et al., 2008). However, this conclusion is based
on the assumption that UV-bright galaxies at this redshift comprise a representative
sample of star-forming galaxies.
As discussed in the introduction, the briefest timescales we expect for merger-triggered
starbursts is ∼ 100 Myr (Mihos & Hernquist, 1996; Cox et al., 2008), and for these
models we expect the SFR to increase to ∼ 20 times the isolated value for m/M & 0.3
events (Cox et al., 2008). (While we adopt these timescales as “typical” of galaxy
mergers, it is important to keep in mind that Cox et al. (2008) focuses on z = 0
galaxies. High redshift galaxies should typically contain higher gas fractions, which
may impact the properties of merger-induced starbursts at these epochs.) As we see
from the left-panel of Figure 3.3, the fraction of galaxies that have a merger large
enough (m/M > 0.3) to trigger such a burst is quite small, . 1% for z . 1. It
is therefore not surprising that stochastic starbursts of this kind do not dominate
the SFR density at moderate to low redshifts. Even at at higher redshift (z =
3 − 4), the fraction of galaxies with major mergers on these timescales is less than
∼ 6% of the total bright galaxy population (consistent with the results presented in
Somerville et al. (2008), for their semi-analytic model). However, galaxy gas fractions
are expected to increase with redshift (Erb et al., 2006), which could presumably
result in significant starburst activity from more minor mergers (as well as providing
fresh gas accretion in a more cumulative sense, see Chapter 4). A higher fraction
of galaxies have experienced such minor (> 1/10) mergers on these timescales at
65
z = 3− 4 (∼ 15%).
Alternatively, if merger-driven starbursts remain active for ∼ 500 Myr, as other mod-
els suggest, then their enhancements are expected to be less pronounced (with an
SFR ∼ 5 times isolated; Cox et al. 2008). In this case, the right panel of Figure 3.3 is
the relevant prediction, and we see that (at most) ∼ 3− 9% of bright galaxies could
exhibit signs of such elevated SFR activity between z = 0 and z = 1. It seems that
in either case, we would not expect merger-triggered activity to play a major role
in driving the integrated star formation rate at these epochs. Only at the highest
redshifts z & 3 would this seem possible. However, we once again point out that the
detailed study of Cox et al. 2008, which we have quoted here, focuses on low redshift
galaxies, with gas fractions < 30%. If minor mergers with very high gas fractions
(> 50%) are capable of triggering starbursts, then over half of all bright galaxies at
z > 2 (where such high gas fractions are more common) may be in the process of
starbursting.
Under the presumption that only major mergers trigger starbursts, we note that
our numbers are an upper limit on the fraction of bright galaxies that could be
experiencing merger-induced starbursts, because moderately high gas fractions are
also necessary. For example, a study of 216 galaxies at z ∼ 2−3 by Law et al. (2007b)
found that galaxy morphology (in rest-frame UV) was not necessarily correlated with
star formation rate, and in a recent examination of two Chandra Deep Field South
sources using adaptive optics, Melbourne et al. (2005) found an example of a merger
of two evolved stellar populations, in which the major merger signature was not
accompanied by a burst of star formation, presumably because both galaxies were
gas-poor. Lin et al. (2008) finds that ∼ 8% (25%) of mergers at z ∼ 1.1 (0.1) are gas-
poor, suggesting that this issue, while less dominant at high redshift, is a significant
effect and must be taken into consideration.
66
We note that we have focused on galaxies which are in the midst of a merger-induced
starburst. The lingering impact these bursts will have on the cumulative star forma-
tion histories (SFH) of galaxies in a separate issue entirely. A recent study by Cowie
& Barger (2008) traced recent star formation in > 2000 galaxies from z = .05 − 1.5
and found that roughly a quarter of these galaxies showed color indications (AB3400-
AB8140 vs. EW in Hβ) indicative of starbursts in the past 0.3 − 1.0 Gyr. Once
again, we find our predictions to be broadly consistent with this result, with ∼ 20%
of bright galaxies (> 0.4L∗) having experienced a major merger in the past Gyr at
z ∼ 1. With this study of individual galaxies’ star formation histories emphasiz-
ing the importance of starbursts, and the previously mentioned studies of the global
SFR density emphasizing the importance of star formation in normal, non-merging
systems, we find that our predicted merger rates are broadly consistent with both
results, suggesting that while starbursts may not be the globally dominant form of
star formation in the Universe, they still play an important role in the star forma-
tion histories of galaxies. Detailed progress in understanding the full importance of
merger-induced starbursts on the global SFR density of the Universe will require a
better understanding of the timescales and signatures associated with galaxy mergers
and merger-induced starbursts.
3.6.4 Morphological signatures
Even if the contribution to the overall SFR due to very recent mergers remains low,
this does not necessarily imply that there would be a lack of morphological signature.
The timescale for morphological relaxation may be significantly longer than starburst
activity. Though the precise timescales for relaxation are uncertain, the middle and
right panels of Figure 3.3 explore merger fractions for two reasonable choices: a fixed
500 Myr timescale and a redshift-dependent halo dynamical time τ .
67
Lotz et al. (2008a) used AEGIS survey data to study the morphological evolution
and implied galaxy merger fraction from redshift z = 0.2 to 1.2. The merger fraction
results for > 0.4L∗ galaxies from Lotz et al. (2008a) are shown by the green pluses
in the middle and right panels of Figure 3.3. In a similar investigation, Jogee et. al
(2008) study z = 0.2 − 0.8 galaxies using a combination of HST, ACS, Combo-17,
and Spitzer 24 µm data to estimate the fraction of “strongly disturbed” galaxies.
Their results 5 are shown by the red crosses in Figure 3.3, and are in reasonably good
agreement with the points from Lotz et al. (2008a). We note that the data from
these very recent works seem to be in good agreement with the m/M > 0.3 merger
fraction if the relaxation time is close to τ . This case in particular has a fairly weak
evolution because τ is decreasing with time. Interestingly, however, due to the rather
large measurement uncertainties, the data are also in reasonable agreement with the
fixed relaxation timescale case of 500 Myr (which has a steeper evolution with z),
as long as more minor mergers (m/M > 0.1) can trigger the observed activity. The
fact that the data matches both the predictions in the middle panel and right panel
of Figure 3.3 draws attention to the inherent degeneracies in this comparison. The
same merger fractions are obtained with high-mass ratio merger events and lookback
times or with lower mass ratio mergers with slightly shorter lookback times.
We may also compare our predictions with the results of Melbourne et al. (2008), who
imaged 15 z ∼ 0.8 luminous infrared galaxies (LIRGs) with the Keck Laser Guide Star
(LGS) AO facility, and found that 3/15 of the galaxies showed evidence for a minor
merger, while only 1/15 was consistent with a major merger. These results match
our expectations for major (m/M > 0.3) and minor (m/M > 0.1) merger fractions
at z ∼ 0.8 fairly well, considering the small number statistics. Similarly, Shapiro et
al. (2008) study 11 rest-frame UV/optical-selected z∼2 galaxies with spectroscopic
5The data from Jogee et. al (2008) correspond to a fixed stellar mass cut at M∗ ∼ 2.5× 10¹⁰M¯,but the associated dark matter halo mappings from CW09 are close to those for galaxies with> 0.4L∗ (see Table 3.1 and our discussion in §3.5).
68
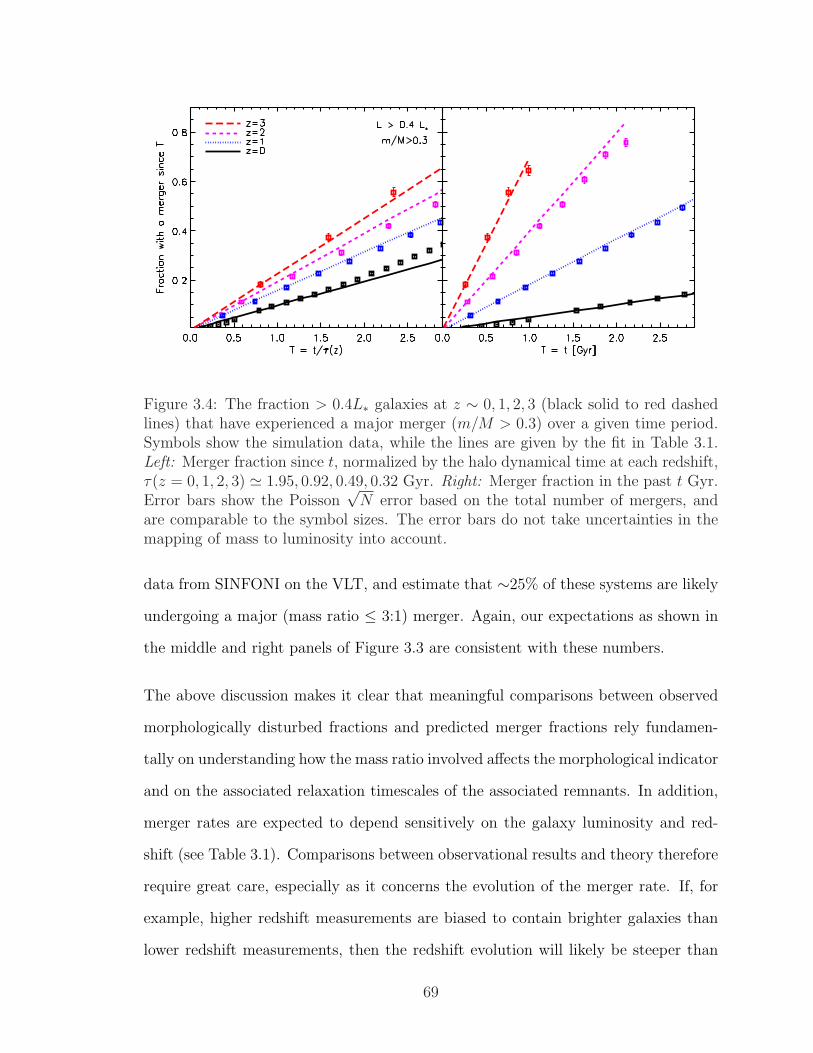
Figure 3.4: The fraction > 0.4L∗ galaxies at z ∼ 0, 1, 2, 3 (black solid to red dashedlines) that have experienced a major merger (m/M > 0.3) over a given time period.Symbols show the simulation data, while the lines are given by the fit in Table 3.1.Left: Merger fraction since t, normalized by the halo dynamical time at each redshift,τ(z = 0, 1, 2, 3) ' 1.95, 0.92, 0.49, 0.32 Gyr. Right: Merger fraction in the past t Gyr.Error bars show the Poisson
√N error based on the total number of mergers, and
are comparable to the symbol sizes. The error bars do not take uncertainties in themapping of mass to luminosity into account.
data from SINFONI on the VLT, and estimate that ∼25% of these systems are likely
undergoing a major (mass ratio ≤ 3:1) merger. Again, our expectations as shown in
the middle and right panels of Figure 3.3 are consistent with these numbers.
The above discussion makes it clear that meaningful comparisons between observed
morphologically disturbed fractions and predicted merger fractions rely fundamen-
tally on understanding how the mass ratio involved affects the morphological indicator
and on the associated relaxation timescales of the associated remnants. In addition,
merger rates are expected to depend sensitively on the galaxy luminosity and red-
shift (see Table 3.1). Comparisons between observational results and theory therefore
require great care, especially as it concerns the evolution of the merger rate. If, for
example, higher redshift measurements are biased to contain brighter galaxies than
lower redshift measurements, then the redshift evolution will likely be steeper than
69
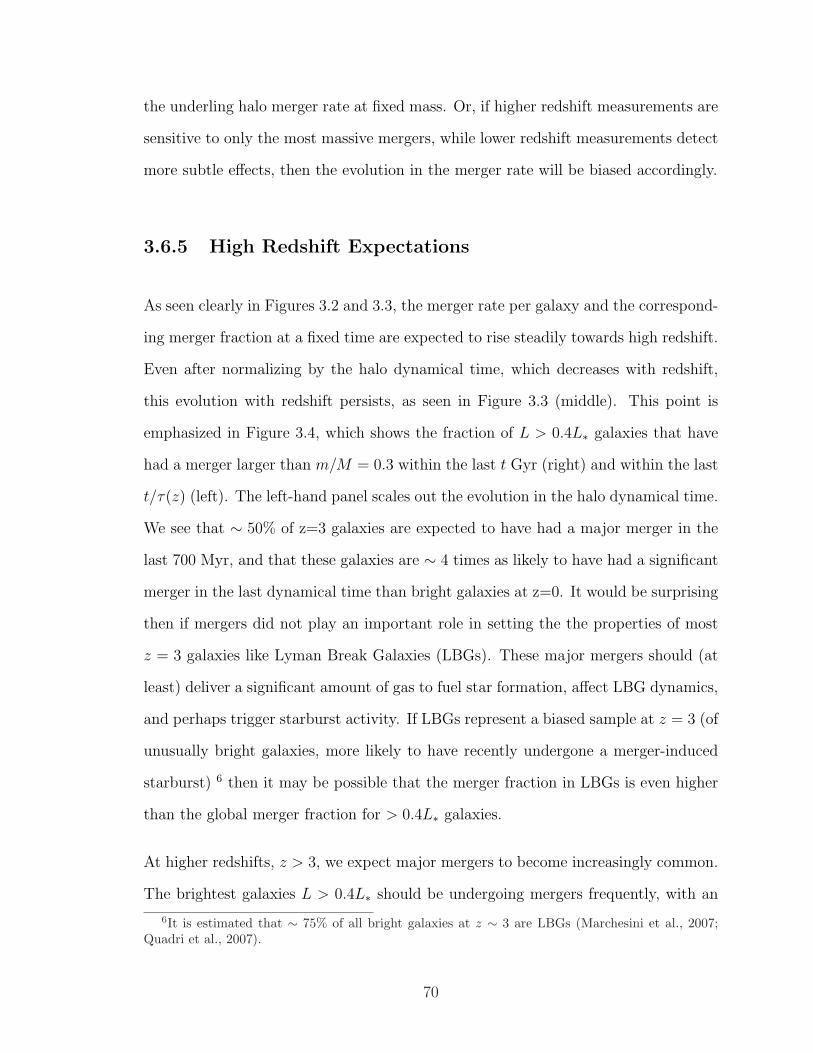
the underling halo merger rate at fixed mass. Or, if higher redshift measurements are
sensitive to only the most massive mergers, while lower redshift measurements detect
more subtle effects, then the evolution in the merger rate will be biased accordingly.
3.6.5 High Redshift Expectations
As seen clearly in Figures 3.2 and 3.3, the merger rate per galaxy and the correspond-
ing merger fraction at a fixed time are expected to rise steadily towards high redshift.
Even after normalizing by the halo dynamical time, which decreases with redshift,
this evolution with redshift persists, as seen in Figure 3.3 (middle). This point is
emphasized in Figure 3.4, which shows the fraction of L > 0.4L∗ galaxies that have
had a merger larger than m/M = 0.3 within the last t Gyr (right) and within the last
t/τ(z) (left). The left-hand panel scales out the evolution in the halo dynamical time.
We see that ∼ 50% of z=3 galaxies are expected to have had a major merger in the
last 700 Myr, and that these galaxies are ∼ 4 times as likely to have had a significant
merger in the last dynamical time than bright galaxies at z=0. It would be surprising
then if mergers did not play an important role in setting the the properties of most
z = 3 galaxies like Lyman Break Galaxies (LBGs). These major mergers should (at
least) deliver a significant amount of gas to fuel star formation, affect LBG dynamics,
and perhaps trigger starburst activity. If LBGs represent a biased sample at z = 3 (of
unusually bright galaxies, more likely to have recently undergone a merger-induced
starburst) 6 then it may be possible that the merger fraction in LBGs is even higher
than the global merger fraction for > 0.4L∗ galaxies.
At higher redshifts, z > 3, we expect major mergers to become increasingly common.
The brightest galaxies L > 0.4L∗ should be undergoing mergers frequently, with an
6It is estimated that ∼ 75% of all bright galaxies at z ∼ 3 are LBGs (Marchesini et al., 2007;Quadri et al., 2007).
70
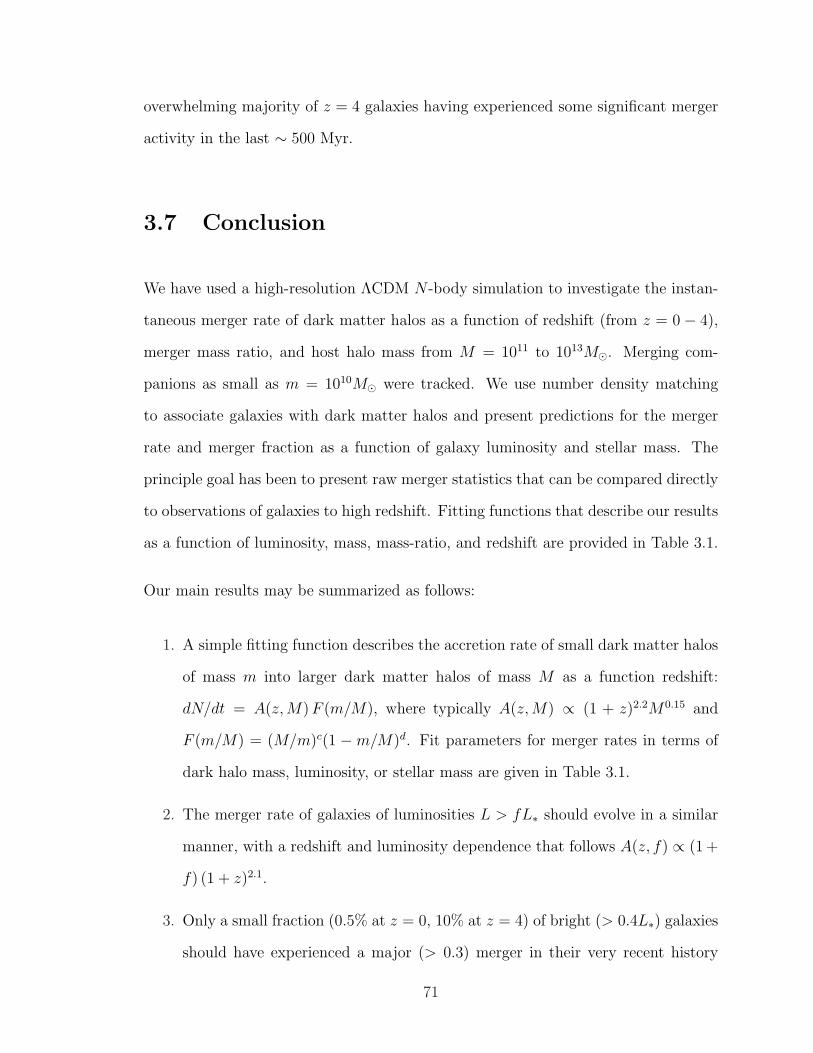
overwhelming majority of z = 4 galaxies having experienced some significant merger
activity in the last ∼ 500 Myr.
3.7 Conclusion
We have used a high-resolution ΛCDM N -body simulation to investigate the instan-
taneous merger rate of dark matter halos as a function of redshift (from z = 0− 4),
merger mass ratio, and host halo mass from M = 1011 to 1013M¯. Merging com-
panions as small as m = 1010M¯ were tracked. We use number density matching
to associate galaxies with dark matter halos and present predictions for the merger
rate and merger fraction as a function of galaxy luminosity and stellar mass. The
principle goal has been to present raw merger statistics that can be compared directly
to observations of galaxies to high redshift. Fitting functions that describe our results
as a function of luminosity, mass, mass-ratio, and redshift are provided in Table 3.1.
Our main results may be summarized as follows:
1. A simple fitting function describes the accretion rate of small dark matter halos
of mass m into larger dark matter halos of mass M as a function redshift:
dN/dt = A(z, M) F (m/M), where typically A(z,M) ∝ (1 + z)2.2M0.15 and
F (m/M) = (M/m)c(1 −m/M)d. Fit parameters for merger rates in terms of
dark halo mass, luminosity, or stellar mass are given in Table 3.1.
2. The merger rate of galaxies of luminosities L > fL∗ should evolve in a similar
manner, with a redshift and luminosity dependence that follows A(z, f) ∝ (1 +
f) (1 + z)2.1.
3. Only a small fraction (0.5% at z = 0, 10% at z = 4) of bright (> 0.4L∗) galaxies
should have experienced a major (> 0.3) merger in their very recent history
71
(100 Myr, Figure 3.3 left panel). Even if mergers trigger the kind of short-lived,
highly-efficient star formation bursts that are expected in some models, they
cannot contribute significantly to the overall distribution of star formation rates
at any given epoch.
4. The predicted fraction of galaxies with a merger in the past 500 Myr, or alterna-
tively within a past halo dynamical time, are in reasonable agreement with the
fraction of galaxies that show observational signs of morphological disturbance
between redshifts z = 0−2 (Figure 3.3, middle and left panels). We emphasize,
however, that comparisons between theory and observations suffer from sig-
nificant uncertainties associated with mass-ratio dependencies and relaxation
timescales.
5. Galaxy merger rates should depend on at least three parameters: mass (or lumi-
nosity), merger mass ratio, and redshift (see Table 3.1). Therefore any attempt
to compare two observational indicators of the merger rate or to relate specific
observations to theoretical predictions must take great care in the respective
comparisons.
6. Mergers must become increasingly important in shaping galaxy properties at
z > 3. At z = 3, the fraction of galaxies with a merger in the past dynamical
time is ∼ 4 times higher than at z = 0. We expect ∼ 30% (60%) of > 0.4L∗
galaxies to have experienced a m/M > 0.3 major (m/M > 0.1 minor) merger
in the past 500 Myr at z = 3. Though it is unlikely that short-lived starbursts
associated with these mergers drive the increase in the global star formation
rate of galaxies with redshift, the broader implications of these mergers (fresh
supply of gas brought in to the central galaxy through accreted satellites, etc.)
are undoubtedly linked to star formation and the general growth of galaxies on
longer timescales.
72
3.8 Acknowledgements
The contents of this chapter were previously published by Stewart, Bullock, Barton
and Wechsler (2009) in The Astrophysics Journal, September 2009 (v702, p1005). The
simulation used in this chapter was run on the Columbia machine at NASA Ames.
We would like to thank Anatoly Klypin for running the simulation and making it
available to us. We are also indebted to Brandon Allgood for providing the merger
trees. We thank Charlie Conroy for providing us the abundance matching data from
CW09, and Kevin Bundy for providing us with an advance copy of his paper before
publication. We thank Jeff Cooke, David Law, Lihwai Lin, Ari Maller, David Patton,
Brant Robertson, and Andrew Wetzel for useful discussions.
73
Chapter 4
Gas-Rich Mergers and Disk
Survivability
4.1 Chapter Abstract
We use N -body simulations and observationally-normalized relations between dark
matter halo mass, stellar mass, and cold gas mass to derive robust expectations about
the baryonic content of major mergers out to redshift z ∼ 2. First, we find that the
majority of major mergers (m/M > 0.3) experienced by Milky Way size dark matter
halos should have been gas-rich, and that gas-rich mergers are increasingly common
at high redshift. Though the frequency of major mergers into galaxy halos in our
simulations greatly exceeds the observed early-type galaxy fraction, the frequency of
gas-poor major mergers is consistent with the observed fraction of bulge-dominated
galaxies across the halo mass range MDM ∼ 1011 − 1013M¯. These results lend
support to the conjecture that mergers with high baryonic gas fractions play an
important role in building and/or preserving disk galaxies in the universe. Secondly,
74
we find that there is a transition mass below which a galaxy’s past major mergers
were primarily gas-rich and above which they were gas poor. The associated stellar
mass scale corresponds closely to that marking the observed bimodal division between
blue, star-forming, disk-dominated systems and red, bulge-dominated systems with
old populations. Finally, we find that the overall fraction of a galaxy’s cold baryons
deposited directly via major mergers is significant. Approximately ∼ 20− 30% of the
cold baryonic material in Mstar ∼ 1010.5M¯ (MDM ∼ 1012M¯) galaxies is accreted as
cold gas or stars via major mergers since z = 2, with most of this accretion in the form
of cold gas. For more massive galaxies with Mstar ∼ 1011M¯ (MDM ∼ 1013M¯) the
fraction of baryons amassed in mergers since z = 2 is even higher, ∼ 40%, but most of
these accreted baryons are delivered directly in the form of stars. This baryonic mass
deposition is almost unavoidable, and provides a limit on the fraction of a galaxy’s
cold baryons that can originate in cold flows or from hot halo cooling.
4.2 Introduction
In the cold dark matter (CDM) model of structure formation, major galaxy mergers
are believed to play an important role in determining a galaxy’s morphology (e.g.
Toomre & Toomre, 1972; Barnes & Hernquist, 1996; Robertson et al., 2006a,b; Burk-
ert et al., 2008), as well as triggering star formation and AGN activity (e.g. Mihos &
Hernquist, 1996; Heckman et al., 1986; Springel et al., 2005a; Cox et al., 2008), while
minor mergers may help explain the origin of thick disks and extended diffuse light
components around galaxies (Barnes & Hernquist, 1996; Kazantzidis et al., 2008; Pur-
cell et al., 2007; Younger et al., 2007; Purcell et al., 2008; Villalobos & Helmi, 2008;
Kazantzidis et al., 2009). More than simply triggering star formation in existing gas
and altering existing galaxy morphologies, mergers deliver new stars and additional
75
fuel for star formation, and thereby contribute to baryonic acquisition of galaxies over
their histories. That mergers contribute significantly to many aspects of galaxy for-
mation is now fairly well accepted, however there are lingering concerns that mergers
are too common in CDM to explain the prominence of thin disk-dominated galaxies
in the local universe (e.g. Toth & Ostriker, 1992; Walker et al., 1996; Stewart et al.,
2008; Purcell et al., 2009; Bullock et al., 2009b, and references therein). Here we ex-
plore the baryonic content of these predicted mergers and the potential ramifications
of gas-rich and gas-poor mergers on galactic morphological evolution.
The baryonic delivery of material into galaxies via major mergers touches on a broader
question in galaxy formation: how do galaxies get their baryons? In recent years,
studies motivated by hydrodynamic simulations have placed a growing emphasis on
the importance of smooth gas accretion via “cold flows.” These cold flows constitute
streams of cold gas flowing along filamentary structures (particularly at high redshift)
with sufficiently high densities to penetrate into a halo’s central region without heating
the gas to the virial temperature (e.g. Birnboim & Dekel, 2003; Keres et al., 2005;
Dekel & Birnboim, 2006; Keres et al., 2009; Dekel et al., 2009; Brooks et al., 2009;
Agertz et al., 2009). These simulations demonstrate a characteristic halo mass scale
(∼ 1012M¯) below which cold streams are the dominant mode of gas accretion, and
above which gas cooling directly from shock-heated (hot mode) material dominates.
Though there has yet to be any observational evidence that cold flows actually occur
in nature, the possibility is well motivated by theory and is suggestive of a number
of interesting scenarios for galaxy assembly. One particularly interesting idea is that
flows of cold gas are vital to the formation of disk galaxies at high redshift z & 1
(Dekel et al., 2009). Still, even if disks were built at high redshift via streams of
cold gas, we can return to the issue of disk survival raised above. How do observed
populations of disk galaxies at high redshift (e.g. Wright et al., 2009, at z ∼ 1.6)
76
survive subsequent mergers and remain disk-dominated by z = 0?
In Chapter 2 we studied the merger histories of Milky Way-size dark matter halos
within a cosmological N -body simulation and found that approximately 70% should
have accreted an object with more than twice the mass of the Milky Way disk (m >
1011M¯) in the last 10 Gyr. In order to achieve the ∼ 70% disk-dominated fraction
that has been observed in Milky Way-sized halos (Weinmann et al., 2006; Park et al.,
2007; Choi et al., 2007; Weinmann et al., 2009), mergers involving > 1/3 mass-ratio
events must not always destroy disks. Adding to the associated concern, Purcell,
Kazantzidis, and Bullock (2008b) performed focused numerical experiments to study
the impact of m = 1011M¯ encounters onto fully-formed Milky-Way type thin stellar
disks and concluded that thin (∼ 400 pc) dissipationless stellar disks do not survive
these (presumably common) encounters.
One possible solution appeals to the role of cold gas in mergers. Focused merger sim-
ulations in the past few years have begun to suggest that sufficiently gas-rich mergers
may help build angular momentum in the central galaxy, while feedback physics pre-
vents the gas from forming stars too quickly, resulting in a disk-dominated merger
remnant (Barnes, 2002; Springel & Hernquist, 2005; Robertson et al., 2006a; Brook
et al., 2007b; Hopkins et al., 2009a; Robertson & Bullock, 2008). Encouragingly,
cosmological simulations that have been successful in reproducing disk galaxies have
also shown that gas-rich mergers have played an important role in the disk’s creation
(e.g. Brook et al., 2004; Governato et al., 2007, 2009), and there have been recent ob-
servations of late-type galaxies that may be in the process of reforming after a recent
gas-rich major merger (e.g. Hammer et al., 2009b). Robertson & Bullock (2008) also
showed that the disk-like merger remnants from gas-rich mergers are similar to the
kinematically hot disks that have been observed at z ∼ 2 (Forster Schreiber et al.,
2006; Genzel et al., 2006; Shapiro et al., 2008).
77
Our goal in this work is to provide an empirically-motivated accounting for the ex-
pected gas and stellar content of mergers by relying on robustly determined dark
matter halo merger rates. We aim first to determine whether gas-rich mergers are
common enough to significantly alleviate the disk formation problem (a necessary but
not sufficient condition in evaluating this scenario). We also aim to investigate the
overall importance that mergers play in the acquisition of a galaxy’s cold baryons.
While the merger histories of the dark matter halos are predicted accurately in dissi-
pationless N -body simulations, the baryonic content of these mergers are much more
difficult to predict from first principles. Indeed, an accurate ab initio accounting
of the baryonic content of dark matter halos would require an overarching theory
that solved all of the major problems in galaxy formation, including star formation,
feedback, and the complicated interplay between mergers and galaxy assembly. In
this work we chose to avoid the issues of galaxy formation physics entirely. Instead
we adopt a semi-empirical approach that forces our model to match observations at
various redshifts. First, we adopt the technique of monotonic abundance matching to
assign stellar masses to dark matter halos (specifically following Conroy & Wechsler,
2009a). Second, we use observational relations between stellar mass and gas mass
(e.g. McGaugh, 2005; Erb et al., 2006) to assign gas masses to our halos. We then
combine these relations with the N -body halo merger histories described in Chapters
2 and 3 in order to determine the baryonic properties of mergers back to redshift
z ∼ 2. In §4.3 we discuss the details of our method. We present our primary results
and discuss the implications for disk survival and the baryonic assembly of galaxies
via mergers in §4.4. We summarize our main conclusions in §4.5.
78
4.3 Method
4.3.1 The Simulation
Our simulation contains 5123 particles, each with mass mp = 3.16× 10⁸M¯, evolved
within a comoving cubic volume of 80h−1 Mpc on a side using the Adaptive Refine-
ment Tree (ART) N -body code (Kravtsov et al., 1997, 2004). We assume LCDM
cosmological parameters: ΩM = 1 − ΩΛ = 0.3, h = 0.7, and σ8 = 0.9. The simula-
tion root computational grid consists of 5123 cells, which are adaptively refined to a
maximum of eight levels, resulting in a peak spatial resolution of 1.2h−1 kpc (comov-
ing). We give only a brief overview of the simulation here, as it has been reviewed
more extensively in previous works. We refer the reader to Chapter 2, and references
therein, for a more complete discussion.
Field dark matter halos and subhalos are identified using a variant of the bound
density maxima algorithm (Klypin et al., 1999a). A subhalo is defined as a dark
matter halo whose center is positioned within the virial radius of a more massive
halo, whereas a field halo does not. The virial radius is defined as the radius of
a collapsed self gravitating dark matter halo within which the average density is
∆vir times the mean density of the universe. Under comparison to constructed mass
functions, we have determined that our halo catalogs are complete to a minimum
mass of 1010M¯, and our sample includes ∼ 17, 000 field halos at z = 0 in the mass
range M = 1011.2−13.2M¯. We use the same merger trees described in Chapter 2,
constructed using the techniques described in Wechsler et al. (2002, 2006).
We present our results primarily in terms of the dark matter mass ratio between the
two halos that are undergoing a merger, (m/M)DM, where we always define mDM as
the mass of the smaller dark matter halo (which we will sometimes refer to as the
79
satellite halo) just prior to entering the virial radius of the larger one, and MDM is
the mass of the larger dark matter halo (also referred to as the host halo) at this infall
epoch. Thus, MDM does not incorporate the mass mDM, and (m/M)DM has a maxi-
mum value of 1.0. However, we also present results in terms of the stellar mass ratio
of the central galaxies within merging halos, or the mass ratio between the total bary-
onic mass of these central galaxies (stellar mass plus gas mass). We refer to the dark
matter, stellar, and galaxy (baryonic) mass ratios as (m/M)DM, (m/M)star, (m/M)gal,
respectively. Independent of the mass ratio definitions above, we always refer to a
merger ratio of m/M > 0.3 as a major merger. For the sake of comparison to our
past work, we emphasize that in Chapter 2, we considered two definitions of merger
ratio. The first (written as m/M0 in that chapter) referred to the ratio of the satellite
mass at infall m to the final dark matter halo mass M0 at z = 0. This is not the ratio
we are using here. The mass ratio definition we adopt here is more standard and
refers always to the mass ratio at the redshift z of accretion (m/Mz in the notation
of Stewart et al. 2008).
In order to provide robust results, we define a merger to occur once the smaller halo
crosses within the virial radius of the larger halo and becomes a subhalo, as the
subsequent orbital evolution of each subhalo will depend on the baryonic distribution
within both halos. We emphasize that for the major mergers we consider in this
chapter, the dynamical friction decay timescales are expected to be short (comparable
to the halo dynamical timescale) for typical orbital parameters (Boylan-Kolchin et al.,
2008). Since only ∼ 5% of 1012M¯ halos have experienced a major merger in the past
halo dynamical time at z = 0 (see Figure 4.4), most of these major mergers into the
virial radius have had adequate time to impact the central galaxy and do not survive
as distinct substructure by z = 0. For a more in-depth comparison between merger
rates into the virial radius and the rate at which accreted satellites are “destroyed”
in this simulation (i.e. once they lose 90% of their infall mass) we refer the reader to
80
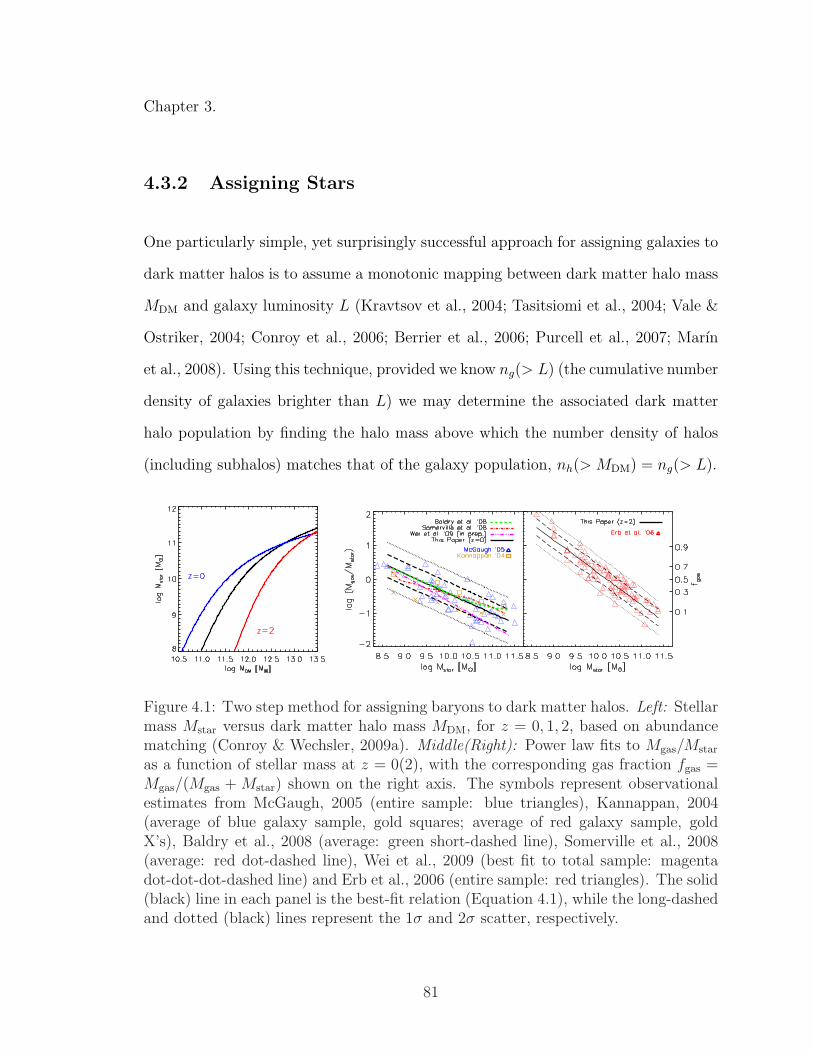
Chapter 3.
4.3.2 Assigning Stars
One particularly simple, yet surprisingly successful approach for assigning galaxies to
dark matter halos is to assume a monotonic mapping between dark matter halo mass
MDM and galaxy luminosity L (Kravtsov et al., 2004; Tasitsiomi et al., 2004; Vale &
Ostriker, 2004; Conroy et al., 2006; Berrier et al., 2006; Purcell et al., 2007; Marın
et al., 2008). Using this technique, provided we know ng(> L) (the cumulative number
density of galaxies brighter than L) we may determine the associated dark matter
halo population by finding the halo mass above which the number density of halos
(including subhalos) matches that of the galaxy population, nh(> MDM) = ng(> L).
Figure 4.1: Two step method for assigning baryons to dark matter halos. Left: Stellarmass Mstar versus dark matter halo mass MDM, for z = 0, 1, 2, based on abundancematching (Conroy & Wechsler, 2009a). Middle(Right): Power law fits to Mgas/Mstar
as a function of stellar mass at z = 0(2), with the corresponding gas fraction fgas =Mgas/(Mgas + Mstar) shown on the right axis. The symbols represent observationalestimates from McGaugh, 2005 (entire sample: blue triangles), Kannappan, 2004(average of blue galaxy sample, gold squares; average of red galaxy sample, goldX’s), Baldry et al., 2008 (average: green short-dashed line), Somerville et al., 2008(average: red dot-dashed line), Wei et al., 2009 (best fit to total sample: magentadot-dot-dot-dashed line) and Erb et al., 2006 (entire sample: red triangles). The solid(black) line in each panel is the best-fit relation (Equation 4.1), while the long-dashedand dotted (black) lines represent the 1σ and 2σ scatter, respectively.
81
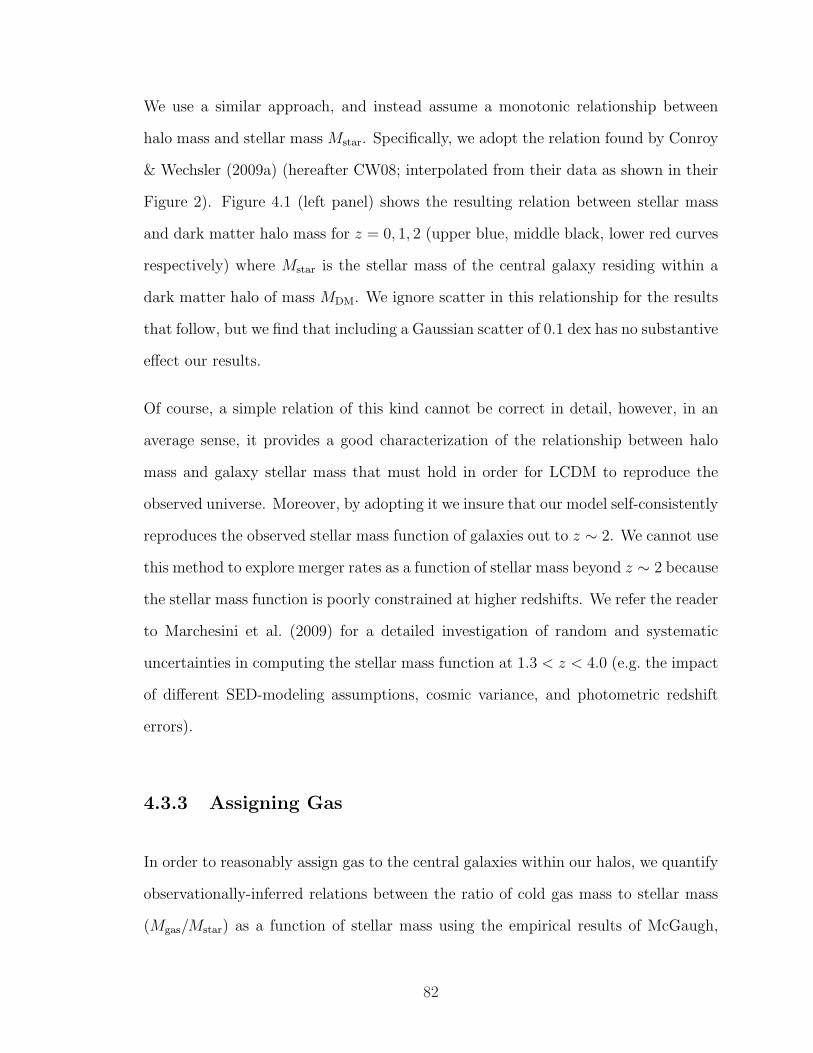
We use a similar approach, and instead assume a monotonic relationship between
halo mass and stellar mass Mstar. Specifically, we adopt the relation found by Conroy
& Wechsler (2009a) (hereafter CW08; interpolated from their data as shown in their
Figure 2). Figure 4.1 (left panel) shows the resulting relation between stellar mass
and dark matter halo mass for z = 0, 1, 2 (upper blue, middle black, lower red curves
respectively) where Mstar is the stellar mass of the central galaxy residing within a
dark matter halo of mass MDM. We ignore scatter in this relationship for the results
that follow, but we find that including a Gaussian scatter of 0.1 dex has no substantive
effect our results.
Of course, a simple relation of this kind cannot be correct in detail, however, in an
average sense, it provides a good characterization of the relationship between halo
mass and galaxy stellar mass that must hold in order for LCDM to reproduce the
observed universe. Moreover, by adopting it we insure that our model self-consistently
reproduces the observed stellar mass function of galaxies out to z ∼ 2. We cannot use
this method to explore merger rates as a function of stellar mass beyond z ∼ 2 because
the stellar mass function is poorly constrained at higher redshifts. We refer the reader
to Marchesini et al. (2009) for a detailed investigation of random and systematic
uncertainties in computing the stellar mass function at 1.3 < z < 4.0 (e.g. the impact
of different SED-modeling assumptions, cosmic variance, and photometric redshift
errors).
4.3.3 Assigning Gas
In order to reasonably assign gas to the central galaxies within our halos, we quantify
observationally-inferred relations between the ratio of cold gas mass to stellar mass
(Mgas/Mstar) as a function of stellar mass using the empirical results of McGaugh,
82
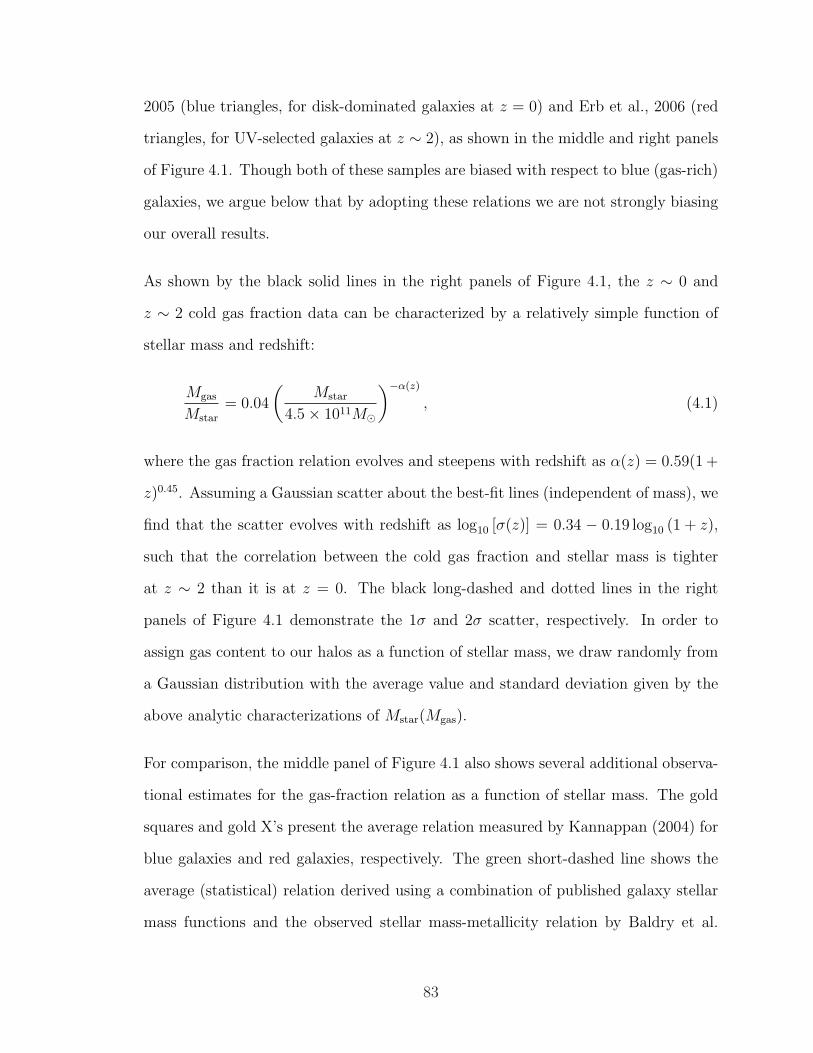
2005 (blue triangles, for disk-dominated galaxies at z = 0) and Erb et al., 2006 (red
triangles, for UV-selected galaxies at z ∼ 2), as shown in the middle and right panels
of Figure 4.1. Though both of these samples are biased with respect to blue (gas-rich)
galaxies, we argue below that by adopting these relations we are not strongly biasing
our overall results.
As shown by the black solid lines in the right panels of Figure 4.1, the z ∼ 0 and
z ∼ 2 cold gas fraction data can be characterized by a relatively simple function of
stellar mass and redshift:
Mgas
Mstar
= 0.04
(Mstar
4.5× 10¹¹M¯
)−α(z)
, (4.1)
where the gas fraction relation evolves and steepens with redshift as α(z) = 0.59(1 +
z)0.45. Assuming a Gaussian scatter about the best-fit lines (independent of mass), we
find that the scatter evolves with redshift as log10 [σ(z)] = 0.34 − 0.19 log10 (1 + z),
such that the correlation between the cold gas fraction and stellar mass is tighter
at z ∼ 2 than it is at z = 0. The black long-dashed and dotted lines in the right
panels of Figure 4.1 demonstrate the 1σ and 2σ scatter, respectively. In order to
assign gas content to our halos as a function of stellar mass, we draw randomly from
a Gaussian distribution with the average value and standard deviation given by the
above analytic characterizations of Mstar(Mgas).
For comparison, the middle panel of Figure 4.1 also shows several additional observa-
tional estimates for the gas-fraction relation as a function of stellar mass. The gold
squares and gold X’s present the average relation measured by Kannappan (2004) for
blue galaxies and red galaxies, respectively. The green short-dashed line shows the
average (statistical) relation derived using a combination of published galaxy stellar
mass functions and the observed stellar mass-metallicity relation by Baldry et al.
83
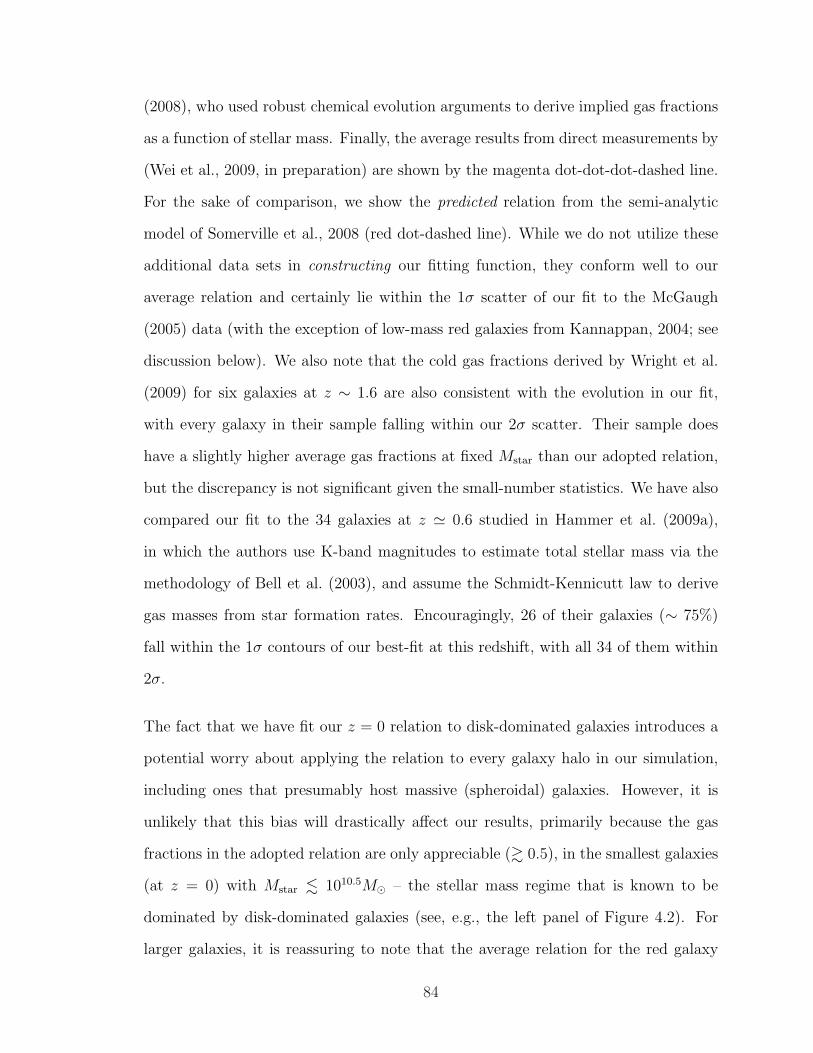
(2008), who used robust chemical evolution arguments to derive implied gas fractions
as a function of stellar mass. Finally, the average results from direct measurements by
(Wei et al., 2009, in preparation) are shown by the magenta dot-dot-dot-dashed line.
For the sake of comparison, we show the predicted relation from the semi-analytic
model of Somerville et al., 2008 (red dot-dashed line). While we do not utilize these
additional data sets in constructing our fitting function, they conform well to our
average relation and certainly lie within the 1σ scatter of our fit to the McGaugh
(2005) data (with the exception of low-mass red galaxies from Kannappan, 2004; see
discussion below). We also note that the cold gas fractions derived by Wright et al.
(2009) for six galaxies at z ∼ 1.6 are also consistent with the evolution in our fit,
with every galaxy in their sample falling within our 2σ scatter. Their sample does
have a slightly higher average gas fractions at fixed Mstar than our adopted relation,
but the discrepancy is not significant given the small-number statistics. We have also
compared our fit to the 34 galaxies at z ' 0.6 studied in Hammer et al. (2009a),
in which the authors use K-band magnitudes to estimate total stellar mass via the
methodology of Bell et al. (2003), and assume the Schmidt-Kennicutt law to derive
gas masses from star formation rates. Encouragingly, 26 of their galaxies (∼ 75%)
fall within the 1σ contours of our best-fit at this redshift, with all 34 of them within
2σ.
The fact that we have fit our z = 0 relation to disk-dominated galaxies introduces a
potential worry about applying the relation to every galaxy halo in our simulation,
including ones that presumably host massive (spheroidal) galaxies. However, it is
unlikely that this bias will drastically affect our results, primarily because the gas
fractions in the adopted relation are only appreciable (& 0.5), in the smallest galaxies
(at z = 0) with Mstar . 1010.5M¯ – the stellar mass regime that is known to be
dominated by disk-dominated galaxies (see, e.g., the left panel of Figure 4.2). For
larger galaxies, it is reassuring to note that the average relation for the red galaxy
84
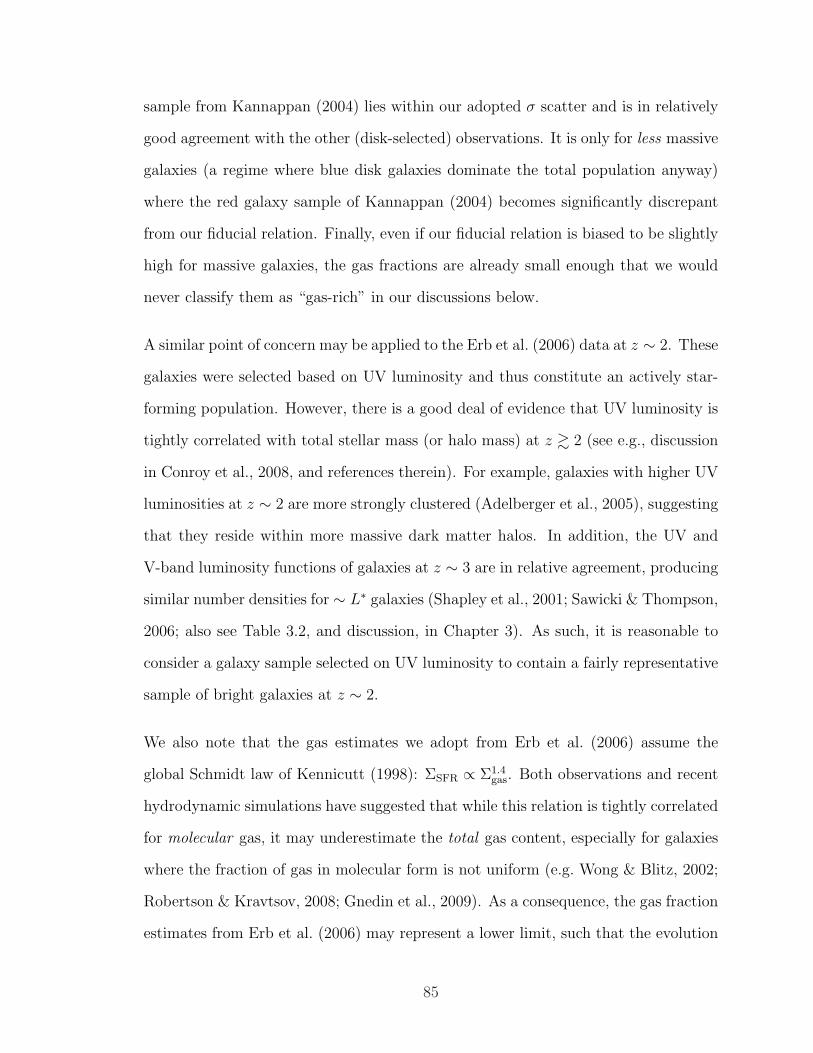
sample from Kannappan (2004) lies within our adopted σ scatter and is in relatively
good agreement with the other (disk-selected) observations. It is only for less massive
galaxies (a regime where blue disk galaxies dominate the total population anyway)
where the red galaxy sample of Kannappan (2004) becomes significantly discrepant
from our fiducial relation. Finally, even if our fiducial relation is biased to be slightly
high for massive galaxies, the gas fractions are already small enough that we would
never classify them as “gas-rich” in our discussions below.
A similar point of concern may be applied to the Erb et al. (2006) data at z ∼ 2. These
galaxies were selected based on UV luminosity and thus constitute an actively star-
forming population. However, there is a good deal of evidence that UV luminosity is
tightly correlated with total stellar mass (or halo mass) at z & 2 (see e.g., discussion
in Conroy et al., 2008, and references therein). For example, galaxies with higher UV
luminosities at z ∼ 2 are more strongly clustered (Adelberger et al., 2005), suggesting
that they reside within more massive dark matter halos. In addition, the UV and
V-band luminosity functions of galaxies at z ∼ 3 are in relative agreement, producing
similar number densities for ∼ L∗ galaxies (Shapley et al., 2001; Sawicki & Thompson,
2006; also see Table 3.2, and discussion, in Chapter 3). As such, it is reasonable to
consider a galaxy sample selected on UV luminosity to contain a fairly representative
sample of bright galaxies at z ∼ 2.
We also note that the gas estimates we adopt from Erb et al. (2006) assume the
global Schmidt law of Kennicutt (1998): ΣSFR ∝ Σ1.4gas. Both observations and recent
hydrodynamic simulations have suggested that while this relation is tightly correlated
for molecular gas, it may underestimate the total gas content, especially for galaxies
where the fraction of gas in molecular form is not uniform (e.g. Wong & Blitz, 2002;
Robertson & Kravtsov, 2008; Gnedin et al., 2009). As a consequence, the gas fraction
estimates from Erb et al. (2006) may represent a lower limit, such that the evolution
85
of gas fraction with redshift may actually be steeper than our adopted relation. In-
sofar as issues of gas accretion and disk survival are concerned, our relation may be
considered a conservative lower limit on the estimated gas content of our galaxies.
Finally, there has been some discussion in the literature that the stellar initial mass
function (IMF) may evolve systematically to become more top heavy at high redshift
in galaxies with extremely low metallicities (e.g. Lucatello et al., 2005; Tumlinson,
2007; van Dokkum, 2008; Komiya et al., 2008). This evolution in the IMF has not
been corrected for in our adopted mapping between halo mass and stellar mass. While
we do not expect this to significantly affect our results, including this evolution of the
IMF would decrease our stellar mass estimates at fixed halo mass—which would, in
turn, increase our estimated gas fractions. As such, so far as issues of gas accretion
and disk survival are concerned, the results we present are a conservative lower limit.
With the above qualifications in mind, we now turn to the implications of this
empirically-motivated stellar mass and gas mass assignment prescription.
4.4 Results and Implications
4.4.1 Galaxy Morphology
We start by investigating the merger histories of z = 0 dark matter halos. The solid
black line in the left panel of Figure 4.2 shows the fraction of dark matter halos that
have experienced at least one major dark matter merger with (m/M)DM > 0.3 since
z = 2 as a function of dark matter halo mass (lower axis label). Equivalently, the
merger fraction as a function of galaxy stellar mass can be seen by focusing on the
upper axis label. Compare this result to the black squares, which show the early-type
86
fraction for SDSS galaxies as a function of central halo mass as derived by Weinmann
et al. (2006; with “early-type” based on galaxy color and specific star formation rate)
1. Also compare to the early-type fraction for SDSS galaxies as a function of halo
mass, where “early-type” is defined by the concentration parameter (C > 3), shown
as the black crosses, from Weinmann et al. (2009) (We will refer to these two results
as W06 and W09, respectively). Clearly the fraction of halos with major mergers
greatly exceeds the early-type fraction at low masses.
Consider now the likely baryonic makeup of these mergers. The (blue) dotted line
shows the fraction of halos that have experienced a gas-rich major merger since z = 2
and the (red) dashed line shows the fraction of halos with at least one gas-poor merger.
In our fiducial case, we define a merger to be gas-rich if both the central galaxy and
the infalling satellite galaxy have more baryonic mass in the form of gas than in
stars: fg ≡ Mgas/(Mgas + Mstar) > 50%. Similarly, gas-poor mergers are defined such
that each of the progenitors has fg < 50%. The shading of the red and blue bands
correspond to varying the definition of gas-rich from fg > 30% to fg > 70%. 2
Remarkably, if one makes the simplistic assumption that only gas-poor mergers gen-
erate early-type galaxies (red dashed line) and gas-rich mergers preserve disks, then
the observed SDSS relation from W06 and W09 is reproduced fairly well. Specifically,
1Note that in W06, they divide galaxies into three categories instead of two; early-type, late-typeand intermediate-type. In order to compare our simple bimodal model to their findings, we counthalf of their intermediate-types as early-type, and half as late-type.
2 Because the morphological impact of a mixed merger (where one galaxy is gas-rich and one isgas-poor) is largely unclear, we choose to focus on the extreme cases where both are either gas-richor gas poor, and to leave a more detailed exploration of mixed mergers for future work. This meansthat the combined gas-rich fractions and gas-poor fractions in Figure 4.2 need not equal the totalmerger fraction, which includes all major mergers regardless of baryonic content. However, becausea galaxy’s gas fraction is a strong function of halo mass at fixed redshift (and because we define astrict cutoff between gas-rich and gas-poor based on gas fraction) we find that mixed mergers areless frequent than mergers between two gas-poor or two gas-rich systems. If the larger galaxy in amajor merger is gas-rich (by our definition), then the smaller galaxy is most likely gas-rich as well.Conversely, if the smaller galaxy in a major merger is gas-poor, then the larger galaxy is most likelyalso gas-poor. While there does exist a characteristic mass scale for which mixed mergers becomea significant portion of the overall merger fraction, even at this special mass scale they still onlyconstitute about half of all mergers (see Figure 4.4, discussion in §4.4.3).
87
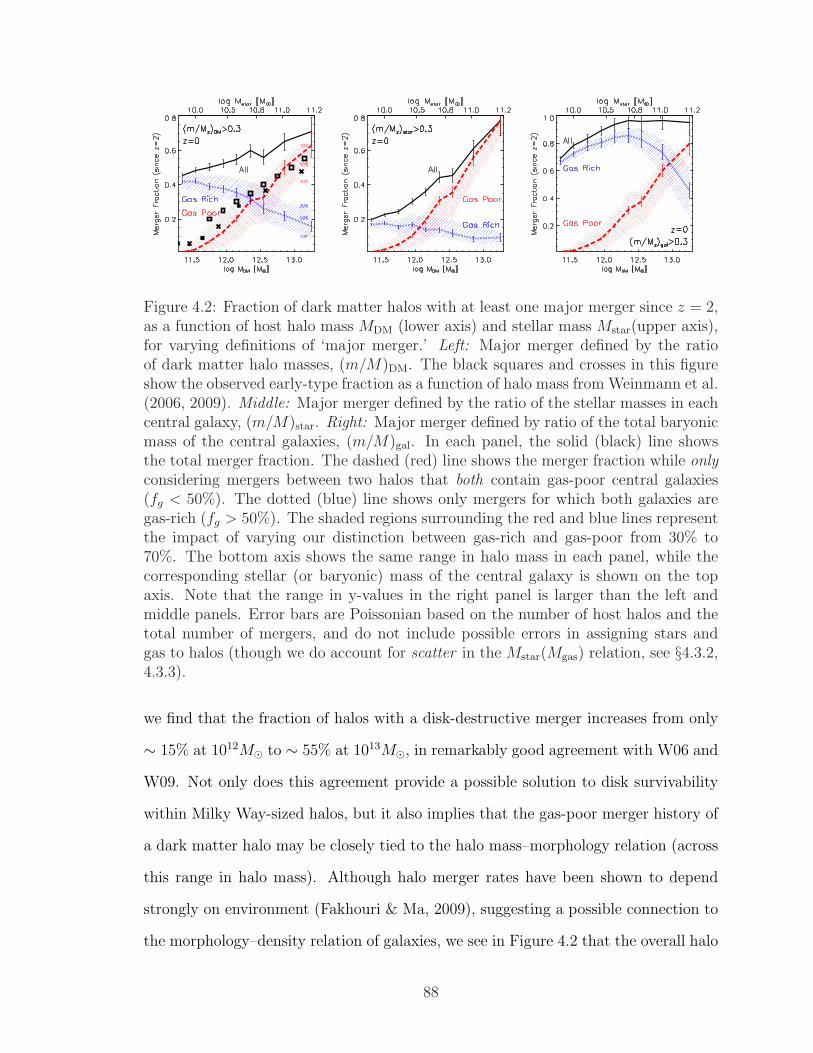
Figure 4.2: Fraction of dark matter halos with at least one major merger since z = 2,as a function of host halo mass MDM (lower axis) and stellar mass Mstar(upper axis),for varying definitions of ‘major merger.’ Left: Major merger defined by the ratioof dark matter halo masses, (m/M)DM. The black squares and crosses in this figureshow the observed early-type fraction as a function of halo mass from Weinmann et al.(2006, 2009). Middle: Major merger defined by the ratio of the stellar masses in eachcentral galaxy, (m/M)star. Right: Major merger defined by ratio of the total baryonicmass of the central galaxies, (m/M)gal. In each panel, the solid (black) line showsthe total merger fraction. The dashed (red) line shows the merger fraction while onlyconsidering mergers between two halos that both contain gas-poor central galaxies(fg < 50%). The dotted (blue) line shows only mergers for which both galaxies aregas-rich (fg > 50%). The shaded regions surrounding the red and blue lines representthe impact of varying our distinction between gas-rich and gas-poor from 30% to70%. The bottom axis shows the same range in halo mass in each panel, while thecorresponding stellar (or baryonic) mass of the central galaxy is shown on the topaxis. Note that the range in y-values in the right panel is larger than the left andmiddle panels. Error bars are Poissonian based on the number of host halos and thetotal number of mergers, and do not include possible errors in assigning stars andgas to halos (though we do account for scatter in the Mstar(Mgas) relation, see §4.3.2,4.3.3).
we find that the fraction of halos with a disk-destructive merger increases from only
∼ 15% at 1012M¯ to ∼ 55% at 1013M¯, in remarkably good agreement with W06 and
W09. Not only does this agreement provide a possible solution to disk survivability
within Milky Way-sized halos, but it also implies that the gas-poor merger history of
a dark matter halo may be closely tied to the halo mass–morphology relation (across
this range in halo mass). Although halo merger rates have been shown to depend
strongly on environment (Fakhouri & Ma, 2009), suggesting a possible connection to
the morphology–density relation of galaxies, we see in Figure 4.2 that the overall halo
88
major merger rate (solid black line) is not steep enough to account for the observed
change in morphological fraction with halo mass.
It is also worth mentioning that the implied transition between mostly gas-rich and
mostly gas-poor mergers occurs at a characteristic mass Mstar ' 5 × 10¹⁰M¯ (or
equivalently MDM ' 2×10¹²M¯), which is close to the characteristic bimodality scale
that separates blue, star-forming, disk-dominated systems and red, bulge-dominated
systems with old populations (typically Mstar ∼ 3×10¹⁰M¯, see e.g. Kauffmann et al.,
2003; Baldry et al., 2004; Kannappan, 2004; Baldry et al., 2006; Cattaneo et al., 2006;
Dekel & Birnboim, 2006).
Of course, for detailed treatments of galaxy morphology, this model is too simplistic.
The inclusion of gas-richness in the efficacy of major mergers to disrupt morphology
seems to greatly relieve the problem of disk stability, and the agreement between
the observed early-type fraction from SDSS and the fraction of halos with at least
one gas-poor major merger is quite remarkable. However, this is only a first step in
understanding the distribution of galaxy morphologies. In detail, nothing we have
investigated here can explain the prominence of “bulgeless” galaxies, as simulated gas-
rich major mergers lead to galaxies with noticeable bulges and disks that are thicker
and hotter than the Milky Way. Even cosmological simulations that produce thin disk
galaxies (e.g. Governato et al., 2009) require significant smooth gas accretion from
the hot halo after the most recent gas-rich merger in order to form a thin disk. Such
intricate details are beyond the scope of this chapter, as we are primarily concerned
with providing the most robust predictions possible, only using N -body dark matter
halo merger trees and empirical relations between MDM,Mstar, and Mgas to determine
gas-rich and gas-poor merger statistics.
Any model that predicts detailed bulge-to-disk mass ratios or estimates the thinness
or thickness of the galactic disk resulting from a merger event must require further
89
assumptions about the detailed morphological effects of any given merger event, which
are still relatively uncertain. We refer the reader to Hopkins et al. (2009b) for a more
detailed galaxy formation model that generates bulge and disk mass estimates due to
merger events as a function of merger mass ratio, gas fraction and orbital parameters.
Using a semi-empirical assignment of gas and stars to dark matter halos similar (but
distinct) from our own treatment, they find that cosmologically motivated merger
trees lead to consistent distributions of B/T (bulge mass to total galaxy mass) values
as a function of halo mass and redshift.
4.4.2 Alternative definitions for major merger
The middle and right panels of Figure 4.2 explore how the implied merger fraction
trends change when one chooses to define major mergers using the stellar-mass ratio,
(m/M)star > 0.3, and total baryonic galaxy mass ratio, (m/M)gal > 0.3, respectively,
rather than the total mass ratio in dark matter. Clearly, the implied trends between
merger fraction and galaxy halo mass depend sensitively on whether dark matter
mass ratios, stellar mass ratios, or baryonic galaxy mass ratios are considered (also
see Maller, 2008; Stewart, 2009). As seen by the solid black line in the middle panel,
high stellar-mass ratio events are rare in small galaxy halos and common in high
mass halos. This follows directly from the fact that low-mass halos tend to have a
higher stellar-mass to dark matter mass ratios (see Figure 4.1). The trend changes
dramatically when the full baryonic mass of the galaxy is considered in the ratio
(right panel). In this case, even small galaxy halos are expected to have had common
mergers with galaxies of a comparable total baryonic mass (note that the range of the
vertical axis has changed in the right-hand panel). It is clear from this comparison
alone that most of the major mergers experienced by small galaxies must be gas-rich.
90
We note that the fraction of systems that have experienced at least one gas-rich merger
(and consequently, the total merger fractions as well) show qualitatively different
behavior depending on these definitions. Gas-rich halo mergers ((m/M)DM > 0.3) are
relatively frequent for MDM = 1011.5M¯ systems (40% since z = 2), with a smoothly
declining merger fraction for increasing halo mass (roughly linear in log MDM), while
the gas-rich stellar merger fractions decline in a qualitatively similar fashion but
are universally less common, with merger fractions < 20% for MDM = 1011.5M¯. In
contrast, the fraction of halos with at least one major galaxy merger ((m/M)gal > 0.3)
shows completely different behavior, with extremely high fractions (40 − 90%) and
non-monotonic evolution with log MDM (with a maximum value at MDM ∼ 1012.2M¯).
The behavior of gas-poor merger fractions, on the other hand, remains remarkably
similar in each case. Regardless of these three merger ratio definitions, the fraction
of halos which have experienced a gas-poor major merger is negligible at small halos
masses (MDM ∼ 1011.5M¯) and increases roughly linearly with log MDM to a fraction
of 65 − 75% at MDM = 1013.2M¯. Because these gas-poor merger fractions appear
somewhat independent of the merger ratio definition used (and they remain consistent
with observed morphological fractions as a function of halo mass) we again suggest
that a dark matter halo’s gas-poor merger history may be a particularly useful tracer
of galaxy morphology—more so than the merger history of all mergers.
One might be tempted to conclude that the total major merger rate in the middle
panel (major stellar mergers) is sufficiently steep to account for the change in mor-
phological fraction with halo mass reported by W06 and W09, without bothering to
account for the gas content of these mergers. Encouragingly, only ∼ 30% of 1012M¯
halos have experienced a (m/M)star > 0.3 merger since z = 2. It is important to note
that even relatively minor, (m/M)DM = 0.1 dark matter halo mergers with negligible
stellar content (m/M)star ∼ 0.03 are capable of heating and thickening a galactic
91
disk beyond the properties of the Milky Way (Purcell et al., 2009). (However, a
galaxy need not contain a disk as thin as the Milky Way in order to be classified
as late-type in either W06 or W09, so systems similar to those studied in Purcell
et al. (2009) would still be labeled as “surviving” disks in our simple model.) Still,
it is important to keep in mind that major dark matter mergers do not necessarily
correspond to major stellar mergers, especially at halos less massive than the Milky
Way (see e.g. Maller, 2008; Stewart, 2009). For example, consider a Mstar = 1010M¯
galaxy experiencing a stellar merger at z = 0, 1, 2 that is just below our definition
of “major,” with (m/M)star = 0.2. The corresponding dark matter halo ratios of
these merger events will be ∼ 0.4, 0.4, and 0.5, respectively. Even if we consider
a more minor stellar merger, with (m/M)star = 0.1 at these redshifts, such merger
events still correspond to major dark matter mergers, with dark matter halo ratios of
∼ 0.3, 0.3, 0.4, respectively. If gas content is ignored, a substantial fraction of these
events will easily be capable of destroying disk morphologies altogether (not simply
thickening and heating the existing disk). Still, these mergers would be classified as
“minor” stellar mergers, with a stellar merger ratio < 0.3, even while the total dark
matter mass ratios may approach 2 : 1. In addition, the opposite effect occurs at
large galaxy masses. For example, a major stellar mergers into a Mstar = 1011M¯
galaxy with a (m/M)star = 0.3 at z = 0 only corresponds to a dark matter halo mass
ratio of ∼ 0.1, which is less likely to be morphologically destructive. This is why the
total merger fraction in the middle panel (at high galaxy mass) exceeds that in the
left panel: major stellar mergers only correspond to minor dark halo mergers at this
mass regime. Thus, we conclude that the major stellar merger fractions in the middle
panel likely present an uneven, and potentially incomplete picture of possible means
of disk destruction via mergers.
92
4.4.3 Gas Delivery Via Mergers
In Chapter 3, we discuss the observational implications of two well-known conse-
quences of galaxy halo mergers: merger-induced starbursts and morphological dis-
turbance (also, Stewart et al., 2009a). A third potentially important consequence
of mergers is the direct, cumulative deposition of cold baryons (gas and stars) onto
galaxies. We are now concerned with the exact baryonic content of each merging
galaxy, whereas we have previously only focused on whether or not a given halo lies
above or below an arbitrary gas fraction threshold. As such, we impose an additional
constraint to our method for assigning gas (as outlined in §4.3). Specifically, when
estimating the gas content of halos at high redshift, blindly extrapolating equation 4.1
to arbitrarily small stellar masses sometimes results in more baryons in a given halo
than the universal baryon fraction of matter in the Universe. This is an unphysical
situation that arises from extrapolation far beyond the regime where Mgas(Mstar) is
well-constrained. In order to avoid unphysically high gas content of low mass halos
at high redshift, we present two models for assigning upper limits to the gas content
of low stellar mass galaxies. In the model A (left panel of figure 4.3), we set an upper
limit on equation 4.1 such that Mgas + Mstar ≤ fbMDM, where fb = 0.17. In model B,
we define the upper limit by the ratio of gas mass to halo mass: (flim ≡ Mgas/MDM
at Mstar = 3 × 10⁸M¯). For galaxies with stellar mass lower than this threshold, we
then set Mgas = flimMDM. This model, which always assigns less (or equal) gas per
galaxy than the first model, is used to construct the right panel of figure 4.3.
In both panels of Figure 4.3, the solid black lines show the fraction of a central galaxy’s
current (z = 0) baryonic mass (Mgal = Mgas + Mstar) acquired directly via major
mergers as a function of halo mass fmerged ≡ Mmerged/Mgal(z = 0). Specifically, Mmerge
includes all of the baryonic mass in mergers obeying (m/M)DM > 0.3 since z = 2.
Focusing on the left panel (model A: Mgas + Mstar ≤ fbMDM) the first clear result is
93

Figure 4.3: The fraction of a z = 0 galaxy’s total baryonic mass that was accreteddirectly via major mergers or moderately sized mergers since z = 2, as a function ofhalo mass. Left: model A, in which we assign gas by Equation 4.1, but impose anupper limit due to the universal baryon fraction, such that Mgas + Mstar ≤ fbMDM.Right: model B, in which we assign gas by Equation 4.1, but impose an upper limitsuch that Mgas ≤ flimMDM, where flim at each redshift is the value of Mgas/MDM whenMstar = 3 × 10⁸M¯ at that redshift. In both panels, the dotted (blue) and dashed(red) lines show the accreted baryonic mass fraction from gas and stars, respectively,while the solid (black) line shows the total.
that the merged baryonic fraction is significant: ∼ 30−50% of the final galaxy mass is
accreted directly in the form of major mergers. Given the effectiveness of dynamical
friction in major mergers, we expect the majority of the accreted baryonic material
in these events to be deposited in the central galaxy itself. In principle, this limits
the fraction of a galaxy’s baryons that can be acquired by direct hot halo cooling,
cold flows, or minor mergers to 50− 70%, depending on the halo mass of interest. Of
course, (gaseous) baryons deposited via major mergers could in principle be blown out
by energetic feedback, but all in all, this result on major merger deposition (much like
known results on cold flows) would seem to make the ’overcooling’ problem in galaxy
formation more difficult. While the fraction of baryons accreted directly as cold gas
via major mergers is less substantial in the right panel (model B: Mgas ≤ flimMDM),
94
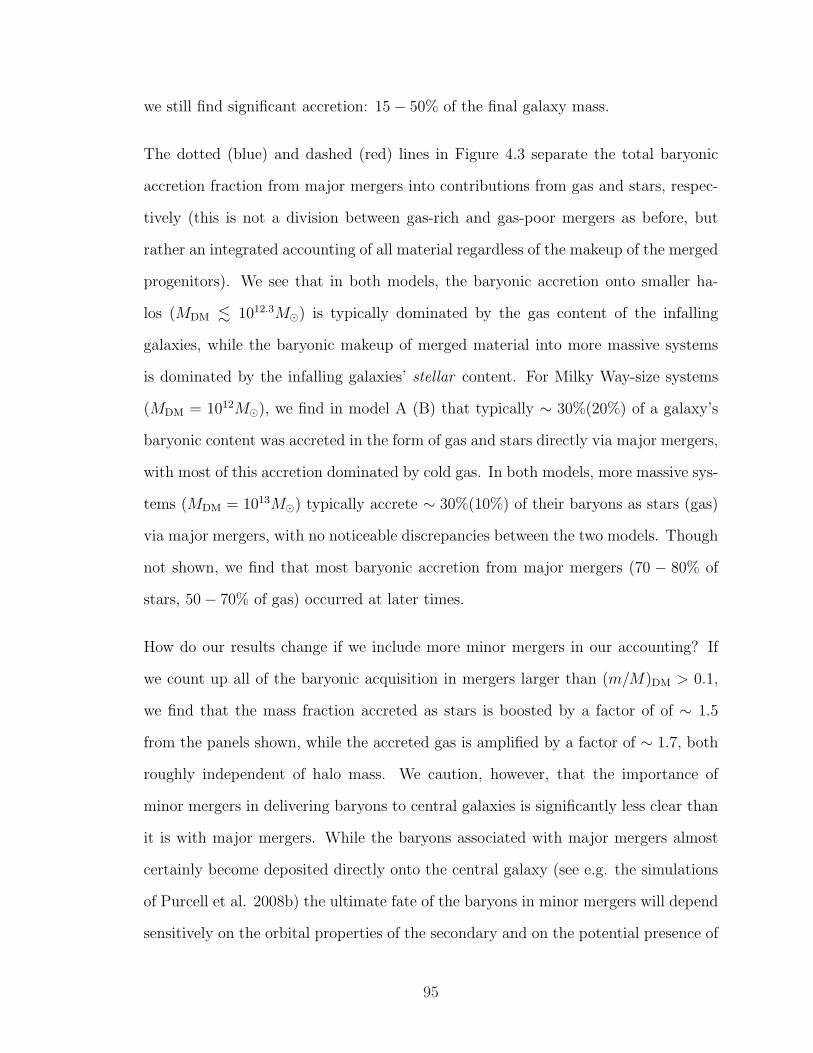
we still find significant accretion: 15− 50% of the final galaxy mass.
The dotted (blue) and dashed (red) lines in Figure 4.3 separate the total baryonic
accretion fraction from major mergers into contributions from gas and stars, respec-
tively (this is not a division between gas-rich and gas-poor mergers as before, but
rather an integrated accounting of all material regardless of the makeup of the merged
progenitors). We see that in both models, the baryonic accretion onto smaller ha-
los (MDM . 1012.3M¯) is typically dominated by the gas content of the infalling
galaxies, while the baryonic makeup of merged material into more massive systems
is dominated by the infalling galaxies’ stellar content. For Milky Way-size systems
(MDM = 1012M¯), we find in model A (B) that typically ∼ 30%(20%) of a galaxy’s
baryonic content was accreted in the form of gas and stars directly via major mergers,
with most of this accretion dominated by cold gas. In both models, more massive sys-
tems (MDM = 1013M¯) typically accrete ∼ 30%(10%) of their baryons as stars (gas)
via major mergers, with no noticeable discrepancies between the two models. Though
not shown, we find that most baryonic accretion from major mergers (70 − 80% of
stars, 50− 70% of gas) occurred at later times.
How do our results change if we include more minor mergers in our accounting? If
we count up all of the baryonic acquisition in mergers larger than (m/M)DM > 0.1,
we find that the mass fraction accreted as stars is boosted by a factor of of ∼ 1.5
from the panels shown, while the accreted gas is amplified by a factor of ∼ 1.7, both
roughly independent of halo mass. We caution, however, that the importance of
minor mergers in delivering baryons to central galaxies is significantly less clear than
it is with major mergers. While the baryons associated with major mergers almost
certainly become deposited directly onto the central galaxy (see e.g. the simulations
of Purcell et al. 2008b) the ultimate fate of the baryons in minor mergers will depend
sensitively on the orbital properties of the secondary and on the potential presence of
95

hot gas halo around the primary galaxy. Past work has demonstrated that the stellar
material in minor mergers will likely contribute to extended diffuse light components
like stellar halos or intracluster light (e.g., Bullock & Johnston, 2005; Purcell et al.,
2007; Conroy et al., 2007; Purcell et al., 2008), but the destiny of accreted gas (which
is the dominant component for galaxy halos) in these minor mergers is relatively
unexplored. One possibility is that the gas in minor mergers is quickly liberated via
ram pressure stripping (see, e.g. Grcevich et al., 2008) and that it either evaporates
into the hot halo itself or eventually rains down onto the galaxy, possibly in the form
of high-velocity clouds. These interesting possibilities are clearly beyond the scope of
the present work but provide important avenues for future investigation.
The relation between gas mass and stellar mass below Mstar = 3 × 10⁸M¯ remains
relatively uncertain, making it impossible to know which panel of this figure is a more
accurate representation of galaxy formation. In detail, we expect our two models to
bracket reasonable expectations for the true relation between Mstar and Mgas in this
regime. Nevertheless, focusing on model A for the time being (left panel), we find
it interesting that there appears to be a minimum in merged baryon fraction at
the MDM ∼ 1012M¯ scale, which corresponds closely to the well-known mass scale
of maximum galaxy formation efficiency (∼ L∗ in the galaxy luminosity function).
Although it is unclear whether this minimum exists in reality, or is merely an artifice of
the manner in which we have assigned gas, we speculate on a possible correspondence
between galaxy formation efficiency and the merged baryon fraction. Specifically, a
minimum in the merged baryon fraction naturally implies a maximum in the baryon
fraction accreted via smooth gas accretion from the hot halo or from cold streams.
We speculate that smooth gas accretion might allow for a higher efficiency in star
formation than accreting large clumps of gas via major mergers, because gas-rich
mergers are likely to trigger massive starbursts that may blow significant gas content
out of the central galaxy. We also speculate that accretion of stars via mergers
96

may also be inefficient, since some fraction of a satellite galaxy’s stars is likely to
be distributed into the stellar halo before reaching the central galaxy within massive
halos. If this is the case, that smooth gas accretion forms stars most efficiently,
then it would be reasonable to expect a maximum in the baryon fraction of smoothly
accreted gas to correlate with the maximum galaxy formation efficiency. However, we
emphasize that this possible correlation between minimum merged baryonic fraction
and maximum star formation efficiency is not a robust prediction of our model, but
merely a speculation (for example, model B results in no such minimum in the merged
baryonic fraction).
4.4.4 Redshift Evolution
While the cumulative fraction of halos that have ever experienced a gas-rich or gas-
poor major merger (since z = 2) is the most pertinent question for morphological
evolution and disk survivability (see §4.4.1), another point of interest is the redshift
evolution of a more instantaneous measure of the merger rate of gas-poor and gas-rich
mergers. Figure 4.4 shows the fraction of halos that have experienced at least one
major merger with (m/M)DM > 0.3 in the past halo dynamical time, τ 3. As in Figure
4.2, the solid (black) line shows the total merger fraction for dark matter halos, while
the dotted (blue) and dashed (red) lines show the major merger fraction for gas-poor
(fg < 50%) and gas-rich (fg > 50%) mergers, respectively. Because the quantitative
values of these merger fractions depend sensitively on the merger timescale in question
at each redshift, we choose to focus on two important qualitative results from this
figure. We refer the reader to Chapter 3 for a more detailed discussion of the evolution
of the halo merger rate (and merger fractions) with redshift, halo mass, and merger
3As in Chapter 3, in which we studied the evolution of the halo merger rate with redshift, weagain adopt τ(z) = R/V ∝ (∆v(z) ρu(z))−1/2, such that the halo dynamical time evolves withredshift, but is independent of halo mass.
97
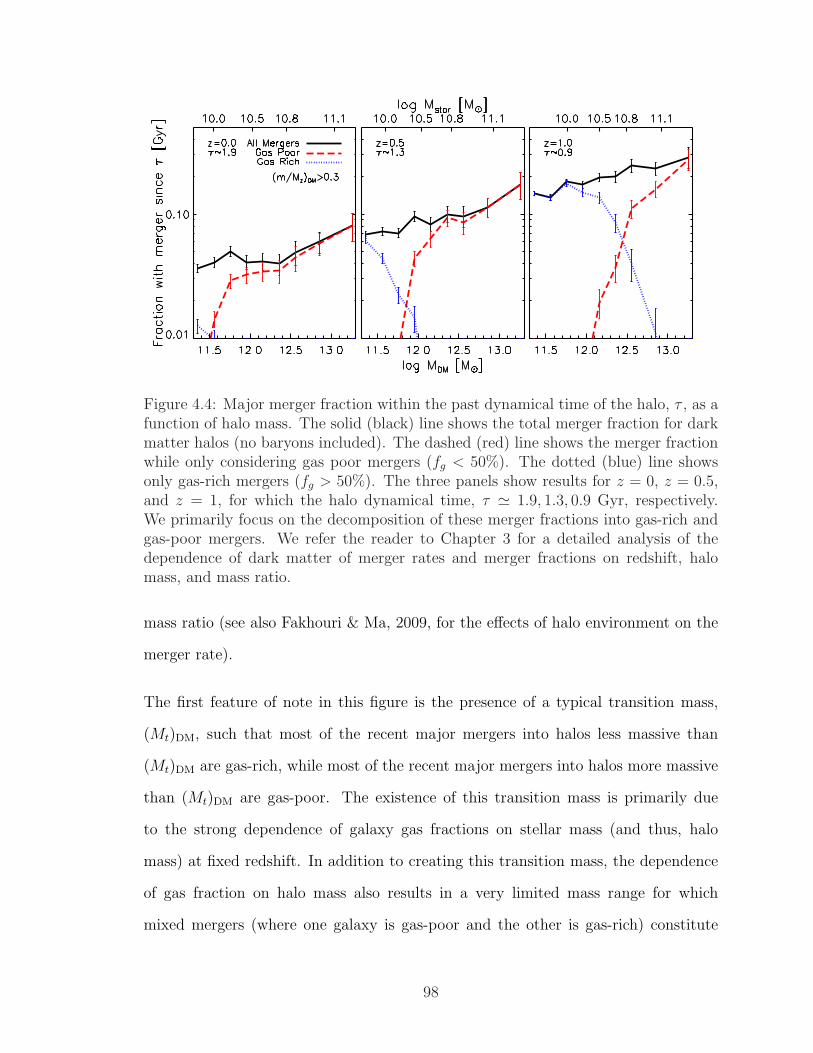
Figure 4.4: Major merger fraction within the past dynamical time of the halo, τ , as afunction of halo mass. The solid (black) line shows the total merger fraction for darkmatter halos (no baryons included). The dashed (red) line shows the merger fractionwhile only considering gas poor mergers (fg < 50%). The dotted (blue) line showsonly gas-rich mergers (fg > 50%). The three panels show results for z = 0, z = 0.5,and z = 1, for which the halo dynamical time, τ ' 1.9, 1.3, 0.9 Gyr, respectively.We primarily focus on the decomposition of these merger fractions into gas-rich andgas-poor mergers. We refer the reader to Chapter 3 for a detailed analysis of thedependence of dark matter of merger rates and merger fractions on redshift, halomass, and mass ratio.
mass ratio (see also Fakhouri & Ma, 2009, for the effects of halo environment on the
merger rate).
The first feature of note in this figure is the presence of a typical transition mass,
(Mt)DM, such that most of the recent major mergers into halos less massive than
(Mt)DM are gas-rich, while most of the recent major mergers into halos more massive
than (Mt)DM are gas-poor. The existence of this transition mass is primarily due
to the strong dependence of galaxy gas fractions on stellar mass (and thus, halo
mass) at fixed redshift. In addition to creating this transition mass, the dependence
of gas fraction on halo mass also results in a very limited mass range for which
mixed mergers (where one galaxy is gas-poor and the other is gas-rich) constitute
98
a significant portion of all mergers (at most ∼ 50%). This effect is apparent in
Figure 4.4 where the combined total of the gas-poor and gas-rich merger fractions fall
significantly short of the total. Not unexpectedly, this range of importance for mixed
mergers is centered on (Mt)DM.
The other important result from Figure 4.4 is that (Mt)DM is more massive at higher
redshifts, with (Mt)DM ' 1011.4, 1011.9, 1012.8M¯ at z = 0.0, 0.5, 1.0, respectively. This
arises naturally from the strong increase in galaxy gas fractions to higher redshift. The
corresponding galaxy stellar mass transitions at z = 0.0, 0.5, and 1.0, are (Mt)star ∼109.7, 1010.3, 1011.0M¯ (upper horizontal axis in Figure 4.4. Of course, the precise value
of Mt at each redshift will depend to some degree on our definitions of “gas-rich” and
“gas-poor,” but the existence of this transition mass, and its qualitative evolution
with redshift should be robust to changes in these definitions.
Consider recent major mergers into Milky-Way size 1012M¯ halos. At z = 0, mergers
of this kind are very uncommon. Only ∼ 5% of Milky-Way size halos should have
experienced a major dark matter accretion event with (m/M)DM > 0.3 in the last
τ ∼ 2 Gyr. However, when these major mergers do occur at z = 0 they are very likely
gas-poor (∼ 0.04/0.05 = 80% of the time). On the other hand major mergers are
fairly common in 1012M¯ halos at z ∼ 1, with ∼ 15% experiencing such a merger in
the last τ ∼ 1 Gyr. Nevertheless, these higher redshift mergers are almost universally
gas-rich. Under the presumption that gas-rich mergers do not destroy disk morpholo-
gies, the evolution of the merger rate with redshift and in the associated gas-rich
transition mass makes it increasingly likely that major mergers build disk galaxies
at high redshift rather than destroy them (c.f. Robertson et al. 2006a, Robertson
& Bullock 2008). If we were to boldly extrapolate our trends to higher redshift, we
would expect that nearly all major mergers into halos with MDM < 1012M¯ should
be gas-rich (fg > 50%) at z > 1.
99
Encouragingly, Lin et al. (2008) observe a similar redshift evolution between gas-rich
and gas-poor mergers by studying the close-pair counts of galaxies from the DEEP2
Redshift Survey. While our definitions vary in detail from theirs (they divide galaxy
pairs into wet and dry mergers based on galaxy colors, and bin their sample by total
galaxy luminosity, while we use galaxy gas fractions to define gas-poor versus gas-rich
mergers, and bin by galaxy stellar mass) they also find that at fixed luminosity (stellar
mass) the percentage of major mergers that are dry (gas-poor) should decrease with
increasing redshift, while the percentage of major mergers that are wet (gas-rich)
should increase. We reserve a more detailed comparison to their results for a future
study, but we find the qualitative agreement encouraging.
4.4.5 Comparison to Previous Work
Recent studies of galaxy formation at high redshift using hydrodynamic simulations
have stressed the importance of smooth accretion of cold gas from filamentary streams.
For example, Keres et al. (2009) compared the accretion rate of gas onto galaxies via
cold flows and via mergers, and found that at z = 1 − 2, only about half of all
gas accretion (onto galaxies corresponding to MDM & 1011.3M¯) is in the form of
mergers, (where gas from mergers was defined as any gas that was added to galaxies
in dense baryonic clumps). Similarly, Dekel et al. (2009) found that half of cold gas
infall onto massive z = 2 galaxies is acquired via mergers with (m/M)DM > 0.1,
and the other acquired from cold flows. Indeed, even studies that focus primarily on
the importance of galaxy mergers also note that smooth gas accretion is at least as
dominant as galaxy mergers in the mass buildup of galaxies (e.g. Maller et al., 2006).
Our results do not contradict these expectations. As demonstrated in Figure 4.3,
we expect that ∼ 30 − 40% of a typical galaxy’s baryons should have been accreted
directly via major mergers with (m/M)DM > 0.3. This leaves significant room for
100
cold-flow gas to contribute to the baryonic assembly of small galaxies and for cooling
to contribute to the buildup of larger galaxies. Though, as mentioned above, we
do expect that the percentage of merger-delivered baryons could rise to as much as
∼ 60% if all of the baryonic material from (m/M)DM > 0.1 mergers is able to find its
way into the central galaxy.
Brooks et al. (2009) used a high-resolution cosmological hydrodynamic simulation to
study the gas accretion onto four disk galaxies within halos of masses 1010.7−12.7M¯,
and also found that smooth accretion of gas (either shocked or un-shocked) dominates
the mass buildup of their galaxies. When comparing smooth gas accretion to gas infall
from mergers (using a generous definition of what qualifies as a merger) they found
that ∼ 25% of the total gas infall into their Milky Way-size galaxy derives from
mergers, with ∼ 10% of the final stellar content at z = 0 being accreted directly as
stars from mergers. While their detailed results (and definitions) differ slightly from
our own, the rough consistency between their simulation and our own semi-empirical
approach is quite encouraging.
One point of caution associated with the discussion of cold flows is that these predic-
tions are based entirely on simulations that do not generally reproduce the observed
baryonic mass function and stellar mass function of galaxies. It is possible that the
cold flows are somehow restricted in the real universe in a way that solves the well-
known over-cooling problem in galaxy formation. Due to the inherent difficulties in
detecting cold filaments of gas locally and at high redshift, there has yet to be an
observational confirmation of a star forming galaxy fueled by the smooth accretion
of cold gas along filaments, as seen in hydrodynamic simulations. In contrast, our
predictions for the accretion of stars and gas via major mergers is solidly normal-
ized against observations, and is arguably inevitable in the context of LCDM merger
histories. Of course, baryonic material (especially gas) that is delivered via major
101
mergers need not remain in the central galaxy indefinitely. Gas accreted either along
cold flows or through major mergers may be subsequently expelled via supernovae
or AGN feedback (e.g. Benson et al., 2003; Di Matteo et al., 2005; Springel et al.,
2005a; Somerville et al., 2008). In this respect, Figure 4.4 represents an upper limit
on the baryonic contribution from major mergers, with respect to the total amount
of barons currently exist in the galaxy.
4.5 Conclusion
We have used dark matter halo merger trees from a large cosmology N -body sim-
ulation together with observationally-normalized relationships between dark matter
halo mass, galaxy stellar mass, and galaxy gas mass to explore the baryonic content
of galaxy mergers back to redshift z = 2. Though our adopted associations between
halo mass and the baryonic content of galaxies cannot be precisely correct, it is almost
certainly accurate in its scalings with halo mass and redshift, and has the added ad-
vantage that it is independent of any uncertain galaxy formation physics. Indeed, any
self-consistent galaxy formation model that is set within the LCDM framework would
certainly need to reproduce our gross baryonic assignments in order to reproduce the
observed universe. Our main results based on this methodology may be summarized
as follows:
1. The vast majority (∼ 85%) of the major mergers experienced by Milky-Way
size galaxies since z = 2 should have been gas-rich, and this fraction drops
significantly towards higher mass systems (see Figure 4.2. Remarkably, the
fraction of galaxies with gas-poor major mergers matches well to the observed
fraction of bulge-dominated galaxies as a function of halo mass from MDM =
1011 to 1013M¯.
102
2. Though recent major mergers are expected to be rare for small galaxies in the
local universe, the recent mergers that do occur should typically be gas poor.
At higher redshift, recent mergers become more common and the probability
that such a merger is gas-rich also increases (see Figure 4.4). One can define
a transition dark matter halo mass Mt, below which most of the recent major
mergers are gas-rich and above which they are gas poor, and this transition mass
increases with redshift: (Mt)DM ∼ 1011.4, 1011.9, 1012.8M¯ at z = 0.0, 0.5, 1.0. As
a result, the vast majority of recent major mergers into galaxy-size MDM <
1012M¯ dark matter halos are expected to be gas-rich at z < 1.
3. A significant fraction (20− 50%) of the baryonic mass in field galaxies at z = 0
should have been deposited directly via major mergers since z = 2. For less
massive galaxies, MDM ∼ 1011.5M¯, the vast majority of the merger-acquired
baryons are gaseous, while in more massive galaxies MDM ∼ 1013M¯, major
mergers bring in mostly stars (see Figure 4.3. For Milky Way-size systems,
major mergers since z = 2 bring in ∼ 30% of the galaxy’s z = 0 baryonic mass,
with most of this contribution in the form of gas.
Many of these conclusions lend support to the conjecture of Robertson et al. (2006a)
and Brook et al. (2007a), who were the first to forcefully suggested a scenario where
gas-rich mergers play an important role in building and stabilizing disk galaxies at
high redshift. Though our conclusions are far from a sufficient test of this idea, we
have demonstrated that gas-rich mergers should be common enough to make it viable
for serious consideration.
Among our most interesting results is the similarity between our predicted gas-poor
merger fraction with halo mass and the observed early-type galaxy fraction with
halo mass (Figure 4.2, left panel). Of course, even if gas-rich mergers do preserve
disks, there are many openings for concern. For example, the current presentation
103
leaves little room for the production of bulge-dominated systems by means other than
major mergers. In an extreme yet illustrative example, Bournaud et al. (2007) used
a suite of focused simulations to show that bulge-dominated galaxies may be formed
by successive minor mergers. Disk galaxies can also grow massive bulges by secular
processes (typically bulges formed in this way show kinematically distinct properties
from classical bulges, and are referred to as “pseudobulges”) (e.g. Courteau et al.,
1996; Kormendy & Kennicutt, 2004; Kormendy & Fisher, 2005, 2008).
An interesting possibility in this context of disk survival and secular evolution is
that we have been too conservative in our classification of ‘gas-rich’. Our fiducial
division between gas-rich and gas poor at fg = 50% was motivated by the idealized
simulations studied by Robertson et al. (2006a) and Hopkins et al. (2008). However
Governato et al. (2009) used a cosmologically self-consistent hydrodynamic simulation
to demonstrate the creation of spiral galaxy at z = 0 within a system that experienced
a very major ((m/M)DM > 0.8) merger at z = 0.8. The two progenitor galaxies in
this case were only moderately gas-rich (fg ∼ 20%). Despite these relatively low gas
fractions, the merger remnant was able to quickly reform a disk via the cooling of
gas from the hot phase. If we use this result as motivation to focus on the more
lenient (fg > 30%) definition of gas-rich in Figure 4.2, our gas-poor merger fractions
drop to 10− 20% smaller than the observed bulge-dominated fractions, leaving room
for processes other than gas-poor major mergers to cause a significant portion of
morphological transformations.
The general semi-empirical findings we have presented here may be regarded as accu-
rate (not precise) predictions based on merger histories of LCDM halos and observed
relations. As such, it is reassuring that our almost unavoidable qualitative trends are
consistent with a growing body of work that stresses the importance of gas-richness
in preserving disk morphologies during mergers (Barnes, 2002; Brook et al., 2004;
104
Springel & Hernquist, 2005; Robertson et al., 2006a; Brook et al., 2007b,a; Governato
et al., 2007, 2009; Hopkins et al., 2009a; Robertson & Bullock, 2008). Although we
have focused primarily on issues of morphological transformation, disk survival, and
baryonic accretion via mergers in this chapter, we believe that in future work, the
semi-empirical approach we have used here may provide a useful tool in exploring a
vast array of galaxy properties and evolutionary mechanisms.
4.6 Acknowledgements
The contents of this chapter were previously published by Stewart, Bullock, Wechsler
and Maller (2009) in The Astrophysics Journal, September 2009 (v702, p307). The
simulation used in this chapter was run on the Columbia machine at NASA Ames.
We would like to thank Anatoly Klypin for running the simulation and making it
available to us. We are also indebted to Brandon Allgood for providing the merger
trees. We thank Charlie Conroy for sharing his abundance matching data so we
could assign stellar masses to dark matter halos, and Lisa Wei (and collaborators)
for sharing gas fraction data from an upcoming paper.
105
Chapter 5
Invisible Major Mergers: Defining
Galaxy “Merger Ratios”
5.1 Chapter Abstract
The mapping between dark matter halo mass, galaxy stellar mass, and galaxy cold
gas mass is not a simple linear relation, but is influenced by a wide array of galaxy for-
mation processes. We implement observationally-normalized relations between dark
matter halo mass, stellar mass, and cold gas mass to explore these mappings, with
specific emphasis on the correlation between different definitions of a major galaxy
merger. We always define a major merger by a mass ratio m/M > 0.3, but allow the
masses used to compute this ratio to be defined in one of three ways: dark matter halo
masses, galaxy stellar masses, or galaxy baryonic masses (stars and cold gas). We find
that the merger ratio assigned to any particular merger event depends strongly on
which of these masses is used, with the mapping between different mass ratio defini-
tions showing strong evolution with halo mass and redshift. For example, major dark
106
matter mergers (> 0.3) in small galaxies (MDM < 1011M¯) typically correspond to
very minor stellar mergers (< 1/20). These mergers contain significant dark matter
mass, and should cause noticeable morphological disruption to the primary galaxy,
even though there is no observable bright companion. In massive galaxies, there
is an opposite effect, with bright companion galaxies corresponding to only minor
dark matter mergers. We emphasize that great care must be taken when comparing
mergers based on different mass ratio definitions.
5.2 Introduction
In the cold dark matter (CDM) model of structure formation, galaxy mergers are
believed to play an important role in galaxy evolution. Typically, these mergers are
divided into two categories. “Minor” mergers (with mass ratios < 1/3) are often
thought to trigger moderate bursts of increased star formation and/or morphological
disturbances, as well as contributing to the deposition of diffuse light components of
galaxies. “Major” mergers (with mass ratios > 1/3) are likely to influence stronger
morphological disturbances responsible for the transformation from disk-dominated
to bulge-dominated morphologies, in addition to triggering stronger starburst and
AGN activity.
Despite this commonly adopted distinction between major and minor mergers at
merger mass ratios of ∼ 1/3, there is still ambiguity in what mass is used to define
this ratio. Theoretical investigations of dark matter halo merger rates typically define
merger ratios in terms of dark matter halo masses, the most theoretically robust
prediction from cosmological N -body simulations (e.g. Chapter 2, and references
within). But because estimates of dark matter halo masses are difficult to obtain
observationally, it is also common to define merger ratios by comparing the stellar
107
masses or the total baryonic masses of galaxies.
In attempting to compare theoretically derived merger statistics (in terms of dark
matter mass ratios) to observational investigations of galaxy mergers (in terms of
stellar or galaxy mass ratios), it is important to understand the mapping between
these definitions. Galaxy merger rates, for example, are quite sensitive to the merger
mass ratio being considered (Chapter 3). In order to explore the fundamental dif-
ferences between major mergers as defined by dark matter halo, stellar, and galaxy
merger ratios, we adopt a semi-empirical methodology to estimate the stellar and cold
gas content of dark matter halos as a function of halo mass and redshift. We give a
very brief overview of this method before presenting our findings, but we refer reader
to Chapter 4 for a more in-depth discussion of this method.
5.3 Assigning Baryons and Defining Masses
In order to assign stars to our halos, we assume a monotonic relationship between
halo mass and stellar mass. Using this technique, provided we know ng(> Mstar) (the
cumulative number density of galaxies with stellar mass more massive than Mstar) we
may determine the associated dark matter halo population by finding the halo mass
above which the number density of halos (including subhalos) matches that of the
galaxy population, nh(> MDM) = ng(> Mstar). Specifically, we adopt the relation
found by Conroy & Wechsler, 2009a (interpolated from the data in their Figure 5.2).
Of course, a simple relation of this kind cannot be correct in detail, but in an average
sense, it provides a good characterization of the relationship between halo mass and
galaxy stellar mass that must hold in order for LCDM to reproduce the observed
universe.
108
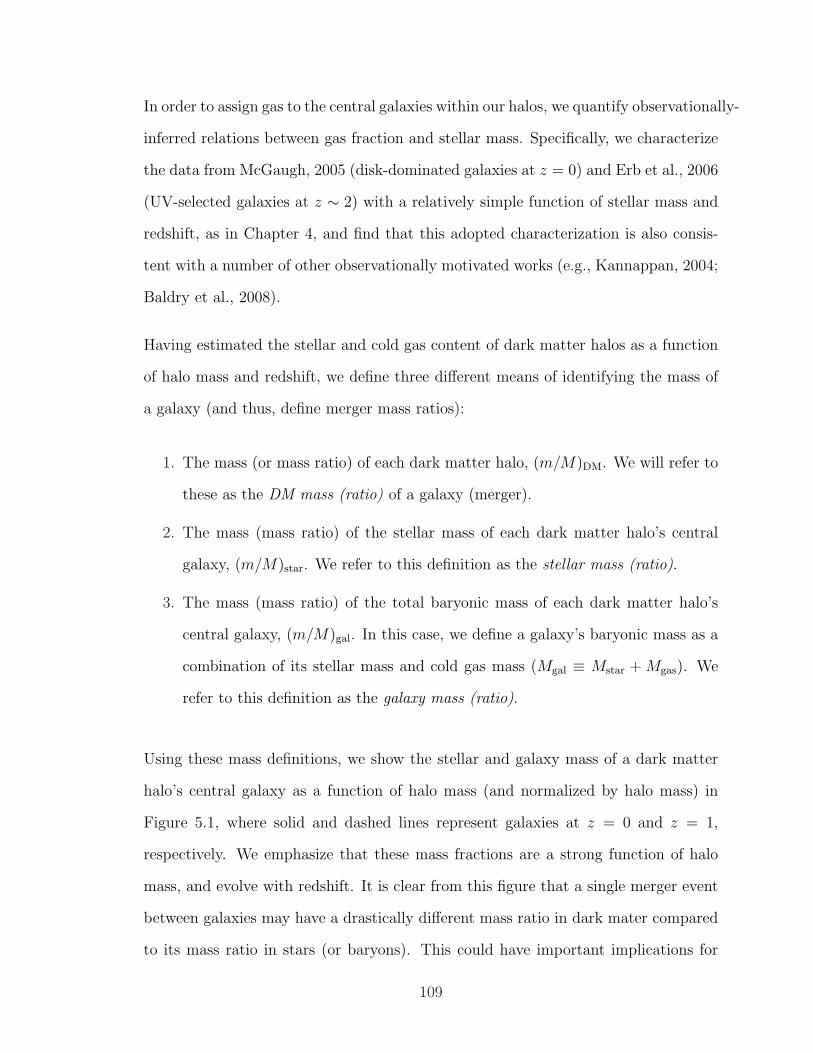
In order to assign gas to the central galaxies within our halos, we quantify observationally-
inferred relations between gas fraction and stellar mass. Specifically, we characterize
the data from McGaugh, 2005 (disk-dominated galaxies at z = 0) and Erb et al., 2006
(UV-selected galaxies at z ∼ 2) with a relatively simple function of stellar mass and
redshift, as in Chapter 4, and find that this adopted characterization is also consis-
tent with a number of other observationally motivated works (e.g., Kannappan, 2004;
Baldry et al., 2008).
Having estimated the stellar and cold gas content of dark matter halos as a function
of halo mass and redshift, we define three different means of identifying the mass of
a galaxy (and thus, define merger mass ratios):
1. The mass (or mass ratio) of each dark matter halo, (m/M)DM. We will refer to
these as the DM mass (ratio) of a galaxy (merger).
2. The mass (mass ratio) of the stellar mass of each dark matter halo’s central
galaxy, (m/M)star. We refer to this definition as the stellar mass (ratio).
3. The mass (mass ratio) of the total baryonic mass of each dark matter halo’s
central galaxy, (m/M)gal. In this case, we define a galaxy’s baryonic mass as a
combination of its stellar mass and cold gas mass (Mgal ≡ Mstar + Mgas). We
refer to this definition as the galaxy mass (ratio).
Using these mass definitions, we show the stellar and galaxy mass of a dark matter
halo’s central galaxy as a function of halo mass (and normalized by halo mass) in
Figure 5.1, where solid and dashed lines represent galaxies at z = 0 and z = 1,
respectively. We emphasize that these mass fractions are a strong function of halo
mass, and evolve with redshift. It is clear from this figure that a single merger event
between galaxies may have a drastically different mass ratio in dark mater compared
to its mass ratio in stars (or baryons). This could have important implications for
109
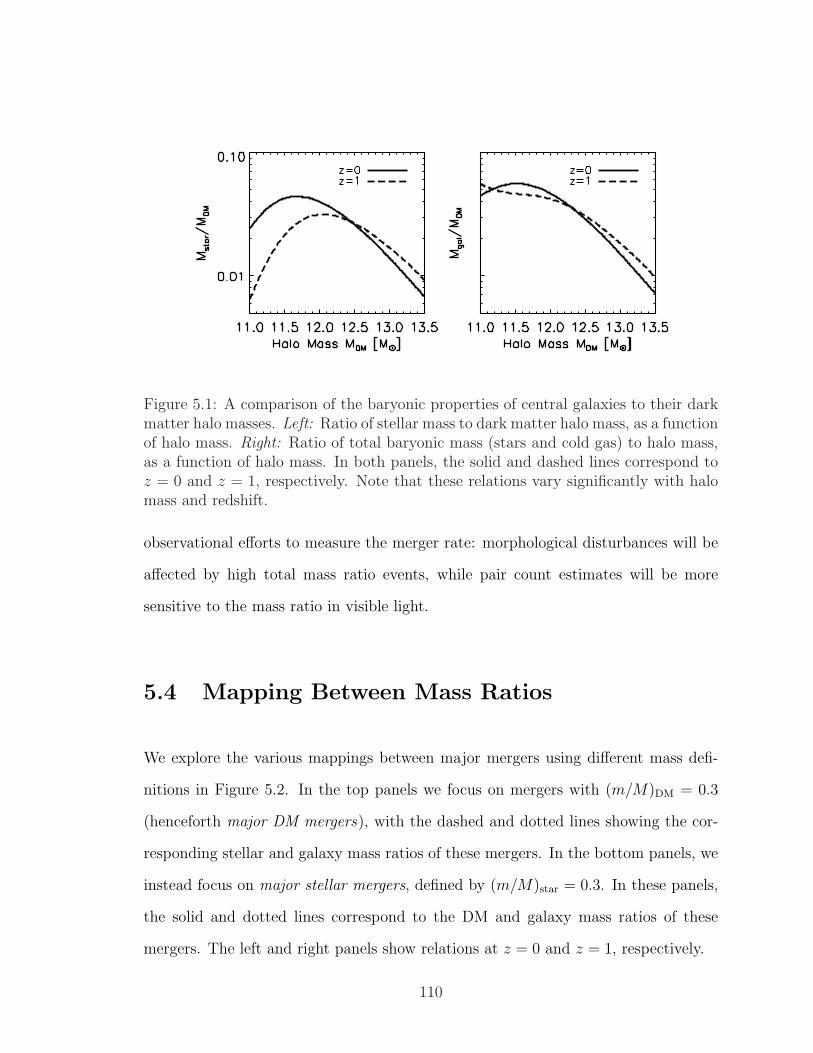
Figure 5.1: A comparison of the baryonic properties of central galaxies to their darkmatter halo masses. Left: Ratio of stellar mass to dark matter halo mass, as a functionof halo mass. Right: Ratio of total baryonic mass (stars and cold gas) to halo mass,as a function of halo mass. In both panels, the solid and dashed lines correspond toz = 0 and z = 1, respectively. Note that these relations vary significantly with halomass and redshift.
observational efforts to measure the merger rate: morphological disturbances will be
affected by high total mass ratio events, while pair count estimates will be more
sensitive to the mass ratio in visible light.
5.4 Mapping Between Mass Ratios
We explore the various mappings between major mergers using different mass defi-
nitions in Figure 5.2. In the top panels we focus on mergers with (m/M)DM = 0.3
(henceforth major DM mergers), with the dashed and dotted lines showing the cor-
responding stellar and galaxy mass ratios of these mergers. In the bottom panels, we
instead focus on major stellar mergers, defined by (m/M)star = 0.3. In these panels,
the solid and dotted lines correspond to the DM and galaxy mass ratios of these
mergers. The left and right panels show relations at z = 0 and z = 1, respectively.
110

Figure 5.2: Conversion between major merger ratios defined by dark matter halo mass(MDM), stellar mass (Mstar), or galaxy (baryonic) mass (Mgal). In the top panels, thedashed and dotted lines show the stellar and galaxy mass ratios of major DM mergerswith (m/M)DM = 0.3, as a function of halo mass (lower axis) and stellar mass (topaxis). Similarly, the solid and dotted lines in the bottom panels show the DM andgalaxy mass ratios corresponding to major stellar mergers with (m/M)star = 0.3. Theleft and right panels give these relations at z = 0 and z = 1, respectively.
We emphasize that, in general, the DM mass ratio between two galaxies is not the
same as the stellar (or galaxy) mass ratio. Specifically, major DM mergers (top panels)
correspond to stellar mass ratios ranging from ∼ 5− 60% (5− 50%) and galaxy mass
ratios of ∼ 20− 60% (35 − 50%) for 1011−13M¯ halos at z = 0 (1). Similarly, major
111
stellar mergers (bottom panels) correspond to DM mass ratios from ∼ 10 − 55%
(15− 65%) and galaxy mass ratios of ∼ 30− 45% (35− 75%) for 1011−13M¯ halos at
z = 0 (1). Indeed, the only broad regime where different mass definitions result in
similar merger ratios is for stellar and galaxy merger ratios of massive galaxies, where
galaxy gas fractions are typically low enough that Mstar ∼ Mgal.
Note that in MDM < 1011M¯ halos, major DM mergers should contain stellar mass
ratios < 1/20. The smaller galaxy in these mergers contain significant mass in dark
matter, and should be capable of triggering severe morphological disruption in the
primary galaxy, but they are observationally “invisible,” with negligible luminous
content with respect to the primary. The existence of these “invisible” major mergers
is a robust, testable prediction of LCDM.
5.5 Example Consequence: Measuring the Merger
Rate
While theoretical investigations into dark matter halo merger rates define mergers by
DM mass ratios, observed merger rates (specifically, those based on close-pair counts
of galaxies) typically select pairs based on luminosity (stellar mass), and should thus
constitute major stellar mergers. The mapping between stellar and DM mass ratios
has two important qualitative effects in this case. First, for smaller halos, major DM
mergers should correspond to substantially smaller stellar mass ratios, and may not
be distinguishable as a luminous close-pair when observed (ie. faint/invisible major
mergers). Second, for massive halos, some observed close-pairs with comparable lu-
minosities (major stellar mergers) may correspond to substantially smaller DM mass
ratios, and would be counted as minor (not major) mergers in theoretical predictions
112
from N -body simulations (ie. bright minor mergers).
For a more quantitative analysis, we adopt the fitting function for dN/dt from Chapter
3 (Table 3.1, infall, “simple fit”), which provides the rate of mergers more massive
than (m/M)DM into dark matter halos of mass MDM (per halo, per Gyr) as a function
of redshift, mass, and mass ratio. For 1011M¯ dark matter halos and DM merger
ratios > 30% at z = 0 − 1, the merger rate increases from ∼ 0.015 − 0.075. Now
consider an identical halo mass, but for mergers selected on stellar mass ratios > 30%,
corresponding to a DM mass ratio of ∼ 7% (4%) at z = 0 (1). Because of the minor
DM mergers being considered, this selection would result in an artificial increase of the
observed merger rate by a factor of 3−4 compared to DM merger rates (∼ 0.05−0.30
from z = 0−1), with a redshift evolution that is too steep (and does not appear to fit
well to dN/dt ∝ (1 + z)α; see Chapter 3). Thus, using different mass ratios to define
mergers has a substantial effect on predictions of galaxy merger rates, and great care
must be taken when comparing studies of galaxy or halo mergers, if the merger mass
ratios have been defined by different criterion.
113
Chapter 6
Stealth Galaxies in the Halo of the
Milky Way
6.1 Chapter Abstract
We predict that there is a population of low-luminosity dwarf galaxies orbiting within
the halo of the Milky Way that have surface brightnesses so low that they have es-
caped detection in modern star-count surveys. The overall count of stealth galaxies
is sensitive to the presence (or lack) of a low-mass threshold in galaxy formation.
These systems have luminosities and stellar velocity dispersions that are similar to
those of known ultrafaint dwarf galaxies but they have more extended stellar distribu-
tions (Re & 100 pc) because they inhabit dark subhalos that are slightly less massive
than their higher surface brightness counterparts. We show that a typical ultrafaint
galaxy with L = 103L¯ and σ? = 5 km s−1 will have a peak surface brightness fainter
than 30 mag arcsec−2 if it inhabits a dark subhalo with maximum circular velocity
smaller than about 15 km s−1, or equivalently, with a mass within 300 pc less than
114
about 107M¯. One implication is that the inferred common mass scale for Milky Way
dwarfs may be an artifact of selection bias. We use results from the Via Lactea II
N -body simulation to show that if there is no sharp threshold in galaxy formation
at low halo mass then ultrafaint galaxies like Segue I represent the high-mass, early
forming tail of a much larger population of objects that have typical peak circular
velocities of about ∼ 8 km s−1 and masses within 300 pc of ∼ 5×10⁶M¯. In this case,
there should be hundreds of stealth galaxies in the halo of the Milky Way, making up
about half of potentially-observable systems. Alternatively, if we impose a low-mass
threshold in galaxy formation in order to explain the unexpectedly high densities of
the ultrafaint dwarfs, then we expect only a handful of stealth galaxies in the halo of
the Milky Way. We expect a similar paucity of stealth galaxies if the power spectrum
is truncated of if the dark matter is warm. A complete census of these objects will
require deeper sky surveys, 30m-class follow-up telescopes, and more refined methods
to identify extended, self-bound groupings of stars in the halo.
6.2 Introduction
Approximately twenty-five new dwarf galaxy companions of the Milky Way (MW)
and M31 have been discovered since 2004, more than doubling the known satellite
population in the Local Group in five years (Willman et al., 2005; Zucker et. al, 2006;
Grillmair, 2006; Majewski et al., 2007; Belokurov et al., 2007; Grillmair, 2009; Be-
lokurov et al., 2009; Martin et al., 2009). The majority of these newly-discovered
dwarfs are less luminous than any galaxy previously known. The most extreme of
these, the ultra-faint MW dwarfs, have luminosities smaller than an average globular
cluster LV ' 102 − 104 L¯, and were discovered by searches for stellar overdensities
in the wide-field maps of the Sloan Digital Sky Survey (SDSS) and the Sloan Ex-
115
tension for Galactic Understanding and Exploration (SEGUE). Follow-up kinematic
observations showed that these tiny galaxies have surprisingly high stellar velocity
dispersions for their luminosities and sizes (σ? ∼ 5 km s−1, Martin et al., 2007; Simon
& Geha, 2007; Geha et al., 2009) and subsequent mass modeling has shown that they
are the most dark matter dominated galaxies known (Strigari et al., 2008; Wolf et al.,
2009). Remarkably, these extreme systems are not only the faintest, most dark mat-
ter dominated galaxies in the universe but they are also the most metal poor stellar
systems yet studied (Kirby et al., 2008; Geha et al., 2009).
Perhaps the most exciting aspect of these recent discoveries is that they point to a
much larger population. Detection in the SDSS is complete only to ∼ 50 kpc for the
least luminous dwarfs (Koposov et al., 2008; Walsh et al., 2009) and straightforward
cosmologically motivated luminosity bias and coverage corrections suggest that there
are ∼ 500 ultra-faint dwarf galaxies within 400 kpc of the Milky Way (Tollerud
et al., 2008), with an ever increasing number beyond. Moreover, the luminosity-
distance detection limits only apply for systems with peak surface brightness obeying
µV < 30 mag arcsec−2 (Koposov et al., 2008). Any satellite galaxy with a luminosity
of L ∼ 1000 L¯ and a projected half-light radius Re larger than about 100 pc would
have evaded detection with current star-count techniques.
Here we argue that there should be a population of dwarf galaxies surrounding the
Milky Way (and by extension, throughout the universe) that are so diffuse in stellar
density that they would have thus far avoided discovery. Our predictions rely on the
fact that the effective radius Re of a dark matter dominated, dispersion-supported
galaxy with fixed stellar velocity dispersion will increase as its dark matter halo mass
decreases. One implication of this idea is that the known ultrafaint dwarf spheroidals
(dSphs) may represent the high (dark matter) mass tail of a larger distribution of
stealth galaxies. These undiscovered systems should preferentially inhabit the lowest
116
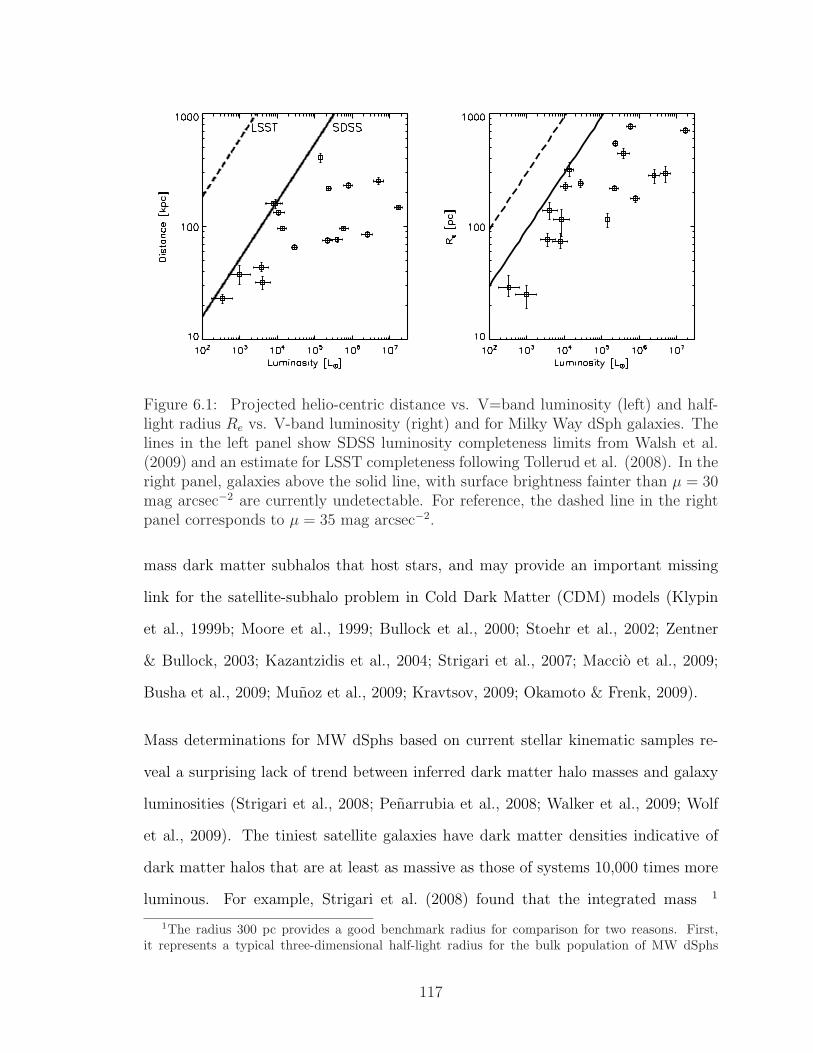
Figure 6.1: Projected helio-centric distance vs. V=band luminosity (left) and half-light radius Re vs. V-band luminosity (right) and for Milky Way dSph galaxies. Thelines in the left panel show SDSS luminosity completeness limits from Walsh et al.(2009) and an estimate for LSST completeness following Tollerud et al. (2008). In theright panel, galaxies above the solid line, with surface brightness fainter than µ = 30mag arcsec−2 are currently undetectable. For reference, the dashed line in the rightpanel corresponds to µ = 35 mag arcsec−2.
mass dark matter subhalos that host stars, and may provide an important missing
link for the satellite-subhalo problem in Cold Dark Matter (CDM) models (Klypin
et al., 1999b; Moore et al., 1999; Bullock et al., 2000; Stoehr et al., 2002; Zentner
& Bullock, 2003; Kazantzidis et al., 2004; Strigari et al., 2007; Maccio et al., 2009;
Busha et al., 2009; Munoz et al., 2009; Kravtsov, 2009; Okamoto & Frenk, 2009).
Mass determinations for MW dSphs based on current stellar kinematic samples re-
veal a surprising lack of trend between inferred dark matter halo masses and galaxy
luminosities (Strigari et al., 2008; Penarrubia et al., 2008; Walker et al., 2009; Wolf
et al., 2009). The tiniest satellite galaxies have dark matter densities indicative of
dark matter halos that are at least as massive as those of systems 10,000 times more
luminous. For example, Strigari et al. (2008) found that the integrated mass 1
1The radius 300 pc provides a good benchmark radius for comparison for two reasons. First,it represents a typical three-dimensional half-light radius for the bulk population of MW dSphs
117
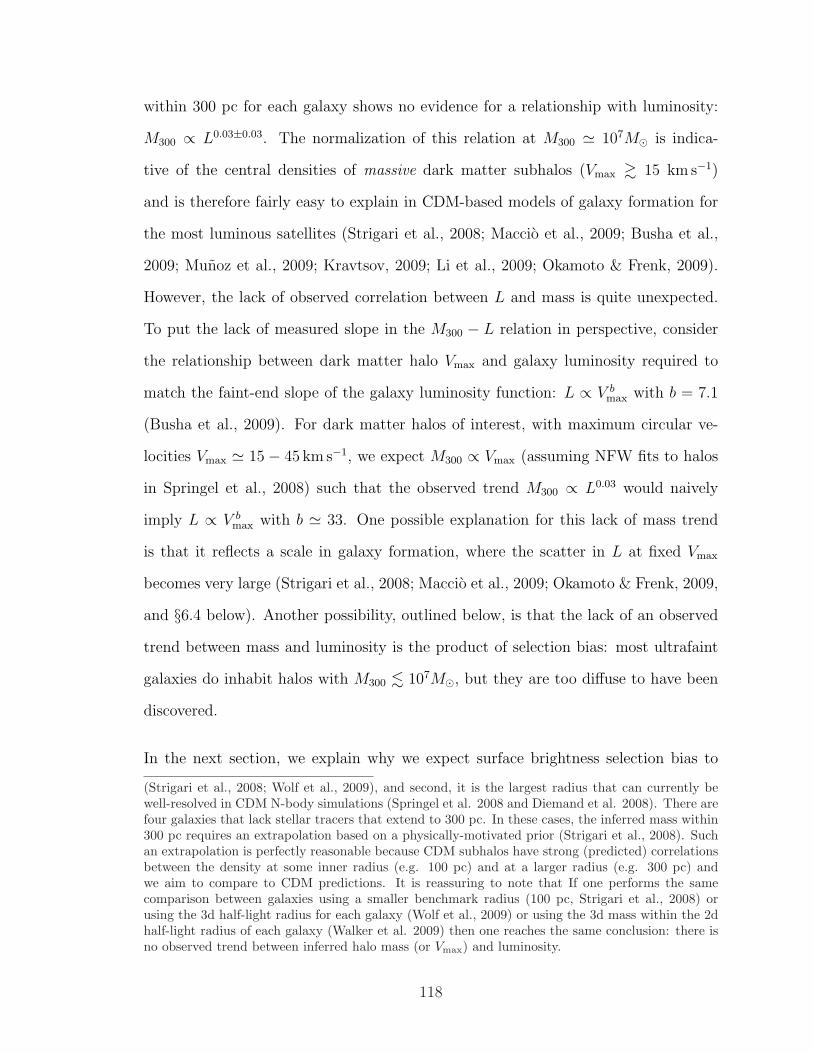
within 300 pc for each galaxy shows no evidence for a relationship with luminosity:
M300 ∝ L0.03±0.03. The normalization of this relation at M300 ' 107M¯ is indica-
tive of the central densities of massive dark matter subhalos (Vmax & 15 km s−1)
and is therefore fairly easy to explain in CDM-based models of galaxy formation for
the most luminous satellites (Strigari et al., 2008; Maccio et al., 2009; Busha et al.,
2009; Munoz et al., 2009; Kravtsov, 2009; Li et al., 2009; Okamoto & Frenk, 2009).
However, the lack of observed correlation between L and mass is quite unexpected.
To put the lack of measured slope in the M300 − L relation in perspective, consider
the relationship between dark matter halo Vmax and galaxy luminosity required to
match the faint-end slope of the galaxy luminosity function: L ∝ V bmax with b = 7.1
(Busha et al., 2009). For dark matter halos of interest, with maximum circular ve-
locities Vmax ' 15− 45 km s−1, we expect M300 ∝ Vmax (assuming NFW fits to halos
in Springel et al., 2008) such that the observed trend M300 ∝ L0.03 would naively
imply L ∝ V bmax with b ' 33. One possible explanation for this lack of mass trend
is that it reflects a scale in galaxy formation, where the scatter in L at fixed Vmax
becomes very large (Strigari et al., 2008; Maccio et al., 2009; Okamoto & Frenk, 2009,
and §6.4 below). Another possibility, outlined below, is that the lack of an observed
trend between mass and luminosity is the product of selection bias: most ultrafaint
galaxies do inhabit halos with M300 . 107M¯, but they are too diffuse to have been
discovered.
In the next section, we explain why we expect surface brightness selection bias to
(Strigari et al., 2008; Wolf et al., 2009), and second, it is the largest radius that can currently bewell-resolved in CDM N-body simulations (Springel et al. 2008 and Diemand et al. 2008). There arefour galaxies that lack stellar tracers that extend to 300 pc. In these cases, the inferred mass within300 pc requires an extrapolation based on a physically-motivated prior (Strigari et al., 2008). Suchan extrapolation is perfectly reasonable because CDM subhalos have strong (predicted) correlationsbetween the density at some inner radius (e.g. 100 pc) and at a larger radius (e.g. 300 pc) andwe aim to compare to CDM predictions. It is reassuring to note that If one performs the samecomparison between galaxies using a smaller benchmark radius (100 pc, Strigari et al., 2008) orusing the 3d half-light radius for each galaxy (Wolf et al., 2009) or using the 3d mass within the 2dhalf-light radius of each galaxy (Walker et al. 2009) then one reaches the same conclusion: there isno observed trend between inferred halo mass (or Vmax) and luminosity.
118
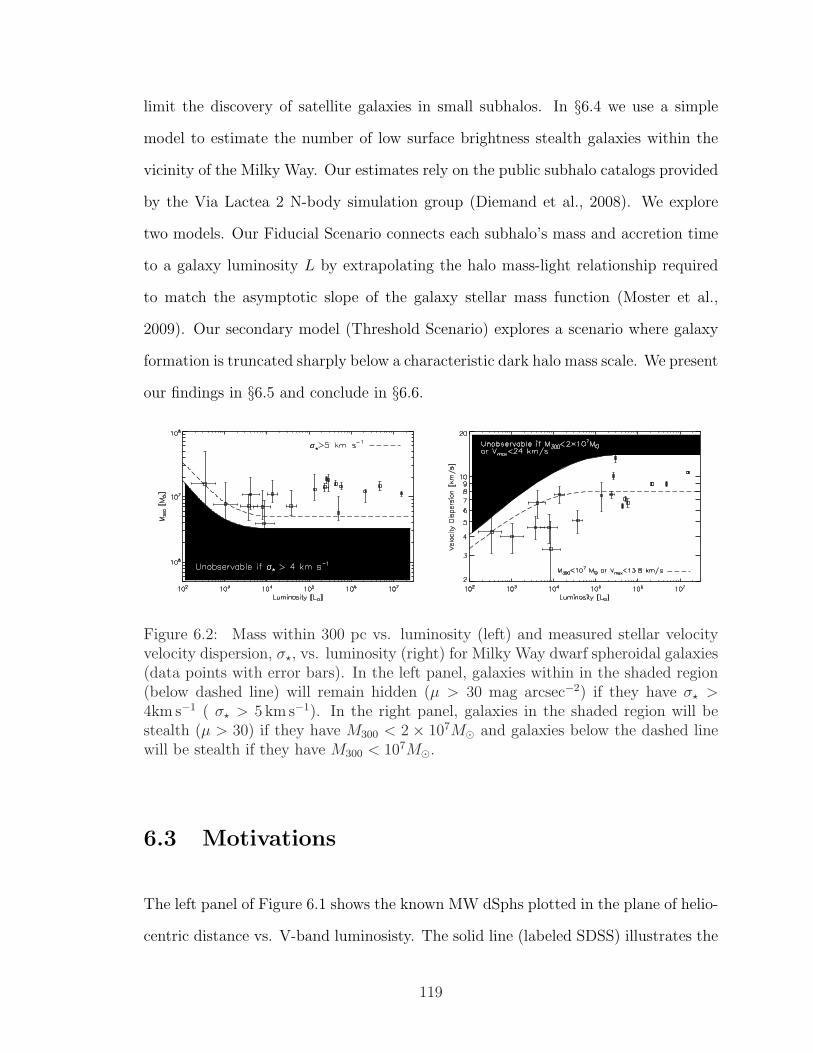
limit the discovery of satellite galaxies in small subhalos. In §6.4 we use a simple
model to estimate the number of low surface brightness stealth galaxies within the
vicinity of the Milky Way. Our estimates rely on the public subhalo catalogs provided
by the Via Lactea 2 N-body simulation group (Diemand et al., 2008). We explore
two models. Our Fiducial Scenario connects each subhalo’s mass and accretion time
to a galaxy luminosity L by extrapolating the halo mass-light relationship required
to match the asymptotic slope of the galaxy stellar mass function (Moster et al.,
2009). Our secondary model (Threshold Scenario) explores a scenario where galaxy
formation is truncated sharply below a characteristic dark halo mass scale. We present
our findings in §6.5 and conclude in §6.6.
Figure 6.2: Mass within 300 pc vs. luminosity (left) and measured stellar velocityvelocity dispersion, σ?, vs. luminosity (right) for Milky Way dwarf spheroidal galaxies(data points with error bars). In the left panel, galaxies within in the shaded region(below dashed line) will remain hidden (µ > 30 mag arcsec−2) if they have σ? >4km s−1 ( σ? > 5 km s−1). In the right panel, galaxies in the shaded region will bestealth (µ > 30) if they have M300 < 2 × 10⁷M¯ and galaxies below the dashed linewill be stealth if they have M300 < 107M¯.
6.3 Motivations
The left panel of Figure 6.1 shows the known MW dSphs plotted in the plane of helio-
centric distance vs. V-band luminosisty. The solid line (labeled SDSS) illustrates the
119
distance to which dwarfs of a given luminosity can be detected in SDSS with 90%
efficiency from Walsh et al. (2009). Similar results were presented by Koposov et al.
(2008). The upper line shows the same limit adjusted up by scaling to the limiting
magnitude of the full co-added LSST survey (Tollerud et al., 2008; Ivezic et. al,
2008). Clearly, the known dwarf galaxies cluster at the current completeness edge of
the diagram, indicating a high likelihood for future discoveries (Koposov et al., 2008;
Tollerud et al., 2008; Walsh et al., 2009).
The distance-luminosity completeness limits presented by Walsh et al. (2009) and
Koposov et al. (2008) are only applicable for systems with surface brightness brighter
than µV = 30 mag arcsec−2 (Koposov et al., 2008, and G. Gilmore, M. Geha, and
B. Willman, private communications). Systems more diffuse than this limit cannot
be detected in SDSS with current methods, no matter their helio-centric distance.
This phenomenon is illustrated qualitatively in the right panel of Figure 6.1, which
presents the same set of MW dSphs in the plane of Re vs. L. The solid line shows a
constant peak (central) surface brightness for a Plummer profile
Σpeak =L
πR2e
= 0.036 L¯ pc−2, (6.1)
and corresponds to µV = 30 mag arcsec−2 for solar absolute magnitude M¯V = 4.83.
As in the distance-luminosity figure, the tendency for many of the fainter dwarfs to
“pile up” near the surface brightness detection limit is suggestive. There is nothing
ruling out the presence of a larger population of more extended systems that remain
undetected because of their low surface brightness.
If a large number of diffuse, undetected galaxies do exist, they are likely associated
with low-mass dark matter subhalos. One can understand this expectation by con-
sidering a spherically-symmetric galaxy with stellar density distribution ρ∗(r) and
120
radial velocity profile σr(r) that is embedded within a gravitationally-dominant dark
matter halo mass profile M(r). The Jeans equation implies
M(r) =r σ2
r
G(γ? + γσ − 2β) , (6.2)
where β(r) ≡ 1 − σ2t /σ
2r characterizes the tangential velocity dispersion and γ? ≡
−d ln ρ?/d ln r and γσ ≡ −d ln σ2r/d ln r. If we make the simplifying assumption that
β = 0 and σ(r) ' σ? = constant, with γσ ¿ 1 then M(r) = r G−1 σ2? γ?. For a fixed
velocity dispersion, a more spatially extended profile (smaller γ?) requires a lower
mass at fixed radius.
The same basic expectation follows in a more general context from the recent work
of Wolf et al. (2009), who showed 2 that the total mass of a quasi-spherical dSph
galaxy within its 3d half-light radius r1/2 ' 1.3 Re may be determined accurately from
the luminosity weighted line-of-sight velocity dispersion σ? for general β: M(r1/2) =
3 G−1 r1/2 σ2?. Mass determinations at larger and smaller radii require an extrapolation
of the mass profile from that point, but given a theoretical prediction for the shape
of the dark matter mass profile one can perform this extrapolation.
It is useful to rewrite the Wolf et al. (2009) mass estimator in terms of the implied
circular velocity at r1/2:
Vc(r1/2) =√
3 σ?. (6.3)
Consider then a galaxy with velocity dispersion σ? and luminosity L embedded within
a gravitationally-dominant dark matter halo described by a circular velocity curve
that increases with radius as an approximate power law: Vc(r) = V300 (r/300pc)α.
2Under the assumption that the observed stellar velocity dispersion remains fairly flat with pro-jected radius, as is the case with all of the well-studied systems.
121
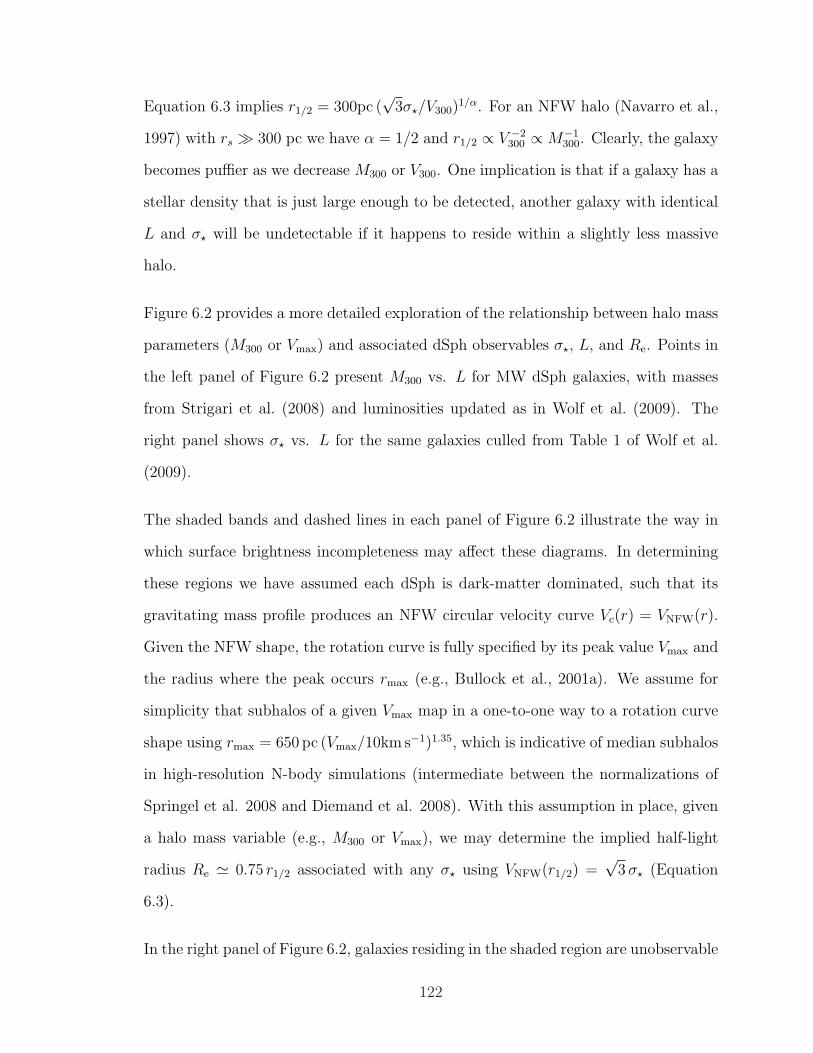
Equation 6.3 implies r1/2 = 300pc (√
3σ?/V300)1/α. For an NFW halo (Navarro et al.,
1997) with rs À 300 pc we have α = 1/2 and r1/2 ∝ V −2300 ∝ M−1
300. Clearly, the galaxy
becomes puffier as we decrease M300 or V300. One implication is that if a galaxy has a
stellar density that is just large enough to be detected, another galaxy with identical
L and σ? will be undetectable if it happens to reside within a slightly less massive
halo.
Figure 6.2 provides a more detailed exploration of the relationship between halo mass
parameters (M300 or Vmax) and associated dSph observables σ?, L, and Re. Points in
the left panel of Figure 6.2 present M300 vs. L for MW dSph galaxies, with masses
from Strigari et al. (2008) and luminosities updated as in Wolf et al. (2009). The
right panel shows σ? vs. L for the same galaxies culled from Table 1 of Wolf et al.
(2009).
The shaded bands and dashed lines in each panel of Figure 6.2 illustrate the way in
which surface brightness incompleteness may affect these diagrams. In determining
these regions we have assumed each dSph is dark-matter dominated, such that its
gravitating mass profile produces an NFW circular velocity curve Vc(r) = VNFW(r).
Given the NFW shape, the rotation curve is fully specified by its peak value Vmax and
the radius where the peak occurs rmax (e.g., Bullock et al., 2001a). We assume for
simplicity that subhalos of a given Vmax map in a one-to-one way to a rotation curve
shape using rmax = 650 pc (Vmax/10km s−1)1.35, which is indicative of median subhalos
in high-resolution N-body simulations (intermediate between the normalizations of
Springel et al. 2008 and Diemand et al. 2008). With this assumption in place, given
a halo mass variable (e.g., M300 or Vmax), we may determine the implied half-light
radius Re ' 0.75 r1/2 associated with any σ? using VNFW(r1/2) =√
3 σ? (Equation
6.3).
In the right panel of Figure 6.2, galaxies residing in the shaded region are unobservable
122
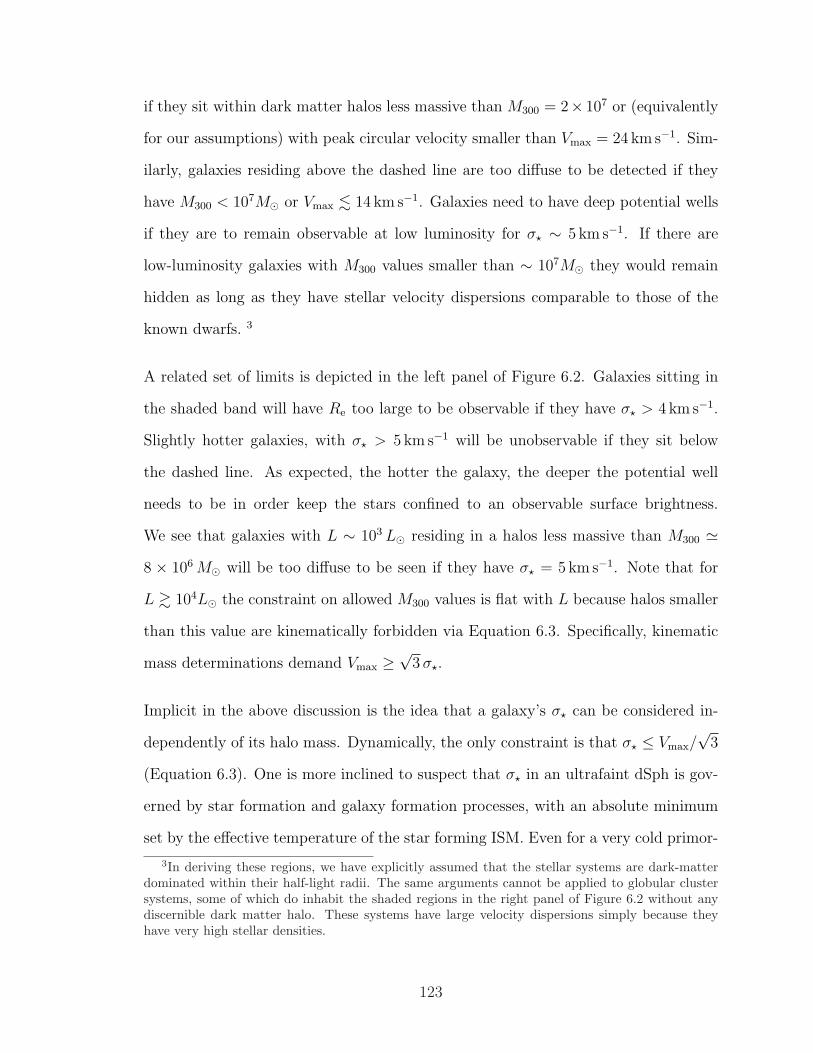
if they sit within dark matter halos less massive than M300 = 2× 10⁷ or (equivalently
for our assumptions) with peak circular velocity smaller than Vmax = 24 km s−1. Sim-
ilarly, galaxies residing above the dashed line are too diffuse to be detected if they
have M300 < 107M¯ or Vmax . 14 km s−1. Galaxies need to have deep potential wells
if they are to remain observable at low luminosity for σ? ∼ 5 km s−1. If there are
low-luminosity galaxies with M300 values smaller than ∼ 107M¯ they would remain
hidden as long as they have stellar velocity dispersions comparable to those of the
known dwarfs. 3
A related set of limits is depicted in the left panel of Figure 6.2. Galaxies sitting in
the shaded band will have Re too large to be observable if they have σ? > 4 km s−1.
Slightly hotter galaxies, with σ? > 5 km s−1 will be unobservable if they sit below
the dashed line. As expected, the hotter the galaxy, the deeper the potential well
needs to be in order keep the stars confined to an observable surface brightness.
We see that galaxies with L ∼ 103 L¯ residing in a halos less massive than M300 '8 × 10⁶ M¯ will be too diffuse to be seen if they have σ? = 5 km s−1. Note that for
L & 104L¯ the constraint on allowed M300 values is flat with L because halos smaller
than this value are kinematically forbidden via Equation 6.3. Specifically, kinematic
mass determinations demand Vmax ≥√
3 σ?.
Implicit in the above discussion is the idea that a galaxy’s σ? can be considered in-
dependently of its halo mass. Dynamically, the only constraint is that σ? ≤ Vmax/√
3
(Equation 6.3). One is more inclined to suspect that σ? in an ultrafaint dSph is gov-
erned by star formation and galaxy formation processes, with an absolute minimum
set by the effective temperature of the star forming ISM. Even for a very cold primor-
3In deriving these regions, we have explicitly assumed that the stellar systems are dark-matterdominated within their half-light radii. The same arguments cannot be applied to globular clustersystems, some of which do inhabit the shaded regions in the right panel of Figure 6.2 without anydiscernible dark matter halo. These systems have large velocity dispersions simply because theyhave very high stellar densities.
123
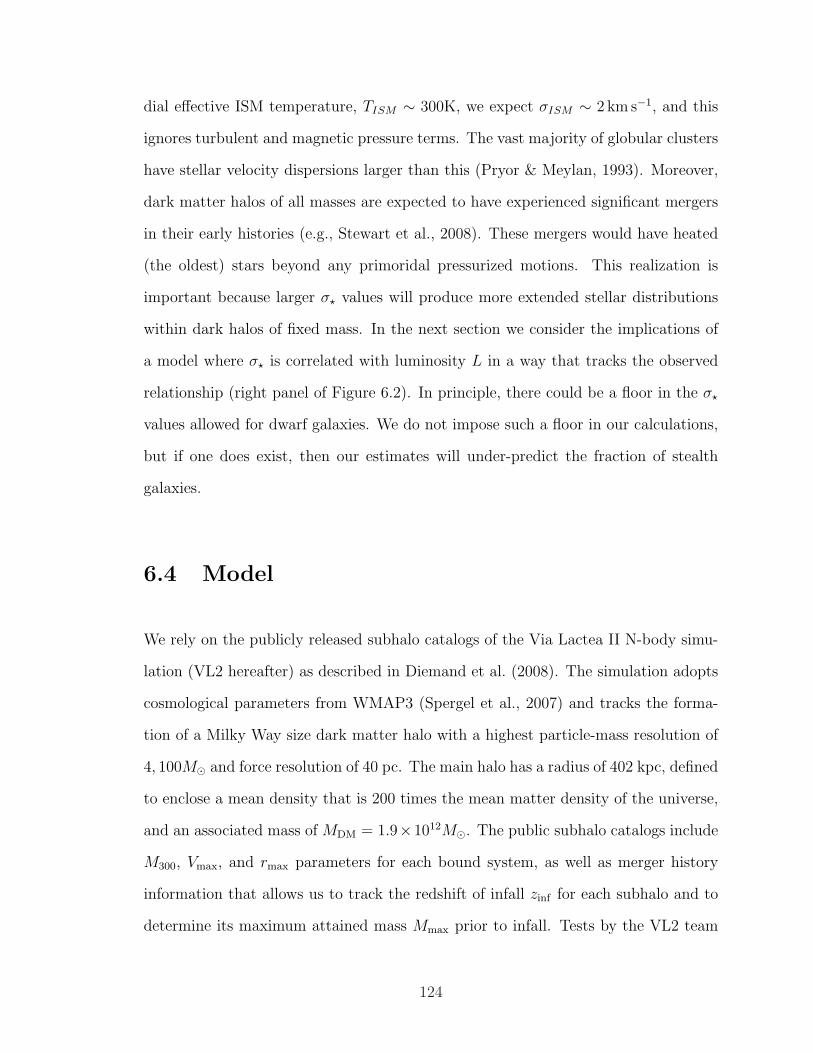
dial effective ISM temperature, TISM ∼ 300K, we expect σISM ∼ 2 km s−1, and this
ignores turbulent and magnetic pressure terms. The vast majority of globular clusters
have stellar velocity dispersions larger than this (Pryor & Meylan, 1993). Moreover,
dark matter halos of all masses are expected to have experienced significant mergers
in their early histories (e.g., Stewart et al., 2008). These mergers would have heated
(the oldest) stars beyond any primoridal pressurized motions. This realization is
important because larger σ? values will produce more extended stellar distributions
within dark halos of fixed mass. In the next section we consider the implications of
a model where σ? is correlated with luminosity L in a way that tracks the observed
relationship (right panel of Figure 6.2). In principle, there could be a floor in the σ?
values allowed for dwarf galaxies. We do not impose such a floor in our calculations,
but if one does exist, then our estimates will under-predict the fraction of stealth
galaxies.
6.4 Model
We rely on the publicly released subhalo catalogs of the Via Lactea II N-body simu-
lation (VL2 hereafter) as described in Diemand et al. (2008). The simulation adopts
cosmological parameters from WMAP3 (Spergel et al., 2007) and tracks the forma-
tion of a Milky Way size dark matter halo with a highest particle-mass resolution of
4, 100M¯ and force resolution of 40 pc. The main halo has a radius of 402 kpc, defined
to enclose a mean density that is 200 times the mean matter density of the universe,
and an associated mass of MDM = 1.9×10¹²M¯. The public subhalo catalogs include
M300, Vmax, and rmax parameters for each bound system, as well as merger history
information that allows us to track the redshift of infall zinf for each subhalo and to
determine its maximum attained mass Mmax prior to infall. Tests by the VL2 team
124
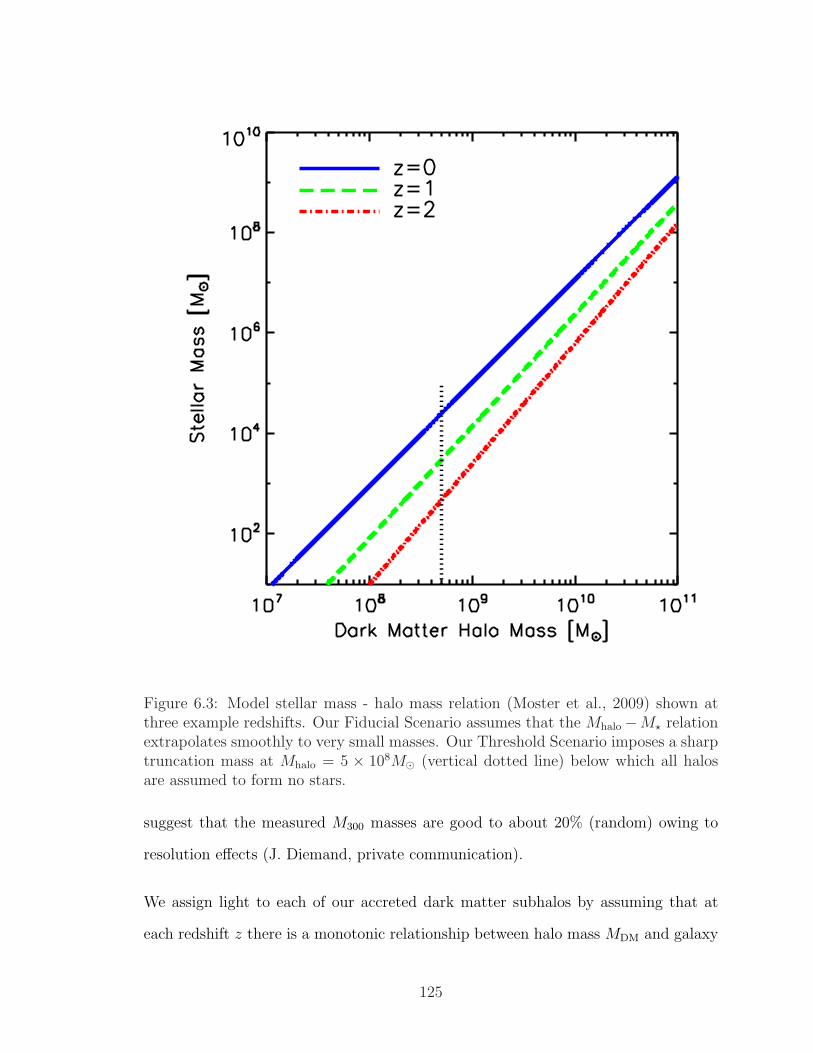
Figure 6.3: Model stellar mass - halo mass relation (Moster et al., 2009) shown atthree example redshifts. Our Fiducial Scenario assumes that the Mhalo−M? relationextrapolates smoothly to very small masses. Our Threshold Scenario imposes a sharptruncation mass at Mhalo = 5 × 10⁸M¯ (vertical dotted line) below which all halosare assumed to form no stars.
suggest that the measured M300 masses are good to about 20% (random) owing to
resolution effects (J. Diemand, private communication).
We assign light to each of our accreted dark matter subhalos by assuming that at
each redshift z there is a monotonic relationship between halo mass MDM and galaxy
125
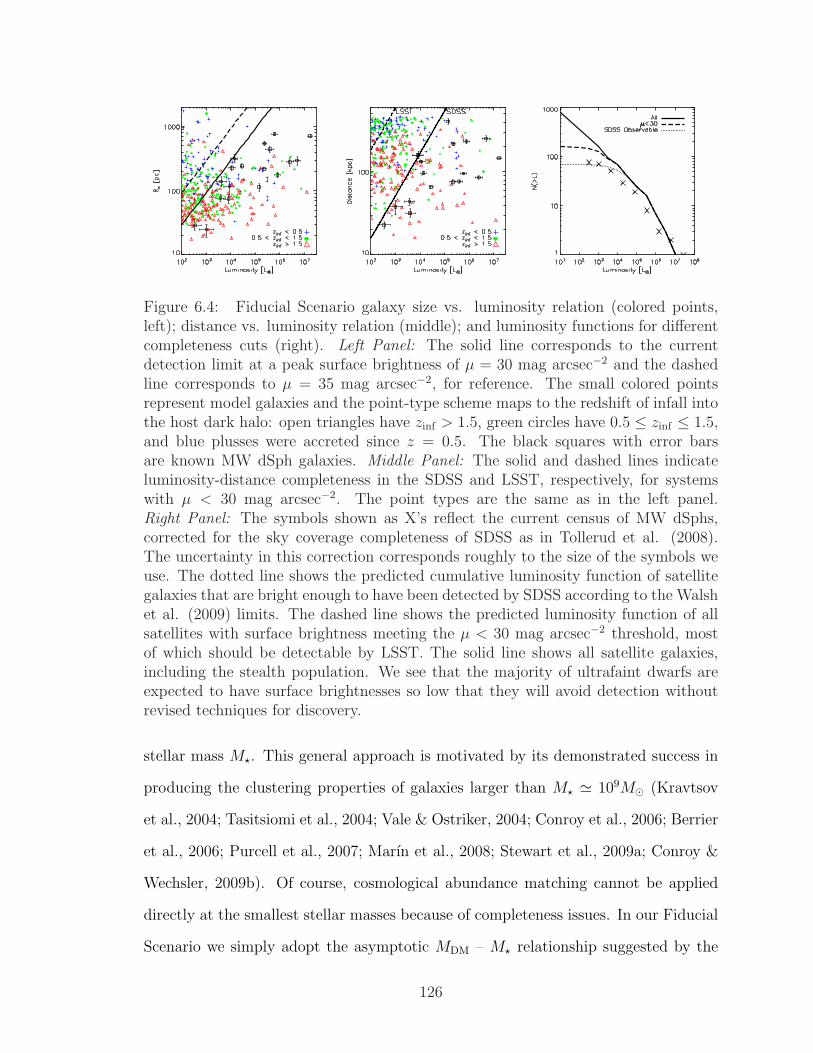
Figure 6.4: Fiducial Scenario galaxy size vs. luminosity relation (colored points,left); distance vs. luminosity relation (middle); and luminosity functions for differentcompleteness cuts (right). Left Panel: The solid line corresponds to the currentdetection limit at a peak surface brightness of µ = 30 mag arcsec−2 and the dashedline corresponds to µ = 35 mag arcsec−2, for reference. The small colored pointsrepresent model galaxies and the point-type scheme maps to the redshift of infall intothe host dark halo: open triangles have zinf > 1.5, green circles have 0.5 ≤ zinf ≤ 1.5,and blue plusses were accreted since z = 0.5. The black squares with error barsare known MW dSph galaxies. Middle Panel: The solid and dashed lines indicateluminosity-distance completeness in the SDSS and LSST, respectively, for systemswith µ < 30 mag arcsec−2. The point types are the same as in the left panel.Right Panel: The symbols shown as X’s reflect the current census of MW dSphs,corrected for the sky coverage completeness of SDSS as in Tollerud et al. (2008).The uncertainty in this correction corresponds roughly to the size of the symbols weuse. The dotted line shows the predicted cumulative luminosity function of satellitegalaxies that are bright enough to have been detected by SDSS according to the Walshet al. (2009) limits. The dashed line shows the predicted luminosity function of allsatellites with surface brightness meeting the µ < 30 mag arcsec−2 threshold, mostof which should be detectable by LSST. The solid line shows all satellite galaxies,including the stealth population. We see that the majority of ultrafaint dwarfs areexpected to have surface brightnesses so low that they will avoid detection withoutrevised techniques for discovery.
stellar mass M?. This general approach is motivated by its demonstrated success in
producing the clustering properties of galaxies larger than M? ' 109M¯ (Kravtsov
et al., 2004; Tasitsiomi et al., 2004; Vale & Ostriker, 2004; Conroy et al., 2006; Berrier
et al., 2006; Purcell et al., 2007; Marın et al., 2008; Stewart et al., 2009a; Conroy &
Wechsler, 2009b). Of course, cosmological abundance matching cannot be applied
directly at the smallest stellar masses because of completeness issues. In our Fiducial
Scenario we simply adopt the asymptotic MDM – M? relationship suggested by the
126
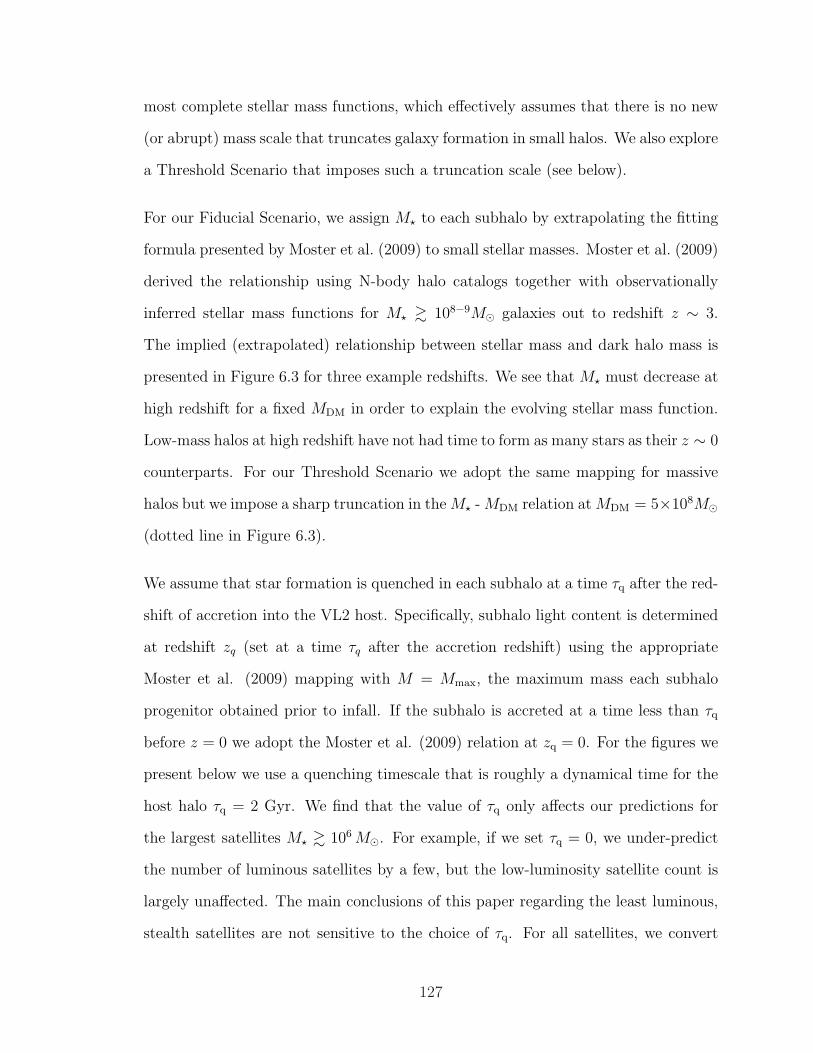
most complete stellar mass functions, which effectively assumes that there is no new
(or abrupt) mass scale that truncates galaxy formation in small halos. We also explore
a Threshold Scenario that imposes such a truncation scale (see below).
For our Fiducial Scenario, we assign M? to each subhalo by extrapolating the fitting
formula presented by Moster et al. (2009) to small stellar masses. Moster et al. (2009)
derived the relationship using N-body halo catalogs together with observationally
inferred stellar mass functions for M? & 108−9M¯ galaxies out to redshift z ∼ 3.
The implied (extrapolated) relationship between stellar mass and dark halo mass is
presented in Figure 6.3 for three example redshifts. We see that M? must decrease at
high redshift for a fixed MDM in order to explain the evolving stellar mass function.
Low-mass halos at high redshift have not had time to form as many stars as their z ∼ 0
counterparts. For our Threshold Scenario we adopt the same mapping for massive
halos but we impose a sharp truncation in the M? - MDM relation at MDM = 5×10⁸M¯
(dotted line in Figure 6.3).
We assume that star formation is quenched in each subhalo at a time τq after the red-
shift of accretion into the VL2 host. Specifically, subhalo light content is determined
at redshift zq (set at a time τq after the accretion redshift) using the appropriate
Moster et al. (2009) mapping with M = Mmax, the maximum mass each subhalo
progenitor obtained prior to infall. If the subhalo is accreted at a time less than τq
before z = 0 we adopt the Moster et al. (2009) relation at zq = 0. For the figures we
present below we use a quenching timescale that is roughly a dynamical time for the
host halo τq = 2 Gyr. We find that the value of τq only affects our predictions for
the largest satellites M? & 106 M¯. For example, if we set τq = 0, we under-predict
the number of luminous satellites by a few, but the low-luminosity satellite count is
largely unaffected. The main conclusions of this paper regarding the least luminous,
stealth satellites are not sensitive to the choice of τq. For all satellites, we convert
127
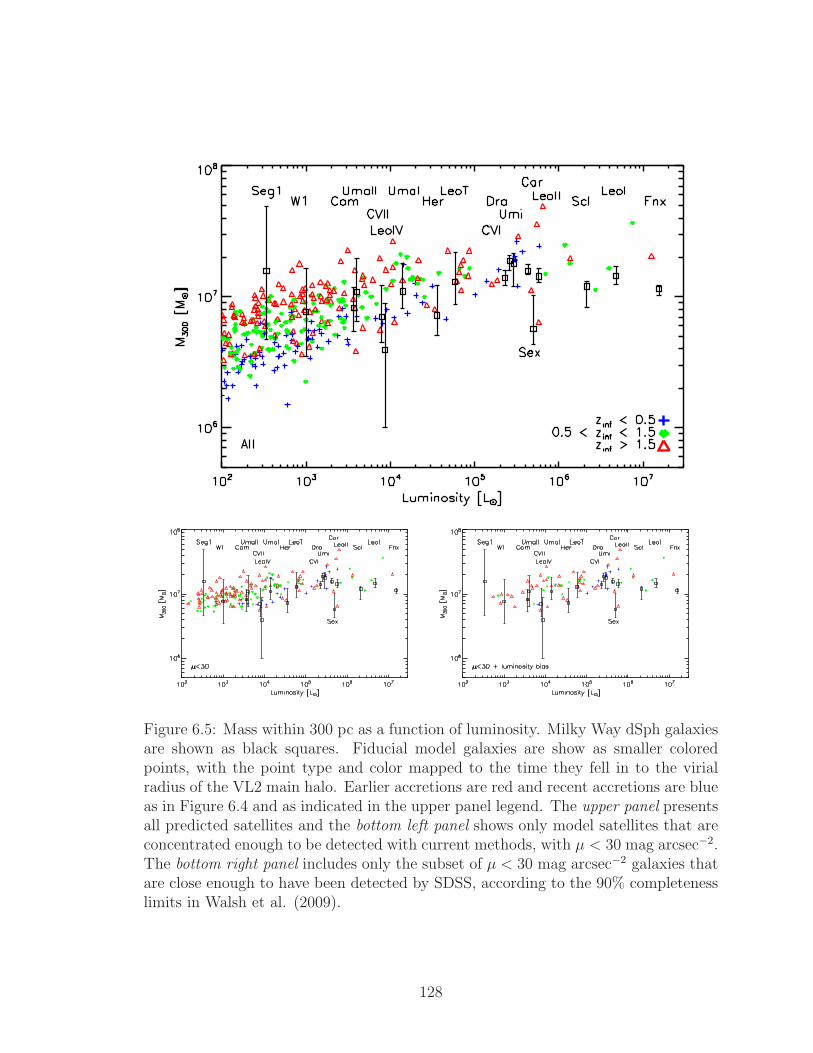
Figure 6.5: Mass within 300 pc as a function of luminosity. Milky Way dSph galaxiesare shown as black squares. Fiducial model galaxies are show as smaller coloredpoints, with the point type and color mapped to the time they fell in to the virialradius of the VL2 main halo. Earlier accretions are red and recent accretions are blueas in Figure 6.4 and as indicated in the upper panel legend. The upper panel presentsall predicted satellites and the bottom left panel shows only model satellites that areconcentrated enough to be detected with current methods, with µ < 30 mag arcsec−2.The bottom right panel includes only the subset of µ < 30 mag arcsec−2 galaxies thatare close enough to have been detected by SDSS, according to the 90% completenesslimits in Walsh et al. (2009).
128
from stellar mass to V-band luminosity using M?/L = 2 [M¯/L¯], which is typical
for Milky Way dSphs according to Martin et al. (2008) for a Kroupa IMF.
Once L is determined for each subhalo, we assign a stellar velocity dispersion by
adopting the empirical relation shown in the right panel of Figure 6.2:
σ? = 6.9 km s−1
(L
105 L¯
)0.09
, (6.4)
with a log normal scatter of ∆ log10 σ = 0.1 at fixed L. 4 We then determine Re '0.75 r1/2 using VNFW (r1/2) =
√3 σ? (Equation 2). The Vmax and rmax values that
define VNFW (r) are those measured for each subhalo in the simulation. We note that
in ∼ 90% of cases we find r1/2 < rmax, such that the NFW assumption for V (r)
provides a reasonable description for the dark matter profiles of subhalos. In reality,
subhalo rotation curves decline more rapidly than NFW at r & rmax because of tidal
effects (e.g. Kazantzidis et al., 2004). The few systems that we do have with r1/2 >
rmax represent systems with stellar content that is currently being tidally stripped.
We will not explore the observational implications of this evaporating population
here, but this definition may prove useful for future theoretical explorations aimed
at predicting the fraction of dwarf satellites that should be showing signs of ongoing
stellar stripping.
With Re ' 0.75 r1/2 in hand, we may now assign a surface brightness to each system.
For simplicity, we assume that each dwarf galaxy follows a Plummer profile, with
a peak surface density given by Equation 6.1. As discussed above, galaxies with
Σpeak < 0.036 L¯ pc−2 are assumed to be undetectable with standard techniques.
Before moving on to our results, we mention that the halo finder and the associated
4We do not account for any systematic surface brightness bias that would lead to high σ? systemsbeing missed (as these are the systems that will have large Re). By ignoring this effect we aresystematically under-estimating the possible number of stealth galaxies.
129
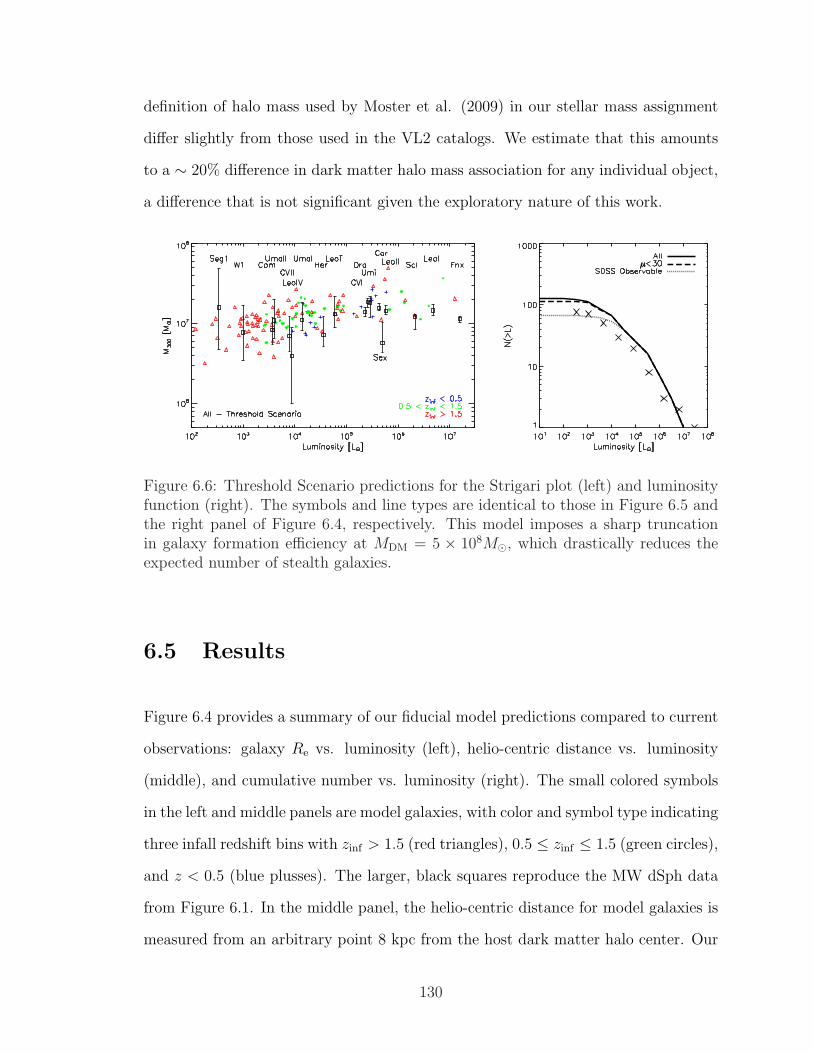
definition of halo mass used by Moster et al. (2009) in our stellar mass assignment
differ slightly from those used in the VL2 catalogs. We estimate that this amounts
to a ∼ 20% difference in dark matter halo mass association for any individual object,
a difference that is not significant given the exploratory nature of this work.
Figure 6.6: Threshold Scenario predictions for the Strigari plot (left) and luminosityfunction (right). The symbols and line types are identical to those in Figure 6.5 andthe right panel of Figure 6.4, respectively. This model imposes a sharp truncationin galaxy formation efficiency at MDM = 5 × 10⁸M¯, which drastically reduces theexpected number of stealth galaxies.
6.5 Results
Figure 6.4 provides a summary of our fiducial model predictions compared to current
observations: galaxy Re vs. luminosity (left), helio-centric distance vs. luminosity
(middle), and cumulative number vs. luminosity (right). The small colored symbols
in the left and middle panels are model galaxies, with color and symbol type indicating
three infall redshift bins with zinf > 1.5 (red triangles), 0.5 ≤ zinf ≤ 1.5 (green circles),
and z < 0.5 (blue plusses). The larger, black squares reproduce the MW dSph data
from Figure 6.1. In the middle panel, the helio-centric distance for model galaxies is
measured from an arbitrary point 8 kpc from the host dark matter halo center. Our
130
gross results are independent of this choice for solar location.
Model galaxies above the solid line in the left panel of Figure 6.4 are too diffuse
to have been detected. Clearly, this population is significant. At fixed luminosity,
systems above the solid line (µ = 30 mag arcsec−2) tend to have been accreted
more recently (blue) than their higher-surface brightness counterparts (red). This
trend follows directly from our redshift-dependent mapping between L and halo mass
– at fixed stellar mass, the required halo mass increases with redshift (Figure 6.3)
and, as discussed above, more massive halos tend to host more concentrated stellar
distributions for a given σ? and L. We also see that there is a slight tendency for
early-accreted galaxies to be closer to the Sun than more recently-accreted galaxies
(middle panel).
The dotted line in the right panel of Figure 6.4 shows the predicted luminosity function
of satellites that are observable for an SDSS-like survey covering the full sky according
to the luminosity-distance completeness limits of Walsh et al. (2009). This should
be compared to the data points, which reflect the current MW satellite population
corrected for sky-coverage as in Tollerud et al. (2008). The uncertainty in the in
the sky-coverage correction (associated with the possibility of an anisotropic satellite
distribution on the sky) is similar to the size of the points (Tollerud et al. 2008). We
see that the predicted and observed populations are roughly consistent. The solid
line shows the predicted luminosity function for all satellites within 400 kpc, without
any allowance for observational incompleteness. The dashed line, on the other hand,
shows the subset of those galaxies that have peak stellar surface densities that are
bright enough to be discovered with standard techniques. We see that roughly half of
the systems that are in principle luminous enough to be detected with deep surveys
like LSST (with L . 1000L¯) have peak surface densities that are too diffuse to be
seen. Specifically, even a survey like LSST, with a very deep limiting magnitude, will
131
have difficulties detecting these systems without new observing strategies.
Figure 6.5 explores how detection bias affects the Strigari plot. In the upper panel,
we show M300 vs. L for all model satellites within 400 kpc of the Sun (color/type
scheme is the same as in Figure 6.4) compared to the MW dSphs (black squares).
We see that unlike the data, there is a significant population of predicted galaxies
with low central densities M300 . 5 × 10⁶M¯ for L . 5000L¯ . Moreover, while the
data follow a nearly common-mass relation M300 ∝ Lc with c ' 0.05 (using updated
luminosities) the model points prefer a steeper trend c ' 0.15 (as expected from
abundance matching). The model predictions are very similar to those presented in
many past CDM-based explorations of satellite M300 values (e.g. Maccio et al., 2009;
Busha et al., 2009; Munoz et al., 2009). The similarity between our model results
and those of Munoz et al. (2009), in particular, are encouraging. These authors use
the same VL2 catalog that we use, but they explored a more sophisticated model for
assigning light to subhalos. Generally, a population of L . 5000L¯ satellite galaxies
with M300 . 5×10⁶M¯ seems to be a fairly robust expectation for hierarchical models.
The bottom left panel of Figure 6.5 includes only those model galaxies that have peak
surface brightness µ < 30 mag arcsec−2. We see that this requirement immediately
removes the population of M300 . 5 × 10⁶M¯ objects. The bottom right panel
includes only those galaxies that meet both the surface brightness requirement and
the luminosity-distance requirement for SDSS discovery. We see that the resultant
population of observable model galaxies has M300 values that are very much in line
with those of the known MW dSphs. The model we have adopted therefore reproduces
both the luminosity function and the mass function of Milky Way dwarfs, once all of
the relevant selection bias effects are taken into account. It is therefore reasonable to
take the implied model prediction seriously: there is a large, undiscovered population
of very low surface brightness MW satellite galaxies that preferentially inhabit the
132
lowest mass dark matter halos to host stars.
Of course, if the smallest dark matter halos do not contain galaxies at all, then the
likelihood for a significant stealth galaxy population is much reduced. We explore
this expectation with our Threshold Scenario, which imposes a sharp scale in galaxy
formation at MDM = 5 × 10⁸M¯. Below this scale dark matter halos are completely
devoid of stars (vertical line in Figure 6.3). The resultant Strigari plot and luminosity
functions for this model are shown in Figure 6.6. Like the Fiducial Scenario, the
Threshold Scenario also reproduces the observed satellite luminosity function (right
panel). However, unlike in the Fiducial Scenario, we now expect only a handful of
stealth galaxies that remain undiscovered (solid vs. dashed lines). The Threshold
case also yields a Strigari relation that is in reasonable agreement with the data (left
panel), without appealing to any selection bias. Another distinct difference in the
Threshold scenario is that all of the low-luminosity galaxies are expected to be quite
old (or at least to have been accreted early zinf > 1.5).
Before concluding we note that the MW dSph M300 masses in Figures 6.5 and 6.6
are taken directly from Strigari et al. (2008). A more recent analysis of membership
in the Hercules dwarf (labeled Her in Figures 6.5 and 6.6) by Aden et al. (2009)
suggests that the actual M300 mass for this system is about a factor of ∼ 3 lower
than the value used in our Figure 6.5. Though this result does not change the fact
that there is no strong observed trend between M300 and L in the data, it does
make the mass of Hercules more difficult to explain in our model (and in almost
all CDM-based models to date). The newly-derived velocity dispersion from Aden
et al. (2009) is σ? ' 3.7km s−1, which is low enough that this system would not be
expected to be stealth according to our definition. Of course, as the most elongated
of the dSphs known, the systematic error associated with any spherically-symmetric
mass determination in Hercules is likely to be significant. More work on the issue of
133
membership and mass modeling in this interesting object is certainly warranted.
6.6 Conclusions and Discussion
We have argued that there is likely a population of low-luminosity satellite galaxies
orbiting within the halo of the Milky Way that are too diffuse to have been detected
with current star-count surveys, despite the fact that they have luminosities similar
to those of known ultrafaint MW dSphs. These stealth galaxies should preferentially
inhabit the smallest dark matter subhalos that host stars (Vmax . 15 km s−1). One
implication is that selection bias (Figures 6.2 and 6.5) may play a role explaining the
apparent common mass scale for MW dSph galaxies (Strigari et al., 2008; Penarrubia
et al., 2008; Walker et al., 2009; Wolf et al., 2009).
We developed a plausible estimate for the number and character of MW stealth satel-
lites using the subhalo catalogs of the VL2 simulation (Diemand et al., 2008). We
assigned light to subhalos by extrapolating the dark matter mass-light relationship re-
quired to reproduce bright galaxy number counts (Moster et al., 2009) and we assigned
stellar velocity dispersions to each system by adopting the empirical relationship be-
tween σ? and L for known Milky Way dwarfs. Finally, galaxy sizes were computed
using the dynamical relationship between Re and σ? for the measured dark matter
halo densities in each subhalo (Equation 6.3). The resultant model galaxy popula-
tion includes a substantial fraction of ultrafaint galaxies that are stealth, with peak
surface brightness µ > 30 mag arcsec−2. According to our fiducial estimate, about
half of the several hundred satellite galaxies that should be potentially observable by
surveys like LSST fall into this category (Figure 6.4).
We also explored the possibility that there is a sharp threshold in galaxy formation
134
at a halo mass of MDM = 5 × 10⁸M¯. This idea follows from the common mass
conjecture in Strigari et al. (2008) and remains viable since it reproduces the observed
Milky Way satellite luminosity function as well as a fairly weak M300 vs. L trend
without appealing to selection bias (Figure 6.6). In this scenario, there are no low-
mass halos that host satellite galaxies, and therefore the number of predicted stealth
galaxies (which preferentially inhabit the smallest dark matter halos) is significantly
reduced (Figure 6.6). Moreover, we expect that all of the low-luminosity satellites
will have been accreted since z ' 1.5 (Figure 6.6) and that they will all host old
stellar populations. This is not necessarily the case in our Fiducial Scenario, where
the most distant and low-mass subhalos may host ultrafaint galaxies that contain
intermediate-age stars.
It is well known that galaxy formation has a primary scale – the scale that gives rise
to the L∗ cutoff in galaxy counts at the bright end of the luminosity function. We do
not know if there is a second scale at the low-luminosity end. One implication of our
findings is that a complete search for very low surface brightness satellite galaxies of
the Milky Way can help determine whether or not there is a second scale in galaxy
formation. Of course, the lack of stealth galaxies is fundamentally an indication that
there are no very low mass halos that host stars. A similar effect would be seen if
there were simply a truncation in the power spectrum, as might be expected in ∼ 1
KeV WDM models (Strigari et al., 2008; Maccio’ & Fontanot, 2009). In this sense,
the discovery of many stealth galaxies in the halo would provide a means to constrain
dark matter particle properties in addition to galaxy formation physics.
It is possible that the structure known as the Pices Overdensity (or Structure J) at
a distance of ∼ 85 kpc represents the first detection of a stealth dwarf galaxy with
µ > 30 (Kollmeier et al., 2009), though deeper imaging and spectroscopic follow-up
will be required to test this suggestion. Unlike the well-known ultrafaint dSphs of
135
the Milky Way, which were discovered as overdensities in RGB or MS turnoff stars,
this system was discovered as an excess in RR Lyrae variables in the multi-epoch
SDSS Stripe-82 (Watkins et al., 2009; Sesar et. al, 2007). Repeated sky surveys like
Pan-STARRS and LSST may provide the best hope for discoveries of this kind in the
future.
More generally, upcoming deep, time-resolved sky surveys and associated follow-up
campaigns with 30m-class telescopes offer significant hope for the discovery of hun-
dreds of new dwarf galaxy companions of the Milky Way (Tollerud et al. 2008).
These data will definitively constrain the overall count of stealth galaxies that lurk
at very low surface brightness and provide unparalleled constraints on the efficiency
of galaxy formation in the smallest dark matter halos.
6.7 Acknowledgements
The contents of this chapter have been submitted for publication in The Astrophysics
Journal as Bullock, Stewart, Kaplinghat, and Tollerud (2010) . We thank M. Geha,
G. Gilmore, J. Simon, and B. Willman for useful discussions.
136
Chapter 7
Future Work
7.1 A Systematic Approach to Cosmological Hy-
drodynamic Simulations
So far, the work presented here has specialized in analyzing cosmological dark matter
simulations to understand the merger statistics of dark matter halos. While dark
matter halo merger rates and merger statistics are well understood in the current
ΛCDM framework, the underlying baryonic physics is much more complicated. In
the work presented so far, we have used semi-empirical techniques such as the ob-
served stellar mass function and relations between galaxy stellar mass and cold gas
mass to estimate baryonic properties of DM halos in a statistical sense. This method
is statistically reliable for large samples of halos, however, the scatter in these rela-
tions make such an approach impossible for studying the detailed evolution of galaxies
on a case-by-case basis. An alternate approach is to use the initial conditions for a
smaller subregion of a large dark matter simulation as a starting point for a smooth
particle hydrodynamic (SPH) simulation, that includes treatment of gas, star forma-
137
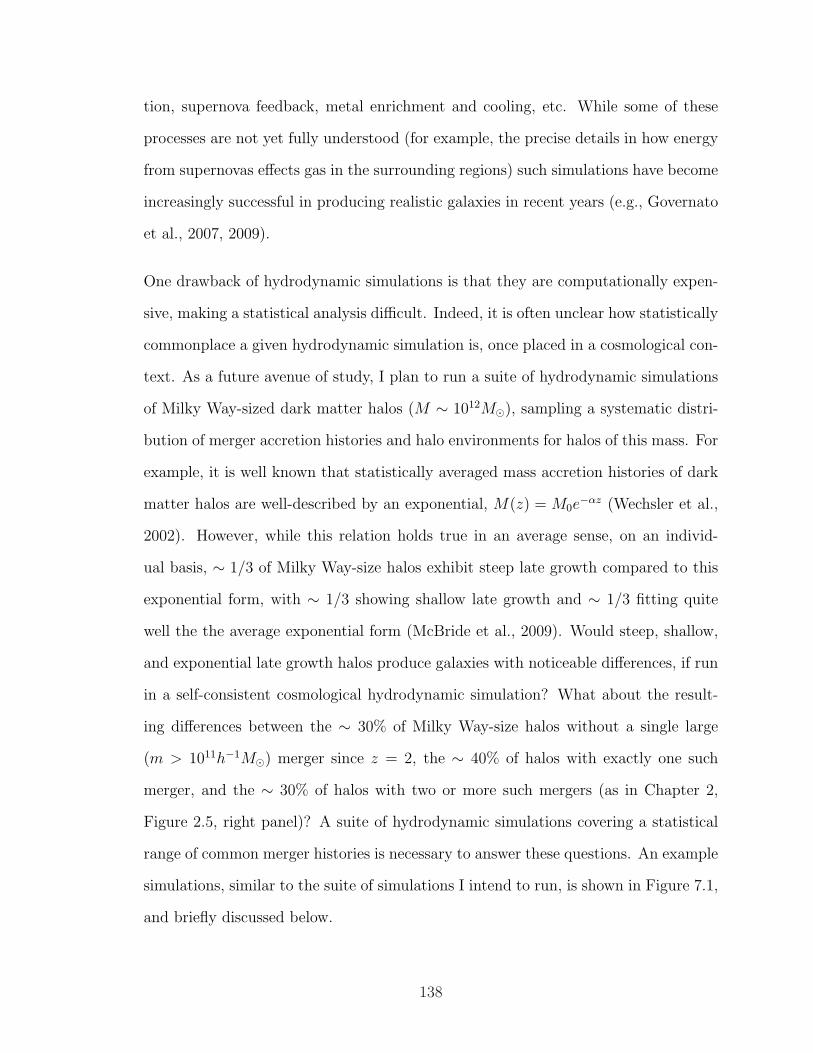
tion, supernova feedback, metal enrichment and cooling, etc. While some of these
processes are not yet fully understood (for example, the precise details in how energy
from supernovas effects gas in the surrounding regions) such simulations have become
increasingly successful in producing realistic galaxies in recent years (e.g., Governato
et al., 2007, 2009).
One drawback of hydrodynamic simulations is that they are computationally expen-
sive, making a statistical analysis difficult. Indeed, it is often unclear how statistically
commonplace a given hydrodynamic simulation is, once placed in a cosmological con-
text. As a future avenue of study, I plan to run a suite of hydrodynamic simulations
of Milky Way-sized dark matter halos (M ∼ 1012M¯), sampling a systematic distri-
bution of merger accretion histories and halo environments for halos of this mass. For
example, it is well known that statistically averaged mass accretion histories of dark
matter halos are well-described by an exponential, M(z) = M0e−αz (Wechsler et al.,
2002). However, while this relation holds true in an average sense, on an individ-
ual basis, ∼ 1/3 of Milky Way-size halos exhibit steep late growth compared to this
exponential form, with ∼ 1/3 showing shallow late growth and ∼ 1/3 fitting quite
well the the average exponential form (McBride et al., 2009). Would steep, shallow,
and exponential late growth halos produce galaxies with noticeable differences, if run
in a self-consistent cosmological hydrodynamic simulation? What about the result-
ing differences between the ∼ 30% of Milky Way-size halos without a single large
(m > 1011h−1M¯) merger since z = 2, the ∼ 40% of halos with exactly one such
merger, and the ∼ 30% of halos with two or more such mergers (as in Chapter 2,
Figure 2.5, right panel)? A suite of hydrodynamic simulations covering a statistical
range of common merger histories is necessary to answer these questions. An example
simulations, similar to the suite of simulations I intend to run, is shown in Figure 7.1,
and briefly discussed below.
138
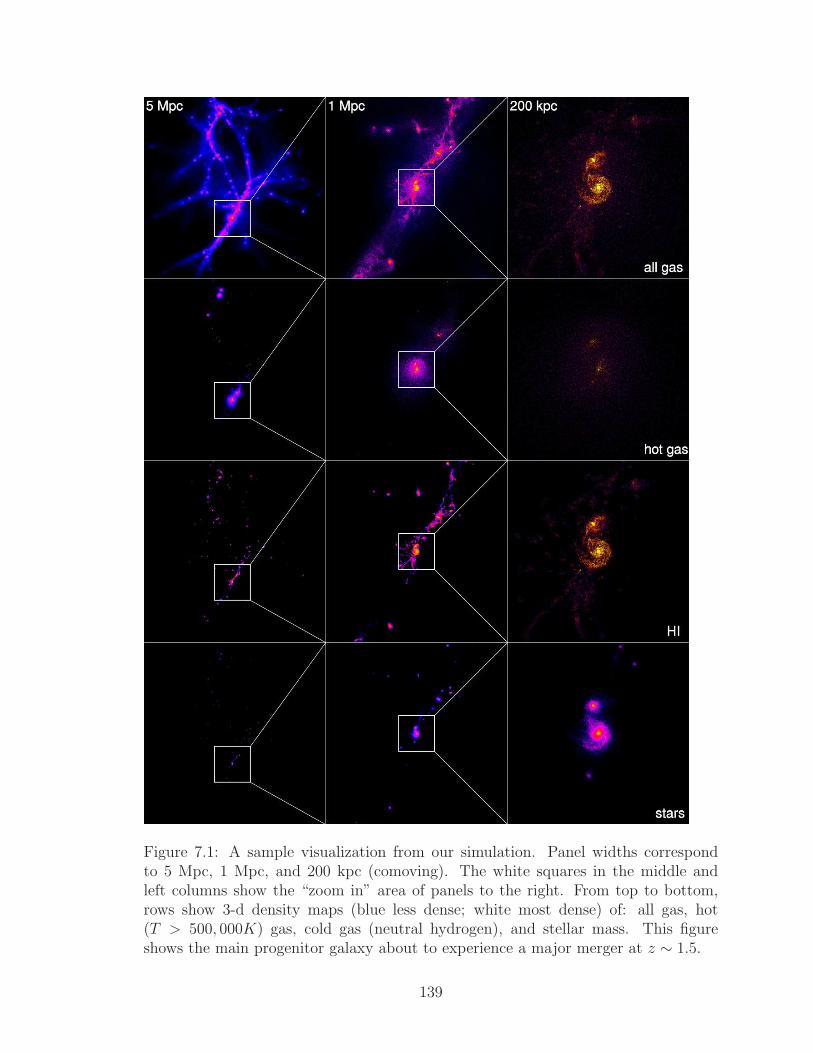
Figure 7.1: A sample visualization from our simulation. Panel widths correspondto 5 Mpc, 1 Mpc, and 200 kpc (comoving). The white squares in the middle andleft columns show the “zoom in” area of panels to the right. From top to bottom,rows show 3-d density maps (blue less dense; white most dense) of: all gas, hot(T > 500, 000K) gas, cold gas (neutral hydrogen), and stellar mass. This figureshows the main progenitor galaxy about to experience a major merger at z ∼ 1.5.
139
7.2 Example Simulation: “Via Lactea II” with SPH
code “GASOLINE”
Our “VL2gas” simulation, shown in Figure 7.1, implements the same initial condi-
tions as the Via Lactea II simulation from Diemand et al. (2008). The main galaxy
has a dark halo mass of Mvir(z = 0) ∼ 2 × 10¹²M¯. We implement the “zoom in”
technique to properly account for large-scale tidal torques as described in Katz &
White (1993). The simulation is contained within a 40 comoving kpc cube, with the
highest resolution region (which includes all the gas and star particles) limited to
a ∼ 4 comoving kpc cube volume. The simulation uses the smooth particle hydro-
dynamics (SPH) code GASOLINE (Wadsley et. al, 2004) to treat the behavior of
gas. In the highest resolution region, the masses per particle of our simulation are:
(mdark,mgas,mstar) = (3.7, 3.4, 1.0) × 105M¯, with a force softening of 332 pc, and
a minimum SPH smoothing length of 0.05 times the force softening. There are no
strong momentum-driven winds in our simulation, nor is there AGN feedback. The
code implements Compton and radiative cooling, as well as star formation and the
“blastwave feedback” prescriptions detailed in Katz et al. (1996) and Stinson et. al
(2006), while the the cosmic UV field implemented is described in Haardt & Madau
(1996). These prescriptions are identical to those implemented in recent simulations
(Governato et al., 2007, 2009) that have shown great success in producing realistic
disk-type galaxies. We refer the reader to these works for a more detailed description
of the workings of the code, though we will give a brief overview here.
Criteria for gas particles to form star particles (star formation) are: 1) the gas particle
temperature is < 30, 000K; 2) local gas density is > 0.1 cm−3; 3) other local gas
particles (in our case, the 32 nearest neighbors) define a converging flow. Stars form
according to the Schmidt Law (Kennicutt, 1998), with a Kroupa IMF Kroupa et al.
140
(1993). We assume that energy from supernova feedback creates turbulent motions in
nearby gas particles (again, the 32 nearest neighbors) that keeps these gas particles
from cooling and forming stars. Once a star particle is formed, it is treated as a single
population with uniform metallicity. We also keep track of mass loss from stellar
winds, with star particles losing ∼ 30 − 40% of their mass over time, depositing
this mass into nearby gas particles, and enriching the ISM with metals from both
supernovae types Ia and II (adopting yields from Thielemann et al. (1986) and Weaver
& Woosley (1993) respectively). As with feedback, these metals are distributed to the
32 nearest neighbors. We note that the only two free parameters in this star formation
and feedback model (star formation efficiency and the fraction of SN energy that is
coupled to the ISM) have both been fixed based on the results of Governato et al.
(2007), in order to produce galaxies with realistic star formation rates, disk thickness,
gas turbulence, and Schmidt law over a range in dynamic masses. In addition, this
pre-set scheme has also been shown to match observed trends between metallicity and
stellar mass (Brooks et al., 2007) and the abundance of Damped Lyman α systems
at z = 3 (Pontzen et al., 2008).
141
Chapter 8
Summary and Concluding Remarks
The aim of this thesis has been to bridge theoretical expectations of ΛCDM cosmology
and observations. In order to do this, we have used dark matter halo merger histories
from dissipationless cosmological N -body simulations to characterize globally aver-
aged merger statistics as a function of redshift, merger mass ratio and halo mass.
We have demonstrated a good agreement between theory and observations in regards
to more direct measurements of the galaxy merger rate, such as the morphologically
disturbed fraction of galaxies and close-pair counts of galaxies as a function of red-
shift, to within the margins of error of both theory and observations (as discussed
in Chapter 3). It is important to note in such comparisons that often observation
will define merger mass ratios in terms of galaxy baryonic mass (stars and cold gas)
or stellar mass, whereas observations typically use dark matter halo mass. Because
there is not a simple linear relation between these quantities, and the merger rate
of galaxies is strongly dependent on merger mass ratio, it is important to keep this
distinction in mind when comparing theory to observation (as discussed in detail in
Chapter 5).
142
We have also focused on the issue of disk survivability. With mergers being as com-
mon as they are in ΛCDM, how are disk-dominated galaxies formed at high redshift
expected to survive subsequent major mergers until z = 0, such that the majority
of Milky Way-sized galaxies are disks? We quantified the extent of this problem in
Chapter 2, showing that 70% of Milky Way-sized galaxies have experienced at least
one dark matter halo merger with more mass than the Milky Way’s own baryonic
disk (m > 1011h−1M¯) in the last 10 Gyr (z ∼ 2). And only a small fraction of the
final halo mass was built via subsequent minor mergers. As such, in order for theory
and observations to agree, mergers this massive must not always destroy disk mor-
phologies. One possible explanation for this seeming contradiction is the role of gas
in mergers. Recent simulations have stressed that gas-rich major mergers may in fact
result in disk galaxies, and are consistent with the kinematics of disk galaxies at z ∼ 2
(Brook et al., 2004; Robertson et al., 2006a; Robertson & Bullock, 2008). In order to
explore the extent to which this may resolve the issue of disk survival, we implemented
empirically motivated prescriptions for stellar mass and cold gas mass as a function
of halo mass and redshift. Given these prescriptions, we find astonishing agreement
between the observed bulge-dominated fraction as a function of halo mass, and the
theoretical fraction of halos with a gas-poor major merger since z = 2. Although this
by no means “solves” the problem of disk survival, it is strongly suggestive that if
gas-rich mergers do indeed preserve disk morphologies, then cosmologically expected
merger histories are consistent with observed morphological fractions.
Finally, we used the very high resolution dark matter simulation “Via Lactea II”
in combination with the empirically motivated stellar mass–halo mass relation to
explore cosmological expectations for the substructure of the Milky Way. Our model
shows good agreement with the observed luminosity function of galaxies, as well
as the “Strigari” plot (M300 vs. Luminosity for Milky Way dwarf galaxies), once
we account for luminosity and peak surface brightness selection biases. Our model
143
also suggests that the flat slope shown in the Strigari plot (Strigari et al., 2008)
may be the result of this selection bias, and we predict a population of very low
surface brightness “stealth” galaxies within the halo of the Milky Way, which have
luminosities comparable to observed ultrafaint dwarfs, but reside is less massive halos,
resulting in low surface brightnesses that cannot be detected with current methods.
Recent SPH simulations have become increasingly successful in producing realistic
disk-dominated galaxies that match a number of empirical relations (e.g., Governato
et al., 2007, 2009). However, since such simulations are typically computationally
expensive, they lack the statistical power of cosmological N -body simulations of dark
matter substructure, and it is often unclear what methods were used in choosing the
initial conditions for such simulations. As computational resources increase, it will
be important to begin choosing halos for hydrodynamic resimulation in a systematic
manner, probing statistically representative merger histories across a wide range of
parameters. Only then can we hope to address how the results of these simulations
may be generalized to more global populations of galaxies in ΛCDM.
144
Bibliography
Abadi, M. G., Navarro, J. F., Steinmetz, M., & Eke, V. R. 2003, ApJ, 591, 499
Adelberger, K. L., Erb, D. K., Steidel, C. C., Reddy, N. A., Pettini, M., & Shapley,A. E. 2005, ApJ, 620, L75
Aden, D., Wilkinson, M. I., Read, J. I., Feltzing, S., Koch, A., Gilmore, G. F., Grebel,E. K., & Lundstrom, I. 2009, ApJL, Accepted, ArXiv:0910.1348
Agertz, O., Teyssier, R., & Moore, B. 2009, MNRAS, 397, L64
Allgood, B., Flores, R. A., Primack, J. R., Kravtsov, A. V., Wechsler, R. H., Fal-tenbacher, A., & Bullock, J. S. 2006, MNRAS, 367, 1781
Baldry, I. K., Balogh, M. L., Bower, R. G., Glazebrook, K., Nichol, R. C., Bamford,S. P., & Budavari, T. 2006, MNRAS, 373, 469
Baldry, I. K., Glazebrook, K., Brinkmann, J., Ivezic, Z., Lupton, R. H., Nichol, R. C.,& Szalay, A. S. 2004, ApJ, 600, 681
Baldry, I. K., Glazebrook, K., & Driver, S. P. 2008, MNRAS, 388, 945
Barnes, J. E. 1988, ApJ, 331, 699
—. 2002, MNRAS, 333, 481
Barnes, J. E. & Hernquist, L. 1996, ApJ, 471, 115
Barton, E. J., Arnold, J. A., Zentner, A. R., Bullock, J. S., & Wechsler, R. H. 2007,ApJ, 671, 1538
Bell, E. F., McIntosh, D. H., Katz, N., & Weinberg, M. D. 2003, ApJ, 149, 289
Bell, E. F., Phleps, S., Somerville, R. S., Wolf, C., Borch, A., & Meisenheimer, K.2006, ApJ, 652, 270
Bell, E. F., Zucker, D. B., Belokurov, V., Sharma, S., Johnston, K. V., Bullock,J. S., Hogg, D. W., Jahnke, K., de Jong, J. T. A., Beers, T. C., Evans, N. W.,Grebel, E. K., Ivezic, Z., Koposov, S. E., Rix, H., Schneider, D. P., Steinmetz, M.,& Zolotov, A. 2008, ApJ, 680, 295
145
Bell et al. 2005, ApJ, 625, 23
Belokurov, V., Walker, M. G., Evans, N. W., Gilmore, G., Irwin, M. J., Mateo, M.,Mayer, L., Olszewski, E., Bechtold, J., & Pickering, T. 2009, MNRAS, 397, 1748
Belokurov, V., Zucker, D. B., Evans, N. W., Kleyna, J. T., Koposov, S., Hodgkin,S. T., Irwin, M. J., Gilmore, G., Wilkinson, M. I., Fellhauer, M., Bramich, D. M.,Hewett, P. C., Vidrih, S., De Jong, J. T. A., Smith, J. A., Rix, H.-W., Bell, E. F.,Wyse, R. F. G., Newberg, H. J., Mayeur, P. A., Yanny, B., Rockosi, C. M., Gnedin,O. Y., Schneider, D. P., Beers, T. C., Barentine, J. C., Brewington, H., Brinkmann,J., Harvanek, M., Kleinman, S. J., Krzesinski, J., Long, D., Nitta, A., & Snedden,S. A. 2007, ApJ, 654, 897
Benson, A. J., Bower, R. G., Frenk, C. S., Lacey, C. G., Baugh, C. M., & Cole, S.2003, ApJ, 599, 38
Berrier, J. C., Bullock, J. S., Barton, E. J., Guenther, H. D., Zentner, A. R., &Wechsler, R. H. 2006, ApJ, 652, 56
Besla, G., Kallivayalil, N., Hernquist, L., Robertson, B., Cox, T. J., van der Marel,R. P., & Alcock, C. 2007, ApJ, 668, 949
Birnboim, Y. & Dekel, A. 2003, MNRAS, 345, 349
Blanton et al. 2003, ApJ, 594, 186
Blumenthal, G. R., Faber, S. M., Primack, J. R., & Rees, M. J. 1984, Nature, 311,517
Bournaud, F., Jog, C. J., & Combes, F. 2007, A&A, 476, 1179
Bouwens, R. J., Illingworth, G. D., Franx, M., & Ford, H. 2007, ApJ, 670, 928
Boylan-Kolchin, M., Ma, C.-P., & Quataert, E. 2005, MNRAS, 362, 184
—. 2008, MNRAS, 383, 93
Brook, C., Richard, S., Kawata, D., Martel, H., & Gibson, B. K. 2007a, ApJ, 658, 60
Brook, C. B., Kawata, D., Gibson, B. K., & Freeman, K. C. 2004, ApJ, 612, 894
Brook, C. B., Veilleux, V., Kawata, D., Martel, H., & Gibson, B. K. Gas Rich Mergersin Disk Formation (Island Universes - Structure and Evolution of Disk Galaxies),551–+
Brooks, A. M., Governato, F., Booth, C. M., Willman, B., Gardner, J. P., Wadsley,J., Stinson, G., & Quinn, T. 2007, ApJ, 655, L17
Brooks, A. M., Governato, F., Quinn, T., Brook, C. B., & Wadsley, J. 2009, ApJ,694, 396
146
Bryan, G. L. & Norman, M. L. 1998, ApJ, 495, 80
Bullock, J. S. & Johnston, K. V. 2005, ApJ, 635, 931
Bullock, J. S., Kolatt, T. S., Sigad, Y., Somerville, R. S., Kravtsov, A. V., Klypin,A. A., Primack, J. R., & Dekel, A. 2001a, MNRAS, 321, 559
Bullock, J. S., Kravtsov, A. V., & Weinberg, D. H. 2000, ApJ, 539, 517
—. 2001b, ApJ, 548, 33
Bullock, J. S., Stewart, K. R., Kaplinghat, M., & Tollerud, E. J. 2009a
Bullock, J. S., Stewart, K. R., & Purcell, C. W. 2009b, in IAU Symposium, Vol. 254,IAU Symposium, ed. J. Andersen, J. Bland-Hawthorn, & B. Nordstrom, 85–94
Bundy, K., Fukugita, M., Ellis, R. S., Targett, T. A., Belli, S., & Kodama, T. 2009,ApJ, 697, 1369
Burkert, A., Naab, T., Johansson, P. H., & Jesseit, R. 2008, ApJ, 685, 897
Busha, M. T., Alvarez, M. A., Wechsler, R. H., Abel, T., & Strigari, L. E. 2009, ApJ,Submitted, ArXiv:0901.3553
Carlberg et al. 2000, ApJ, 532, L1
Carollo, C. M., Scarlata, C., Stiavelli, M., Wyse, R. F. G., & Mayer, L. 2007, ApJ,658, 960
Cattaneo, A., Dekel, A., Devriendt, J., Guiderdoni, B., & Blaizot, J. 2006, MNRAS,370, 1651
Choi, Y.-Y., Park, C., & Vogeley, M. S. 2007, ApJ, 658, 884
Cohn, J. D. & White, M. 2008, MNRAS, 385, 2025
Cole, S., Helly, J., Frenk, C. S., & Parkinson, H. 2008a, MNRAS, 383, 546
—. 2008b, MNRAS, 383, 546
Conroy, C., Shapley, A. E., Tinker, J. L., Santos, M. R., & Lemson, G. 2008, ApJ,679, 1192
Conroy, C. & Wechsler, R. H. 2009a, ApJ, 696, 620
—. 2009b, ApJ, 696, 620
Conroy, C., Wechsler, R. H., & Kravtsov, A. V. 2006, ApJ, 647, 201
—. 2007, ApJ, 668, 826
Conselice, C. J., Bershady, M. A., Dickinson, M., & Papovich, C. 2003, AJ, 126, 1183
147
Courteau, S., de Jong, R. S., & Broeils, A. H. 1996, ApJ, 457, L73+
Cowie, L. L. & Barger, A. J. 2008, ApJ, 686, 72
Cox, T. J., Dutta, S. N., Di Matteo, T., Hernquist, L., Hopkins, P. F., Robertson,B., & Springel, V. 2006a, ApJ, 650, 791
Cox, T. J., Jonsson, P., Primack, J. R., & Somerville, R. S. 2006b, MNRAS, 373,1013
Cox, T. J., Jonsson, P., Somerville, R. S., Primack, J. R., & Dekel, A. 2008, MNRAS,384, 386
Cuesta, A. J., Prada, F., Klypin, A., & Moles, M. 2008, MNRAS, 389, 385
Dalcanton, J. J. & Bernstein, R. A. 2002, AJ, 124, 1328
Dalcanton, J. J., Seth, A., & Yoachim, P. 2005, arXiv:astro-ph/0509700
Davis, M., Efstathiou, G., Frenk, C. S., & White, S. D. M. 1985, ApJ, 292, 371
de Ravel et al. 2009, A&A, 498, 379
Dekel, A. & Birnboim, Y. 2006, MNRAS, 368, 2
Dekel, A., Birnboim, Y., Engel, G., Freundlich, J., Goerdt, T., Mumcuoglu, M.,Neistein, E., Pichon, C., Teyssier, R., & Zinger, E. 2009, Nature, 457, 451
Di Matteo, T., Springel, V., & Hernquist, L. 2005, Nature, 433, 604
Diaferio, A., Kauffmann, G., Balogh, M. L., White, S. D. M., Schade, D., & Ellingson,E. 2001, MNRAS, 323, 999
Diemand, J., Kuhlen, M., & Madau, P. 2007, ApJ, 667, 859
Diemand, J., Kuhlen, M., Madau, P., Zemp, M., Moore, B., Potter, D., & Stadel, J.2008, Nature, 454, 735
Erb, D. K., Steidel, C. C., Shapley, A. E., Pettini, M., Reddy, N. A., & Adelberger,K. L. 2006, ApJ, 646, 107
Faber et al. 2007, ApJ, 665, 265
Fakhouri, O. & Ma, C. 2009, MNRAS, 394, 1825
Fakhouri, O. & Ma, C.-P. 2008, MNRAS, 386, 577
Feldmann, R., Mayer, L., & Carollo, C. M. 2008, ApJ, 684, 1062
Forster Schreiber et al. 2006, The Messenger, 125, 11
Geha, M., Blanton, M. R., Masjedi, M., & West, A. A. 2006, ApJ, 653, 240
148
Geha, M., Willman, B., Simon, J. D., Strigari, L. E., Kirby, E. N., Law, D. R., &Strader, J. 2009, ApJ, 692, 1464
Genel, S., Genzel, R., Bouche, N., Naab, T., & Sternberg, A. 2009, ApJ, 701, 2002
Genzel et al. 2006, Nature, 442, 786
Gnedin, N. Y., Tassis, K., & Kravtsov, A. V. 2009, ApJ, 697, 55
Gottlober, S., Klypin, A., & Kravtsov, A. V. 2001, ApJ, 546, 223
Governato, F., Brook, C. B., Brooks, A. M., Mayer, L., Willman, B., Jonsson, P.,Stilp, A. M., Pope, L., Christensen, C., Wadsley, J., & Quinn, T. 2009, MNRAS,398, 312
Governato, F., Gardner, J. P., Stadel, J., Quinn, T., & Lake, G. 1999, AJ, 117, 1651
Governato, F., Willman, B., Mayer, L., Brooks, A., Stinson, G., Valenzuela, O.,Wadsley, J., & Quinn, T. 2007, MNRAS, 374, 1479
Grcevich, J., Putman, M., & Peek, J. E. G. 2008, in American Institute of PhysicsConference Series, Vol. 1035, The Evolution of Galaxies Through the Neutral Hy-drogen Window, ed. R. Minchin & E. Momjian, 159–162
Grillmair, C. J. 2006, ApJ, 645, L37
—. 2009, ApJ, 693, 1118
Haardt, F. & Madau, P. 1996, ApJ, 461, 20
Hammer, F., Flores, H., Puech, M., Athanassoula, E., Rodrigues, M., Yang, Y., &Delgado-Serrano, R. 2009a, submitted to A&A, ArXiv:0903.3962 [astro-ph],
Hammer, F., Flores, H., Yang, Y. B., Athanassoula, E., Puech, M., Rodrigues, M., &Peirani, S. 2009b, A&A, 496, 381
Hayashi, H. & Chiba, M. 2006, PASJ, 58, 835
Heckman, T. M., Smith, E. P., Baum, S. A., van Breugel, W. J. M., Miley, G. K.,Illingworth, G. D., Bothun, G. D., & Balick, B. 1986, ApJ, 311, 526
Helmi, A. & White, S. D. M. 1999, MNRAS, 307, 495
Hernquist, L. 1993, ApJ, 409, 548
Hopkins, P. F., Cox, T. J., Younger, J. D., & Hernquist, L. 2009a, ApJ, 691, 1168
Hopkins, P. F., Hernquist, L., Cox, T. J., Younger, J. D., & Besla, G. 2008, ApJ,688, 757
Hopkins, P. F., Somerville, R. S., Cox, T. J., Hernquist, L., Jogee, S., Keres, D., Ma,C., Robertson, B., & Stewart, K. 2009b, MNRAS, 397, 802
149
Ilbert et al. 2006, A&A, 453, 809
Ivezic et. al. 2008, ArXiv:0805.2366
Jesseit, R., Naab, T., Peletier, R. F., & Burkert, A. 2007, MNRAS, 376, 997
Jogee et. al. 2008, in Astronomical Society of the Pacific Conference Series, Vol.396, Astronomical Society of the Pacific Conference Series, ed. J. G. Funes &E. M. Corsini, 337–+
Johnston, K. V., Hernquist, L., & Bolte, M. 1996, ApJ, 465, 278
Jonsson, P., Cox, T. J., Primack, J. R., & Somerville, R. S. 2006, ApJ, 637, 255
Juric et. al. 2008, ApJ, 673, 864
Kampczyk, P., Lilly, S. J., Carollo, C. M., Scarlata, C., Feldmann, R., Koekemoer,A., Leauthaud, A., Sargent, M. T., Taniguchi, Y., & Capak, P. 2007, ApJ, 172, 329
Kannappan, S. J. 2004, ApJ, 611, L89
Kartaltepe, J. S., Sanders, D. B., Scoville, N. Z., Calzetti, D., Capak, P., Koekemoer,A., Mobasher, B., Murayama, T., Salvato, M., Sasaki, S. S., & Taniguchi, Y. 2007,ApJ, 172, 320
Katz, N., Weinberg, D. H., & Hernquist, L. 1996, ApJ, 105, 19
Katz, N. & White, S. D. M. 1993, ApJ, 412, 455
Kauffmann, G., Heckman, T. M., White, S. D. M., Charlot, S., Tremonti, C., Peng,E. W., Seibert, M., Brinkmann, J., Nichol, R. C., SubbaRao, M., & York, D. 2003,MNRAS, 341, 54
Kaufmann, T., Mayer, L., Wadsley, J., Stadel, J., & Moore, B. 2007a, MNRAS, 53
Kaufmann, T., Wheeler, C., & Bullock, J. S. 2007b, MNRAS, 382, 1187
Kautsch, S. J., Grebel, E. K., Barazza, F. D., & Gallagher, III, J. S. 2006, A&A, 445,765
Kazantzidis, S., Bullock, J. S., Zentner, A. R., Kravtsov, A. V., & Moustakas, L. A.2008, ApJ, 688, 254
Kazantzidis, S., Mayer, L., Mastropietro, C., Diemand, J., Stadel, J., & Moore, B.2004, ApJ, 608, 663
Kazantzidis, S., Zentner, A. R., & Bullock, J. S. 2009, in IAU Symposium, Vol. 254,IAU Symposium, ed. J. Andersen, J. Bland-Hawthorn, & B. Nordstrom, 417–422
Kennicutt, Jr., R. C. 1998, ApJ, 498, 541
150
Keres, D., Katz, N., Fardal, M., Dave, R., & Weinberg, D. H. 2009, MNRAS, 395,160
Keres, D., Katz, N., Weinberg, D. H., & Dave, R. 2005, MNRAS, 363, 2
Khochfar, S. & Burkert, A. 2005, MNRAS, 359, 1379
Kirby, E. N., Simon, J. D., Geha, M., Guhathakurta, P., & Frebel, A. 2008, ApJ,685, L43
Kitzbichler, M. G. & White, S. D. M. 2008, MNRAS, 391, 1489
Klypin, A. & Holtzman, J. 1997, ArXiv:astro-ph/9712217
Klypin, A., Kravtsov, A. V., Valenzuela, O., & Prada, F. 1999a, ApJ, 522, 82
—. 1999b, ApJ, 522, 82
Klypin, A., Zhao, H., & Somerville, R. S. 2002, ApJ, 573, 597
Koda, J., Milosavljevic, M., & Shapiro, P. R. 2009, ApJ, 696, 254
Kolatt, T. S., Bullock, J. S., Somerville, R. S., Sigad, Y., Jonsson, P., Kravtsov,A. V., Klypin, A. A., Primack, J. R., Faber, S. M., & Dekel, A. 1999, ApJ, 523,L109
Kollmeier, J. A., Gould, A., Shectman, S., Thompson, I. B., Preston, G. W., Simon,J. D., Crane, J. D., Ivezic, Z., & Sesar, B. 2009, ApJ, 705, L158
Komiya, Y., Suda, T., Habe, A., & Fujimoto, M. Y. 2008, in American Institute ofPhysics Conference Series, Vol. 990, First Stars III, ed. B. W. O’Shea & A. Heger,462–466
Koposov, S., Belokurov, V., Evans, N. W., Hewett, P. C., Irwin, M. J., Gilmore, G.,Zucker, D. B., Rix, H.-W., Fellhauer, M., Bell, E. F., & Glushkova, E. V. 2008,ApJ, 686, 279
Kormendy, J. & Fisher, D. B. 2005, in Revista Mexicana de Astronomia y AstrofisicaConference Series, Vol. 23, Revista Mexicana de Astronomia y Astrofisica Confer-ence Series, ed. S. Torres-Peimbert & G. MacAlpine, 101–108
Kormendy, J. & Fisher, D. B. 2008, in Astronomical Society of the Pacific ConferenceSeries, Vol. 396, Astronomical Society of the Pacific Conference Series, ed. J. G.Funes & E. M. Corsini, 297–+
Kormendy, J. & Kennicutt, Jr., R. C. 2004, ARAA&A, 42, 603
Kravtsov, A. V. 2009, ArXiv:0906.3295
Kravtsov, A. V., Berlind, A. A., Wechsler, R. H., Klypin, A. A., Gottlober, S.,Allgood, B., & Primack, J. R. 2004, ApJ, 609, 35
151
Kravtsov, A. V., Klypin, A. A., & Khokhlov, A. M. 1997, ApJ, 111, 73
Kriek et al. 2008, ApJ, 677, 219
Kroupa, P., Tout, C. A., & Gilmore, G. 1993, MNRAS, 262, 545
Lacey, C. & Cole, S. 1993, MNRAS, 262, 627
Law, D. R., Steidel, C. C., Erb, D. K., Larkin, J. E., Pettini, M., Shapley, A. E., &Wright, S. A. 2007a, ApJ, 669, 929
Law, D. R., Steidel, C. C., Erb, D. K., Pettini, M., Reddy, N. A., Shapley, A. E.,Adelberger, K. L., & Simenc, D. J. 2007b, ApJ, 656, 1
Li, Y., Helmi, A., De Lucia, G., & Stoehr, F. 2009, MNRAS, 397, L87
Li, Y., Mo, H. J., van den Bosch, F. C., & Lin, W. P. 2007, MNRAS, 379, 689
Lin, L., Koo, D. C., Willmer, C. N. A., Patton, D. R., Conselice, C. J., Yan, R., Coil,A. L., Cooper, M. C., Davis, M., Faber, S. M., Gerke, B. F., Guhathakurta, P., &Newman, J. A. 2004, ApJ, 617, L9
Lin, L., Patton, D. R., Koo, D. C., Casteels, K., Conselice, C. J., Faber, S. M., Lotz,J., Willmer, C. N. A., Hsieh, B. C., Chiueh, T., Newman, J. A., Novak, G. S.,Weiner, B. J., & Cooper, M. C. 2008, ApJ, 681, 232
Lotz, J. M., Davis, M., Faber, S. M., Guhathakurta, P., Gwyn, S., Huang, J., Koo,D. C., Le Floc’h, E., Lin, L., Newman, J., Noeske, K., Papovich, C., Willmer,C. N. A., Coil, A., Conselice, C. J., Cooper, M., Hopkins, A. M., Metevier, A.,Primack, J., Rieke, G., & Weiner, B. J. 2008a, ApJ, 672, 177
Lotz, J. M., Jonsson, P., Cox, T. J., & Primack, J. R. 2008b, MNRAS, 391, 1137
Lucatello, S., Gratton, R. G., Beers, T. C., & Carretta, E. 2005, ApJ, 625, 833
Maccio’, A. V. & Fontanot, F. 2009, ArXiv:0910.2460
Maccio, A. V., Kang, X., & Moore, B. 2009, ApJ, 692, L109
Majewski, S. R., Beaton, R. L., Patterson, R. J., Kalirai, J. S., Geha, M. C., Munoz,R. R., Seigar, M. S., Guhathakurta, P., Gilbert, K. M., Rich, R. M., Bullock, J. S.,& Reitzel, D. B. 2007, ApJ, 670, L9
Maller, A. H. 2008, in Astronomical Society of the Pacific Conference Series, Vol.396, Astronomical Society of the Pacific Conference Series, ed. J. G. Funes & E. M.Corsini, 251–+
Maller, A. H., Katz, N., Keres, D., Dave, R., & Weinberg, D. H. 2006, ApJ, 647, 763
Marchesini, D., van Dokkum, P., Quadri, R., Rudnick, G., Franx, M., Lira, P., Wuyts,S., Gawiser, E., Christlein, D., & Toft, S. 2007, ApJ, 656, 42
152
Marchesini, D., van Dokkum, P. G., Forster Schreiber, N. M., Franx, M., Labbe, I.,& Wuyts, S. 2009, ApJ, 701, 1765
Marın, F. A., Wechsler, R. H., Frieman, J. A., & Nichol, R. C. 2008, ApJ, 672, 849
Martin, N. F., de Jong, J. T. A., & Rix, H.-W. 2008, ApJ, 684, 1075
Martin, N. F., Ibata, R. A., Chapman, S. C., Irwin, M., & Lewis, G. F. 2007, MNRAS,380, 281
Martin, N. F., Mc Connachie, A. W., Irwin, M., Widrow, L. M., Ferguson, A. M. N.,Ibata, R. A., Dubinski, J., Babul, A., Chapman, S., Fardal, M., Lewis, G. F.,Navarro, J., & Rich, R. M. 2009, ApJ, 705, 758
McBride, J., Fakhouri, O., & Ma, C. 2009, MNRAS, 398, 1858
McGaugh, S. S. 2005, ApJ, 632, 859
McIntosh, D. H., Guo, Y., Hertzberg, J., Katz, N., Mo, H. J., van den Bosch, F. C.,& Yang, X. 2008, MNRAS, 388, 1537
Melbourne, J., Ammons, M., Wright, S. A., Metevier, A., Steinbring, E., Max, C.,Koo, D. C., Larkin, J. E., & Barczys, M. 2008, AJ, 135, 1207
Melbourne et al. 2005, ApJ, 625, L27
Mihos, J. C. & Hernquist, L. 1996, ApJ, 464, 641
Monaco, P., Theuns, T., & Taffoni, G. 2002, MNRAS, 331, 587
Moore, B., Ghigna, S., Governato, F., Lake, G., Quinn, T., Stadel, J., & Tozzi, P.1999, ApJ, 524, L19
Moster, B. P., Somerville, R. S., Maulbetsch, C., van den Bosch, F. C., Maccio’,A. V., Naab, T., & Oser, L. 2009, ApJ, Submitted, ArXiv:0903.4682
Munoz, J. A., Madau, P., Loeb, A., & Diemand, J. 2009, MNRAS, Accepted,ArXiv:0905.4744
Naab, T. & Burkert, A. 2003, ApJ, 597, 893
Naab, T., Khochfar, S., & Burkert, A. 2006, ApJ, 636, L81
Navarro, J. F., Frenk, C. S., & White, S. D. M. 1997, ApJ, 490, 493
Navarro, J. F. & Steinmetz, M. 2000, ApJ, 538, 477
Neistein, E. & Dekel, A. 2008, MNRAS, 388, 1792
Newberg, H. J., Mayeur, P. A., Yanny, B., & the SEGUE collaboration. 2006, Mem-orie della Societa Astronomica Italiana, 77, 1049
153
Noeske et al. 2007, ApJ, 660, L47
Nordstrom, B., Mayor, M., Andersen, J., Holmberg, J., Pont, F., Jørgensen, B. R.,Olsen, E. H., Udry, S., & Mowlavi, N. 2004, A&A, 418, 989
Okamoto, T. & Frenk, C. S. 2009, MNRAS, L315+
Okamoto, T. & Nagashima, M. 2001, ApJ, 547, 109
Park, C., Choi, Y.-Y., Vogeley, M. S., Gott, J. R. I., & Blanton, M. R. 2007, ApJ,658, 898
Patton, D. R. & Atfield, J. E. 2008, ApJ, 685, 235
Patton et al. 2002, ApJ, 565, 208
Penarrubia, J., McConnachie, A. W., & Navarro, J. F. 2008, ApJ, 672, 904
Peebles, P. J. E. 1982, ApJ, 263, L1
Pontzen, A., Governato, F., Pettini, M., Booth, C. M., Stinson, G., Wadsley, J.,Brooks, A., Quinn, T., & Haehnelt, M. 2008, MNRAS, 390, 1349
Pryor, C. & Meylan, G. 1993, in Astronomical Society of the Pacific ConferenceSeries, Vol. 50, Structure and Dynamics of Globular Clusters, ed. S. G. Djorgovski& G. Meylan, 357–+
Purcell, C. W., Bullock, J. S., & Zentner, A. R. 2007, ApJ, 666, 20
—. 2008, MNRAS, 391, 550
Purcell, C. W., Kazantzidis, S., & Bullock, J. S. 2009, ApJ, 694, L98
Quadri et al. 2007, AJ, 134, 1103
Quinn, P. J., Hernquist, L., & Fullagar, D. P. 1993, ApJ, 403, 74
Robertson, B., Bullock, J. S., Cox, T. J., Di Matteo, T., Hernquist, L., Springel, V.,& Yoshida, N. 2006a, ApJ, 645, 986
Robertson, B., Bullock, J. S., Font, A. S., Johnston, K. V., & Hernquist, L. 2005,ApJ, 632, 872
Robertson, B., Cox, T. J., Hernquist, L., Franx, M., Hopkins, P. F., Martini, P., &Springel, V. 2006b, ApJ, 641, 21
Robertson, B., Hernquist, L., Cox, T. J., Di Matteo, T., Hopkins, P. F., Martini, P.,& Springel, V. 2006c, ApJ, 641, 90
Robertson, B., Yoshida, N., Springel, V., & Hernquist, L. 2004, ApJ, 606, 32
Robertson, B. E. & Bullock, J. S. 2008, ApJ, 685, L27
154
Robertson, B. E. & Kravtsov, A. V. 2008, ApJ, 680, 1083
Rocha, M., Jonsson, P., Primack, J. R., & Cox, T. J. 2008, MNRAS, 383, 1281
Ryan, Jr., R. E., Cohen, S. H., Windhorst, R. A., & Silk, J. 2008, ApJ, 678, 751
Sawicki, M. & Thompson, D. 2006, ApJ, 642, 653
Sesar et. al. 2007, AJ, 134, 2236
Shapiro et al. 2008, ApJ, 682, 231
Shapley, A. E., Steidel, C. C., Adelberger, K. L., Dickinson, M., Giavalisco, M., &Pettini, M. 2001, ApJ, 562, 95
Siegel, M. H., Majewski, S. R., Reid, I. N., & Thompson, I. B. 2002, ApJ, 578, 151
Simon, J. D. & Geha, M. 2007, ApJ, 670, 313
Somerville, R. S., Hopkins, P. F., Cox, T. J., Robertson, B. E., & Hernquist, L. 2008,MNRAS, 391, 481
Somerville, R. S. & Kolatt, T. S. 1999, MNRAS, 305, 1
Sommer-Larsen, J., Gotz, M., & Portinari, L. 2003, ApJ, 596, 47
Spergel, D. N., Bean, R., Dore, O., Nolta, M. R., Bennett, C. L., Dunkley, J., Hin-shaw, G., Jarosik, N., Komatsu, E., Page, L., Peiris, H. V., Verde, L., Halpern,M., Hill, R. S., Kogut, A., Limon, M., Meyer, S. S., Odegard, N., Tucker, G. S.,Weiland, J. L., Wollack, E., & Wright, E. L. 2007, ApJ, 170, 377
Springel, V., Di Matteo, T., & Hernquist, L. 2005a, MNRAS, 361, 776
Springel, V. & Hernquist, L. 2003, MNRAS, 339, 289
—. 2005, ApJ, 622, L9
Springel, V., Wang, J., Vogelsberger, M., Ludlow, A., Jenkins, A., Helmi, A., Navarro,J. F., Frenk, C. S., & White, S. D. M. 2008, MNRAS, 391, 1685
Springel, V., White, S. D. M., Jenkins, A., Frenk, C. S., Yoshida, N., Gao, L.,Navarro, J., Thacker, R., Croton, D., Helly, J., Peacock, J. A., Cole, S., Thomas,P., Couchman, H., Evrard, A., Colberg, J., & Pearce, F. 2005b, Nature, 435, 629
Stewart, K. R. 2009, to appear in proceedings of to appear in proceedings of “GalaxyEvolution: Emerging Insights and Future Challenges”, ArXiv:0902.2214 [astro-ph]
Stewart, K. R., Bullock, J. S., Barton, E. J., & Wechsler, R. H. 2009a, ApJ, 702, 1005
Stewart, K. R., Bullock, J. S., Wechsler, R. H., & Maller, A. H. 2009b, ApJ, 702, 307
155
Stewart, K. R., Bullock, J. S., Wechsler, R. H., Maller, A. H., & Zentner, A. R. 2008,ApJ, 683, 597
Stinson et. al. 2006, MNRAS, 373, 1074
Stoehr, F., White, S. D. M., Tormen, G., & Springel, V. 2002, MNRAS, 335, L84
Strigari, L. E., Bullock, J. S., Kaplinghat, M., Diemand, J., Kuhlen, M., & Madau,P. 2007, ApJ, 669, 676
Strigari, L. E., Bullock, J. S., Kaplinghat, M., Simon, J. D., Geha, M., Willman, B.,& Walker, M. G. 2008, Nature, 454, 1096
Tasitsiomi, A., Kravtsov, A. V., Wechsler, R. H., & Primack, J. R. 2004, ApJ, 614,533
Thielemann, F., Nomoto, K., & Yokoi, K. 1986, A&A, 158, 17
Tollerud, E. J., Bullock, J. S., Strigari, L. E., & Willman, B. 2008, ApJ, 688, 277
Toomre, A. & Toomre, J. 1972, ApJ, 178, 623
Toth, G. & Ostriker, J. P. 1992, ApJ, 389, 5
Tumlinson, J. 2007, ApJ, 665, 1361
Vale, A. & Ostriker, J. P. 2004, MNRAS, 353, 189
van den Bosch, F. C., Yang, X., Mo, H. J., Weinmann, S. M., Maccio, A. V., More,S., Cacciato, M., Skibba, R., & Kang, X. 2007, MNRAS, 376, 841
van der Marel, R. P., Alves, D. R., Hardy, E., & Suntzeff, N. B. 2002, AJ, 124, 2639
van Dokkum, P. G. 2008, ApJ, 674, 29
Villalobos, A. & Helmi, A. 2008, MNRAS, 391, 1806
Wadsley et. al. 2004, New Astronomy, 9, 137
Walker, I. R., Mihos, J. C., & Hernquist, L. 1996, ApJ, 460, 121
Walker, M. G., Mateo, M., Olszewski, E. W., Penarrubia, J., Wyn Evans, N., &Gilmore, G. 2009, ApJ, 704, 1274
Walsh, S. M., Willman, B., & Jerjen, H. 2009, AJ, 137, 450
Watkins, L. L., Evans, N. W., Belokurov, V., Smith, M. C., Hewett, P. C., Bramich,D. M., Gilmore, G. F., Irwin, M. J., Vidrih, S., Wyrzykowski, ÃL., & Zucker, D. B.2009, MNRAS, 398, 1757
Weaver, T. A. & Woosley, S. E. 1993, PhR, 227, 65
156
Wechsler, R. H., Bullock, J. S., Primack, J. R., Kravtsov, A. V., & Dekel, A. 2002,ApJ, 568, 52
Wechsler, R. H., Zentner, A. R., Bullock, J. S., Kravtsov, A. V., & Allgood, B. 2006,ApJ, 652, 71
Wei, L. H., Kannappan, S. J., Vogel, S. N., & Baker, A. J. 2009, ArXiv:0908.2868[astro-ph]
Weinmann, S. M., Kauffmann, G., van den Bosch, F. C., Pasquali, A., McIntosh,D. H., Mo, H., Yang, X., & Guo, Y. 2009, MNRAS, 394, 1213
Weinmann, S. M., van den Bosch, F. C., Yang, X., & Mo, H. J. 2006, MNRAS, 366,2
Wetzel, A. R., Cohn, J. D., & White, M. 2009, MNRAS, 395, 1376
Widrow, L. M. & Dubinski, J. 2005, ApJ, 631, 838
Willman, B., Dalcanton, J. J., Martinez-Delgado, D., West, A. A., Blanton, M. R.,Hogg, D. W., Barentine, J. C., Brewington, H. J., Harvanek, M., Kleinman, S. J.,Krzesinski, J., Long, D., Neilsen, Jr., E. H., Nitta, A., & Snedden, S. A. 2005, ApJ,626, L85
Wolf, J., Martinez, G. D., Bullock, J. S., Kaplinghat, M., Geha, M., Munoz, R. R.,Simon, J. D., & Avedo, F. F. 2009, MRNAS, submitted, ArXiv:0908.2995
Wolf et al. 2005, ApJ, 630, 771
Wong, T. & Blitz, L. 2002, ApJ, 569, 157
Woods, D. F., Geller, M. J., & Barton, E. J. 2006, AJ, 132, 197
Wright, S. A., Larkin, J. E., Law, D. R., Steidel, C. C., Shapley, A. E., & Erb, D. K.2009, ApJ, 699, 421
Wyse, R. F. G. 2001, in Astronomical Society of the Pacific Conference Series, Vol.230, Galaxy Disks and Disk Galaxies, ed. J. G. Funes & E. M. Corsini, 71–80
Wyse, R. F. G. 2006, in The Local Group as an Astrophysical Laboratory, ed. M. Livio& T. M. Brown, 33–46
Yepes, G., Kates, R., Khokhlov, A., & Klypin, A. 1997, MNRAS, 284, 235
Younger, J. D., Cox, T. J., Seth, A. C., & Hernquist, L. 2007, ApJ, 670, 269
Zentner, A. R. 2007, International Journal of Modern Physics D, 16, 763
Zentner, A. R., Berlind, A. A., Bullock, J. S., Kravtsov, A. V., & Wechsler, R. H.2005, ApJ, 624, 505
157
Zentner, A. R. & Bullock, J. S. 2003, ApJ, 598, 49
Zhao, D. H., Mo, H. J., Jing, Y. P., & Borner, G. 2003, MNRAS, 339, 12
Zucker et. al. 2006, ApJ, 643, L103
Zurek, W. H., Quinn, P. J., & Salmon, J. K. 1988, ApJ, 330, 519
158