Aerosol-Precipitation Responses Deduced from Ship Tracks as Observed by CloudSat
Aqueous Photochemistry of Secondary Organic Aerosol of α‑Pineneand α‑Humulene Oxidized with Ozone, Hydroxyl Radical, and NitrateRadicalDian E. Romonosky,† Ying Li,‡ Manabu Shiraiwa,† Alexander Laskin,§ Julia Laskin,∥
and Sergey A. Nizkorodov*,†
†Department of Chemistry, University of California, Irvine, California 92697, United States‡National Institute for Environmental Studies, Tsukuba, Ibaraki 305-8506, Japan§Environmental Molecular Sciences Laboratory and ∥Physical Sciences Division, Pacific Northwest National Laboratory, Richland,Washington 99352, United States
*S Supporting Information
ABSTRACT: Formation of secondary organic aerosols(SOA) from biogenic volatile organic compounds (BVOC)occurs via O3- and OH-initiated reactions during the day andreactions with NO3 during the night. We explored the effect ofthese three oxidation conditions on the molecular compositionand aqueous photochemistry of model SOA prepared fromtwo common BVOC. A common monoterpene, α-pinene, andsesquiterpene, α-humulene, were used to form SOA in a smogchamber via BVOC + O3, BVOC + NO3, and BVOC + OH +NOx oxidation. Samples of SOA were collected on filters,water-soluble compounds from SOA were extracted in water,and the resulting aqueous solutions were photolyzed tosimulate the photochemical aqueous processing of SOA. Theextent of change in the molecular level composition of SOA over 4 h of photolysis (approximately equivalent to 64 h ofphotolysis under ambient conditions) was assessed with high-resolution electrospray ionization mass spectrometry. The analysisrevealed significant differences in the molecular composition between SOA formed by the different oxidation pathways. Thecomposition further evolved during photolysis with the most notable change corresponding to the nearly complete removal ofnitrogen-containing organic compounds. Hydrolysis of SOA compounds also occurred in parallel with photolysis. Thepreferential loss of larger SOA compounds during photolysis and hydrolysis made the SOA compounds more volatile on average.This study suggests that aqueous processes may under certain conditions lead to a reduction in the SOA loading as opposed toan increase in SOA loading commonly assumed in the literature.
■ INTRODUCTION
Secondary organic aerosols (SOA) produced by the gas- andaqueous-phase oxidation of biogenic volatile organic com-pounds (BVOC) have both health and climate relevance.1
Following the initial formation, SOA are known to undergochemical aging processes from reactions with sunlight andatmospheric oxidants.2,3 The mechanisms of chemical agingand the role of aging processes in determining climate andhealth relevant properties of SOA, such as saturation vaporpressures of the SOA compounds, remain poorly explored.4
Part of the challenge is the inherent chemical complexity ofboth SOA and their aging processes.5
Aqueous processing of atmospheric organic compoundsinclude reactions with aqueous oxidants and aqueous photolysisand is now recognized as an important mechanism of chemicalaging of SOA.6,7 The SOA particles produced from BVOCoften nucleate cloud and fog droplets making the SOAcompounds dissolved and accessible to the aqueous photo-
chemical processes. We previously showed that exposure ofdissolved SOA produced from a number of VOC precursors toactinic radiation leads to significant changes in the molecularcomposition of SOA.8−10 The effect of photolysis on SOAcomposition was greater for SOA prepared by ozonolysis ofVOC in dark conditions compared to that for SOA prepared byOH + NOx photooxidation of VOC.10 This is a reasonableresult as the most photolabile compounds are photolyzedalready during the photooxidation in the smog chamber.Formation of SOA in the BVOC + NO3 reactions is anotherexample of a process that occurs in dark conditions. This typeof SOA may contain a larger fraction of photolabile moleculesrelative to the SOA prepared from the same VOC under OH +NOx photooxidation conditions. If this were correct, the SOA
Received: October 30, 2016Revised: January 16, 2017Published: January 18, 2017
Article
pubs.acs.org/JPCA
© 2017 American Chemical Society 1298 DOI: 10.1021/acs.jpca.6b10900J. Phys. Chem. A 2017, 121, 1298−1309
produced by night-time chemistry would quickly change itscomposition after sunrise. One of the motivations for this workis to test this hypothesis.Monoterpenes (C10H16) are the major precursors of SOA.
Formation of SOA from monoterpenes, such as α-pinene, hasbeen extensively documented, especially for the OH- and O3-initiated oxidation pathways.11−17 Several studies have exam-ined the oxidation of monoterpenes by the nitrate radical(NO3).
11,14,18−29 The NO3-driven oxidation mechanismappears to be a major sink for BVOC and a major source forSOA at night in regions characterized by elevated NOx (NO +NO2) and O3 levels.
11,30
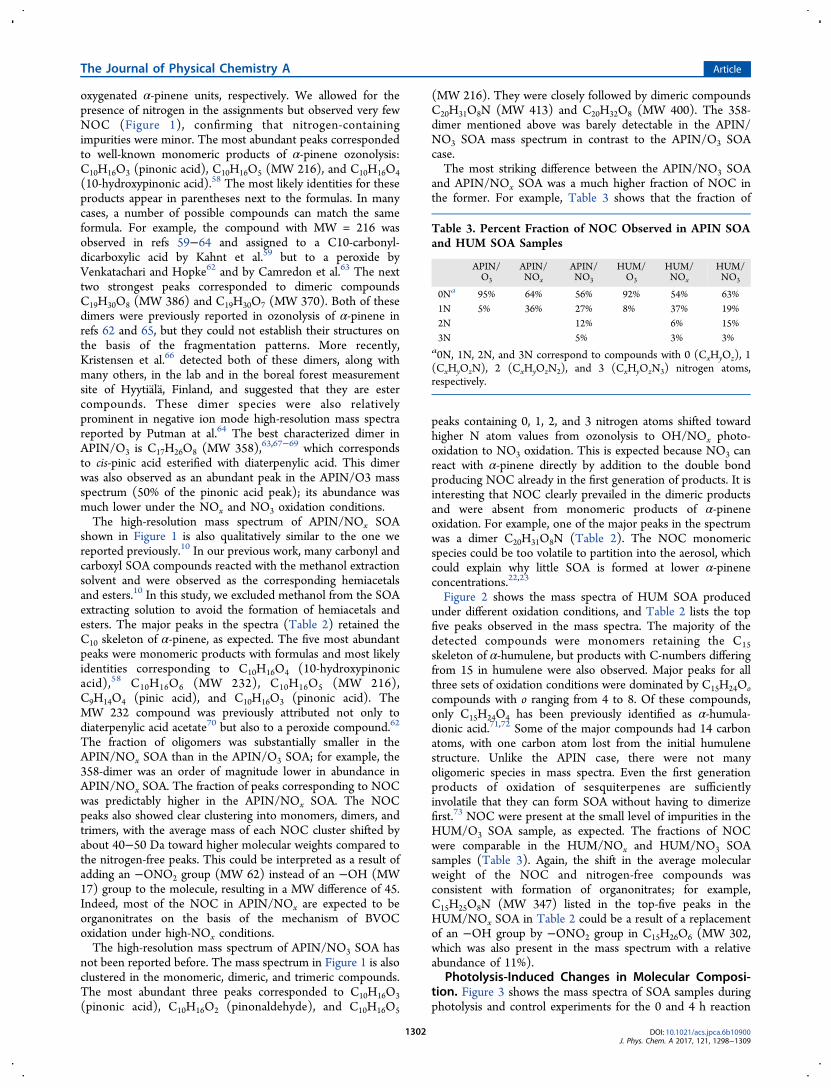
Sesquiterpenes, such as α-humulene, are less abundant inambient air than monoterpenes.31 However, their highermolecular weights and higher reactivity toward ozone andOH32−34 make them more efficient SOA precursors comparedto the monoterpenes in terms of the SOA mass yields.25,35
There have been limited studies on the NO3 oxidation ofsesquiterpenes. Canosa-Mas et al.26 and Shu and Atkinson33
measured the rate constants for the reactions between selectedsesquiterpenes and NO3 radical. Fry et al.23 investigated theNO3 oxidation of β-caryophyllene, observing high SOA yieldswith a low organonitrate yield in the condensed phase. Jaoui etal. observed efficient SOA formation in reactions of severalsesquiterpenes with NO3.
25
Though numerous studies of each oxidation pathway (OH,O3, or NO3) have been performed for both monoterpenes andsesquiterpenes, only one study has attempted to systematicallycompare all three oxidation conditions for the same VOCprecursor.25 The first goal of our work is to compare the SOAformed in an environmental chamber from a modelmonoterpene (α-pinene) and a model sesquiterpene (α-humulene) under these three oxidation conditions. By usingelectrospray ionization high-resolution mass spectrometry (ESI-HRMS), we detect a much broader array of SOA compoundsthan previously observed and investigate the effect of theoxidation conditions on the molecular distribution of the SOAproducts. The second goal of this work is to examine the effectof photolysis on the molecular composition of SOA producedby NO3 oxidation. Our results suggest facile photolysis ofdissolved SOA compounds, especially the nitrogen-containingorganic compounds (NOC). On the basis of the elementalcomposition assignments inferred from the ESI-HRMS data, wepredict that photolysis should increase the volatility of SOAcompounds based on a recently proposed “molecular corridors”parametrization36,37 between the molecular composition andvolatility.
■ MATERIAL AND METHODS
Secondary Organic Aerosol Generation. SOA wasprepared in a similar manner as previously described for theO3 and photooxidation experiments.10,38 Briefly, into a 5 m3
chamber approximately 650 ppb of ozone was added forozonolysis experiments, whereas approximately 300 ppb ofnitric oxide and 2 ppm of hydrogen peroxide were added forphotooxidation experiments. H2O2, added to the chamber byevaporation of its 30 v/v% aqueous solution with a stream ofzero air, was used to generate the hydroxyl radical. Initialmixing ratios of α-pinene (APIN) and α-humulene (HUM)were 500 ppb for all experiments, except for the APIN/NO3experiment, in which the concentration of APIN was increasedto 1000 ppb. For OH + NOx experiments, UV−B lamps(FS40T12/UVB, Solarc Systems Inc.) were turned on andphotooxidation time was 2 h for α-pinene experiments and 1 hfor α-humulene experiments. To simulate the nighttime NO3radical chemistry, approximately 2-fold excess O3 was added to300 ppb NO to drive the following reactions:
+ → +O NO NO O3 2 2 (R1)
+ → +O NO NO O3 2 3 2 (R2)
+ ⇌NO NO N O3 2 2 5 (R3)
After that, either α-pinene or α-humulene was added to thechamber. All experiments were performed under dry conditionsat 21−25 °C and in the absence of seed particles. All chemicalsnoted above were purchased from Sigma-Aldrich at highestavailable stated purities and used without further purification.SOA formed in the chamber were monitored by a TSI model
3936 scanning mobility particle sizer (SMPS), O3 wasmonitored using a Thermo Scientific model 49i ozone analyzer,and a Thermo Scientific model 42i-Y NOy analyzer recordedNO/NOy data. The particles were collected through anactivated carbon denuder at 17 SLM (standard liters perminute) onto poly(tetrafluoroethylene) (PTFE) filters (Milli-pore 0.2 μm pore size). We had to use high concentrations ofprecursors to collect a sufficient amount of SOA material (>0.2mg) for both photochemical and control experiments (Table1). Although the chemical composition of SOA formed at thehigh precursor and oxidant concentrations is not the same asthat formed at ambient concentrations,39 the major products aswell as the degrees of chemical complexity of SOA should becomparable. Therefore, these SOA samples should be suitablefor studying the general features of the photodegradationprocess. The filters were vacuum-sealed and immediately frozenat −20 °C in anticipation for offline aqueous photolysisexperiments and mass spectrometry analysis.
Electrospray Ionization High-Resolution Mass Spec-trometry (ESI-HRMS) of Aqueous Photolysis and ControlSamples. Filter SOA samples were thawed and extracted in 6mL of water (Fluka, HPLC grade) by sonicating the filterimmersed in water. The extract was split in two equal portions,where 3 mL of the sample was used for photolysis experimentsand 3 mL was used as a dark control. SOA material from α-pinene was believed to be fully dissolved during the extraction
Table 1. Experimental Conditions for the SOA Samples Prepared from α-Pinene (APIN) and α-Humulene (HUM)
VOCprecursor oxidant
initial VOC(ppb)
initial O3(ppb)
initial NO(ppb)
reaction time(h)
SOA concentration(mg/m3)
collection time(h)
SOA collected(mg)
APIN O3 500 640 <5 1 1.5 3 1.8APIN OH/NOx 500 <5 300 2 0.18 3 0.24APIN NO3 1000 720 300 1 1.2 3 2.7HUM O3 500 660 <5 1.5 1.2 3 1.3HUM OH/NOx 500 <5 300 1 0.87 4 1.1HUM NO3 500 600 300 1 1.8 3 4.1
The Journal of Physical Chemistry A Article
DOI: 10.1021/acs.jpca.6b10900J. Phys. Chem. A 2017, 121, 1298−1309
1299
on the basis of our previous experience.10 SOA material from α-humulene is less soluble in water,10 and only water-solublecomponents of SOA ended up in the solution. We did not havea way to quantify the amount of SOA remaining on the filter.The concentrations of the resulting solutions (up to 0.7 g/L iffully extracted) are more relevant to fog than to cloud droplets,so the conclusions reached in this paper should be moreapplicable to aqueous processes in a polluted environment thanto those in a remote atmosphere. The solutions were used assoon as they were prepared. For photolysis experiments, thesamples were photolyzed by a Xenon UV lamp (Newportmodel 66905) with a U-330 bandpass filter (Edmund optics#46-438) to reduce the visible and IR radiation. Thetemperature of the solution was not controlled but the solutiondid not measurably warm up above the room temperatureduring photolysis. The solution was open to air allowing oxygento enter and volatile photolysis products to escape. Thespectrum of the resulting radiation was recorded using aportable UV−vis spectrometer (Ocean Optics, USB4000) withmost of the radiation falling in the 280−400 nm range. Anazoxybenzene actinometer was used under the same exper-imental conditions to determine the flux of the lamp asdescribed by Lignell et al.40 On the basis of the actinometrymeasurements, we estimate that 1 h of photolysis with our lampwas equivalent to 16 h of photolysis by the overhead sun (SZAof 0° using the “Quick TUV”41 calculator with the followingparameters: 300 Dobson overhead ozone, surface albedo of 0.1,ground elevation and altitude = 0 km). Even though theirradiation source had considerably stronger UV flux than theambient sunlight, it was still far below the intensity needed todrive nonlinear processes in the solution, such as two-photonabsorption.The photolysis was carried out for a total of 4 h; the control
samples remained in water for the same duration of time butwere not exposed to radiation. Small aliquots (∼300 μL) werewithdrawn from the sample and control cuvettes once an hourand analyzed by ESI-HRMS in a direct infusion mode.Immediately before the analysis, the extracted aliquot wasmixed with acetonitrile in a 1:1 ratio to provide a more stableelectrospray ionization. An LTQ-Orbitrap mass spectrometer(Thermo Corp.) equipped with a modified ESI source was usedto analyze samples before and after photolysis.8−10,38,42−45
Mass spectra of the solvent (water + acetonitrile) were alsocollected to subtract from the sample mass spectra during dataanalysis. Mass spectra were acquired in the positive ion modefor all samples with a resolving power of 105 at m/z 400.Analysis of the mass spectra was performed similarly to our
previous work.5,10 Decon2LS (https://omics.pnl.gov/software/decontools-decon2ls) was used to generate a list of peakpositions and abundances for each spectrum. The resultingpeak lists for all the files in the same experimental batch (0, 1, 2,3, and 4 h of photolysis, 0, 1, 2, 3, and 4 h of dark hydrolysis,and solvent blank) were clustered together. The clustered peakswere first assigned with a m/z tolerance of ±0.001 to molecularformulas CcHhOoNnNa0−1
+ (c, h, o, n refer to the number ofcorresponding atoms in the ion; the number of Na atoms wasrestricted to 0 or 1). We limited n to 3, and allowed for thepresence of N atoms in the APIN/O3 and HUM/O3assignments to see whether any nitrogen-containing impuritiesaffected our measurements. Constraints were imposed on theelemental ratios (0.0< O/C < 1.3, 0.7 < H/C < 2.0) toeliminate unphysical assignments.46 Peaks that corresponded to13C isotopes and obvious impurities with anomalous mass
defects were excluded from further analysis. The set of theinitially assigned peaks was used to internally recalibrate the m/z axis, and the mass spectra were then reassigned with a lowerm/z tolerance of ±0.00075. The remaining peaks that couldnot be assigned within these constraints and peaks withambiguous assignments were assigned manually with help of amolecular formula calculator (http://magnet.fsu.edu/~midas/).The majority of the observed ions corresponded to sodium ionadduc t s (C cH hO oN nNa+) ; p ro tona ted molecu le s(CcHhOoNnH
+) generally had small abundances. For theremainder of this paper, we present and discuss formulascorresponding to the neutral species, CcHhOoNn, obtained byremoving Na+ or H+ from the assigned ion formulas.
“Molecular Corridors” Analysis of the SOA VolatilityDistribution. The volatility distributions of SOA componentswere estimated using the “molecular corridor” approach, whichtakes advantage of an inverse correlation between purecompound saturation mass concentration (C0) and molarmass of organic compounds.36,37 Recently, Li et al.37 developedparametrizations to predict C0 of organic compoundscontaining oxygen, nitrogen, and sulfur from the elementalcomposition. The ESI-HRMS data are well suited for thispurpose because they provide an experimental distribution ofmolecular formulas (and hence, molecular weights) in the SOAsample. On the basis of the Pankow absorptive partitioningtheory under the assumption of ideal thermodynamicmixing,47−49 the gas-phase mass concentration (Cg,i) andparticle-phase mass concentration (Cp,i) of compound i arerelated as follows
=C
C
C
Cg,i
p,i
0,i
p (1)
where Cp is the total mass concentration of organic particulatematter. Compounds for which C0,i is smaller than Cp shouldreside predominantly in the particle phase at equilibrium. Wenote that the above expression does not account for nonidealthermodynamic mixing of compounds in particles. The term“volatility” often refers to the effective saturation massconcentration (C*), which is related to C0 via an unknownactivity coefficient, C* = γ × C0. C* and C0 are interchangeableunder the assumption of an ideal thermodynamic mixing (γ =1).Because we generated SOA at high concentrations (Table 1)
and because of possible filter artifacts (volatile compoundspartitioning in the SOA material and on the filter), the SOAsamples contained compounds that would be expected toevaporate from particles under typical ambient conditions.Therefore, for each SOA sample we calculated a fraction of theobserved compounds with C0,i below Cp = 10 μg m−3, a valuethat is representative of moderately polluted air, from theobserved relative abundances in the ESI-HRMS mass spectra,ESIi.
=∑ <
∑C C
fractionESI ( )
ESIi 0,i p
i (2)
Equation 2 assumes that the mass fraction of each SOAcompound is proportional to its observed relative abundance inthe ESI-HRMS mass spectrum. This is certainly anapproximation because ESI detection sensitivities dependstrongly on the structures of the molecules and their surfaceactivities.50 Furthermore, the transmission of ions through themass spectrometer and their detection efficiency strongly
The Journal of Physical Chemistry A Article
DOI: 10.1021/acs.jpca.6b10900J. Phys. Chem. A 2017, 121, 1298−1309
1300
depend on the instrumental configuration. However, for a givenset of instrumental parameters, ESI tends to preferentiallyionize larger molecules, and for homologous compounds, thereis a positive correlation between the ESI detection sensitivityand molecular weight.51 Therefore, eq 2 should be a reasonableapproximation of the mass fraction of the detected SOAcompounds that should be associated with particles, especiallyfor the purposes of comparing two samples analyzed under thesame experimental conditions.
■ RESULTS AND DISCUSSION
Composition and Volatility of SOA before Photolysis.The main purpose of this section is to compare the detailedmolecular compositions of SOAs generated under threedifferent oxidation conditions (ozonolysis, OH/NOx photo-oxidation, NO3 oxidation). Table 1 provides a list of the SOAsamples produced in this work. The peak SOA concentrationand the amount of the collected SOA varied between thedifferent samples. The OH + NOx photooxidation resulted inthe lowest amount of SOA produced, whereas the NO3oxidation produced the most SOA. This is qualitatively
consistent with a previous report that found the average SOAyields for the same VOC precursor to be the highest for theNO3 reaction;25 however, the SOA yields could not bequalitatively compared because we did not measure the amountof reacted VOC.The reaction of α-pinene with NO3 was recently reported to
produce unexpectedly low SOA yields compared to reactions ofother monoterpenes with NO3.
22,23 Furthermore, ozonolysiswas found to be much more efficient in nucleating new particlesfrom α-pinene and β-pinene than reaction with NO3 or OH.
18
We were able to form particles for the APIN/NO3 system usinghigh concentrations of α-pinene in our system (1 ppm), inagreement with several previous studies.18,20,52
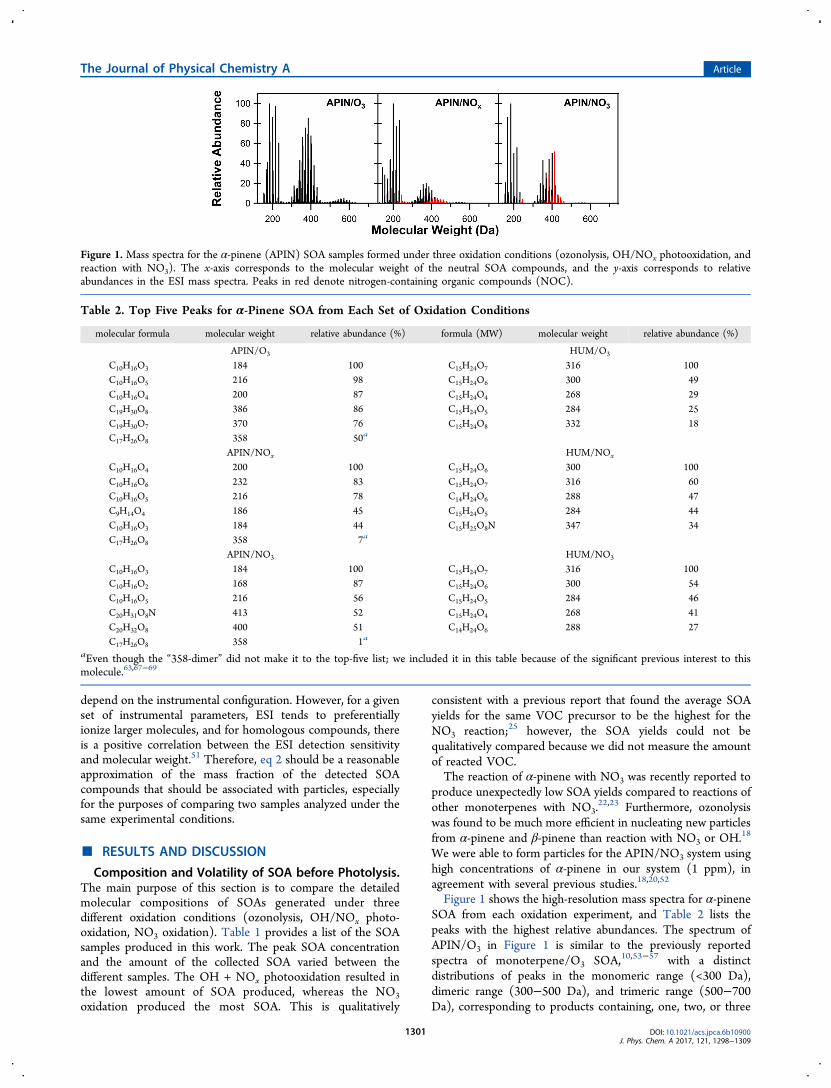
Figure 1 shows the high-resolution mass spectra for α-pineneSOA from each oxidation experiment, and Table 2 lists thepeaks with the highest relative abundances. The spectrum ofAPIN/O3 in Figure 1 is similar to the previously reportedspectra of monoterpene/O3 SOA,10,53−57 with a distinctdistributions of peaks in the monomeric range (<300 Da),dimeric range (300−500 Da), and trimeric range (500−700Da), corresponding to products containing, one, two, or three
Figure 1. Mass spectra for the α-pinene (APIN) SOA samples formed under three oxidation conditions (ozonolysis, OH/NOx photooxidation, andreaction with NO3). The x-axis corresponds to the molecular weight of the neutral SOA compounds, and the y-axis corresponds to relativeabundances in the ESI mass spectra. Peaks in red denote nitrogen-containing organic compounds (NOC).
Table 2. Top Five Peaks for α-Pinene SOA from Each Set of Oxidation Conditions
molecular formula molecular weight relative abundance (%) formula (MW) molecular weight relative abundance (%)
APIN/O3 HUM/O3
C10H16O3 184 100 C15H24O7 316 100C10H16O5 216 98 C15H24O6 300 49C10H16O4 200 87 C15H24O4 268 29C19H30O8 386 86 C15H24O5 284 25C19H30O7 370 76 C15H24O8 332 18C17H26O8 358 50a
APIN/NOx HUM/NOx
C10H16O4 200 100 C15H24O6 300 100C10H16O6 232 83 C15H24O7 316 60C10H16O5 216 78 C14H24O6 288 47C9H14O4 186 45 C15H24O5 284 44C10H16O3 184 44 C15H25O8N 347 34C17H26O8 358 7a
APIN/NO3 HUM/NO3
C10H16O3 184 100 C15H24O7 316 100C10H16O2 168 87 C15H24O6 300 54C10H16O5 216 56 C15H24O5 284 46C20H31O8N 413 52 C15H24O4 268 41C20H32O8 400 51 C14H24O6 288 27C17H26O8 358 1a
aEven though the “358-dimer” did not make it to the top-five list; we included it in this table because of the significant previous interest to thismolecule.63,67−69
The Journal of Physical Chemistry A Article
DOI: 10.1021/acs.jpca.6b10900J. Phys. Chem. A 2017, 121, 1298−1309
1301
oxygenated α-pinene units, respectively. We allowed for thepresence of nitrogen in the assignments but observed very fewNOC (Figure 1), confirming that nitrogen-containingimpurities were minor. The most abundant peaks correspondedto well-known monomeric products of α-pinene ozonolysis:C10H16O3 (pinonic acid), C10H16O5 (MW 216), and C10H16O4(10-hydroxypinonic acid).58 The most likely identities for theseproducts appear in parentheses next to the formulas. In manycases, a number of possible compounds can match the sameformula. For example, the compound with MW = 216 wasobserved in refs 59−64 and assigned to a C10-carbonyl-dicarboxylic acid by Kahnt et al.59 but to a peroxide byVenkatachari and Hopke62 and by Camredon et al.63 The nexttwo strongest peaks corresponded to dimeric compoundsC19H30O8 (MW 386) and C19H30O7 (MW 370). Both of thesedimers were previously reported in ozonolysis of α-pinene inrefs 62 and 65, but they could not establish their structures onthe basis of the fragmentation patterns. More recently,Kristensen et al.66 detected both of these dimers, along withmany others, in the lab and in the boreal forest measurementsite of Hyytiala, Finland, and suggested that they are estercompounds. These dimer species were also relativelyprominent in negative ion mode high-resolution mass spectrareported by Putman at al.64 The best characterized dimer inAPIN/O3 is C17H26O8 (MW 358),63,67−69 which correspondsto cis-pinic acid esterified with diaterpenylic acid. This dimerwas also observed as an abundant peak in the APIN/O3 massspectrum (50% of the pinonic acid peak); its abundance wasmuch lower under the NOx and NO3 oxidation conditions.The high-resolution mass spectrum of APIN/NOx SOA
shown in Figure 1 is also qualitatively similar to the one wereported previously.10 In our previous work, many carbonyl andcarboxyl SOA compounds reacted with the methanol extractionsolvent and were observed as the corresponding hemiacetalsand esters.10 In this study, we excluded methanol from the SOAextracting solution to avoid the formation of hemiacetals andesters. The major peaks in the spectra (Table 2) retained theC10 skeleton of α-pinene, as expected. The five most abundantpeaks were monomeric products with formulas and most likelyidentities corresponding to C10H16O4 (10-hydroxypinonicacid),58 C10H16O6 (MW 232), C10H16O5 (MW 216),C9H14O4 (pinic acid), and C10H16O3 (pinonic acid). TheMW 232 compound was previously attributed not only todiaterpenylic acid acetate70 but also to a peroxide compound.62
The fraction of oligomers was substantially smaller in theAPIN/NOx SOA than in the APIN/O3 SOA; for example, the358-dimer was an order of magnitude lower in abundance inAPIN/NOx SOA. The fraction of peaks corresponding to NOCwas predictably higher in the APIN/NOx SOA. The NOCpeaks also showed clear clustering into monomers, dimers, andtrimers, with the average mass of each NOC cluster shifted byabout 40−50 Da toward higher molecular weights compared tothe nitrogen-free peaks. This could be interpreted as a result ofadding an −ONO2 group (MW 62) instead of an −OH (MW17) group to the molecule, resulting in a MW difference of 45.Indeed, most of the NOC in APIN/NOx are expected to beorganonitrates on the basis of the mechanism of BVOCoxidation under high-NOx conditions.The high-resolution mass spectrum of APIN/NO3 SOA has
not been reported before. The mass spectrum in Figure 1 is alsoclustered in the monomeric, dimeric, and trimeric compounds.The most abundant three peaks corresponded to C10H16O3(pinonic acid), C10H16O2 (pinonaldehyde), and C10H16O5
(MW 216). They were closely followed by dimeric compoundsC20H31O8N (MW 413) and C20H32O8 (MW 400). The 358-dimer mentioned above was barely detectable in the APIN/NO3 SOA mass spectrum in contrast to the APIN/O3 SOAcase.The most striking difference between the APIN/NO3 SOA
and APIN/NOx SOA was a much higher fraction of NOC inthe former. For example, Table 3 shows that the fraction of
peaks containing 0, 1, 2, and 3 nitrogen atoms shifted towardhigher N atom values from ozonolysis to OH/NOx photo-oxidation to NO3 oxidation. This is expected because NO3 canreact with α-pinene directly by addition to the double bondproducing NOC already in the first generation of products. It isinteresting that NOC clearly prevailed in the dimeric productsand were absent from monomeric products of α-pineneoxidation. For example, one of the major peaks in the spectrumwas a dimer C20H31O8N (Table 2). The NOC monomericspecies could be too volatile to partition into the aerosol, whichcould explain why little SOA is formed at lower α-pineneconcentrations.22,23
Figure 2 shows the mass spectra of HUM SOA producedunder different oxidation conditions, and Table 2 lists the topfive peaks observed in the mass spectra. The majority of thedetected compounds were monomers retaining the C15skeleton of α-humulene, but products with C-numbers differingfrom 15 in humulene were also observed. Major peaks for allthree sets of oxidation conditions were dominated by C15H24Oocompounds with o ranging from 4 to 8. Of these compounds,only C15H24O4 has been previously identified as α-humula-dionic acid.71,72 Some of the major compounds had 14 carbonatoms, with one carbon atom lost from the initial humulenestructure. Unlike the APIN case, there were not manyoligomeric species in mass spectra. Even the first generationproducts of oxidation of sesquiterpenes are sufficientlyinvolatile that they can form SOA without having to dimerizefirst.73 NOC were present at the small level of impurities in theHUM/O3 SOA sample, as expected. The fractions of NOCwere comparable in the HUM/NOx and HUM/NO3 SOAsamples (Table 3). Again, the shift in the average molecularweight of the NOC and nitrogen-free compounds wasconsistent with formation of organonitrates; for example,C15H25O8N (MW 347) listed in the top-five peaks in theHUM/NOx SOA in Table 2 could be a result of a replacementof an −OH group by −ONO2 group in C15H26O6 (MW 302,which was also present in the mass spectrum with a relativeabundance of 11%).
Photolysis-Induced Changes in Molecular Composi-tion. Figure 3 shows the mass spectra of SOA samples duringphotolysis and control experiments for the 0 and 4 h reaction
Table 3. Percent Fraction of NOC Observed in APIN SOAand HUM SOA Samples
APIN/O3
APIN/NOx
APIN/NO3
HUM/O3
HUM/NOx
HUM/NO3
0Na 95% 64% 56% 92% 54% 63%1N 5% 36% 27% 8% 37% 19%2N 12% 6% 15%3N 5% 3% 3%
a0N, 1N, 2N, and 3N correspond to compounds with 0 (CxHyOz), 1(CxHyOzN), 2 (CxHyOzN2), and 3 (CxHyOzN3) nitrogen atoms,respectively.
The Journal of Physical Chemistry A Article
DOI: 10.1021/acs.jpca.6b10900J. Phys. Chem. A 2017, 121, 1298−1309
1302
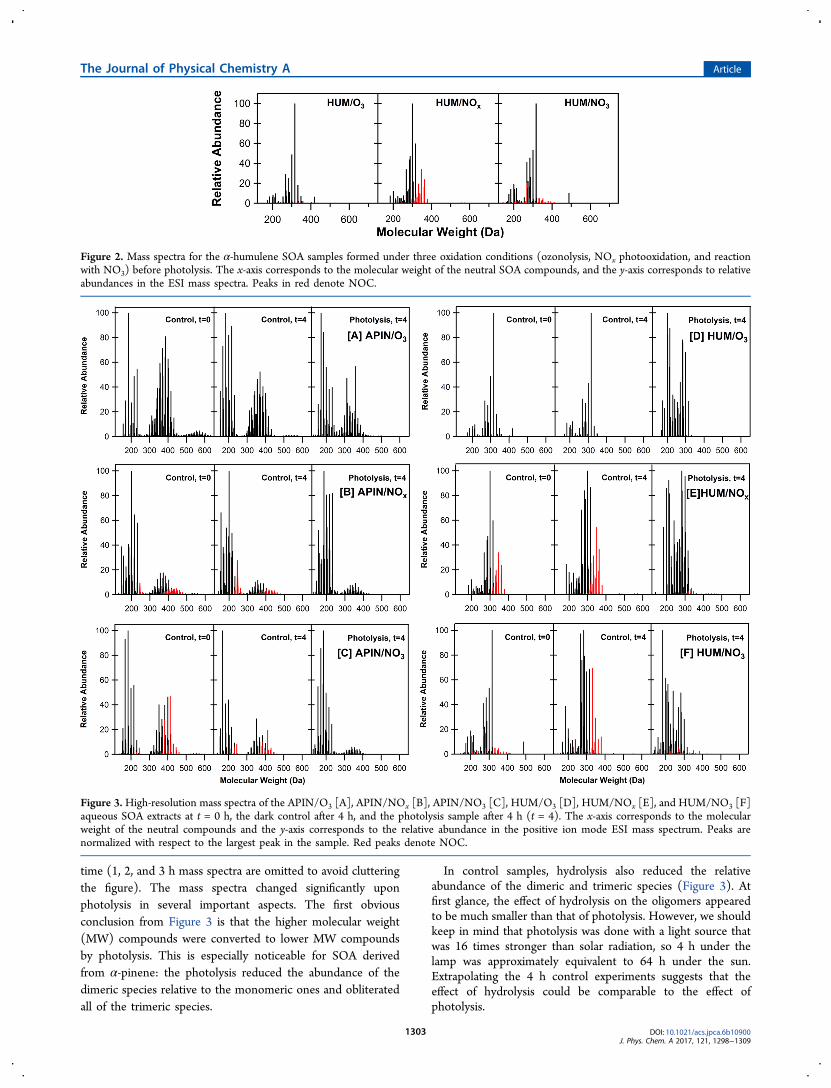
time (1, 2, and 3 h mass spectra are omitted to avoid clutteringthe figure). The mass spectra changed significantly uponphotolysis in several important aspects. The first obviousconclusion from Figure 3 is that the higher molecular weight(MW) compounds were converted to lower MW compoundsby photolysis. This is especially noticeable for SOA derivedfrom α-pinene: the photolysis reduced the abundance of thedimeric species relative to the monomeric ones and obliteratedall of the trimeric species.
In control samples, hydrolysis also reduced the relativeabundance of the dimeric and trimeric species (Figure 3). Atfirst glance, the effect of hydrolysis on the oligomers appearedto be much smaller than that of photolysis. However, we shouldkeep in mind that photolysis was done with a light source thatwas 16 times stronger than solar radiation, so 4 h under thelamp was approximately equivalent to 64 h under the sun.Extrapolating the 4 h control experiments suggests that theeffect of hydrolysis could be comparable to the effect ofphotolysis.
Figure 2. Mass spectra for the α-humulene SOA samples formed under three oxidation conditions (ozonolysis, NOx photooxidation, and reactionwith NO3) before photolysis. The x-axis corresponds to the molecular weight of the neutral SOA compounds, and the y-axis corresponds to relativeabundances in the ESI mass spectra. Peaks in red denote NOC.
Figure 3. High-resolution mass spectra of the APIN/O3 [A], APIN/NOx [B], APIN/NO3 [C], HUM/O3 [D], HUM/NOx [E], and HUM/NO3 [F]aqueous SOA extracts at t = 0 h, the dark control after 4 h, and the photolysis sample after 4 h (t = 4). The x-axis corresponds to the molecularweight of the neutral compounds and the y-axis corresponds to the relative abundance in the positive ion mode ESI mass spectrum. Peaks arenormalized with respect to the largest peak in the sample. Red peaks denote NOC.
The Journal of Physical Chemistry A Article
DOI: 10.1021/acs.jpca.6b10900J. Phys. Chem. A 2017, 121, 1298−1309
1303
The most obvious effect of photolysis was the dramaticremoval of NOC species. They were removed almost entirelyfor the mixtures of APIN/NOx and APIN/NO3 SOA. Thereduction in the number of the NOC species was also obviousfor the HUM/NOx and HUM/NO3 SOA, although a few NOCappeared to persist. The hydrolysis in the control samples didnot have the same effect; the relative amount of NOC remainedabout the same, or even increased in some cases, judging fromthe relative peak abundance.Aerosol mass spectrometer (AMS) measurements of average
elemental ratios (H/C, O/C, and N/C) are frequently reportedin both field and lab studies.74 To aid in the comparison withother experiments, we calculated the average elemental ratios,as well as the average molecular size (denoted by the number ofC atoms per molecule), and average double bond equivalent(DBE) from the assigned, neutral molecular formulas. Allaveraged quantities were calculated with respect to peakabundances for all observed compounds as shown below:
⟨ ⟩ =∑∑
=XI xI
x c o h n( , , , , DBE)i i
i (3)
⟨ ⟩⟨ ⟩
=∑∑
=XY
I xI y
x y o c h n( , , , , )i i
i i (4)
The results from these calculations for the control andphotolysis samples are compiled in Figures 4 and 5 for APINSOA and HUM SOA, respectively, as a function of thephotolysis (or hydrolysis) time from 0 to 4 h.
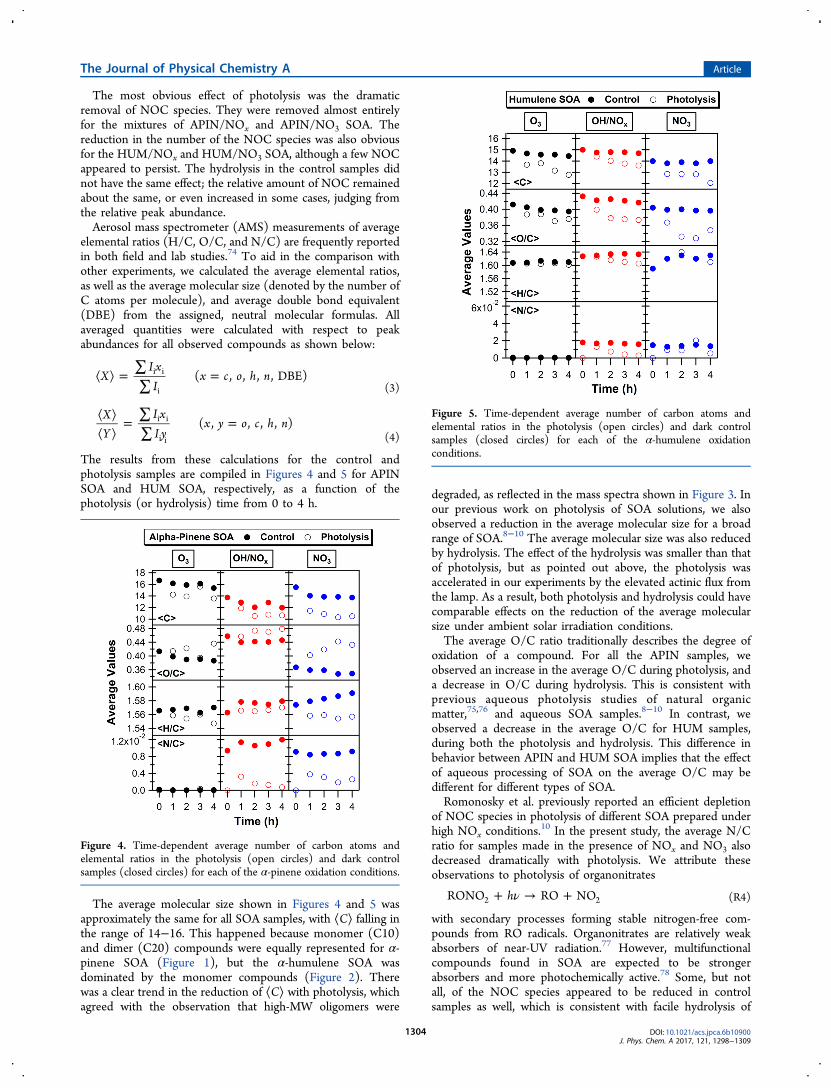
The average molecular size shown in Figures 4 and 5 wasapproximately the same for all SOA samples, with ⟨C⟩ falling inthe range of 14−16. This happened because monomer (C10)and dimer (C20) compounds were equally represented for α-pinene SOA (Figure 1), but the α-humulene SOA wasdominated by the monomer compounds (Figure 2). Therewas a clear trend in the reduction of ⟨C⟩ with photolysis, whichagreed with the observation that high-MW oligomers were
degraded, as reflected in the mass spectra shown in Figure 3. Inour previous work on photolysis of SOA solutions, we alsoobserved a reduction in the average molecular size for a broadrange of SOA.8−10 The average molecular size was also reducedby hydrolysis. The effect of the hydrolysis was smaller than thatof photolysis, but as pointed out above, the photolysis wasaccelerated in our experiments by the elevated actinic flux fromthe lamp. As a result, both photolysis and hydrolysis could havecomparable effects on the reduction of the average molecularsize under ambient solar irradiation conditions.The average O/C ratio traditionally describes the degree of
oxidation of a compound. For all the APIN samples, weobserved an increase in the average O/C during photolysis, anda decrease in O/C during hydrolysis. This is consistent withprevious aqueous photolysis studies of natural organicmatter,75,76 and aqueous SOA samples.8−10 In contrast, weobserved a decrease in the average O/C for HUM samples,during both the photolysis and hydrolysis. This difference inbehavior between APIN and HUM SOA implies that the effectof aqueous processing of SOA on the average O/C may bedifferent for different types of SOA.Romonosky et al. previously reported an efficient depletion
of NOC species in photolysis of different SOA prepared underhigh NOx conditions.
10 In the present study, the average N/Cratio for samples made in the presence of NOx and NO3 alsodecreased dramatically with photolysis. We attribute theseobservations to photolysis of organonitrates
ν+ → +hRONO RO NO2 2 (R4)
with secondary processes forming stable nitrogen-free com-pounds from RO radicals. Organonitrates are relatively weakabsorbers of near-UV radiation.77 However, multifunctionalcompounds found in SOA are expected to be strongerabsorbers and more photochemically active.78 Some, but notall, of the NOC species appeared to be reduced in controlsamples as well, which is consistent with facile hydrolysis of
Figure 4. Time-dependent average number of carbon atoms andelemental ratios in the photolysis (open circles) and dark controlsamples (closed circles) for each of the α-pinene oxidation conditions.
Figure 5. Time-dependent average number of carbon atoms andelemental ratios in the photolysis (open circles) and dark controlsamples (closed circles) for each of the α-humulene oxidationconditions.
The Journal of Physical Chemistry A Article
DOI: 10.1021/acs.jpca.6b10900J. Phys. Chem. A 2017, 121, 1298−1309
1304
certain secondary and tertiary organic nitrates, but not theprimary ones.79−81 The average N/C was relatively insensitiveto the hydrolysis.The mechanism of the observed photodegradation of SOA
compounds, including organonitrates, cannot be conclusivelyproven because it is challenging to distinguish between directphotolysis of organic compounds and their indirect photo-oxidation by OH. Hydroxyl radicals can be formed asbyproducts of SOA photolysis82 or even from the spontaneousdecomposition of SOA compounds in water.82,83 In theexperiments described in this paper, we did not intentionallyadd any OH precursors to the photolyzed solutions toemphasize direct photolysis. Aljawhary et al.84 examined OH-driven aqueous photooxidation of pinonic acid, which photo-lyzes too slowly,40 and of two other surrogate products of α-pinene oxidation. They observed formation of less volatileproducts in these processes. For example, more aerosol couldbe produced by atomization of a solution of pinonic acid andH2O2 after the solution was irradiated. We tested the effect ofOH in a separate series of experiments, in which hydrogenperoxide or nitrate ion were intentionally added to the sameSOA solutions and found that the photodegradation of SOAorganics occurred at an even faster rate, as judged by therelative abundance of the dimer species to the monomer speciesin the mass spectrum after 4 h of irradiation (the data are notshown because they are qualitatively similar to the data shownin Figure 3). The SOA compounds that are removed under ourexperimental conditions may already be sufficiently oxidizedmaking the fragmentation-type processes more favorable,85−87
regardless of the mechanism (photolysis, hydrolysis, OHoxidation).
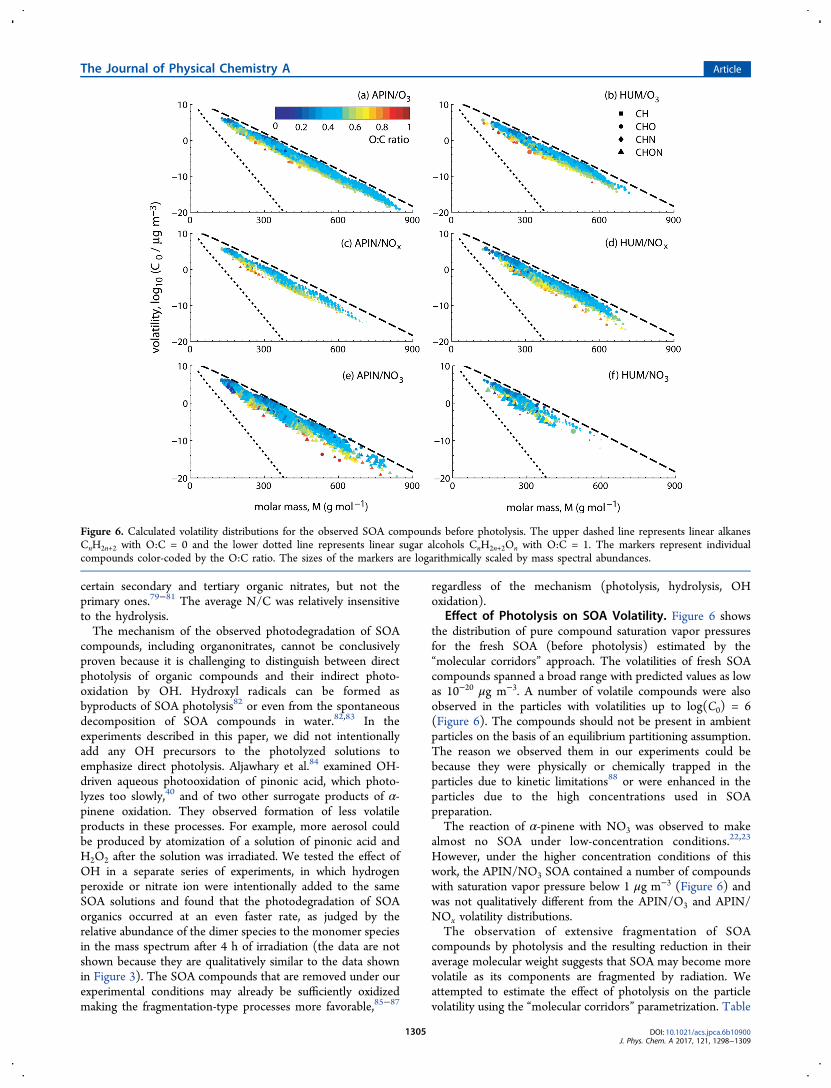
Effect of Photolysis on SOA Volatility. Figure 6 showsthe distribution of pure compound saturation vapor pressuresfor the fresh SOA (before photolysis) estimated by the“molecular corridors” approach. The volatilities of fresh SOAcompounds spanned a broad range with predicted values as lowas 10−20 μg m−3. A number of volatile compounds were alsoobserved in the particles with volatilities up to log(C0) = 6(Figure 6). The compounds should not be present in ambientparticles on the basis of an equilibrium partitioning assumption.The reason we observed them in our experiments could bebecause they were physically or chemically trapped in theparticles due to kinetic limitations88 or were enhanced in theparticles due to the high concentrations used in SOApreparation.The reaction of α-pinene with NO3 was observed to make
almost no SOA under low-concentration conditions.22,23
However, under the higher concentration conditions of thiswork, the APIN/NO3 SOA contained a number of compoundswith saturation vapor pressure below 1 μg m−3 (Figure 6) andwas not qualitatively different from the APIN/O3 and APIN/NOx volatility distributions.The observation of extensive fragmentation of SOA
compounds by photolysis and the resulting reduction in theiraverage molecular weight suggests that SOA may become morevolatile as its components are fragmented by radiation. Weattempted to estimate the effect of photolysis on the particlevolatility using the “molecular corridors” parametrization. Table
Figure 6. Calculated volatility distributions for the observed SOA compounds before photolysis. The upper dashed line represents linear alkanesCnH2n+2 with O:C = 0 and the lower dotted line represents linear sugar alcohols CnH2n+2On with O:C = 1. The markers represent individualcompounds color-coded by the O:C ratio. The sizes of the markers are logarithmically scaled by mass spectral abundances.
The Journal of Physical Chemistry A Article
DOI: 10.1021/acs.jpca.6b10900J. Phys. Chem. A 2017, 121, 1298−1309
1305
4 lists the mass fraction of the SOA compounds expected toreside in particle phase at Cp = 10 μg/m3 calculated from eq 2.
A reduction in this fraction would mean that the compounds inthe SOA sample become more volatile. The data show thatboth the photolysis and hydrolysis reduced the fraction ofmaterial residing in the particle phase. The effect appeared tobe stronger for photolysis. For example, for the APIN/NOxSOA, the fraction of the detected compounds expected to be inthe particle phase went down from about 50% to less than 20%after photolysis, and down to 36% during hydrolysis. Aspointed out earlier, the rate of photolysis was accelerated by thestronger actinic flux from the lamp compared to normalambient conditions, so it can be concluded that both photolysisand hydrolysis had comparable influences on the increase ofSOA volatility. Both processes produced smaller, more volatilecompounds from larger, less volatile ones initially present inSOA.
■ CONCLUSIONS AND IMPLICATIONSThis study presented high-resolution mass spectra of SOAprepared from a common monoterpene α-pinene and acommon sesquiterpene α-humulene oxidized under threedifferent conditions: ozonolysis, reaction with OH in thepresence of NOx, and reaction with NO3. Molecular formulascould be assigned to most of the observed peaks, and the majorobserved peaks were consistent with previous studies of SOAfrom these two precursors. The SOA contained a mixture ofmonomeric and oligomeric products in the case of α-pinene; itwas dominated by monomeric products C15H24Oo with o = 4−8in the case of α-humulene. The SOA prepared under OH/NOxand NO3 oxidation conditions had a number of nitrogen-containing organic compounds (NOC), assumed to beorganonitrates, RONO2.The composition of SOA changed significantly during
aqueous photolysis. The photolysis time used in theseexperiments was rather long (4 h of photolysis under theexperimental conditions; approximately equivalent to 64 hunder sunlight) but the changes were clearly visible alreadyafter 1 h of photolysis. Two most obvious effects were thereduction in the average molecular size due to the preferentialdegradation of oligomeric compounds, and strong reduction inthe amount of nitrogen-containing organic compounds. TheNOC were almost completely absent after 4 h of photolysisunder the experimental conditions, which was approximatelyequivalent to 64 h under sunlight. In contrast, most (but notall) NOC persisted in aqueous solutions under dark conditions.The main implication of this work is that organonitrates derivedfrom BVOC oxidation are not likely to survive long-rangetransport of SOA when aqueous processing is occurring undersunlit conditions. Hydrolysis of organonitrates was suggested asthe reason between much lower amounts of organonitratesdetected in field compared to lab studies;81 photolysis could be
just as important, if not more important, in removing thesecompounds. The photodegradation and hydrolysis of NOCobserved in this work could potentially be responsible for thefacile (time scale of 2−4 h) removal of highly functionalizedorganonitrates observed in recent field measurements in thesoutheast United States.89
Although this study focused on aqueous photochemistry,similar photodegradation processes could potentially beeffective in the gaseous phase and in organic particles, in theabsence of liquid water. However, the differences in themechanisms and rates of photochemical processes occurringinside the organic phase of SOA and in an aqueous solution ofSOA is still an open question. Although the SOA material isknown to photodegrade at atmospherically relevant rates,90
certain types of photochemical processes are suppressed by theviscous environment of the SOA material.91,92 Anothercomplication is that we only tracked water-soluble componentsof SOA in this study, and the water-insoluble fraction thatremained on the filter could have very different photochemistry.The matrix effect on the photodegradation of SOA compoundsshould be examined in future experiments.Aqueous photochemical processing of organics is viewed as
an important source of SOA.6,7 For example, it is well-established that small water-soluble molecules such as glyoxaland methylglyoxal produce low-volatility products throughoxidation and oligomerization processes.93−95 Our experimentsclearly demonstrate that not all aqueous processes lead tobuildup of SOA by generating low-volatility products; there arealso competing hydrolysis and photolysis processes that makedissolved organic compounds smaller and more volatile.Therefore, an SOA particle entering a fog or cloud dropletcould potentially shrink after the droplet evaporates. We shouldstress that in our experiments we removed the volatilecompounds from the aerosol before dissolving the particles inwater. The situations in which both small water-solublemolecules and particulate compounds are scavenged by waterdroplets, and then irradiated by sunlight, will be more complex.Will the photodegradation of larger SOA compounds prevailover oligomerization and OH oxidation of smaller ones? It willbe an interesting question to explore in future studies.
■ ASSOCIATED CONTENT*S Supporting InformationThe Supporting Information is available free of charge on theACS Publications website at DOI: 10.1021/acs.jpca.6b10900.
List of the observed peaks and their formula assignmentsin the fresh SOA samples (XLSX)
■ AUTHOR INFORMATIONCorresponding Author*S. A. Nizkorodov. Phone: 949-824-1262. E-mail [email protected] A. Nizkorodov: 0000-0003-0891-0052NotesThe authors declare no competing financial interest.
■ ACKNOWLEDGMENTSWe acknowledge support by the U.S. Department ofCommerce, National Oceanic and Atmospheric Administrationthrough Climate Program Office’s AC4 program, awards
Table 4. Percent Mass Fractions of Observed SOACompounds with Saturation Vapor Pressures (C0) below 10μg/m3 before and after Photolysis and Hydrolysis
SOA0 h
photolysis4 h
photolysis0 h
hydrolysis4 h
hydrolysis
APIN/O3 70 52 71 62APIN/NOx 48 19 48 36APIN/NO3 56 17 61 45
The Journal of Physical Chemistry A Article
DOI: 10.1021/acs.jpca.6b10900J. Phys. Chem. A 2017, 121, 1298−1309
1306
NA13OAR4310066 (PNNL) and NA13OAR4310062 (UCI).D.E.R. thanks NSF for the support via the graduate fellowshipprogram and NSF grant AGS-1227579. The ESI-HRMSmeasurements were performed at the W. R. Wiley Environ-mental Molecular Sciences Laboratory (EMSL)a nationalscientific user facility located at PNNL, and sponsored by theOffice of Biological and Environmental Research of the U.S.DOE. PNNL is operated for U.S. DOE by Battelle MemorialInstitute under Contract No. DE-AC06-76RL0 1830.
■ REFERENCES(1) Finlayson-Pitts, B. J.; Pitts, J. N. Chemistry of the Upper and LowerAtmosphere: Theory, Experiments, and Applications; Academic Press:San Diego, 2000.(2) George, C.; Ammann, M.; D’Anna, B.; Donaldson, D. J.;Nizkorodov, S. A. Heterogeneous Photochemistry in the Atmosphere.Chem. Rev. 2015, 115, 4218−4258.(3) Rudich, Y.; Donahue, N. M.; Mentel, T. F. Aging of OrganicAerosol: Bridging the Gap between Laboratory and Field Studies.Annu. Rev. Phys. Chem. 2007, 58, 321−352.(4) Poschl, U.; Shiraiwa, M. Multiphase Chemistry at theAtmosphere−Biosphere Interface Influencing Climate and PublicHealth in the Anthropocene. Chem. Rev. 2015, 115, 4440−4475.(5) Nizkorodov, S. A.; Laskin, J.; Laskin, A. Molecular Chemistry ofOrganic Aerosols through the Application of High Resolution MassSpectrometry. Phys. Chem. Chem. Phys. 2011, 13, 3612−3629.(6) Ervens, B.; Turpin, B. J.; Weber, R. J. Secondary Organic AerosolFormation in Cloud Droplets and Aqueous Particles (aqSOA): AReview of Laboratory, Field and Model Studies. Atmos. Chem. Phys.2011, 11, 11069−11102.(7) Herrmann, H.; Schaefer, T.; Tilgner, A.; Styler, S. A.; Weller, C.;Teich, M.; Otto, T. Tropospheric Aqueous-Phase Chemistry: Kinetics,Mechanisms, and Its Coupling to a Changing Gas Phase. Chem. Rev.2015, 115, 4259−4334.(8) Bateman, A. P.; Nizkorodov, S. A.; Laskin, J.; Laskin, A.Photochemical Processing of Secondary Organic Aerosols Dissolved inCloud Droplets. Phys. Chem. Chem. Phys. 2011, 13, 12199−12212.(9) Nguyen, T. B.; Laskin, A.; Laskin, J.; Nizkorodov, S. A. DirectAqueous Photochemistry of Isoprene High-NOX Secondary OrganicAerosol. Phys. Chem. Chem. Phys. 2012, 14, 9702−9714.(10) Romonosky, D. E.; Laskin, A.; Laskin, J.; Nizkorodov, S. A.High-Resolution Mass Spectrometry and Molecular Characterizationof Aqueous Photochemistry Products of Common Types of SecondaryOrganic Aerosols. J. Phys. Chem. A 2015, 119, 2594−2606.(11) Atkinson, R.; Arey, J. Gas-Phase Tropospheric Chemistry ofBiogenic Volatile Organic Compounds: A Review. Atmos. Environ.2003, 37, S197−S219.(12) Lee, A.; Goldstein, A. H.; Keywood, M. D.; Gao, S.;Varutbangkul, V.; Bahreini, R.; Ng, N. L.; Flagan, R. C.; Seinfeld, J.H.. Gas-Phase Products and Secondary Aerosol Yields from theOzonolysis of Ten Different Terpenes. J. Geophys. Res. 2006, 111,10.1029/2005JD006437.(13) Calogirou, A.; Larsen, B. R.; Kotzias, D. Gas-Phase TerpeneOxidation Products: A Review. Atmos. Environ. 1999, 33, 1423−1439.(14) Hoffmann, T.; Odum, J. R.; Bowman, F.; Collins, D.; Klockow,D.; Flagan, R. C.; Seinfeld, J. H. Formation of Organic Aerosols fromthe Oxidation of Biogenic Hydrocarbons. J. Atmos. Chem. 1997, 26,189−222.(15) Johnson, D.; Marston, G. The Gas-Phase Ozonolysis ofUnsaturated Volatile Organic Compounds in the Troposphere.Chem. Soc. Rev. 2008, 37, 699−716.(16) Kroll, J. H.; Seinfeld, J. H. Chemistry of Secondary OrganicAerosol: Formation and Evolution of Low-Volatility Organics in theAtmosphere. Atmos. Environ. 2008, 42, 3593−3624.(17) Yu, J.; Cocker, D. R., III; Griffin, R. J.; Flagan, R. C.; Seinfeld, J.H. Gas-Phase Ozone Oxidation of Monoterpenes: Gaseous andParticulate Products. J. Atmos. Chem. 1999, 34, 207−258.
(18) Bonn, B.; Moorgat, G. K. New Particle Formation during a- andB-Pinene Oxidation by O3, OH and NO3, and the Influence of WaterVapour: Particle Size Distribution Studies. Atmos. Chem. Phys. 2002, 2,183−196.(19) Spittler, M.; Barnes, I.; Bejan, I.; Brockmann, K. J.; Benter, T.;Wirtz, K. Reactions of NO3 Radicals with Limonene and α-Pinene:Product and SOA Formation. Atmos. Environ. 2006, 40, 116−127.(20) Perraud, V.; Bruns, E. A.; Ezell, M. J.; Johnson, S. N.; Greaves, J.;Finlayson-Pitts, B. J. Identification of Organic Nitrates in the NO3
Radical Initiated Oxidation of α-Pinene by Atmospheric PressureChemical Ionization Mass Spectrometry. Environ. Sci. Technol. 2010,44, 5887−5893.(21) Fry, J. L.; Kiendler-Scharr, A.; Rollins, A. W.; Wooldridge, P. J.;Brown, S. S.; Fuchs, H.; Dube, W.; Mensah, A.; Dal Maso, M.;Tillmann, R. Organic Nitrate and Secondary Organic Aerosol Yieldfrom NO3 Oxidation of β-Pinene Evaluated Using a Gas-PhaseKinetics/aerosol Partitioning Model. Atmos. Chem. Phys. 2009, 9,1431−1449.(22) Draper, D. C.; Farmer, D. K.; Desyaterik, Y.; Fry, J. L. AQualitative Comparison of Secondary Organic Aerosol Yields andComposition from Ozonolysis of Monoterpenes at Varying Concen-trations of NO2. Atmos. Chem. Phys. 2015, 15, 12267−12281.(23) Fry, J. L.; Draper, D. C.; Barsanti, K. C.; Smith, J. N.; Ortega, J.;Winkler, P. M.; Lawler, M. J.; Brown, S. S.; Edwards, P. M.; Cohen, R.C. Secondary Organic Aerosol Formation and Organic Nitrate Yieldfrom NO3 Oxidation of Biogenic Hydrocarbons. Environ. Sci. Technol.2014, 48, 11944−11953.(24) Fry, J. L.; Kiendler-Scharr, A.; Rollins, A. W.; Brauers, T.;Brown, S. S.; Dorn, H.-P.; Dube, W. P.; Fuchs, H.; Mensah, A.; Rohrer,F. SOA from Limonene: Role of NO3 in Its Generation andDegradation. Atmos. Chem. Phys. 2011, 11, 3879−3894.(25) Jaoui, M.; Kleindienst, T. E.; Docherty, K. S.; Lewandowski, M.;Offenberg, J. H. Secondary Organic Aerosol Formation from theOxidation of a Series of Sesquiterpenes: α-Cedrene, β-Caryophyllene,α-Humulene and α-Farnesene with O3, OH and NO3 Radicals.Environ. Chem. 2013, 10, 178−193.(26) Canosa-Mas, C. E.; King, M. D.; Scarr, P. J.; Thompson, K. C.;Wayne, R. P. An Experimental Study of the Gas-Phase Reactions of theNO3 Radical with Three Sesquiterpenes: Isolongifolene, Alloisolongi-folene, and α-Neoclovene. Phys. Chem. Chem. Phys. 1999, 1, 2929−2933.(27) Boyd, C. M.; Sanchez, J.; Xu, L.; Eugene, A. J.; Nah, T.; Tuet,W. Y.; Guzman, M. I.; Ng, N. L. Secondary Organic AerosolFormation from the β-Pinene + NO3 System: Effect of Humidity andPeroxy Radical Fate. Atmos. Chem. Phys. 2015, 15, 7497−7522.(28) Nah, T.; Sanchez, J.; Boyd, C. M.; Ng, N. L. PhotochemicalAging of α-Pinene and β-Pinene Secondary Organic Aerosol Formedfrom Nitrate Radical Oxidation. Environ. Sci. Technol. 2016, 50, 222−231.(29) Ayres, B. R.; Allen, H. M.; Draper, D. C.; Brown, S. S.; Wild, R.J.; Jimenez, J. L.; Day, D. A.; Campuzano-Jost, P.; Hu, W.; Gouw, J. de.Organic Nitrate Aerosol Formation via NO3 + Biogenic VolatileOrganic Compounds in the Southeastern United States. Atmos. Chem.Phys. 2015, 15, 13377−13392.(30) Wayne, R. P.; Barnes, I.; Biggs, P.; Burrows, J. P.; Canosa-Mas,C. E.; Hjorth, J.; Le Bras, G.; Moortgat, G. K.; Perner, D.; Poulet, G.The Nitrate Radical: Physics, Chemistry, and the Atmosphere. Atmos.Environ., Part A 1991, 25, 1−203.(31) Sindelarova, K.; Granier, C.; Bouarar, I.; Guenther, A.; Tilmes,S.; Stavrakou, T.; Muller, J.-F.; Kuhn, U.; Stefani, P.; Knorr, W. GlobalData Set of Biogenic VOC Emissions Calculated by the MEGANModel over the Last 30 Years. Atmos. Chem. Phys. 2014, 14, 9317−9341.(32) Atkinson, R.; Arey, J. Atmospheric Degradation of VolatileOrganic Compounds. Chem. Rev. 2003, 103, 4605−4638.(33) Shu, Y.; Atkinson, R. Rate Constants for the Gas-phaseReactions of O3 with a Series of Terpenes and OH Radical Formationfrom the O3 Reactions with Sesquiterpenes at 296 ± 2 K. Int. J. Chem.Kinet. 1994, 26, 1193−1205.
The Journal of Physical Chemistry A Article
DOI: 10.1021/acs.jpca.6b10900J. Phys. Chem. A 2017, 121, 1298−1309
1307
(34) Shu, Y.; Atkinson, R. Atmospheric Lifetimes and Fates of aSeries of Sesquiterpenes. J. Geophys. Res. 1995, 100, 7275−7281.(35) Griffin, R. J.; Cocker, D. R.; Flagan, R. C.; Seinfeld, J. H.Organic Aerosol Formation from the Oxidation of Biogenic Hydro-carbons. J. Geophys. Res. 1999, 104, 3555−3567.(36) Shiraiwa, M.; Berkemeier, T.; Schilling-Fahnestock, K. A.;Seinfeld, J. H.; Poschl, U. Molecular Corridors and Kinetic Regimes inthe Multiphase Chemical Evolution of Secondary Organic Aerosol.Atmos. Chem. Phys. 2014, 14, 8323−8341.(37) Li, Y.; Poschl, U.; Shiraiwa, M. Molecular Corridors andParameterizations of Volatility in the Chemical Evolution of OrganicAerosols. Atmos. Chem. Phys. 2016, 16, 3327−3344.(38) Nguyen, T. B.; Bateman, A. P.; Bones, D. L.; Nizkorodov, S. A.;Laskin, J.; Laskin, A. High-Resolution Mass Spectrometry Analysis ofSecondary Organic Aerosol Generated by Ozonolysis of Isoprene.Atmos. Environ. 2010, 44, 1032−1042.(39) Kourtchev, I.; Giorio, C.; Manninen, A.; Wilson, E.; Mahon, B.;Aalto, J.; Kajos, M.; Venables, D.; Ruuskanen, T.; Levula, J. EnhancedVolatile Organic Compounds Emissions and Organic Aerosol MassIncrease the Oligomer Content of Atmospheric Aerosols. Sci. Rep.2016, 6, 35038.(40) Lignell, H.; Epstein, S. A.; Marvin, M. R.; Shemesh, D.; Gerber,B.; Nizkorodov, S. Experimental and Theoretical Study of AqueousCis-Pinonic Acid Photolysis. J. Phys. Chem. A 2013, 117, 12930−12945.(41) Madronich, S. Tropospheric Ultraviolet and Visible (TUV)Radiation Model. http://cprm.acd.ucar.edu/Models/TUV/index.shtml(accessed May 2016).(42) Bateman, A. P.; Laskin, J.; Laskin, A.; Nizkorodov, S. A.Applications of High-Resolution Electrospray Ionization MassSpectrometry to Measurements of Average Oxygen to Carbon Ratiosin Secondary Organic Aerosols. Environ. Sci. Technol. 2012, 46, 8315−8324.(43) Bateman, A. P.; Nizkorodov, S. A.; Laskin, J.; Laskin, A. Time-Resolved Molecular Characterization of Limonene/ozone AerosolUsing High-Resolution Electrospray Ionization Mass Spectrometry.Phys. Chem. Chem. Phys. 2009, 11, 7931−7942.(44) Nguyen, T. B.; Roach, P. J.; Laskin, J.; Laskin, A.; Nizkorodov, S.A. Effect of Humidity on the Composition of Isoprene PhotooxidationSecondary Organic Aerosol. Atmos. Chem. Phys. 2011, 11, 6931−6944.(45) Nguyen, T. B.; Laskin, J.; Laskin, A.; Nizkorodov, S. A.Nitrogen-Containing Organic Compounds and Oligomers in Secon-dary Organic Aerosol Formed by Photooxidation of Isoprene. Environ.Sci. Technol. 2011, 45, 6908−6918.(46) Kind, T.; Fiehn, O. Seven Golden Rules for Heuristic Filteringof Molecular Formulas Obtained by Accurate Mass Spectrometry.BMC Bioinf. 2007, 8, 1.(47) Pankow, J. F. An Absorption-Model of Gas-Particle Partitioningof Organic-Compounds in the Atmosphere. Atmos. Environ. 1994, 28,185−188.(48) Pankow, J. F. An Absorption-Model of the Gas AerosolPartitioning Involved in the Formation of Secondary Organic Aerosol.Atmos. Environ. 1994, 28, 189−193.(49) Donahue, N. M.; Robinson, A. L.; Stanier, C. O.; Pandis, S. N.Coupled Partitioning, Dilution, and Chemical Aging of SemivolatileOrganics. Environ. Sci. Technol. 2006, 40, 2635−2643.(50) Cech, N. B.; Enke, C. G. Practical Implications of Some RecentStudies in Electrospray Ionization Fundamentals. Mass Spectrom. Rev.2001, 20, 362−387.(51) Nguyen, T. B.; Nizkorodov, S. A.; Laskin, A.; Laskin, J. AnApproach toward Quantification of Organic Compounds in ComplexEnvironmental Samples Using High-Resolution Electrospray Ioniza-tion Mass Spectrometry. Anal. Methods 2013, 5, 72−80.(52) Wangberg, I.; Barnes, I.; Becker, K. H. Product and MechanisticStudy of the Reaction of NO3 Radicals with α-Pinene. Environ. Sci.Technol. 1997, 31, 2130−2135.(53) Heaton, K. J.; Dreyfus, M. A.; Wang, S.; Johnston, M. V.Oligomers in the Early Stage of Biogenic Secondary Organic AerosolFormation and Growth. Environ. Sci. Technol. 2007, 41, 6129−6136.
(54) Baltensperger, U.; Kalberer, M.; Dommen, J.; Paulsen, D.;Alfarra, M. R.; Coe, H.; Fisseha, R.; Gascho, A.; Gysel, M.; Nyeki, S.;et al. Secondary Organic Aerosols from Anthropogenic and BiogenicPrecursors. Faraday Discuss. 2005, 130, 265−278.(55) Reinhardt, A.; Emmenegger, C.; Gerrits, B.; Panse, C.;Dommen, J.; Baltensperger, U.; Zenobi, R.; Kalberer, M. UltrahighMass Resolution and Accurate Mass Measurements as a Tool toCharacterize Oligomers in Secondary Organic Aerosols. Anal. Chem.2007, 79, 4074−4082.(56) Tolocka, M. P.; Jang, M.; Ginter, J. M.; Cox, F. J.; Kamens, R.M.; Johnston, M. V. Formation of Oligomers in Secondary OrganicAerosol. Environ. Sci. Technol. 2004, 38, 1428−1434.(57) Gao, Y. Q.; Hall, W. A.; Johnston, M. V. Molecular Compositionof Monoterpene Secondary Organic Aerosol at Low Mass Loading.Environ. Sci. Technol. 2010, 44, 7897−7902.(58) Glasius, M.; Duane, M.; Larsen, B. R. Determination of PolarTerpene Oxidation Products in Aerosols by Liquid Chromatography-Ion Trap Mass Spectrometry. J. Chromatogr. A 1999, 833, 121−135.(59) Kahnt, A.; Iinuma, Y.; Mutzel, A.; Boge, O.; Claeys, M.;Herrmann, H. Campholenic Aldehyde Ozonolysis: A MechanismLeading to Specific Biogenic Secondary Organic Aerosol Constituents.Atmos. Chem. Phys. 2014, 14, 719−736.(60) Winterhalter, R.; Dingenen, R.; Van Larsen, B. R.; Jensen, N. R.;Hjorth, J. LC-MS Analysis of Aerosol Particles from the Oxidation ofα-Pinene by Ozone and OH-Radicals. Atmos. Chem. Phys. Discuss.2003, 3, 1−39.(61) Iinuma, Y.; Boge, O.; Miao, Y.; Sierau, B.; Gnauk, T.; Herrmann,H. Laboratory Studies on Secondary Organic Aerosol Formation fromTerpenes. Faraday Discuss. 2005, 130, 279−294.(62) Venkatachari, P.; Hopke, P. K. Characterization of ProductsFormed in the Reaction of Ozone with α-Pinene: Case for OrganicPeroxides. J. Environ. Monit. 2008, 10, 966−974.(63) Camredon, M.; Hamilton, J. F.; Alam, M. S.; Wyche, K. P.; Carr,T.; White, I. R.; Monks, P. S.; Rickard, A. R.; Bloss, W. J. Distributionof Gaseous and Particulate Organic Composition during Dark α-Pinene Ozonolysis. Atmos. Chem. Phys. 2010, 10, 2893−2917.(64) Putman, A. L.; Offenberg, J. H.; Fisseha, R.; Kundu, S.; Rahn, T.A.; Mazzoleni, L. R. Ultrahigh-Resolution FT-ICR Mass SpectrometryCharacterization of α-Pinene Ozonolysis SOA. Atmos. Environ. 2012,46, 164−172.(65) Muller, L.; Reinnig, M.; Hayen, H.; Hoffmann, T. Character-ization of Oligomeric Compounds in Secondary Organic AerosolUsing Liquid Chromatography Coupled to Electrospray IonizationFourier Transform Ion Cyclotron Resonance Mass Spectrometry.Rapid Commun. Mass Spectrom. 2009, 23, 971−979.(66) Kristensen, K.; Watne, Å. K.; Hammes, J.; Lutz, A.; Petaja, T.;Hallquist, M.; Bilde, M.; Glasius, M. High-Molecular Weight DimerEsters Are Major Products in Aerosols from α-Pinene Ozonolysis andthe Boreal Forest. Environ. Sci. Technol. Lett. 2016, 3, 280−285.(67) Beck, M.; Hoffmann, T. A Detailed MSN Study for theMolecular Identification of a Dimer Formed from Oxidation of Pinene.Atmos. Environ. 2016, 130, 120−126.(68) Kristensen, K.; Cui, T.; Zhang, H.; Gold, A.; Glasius, M.;Surratt, J. D. Dimers in α-Pinene Secondary Organic Aerosol: Effect ofHydroxyl Radical, Ozone, Relative Humidity and Aerosol Acidity.Atmos. Chem. Phys. 2014, 14, 4201−4218.(69) Yasmeen, F.; Vermeylen, R.; Szmigielski, R.; Iinuma, Y.; Boge,O.; Herrmann, H.; Maenhaut, W.; Claeys, M. Terpenylic Acid andRelated Compounds: Precursors for Dimers in Secondary OrganicAerosol from the Ozonolysis of α-and β-Pinene. Atmos. Chem. Phys.2010, 10, 9383−9392.(70) Noziere, B.; Kalberer, M.; Claeys, M.; Allan, J.; D’Anna, B.;Decesari, S.; Finessi, E.; Glasius, M.; Grgic, I.; Hamilton, J. F.; et al.The Molecular Identification of Organic Compounds in theAtmosphere: State of the Art and Challenges. Chem. Rev. 2015, 115,3919−3983.(71) Beck, M.; Winterhalter, R.; Herrmann, F.; Moortgat, G. K. TheGas-Phase Ozonolysis of α-Humulene. Phys. Chem. Chem. Phys. 2011,13, 10970−11001.
The Journal of Physical Chemistry A Article
DOI: 10.1021/acs.jpca.6b10900J. Phys. Chem. A 2017, 121, 1298−1309
1308
(72) Jaoui, M.; Kamens, R. M. Gas and Particulate ProductsDistribution from the Photooxidation of α-Humulene in the Presenceof NOx, Natural Atmospheric Air and Sunlight. J. Atmos. Chem. 2003,46, 29−54.(73) Ng, N. L.; Kroll, J. H.; Keywood, M. D.; Bahreini, R.;Varutbangkul, V.; Flagan, R. C.; Seinfeld, J. H.; Lee, A.; Goldstein, A.H. Contribution of First- versus Second-Generation Products toSecondary Organic Aerosols Formed in the Oxidation of BiogenicHydrocarbons. Environ. Sci. Technol. 2006, 40, 2283−2297.(74) Aiken, A. C.; Decarlo, P. F.; Kroll, J. H.; Worsnop, D. R.;Huffman, J. A.; Docherty, K. S.; Ulbrich, I. M.; Mohr, C.; Kimmel, J.R.; Sueper, D.; et al. O/C and OM/OC Ratios of Primary, Secondary,and Ambient Organic Aerosols with High-Resolution Time-of-FlightAerosol Mass Spectrometry. Environ. Sci. Technol. 2008, 42, 4478−4485.(75) Brinkmann, T.; Horsch, P.; Sartorius, D.; Frimmel, F. H.Photoformation of Low-Molecular-Weight Organic Acids from BrownWater Dissolved Organic Matter. Environ. Sci. Technol. 2003, 37,4190−4198.(76) Kujawinski, E. B.; Del Vecchio, R.; Blough, N. V.; Klein, G. C.;Marshall, A. G. Probing Molecular-Level Transformations of DissolvedOrganic Matter: Insights on Photochemical Degradation andProtozoan Modification of DOM from Electrospray Ionization FourierTransform Ion Cyclotron Resonance Mass Spectrometry. Mar. Chem.2004, 92, 23−37.(77) Romonosky, D. E.; Nguyen, L. Q.; Shemesh, D.; Nguyen, T. B.;Epstein, S. A.; Martin, D. B. C.; Vanderwal, C. D.; Gerber, R. B.;Nizkorodov, S. A. Absorption Spectra and Aqueous Photochemistry ofβ-Hydroxyalkyl Nitrates of Atmospheric Interest. Mol. Phys. 2015, 113,2179−2190.(78) Muller, J.-F.; Peeters, J.; Stavrakou, T. Fast Photolysis ofCarbonyl Nitrates from Isoprene. Atmos. Chem. Phys. 2014, 14, 2497−2508.(79) Darer, A. I.; Cole-Filipiak, N. C.; O’Connor, A. E.; Elrod, M. J.Formation and Stability of Atmospherically Relevant Isoprene-DerivedOrganosulfates and Organonitrates. Environ. Sci. Technol. 2011, 45,1895−1902.(80) Hu, K. S.; Darer, A. I.; Elrod, M. J. Thermodynamics andKinetics of the Hydrolysis of Atmospherically Relevant Organonitratesand Organosulfates. Atmos. Chem. Phys. 2011, 11, 8307−8320.(81) Liu, S.; Shilling, J. E.; Song, C.; Hiranuma, N.; Zaveri, R. A.;Russell, L. M. Hydrolysis of Organonitrate Functional Groups inAerosol Particles. Aerosol Sci. Technol. 2012, 46, 1359−1369.(82) Badali, K. M.; Zhou, S.; Aljawhary, D.; Antinolo, M.; Chen, W.J.; Lok, A.; Mungall, E.; Wong, J. P. S.; Zhao, R.; Abbatt, J. P. D.Formation of Hydroxyl Radicals from Photolysis of Secondary OrganicAerosol Material. Atmos. Chem. Phys. 2015, 15, 7831−7840.(83) Tong, H.; Arangio, A. M.; Lakey, P. S. J.; Berkemeier, T.; Liu, F.;Kampf, C. J.; Brune, W. H.; Poschl, U.; Shiraiwa, M. Hydroxyl Radicalsfrom Secondary Organic Aerosol Decomposition in Water. Atmos.Chem. Phys. 2016, 16, 1761−1771.(84) Aljawhary, D.; Zhao, R.; Lee, A. K. Y.; Wang, C.; Abbatt, J. P. D.Kinetics, Mechanism, and Secondary Organic Aerosol Yield ofAqueous Phase Photo-Oxidation of α-Pinene Oxidation Products. J.Phys. Chem. A 2016, 120, 1395−1407.(85) Chacon-Madrid, H. J.; Donahue, N. M. Fragmentation vs.Functionalization: Chemical Aging and Organic Aerosol Formation.Atmos. Chem. Phys. 2011, 11, 10553−10563.(86) Kroll, J. H.; Smith, J. D.; Che, D. L.; Kessler, S. H.; Worsnop, D.R.; Wilson, K. R. Measurement of Fragmentation and Functionaliza-tion Pathways in the Heterogeneous Oxidation of Oxidized OrganicAerosol. Phys. Chem. Chem. Phys. 2009, 11, 8005−8014.(87) Lambe, A. T.; Onasch, T. B.; Croasdale, D. R.; Wright, J. P.;Martin, A. T.; Franklin, J. P.; Massoli, P.; Kroll, J. H.; Canagaratna, M.R.; Brune, W. H. Transitions from Functionalization to FragmentationReactions of Laboratory Secondary Organic Aerosol (SOA) Generatedfrom the OH Oxidation of Alkane Precursors. Environ. Sci. Technol.2012, 46, 5430−5437.
(88) Perraud, V.; Bruns, E. A.; Ezell, M. J.; Johnson, S. N.; Yu, Y.;Alexander, M. L.; Zelenyuk, A.; Imre, D.; Chang, W. L.; Dabdub, D.Nonequilibrium Atmospheric Secondary Organic Aerosol Formationand Growth. Proc. Natl. Acad. Sci. U. S. A. 2012, 109, 2836−2841.(89) Lee, B. H.; Mohr, C.; Lopez-Hilfiker, F. D.; Lutz, A.; Hallquist,M.; Lee, L.; Romer, P.; Cohen, R. C.; Iyer, S.; Kurten, T. HighlyFunctionalized Organic Nitrates in the Southeast United States:Contribution to Secondary Organic Aerosol and Reactive NitrogenBudgets. Proc. Natl. Acad. Sci. U. S. A. 2016, 113, 1516−1521.(90) Malecha, K. T.; Nizkorodov, S. A. Photodegradation ofSecondary Organic Aerosol Particles as a Source of Small, OxygenatedVolatile Organic Compounds. Environ. Sci. Technol. 2016, 50, 9990−9997.(91) Lignell, H.; Hinks, M. L.; Nizkorodov, S. A. Exploring MatrixEffects on Photochemistry of Organic Aerosols. Proc. Natl. Acad. Sci.U. S. A. 2014, 111, 13780−13785.(92) Hinks, M. L.; Brady, M. V.; Lignell, H.; Song, M.; Grayson, J.W.; Bertram, A. K.; Lin, P.; Laskin, A.; Laskin, J.; Nizkorodov, S. A.Effect of Viscosity on Photodegradation Rates in Complex SecondaryOrganic Aerosol Materials. Phys. Chem. Chem. Phys. 2016, 18, 8785−8793.(93) Lee, A. K. Y.; Zhao, R.; Gao, S. S.; Abbatt, J. P. D. Aqueous-Phase OH Oxidation of Glyoxal: Application of a Novel AnalyticalApproach Employing Aerosol Mass Spectrometry and Complementaryoff-Line Techniques. J. Phys. Chem. A 2011, 115, 10517−10526.(94) Tan, Y.; Carlton, A. G.; Seitzinger, S. P.; Turpin, B. J. SOA fromMethylglyoxal in Clouds and Wet Aerosols: Measurement andPrediction of Key Products. Atmos. Environ. 2010, 44, 5218−5226.(95) Waxman, E. M.; Dzepina, K.; Ervens, B.; Lee-Taylor, J.;Aumont, B.; Jimenez, J. L.; Madronich, S.; Volkamer, R. SecondaryOrganic Aerosol Formation from Semi-and Intermediate-volatilityOrganic Compounds and Glyoxal: Relevance of O/C as a Tracer forAqueous Multiphase Chemistry. Geophys. Res. Lett. 2013, 40, 978−982.
The Journal of Physical Chemistry A Article
DOI: 10.1021/acs.jpca.6b10900J. Phys. Chem. A 2017, 121, 1298−1309
1309