Ultra-violet absorption spectra and π-electron structures of nitromethane and the nitromethyl anion
12
This article was downloaded by: [UZH Hauptbibliothek / Zentralbibliothek Zürich] On: 10 July 2014, At: 12:47 Publisher: Taylor & Francis Informa Ltd Registered in England and Wales Registered Number: 1072954 Registered office: Mortimer House, 37-41 Mortimer Street, London W1T 3JH, UK Molecular Physics: An International Journal at the Interface Between Chemistry and Physics Publication details, including instructions for authors and subscription information: http://www.tandfonline.com/loi/tmph20 Ultra-violet absorption spectra and π- electron structures of nitromethane and the nitromethyl anion Saburo Nagakura a b c a Laboratory of Molecular Structure and Spectra, Department of Physics , the University of Chicago b The Institute for Solid State Physics, The University of Tokyo c The Institute for Solid State Physics, The University of Tokyo , Meguro- ku, Tokyo Published online: 23 Aug 2006. To cite this article: Saburo Nagakura (1960) Ultra-violet absorption spectra and π-electron structures of nitromethane and the nitromethyl anion, Molecular Physics: An International Journal at the Interface Between Chemistry and Physics, 3:2, 152-162, DOI: 10.1080/00268976000100171 To link to this article: http://dx.doi.org/10.1080/00268976000100171 PLEASE SCROLL DOWN FOR ARTICLE Taylor & Francis makes every effort to ensure the accuracy of all the information (the “Content”) contained in the publications on our platform. However, Taylor & Francis, our agents, and our licensors make no representations or warranties whatsoever as to the accuracy, completeness, or suitability for any purpose of the Content. Any opinions and views expressed in this publication are the opinions and views of the authors, and are not the views of or endorsed by Taylor & Francis. The accuracy of the Content should not be relied upon and should be independently verified with primary sources of information. Taylor and Francis shall not be liable for any losses, actions, claims, proceedings, demands, costs, expenses, damages, and other liabilities whatsoever or howsoever caused arising directly or indirectly in connection with, in relation to or arising out of the use of the Content. This article may be used for research, teaching, and private study purposes. Any substantial or systematic reproduction, redistribution, reselling, loan, sub-licensing, systematic supply, or distribution in any form to anyone is expressly forbidden. Terms & Conditions of access and use can be found at http://www.tandfonline.com/page/terms-and-conditions
Transcript of Ultra-violet absorption spectra and π-electron structures of nitromethane and the nitromethyl anion
This article was downloaded by: [UZH Hauptbibliothek / Zentralbibliothek Zürich]On: 10 July 2014, At: 12:47Publisher: Taylor & FrancisInforma Ltd Registered in England and Wales Registered Number: 1072954 Registered office:Mortimer House, 37-41 Mortimer Street, London W1T 3JH, UK
Molecular Physics: An International Journalat the Interface Between Chemistry andPhysicsPublication details, including instructions for authors and subscriptioninformation:http://www.tandfonline.com/loi/tmph20
Ultra-violet absorption spectra and π-electron structures of nitromethane andthe nitromethyl anionSaburo Nagakura a b ca Laboratory of Molecular Structure and Spectra, Department ofPhysics , the University of Chicagob The Institute for Solid State Physics, The University of Tokyoc The Institute for Solid State Physics, The University of Tokyo , Meguro-ku, TokyoPublished online: 23 Aug 2006.
To cite this article: Saburo Nagakura (1960) Ultra-violet absorption spectra and π-electron structuresof nitromethane and the nitromethyl anion, Molecular Physics: An International Journal at the InterfaceBetween Chemistry and Physics, 3:2, 152-162, DOI: 10.1080/00268976000100171
To link to this article: http://dx.doi.org/10.1080/00268976000100171
PLEASE SCROLL DOWN FOR ARTICLE
Taylor & Francis makes every effort to ensure the accuracy of all the information (the“Content”) contained in the publications on our platform. However, Taylor & Francis, ouragents, and our licensors make no representations or warranties whatsoever as to theaccuracy, completeness, or suitability for any purpose of the Content. Any opinions and viewsexpressed in this publication are the opinions and views of the authors, and are not the viewsof or endorsed by Taylor & Francis. The accuracy of the Content should not be relied uponand should be independently verified with primary sources of information. Taylor and Francisshall not be liable for any losses, actions, claims, proceedings, demands, costs, expenses,damages, and other liabilities whatsoever or howsoever caused arising directly or indirectly inconnection with, in relation to or arising out of the use of the Content.
This article may be used for research, teaching, and private study purposes. Any substantialor systematic reproduction, redistribution, reselling, loan, sub-licensing, systematic supply, ordistribution in any form to anyone is expressly forbidden. Terms & Conditions of access anduse can be found at http://www.tandfonline.com/page/terms-and-conditions
Ultra-violet absorption spectra and ~-electron structures of nitromethane and the nitromethyl aniont
b y S A B U R O N A G A K U R A ~
L a b o r a t o r y of M o l e c u l a r S t r u c t u r e a n d Spec t ra , D e p a r t m e n t of Phys ics , t h e U n i v e r s i t y of Ch icago and t h e I n s t i t u t e for So l id S ta te Phys ics ,
t he U n i v e r s i t y of T o k y o
Received 30 September 1959)
The uitra-vlolet absorption spectrum of nitromethane was measured under various conditions. Besides the weak band at 270 m/x, a strong band, which may be regarded as due to the longest wavelength ~r--~vr* transition band, was observed at 198 m/x in the gaseous state. Further, the absorption spectrum of nitromethane was measured in aqueous solutions with several different pH values, and a strong band was observed at 233 m/*. From the fact that the p K a value evaluated on the basis of the ptt dependence of the absorption intensity is equal to that obtained electrometrically, it was concluded that the 233 m/, band is to be ascribed to the nitromethyl anion (H~C-NO2). This band was found to shift to 238 m/x in alcoholic KOH solution.
The ~r-electron structure of the anion was studied theoretically by taking into account configuration interaction in terms of the ground, charge transfer, and locally excited configurations. I t is shown that the 233 m/x band of the anion may be interpreted as an intramolecular charge-transfer absorption involving a large electron transfer from CH~- tox~ard NO~. It is suggested that electron donating substituent groups like NH2, OH, and CH2- should cause the 198 m/x band of the nitro group to shift toward shorter wavelengths, in marked contrast to the case of substituted benzene molecules Iike aniline and phenol.
1. INTRODUCTION
I t has been wel l r e c o g n i z e d tha t a l ipha t i c n i t ro c o m p o u n d s like n i t r o m e t h a n e exh ib i t some in t e r e s t i ng p r o p e r t i e s f rom b o t h phys i ca l and chemica l p o i n t s of view. T h e s e mo lecu le s are gene ra l ly r e p r e s e n t e d b y a r e sonance h y b r i d b e t w e e n the two fo l lowing s t ruc tu res , and t h e y have an u n u s u a l l y large d ipo le m o m e n t ( 3 . 5 ~ 3 - 8 D ) [1] :
O O -
R - - N ~- +- > R - - N -
O - 0
F u r t h e r , c o n c e r n i n g the u l t r a -v io l e t a b s o r p t i o n spec t r a of these n i t ro c o m p o u n d s , a w e a k b a n d at 270 m/ , has been ex tens ive ly s t ud i ed by severa l au tho r s [2, 3, 4, 5, 6] a n d r ea sonab ly ass igned to an n~>rr* t r ans i t i on . H o w e v e r , no s t rong b a n d w h i c h
t This work was assisted bv the Office of Ordnance Research Under Project TB24)001 (505) of Contract D A - 1 1 - 0 2 2 - O R D 1002 with the Unix ersity of Chicago.
$ Permanent address: The Institute for Solid State Physics, The University of Tokyo, Meguro-ku, Tokyo.
Dow
nloa
ded
by [
UZ
H H
aupt
bibl
ioth
ek /
Zen
tral
bibl
ioth
ek Z
üric
h] a
t 12:
47 1
0 Ju
ly 2
014
Absorption spectra of nitromethane and the nitromethyl anion 153
can be associated with the allowed ~r-+Tr* transition has ever been observed with simple nitroalkanes t . In the present study of the ultra-violet absorption spectrum of nitromethane, the author found a new band whose molar extinction coefficient is about 5000 and which may safely be assigned to the allowed ~r-~r* transition.
From the chemical point of view, aliphatic nitro compounds are well known to be typical carbon acids (pseudo-acids). That is to say, they show acid dis- sociation represented by the following equation~ [8] :
RH2C--NO2 ~ [ R H C - - N O 2 ] - + H +.
The acid dissociation constant (pKa) of nitromethane has been determined as 10.2 at 25 ~ by the aid of electrometric measurement [8]. Since the nitromethyl anion, the ionization product, is isoelectronic with nitramide (H2N--NO~) whose strong band at 243 m/~ has been shown to be satisfactorily explained as an intramolecular charge transfer absorption [9], it seems interesting to compare the absorption spectra of these two entities. Furthermore, as was pointed out by Leftter [10], electronic structures of anions of this kind are important in discussing the relationship between the equilibrium constant and the rate constant for the acid dissociation reactions of several nitroalkane molecules. Under these circumstances, it was undertaken to measure the ultra-violet absorption spectrum of the nitromethyl anion and to make some theoretical study of its electronic structure.
2. EXPERIMENTAL
2.1. Materials Commercial nitromethane was dried with calcium chloride. Before use it
was fractionally distilled (b.p. 101 ~ 102~ Methanol used as a solvent was dried by the use of magnesium foil activated by iodine, and then fractionally distilled. The buffer solutions were Fisher Certified Reagent, Standard Buffer Solution.
2.2. Measurement Most of the near ultra-violet absorption spectra were measured with a Beckman
spectrophotometer model DU. The measurements of the absorption spectra in the wavelength region 2300~ to 1900A were made with a Cary self-recording spectrophotometer model 14, using a set of special fused silica cells especially transparent to ultra-violet light below 2000 $. In both instruments the tempera- ture of the cell compartment was kept constant during the measurement by circulating water at a constant temperature.
3. EXPERIMENTAL RESULTS
3.1. Ultra-violet absorption spectrum of nitromethane The ultra-violet absorption spectrum of nitromethane was measured in the
gaseous state and in aqueous and alcoholic solutions. The results are shown in
J-NIatsen stated that nitromethane exhibits a strong band at 210m/x. However, the data to which he referred show no definite absorption maximum (see reference [5]).
Hantzsch believed that the ionization of nitromethane could not take place directly,
( "~ N + f O H ) . However, it but only by the intermediate formation of the aci-form H2 ~ = ~ O _
is now believed that the ionization occurs by a single step, as above. Concerning this problem, see reference [7].
M.P. L
Dow
nloa
ded
by [
UZ
H H
aupt
bibl
ioth
ek /
Zen
tral
bibl
ioth
ek Z
üric
h] a
t 12:
47 1
0 Ju
ly 2
014
154 S. Nagakura
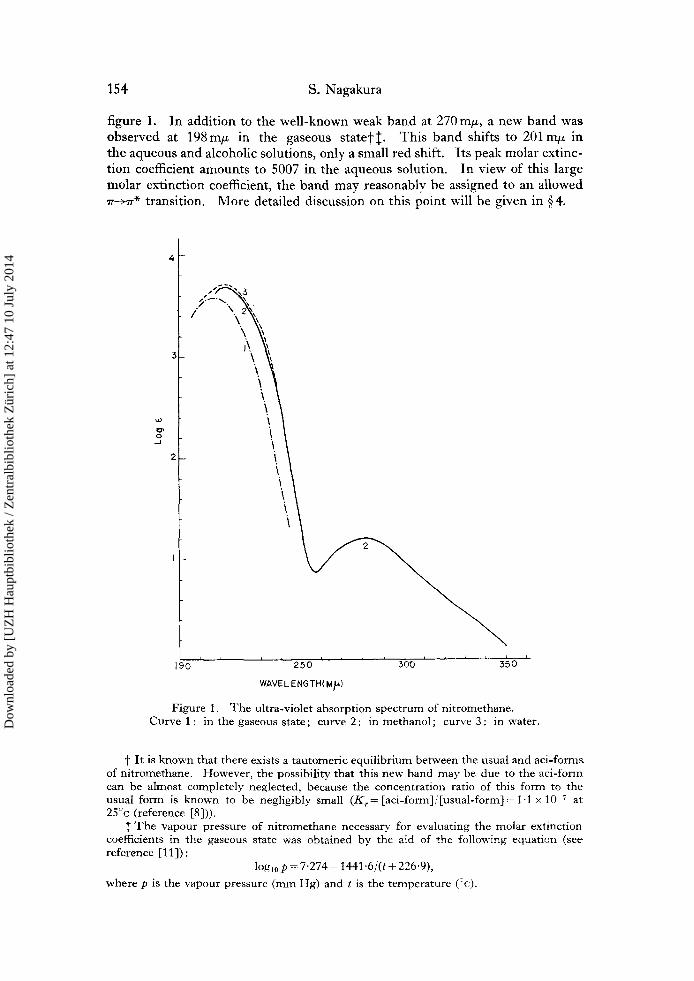
figure 1. In addition to the well-known weak band at 270 m/~, a new band was observed at 198mF in the gaseous statet~. This band shifts to 201 m/~ in the aqueous and alcoholic solutions, only a small red shift, its peak molar extinc- tion coefficient amounts to 5007 in the aqueous solution. In view of this large molar extinction coefficient, the band may reasonably be assigned to an allowed ~r-~* transition. More detailed discussion on this point will be given in w 4.
4
3
o2 2
19o . . . . 2 ~ o ' ' ' ~bo . . . . 3 ~ o '
WAVE LENGTH(I~1~-)
Figure 1. T h e ul t ra-viole t absorp t ion spec t rum of n i t romethane . Curve 1 : in the gaseous s ta te ; curve 2: in m e t h a n o l ; curve 3 : in water.
t I t is k n o w n tha t there exists a t au tomer i c equ i l ib r ium be tween the usual and ac i - forms of n i t romethane . However , the possibility, t ha t this new band may be due to the aci- form can be a lmost complete ly neglected, because the concen t ra t ion ratio of this fo rm to the usual fo rm is known to be negl igibly small ( K r = [ac i - form] / [usua l - form] = 1-1 • 10 v at 25~ (reference [8])).
T h e vapour pressure of n i t r o m e t h a n e necessary." for evaluat ing the mola r ext inct ion coefficients in the gaseous state was ob ta ined by the aid of the fol lowing equa t ion (see reference [11]) :
log10 p = 7"274 - 1441"6/(t + 226"9),
whe re p is the vapour pressure ( ram Hg) and t is the t empera tu re (~c).
Dow
nloa
ded
by [
UZ
H H
aupt
bibl
ioth
ek /
Zen
tral
bibl
ioth
ek Z
üric
h] a
t 12:
47 1
0 Ju
ly 2
014
Absorption spectra of nitromethane and the nitromethyl anion 155
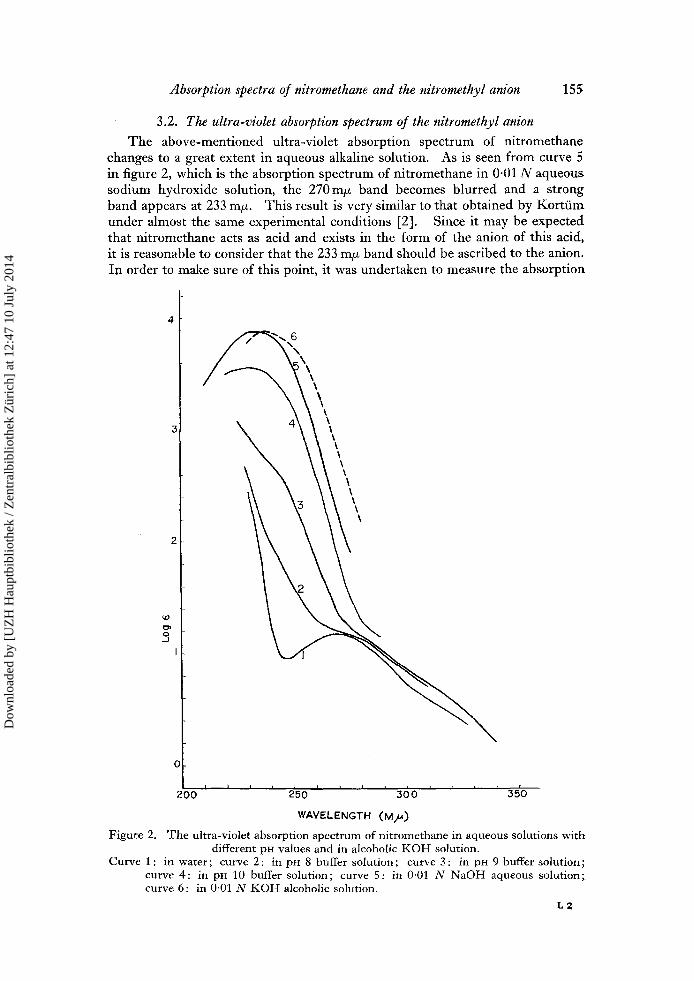
3.2. The ultra-violet absorption spectrum of the nitromethyl anion
The above-mentioned ultra-violet absorption spectrum of nitromethane changes to a great extent in aqueous alkaline solution. As is seen from curve 5 in figure 2, which is the absorption spectrum of nitromethane in 0.01 N aqueous sodium hydroxide solution, the 270m/x band becomes blurred and a strong band appears at 233 m F. This result is very similar to that obtained by Kortfim under almost the same experimental conditions [2]. Since it may be expected that nitromethane acts as acid and exists in the form of the anion of this acid, it is reasonable to consider that the 233 mF band should be ascribed to the anion. In order to make sure of this point, it was undertaken to measure the absorption
I
\ 4
".6
\ ",,
\
\
I , , , , , , , ' 3 ~ 0 . . . . 3 ~ 0 200 250
WAVELENGTH (M/,,)
Figure 2. T h e ultra-violet absorpt ion spec t rum of n i t romethane in aqueous solutions wi th different pH values and in alcoholic K O H solution.
Curve 1 : in water ; curve 2 : in pI~ 8 buffer solution ; curve 3 : in pH 9 buffer so lu t ion; curve 4: in pH 10 buffer solution; curve 5: in 0.01 N N a O H aqueous solut ion; curve 6 : in 0-01 N K O H alcoholic solution.
L 2
Dow
nloa
ded
by [
UZ
H H
aupt
bibl
ioth
ek /
Zen
tral
bibl
ioth
ek Z
üric
h] a
t 12:
47 1
0 Ju
ly 2
014
156 S. Nagakura
spectrum of nitromethane in buffer solutions with different pH values ranging from 6 to 10 and to obtain quantitative information on the dependence of 233 m/x band intensity on the pH value of the solution]-. The results are shown in figure 2. From the absorption curves given in this figure, the acid dissociation ,constant (pK,) of nitromethane was determined as 10-1 at 25~ This value is in fairly good agreement with that determined by the electrometric measurement (10-21 at 25~ This fact furnishes substantial evidence that the 233 m/x band observed in the present investigation is due to the nitromethyl anion.
A similar experiment was carried out with an alcoholic potassium hydroxide solution of nitromethane, for the purpose of obtaining some information about the solvent effect upon the absorption spectrum of the anion. As is seen from ,curve 6 in figure 2, the strong band of the anion appears at 238 m/, in the alcoholic ,solution.
4 . THEORETICAL CONSIDERATIONS ON THE ELECTRONIC STRUCTURE OF THE NITRO-
METHYL ANION
In the previous papers [9, 13], it was shown that a number of strong absorption bands observed with a series of compounds containing the nitro or the carbonyl group as electron acceptor can be regarded as due to intramolecular charge transfer absorptionw [14] : namely, as due to a transition involving a large electron transfer from an electron donor toward an electron acceptor. From this point of view, peak absorption wavelengths and intensities of a series of strong bands observed with nitramide, nitrobenzene, nitroethylene, p-nitrophenol, etc. could be interpreted at least senfiquantitatively with the aid of the simple LCMO method.
Moreover, from the experimental point of view, some interesting results have been obtained on this problem. For example, Tanaka has measured the polarized ultra-violet absorption spectrum of a single crystal of p-nitroaniline [15]. Combining his result with x-ray crystal analysis data, it was concluded that the transition moment corresponding to the 370 m/x band ofp-nitroaniline is directed parallel to the molecular axis joining the two nitrogen atoms. This is what may be expected if the band is an intramolecular charge transfer absorption including a large electron transfer from the amino group to the nitro group. On the other
]" T h e ion is no t stable and the absorp t ion spec t rum changes wi th t ime. T h i s change is -conspicuous in solut ions of h igh concen t ra t ion in the n i t r o m e t h a n e anion. T h i s is because the anions react wi th each o ther to form methayona te ions, O2NCH.aCHNO- (see reference [12]). However , in such di lute solut ions as are used in the present measurement s , it is fa i r ly stable, at least enough so to give reproducib le results. Fur ther , the above -men t ioned change in the absorp t ion spec t rum caused by add ing alkali is complete ly reversible. W h e n the solut ion was neutra l ized wi th hydrochlor ic acid wi th in 30 min after preparat ion, the a b s o r p t i o n spec t rum of the solut ion complete ly re tu rned to tha t of the n i t r o m e t h a n e molecule .
T h e pK, value can be represen ted by the following equat ion : pK,, = pH -- Iog[H2C NOe] [HaCNO2]
where [CHaNOe] and [Cti-,_,_NO_~] are the concent ra t ions of n i t r o m e t h a n e and of its an ion respect ively in the solut ion of a fixed pH value. W i t h the aid of absorp t ion curves 1 and 5 and an absorpt ion curve for a solution of fixed pH, [CHaNO2] [CH_, NO2] in the above equa t i on can be de termined. T h e above pK~, value is the average obta ined on the basis of the absorp t ion curves for the solutions of pH values 8, 9 and 10.
w T h i s t e rminology was given in analogy wi th _Mulliken's for the case of molecular comp lex format ion between electron donor and acceptor.
Dow
nloa
ded
by [
UZ
H H
aupt
bibl
ioth
ek /
Zen
tral
bibl
ioth
ek Z
üric
h] a
t 12:
47 1
0 Ju
ly 2
014
Absorption spectra of nitromethane and the nitromethyl anion 157
hand, if the band were a shifted 260 m/~ band of benzene, the direction of the transition moment should be perpendicular to the molecular axis in the r ing plane.
Since the ni t romethane anion is undoubtedly isoelectronic with nitramide, it may reasonably be supposed that the 233 m/~ band of the former corresponds to the 225 m/~ band [16] of the latter, and that both of them can be interpreted as due to intramolecular charge transfer absorption. However, there is a possi- bility of an alternative interpretation, namely that the band under consideration is a shifted 198 m/z band of the nitro group. Such a red shift caused by art electron- donating substi tuent group (in this case CH2- ) has been observed with various aromatic compounds like aniline and phenol [17]. However, theoretical considera- tions described below indicate that the 198 m/z band of the nitro group should shift toward shorter wavelengths as the result of interaction with a subst i tuent group such as the amino or CH 2- group.
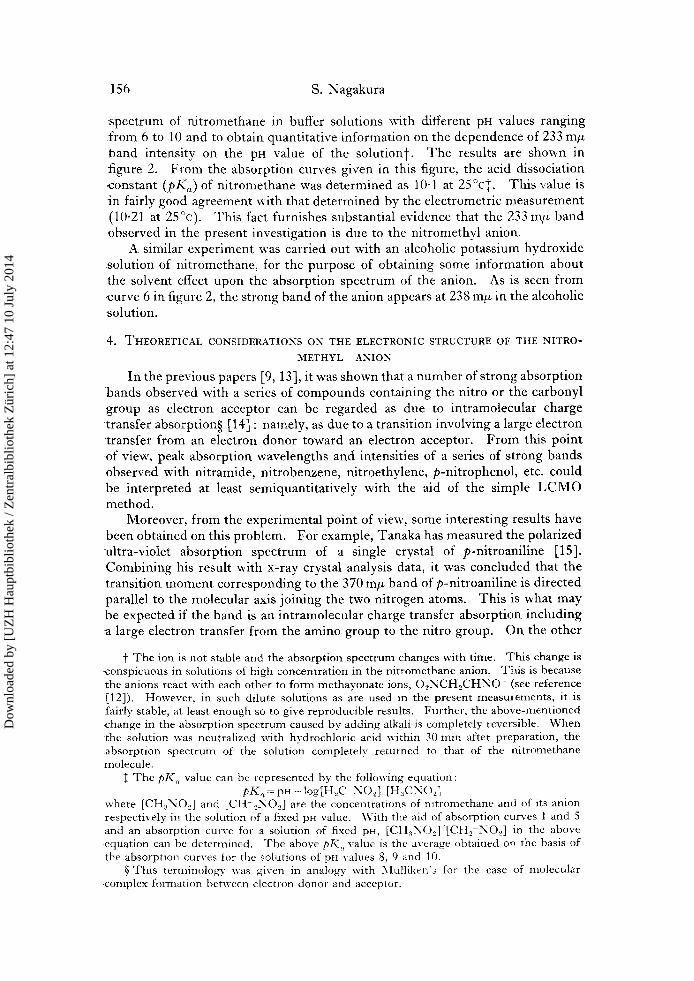
First let us consider the ~-electron structure of the nitro group. According: to calculations made by Tanaka using Roothaan's LCA O SCF method [18] combined with Pariser and Parr ' s method [19], the 7r-electron molecular orbitals of this group are as shown in table 1.
Symmetryt
b~ a2 b~
Energy (ev)
E 0 = - 1 8 - 8 6
E1 = - 15'63 E2 = 0"40
Wave function~
r = 0.7133X~ + 0.7009(Xol r = (Xol - Xo,)/ ~/2 r = 0"7009XN- 0.7133(Xol
+ xo)/~/2
+ xo) /~2
Wave functions and energy values of nitro group ~-electron orbitals calculated for nitromethane [20].
"~ The symmetry of the nitro group is C~v. XI~-, Xol and Xo, are 2p~r atomic orbitals of the nitrogen atom and the oxygen atoms
1 and 2, respectively.
Since, in the ground state, the two orbitals E 0 and E 1 are filled, the transition between E 1 and E 2 orbitals may be expected to be associated with the longest wavelength ~-+Tr* transition band, which was found at 198 m~. Consideration of the absorption intensity of this band from both experimental and theoretical points of view supports this assignment. T h e oscillator strength is calculated as 0.38 and 0-06 for the E1-->E 2 and Eo-+E 2 transitions, respectively [20]. On the other hand, f rom the absorption curve of ni t romethane in aqueous solution (curve 3 in figure 1), the measured oscillator strength is 0-18. Taking into account that the calculated value of this quantity is usually larger than the observed, it seems reasonable to assign the 198 m/, band to the EI-+E 2 transition.
Now let us turn to the electronic structure of the ni tromethyl anion. If one regards this ion as constructed from the electron donor CN~- and the electron acceptor NO2, and if the atoms are all coplanar, with overall symmetry C2v , as seems very probable, the 7r-electron structure of the system as a whole can be described on the basis of the orbitals of the component groups by considering the resonance, inductive, and electron interaction effects. As pointed out by Murrel l and Longuet-Higgins [21], these effects can be evaluated in terms of configuration interaction among the electron configurations which are schematically shown
Dow
nloa
ded
by [
UZ
H H
aupt
bibl
ioth
ek /
Zen
tral
bibl
ioth
ek Z
üric
h] a
t 12:
47 1
0 Ju
ly 2
014
158 S. Nagakura
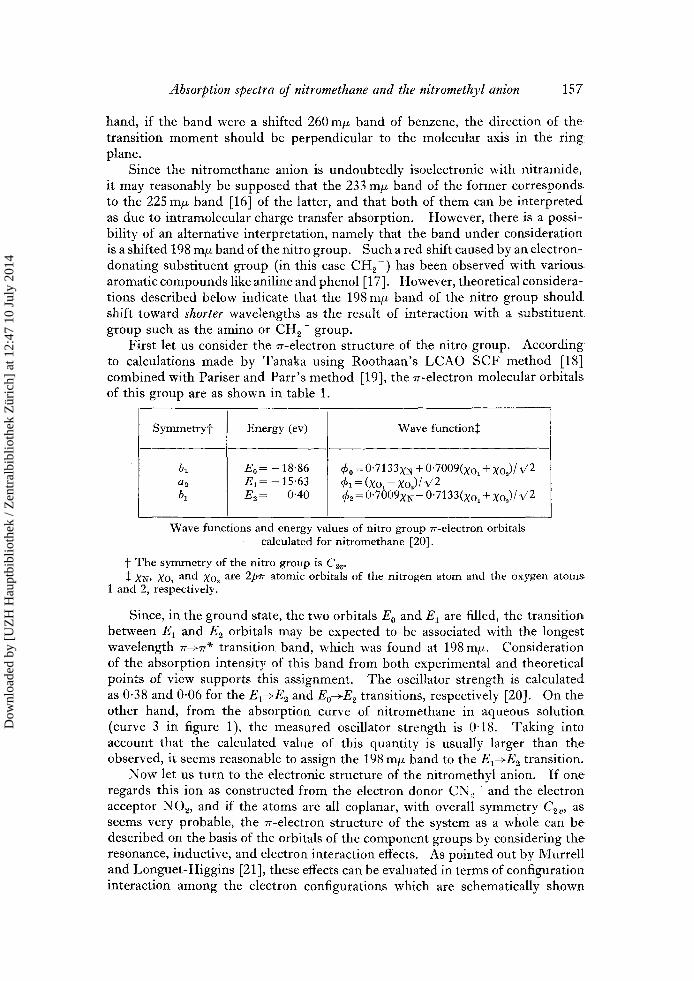
in figure 3]-. The configurations (A) and (B) in this figure represent the ground and charge-transfer configurations, and the configurations (C) and (D) the locally excited ones.
---O-- --O-- --O--- -O-O- --O-- -O-O- -O-O- C H2 C H,',; C H~ C H2
-OO- -O-O- ---O--- -O-O-
-O-O- -O-O- -O-O- --O-- N 0~ N0z N 0a N Oa
(AI {B} (r {Ol
Figure 3. Electron configurations for the nitromethane anion. {A) the ground configuration; (B) the charge transfer configuration; (C) the locally excited
(ElsE2) configuration; (D) the locally excited (Eo~E~) configuration.
Configuration (A) has a closed-shell (1A1) wave function. Configurations (B) and (D) each give a 1A 1 and a 3A 1 state, of which the 1A 1 can interact with (A). Configuration (C) gives 1B~ and aBz states, which cannot interact with the others. However, we shall include configuration (C) in the following calculations, since it is important for a consideration of the position of the analogue of the 198 m/x band of nitromethane. On the other hand, the interaction of configuration (D), whose energy was evaluated [20] to be higher by 2 or 3 ev than that of (C), with (A) and (B) will be considered only qualitatively.
Now- one nmst determine the energy values of configurations (A), (B), and (C). I t is useful to explain this procedure in two steps. Th e first step is to determine the energy values of configurations (B) and (C) relative to that of (A), neglecting the electrostatic interaction between the CH 2 and NO 2 groups. This procedure can easily be accomplished using the electron affinity of the nitro group~, the ionization potential of the 2p orbital of the carbon anionw [22], and the observed excitation energy of ni t romethane E~-+E2 transition (198 m/x = 6.235 ev). The result is shown in figure 4 (a). Looking at this figure, it is seen that the energy values of the ground and charge-transfer configurations are very close to each other in this stage of the evaluation.
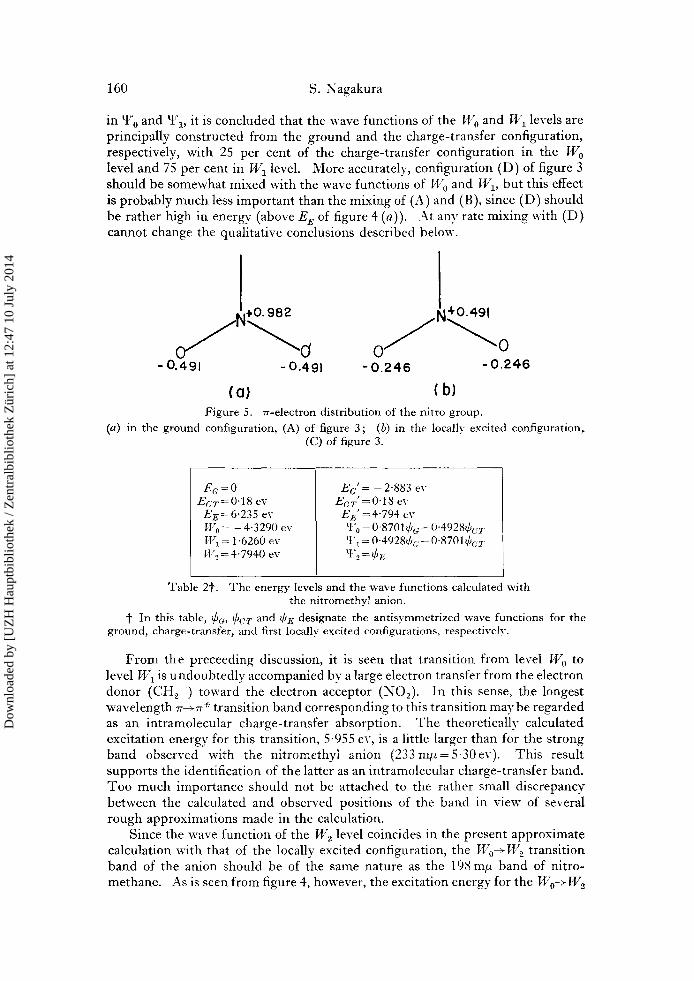
In the second step, electrostatic interaction between the CH 2- and NO2 groups must be considered for the ground and locally excited configurations. I t may be expected that this interaction brings about energy stabilization in these two configurations, because the nitro group in its ground state has a large heterogeneity in the 7r-electron distribution and the nitrogen atom is positively charged to a great extent[. In fact, using the wave functions given in table 1, the ~-electron distributions in configurations (A) and (C) can be evaluated with results as shown in figure 5 (a) and (b), respectively. In configuration (D), on
t" In the present treatment only the single excited configurations are taken into account. The doubly excited ones are neglected.
Tanaka determined theoretically the electron affinity of the nitro group as 0"4 ev. w 0'58 ev. This was taken from Pritchard and Skinner's table. II On the basis of this 7r-electron distribution, the contribution of the :r-electrons to the
dipole moment of the nitromethane molecule is evaluated as 2.8D. This value amounts to 80 per cent of the observed dipole moment of this molecule (3"5D).
Dow
nloa
ded
by [
UZ
H H
aupt
bibl
ioth
ek /
Zen
tral
bibl
ioth
ek Z
üric
h] a
t 12:
47 1
0 Ju
ly 2
014
Absorption spectra of nitromethane and the nitromethyl anion 159
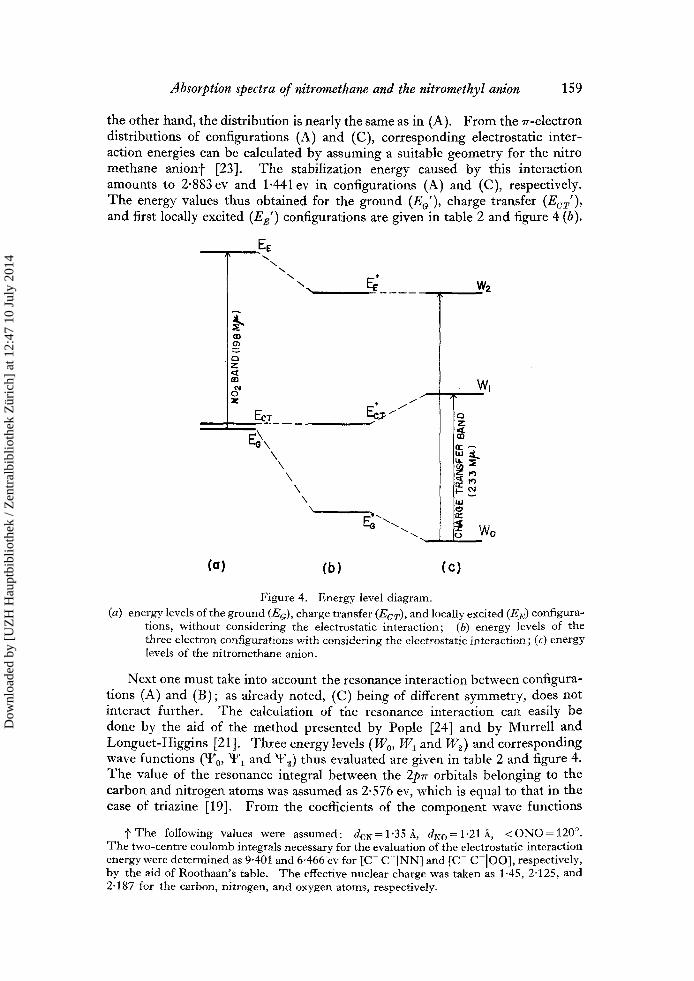
the other hand, the distribution is nearly the same as in (A). From the ~r-electron distributions of configurations (A) and (C), corresponding electrostatic inter- action energies can be calculated by assuming a suitable geometry for the nitro methane anion t [23]. The stabilization energy caused by this interaction amounts to 2.883 ev and 1.441 ev in configurations (A) and (C), respectively. The energy values thus obtained for the ground (Ea'), charge transfer (EcT'), and first locally excited (E~') configurations are given in table 2 and figure 4 (b).
gE \
\ \
\
/ ,i j f
F--c t I
\ \
\ \
\ \
W l
(o] (b) (c)
Figure 4. Energy level diagram. (a) energy levels of the ground (E~), charge transfer (E6,T) , and locally excited (E E) configura-
tions, without considering the electrostatic interaction; (b) energy levels of the three electron configurations with considering the electrostatic interaction ; (c) energy levels of the nitromethane anion.
Next one must take into account the resonance interaction between configura- tions (A) and (B) ; as already noted, (C) being of different symmetry, does not interact further. The calculation of the resonance interaction can easily be done by the aid of the method presented by Pople [24] and by Murrell and Longuet-Higgins [21]. Three energy levels (W0, W~ and W2) and corresponding wave functions (~F0, Re1 and 33~) thus evaluated are given in table 2 and figure 4. The value of the resonance integral between the 2pTr orbitals belonging to the carbon and nitrogen atoms was assumed as 2.576 ev, which is equal to that in the case of triazine [19]. From the coefficients of the component wave functions
t The following values were assumed : dcsl = 1"35 3,, dxo = 1"21 A, < ONO = 120 ~ The two-centre coulomb integrals necessary for the evaluation of the electrostatic interaction energywere determined as 9.401 and 6.466 ev for [C- C-INN] and [C- C ]OO], respectively, by the aid of Roothaan's table. The effective nuclear charge was taken as 1-45, 2.125, and 2-187 for the carbon, nitrogen, and oxygen atoms, respectively.
Dow
nloa
ded
by [
UZ
H H
aupt
bibl
ioth
ek /
Zen
tral
bibl
ioth
ek Z
üric
h] a
t 12:
47 1
0 Ju
ly 2
014
160 S. Nagakura
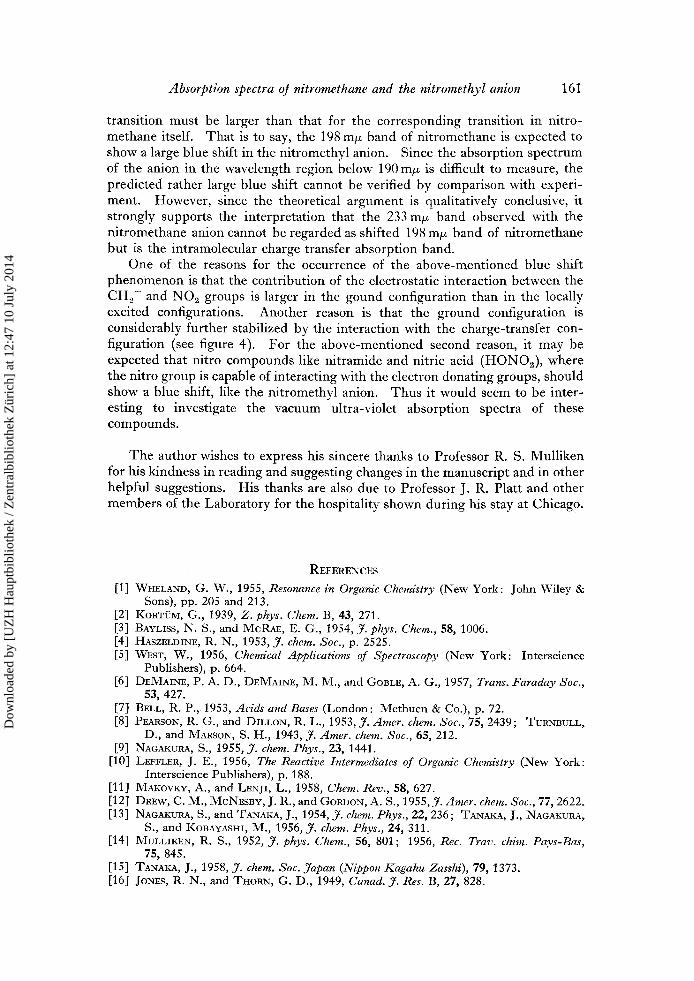
in LF 0 and ~'1, it is concluded that the wave functions of the H~ and PP\ levels are principally constructed f rom the ground and the charge-transfer configuration, respectively, with 25 per cent of the charge-transfer configuration in tile W 0 level and 75 per cent in Iq/~ level. More accurately, configuration (D) of figure 3 should be somewhat mixed with the wave functions of W 0 and ~ \ , but this effect is probably much less impor tant than the mixing of (A) and (B), since (D) should be rather high in energy (above E E of figure 4 (a)). At any rate mixing with (D) cannot change the qualitative conclusions described below.
N + o . 9 8 2
- 0.491 - 0.491 o j o
- 0 . 2 4 6 - 0 .24 .6
(a) (b) Figure 5. 7r-electron distribution of the nitro group.
(a) in the ground configuration, (A) of figure 3; (b) in the locally excited configuration, (C) of figure 3.
E G = 0 Ec,~r = 0'18 ev
E E = 6"235 ev W0 -- - 4-3290 ev W1 = 1 "6260 ev W2 = 4"7940 ev
E~' = - 2"883 ev Ec, r ' = 0"18 ev
E E' = 4-794 ev W 0 = 0-8701r + 0-4928r T tF 1 = 0"4928r - 0"8701~CT
Table 2~. The energy levels and the wave functions calculated with the nitromethyI anion.
In this table, CG, r and CE designate the antisymmetrized wave functions for the ground, charge-transfer, and first locally excited configurations, respectively.
F r o m the preceeding discussion, it is seen that transit ion f rom level W 0 to level W 1 is undoub ted ly accompanied by a large electron transfer f rom the electron donor (CH2- ) toward the electron acceptor (NO2). Ill this sense, the longest wavelength 7r-->~* transition band corresponding to this transit ion may be regarded as an intramolecular charge-transfer absorption. T h e theoretically calculated excitation energy for this transition, 5"955 ev, is a little larger than for the strong band observed with the ni t romethyl anion (233m/z=5 .30ev) . Th is result suppor ts the identification of the latter as an intramolecular charge-transfer band. T o o much impor tance should not be attached to the rather small discrepancy between the calculated and observed positions of the band in view of several rough approximat ions made in the calculation.
Since the wave funct ion of the W 2 level coincides in the present approximate calculation with that of the locally excited configuration, the W0->l/l ~ transit ion band of the anion should be of the same nature as the 198 mix band of nitro- methane. As is seen f rom figure 4, however, the excitation energy for the W0-+W 2
Dow
nloa
ded
by [
UZ
H H
aupt
bibl
ioth
ek /
Zen
tral
bibl
ioth
ek Z
üric
h] a
t 12:
47 1
0 Ju
ly 2
014
Absorption spectra or nitromethane and the nitromethyl anion 161
transition must be larger than that for the corresponding transition in nitro- methane itself. That is to say, the 198 m/z band of nitromethane is expected to show a large blue shift in the nitromethyl anion. Since the absorption spectrum of the anion in the wavelength region below 190 m/~ is difficult to measure, the predicted rather large blue shift cannot be verified by comparison with experi- ment. However, since the theoretical argument is qualitatively conclusive, it strongly supports the interpretation that the 233 m/z band observed with the nitromethane anion cannot be regarded as shifted 198 m/z band of nitromethane but is the intramolecular charge transfer absorption band.
One of the reasons for the occurrence of the above-mentioned blue shift phenomenon is that the contribution of the electrostatic interaction between the CH 2- and NOz groups is larger in the gound configuration than in the locally excited configurations. Another reason is that the ground configuration is considerably further stabilized by the interaction with the charge-transfer con- figuration (see figure 4). For the above-mentioned second reason, it may be expected that nitro compounds like nitramide and nitric acid (HONO2), where the nitro group is capable of interacting with the electron donating groups, should show a blue shift, like the nitromethyl anion. Thus it would seem to be inter- esting to investigate the vacuum ultra-violet absorption spectra of these compounds.
The author wishes to express his sincere thanks to Professor R. S. Mulliken for his kindness in reading and suggesting changes in the manuscript and in other helpful suggestions. His thanks are also due to Professor J. R. Platt and other members of the Laboratory for the hospitality shown during his stay at Chicago.
REFERENCES [1] WHELAND, G. W., 1955, Resonance in Organic Chemistry (New York: John Wiley &
Sons), pp. 205 and 213. [2] KOaTCM, G., 1939, Z. phys. Chem. B, 43, 271. [3] BAYLISS, N. S., and McRAE, E. G., 1954, J. phys. Chem., 58, 1006. [4] HASZELDINE, R. N., 1953, J. chem. Soc., p. 2525. [5] WEST, W., 1956, Chemical Applications of Spectroscopy (New York: Interscience
Publishers), p. 664. [6] DEMAINE, P. A. D., DEMAINE, M. M., and GOBLE, A. G., 1957, Trans. Faraday Soc.,
53, 427. [7] BELL, R. P., 1953, Acids andBases (London: Methuen & Co.), p. 72. [8] PEARSON, R. G., and DILLON, R. L., 1953, J. Amer. chem. Soc., 75, 2439; TURNBULL,
D., and MARSON, S. H., 1943, J. Amer. chem. Soc., 65, 212. [9] NAGAKURA, S., 1955, J. chem. PAys., 23, 1441.
[10] LEFFLER, J. E., 1956, The Reactive Intermediates of Organic Chemistry (New York: Interscience Publishers), p. 188.
[11] MAKOVKY, A., and LENjI, L., 1958, Chem. Rev., 58, 627. [12] DREW, C. M., MeNEsBY, J. R., and GORDON, A. S., 1955,J. Amer. chem. Soc., 77, 2622. [13] NACAKURA, S., and TANAKA, J., 1954, J. chem. Phys., 22, 236; TANAKA, J., NAGAKURA,
S., and KOBAYASHI, M., 1956, J. chem. Phys., 24, 311. [14] MULLIKEN, R. S., 1952, J. phys. Chem., 56, 801 ; 1956, Rec. Trav. chim. Pays-Bas,
75, 845. [15] TANAKA, J., 1958, J. chem. Soc. Japan (Nippon Kagahu Zasshi), 79, 1373. [16] JONES, R. N., and THORN, G. D., 1949, Canad. J. Res. B, 27, 828.
Dow
nloa
ded
by [
UZ
H H
aupt
bibl
ioth
ek /
Zen
tral
bibl
ioth
ek Z
üric
h] a
t 12:
47 1
0 Ju
ly 2
014
162 S. Nagakura
[17] MATSEN, F. A., 1950, J. Amer. chem. Soc., 72, 5243; HERZFELD, K. F., 1947, Chem. Rev., 41, 233 ; NAGAKURA, S., and BABA, H., 1952, J. Amer. chem. Soc., 74, 5693.
[18] ROOTHAAN, C. C. J., 1951, Rev. rood. Phys., 23, 69. [19] PARISER, R., and PARR, R. G., 1953, J. chem. Phys., 21, 466, 767. [20] TANAKA, J., 1957, J. chem. Soc. Japan (Nippon Kagaku Zasshi), 78, 1643. [21] 1V[uRRELL, J. N., and LONGUET-HIGGINS, H. C., 1955, Proc. phys. Soc. Lond. A, 68,
329; ~k/IURRELL, J. N., 1955, Proc. phys. Soc. Lond. A, 68, 969. [22] PRITCHARD, H. O., and SKINNER, H. A., 1955, Chem. Rev., 55, 745. [23] ROOTHAAN, C. C. J., 1955, Special Technical Report, Laboratory of Molecular
Structure and Spectra, The University of Chicago. [24] POPLE, J. A., 1955, Proc. phys. Soc. Lond. A, 68, 81.
Dow
nloa
ded
by [
UZ
H H
aupt
bibl
ioth
ek /
Zen
tral
bibl
ioth
ek Z
üric
h] a
t 12:
47 1
0 Ju
ly 2
014