Time (Minutes) - QSpace - Queen's University
98
Compartmentation of the β-adrenergic signal by phosphodiesterases in adult rat ventricular myocytes by Jesse Milo Schwartz A thesis submitted to the Department of Physiology In conformity with the requirements for the degree of Master of Science Queen’s University Kingston, Ontario, Canada (January, 2008) Copyright © Jesse Milo Schwartz, 2008
Transcript of Time (Minutes) - QSpace - Queen's University
Compartmentation of the β-adrenergic signal by phosphodiesterases in
adult rat ventricular myocytes
by
Jesse Milo Schwartz
A thesis submitted to the Department of Physiology
In conformity with the requirements for
the degree of Master of Science
Queen’s University
Kingston, Ontario, Canada
(January, 2008)
Copyright © Jesse Milo Schwartz, 2008
i
ABSTRACT
Previous studies have suggested that phosphodiesterase (PDE) hydrolysis of
cyclic adenosine monophosphate (cAMP) is important in the generation of specific and
segregated cAMP signals within cells. The purpose of this study was to determine if
PDE compartmentation was important in cardiac ventricular myocytes. Therefore, we
investigated the effects of β-adrenergic (β-AD) stimulation with isoproterenol in the
presence of cilostamide, a PDE3 inhibitor, or Ro 20-1724, a PDE4 inhibitor, on unloaded
cell shortening, L-type calcium currents and intracellular calcium levels in freshly
dissociated adult rat ventricular myocytes. PDE3 inhibition resulted in a 216 ± 17 %
(n=8) increase in unloaded cell shortening after ten minutes of isoproterenol exposure,
whereas isoproterenol produced a statistically smaller increase of 155 ± 12 % (n=8) in the
presence of PDE4 inhibition. There was a non-significant trend for PDE4 inhibition to
produce larger increases in calcium currents (179 ± 17 % (n=4) of controls) than PDE3
inhibition (155 ± 10 % (n=6) of controls). Both PDE3 and PDE4 inhibitors had similar
effects on isoproterenol-stimulated increases of calcium transient amplitude with values
of 209 ± 14 % (n=8) and 185 ± 12 % (n=8), respectively. Determination of sarcoplasmic
reticulum (SR) calcium load using caffeine pulse experiments demonstrated that PDE4
inhibition and isoproterenol superfusion produced a statistically larger increase in SR-
calcium loading (139 ± 9 % (n=6)) than PDE3 inhibition and isoproterenol superfusion
(113 ± 9 % (n=6)). These results suggest that PDE3 may be active in proximity to the
contractile apparatus of cardiac myocytes, whereas PDE4 may be localized in a domain
consisting of the L-type calcium channel and junctional SR. Consequently, our study

ii
provides functional evidence for differential localization of PDE isoforms in cardiac
myocytes.

iii
ACKNOWLEDGEMENTS
I would like to start by thanking my family. Thank you Noa, for encouraging me
to “do the work,” Sheldon, for giving me a good brain, and Jacob, for being my friend
and exchanging funny stories on the phone. I would also like to thank my grandmother,
Anne. You’re one of the few grandmothers I can imagine who would take such an active
interest in my research, and combine it with a capacity to really understand what I do.
I would like to acknowledge my housemates Gursev and Adrian. It is only in
retrospect that I appreciate how lucky I was to live with you. A special thanks to Gursev
for helping me with so many things and for all your sage advice, your friendship means a
great deal to me.
I would like to thank the members of the Ward lab. Thank you Gina, for being
there with me from the beginning, and Clarissa, for your assistance with prep work. A
special thanks to Jimmy and Lian. Jimmy, you made working in the lab a lot of fun.
Lian, you came to the rescue at exactly the right time. You’re an excellent student and I
know you will be successful. I would also like to thank the Ward lab volunteers, Dr.
Melo, and all my friends and colleagues in the Melo lab.
Thank you Chris, for all your help and encouragement over the past two years. I
learned a tremendous amount by working in your lab that will stay with me for the rest of
my life. If I could go back and do it again, I wouldn’t do my Master’s anywhere else.
I would like to acknowledge the rats I used to acquire the data for my Master’s. I
will strive to take the knowledge I have gained from this experience and use it to benefit
others.
My Master’s is dedicated to the memory of my grandfather, Joshua Heilman.
iv
TABLE OF CONTENTS
ABSTRACT ......................................................................................................................... i
ACKNOWLEDGEMENTS ............................................................................................... iii
TABLE OF CONTENTS ................................................................................................... iv
LIST OF TABLES ............................................................................................................. vi
LIST OF FIGURES .......................................................................................................... vii
CHAPTER 1: INTRODUCTION/LITERATURE REVIEW ............................................ 1
Cellular Second Messengers ........................................................................................... 1
cAMP .............................................................................................................................. 2
PDEs ................................................................................................................................ 3
Clinical use of PDE Inhibitors ........................................................................................ 4
G-protein coupled receptor signaling .............................................................................. 5
β-adrenergic receptors ..................................................................................................... 6
Co-localization to caveolae ............................................................................................. 8
Recruitment of PDEs to β-ARs ....................................................................................... 9
cAMP-cGMP pathway cross-talk.................................................................................. 11
Cardiac Excitation-Contraction Coupling and G-Proteins ............................................ 13
The RyR macromolecular signaling complex ............................................................... 14
The L-type Ca2+
channel ............................................................................................... 16
Calcium Channels of the Sarcolemma .......................................................................... 17
Role of PDEs and associated proteins in disease states ................................................ 18
cAMP compartmentation .............................................................................................. 22
Conceptual models for PDE regulation of cAMP diffusion ......................................... 24
v
Hypothesis and Objectives ............................................................................................ 26
CHAPTER 2: METHODS ............................................................................................... 28
Cell isolation ................................................................................................................. 28
Cell-Shortening recordings ........................................................................................... 29
Electrophysiological methods ....................................................................................... 29
Calcium transient recordings ......................................................................................... 31
Caffeine-pulse experiments ........................................................................................... 32
Statistical Analysis ........................................................................................................ 33
CHAPTER 3: RESULTS ................................................................................................. 34
CHAPTER 4: DISCUSSION AND CONCLUSIONS .................................................... 67
Summary ....................................................................................................................... 67
Compartmentation of PDE3 and PDE4 ......................................................................... 67
Limitations of Unloaded Cell Shortening Experiments ................................................ 72
Limitations of Calcium Current Experiments ............................................................... 73
Limitations of Calcium Transient and SR Calcium Loading Experiments ................... 76
Comparison to Previous Studies ................................................................................... 77
Future directions ............................................................................................................ 79
Conclusions ................................................................................................................... 81
REFERENCES ................................................................................................................. 82
vi
LIST OF TABLES
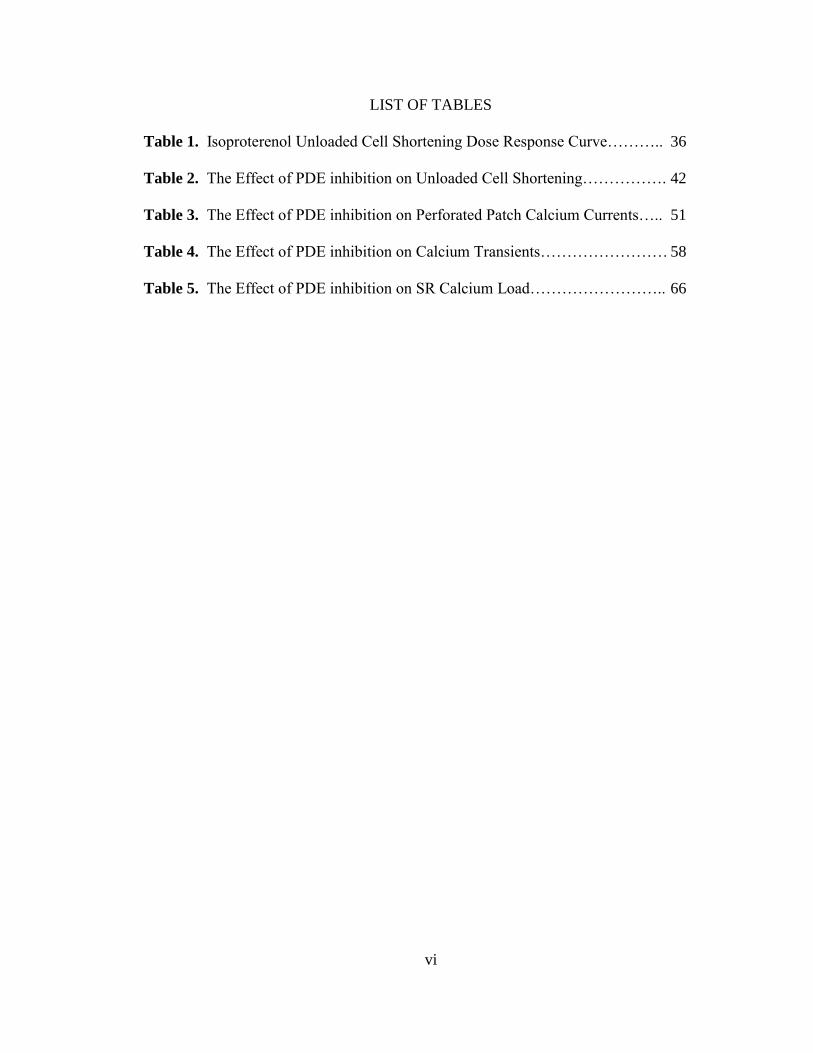
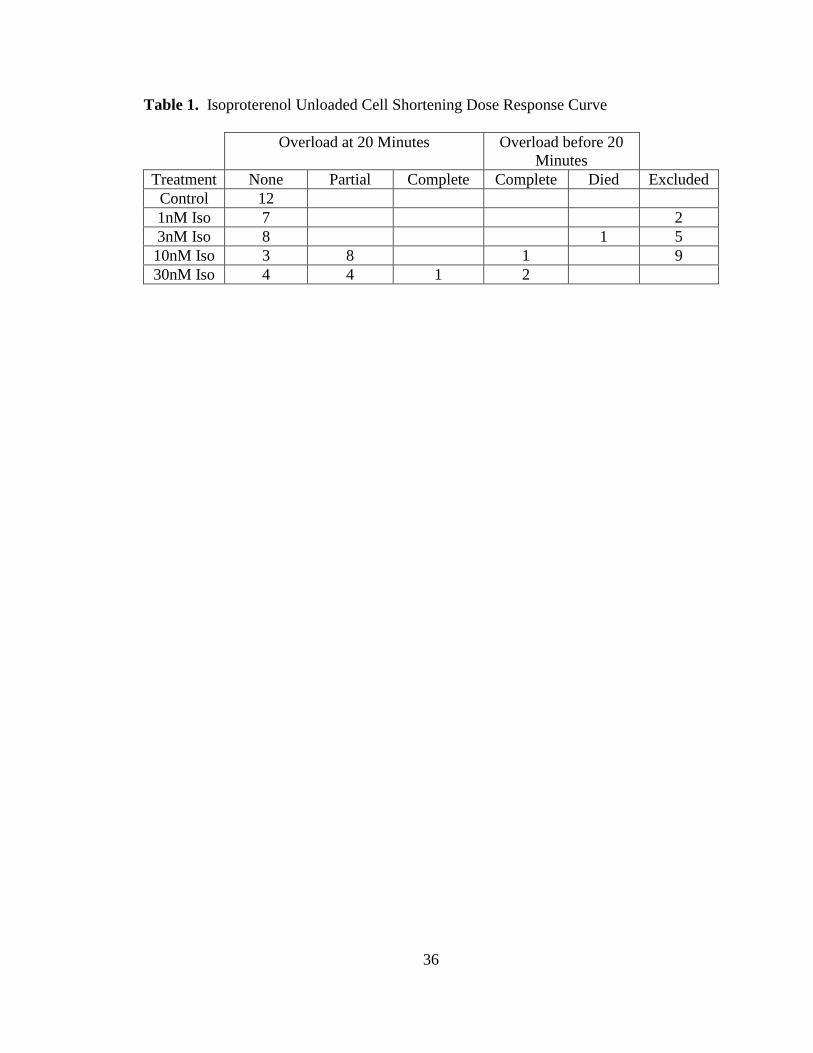
Table 1. Isoproterenol Unloaded Cell Shortening Dose Response Curve……….. 36
Table 2. The Effect of PDE inhibition on Unloaded Cell Shortening……………. 42
Table 3. The Effect of PDE inhibition on Perforated Patch Calcium Currents….. 51
Table 4. The Effect of PDE inhibition on Calcium Transients…………………… 58
Table 5. The Effect of PDE inhibition on SR Calcium Load…………………….. 66
vii
LIST OF FIGURES
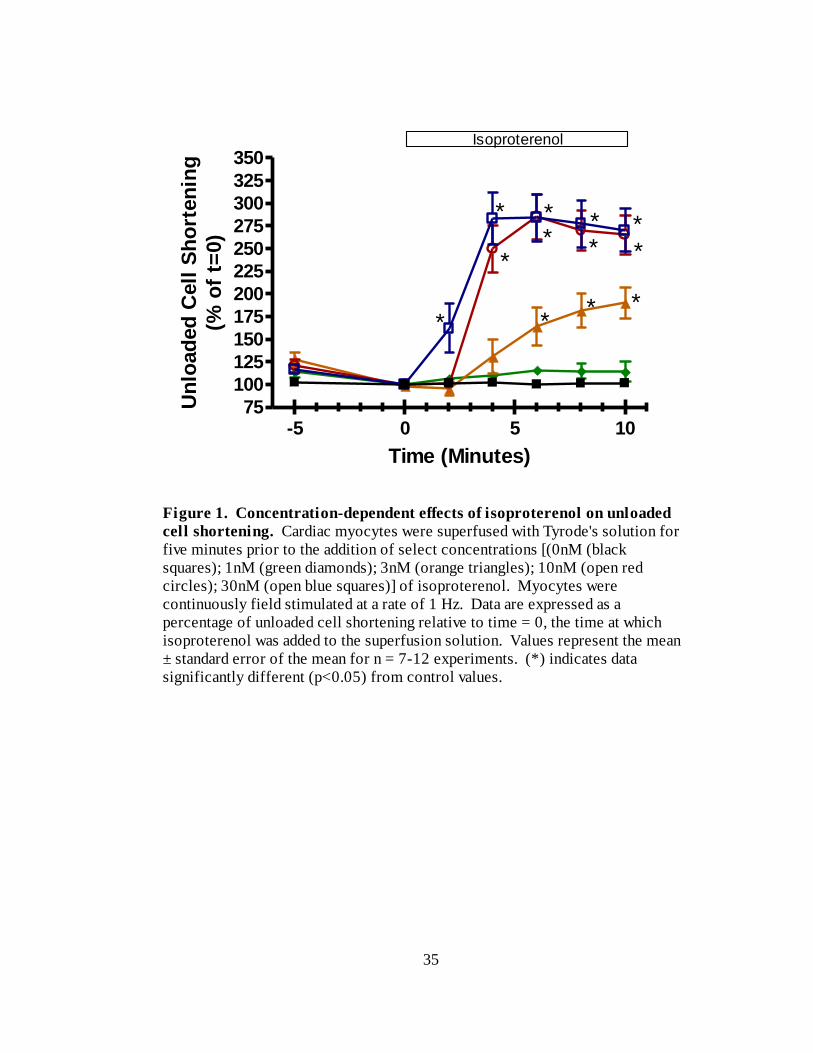
Figure 1. Concentration-dependent effects of isoproterenol on unloaded cell
shortening………………………………………………………………….. 35
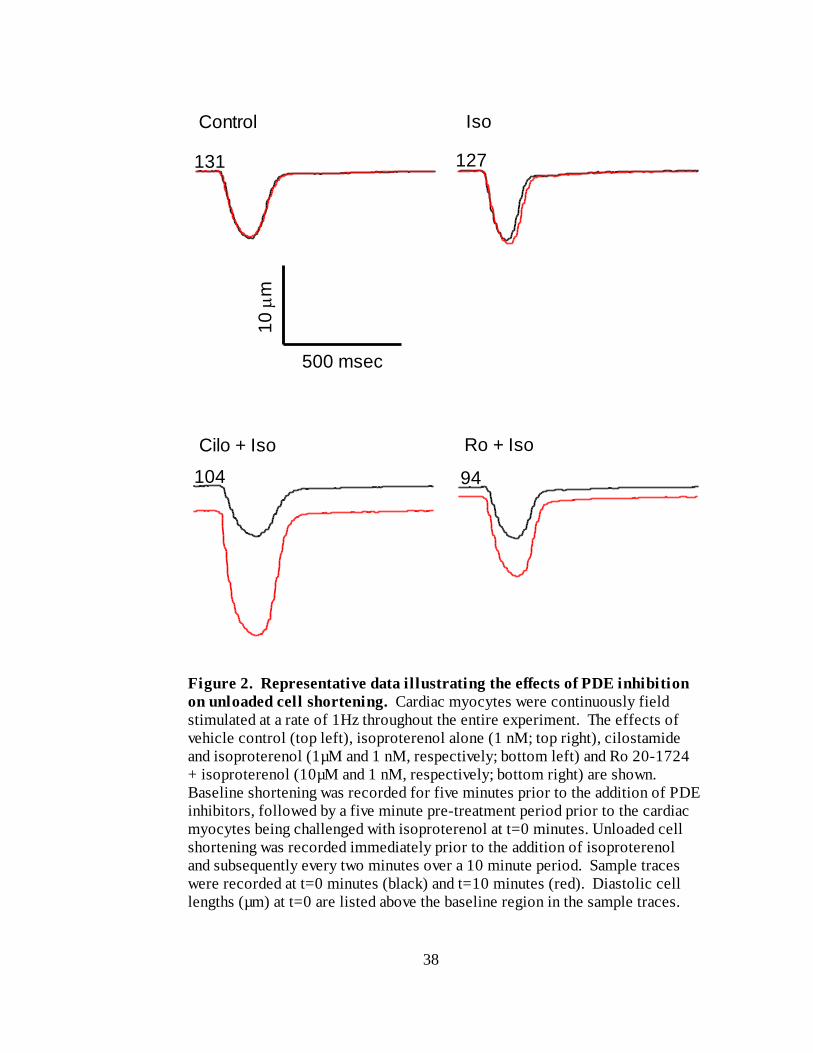
Figure 2. Representative data illustrating the effects of PDE inhibition on unloaded cell
shortening………………………………………………………………….. 38
Figure 3. The effects of selective PDE3 inhibition on unloaded cell shortening… 39
Figure 4. The effects of selective PDE4 inhibition on unloaded cell shortening… 40
Figure 5. The effects of selective PDE3 and PDE4 inhibition on unloaded cell
shortening………………………………………………………………….. 41
Figure 6. Run-down of calcium currents associated with the whole-cell ruptured patch
technique…………………………………………………………………… 44
Figure 7A. Calcium currents recorded using the perforated-patch technique……. 45
Figure 7B. Representative data illustrating the effect of cadmium on perforated-patch
calcium currents……………………………………………………………. 45
Figure 8. Representative data illustrating the effect of PDE inhibition on perforated-
patch calcium currents……………………………………………………... 47
Figure 9. The effects of selective PDE3 inhibition on calcium currents…………. 48
Figure 10. The effects of selective PDE4 inhibition on calcium currents………... 49
Figure 11. The effects of selective PDE3 and PDE4 inhibition on calcium
currents…………………………………………………………………….. 50
Figure 12. Representative data illustrating the effects of PDE inhibition on calcium
transients…………………………………………………………………… 54
Figure 13. The effects of selective PDE3 inhibition on calcium transients………. 55
viii
Figure 14. The effects of selective PDE4 inhibition on calcium transients………. 56
Figure 15. The effects of selective PDE3 and PDE4 inhibition on calcium
transients………………………………………………………………….. 57
Figure 16. The effects of selective PDE3 and PDE4 inhibition on calcium transients
with 0.5mM external Ca2+
…………………………………………………. 60
Figure 17. Representative data illustrating the effects of PDE inhibition on SR calcium
load………………………………………………………………………… 61
Figure 18. The effects of selective PDE3 inhibition on SR calcium load………... 63
Figure 19. The effects of selective PDE4 inhibition on SR calcium load………... 64
Figure 20. The effects of selective PDE3 and PDE4 inhibition on SR calcium
load………………………………………………………………………… 65
Figure 21. Conceptual model for the localization of the β-AD signaling cascade by
PDEs in cardiac myocytes…………………………………………………. 68
ix
LIST OF ABBREVIATIONS
AC………………………….. adenylyl cyclase
AKAP……………………… A-kinase anchoring protein
β-AD……………………….. β-adrenergic
β-AR………………………... β-adrenergic receptors
CaM kinase………………… Ca2+
/calmodulin dependent kinase
cAMP………………………. cyclic adenosine monophosphate
Cav-3……………………….. Caveolin-3
cGMP………………………. cyclic guanosine monophosphate
CICR………………….……. calcium-induced calcium release
CNG………………………... cyclic nucleotide-gated
COPD………………………. chronic obstructive pulmonary disease
CPVT………………………. catecholaminergic polymorphic ventricular tachycardia
DAD………………………. delayed after-depolarization
DAG……………………….. diacylglycerol
ECC………………………… excitation contraction coupling
EHNA……………………… erythro-9-(2-hydroxy-3-nonyl)adenine
eNOS………………………..endothelial nitric oxide synthase
EP……………………………E-prostanoid
F……………………………. fluorescence intensity
F0…………………………… basal fluorescence intensity
FKBP12.6………………….. Calstabin 2
FRET……………………….. fluorescence resonance energy transfer
x
FSK………………………… forskolin
GC………………………….. guanylyl cyclase
GPCR……………………... G-protein coupled receptor
HCN2………………………. hyperpolarization activated cyclic nucleotide-gated cation
channel
IBMX………………………. 3-isobutyl-1-methylxanthine
ICa,L………………………… L-type calcium channel
IK1………………………….. inward rectifier potassium current
INCX………………………… sodium-calcium exchange current
IP3………………………….. inositol-1,4,5-trisphosphate
Isus………………………….. delayed rectifier potassium current
Ito…………………………… transient outward potassium current
LZ………………………….. leucine zipper
mAKAP…………………… muscle A-kinase anchoring protein
MBCD……………………… methyl-beta cyclodextrin
MI………………………….. myocardial infarction
NO…………………………..nitric oxide
PDE …………………………phosphodiesterase
PGE1……………………….. prostaglandin E1
PIP2………………………… phosphatidylinositol-4,5-bisphosphate
PKA……………………….. protein kinase A
PKC………………………… protein kinase C
PLC………………………… phospholipase C

xi
Po…………………………… open probability
R……………………………. ratio
RA…………………………. relative amplitude
RyR………………………... ryanodine receptor
SCD………………………… sudden cardiac death
sGC………………………… soluble GC
siRNA……………………….small interfering ribonucleic acid
SR…………………………... sarcoplasmic reticulum
wt…………………………... wild type
1
CHAPTER 1: INTRODUCTION/LITERATURE REVIEW
Cellular Second Messengers
Distant cells can use chemical signaling to communicate with one another.
Chemical signaling generally involves three components. A cell releases an extracellular
signal, also known as a “first messenger.” This first messenger binds to a specific
receptor at the target cell, which can be located either in the membrane or cytoplasm,
depending upon the chemical nature of the messenger. In response, the target cell may
then mobilize yet another chemical signal, which is broadly referred to as a “second
messenger.” These second messengers may cause downstream effects to modulate
biological functions or they may serve to mobilize additional second messengers
(Reviewed in Beavo and Brunton, 2002).
Many second messengers are well conserved across cell types. For example, G-
proteins can activate phospholipase C (PLC) to catalyze the breakdown of
phosphatidylinositol-4,5-bisphosphate (PIP2) into two second messengers: inositol-1,4,5-
trisphosphate (IP3) and diacylglycerol (DAG). DAG, in conjunction with calcium (Ca2+
),
activates a class of phospholipid-dependent kinases known as protein kinase C (PKC).
PKC phosphorylates many cellular proteins to exert its cellular effects. Additionally, the
IP3 liberated from PIP2 works through a separate pathway to cause the release of Ca2+
from intracellular stores (Reviewed in Oude Weernink et al., 2007). Ca2+
, in turn, binds
to troponin C in cardiac and skeletal muscle, and activates calmodulin in most cells. The
binding of Ca2+
/calmodulin by Ca2+
/calmodulin dependent kinase (CaM kinase) activates
the kinase, which phosphorylates a variety of cellular proteins (Reviewed in Maier and
2
Bers, 2007) as well as directly activates enzymes such as phosphodiesterases and
adenylyl cyclase (Reviewed in Iacovelli et al., 1999).
cAMP
Another important, and ubiquitous, second messenger is cyclic adenosine
monophosphate (cAMP). Earl Sutherland made some early advances in this field while
researching how hormones like epinephrine promote glycogenolysis. Rall et al (1956)
discovered that activation of liver phosphorylase was accompanied by the incorporation
of phosphate into the enzyme. By 1958, the messenger cAMP, adenylyl cyclase (AC),
which synthesizes cAMP, and phosphodiesterases (PDEs), which degrade cAMP, had all
been described (Reviewed in Beavo and Brunton, 2002).
Krebs and colleagues found that epinephrine stimulated a cascade of kinases, the
first of which was activated by cAMP (Reviewed in Krebs and Beavo, 1979). This
completed the pathway from hormone to glycogenolysis. Subsequent investigations by
many investigators demonstrated that many additional cellular substrates could also be
phosphorylated by this cAMP-activated protein kinase, which was renamed protein
kinase A (PKA) (Langan, 1968; Lohmann et al., 1980).
Other studies investigated PDEs, the enzymes responsible for hydrolyzing cAMP.
Early studies suggested that the maximal rate of cAMP degradation was greater than
synthesis by more than an order of magnitude. Regulation of PDE activity occurs via a
variety of mechanisms, and is often quantitatively more important in controlling cAMP
levels than the rate of synthesis (Reviewed in Beavo and Brunton, 2002).
3
PDEs
PDEs possess conserved C-terminal and catalytic domains and unique N-terminal
domains which are important for subcellular localization (Lenhart et al., 2005). There are
11 families and more than 90 isoforms of PDEs (Zaccolo and Movsesian, 2007). There
are at least five families of PDEs expressed in the neonatal rat ventricular myocytes:
PDE1, PDE2, PDE3, PDE4 and PDE5 (Mongillo and Zaccolo, 2006).
PDE1 is activated by Ca2+
/calmodulin and can hydrolyze either cGMP or cAMP.
PDE2 can be activated by cGMP and can also hydrolyze cGMP or cAMP (Rochais et al.,
2006). PDE2 is reported to be responsible for blocking the increase in cAMP generated
by β-adrenergic stimulation in cardiac myocytes (Mongillo et al., 2006). PDE3 and
PDE4 provide the major cAMP hydrolytic activity in the heart (Mongillo et al. 2004).
PDE3 is inhibited by cGMP and preferentially hydrolyzes cAMP whereas PDE4 is cAMP
specific (Rochais et al., 2006). PDE3 is responsible for most of the cAMP hydrolyzing
activity in membrane-enriched fractions of human myocardium. Its contribution to
cytosolic cAMP hydrolysis varies from greater than 50% to less than 20%, depending on
the experimental conditions (Zaccolo and Movsesian, 2007). In a fluorescence resonance
energy transfer (FRET) study of neonatal rat cardiac myocytes, Mongillo et al. (2004)
found that PDE3 and PDE4 contributed approximately 90% of cAMP hydrolyzing
activity. Of this 90%, PDE4 contributed twice as much as PDE3. They found that
approximately 90% of PDE4 activity was from the PDE4B and PDE4D isoforms, and
that of this, PDE4D contributed twice as much as PDE4B (Mongillo et al., 2004).
PDE5 is cGMP specific and as such does not hydrolyze cAMP. It has been
shown to be expressed in the heart (Nagendran et al., 2007), although it is unknown
4
whether it is involved in regulating cardiac contractility. However, PDE5 inhibition
counteracts the cAMP-mediated effects of catecholamine (β-adrenergic) stimulation, and
further investigation could lead to a better understanding of its purpose (Reviewed in
Mongillo and Zaccolo, 2006).
Clinical use of PDE Inhibitors
A characteristic of heart failure is reduced cAMP levels, especially in the terminal
stages of the disease (Packer et al., 1991). As such, it would seem logical to attempt to
elevate cAMP levels as a treatment of heart failure. The elevation of cAMP can be
achieved by one of two ways: either 1) by increasing cAMP production; or 2) by
inhibiting cAMP degradation. However, treatments which elevated cAMP are known to
actually exacerbate heart failure and further promote arrhythmias (Packer et al., 1991).
The effect of milrinone, a PDE3 inhibitor, on the treatment of heart failure was
investigated in a clinical study. It was found that there was a 34% increase in
cardiovascular mortality with respect to controls in patients taking milrinone.
Additionally, there was a 53% increase in mortality in patients whose heart failure
symptoms were the most severe at the start of treatment (Packer et al., 1991). In fact,
milrinone was so deleterious to patient survival that the study was stopped before its
scheduled completion.
In addition to milrinone, similar observations are reported with other PDE
inhibitors. For example, theophylline, which is used to treat asthma and chronic
obstructive pulmonary disease (COPD), also causes an increase in mortality due to
arrhythmias (Bittar and Friedman, 1991). In addition to PDE3 inhbitors, PDE4 inhibitors
5
are used to treat asthma, COPD and Alzheimer’s disease (Lehnart et al., 2005).
Consequently, because of the potential role of PDE deficiency in heart failure, and the
known cardiac side-effects of PDE inhibitors used to treat other clinical conditions, it is
important to understand PDE regulation in the heart.
G-protein coupled receptor signaling
G-protein coupled receptors (GPCRs) consist of a protein with seven trans-
membrane domains bound to the Gα subunit of a heterotrimer, which consists of Gα,
GDP and Gβγ. The binding of a ligand to the GPCR causes Gα-GDP to exchange GDP
for GTP which in turn causes Gα-GTP and Gβγ to dissociate from the receptor and each
other. Gα-GTP and Gβγ are subsequently able to activate downstream elements, such as
adenylyl cyclase (AC), which produces cAMP (Reviewed in Hendrickson, 2005).
In the heart, the major pathway for increasing intracellular cAMP is
catecholamines binding to β-adrenergic receptors (β-AR), which are GPCRs. The cAMP
activates PKA, which in turn phosphorylates many targets such as the L-type calcium
channels (ICa,L) of the sarcolemma. Phosphorylation of these channels results in an
increased open probability (Po) at the single channel level, causing a global increase in
ICa,L and contractility (Reviewed in Brette et al., 2005) via calcium-induced calcium
release (CICR). Additionally, β-adrenergic signaling directly increases the Po of
ryanodine receptors by activating muscle A-kinase anchoring protein (mAKAP)-bound
PKA, which phosphorylates these sarcoplasmic reticulum channels (Marx et al., 2000;
Wehrens et al., 2003).
6
Ligands which use similar second messenger pathways can have very different
effects at the cellular level. Rochais et al. (2006) noted that different GPCRs have
different effects on contractility and glycogen metabolism in the heart despite using a
common second messenger pathway. For example, both the β1-AR and the E-prostanoid
(EP) 1 receptor are GPCRs that act via a cAMP/PKA cascade, but β1-adrenergic
stimulation causes increased force of contraction and stimulation of glycogen
phosphorylase while prostaglandin E1 (PGE1) has no effect on contractile activity or
glycogen metabolism. Consequently, the different effects of ligands which use similar
second messenger pathways has lead to the idea that these second messenger pathways
must be segregated from one another.
β-adrenergic receptors
There are three β-adrenergic receptor (β-AR) subtypes expressed in the
mammalian heart: β1, β2 and β3 (Nikolaev et al., 2006). β1-ARs comprise 75-80% of β-
ARs in mammalian hearts (Rybin et al., 2000). β1 and β2 are primarily involved in
mediating the increase in chronotropy and inotropy associated with β-adrenergic
stimulation of the heart. These receptors couple primarily to Gs, which promotes cAMP
production and PKA-dependent phosphorylation of various components of the excitation-
contraction coupling (ECC) machinery. Targets for PKA derived from β-adrenergic
stimulation include the L-type calcium channel, phospholamban, the RyR and troponin T
and I. Evidence has been found supporting differential compartmentation of β1- and β2-
mediated cAMP signaling, with localized control of cAMP degradation supplied by PDEs
(Nikolaev et al., 2006).
7
Nikolaev et al. (2006) set out to elucidate differences between cAMP generated
by β1 and β2 stimulation in adult mouse cardiac myocytes. They conducted their
experiments in ventricular myocytes from transgenic mice expressing a novel cAMP-
FRET sensor. This sensor was based on the hyperpolarization activated cyclic
nucleotide-gated cation channel 2 (HCN2), and was distributed in the cytosol. Using the
non-specific β-adrenergic agonist isoproterenol in the presence of phosphodiesterase
inhibitors, they found that cAMP generated by β-adrenergic stimulation was primarily
regulated by PDE4, with less significant contributions by PDE2 and less still by PDE3.
Furthermore, cAMP generated by β1-AR stimulation was primarily regulated by PDE4,
while cAMP generated by β2-AR was regulated by multiple PDEs.
They also found that there was twice as much cAMP generated by β1-AR
stimulation as by β2-AR stimulation, even in the presence of complete PDE inhibition by
3-isobutyl-1-methylxanthine (IBMX). Additionally, cAMP generated by the β1-AR
propagated throughout the cell over a distance spanning multiple sarcomeres, while
cAMP generated by the β2 -AR remained locally confined. Interestingly, the
compartmentation of β2 -AR generated cAMP was also Gi independent. Disruption of Gi
inhibitory G proteins with pertussis toxin did not alleviate the limited diffusion of β2 -AR
generated cAMP. The experimenters concluded that there must be additional
mechanisms restricting cAMP generated by the β2-AR which are PDE and Gi
independent, such as differential receptor localization with respect to caveolae and t-
tubules (Nikolaev et al., 2006).
8
Co-localization to caveolae
Caveolae are 50 to 100nM deep plasma membrane invaginations enriched in
cholesterol, sphingolipids and the protein caveolin. Caveolin-3 (Cav-3) is the primary
isoform expressed in muscle (Balijepalli et al., 2006). Caveolae may play a role in
membrane receptor internalization; it has been suggested that GPCRs can be
phosphorylated by PKA and internalized from these regions. In addition to the plasma
membrane, caveolae may also be localized to intracellular membranes such as the SR and
t-tubules. Interestingly, GPCRs and post-receptor agonists appear to localize differently
in the caveolin-rich fraction of adult cardiac myocytes versus fibroblasts, smooth muscle
cells and neonatal cardiac myocytes (Insel et al., 2005). The latter suggests that there
may be a developmental component to GPCR localization as well as the mechanisms of
second messenger compartmentalization. In the heart, several signaling molecules have
been localized to caveolae, including the β2 –AR, the voltage-dependent Na channel, the
voltage-dependent potassium channel Kv1.5, the Na/Ca2+
exchanger and the HCN4
pacemaker (Balijepalli et al., 2006).
Rybin et al. (2000) set out to determine whether or not caveolae are a location for
compartmentalized β-AR signaling in cardiac myocytes. Using immunoblot analysis of
proteins extracted from neonatal rat cardiac myocytes, they found that β1-ARs localize to
caveolae, non-caveolar cell surface plasma membrane and internal membranes. Along
with more than 99% of cellular proteins, the vast majority of β1-ARs were non-caveolar.
On the other hand, β2-ARs localize to caveolae. Additionally, β2-ARs localize to
caveolae and internal membranes in cardiac fibroblasts, and were excluded from non-
9
caveolar plasma membrane, indicating that this may be a general phenomenon. They
also found that isoproterenol-stimulated trafficking from caveolae was limited to β2-ARs.
Rybin et al. (2000) subsequently went on to explore the localization of
downstream elements in the β-AR signaling cascaded. The vast majority of Gαi subunits
and approximately 50% of Gαs and β subunits were found in caveolae. Additionally, as
much as 50% of AC localizes to caveolae, where it interacts with Cav-3. Caveolae
contained negligible amounts of the α-catalytic and RI regulatory subunits of PKA, but
were highly enriched in the RII regulatory subunit. Finally, disassembly of caveolae
using cyclodextrin increased cAMP accumulation in response to β1, β2 and direct AC
activation with forskolin. As such, it is possible that caveolae act to inhibit cAMP
formation with inhibitory control at the level of AC. Evidence supporting this is
provided by the fact that AC6 can be inhibited by capacitive calcium entry through
channels that co-localize to caveolae (Rybin et al., 2000).
Recruitment of PDEs to β-ARs
GPCR uncoupling limits the magnitude of agonist-induced signals, and returns
cells to an un-stimulated state. Uncoupling occurs through desensitization, whereby
activated receptors are phosphorylated and subsequently bind to β-arrestin proteins (Perry
et al., 2002). These proteins inhibit further receptor interaction with G-proteins. β-
arrestins can also recruit cytosolic proteins to the plasma membrane, a phenomenon
which Perry et al. (2002) chose to investigate further. They administered isoproterenol
to HEK cells over-expressing Gs and AC-coupled β2 -AR. They found that there was a
similar time-course for the recruitment of the major PDE4 isoforms expressed in these

10
cells to the plasma membrane as for the recruitment of β-arrestins. They also challenged
cells over-expressing PDE4D3 and β2-AR with isoproterenol, and found that there was a
similar time-course for the recruitment of PDE4D3 and β-arrestins to β2-AR. Additional
studies demonstrated that there was no PDE4 recruitment to membranes upon
isoproterenol stimulation of mouse embryonic fibroblasts which expressed β-ARs but
lacked β-arrestin 1 and 2. In this study, wild-type levels of exogenous β-arrestin 1 re-
established normal PDE4 recruitment to the membrane (Kohout et al., 2001).
Perry et al. (2002) subsequently used immunoprecipitation to demonstrate an
association between β-arrestins and PDE4s. Experiments revealed the presence of
complexes containing both PDE4D3 and β-arrestin 1 in Rat-1 cell cytosol. In accordance
with a characteristic common to PDEs, PDE4D1 to 5 have identical catalytic and
carboxyl termini but different amino termini which are responsible for interactions with
scaffolding and signaling proteins. β-arrestin 1 and β-arrestin 2 expressed in COS-7 cells
immunoprecipitated with all five isoforms of PDE4, suggesting that the common catalytic
and carboxyl domains are involved in the association between PDEs and β-arrestins.
Finally, the experimenters set out to determine the effects of overexpressing a mutant
PDE4D5 with negligible catalytic activity that could still bind to β-arrestins in COS-7
cells. As such, this mutant PDE4D5 competed with wt PDE4D5 for binding to β-
arrestins. Overexpression of mutant PDE4D5 increased isoproterenol-stimulated
membrane PKA activity in relation to mock-transfected cells. In light of these results, it
was concluded that β-arrestins recruit PDEs to ligand-activated receptors, thereby
targeting cAMP degredation to plasma membrane sites of localized PKA activation
11
(Perry et al., 2002). As such, β-arrestins play a role in attenuating PKA activation in
addition to their role in receptor desensitization.
cAMP-cGMP pathway cross-talk
In addition to cAMP, cGMP is an important regulator of cardiac function. Nitric
oxide (NO) and atrial natriuretic peptides activate guanylyl cyclase (GC) to produce
cGMP (Zaccolo and Movsesian, 2007). There are two forms of GC: soluble GC, which
is found in the cytosol and activated by NO, and particulate GC, which is localized to the
membrane and activated by natriuretic peptides. cGMP, in turn, activates downstream
effectors such as PKG and cyclic nucleotide-gated channels to mediate changes in
inotropy and metabolic responses. cAMP- and cGMP- mediated pathways often have
opposing effects on cardiac function, in part due to the opposite consequences of PKA
and PKG phosphorylation of target proteins. As was previously mentioned, cGMP can
also serve as a regulator of cAMP hydrolyzing PDEs (Zaccolo and Movsesian, 2007).
A potential mechanism for cGMP regulation of cAMP pathways involves the
differential sensitivities PDEs for cGMP. Low levels of cGMP (< 50nM) inhibit PDE3,
while intermediate levels (200nM < cGMP < 500nM) would also activate PDE2. At
higher levels of cGMP (> 1µM), PDE1 inhibition could also occur, although this has not
been demonstrated in vivo (Zaccolo and Movsesian, 2007). The presence of cGMP
anchoring proteins as well as restricted cGMP diffusion suggests the potential for cGMP
compartmentation, similar to that proposed for cAMP (Zaccolo and Movsesian, 2007).
The differential sensitivity of cAMP-hydrolyzing PDEs to cGMP and the potential for
12
cGMP compartmentation suggest a mechanism whereby distinct cGMP pools could
regulate PDEs and their associated pools of cAMP in cardiac myocytes.
A specific example of cAMP and cGMP pathway crosstalk is provided by the
work of Mongillo et al. (2006). They set out to investigate the effects of PDE2 activity
on the β-AD-mediated increase in cAMP using neonatal rat ventricular myocytes
expressing a genetically encoded cAMP sensor. As previously noted, PDE2 is a cGMP-
activated cAMP-hydrolyzing PDE. Specifically, PDE2 increases its hydrolytic activity in
response to cGMP binding to its N-terminal paired GAF domains. In a series of FRET
experiments, Mongillo et al. (2006) found that inhibition of PDE2 with the specific
inhibitor erythro-9-(2-hydroxy-3-nonyl)adenine (EHNA) and stimulation with NE
resulted in a similar increase in cAMP compared to complete PDE inhibition with IBMX.
However, the effects of EHNA were more than 30 times greater when the cAMP was
produced by NE stimulation than direct AC activation with forskolin. Using
immunocytochemsitry and confocal microscopy, they found that PDE2 localized to the
plasma membrane, in particular to cell to cell junctions and the sarcomeric Z-line
(Mongillo et al., 2006).
It has also been determined that NO activation with SNP decreases cAMP
produced by NE, while soluble GC (sGC) inhibition with ODQ reverses this effect.
PDE2 inhibition prevents SNP and ODQ from altering NE-generated cAMP levels,
indicating that an NO-dependent pathway may act through PDE2 to increase hydrolysis
of cAMP. Additionally, NE administration produced a similar amount of cGMP
regardless of whether β1 and β2 were blocked, leaving only the β3-AR active (Mongillo et
al., 2006). Furthermore, β3 inhibition increased cAMP generated in response to NE.
13
Mongillo et al. (2006) subsequently explored the functional consequences of PDE2
inhibition on adult mouse ventricular myocytes. They found that there was increased
fractional cell shortening and calcium transients with PDE2 inhibition and NE as opposed
to NE alone, and that these effects were significantly attenuated in endothelial nitric
oxide synthase (eNOS) homozygous knockout mice. There was no effect on fractional
cell shortening and calcium transients in the presence of PDE2 inhibition when the cAMP
was produced by direct activation of AC by forskolin (Mongillo et al., 2006).
In light of these results, the experimenters proposed a pathway whereby NE
activation of the β3-AR stimulates eNOS to produce NO. NO, in turn, activates sGC to
produce cGMP, which enhances PDE2 hydrolysis of cAMP produced by β1 and β2-ARs
in response to catecholaminergic stimulation (Mongillo et al., 2006). Consequently, this
study provides an example of cGMP-mediated attenuation of cAMP signaling, and of
crosstalk between the two pathways.
Cardiac Excitation-Contraction Coupling and G-Proteins
Many of the key elements involved in ECC and hormonal regulation of
contractility in heart cells are located at the t-tubules (Laflamme and Becker, 1999). T-
tubules are invaginations in the surface membranes of mammalian cardiac myocytes that
occur at the Z-line and are closely associated with the junctional sarcoplasmic reticulum
(SR). L-type calcium channels and ryanodine receptors (RyRs), the SR calcium release
channels involved in CICR and ECC, are found primarily at the t-tubules (Reviewed in
Brette and Orchard, 2003). The key elements of the β-adrenergic signaling cascade such
as Gs and AC are also concentrated at the t-tubules (Laflamme and Becker, 1999).
14
Like many of the components of ECC and β-adrenergic signaling, PDE4 enzyme-
activity is also located in the vicinity of the t-tubules and junctional SR in mammalian
cardiac myocytes. For example, PDE4D3 binds to mAKAPs in a complex which
contains PKA (Dodge et al., 2001; Lehnart et al., 2005). mAKAP is also bound to the
RyR, and PKA phosphorylation increases the Po of the RyR. The presence of this
macromolecular signaling complex provides a mechanism whereby cAMP access to PKA
can be both spatially and temporally regulated by PDE4D3, and also whereby cAMP
produced by β-adrenergic signaling can be localized and degraded (Dodge et al., 2001;
Lehnart et al., 2005).
The RyR macromolecular signaling complex
Another important target for cAMP signaling with important consequences for
contractility and disease states is the RyR macromolecular signaling complex. Brillantes
et al. (1994) conducted an important study of the skeletal muscle RyR channel and its
stabilization by the FK506-binding protein FKBP12. The RyR is composed of four
subunits, each of which binds one FKBP12. In the absence of FKBP12, single channel
recordings provide evidence for partial cooperativity between the four subunits in the
form of subconductance states. The expression of FKBP12 in insect cells eliminated
subconductance states, possibly because the prolyl isomerase activity of FKBP12
maintains proper folding of the RyR subunits. RyR co-expressed with FKBP12 had a
decreased Po but an increased mean open time, optimal parameters for calcium release
into the cytoplasm. Interestingly, drugs which interfered with the prolyl isomerase action
of FKBP12 induced muscle twitches in skeletal muscle preparations, indicating some
15
physiological effects of destabilization of the RyR channel in skeletal muscle (Brillantes
et al., 1994).
A subsequent study examined the regulation of FKBP12.6 binding to the RyR2
and how this could be modified in disease states. They found that FKBP12.6, the PKA
catalytic subunit, R2 (the PKA regulatory subunit), phosphatases PP1 and PP2A and
mAKAP are in a molecular complex with the RyR2, (Marx et al., 2000). Based on these
findings, they proposed that PKA phosphorylation of RyR2 causes FKBP12.6 to
dissociate from the complex, increasing Po of RyR2 by increasing its sensitivity to
calcium-dependent activation. Consequently, this provides a possible mechanism
whereby β-adrenergic cAMP signaling exerts its effects on contractility.
Marx et al. (2000) also investigated the characteristics of RyR2 in
pathophysiological conditions. They found that RyR2 was hyperphosphorylated in heart
failure, perhaps due to the observed decrease in phosphatases bound to the channel.
Hyperphosphorylation resulted in the loss of FKBP12.6 from RyR2, subconductance
states never seen in non-failing hearts and activation of RyR2 at resting levels of
cytosolic calcium. These findings perhaps explain the blunted β-adrenergic response
observed in heart failure: cAMP produced by β-adrenergic GPCRs is no longer able to
cause PKA to phosphorylate RyR2 because the channel is already hyperphosphorylated.
Dodge et al. (2001) conducted an important study to determine the nature of the
association between PKA, mAKAP and PDE4D3 in rat cardiac myocytes. They found
that the PKA holoenzyme (composed of two regulatory subunits and two catalytic R2
subunits) and the phosphodiesterase PDE4D3 are bound to mAKAP and consequently
proposed a mechanism for negative feedback of cAMP-dependent PKA activation. In
16
their model, PDE4D3 hydrolyzes low levels of cAMP to prevent basal activation of PKA.
However, hormonal stimulation results in an increase in cAMP, which is able to activate
PKA and cause the dissociation of the catalytic subunits from the regulatory subunits.
The catalytic subunits then phosphorylate PDE4D3, thereby increasing its activity. The
activated PDE4D3 hydrolyzes cAMP to cause the reformation of the PKA holoenzyme
(Dodge et al., 2001).
The work of Dodge et al. (2001) has many interesting implications in the context
of previous work by Marx et al. (2000). As was previously mentioned, Marx et al. (2000)
found that mAKAP was part of the RyR macromolecular signaling complex and that
hyperphosphorylation of the channel was a characteristic of heart failure. Consequently,
Dodge et al. (2001) hypothesized that disruption of PDE could lead to
hyperphosphorylation of RyR and the leaky channels characteristic in heart failure by
removing the feedback inhibition on the activation of PKA.
The L-type Ca2+
channel
There is also evidence that cAMP-signaling at the L-type Ca2+
channel shares
some features with cAMP-signaling at the RyR. Hulme et al. (2003) conducted a study
to determine the role of A-kinase anchoring proteins (AKAPs) in targeting PKA to
CaV1.2 channels, the major L-type Ca2+
channel in the heart. It was demonstrated that
AKAP15 targets PKA to the C-terminus of CaV1.1 in skeletal muscle via a leucine zipper
(LZ) interaction. In a sequence alignment of the C-terminus of CaV1.1, they found that
the LZ domain is conserved throughout CaV1. Additionally, CaV1.2
coimmunoprecipitated with AKAP15 from rat heart extracts as well as transfected tsA-
17
201 cells (Hulme et al., 2003). AKAP15 also coimmunprecipitated with the C-terminal
domain of CaV1.2 expressed on its own in tsA-201 cells. However, this interaction was
lost with mutations in CaV1.2 or AKAP15 that disrupted the putative LZ domain. Using
immunofluorescence, Hulme et al. (2003) determined that CaV1.2 and AKAP15 co-
localize at the t-tubules in rat ventricular myocytes. Finally, they determined that
inhibiting the PKA-AKAP15 interaction using HT31 or the AKAP- CaV1.2 interaction
using AKAP15LZ(38-54) (the leucine zipper domain of AKAP15) attenuated the
isoproterenol-mediated increase in ICa,L. This was not seen in with the addition of an
AKAP15LZ(38-54) LZ mutant to the pipette solution. Consequently, they proposed that an
LZ domain on the C-terminus of CaV1.2 anchors PKA via AKAP15 to mediate the β-
adrenergic increase in ICa,L in heart cells (Hulme et al. 2003). While it is currently
unknown if a PDE is associated with the AKAP15-PKA complex, its presence would not
be surprising given previous studies of cAMP signaling and RyR2.
Calcium Channels of the Sarcolemma
In cardiac myocytes, a significant fraction of L-type Ca2+
channels are localized to
the t-tubules in close proximity to SR Ca2+
release channels. However, they are also
found on the surface sarcolemma (Balijepalli et al., 2006). Using immunofluorescence
labeling, it was found that Cav1.2 (the pore forming unit of the L-type Ca2+
channel) and
Cav-3 co-localize on surface membrane domains and punctuate areas consistent with t-
tubules in cardiac myocytes. They also found that both proteins colocalize to caveolae in
cardiac myocytes using immunogold labeling and electron microscopy, which provides
better spatial resolution than confocal microscopy. Cav1.2 immunoprecipitated with β2-
18
AR, Gαs, AC, PKARII, and PP2A, but not β1-AR or Gαi, while Cav-3 immunoprecipitated
with the same proteins as well as Gαi (Balijepalli et al., 2006). This suggests that
caveolar Cav1.2 channels are part of a macromolecular signaling complex.
Electrophysiological experiments were subsequently performed on neonatal
mouse ventricular myocytes. Balijepalli et al. (2006) disrupted Gi with pertussis toxin in
order to determine the effects of β2-AR stimulation on ICa,L. β2-AR stimulation of ICa,L
was eliminated by disruption of caveolae with methyl-beta cyclodextrin (MBCD)
whereas β1-AR stimulation of ICa,L was unaffected. These results were confirmed by
small interfering ribonucleic acid (siRNA) directed against Cav-3, which eliminated the
effect of β2-AR stimulation on ICa,L. The results of this study indicate that there are a
subpopulation of L-type Ca2+
channels localized to caveolae as part of a macromolecular
signaling complex necessary for β2-AR regulation of ICa,L (Balijepalli et al., 2006).
Along with the work of Nikolaev et al. (2006) and Rybin et al. (2000), the work
of Balijepalli et al. (2006) indicates that factors other than the localization of PDEs can be
important in the compartmentation of second messenger pathways. Specifically, these
results suggest that there may be different ways of regulating Ca2+
channel/β-AR
interactions in the caveolae (mostly β2-AR) versus the ECC associated t-tubules (β1-AR),
the latter which seems to rely more heavily on PDEs to localize the cAMP signal.
Role of PDEs and associated proteins in disease states
In light of the potential clinical applications of the aforementioned research, the
effect of FKBP12.6 deficiency on arrhythmias has been studied (Wehrens et al., 2003).
Ventricular arrhythmias can be rapidly fatal, a phenomena known as sudden cardiac
19
death (SCD). SCD is responsible for approximately 50% of deaths in heart failure, and is
associated with many common cardiac diseases. Triggered arrhythmias can be caused by
delayed after depolarizations (DADs), which are premature depolarizations after
repolarization of the cardiac action potential due to aberrant SR calcium release.
During exercise, catecholamines activate β-ARs in the heart. Catecholaminergic
polymorphic ventricular tachycardia (CPVT) is an arrhythmogenic disorder of the heart
characterized by ventricular tachycardia during exercise but not at rest. Mutations in the
gene coding for human RyR2 are associated with this disease (Wehrens et al., 2003).
It has been shown that FKBP12.6-/-
mice displayed exercise-induced ventricular
arrhythmias similar to those in CPVT (Wehrens et al., 2003). Heart cells from these mice
showed DADs upon the administration of catecholamines. Additionally, RyR2 channels
from FKBP12.6-/-
mice which had exercised showed subconductance states and had a
greater Po than controls. Wehrens et al. (2003) also expressed three mutant RyR2
channels associated with CPVT in HEK 293 cells. These cells showed depletion of
FKBP12.6 from the RyR2 complex and increased Po with PKA phosphorylation, which
mimics the effect of exercise-induced β-AR signaling in humans. They proved that the
lack of FKBP12.6 from RyR2 caused the observed subconductance states and increases
in Po by generating a mutant FKBP12.6 which could bind to phosphorylated RyR2
channels. This mutant bound to RyR2 in exercised FKBP12.6-/-
mice as well as CPVT
RyR mutant channels treated with PKA and abolished the previously observed
subconductance states and elevated Po.
It is interesting to note that the depletion of FKBP12.6 from the RyR2
macromolecular complex in the PKA-phosphorylated CPVT mutants in this study and the
20
RyR2 from failing human heart in their previous study (Marx et al. 2000) resulted in
similar single channel properties, namely, subconductance states and increased Po at low
cytosolic calcium levels. In both cases, this may promote diastolic calcium leak and
contribute to arrhythmias. Consequently, it is possible that the depletion of FKBP12.6
from RyR2, due to a mutation in CPVT or β-adrenergic hyperphosphorylation in heart
failure, is a mechanism for triggered arrhythmias caused by diastolic calcium leak.
The role of PDEs in regulating cAMP signaling and the consequences of
problems with this regulation has been further explored. It was determined that PDE4D3
is the only isoform of PDE4 found in the RyR2 complex and that PDE4D3 is decreased
in humans with heart failure (Lehnart et al., 2005). They then created a PDE4D3-/-
knockout mouse which was prone to age-related cardiomyopathy. The PDE4D3-/-
knockout had increased PKA phosphorylation of RyR2 and decreased FKBP12.6
binding. Single channel recordings showed increased Po with respect to wild type as well
as subconductance states. The knockout mice were prone to exercise induced cardiac
arrhythmias, whereas wt mice were not. In addition, wt mice treated with the PDE4-
blocker rolipram and put on the exercise regimen had arrhythmias, which were not
present in rolipram-treated RyR2-S2808A+/+
knockin mutants that have a RyR2 channel
which cannot be phosphorylated (Lehnart et al, 2005).
Further investigating the effect of PDE4D3+/-
post-myocardial infarction (MI), it
was found that these mice have a similar level of PDE4D3 in RyR2 as human heart
failure patients. Crossing the PDE4D3+/-
mice with RyR2-S2808A+/+
or treating them
with JTV-519, which enhances Calstabin 2 (FKBP12.6) binding, significantly improved
cardiac performance post MI. RyR2 phosphorylation was significantly decreased post
21
MI in the PDE4D3+/-
/ RyR2-S2808A+/+
cross and with JTV-519 treatment, and PDE
activity in the RyR2 complex was increased with respect to PDE4D3+/-
(Lehnart et al,
2005).
Taken together with their previous study of CPVT (Wehrens et al., 2003), this
work by Lehnart et al. (2005) can help us form a general understanding about a way in
which arrhythmias may be triggered in heart failure. In CPVT, exercise increases β-AR
generation of cAMP, which triggers PKA to phosphorylate RyR2, causing the depletion
of FKBP12.6 from the complex due to a mutation in the RyR2. This increases Po of
RyR2 and induces subconductance states and arrhythmias. β-AR stimulation is increased
in heart failure, and it was shown that human heart failure patients exhibit a decrease in
PDE4D3 in the macromolecular signaling complex (Lehnart et al., 2005). The increased
β-AR stimulation results in the generation of cAMP, which triggers PKA to
phosphorylate RyR2. The lack of PDE4D3 in heart failure prevents the attenuation of the
β-AR signal, leading to the hyperphosphorylation of RyR2 and the depletion of
FKBP12.6 from the complex. This increases Po of RyR2 and induces subconductance
states and, therefore, arrhythmias.
It would seem as if a potential cause of arrhythmias in CPVT and this model of
heart failure is the depletion of FKBP12.6 from the RyR2 complex. In CPVT, this is due
to a mutation in RyR2 which decreases FKBP12.6 binding with β-adrenergic stimulation.
In the model of heart failure used by Lehnart et al. (2005), FKBP12.6 depletion is due to
decreased PDE4D3 in the RyR2 complex. Heart failure is characterized by a
hyperadrenergic state, and decreased PDE4D3 would result in the faulty termination of
22
the β-adrenergic cAMP cascade, hyperphosphorylation of RyR2 and depletion of
FKBP12.6.
cAMP compartmentation
It is evident from the aforementioned discussion that regulation of cellular cAMP
levels is complex and dynamic. This process is relevant to the normal functioning of
every cell in the body and involved in disease states in specific organs such as the heart.
However, there has been a question since the discovery that cAMP is involved in many
cellular pathways; how can a conserved second messenger generate distinct responses to
a wide variety of first messengers? It would appear there are several mechanisms
controlling β-AD-mediated cAMP signaling, including differential receptor localization.
However, there is mounting evidence that PDEs form an important locus for the
regulation of cellular cAMP. In particular, there are studies supporting the idea that the
distinct subcellular localization of PDEs is responsible for the creation of distinct cAMP
signals in response to first messengers.
One of the first studies addressing the compartmentation of cAMP was conducted
by Jurevicius and Fischmeister (1996). They found that the local application of
isoproterenol, a β-AR agonist, resulted in a local increase in ICa,L, implying a local
increase of cAMP. However, direct activation of AC by forskolin (FSK) resulted in
widespread activation of ICa,L, implying the activation of a cAMP pathway which was not
spatially limited. This also occurred when isoproterenol was applied in the presence of
IBMX, a non-selective PDE inhibitor. It was concluded that PDE hydrolysis of cAMP
around ICa,L prevents diffusion, thereby compartmentalizing cAMP (Jurevicius and
23
Fischmeister, 1996). Consequently, their finding that cAMP could be compartmentalized
by PDEs suggested a mechanism whereby pathways using cAMP could be segregated
from one another and have different cellular effects.
Direct evidence for the compartmentation of cAMP signaling in cardiac tissue
was provided by a fluorescence resonance energy transfer (FRET) study of neonatal rat
cardiac myocytes (Zaccolo and Pozzan, 2002). It was reported that activation of the β-
AR resulted in a local increase of cAMP in the vicinity of the t-tubules and junctional SR.
PKA, a substrate for cAMP, was also anchored in this region via AKAPs. PDEs
prevented cAMP diffusion, and PDE inhibition resulted in generalized activation of PKA.
Importantly, only AKAP-anchored PKA could sense the change in cAMP produced by β-
AR activation, suggesting a localized β-AR second messenger pathway (Zaccolo and
Pozzan, 2002).
In a follow up FRET study, Mongillo et al. (2004) set out to determine which
PDEs were involved in mediating the β-adrenergic cAMP signal. It was found that β-
adrenergic stimulation by norepinephrine, in the presence of the PDE3 inhibitor
cilostamide, resulted in a transient increase in cAMP. The transient nature of the increase
in cAMP was possibly due to the activation of PDE4 by PKA. However, when they
administered norepinephrine in the presence of the PDE4 inhibitor Ro 20-1724, they
found that there was a stable increase in cAMP, implying that PDE4 was the PDE
involved in mediating the β-adrenergic signal. They also determined that PDE3 was
possibly localized on internal membranes while PDE4 was localized to the M-line and Z-
line, where PKA was also found. It was concluded that PDE4, especially PDE4B2,
24
played a major role in the localization of the β-adrenergic cAMP signal, and that its
specific subcellular localization could contribute to this role (Mongillo et al. 2004).
Rochais et al. (2006) compared the different cAMP signals generated by four
different GPCRs; β1-AR, β2-AR, Glu-R and the EP1 receptor. By using high-affinity
cyclic nucleotide-gated (CNG) channel mutants, they were able to directly monitor the
concentration of cAMP below the plasma membrane in cultured adult rat ventricular
myocytes. They found that blocking PDE3 or PDE4 increased the β1-adrenergic cAMP
signal, while blocking both PDE3 and PDE4 increased the β2-adrenergic and PGE1
cAMP signals. Blocking PDE4 increased the cAMP generated below the plasma
membrane by glucagon.
The effect of PDE inhibitors downstream on ICa,L was generally similar to that
observed with the CNG channels. PDE3 and more prominently PDE4 control the effect
of β1-adrenergic and β2-adrenergic stimulation on ICa,L while PDE4 is responsible for
limiting the effect of glucagon. PGE1 did not have an effect on ICa,L even with inhibition
of PDE3 and PDE4, suggesting that cAMP generated by PGE1 is not coupled to ICa,L.
Because PDE inhibition generally had similar effects on cAMP generation and ICa,L, this
study offers evidence that the regulation of cAMP by PDEs has important downstream
consequences in cardiac myocytes (Rochais et al., 2006).
Conceptual models for PDE regulation of cAMP diffusion
There are two conceptual models for how PDEs regulate internal cAMP: PDEs
act as a barrier to prevent cAMP diffusion from the site of synthesis or as a drain to
prevent inappropriate activation of PKA by cAMP. Because cAMP is produced by
25
membrane-bound AC, the barrier model would involve a high concentration of cAMP at
the plasma membrane which becomes progressively less concentrated further away from
the membrane. The problem with this model is that plasma-bound PKA would be much
easier to activate than PKA deep in the cytosol, as cAMP would have to pass through a
PDE barrier at the membrane to activate cytosolic PKA. With regards to finely-tuned
activation of particular PKA subsets, the question arises of how it would be possible to
activate PKA deep inside the cell without concurrently activated PKA closer to the
membrane (Reviewed in Zaccolo et al., 2006).
In the drain model, there is freely diffusing cAMP which can reach a significant
concentration to activate PKA throughout the cell except where it is hydrolyzed by
localized PDEs. As such, rather than acting as a barrier to prevent cAMP diffusion
throughout the cell, PDEs would act, in the words of Zaccolo et al. (2006); “in defined
compartments to protect sensitive targets from inappropriate activation.” This model is
plausible, although questions arise regarding the degree to which it allows for finely
tuned regulation of PKA activation. As it is, the “drain” model could provide a useful
conceptual framework for the analysis of functional data showing the effects of PDE
disruption.
26
Hypothesis and Objectives
Based on the preceding discussion, it is evident that PDEs play an essential role in
cardiac physiology and pathophysiology. It is also evident that β-AR signaling is quite
complex and is in need of further investigation at the single cell level. Therefore, our
goal is to examine the role of PDEs as a mediator for the actions of isoproterenol, a β-AR
agonist, on unloaded cell shortening, calcium currents, calcium transients and SR calcium
load. We will specifically examine the effects of PDE3 and PDE4 inhibition, as these
families are well known to contribute to the vast majority of cAMP hydrolyzing activity
in the heart, as well as the fact that highly specific blocking agents exist (Mongillo et al.,
2004).
Our hypothesis is that the subcellular localization of different PDEs regulates
distinct effects of isopoterenol on cellular contractility, calcium currents and
calcium uptake and release from the SR. This compartmentation theory is based on
previous studies that have suggested that PDE3 is associated with the membrane while
PDE4 is localized to the Z-line (Mongillo et al., 2004, Lehnart et al., 2005).
There are several unique aspects of our study in relation to previously published
work. Firstly, we are using freshly dissociated adult ventricular myocytes, whereas
previous studies have used cultured ventricular myocytes (Rochais et al., 2006). Cardiac
myocytes are notorious for phenotypic changes during culture, which is why these studies
must be conducted with freshly dissociated cells (Reviewed in Mitcheson et al., 1998).
Secondly, we are performing all electrophysiological experiments using the perforated
patch clamp configuration, whereas previous studies have used whole cell (Rochais et al.,
2006; Kerfant et al., 2007).
27
Calcium current rundown in whole cell (Belles et al., 1988; Korn and Horn, 1989;
Fukumoto et al., 2005) due to dephosphorylation of L-type calcium channels (Ono et al.,
1992) is well characterized in cardiac myoctyes. Additionally, whole cell is known for
disrupting the internal cellular environment (Liem et al., 1995), which could be
problematic when studying second messengers. We propose to avoid these difficulties
using the perforated patch clamp technique.
28
CHAPTER 2: METHODS
Cell isolation
Cardiac myocytes were isolated from the right ventricular free wall of male
Sprague-Dawley rats (225-275g) using the method of Ward and Giles (1997) with slight
modifications. Animals were killed by decapitation using a protocol approved by the
Queen’s University Animal Care Committee in accordance with Canadian Council on
Animal Care guidelines. The heart was rapidly removed and mounted on a cannula for
retrograde perfusion at a rate of 10mL/min using standard Langendorff apparatus. The
nominally Ca2+
-free Tyrode’s solution contained (mM): NaCl 140; KCl 5.4; MgCl2 1;
Na2HPO4 1; HEPES 5; glucose 10. The pH was adjusted to 7.4 with NaOH and
continuously gassed with 100% O2.
Hearts were initially perfused with standard Tyrode’s solution containing 1 mM
CaCl2, followed by 5 min of perfusion with the Ca2+
-free Tyrode’s solution. After this,
the heart was perfused for 7-8 min with standard Tyrode’s solution to which collagenase
(0.02 mg/mL; Yakult Co. Ltd, Tokyo) and protease (0.004 mg/mL; Type XIV; Sigma)
had been added. The right ventricular free wall was then removed and minced in 10mL
of Tyrode’s solution containing collagenase (0.5 mg/mL), protease (0.1 mg/mL), bovine
serum albumin (BSA; 2.5 mg/mL; Sigma) and CaCl2 (50 M). The tissue was gently
agitated in a shaker bath for 10-30 minutes at 37 oC until dissociated cells were observed.
Once myocytes were present, aliquots were removed at 3 min intervals and stored in 4mL
of modified KB solution containing (in mM): potassium glutamate 100; potassium
aspartate 10; KCl 25; glucose 20; KH2PO4 10; HEPES 5; MgSO4 2; taurine 20; creatine
5; and EGTA 0.5; with 1mg/mL BSA, pH was adjusted to 7.2 with KOH.
29
Cell-Shortening recordings
To record unloaded cell shortening, which is representative of cardiac
contractility, myocytes were field stimulated with a Grass SD9 stimulator at a rate of
1Hz. The video signal from the microscope was fed to an edge detection device
(Crescent Electronics, USA). Output from the edge detection device was acquired using
a pClamp 9.0 / Digidata 1320 data acquisition system and calibrated for cell length. Data
are expressed as fractional unloaded cell shortening, which is defined as percent
contraction of resting cell length with respect to t=0, the time immediately prior to
isoproterenol (Sigma) administration.
Electrophysiological methods
Borosilicate glass electrodes were pulled on model P97, Sutter Instruments pipette
puller. When filled with internal solution, pipette resistances ranged from 1 to 3 M.
Cells were superfused with standard Tyrode’s solution for potassium current
recordings. The solution used to fill the pipettes contained (mM): KCl 20; K-Aspartate
(L-Aspartic Acid) 110, EGTA 10, HEPES 10, MgCl2 1, K2ATP 5, CaCl2 1, NaCl 10; pH
was adjusted to 7.2 with KOH. These solutions created a junction potential of
approximately 10 mV, which was compensated for.
Potassium currents were recorded during voltage clamp protocols using the
perforated patch configuration. The transient outward (Ito), inward rectifier (IK1), and
delayed rectifier (Isus) potassium currents were triggered using 500ms test pulses ranging
from -120mV to +50mV, in 10mV increments, from a holding potential of -80mV. The

30
protocol was repeated with a pre-pulse to inactivate Ito, which consisted of a step to -
40mV for 100ms immediately prior to the 500ms test pulses. The isolated Ito peak
current amplitude was determined by subtraction of currents derived from the two
protocols. IK1 currents were recorded with and without BaCl2 (200μM), a selective
inhibitor, from a holding potential of -80mV, with 500ms test pulses ranging from -
120mV to +50mV, in 10mV increments. The IK1 current was derived by subtracting the
resultant currents in the presence and absence of BaCl2. Isus measurements were taken
from the residual current of the 500ms pulses recorded from -120mV to +50mV, in
10mV increments, from a holding potential of -80mV. Isus was observed in isolation after
200µM BaCl2 was applied, along with a 100ms pre-pulse to -40mV to eliminate IK1 and
Ito, respectively. Action potentials were triggered using a 5ms, 700pA current injection.
For perforated patch calcium current recordings, the modified Tyrode’s solution
used for superfusion contained (mM): NaCl 140; CsCl 3; CaCl2 1; KCl 5.4, Na2HPO4 1;
HEPES 5; glucose 10; MgCl2 1; Lidocaine 0.25 with pH adjusted to 7.4 with NaOH. The
solution used to fill the pipettes contained (mM): CsOH 120; aspartic acid 120; CsCl 30;
MgCl2 1; Na2ATP 5; HEPES 10; EGTA 1; pH was adjusted to 7.2 with CsOH.
L-type Ca2+
currents were elicited at a rate of 0.1 Hz from a holding potential of -
80 mV with a 1s ramp to -40 mV (to voltage inactivate sodium currents) followed by a
300 ms step to 0 mV to activate ICa,L. Currents were sampled at 10 kHz and filtered at 1
kHz. All data was acquired and analyzed with the pClamp 9.0/Digidata 1320 data
acquisition system. All currents were initially expressed relative to cell capacitance and
reported as current density (pA/pF). Data were subsequently expressed as fractional
31
current, which is defined as percent current with respect to t=0, the time immediately
prior to isoproterenol administration.
For amphotericin-perforated patch recordings, a stock solution was made by
sonicating 3 mg amphotericin B (Sigma) in 30 L dimethylsulphoxide. Immediately
prior to each experiment, 3.33 L amphotericin stock was added to 1 mL of internal
solution and sonicated briefly. When protected from light, this solution remained stable
(for electrophysiological recordings) for up to 2 h. Prior to back-filling of the electrodes,
the tips were dipped in amphotericin-free internal solution to enhance seal formation.
Calcium transient recordings
Rat myocytes were loaded with fluo-3 AM (Invitrogen/Molecular Probes,
Carlsbad, CA) at 2.28 µM for 30 min in Ca2+
-free Tyrode’s solution. Cells were
superfused with a standard Tyrode’s solution (Ca2+
-containing) for the recordings. Cells
were visualized under oil immersion with a 100X objective (Nikon) and Type A oil
(Fisher Scientific). For these experiments, we used an excitation wavelength of 480 nm
using a Model 1600 Power Supply (Opti Quip), a model 720 lamp house with a 150W
Xenon bulb and a DX-100 optical switch (Solamere Tech Group). Emitted fluorescence
was recorded at 510 nm using a microfluorimeter and digitized using the pClamp 9.0 /
Digidata 1320 data acquisition system. Calcium transients were elicited by field
stimulating using a Grass SD9 stimulator at a rate of 1Hz. Changes in Fluo-3 AM
fluorescence were expressed as a ratio (R) of fluorescence intensity (F) to the basal
fluorescence intensity (F0). Data are expressed as fractional fluorescence, which is
32
defined as percent fluorescence with respect to t=0, the time immediate prior to
isoproterenol administration.
Caffeine-pulse experiments
Rat myocytes were loaded with fluo-4 AM (Invitrogen/Molecular Probes,
Carlsbad, CA) at 2.3 µM for 15 min in Ca2+
-free standard Tyrode’s solution. Cells were
superfused with a Tyrode’s solution (Ca2+
-containing) for the recordings. Fluo-4 was
used in preference to fluo-3 due to prior experience with Fluo-3 for the calcium transient
experiments. Fluo-4 permeates the cell membrane faster than Fluo-3 and is also a
brighter dye, yielding higher resolution recordings (Gee et al., 2000). The cells were
stimulated with a Grass SD9 stimulator at a rate of 1Hz for five minutes before the first
caffeine-pulse recording. These five minutes were meant to serve as an equilibration
period for the cells to attain a stable level of SR calcium.
To perform a caffeine pulse experiment, the stimulator and perfusion system were
turned off while fluo-4 fluorescence was measured using the same wavelengths as those
used for fluo-3. The cells were subsequently exposed to a rapid, unrestricted (gravity-
limited) flow of Tyrode’s solution containing 10mM caffeine, which causes release of the
bulk of SR calcium (Su et al., 2003). At the end of the 75 or 90 second recording
(recording time was selected to ensure the fluorescence level would return to a stable
baseline), the caffeine perfusion was turned off, the stimulator was turned on and cells
were again superfused with the standard Tyrode’s solution. A second caffeine pulse
experiment was performed 10 minutes after the standard Tyrode’s superfusion was turned
back on. Emitted fluorescence was recorded using a pClamp 9.0 / Digidata 1320 data
33
acquisition system. Area under the curve was taken as a measure of SR calcium content.
Data are expressed as fractional fluorescence, which is defined as percent fluorescence
with respect to t=0, the time immediate prior to isoproterenol administration.
Statistical Analysis
All statistical analysis was done using GraphPad Prism 4.0 software. Statistical
analysis was performed using an ANOVA, followed by a Newman-Keuls post-hoc test
when appropriate. An unpaired student’s t test with two tails was used when there were
only two values available for comparison. Data are considered statistically different with
P < 0.05.
34
CHAPTER 3: RESULTS
In order to determine a concentration of isoproterenol that would allow us to
observe the consequences of PDE inhibition on our experimental parameters, we
constructed a concentration-response curve for the effects of isoproterenol on unloaded
cell shortening (Figure 1). Rat cardiac myocytes were continuously field stimulated at a
rate of 1 Hz. Various concentrations of isoproterenol, or vehicle control, were added to
the superfusion solution and the effects recorded every two minutes over a ten minute
period. No changes in unloaded cell shortening were observed in the control group
(n=12). The addition of 1 nM isoproterenol lead to a small, insignificant increase in
unloaded cell shortening to 114 ± 11 % (n=7) of t=0. In contrast, both of 3 nM (n = 8)
and 10 nM isoproterenol (n = 7) caused significant increases in contractility, with
increases to 190 ± 17 % and 265 ± 22 % of t=0, respectively. As can be seen with 30 nM
isoproterenol (n=8), further increasing the concentration of isoproterenol did not lead to
additional increases in unloaded cell shortening suggesting that the maximum
contractility of these cells had been achieved. Additionally, at these higher
concentrations, signs of calcium overload, such as spontaneous activity, became evident
(Table 1).
Based on the concentration-response curve, we decided to use an isoproterenol
concentration of 1nM in all subsequent experiments. This was selected since we
predicted that inhibition of phosphodiesterase activity would potentiate the effects of β-
adrenergic stimulation and we wished to use a level of stimulation that elicited sub-
maximal effects on its own.
35
-5 0 5 1075
100
125
150
175
200
225
250
275
300
325
350Isoproterenol
**
**
*
**
*
**
* *
Time (Minutes)
Un
load
ed
Cell
Sh
ort
en
ing
(% o
f t=
0)
Figure 1. Concentration-dependent effects of isoproterenol on unloaded
cell shortening. Cardiac myocytes were superfused with Tyrode's solution for
five minutes prior to the addition of select concentrations [(0nM (black
squares); 1nM (green diamonds); 3nM (orange triangles); 10nM (open red
circles); 30nM (open blue squares)] of isoproterenol. Myocytes were
continuously field stimulated at a rate of 1 Hz. Data are expressed as a
percentage of unloaded cell shortening relative to time = 0, the time at which
isoproterenol was added to the superfusion solution. Values represent the mean
± standard error of the mean for n = 7-12 experiments. (*) indicates data
significantly different (p<0.05) from control values.
36
Table 1. Isoproterenol Unloaded Cell Shortening Dose Response Curve
Overload at 20 Minutes Overload before 20
Minutes
Treatment None Partial Complete Complete Died Excluded
Control 12
1nM Iso 7 2
3nM Iso 8 1 5
10nM Iso 3 8 1 9
30nM Iso 4 4 1 2
37
To evaluate the effect of PDE inhibition on isopreterenol-stimulated increases in
unloaded cell shortening, we selected two putatively selective PDE inhibitors.
Cilostamide was chosen as a selective inhibitor of PDE3 while Ro 20-1724 was chosen as
a selective inhibitor of PDE4 (Rochais et al., 2006). For these experiments, we recorded
baseline shortening five minutes prior to the addition of either cilostamide (1 M;
Sigma), Ro 20-1724 (10 M; Calbiochem) or vehicle control, followed by a five minute
pre-treatment period prior to the cardiac myocytes being challenged with 1nM
isoproterenol. Unloaded cell shortening was recorded immediately prior to the addition
of isoproterenol and subsequently every two minutes over a 10 minute period.
Representative data of these experiments is presented in Figure 2.
Pooled data demonstrating the effects of cilostamide pre-treatment on
isoproterenol-stimulated increases of unloaded cell shortening are shown in Figure 3. As
can be seen, addition of isoproterenol, following cilostamide pre-treatment, resulted in an
increase of unloaded cell shortening to 216 ± 17 % (n=8) of t=0 at 10 minutes. This
increase is significantly greater than that observed with isoproterenol alone, which was to
114 ± 11 % (n=7) of t=0 at 10 minutes. Repeating these experiments with Ro 20-1724
instead of cilostamide produced the results shown in Figure 4. In the presence of Ro 20-
1724, 10 minutes exposure to isoproterenol increased unloaded cell shortening to 155 ±
12 % (n=8) of t=0. Figure 5 is a re-plot of the cilostamide + isoproterenol and Ro 20-
1724 + isoproterenol data from Figures 3 and 4. As can be seen when the data are
presented together, the effects of cilostamide were significantly greater than those of Ro
20-1724 between two and 10 minutes isoproterenol exposure. Overload was a minor
factor in these experiments (Table 2).
38
Figure 2. Representative data illustrating the effects of PDE inhibition
on unloaded cell shortening. Cardiac myocytes were continuously field
stimulated at a rate of 1Hz throughout the entire experiment. The effects of
vehicle control (top left), isoproterenol alone (1 nM; top right), cilostamide
and isoproterenol (1µM and 1 nM, respectively; bottom left) and Ro 20-1724
+ isoproterenol (10µM and 1 nM, respectively; bottom right) are shown.
Baseline shortening was recorded for five minutes prior to the addition of PDE
inhibitors, followed by a five minute pre-treatment period prior to the cardiac
myocytes being challenged with isoproterenol at t=0 minutes. Unloaded cell
shortening was recorded immediately prior to the addition of isoproterenol
and subsequently every two minutes over a 10 minute period. Sample traces
were recorded at t=0 minutes (black) and t=10 minutes (red). Diastolic cell
lengths (µm) at t=0 are listed above the baseline region in the sample traces.
Control Iso
Cilo + Iso Ro + Iso
500 msec
131 127
94
10
m
104
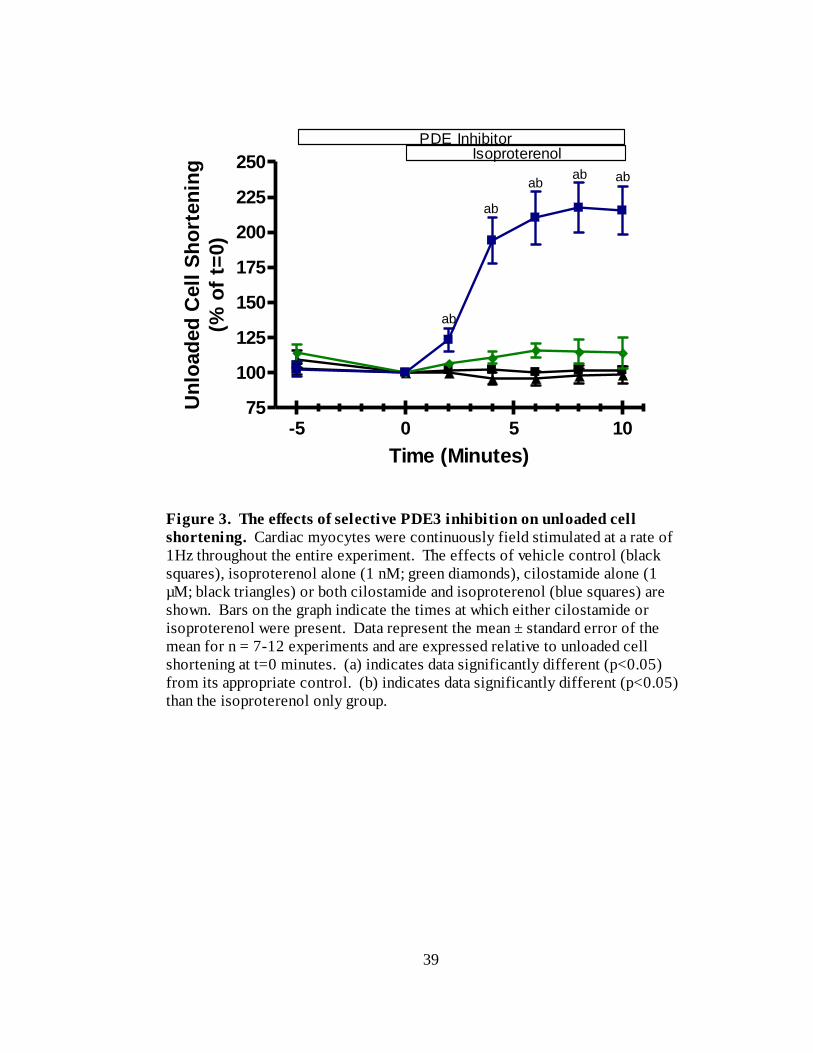
39
-5 0 5 1075
100
125
150
175
200
225
250abab
ab
ab
PDE InhibitorIsoproterenol
ab
Time (Minutes)
Un
load
ed
Cell
Sh
ort
en
ing
(% o
f t=
0)
Figure 3. The effects of selective PDE3 inhibition on unloaded cell
shortening. Cardiac myocytes were continuously field stimulated at a rate of
1Hz throughout the entire experiment. The effects of vehicle control (black
squares), isoproterenol alone (1 nM; green diamonds), cilostamide alone (1
µM; black triangles) or both cilostamide and isoproterenol (blue squares) are
shown. Bars on the graph indicate the times at which either cilostamide or
isoproterenol were present. Data represent the mean ± standard error of the
mean for n = 7-12 experiments and are expressed relative to unloaded cell
shortening at t=0 minutes. (a) indicates data significantly different (p<0.05)
from its appropriate control. (b) indicates data significantly different (p<0.05)
than the isoproterenol only group.
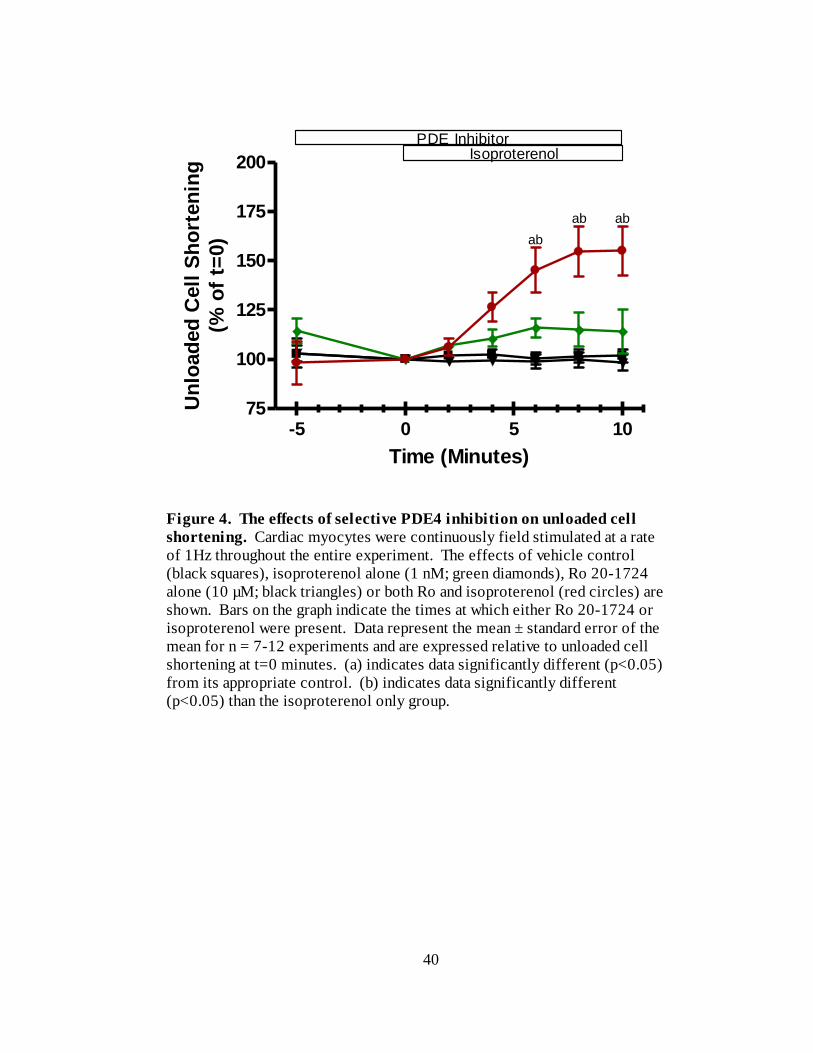
40
-5 0 5 1075
100
125
150
175
200
ab
PDE InhibitorIsoproterenol
abab
Time (Minutes)
Un
load
ed
Cell
Sh
ort
en
ing
(% o
f t=
0)
Figure 4. The effects of selective PDE4 inhibition on unloaded cell
shortening. Cardiac myocytes were continuously field stimulated at a rate
of 1Hz throughout the entire experiment. The effects of vehicle control
(black squares), isoproterenol alone (1 nM; green diamonds), Ro 20-1724
alone (10 µM; black triangles) or both Ro and isoproterenol (red circles) are
shown. Bars on the graph indicate the times at which either Ro 20-1724 or
isoproterenol were present. Data represent the mean ± standard error of the
mean for n = 7-12 experiments and are expressed relative to unloaded cell
shortening at t=0 minutes. (a) indicates data significantly different (p<0.05)
from its appropriate control. (b) indicates data significantly different
(p<0.05) than the isoproterenol only group.
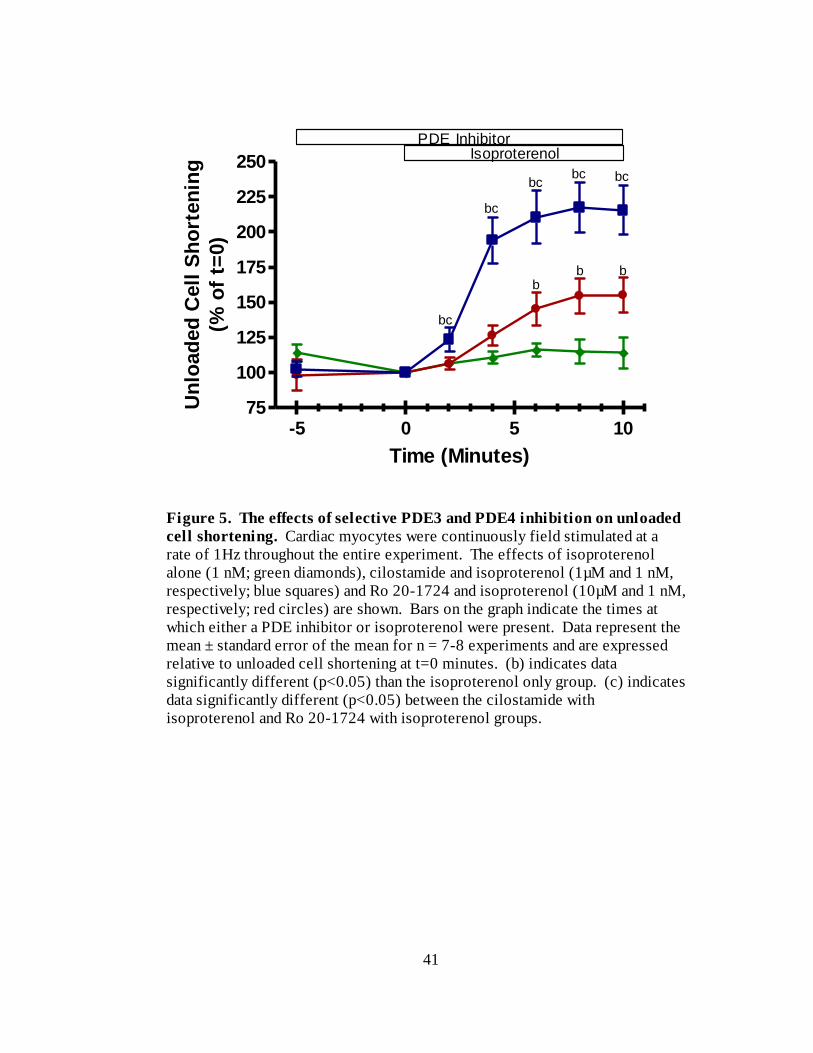
41
-5 0 5 1075
100
125
150
175
200
225
250
bc
bc
b
bc bc
PDE InhibitorIsoproterenol
b b
bc
Time (Minutes)
Un
load
ed
Cell
Sh
ort
en
ing
(% o
f t=
0)
Figure 5. The effects of selective PDE3 and PDE4 inhibition on unloaded
cell shortening. Cardiac myocytes were continuously field stimulated at a
rate of 1Hz throughout the entire experiment. The effects of isoproterenol
alone (1 nM; green diamonds), cilostamide and isoproterenol (1µM and 1 nM,
respectively; blue squares) and Ro 20-1724 and isoproterenol (10µM and 1 nM,
respectively; red circles) are shown. Bars on the graph indicate the times at
which either a PDE inhibitor or isoproterenol were present. Data represent the
mean ± standard error of the mean for n = 7-8 experiments and are expressed
relative to unloaded cell shortening at t=0 minutes. (b) indicates data
significantly different (p<0.05) than the isoproterenol only group. (c) indicates
data significantly different (p<0.05) between the cilostamide with
isoproterenol and Ro 20-1724 with isoproterenol groups.
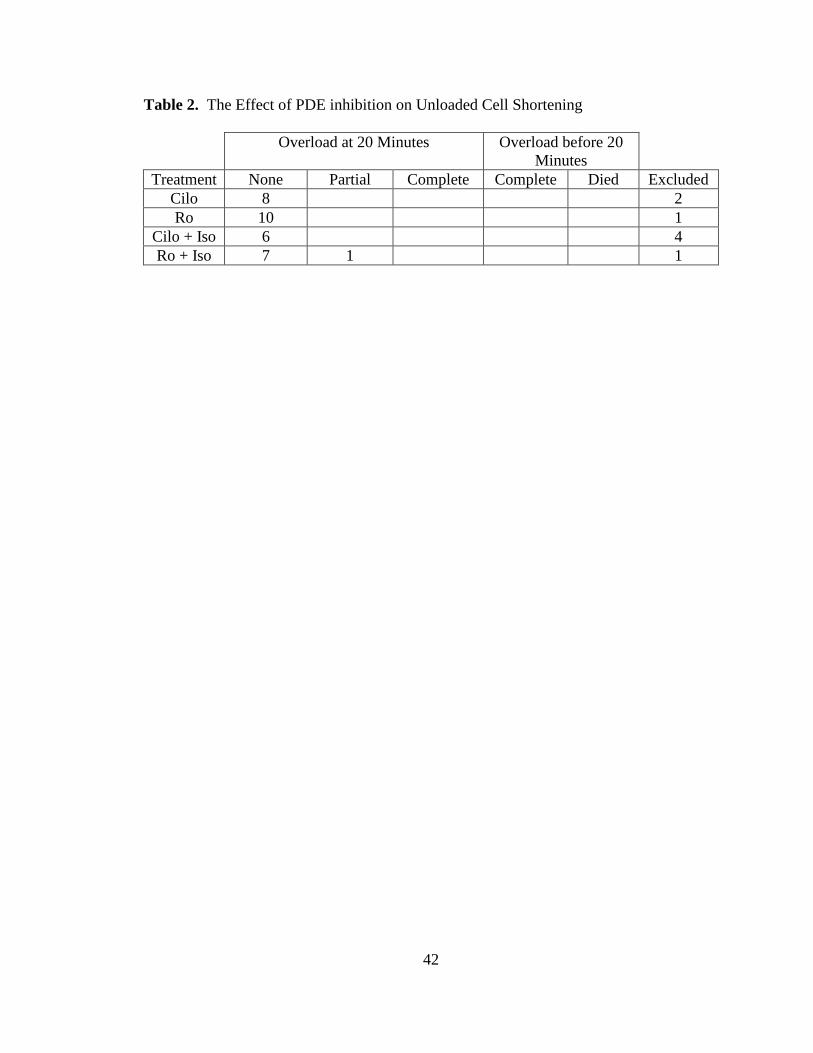
42
Table 2. The Effect of PDE inhibition on Unloaded Cell Shortening
Overload at 20 Minutes Overload before 20
Minutes
Treatment None Partial Complete Complete Died Excluded
Cilo 8 2
Ro 10 1
Cilo + Iso 6 4
Ro + Iso 7 1 1
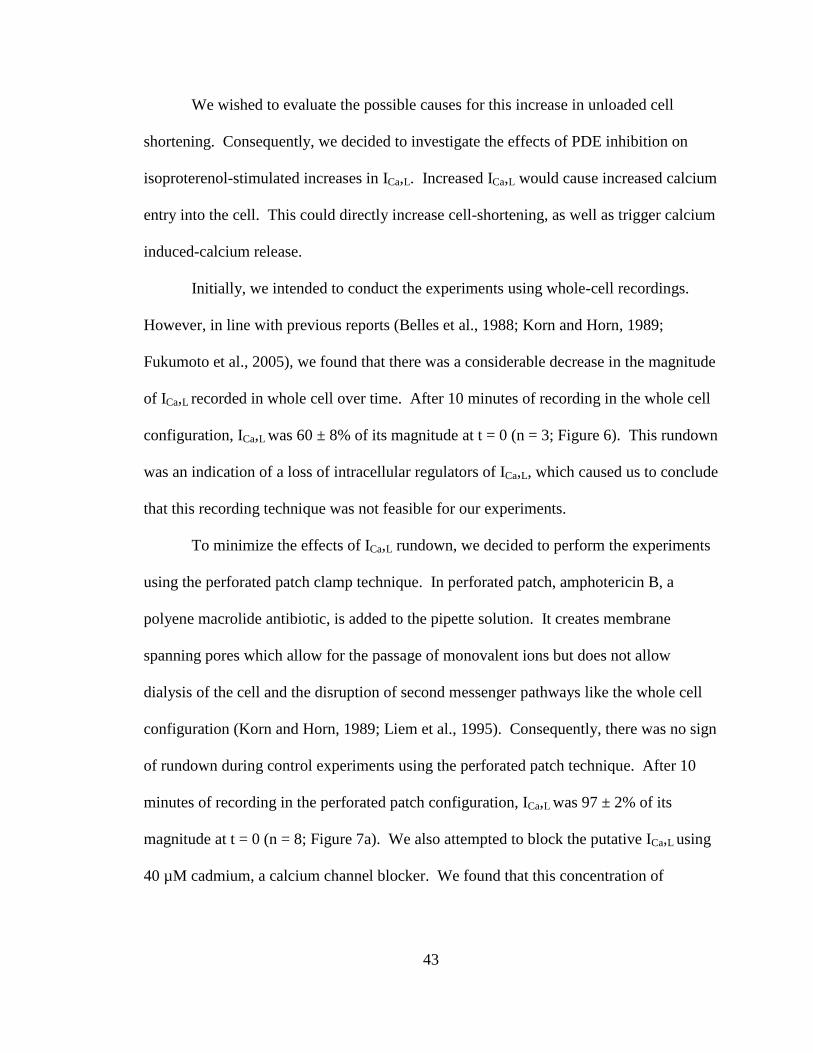
43
We wished to evaluate the possible causes for this increase in unloaded cell
shortening. Consequently, we decided to investigate the effects of PDE inhibition on
isoproterenol-stimulated increases in ICa,L. Increased ICa,L would cause increased calcium
entry into the cell. This could directly increase cell-shortening, as well as trigger calcium
induced-calcium release.
Initially, we intended to conduct the experiments using whole-cell recordings.
However, in line with previous reports (Belles et al., 1988; Korn and Horn, 1989;
Fukumoto et al., 2005), we found that there was a considerable decrease in the magnitude
of ICa,L recorded in whole cell over time. After 10 minutes of recording in the whole cell
configuration, ICa,L was 60 ± 8% of its magnitude at t = 0 (n = 3; Figure 6). This rundown
was an indication of a loss of intracellular regulators of ICa,L, which caused us to conclude
that this recording technique was not feasible for our experiments.
To minimize the effects of ICa,L rundown, we decided to perform the experiments
using the perforated patch clamp technique. In perforated patch, amphotericin B, a
polyene macrolide antibiotic, is added to the pipette solution. It creates membrane
spanning pores which allow for the passage of monovalent ions but does not allow
dialysis of the cell and the disruption of second messenger pathways like the whole cell
configuration (Korn and Horn, 1989; Liem et al., 1995). Consequently, there was no sign
of rundown during control experiments using the perforated patch technique. After 10
minutes of recording in the perforated patch configuration, ICa,L was 97 ± 2% of its
magnitude at t = 0 (n = 8; Figure 7a). We also attempted to block the putative ICa,L using
40 µM cadmium, a calcium channel blocker. We found that this concentration of
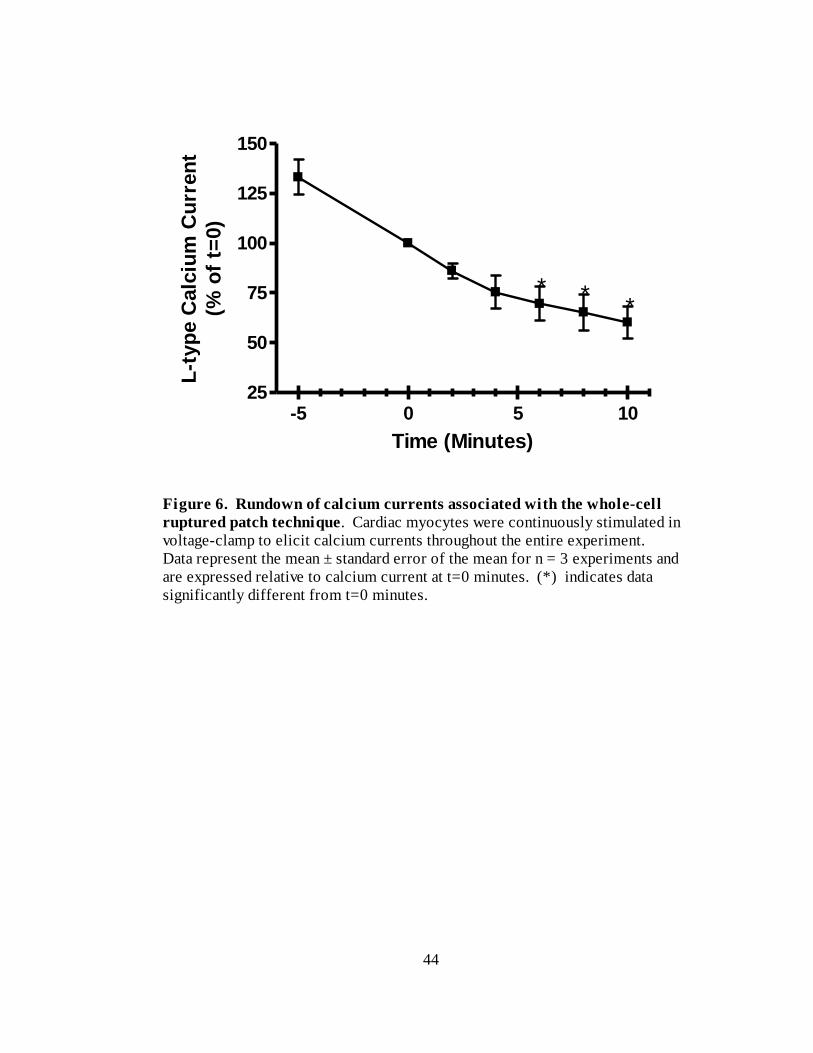
44
-5 0 5 1025
50
75
100
125
150
***
Time (Minutes)
L-t
yp
e C
alc
ium
Cu
rren
t
(% o
f t=
0)
Figure 6. Rundown of calcium currents associated with the whole-cell
ruptured patch technique. Cardiac myocytes were continuously stimulated in
voltage-clamp to elicit calcium currents throughout the entire experiment.
Data represent the mean ± standard error of the mean for n = 3 experiments and
are expressed relative to calcium current at t=0 minutes. (*) indicates data
significantly different from t=0 minutes.
45
-5 0 5 1090
95
100
105
110
Time (Minutes)
L-t
yp
e C
alc
ium
Cu
rren
t
(% o
f t=
0)
Figure 7. Calcium currents recorded using the perforated-patch
technique. (A) Cardiac myocytes were continuously stimulated under
voltage-clamp to elicit calcium currents throughout the entire experiment.
Data represent the mean ± standard error of the mean for n = 8 experiments
and are expressed relative to calcium current at t=0 minutes. (*) indicates
data significantly different from t=0 minutes. (B) Representative data
illustrating the effect of cadmium on perforated-patch calcium currents.
Cardiac myocytes were continuously stimulated in voltage-clamp to elicit
calcium currents throughout the entire experiment. The effects of cadmium
(40 µM) are shown. Sample traces were recorded before (black) and 10
minutes after cadmium was administered (red). Data are representative of n =
3 experiments.
100 msec
B
A
2 p
A/p
F
46
cadmium rapidly and completely blocked the currents we were recording, supporting the
notion that it was, in fact, ICa,L (n=3; Figure 7b).
The perforated patch recordings of ICa,L used an identical format as the cell
shortening experiments. For these experiments, we recorded baseline ICa,L for five
minutes prior to the addition of either cilostamide (1 M), Ro 20-1724 (10 M) or
vehicle control, followed by a five minutes pre-treatment period prior to the cardiac
myocytes being challenged with 1nM isoproterenol. ICa,L was recorded immediately
prior to the addition of isoproterenol and subsequently every two minutes over a 10
minute period. Representative data of these experiments are presented in Figure 8.
Data illustrating the effects of cilostamide pre-treatment on isoproterenol-
stimulated increases of ICa,L are shown in Figure 9. Addition of isoproterenol, following
cilostamide pre-treatment, resulted in an increase of ICa,L to 155 ± 10 % (n=6) of t=0
values at 10 minutes. This increase is significantly greater than that observed with
isoproterenol alone, which was 114 ± 3 % (n=5) of t=0 values at 10 minutes. Repeating
these experiments with Ro 20-1724 instead of cilostamide produced results as shown in
Figure 10. In the presence of Ro 20-1724, 10 minutes exposure to isoproterenol
increased ICa,L to 179 ± 17 % (n=4) of t=0 values. Figure 11 is a re-plot of the
cilostamide + isoproterenol and Ro 20-1724 + isoproterenol data from Figures 9 and 10.
There was no significant difference between the effects of cilostamide and Ro 20-1724
following 10 minutes of isoproterenol exposure. However, there was a trend for Ro 20-
1724 to have a greater effect than that observed with cilostamide.
It is important to note that many cells in the experimental groups showed signs of
overload, such as spontaneous activity (Table 3). As such, it is possible that there are
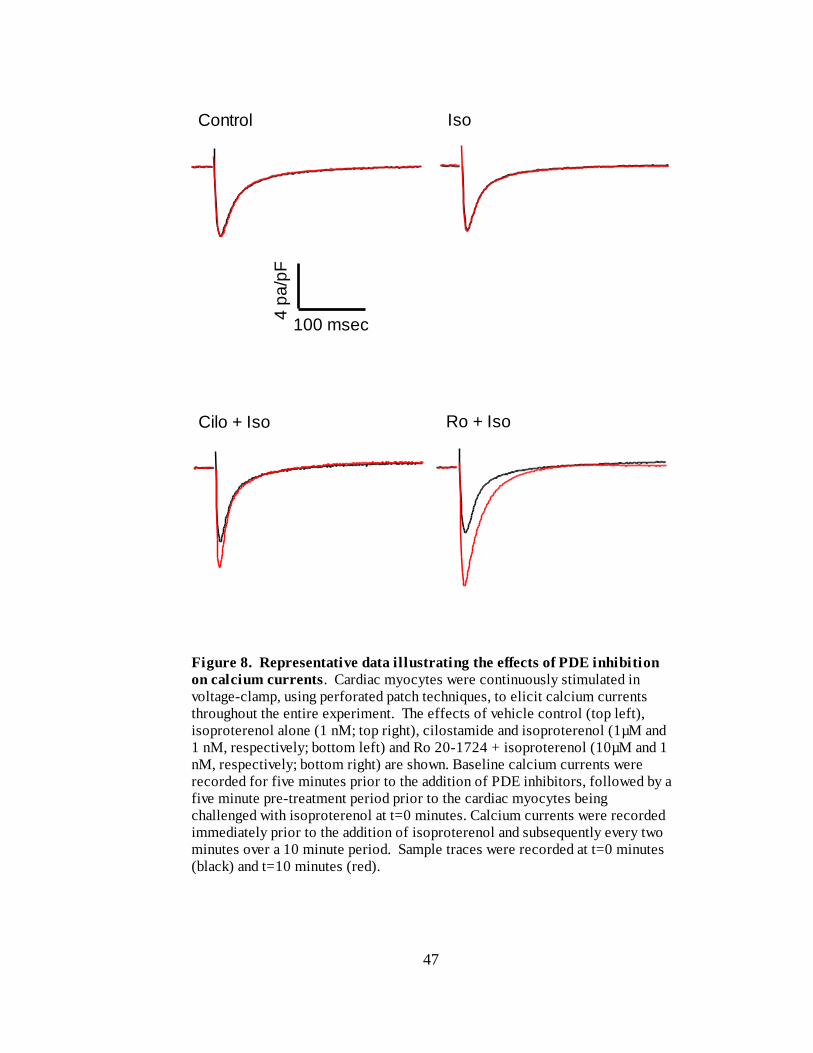
47
Figure 8. Representative data illustrating the effects of PDE inhibition
on calcium currents. Cardiac myocytes were continuously stimulated in
voltage-clamp, using perforated patch techniques, to elicit calcium currents
throughout the entire experiment. The effects of vehicle control (top left),
isoproterenol alone (1 nM; top right), cilostamide and isoproterenol (1µM and
1 nM, respectively; bottom left) and Ro 20-1724 + isoproterenol (10µM and 1
nM, respectively; bottom right) are shown. Baseline calcium currents were
recorded for five minutes prior to the addition of PDE inhibitors, followed by a
five minute pre-treatment period prior to the cardiac myocytes being
challenged with isoproterenol at t=0 minutes. Calcium currents were recorded
immediately prior to the addition of isoproterenol and subsequently every two
minutes over a 10 minute period. Sample traces were recorded at t=0 minutes
(black) and t=10 minutes (red).
Control Iso
Cilo + Iso Ro + Iso
4 p
a/p
F
100 msec
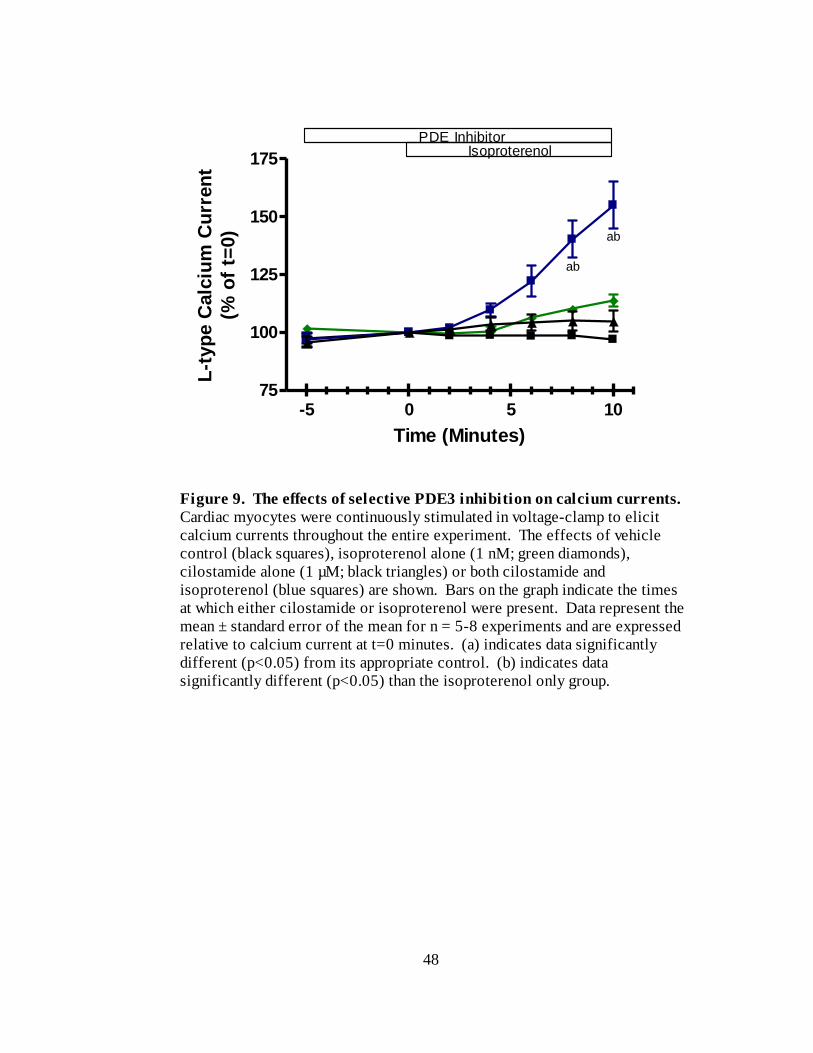
48
-5 0 5 1075
100
125
150
175
ab
ab
PDE InhibitorIsoproterenol
Time (Minutes)
L-t
yp
e C
alc
ium
Cu
rren
t
(% o
f t=
0)
Figure 9. The effects of selective PDE3 inhibition on calcium currents.
Cardiac myocytes were continuously stimulated in voltage-clamp to elicit
calcium currents throughout the entire experiment. The effects of vehicle
control (black squares), isoproterenol alone (1 nM; green diamonds),
cilostamide alone (1 µM; black triangles) or both cilostamide and
isoproterenol (blue squares) are shown. Bars on the graph indicate the times
at which either cilostamide or isoproterenol were present. Data represent the
mean ± standard error of the mean for n = 5-8 experiments and are expressed
relative to calcium current at t=0 minutes. (a) indicates data significantly
different (p<0.05) from its appropriate control. (b) indicates data
significantly different (p<0.05) than the isoproterenol only group.
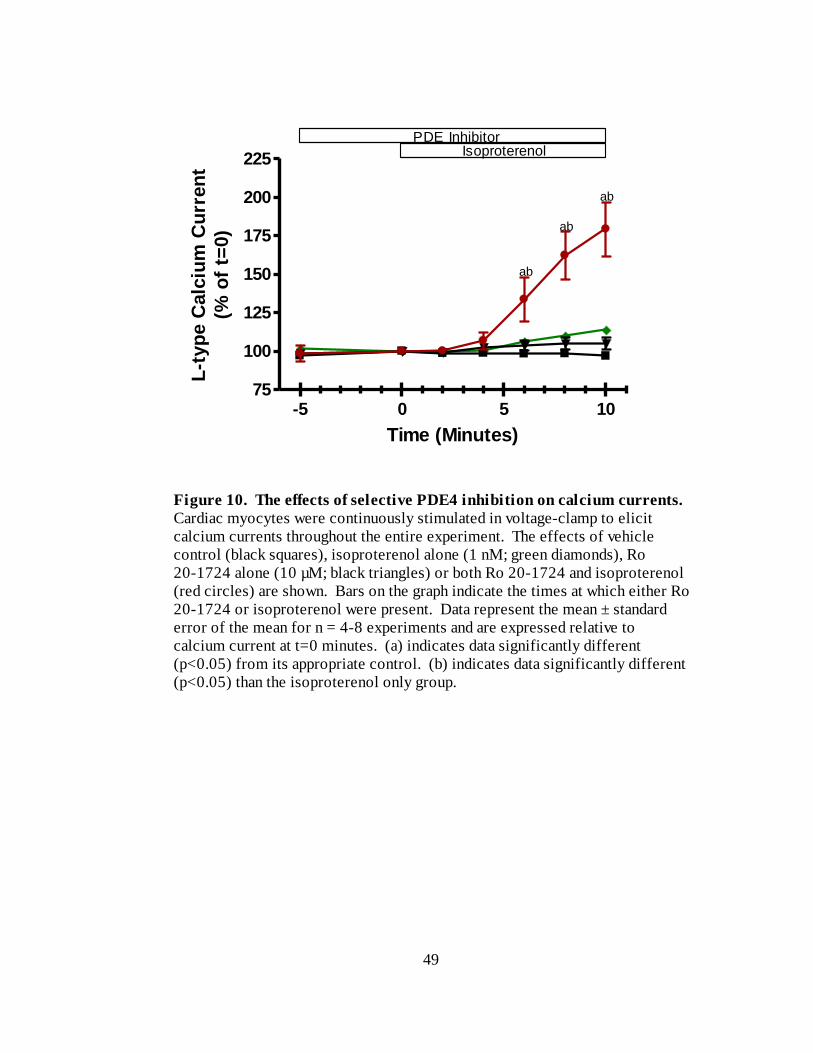
49
-5 0 5 1075
100
125
150
175
200
225
PDE InhibitorIsoproterenol
ab
ab
ab
Time (Minutes)
L-t
yp
e C
alc
ium
Cu
rren
t
(% o
f t=
0)
Figure 10. The effects of selective PDE4 inhibition on calcium currents.
Cardiac myocytes were continuously stimulated in voltage-clamp to elicit
calcium currents throughout the entire experiment. The effects of vehicle
control (black squares), isoproterenol alone (1 nM; green diamonds), Ro
20-1724 alone (10 µM; black triangles) or both Ro 20-1724 and isoproterenol
(red circles) are shown. Bars on the graph indicate the times at which either Ro
20-1724 or isoproterenol were present. Data represent the mean ± standard
error of the mean for n = 4-8 experiments and are expressed relative to
calcium current at t=0 minutes. (a) indicates data significantly different
(p<0.05) from its appropriate control. (b) indicates data significantly different
(p<0.05) than the isoproterenol only group.
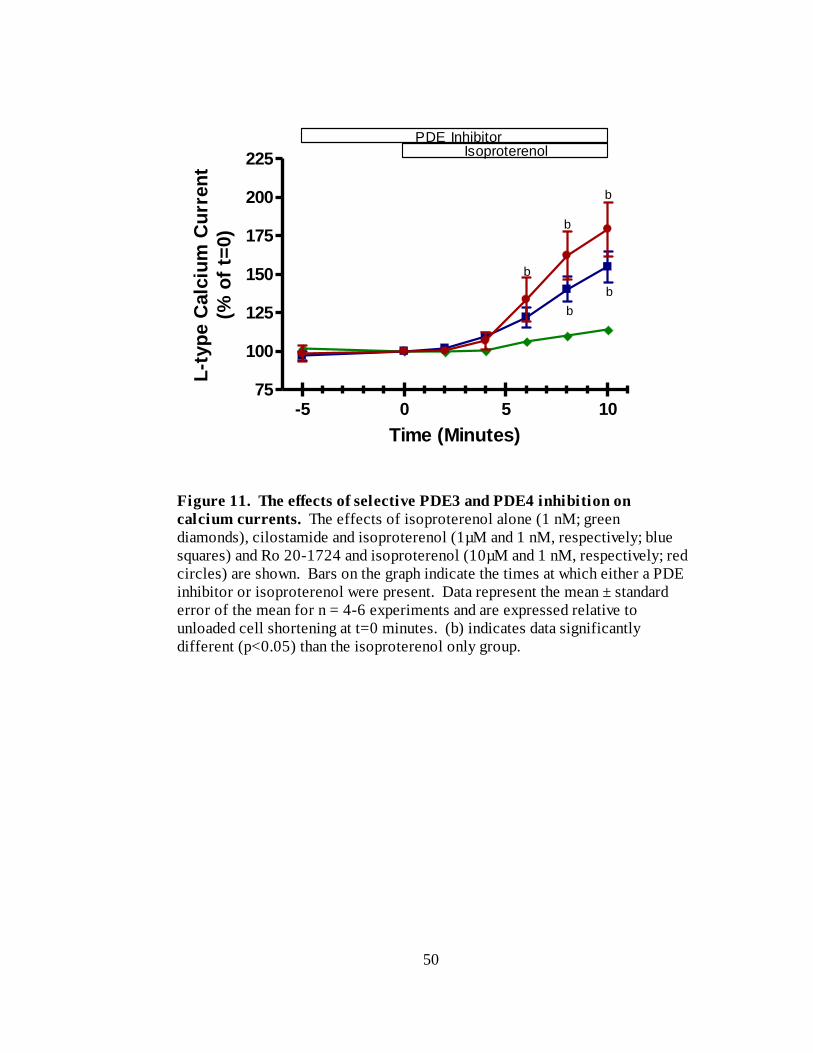
50
-5 0 5 1075
100
125
150
175
200
225
PDE InhibitorIsoproterenol
b
b
b
b
b
Time (Minutes)
L-t
yp
e C
alc
ium
Cu
rren
t
(% o
f t=
0)
Figure 11. The effects of selective PDE3 and PDE4 inhibition on
calcium currents. The effects of isoproterenol alone (1 nM; green
diamonds), cilostamide and isoproterenol (1µM and 1 nM, respectively; blue
squares) and Ro 20-1724 and isoproterenol (10µM and 1 nM, respectively; red
circles) are shown. Bars on the graph indicate the times at which either a PDE
inhibitor or isoproterenol were present. Data represent the mean ± standard
error of the mean for n = 4-6 experiments and are expressed relative to
unloaded cell shortening at t=0 minutes. (b) indicates data significantly
different (p<0.05) than the isoproterenol only group.
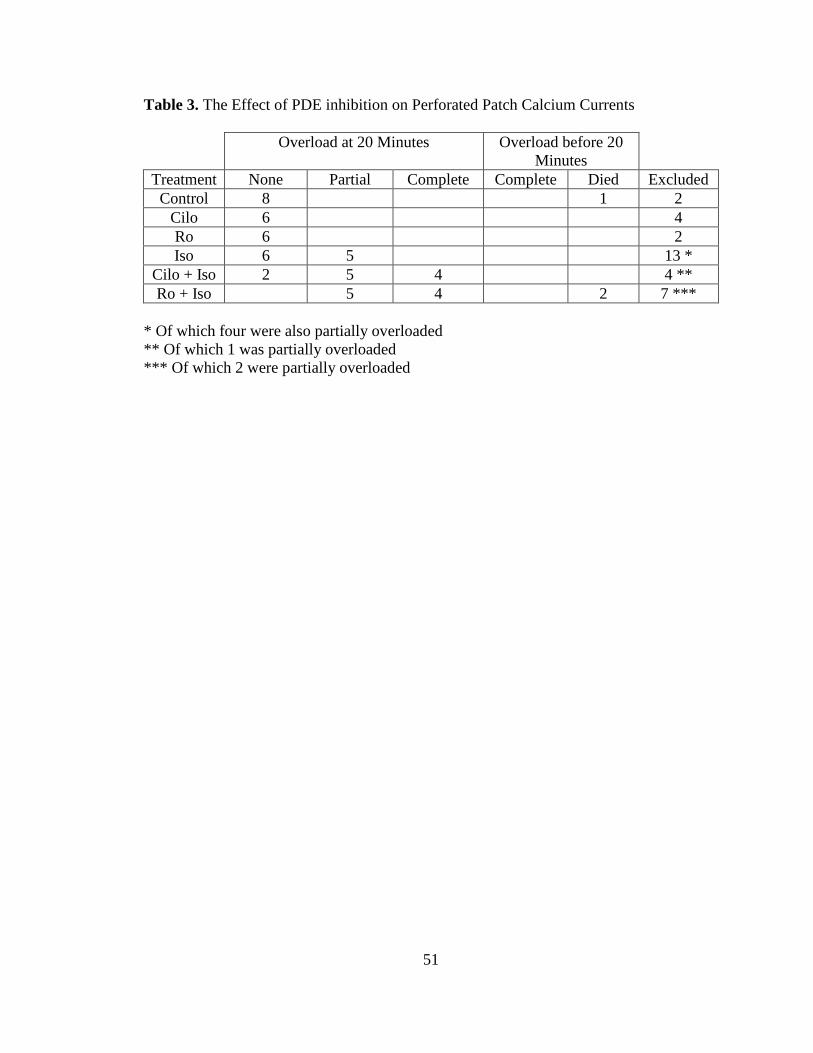
51
Table 3. The Effect of PDE inhibition on Perforated Patch Calcium Currents
Overload at 20 Minutes Overload before 20
Minutes
Treatment None Partial Complete Complete Died Excluded
Control 8 1 2
Cilo 6 4
Ro 6 2
Iso 6 5 13 *
Cilo + Iso 2 5 4 4 **
Ro + Iso 5 4 2 7 ***
* Of which four were also partially overloaded
** Of which 1 was partially overloaded
*** Of which 2 were partially overloaded
52
differences between these groups which are being obscured by overload. Using the same
experimental design, we attempted to record ICa,L in the presence of PDE inhibition and
isoproterenol administration with an extracellular concentration of 0.5mM calcium as
opposed to 1mM. However, 2 out of 3 cells for which we administered isoproterenol in
the presence of cilostamide also went into overload.
We also tested the effects of cilostamide and Ro 20-1724 on potassium channels
using the perforated patch configuration. We did this to ensure that the effects of PDE
inhibition on unloaded cell shortening were not due to changes in potassium conductance.
For these experiments, we recorded Ito, IK1, Isus and action potentials for five minutes
prior to the addition of either cilostamide (1 M), Ro 20-1724 (10 M) or vehicle
control. We subsequently recorded action potentials and the aforementioned potassium
currents every five minutes for fifteen minutes in the presence of PDE inhibitors or
vehicle control. PDE inhibition with cilostamide (n=3) or Ro 20-1724 (n=3) did not
change Ito, IK1, Isus or action potentials with respect to baseline values (data not shown).
We subsequently decided to determine the effects of PDE inhibition on
isoproterenol-stimulated increases in calcium transients. Calcium transients are
representative of the amount of calcium influx and release from the SR per stimulation,
and as such, could provide an explanation for the observed differences in unloaded cell
shortening.
The calcium transient experiments used an identical format as the unloaded cell
shortening and perforated patch experiments. For these experiments, we recorded
baseline calcium transients for five minutes prior to the addition of either cilostamide
(1M), Ro 20-1724 (10 M) or vehicle control, followed by a five minutes pre-treatment
53
period prior to the cardiac myocytes being challenged with 1nM isoproterenol. Calcium
transients were recorded immediately prior to the addition of isoproterenol and
subsequently every two minutes over a 10 minute period. Representative data of these
experiments are presented in Figure 12.
Pooled data demonstrating the effects of cilostamide pre-treatment on
isoproterenol-stimulated increases in calcium transients are shown in Figure 13. As can
be seen, addition of isoproterenol, following cilostamide pre-treatment, resulted in an
increase in calcium transients to 209 ± 14 % (n=8) of t=0 values at 10 minutes. This
increase is significantly greater than that observed with isoproterenol alone, which was
154 ± 8 % (n=6) of t=0 values at 10 minutes. Repeating these experiments with Ro 20-
1724 instead of cilostamide produced similar results, as shown in Figure 14. In the
presence of Ro 20-1724, 10 minutes exposure to isoproterenol increased calcium
transients to 185 ± 12 % (n=8) of t=0 values. Figure 15 is a re-plot of the cilostamide +
isoproterenol and Ro 20-1724 + isoproterenol data from Figures 13 and 14. As can be
seen, there was no significant difference between the effects of cilostamide and Ro 20-
1724 following 10 minutes of isoproterenol exposure. However, there was a trend for the
effects of cilostamide to be greater than those for Ro 20-1724.
Overload was not as prevalent in these experiments as in the perforated patch
recordings (Tables 3, 4). This was probably due, at least in part, to the intracellular
calcium buffering effects of fluo-3. However, because the experimental groups were
slightly but not significantly different, we decided to do these recordings with an
extracellular calcium concentration of 0.5mM. The experimental design was the same as

54
Figure 12. Representative data illustrating the effects of PDE inhibition
on calcium transients. Cardiac myocytes were continuously field stimulated at
a rate of 1Hz throughout the entire experiment. The effects of vehicle control
(top left), isoproterenol alone (1 nM; top right), cilostamide and isoproterenol
(1µM and 1 nM, respectively; bottom left) and Ro 20-1724 + isoproterenol
(10µM and 1 nM, respectively; bottom right) are shown. Baseline calcium
transients were recorded for five minutes prior to the addition of PDE inhibitors,
followed by a five minute pre-treatment period prior to the cardiac myocytes
being challenged with isoproterenol at t=0 minutes. Calcium transients were
recorded immediately prior to the addition of isoproterenol and subsequently
every two minutes over a 10 minute period. Sample traces were recorded at t=0
minutes (black) and t=10 minutes (red). Because the data were recorded in
arbitrary units, all tracings were expressed relative to t=0, which was assigned a
relative amplitude (RA) of 1.
Control Iso
Cilo + Iso Ro + Iso
500msec
1 R
A
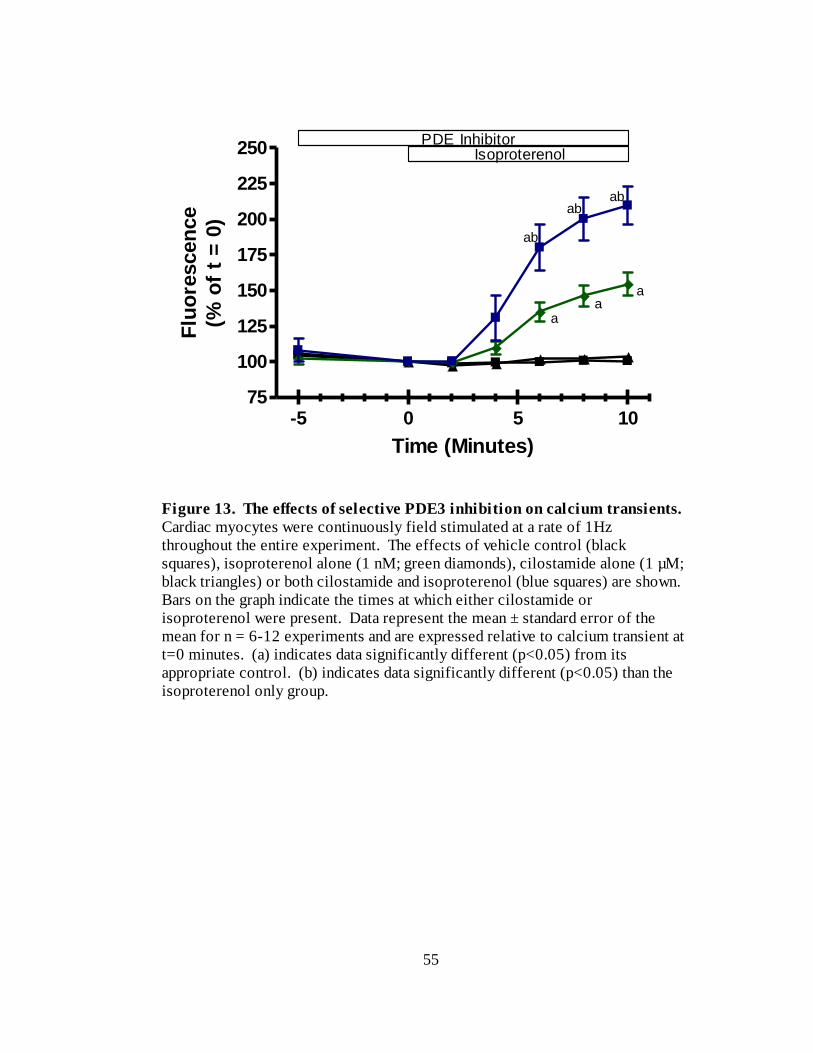
55
-5 0 5 1075
100
125
150
175
200
225
250PDE Inhibitor
Isoproterenol
ab
ab
ab
aa
a
Time (Minutes)
Flu
ore
scen
ce
(% o
f t
= 0
)
Figure 13. The effects of selective PDE3 inhibition on calcium transients.
Cardiac myocytes were continuously field stimulated at a rate of 1Hz
throughout the entire experiment. The effects of vehicle control (black
squares), isoproterenol alone (1 nM; green diamonds), cilostamide alone (1 µM;
black triangles) or both cilostamide and isoproterenol (blue squares) are shown.
Bars on the graph indicate the times at which either cilostamide or
isoproterenol were present. Data represent the mean ± standard error of the
mean for n = 6-12 experiments and are expressed relative to calcium transient at
t=0 minutes. (a) indicates data significantly different (p<0.05) from its
appropriate control. (b) indicates data significantly different (p<0.05) than the
isoproterenol only group.
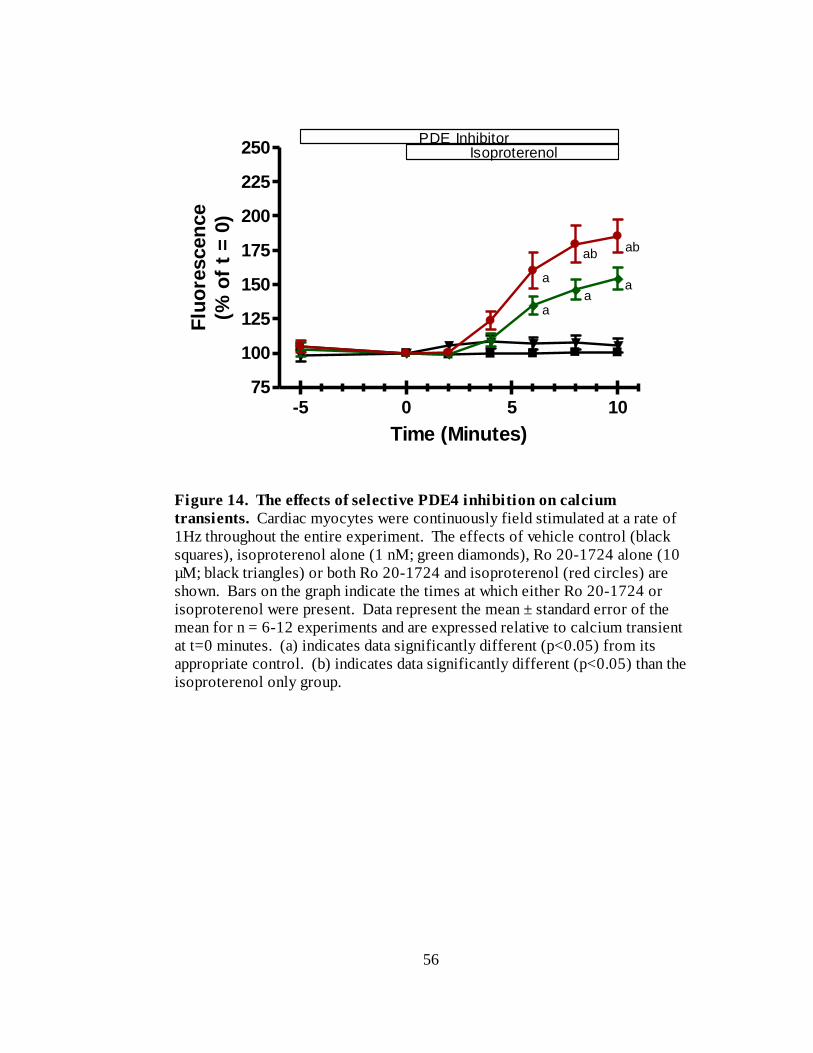
56
-5 0 5 1075
100
125
150
175
200
225
250PDE Inhibitor
Isoproterenol
aa
a
a
abab
Time (Minutes)
Flu
ore
scen
ce
(% o
f t
= 0
)
Figure 14. The effects of selective PDE4 inhibition on calcium
transients. Cardiac myocytes were continuously field stimulated at a rate of
1Hz throughout the entire experiment. The effects of vehicle control (black
squares), isoproterenol alone (1 nM; green diamonds), Ro 20-1724 alone (10
µM; black triangles) or both Ro 20-1724 and isoproterenol (red circles) are
shown. Bars on the graph indicate the times at which either Ro 20-1724 or
isoproterenol were present. Data represent the mean ± standard error of the
mean for n = 6-12 experiments and are expressed relative to calcium transient
at t=0 minutes. (a) indicates data significantly different (p<0.05) from its
appropriate control. (b) indicates data significantly different (p<0.05) than the
isoproterenol only group.
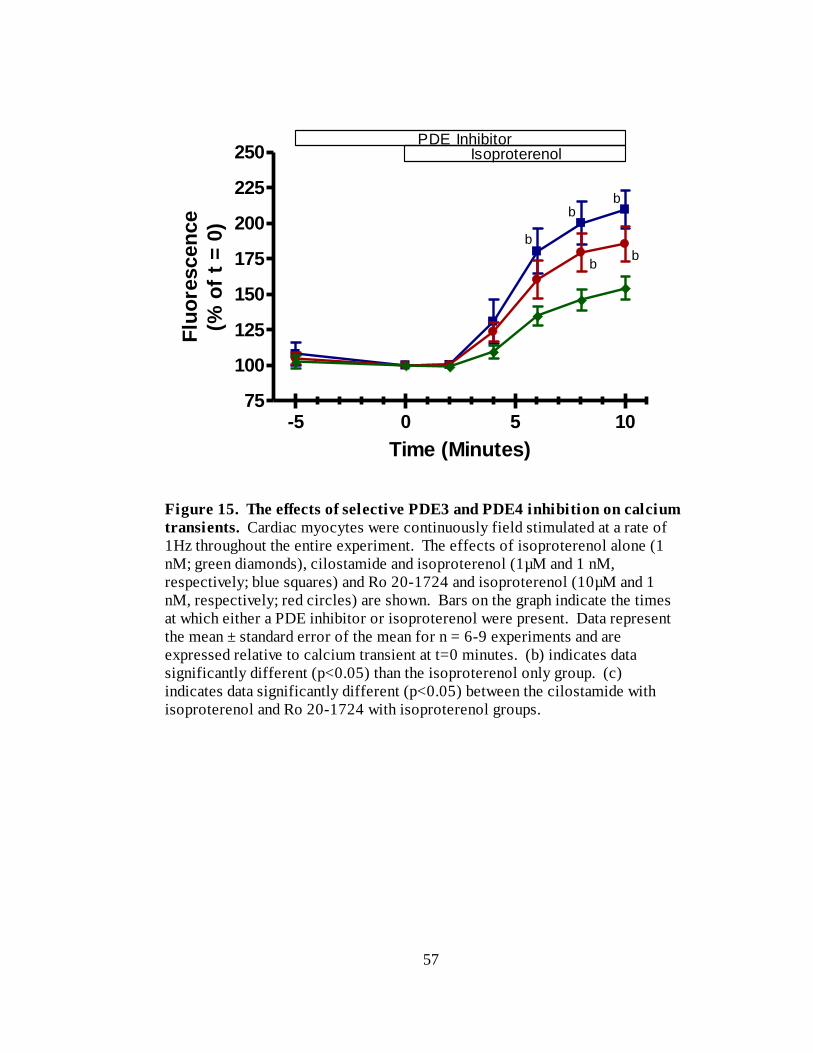
57
-5 0 5 1075
100
125
150
175
200
225
250PDE Inhibitor
Isoproterenol
b
b
b
b
b
Time (Minutes)
Flu
ore
scen
ce
(% o
f t
= 0
)
Figure 15. The effects of selective PDE3 and PDE4 inhibition on calcium
transients. Cardiac myocytes were continuously field stimulated at a rate of
1Hz throughout the entire experiment. The effects of isoproterenol alone (1
nM; green diamonds), cilostamide and isoproterenol (1µM and 1 nM,
respectively; blue squares) and Ro 20-1724 and isoproterenol (10µM and 1
nM, respectively; red circles) are shown. Bars on the graph indicate the times
at which either a PDE inhibitor or isoproterenol were present. Data represent
the mean ± standard error of the mean for n = 6-9 experiments and are
expressed relative to calcium transient at t=0 minutes. (b) indicates data
significantly different (p<0.05) than the isoproterenol only group. (c)
indicates data significantly different (p<0.05) between the cilostamide with
isoproterenol and Ro 20-1724 with isoproterenol groups.
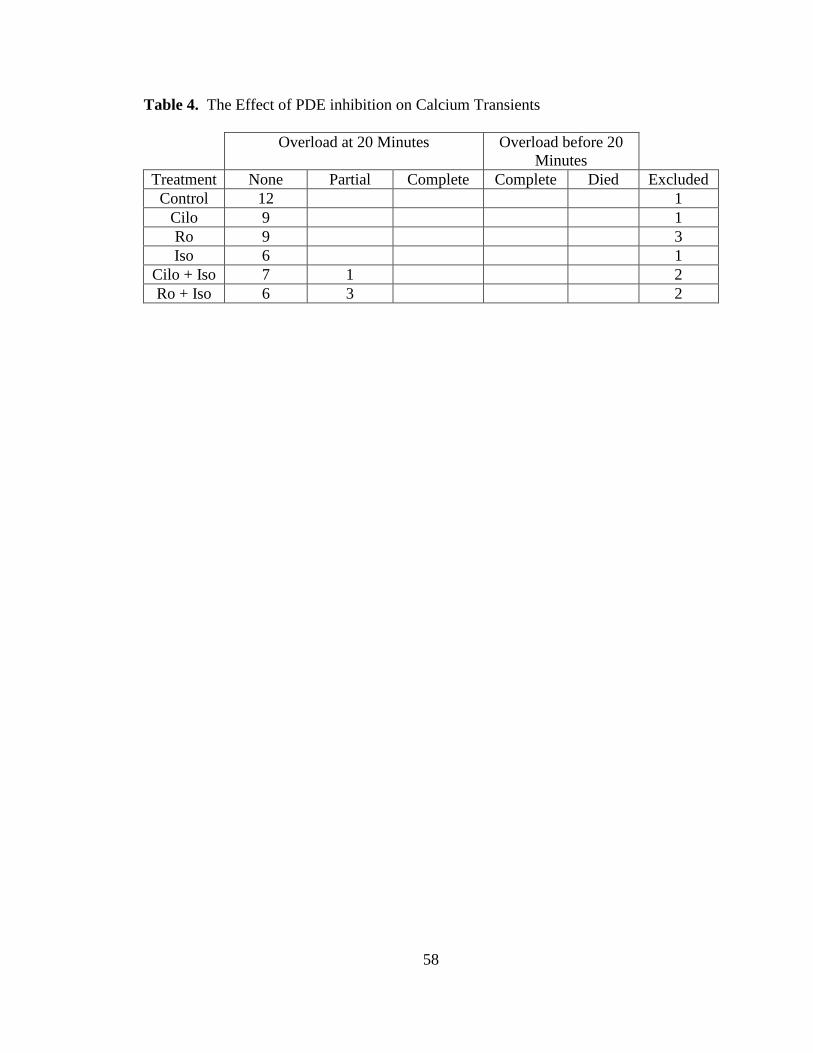
58
Table 4. The Effect of PDE inhibition on Calcium Transients
Overload at 20 Minutes Overload before 20
Minutes
Treatment None Partial Complete Complete Died Excluded
Control 12 1
Cilo 9 1
Ro 9 3
Iso 6 1
Cilo + Iso 7 1 2
Ro + Iso 6 3 2
59
for the previous calcium transient experiments. The addition of isoproterenol following
cilostamide pre-treatment resulted in an increase in calcium transients to 224 ± 16 % of
t=0 values at 10 minutes (n=7; Figure 16). This was not significantly different from the
addition of isoproterenol following Ro 20-1724 pre-treatment, which resulted in an
increase in calcium transients to 203 ± 16 % (n=7) of t=0 values. There was no overload
present in these experiments.
We subsequently set out to discover whether or not there are differences in PDE3
and PDE4 mediated effects on calcium uptake into the sarcoplasmic reticulum following
β-adrenergic stimulation. We did this by performing caffeine pulse experiments to
deplete the SR of its calcium stores. In order to preserve the format of the previous
experiments, we initially attempted to administer caffeine pulses at five minute intervals.
However, we found that this amount of time between caffeine administration did not
allow the cells to fully regain their pre-caffeine function. Consequently, we decided to
switch to the administration of caffeine every ten minutes, which required slight
modifications in the experimental protocol with respect to previous experiments.
For the SR calcium load experiments, we recorded baseline calcium transients for
five minutes prior to the first caffeine pulse recording. We subsequently washed out the
caffeine for five minutes prior to the addition of either cilostamide (1 M), Ro 20-1724
(10 M) or vehicle control. This was followed by a five minute pre-treatment period
before the cardiac myocytes were given a second caffeine pulse. At the conclusion of the
second caffeine pulse, myocytes were challenged with 1nM isoproterenol for ten minutes
prior to the third caffeine pulse recording. Representative data of these experiments is
presented in Figure 17.
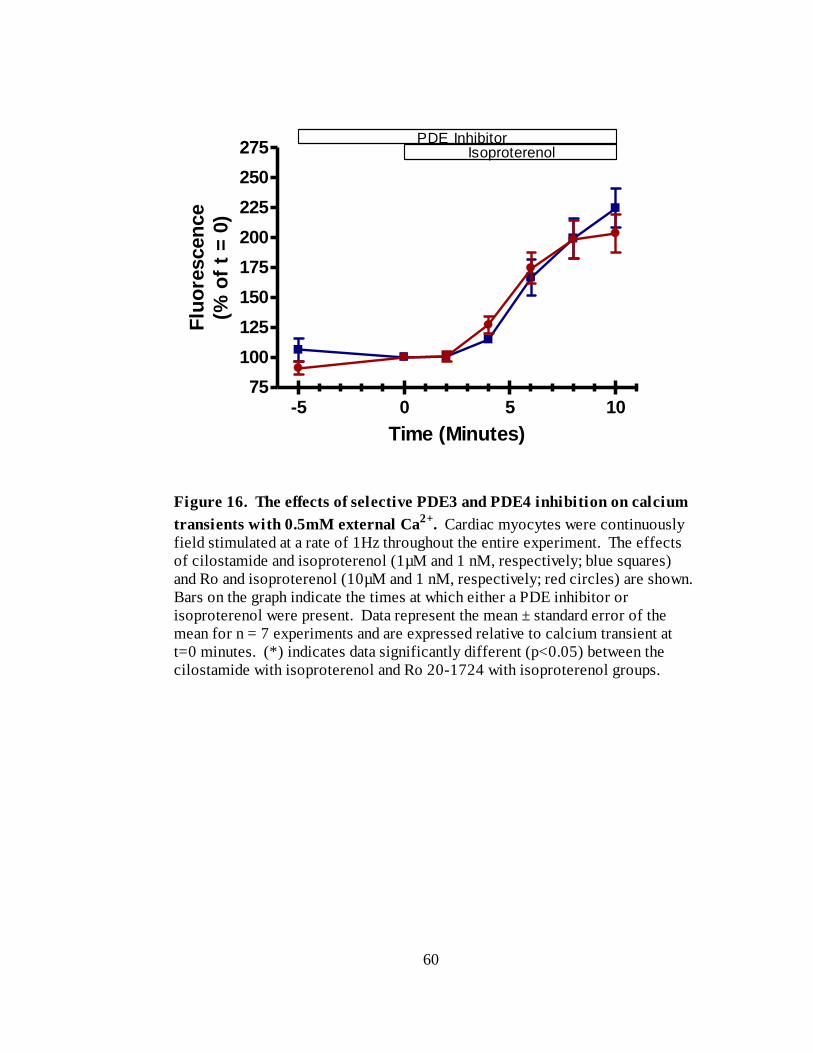
60
-5 0 5 1075
100
125
150
175
200
225
250
275PDE Inhibitor
Isoproterenol
Time (Minutes)
Flu
ore
scen
ce
(% o
f t
= 0
)
Figure 16. The effects of selective PDE3 and PDE4 inhibition on calcium
transients with 0.5mM external Ca2+
. Cardiac myocytes were continuously
field stimulated at a rate of 1Hz throughout the entire experiment. The effects
of cilostamide and isoproterenol (1µM and 1 nM, respectively; blue squares)
and Ro and isoproterenol (10µM and 1 nM, respectively; red circles) are shown.
Bars on the graph indicate the times at which either a PDE inhibitor or
isoproterenol were present. Data represent the mean ± standard error of the
mean for n = 7 experiments and are expressed relative to calcium transient at
t=0 minutes. (*) indicates data significantly different (p<0.05) between the
cilostamide with isoproterenol and Ro 20-1724 with isoproterenol groups.
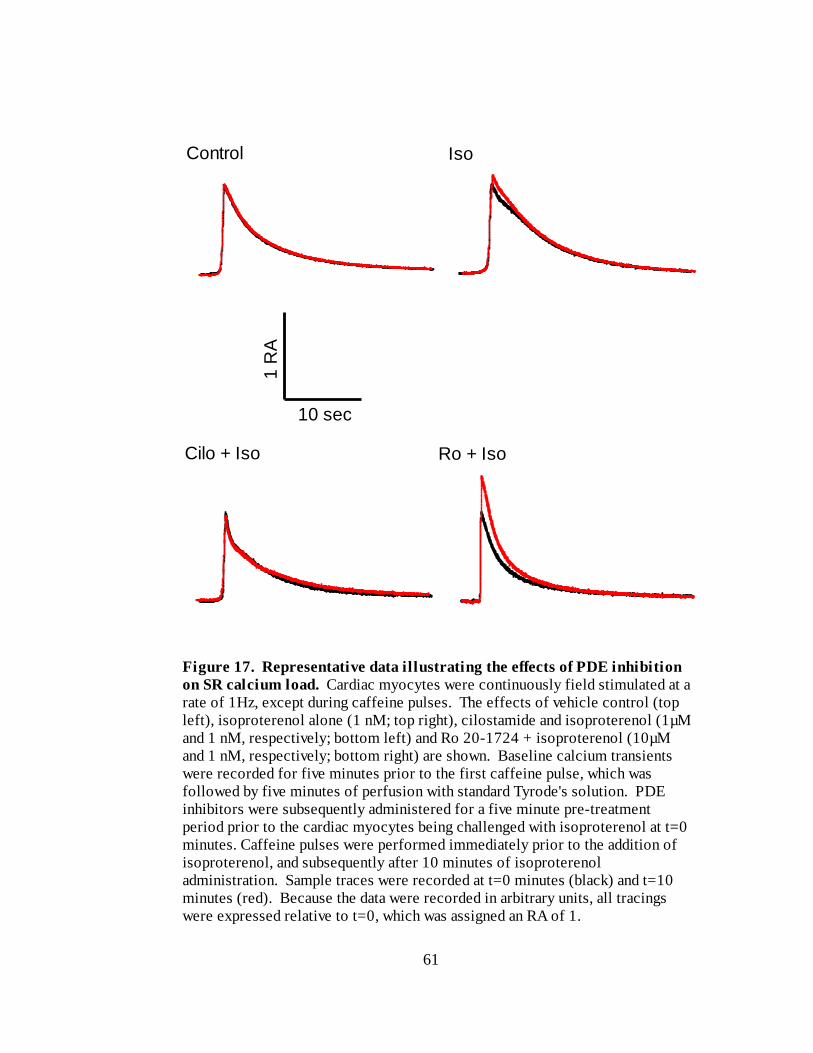
61
Figure 17. Representative data illustrating the effects of PDE inhibition
on SR calcium load. Cardiac myocytes were continuously field stimulated at a
rate of 1Hz, except during caffeine pulses. The effects of vehicle control (top
left), isoproterenol alone (1 nM; top right), cilostamide and isoproterenol (1µM
and 1 nM, respectively; bottom left) and Ro 20-1724 + isoproterenol (10µM
and 1 nM, respectively; bottom right) are shown. Baseline calcium transients
were recorded for five minutes prior to the first caffeine pulse, which was
followed by five minutes of perfusion with standard Tyrode's solution. PDE
inhibitors were subsequently administered for a five minute pre-treatment
period prior to the cardiac myocytes being challenged with isoproterenol at t=0
minutes. Caffeine pulses were performed immediately prior to the addition of
isoproterenol, and subsequently after 10 minutes of isoproterenol
administration. Sample traces were recorded at t=0 minutes (black) and t=10
minutes (red). Because the data were recorded in arbitrary units, all tracings
were expressed relative to t=0, which was assigned an RA of 1.
Control Iso
Cilo + Iso Ro + Iso
1 R
A
10 sec
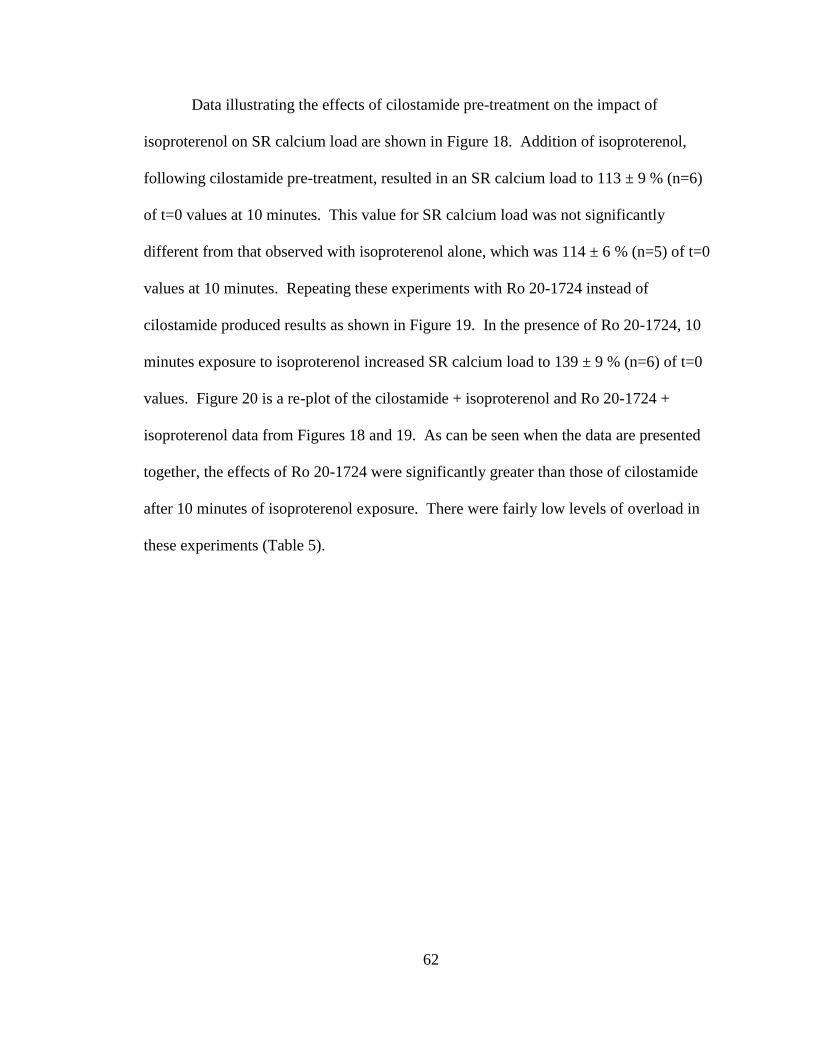
62
Data illustrating the effects of cilostamide pre-treatment on the impact of
isoproterenol on SR calcium load are shown in Figure 18. Addition of isoproterenol,
following cilostamide pre-treatment, resulted in an SR calcium load to 113 ± 9 % (n=6)
of t=0 values at 10 minutes. This value for SR calcium load was not significantly
different from that observed with isoproterenol alone, which was 114 ± 6 % (n=5) of t=0
values at 10 minutes. Repeating these experiments with Ro 20-1724 instead of
cilostamide produced results as shown in Figure 19. In the presence of Ro 20-1724, 10
minutes exposure to isoproterenol increased SR calcium load to 139 ± 9 % (n=6) of t=0
values. Figure 20 is a re-plot of the cilostamide + isoproterenol and Ro 20-1724 +
isoproterenol data from Figures 18 and 19. As can be seen when the data are presented
together, the effects of Ro 20-1724 were significantly greater than those of cilostamide
after 10 minutes of isoproterenol exposure. There were fairly low levels of overload in
these experiments (Table 5).
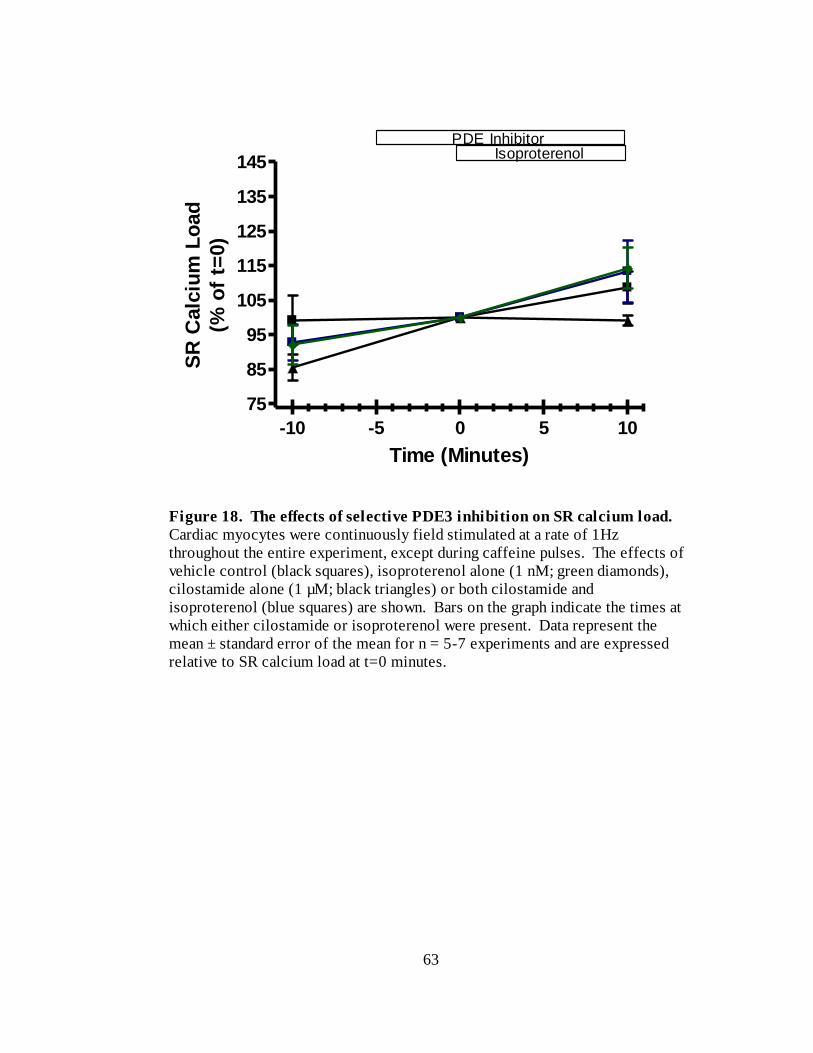
63
-10 -5 0 5 10
75
85
95
105
115
125
135
145
PDE InhibitorIsoproterenol
Time (Minutes)
SR
Calc
ium
Lo
ad
(% o
f t=
0)
Figure 18. The effects of selective PDE3 inhibition on SR calcium load.
Cardiac myocytes were continuously field stimulated at a rate of 1Hz
throughout the entire experiment, except during caffeine pulses. The effects of
vehicle control (black squares), isoproterenol alone (1 nM; green diamonds),
cilostamide alone (1 µM; black triangles) or both cilostamide and
isoproterenol (blue squares) are shown. Bars on the graph indicate the times at
which either cilostamide or isoproterenol were present. Data represent the
mean ± standard error of the mean for n = 5-7 experiments and are expressed
relative to SR calcium load at t=0 minutes.
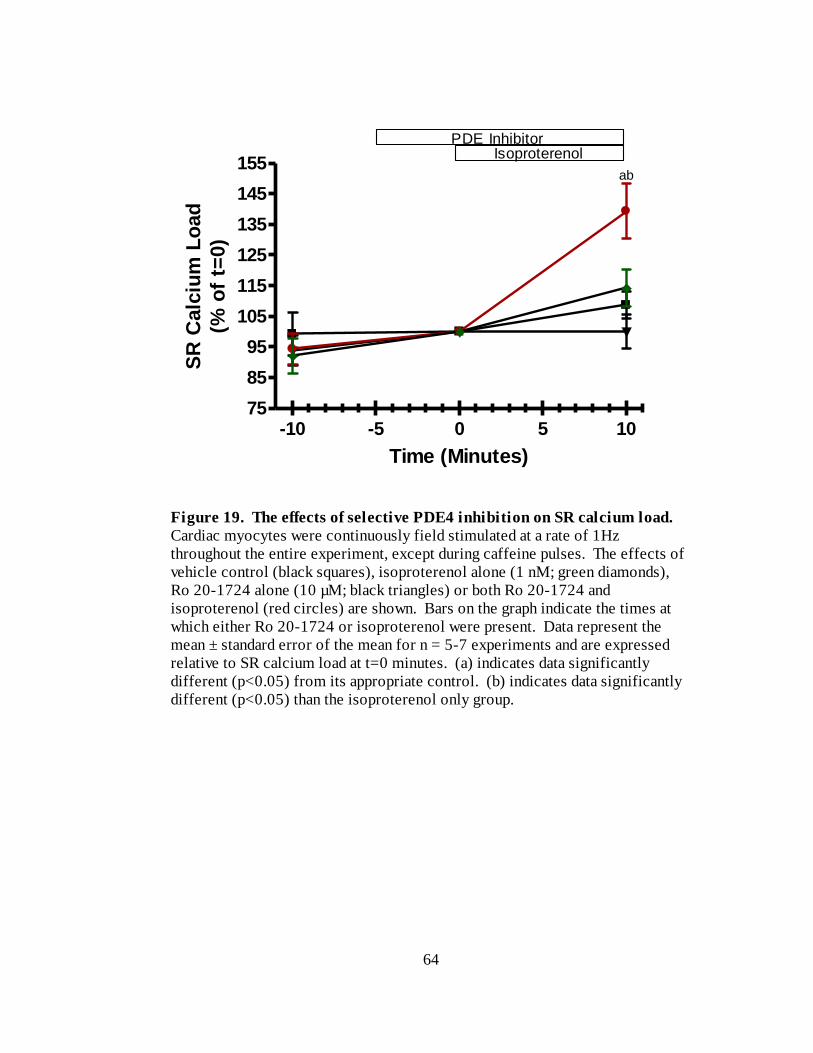
64
-10 -5 0 5 1075
85
95
105
115
125
135
145
155
PDE InhibitorIsoproterenol
ab
Time (Minutes)
SR
Calc
ium
Lo
ad
(% o
f t=
0)
Figure 19. The effects of selective PDE4 inhibition on SR calcium load.
Cardiac myocytes were continuously field stimulated at a rate of 1Hz
throughout the entire experiment, except during caffeine pulses. The effects of
vehicle control (black squares), isoproterenol alone (1 nM; green diamonds),
Ro 20-1724 alone (10 µM; black triangles) or both Ro 20-1724 and
isoproterenol (red circles) are shown. Bars on the graph indicate the times at
which either Ro 20-1724 or isoproterenol were present. Data represent the
mean ± standard error of the mean for n = 5-7 experiments and are expressed
relative to SR calcium load at t=0 minutes. (a) indicates data significantly
different (p<0.05) from its appropriate control. (b) indicates data significantly
different (p<0.05) than the isoproterenol only group.
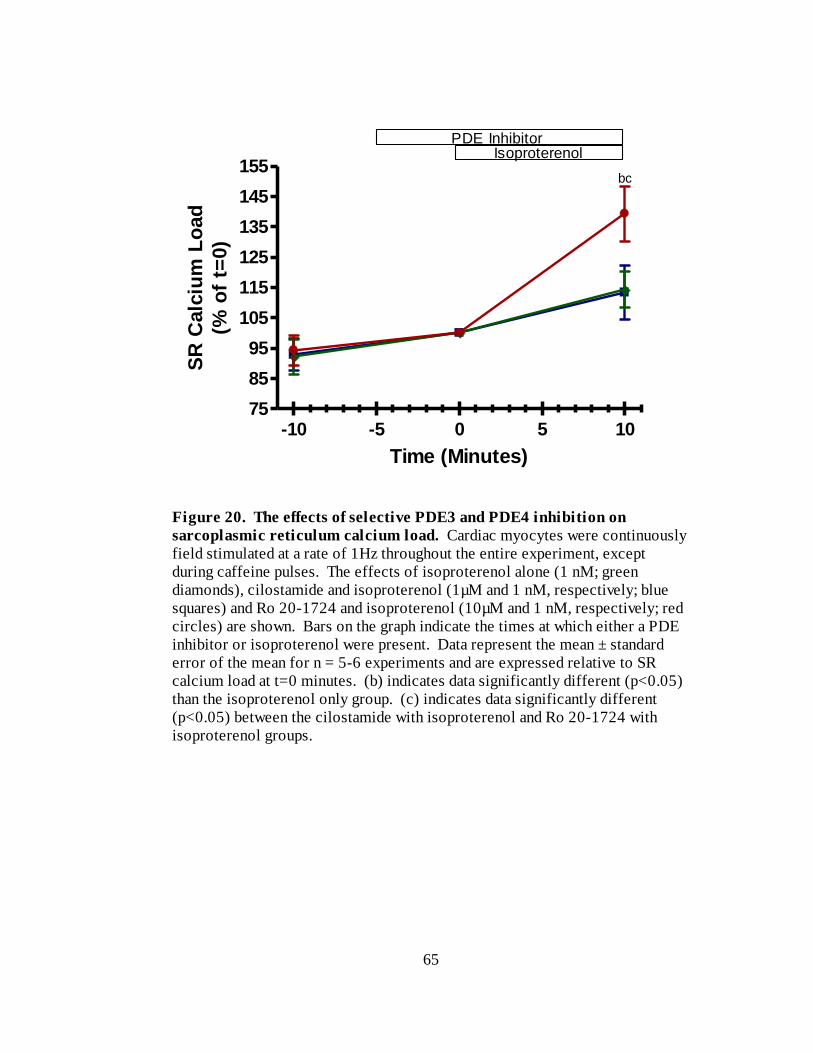
65
-10 -5 0 5 1075
85
95
105
115
125
135
145
155
PDE InhibitorIsoproterenol
bc
Time (Minutes)
SR
Calc
ium
Lo
ad
(% o
f t=
0)
Figure 20. The effects of selective PDE3 and PDE4 inhibition on
sarcoplasmic reticulum calcium load. Cardiac myocytes were continuously
field stimulated at a rate of 1Hz throughout the entire experiment, except
during caffeine pulses. The effects of isoproterenol alone (1 nM; green
diamonds), cilostamide and isoproterenol (1µM and 1 nM, respectively; blue
squares) and Ro 20-1724 and isoproterenol (10µM and 1 nM, respectively; red
circles) are shown. Bars on the graph indicate the times at which either a PDE
inhibitor or isoproterenol were present. Data represent the mean ± standard
error of the mean for n = 5-6 experiments and are expressed relative to SR
calcium load at t=0 minutes. (b) indicates data significantly different (p<0.05)
than the isoproterenol only group. (c) indicates data significantly different
(p<0.05) between the cilostamide with isoproterenol and Ro 20-1724 with
isoproterenol groups.
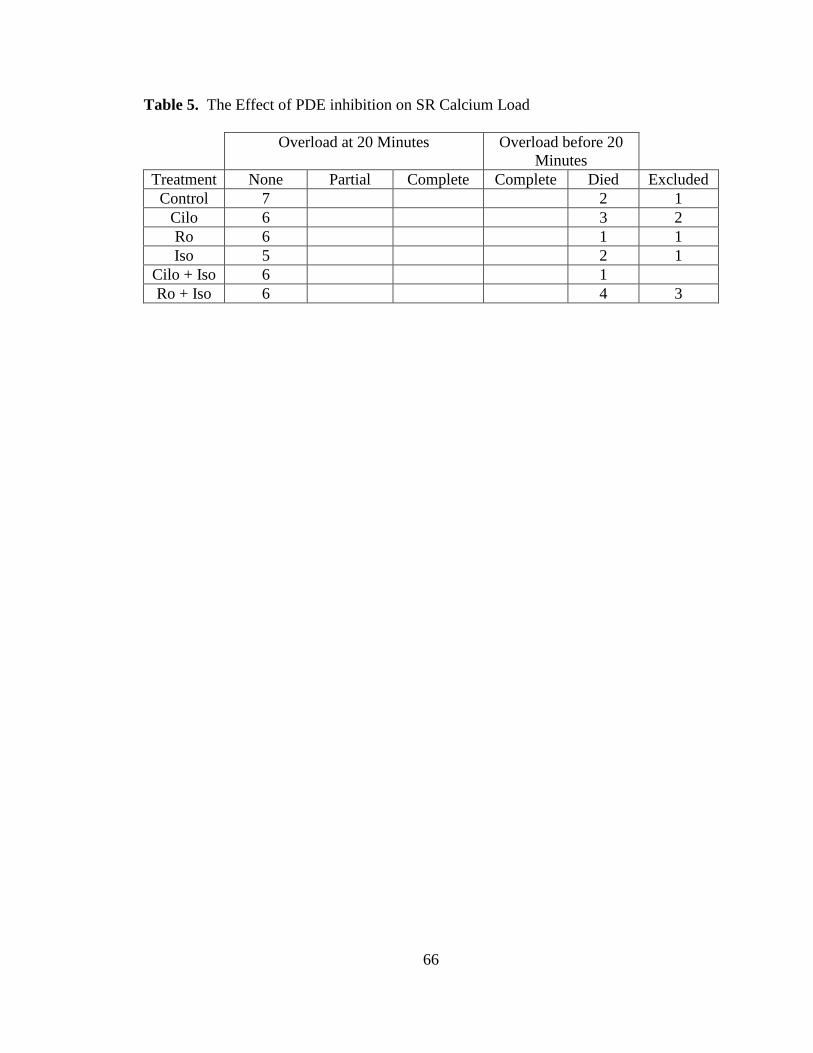
66
Table 5. The Effect of PDE inhibition on SR Calcium Load
Overload at 20 Minutes Overload before 20
Minutes
Treatment None Partial Complete Complete Died Excluded
Control 7 2 1
Cilo 6 3 2
Ro 6 1 1
Iso 5 2 1
Cilo + Iso 6 1
Ro + Iso 6 4 3
67
CHAPTER 4: DISCUSSION AND CONCLUSIONS
Summary
This study demonstrated that isoproterenol administration, in the presence of
PDE3 inhibition, resulted in a larger increase in unloaded cell shortening compared to
those recorded in the presence of PDE4 inhibition. There was a trend for PDE4
inhibition and isoproterenol administration to cause a larger increase in calcium currents
than PDE3 inhibition and isoproterenol administration, although this increase was not
significant. There was also a trend for PDE3 inhibition to cause a larger increase in
calcium currents than PDE4 inhibition with isoproterenol administration, although again,
this increase was not significant. Finally, PDE4 inhibition and isoproterenol
administration caused a larger increase in SR-calcium loading than PDE3 inhibition and
isoproterenol administration. These results indicate that PDE3 may be localized in
proximity to the contractile apparatus of cardiac myocytes, while PDE4 may be localized
in a domain consisting of the L-type calcium channel and junctional SR (Figure 21). As
such, our study provides functional evidence for differential localization of PDE isoforms
in cardiac myocytes.
Compartmentation of PDE3 and PDE4
The results of this study would suggest that PDE4 is associated with t-tubule L-
type calcium channels and the junctional SR, while PDE3 could be associated with the
contractile apparatus. This is because PDE4 inhibition and isoproterenol stimulation
increased SR calcium load more than PDE3 inhibition and isoproterenol stimulation, and
produced a non-significant trend in the same direction for calcium currents. On the other
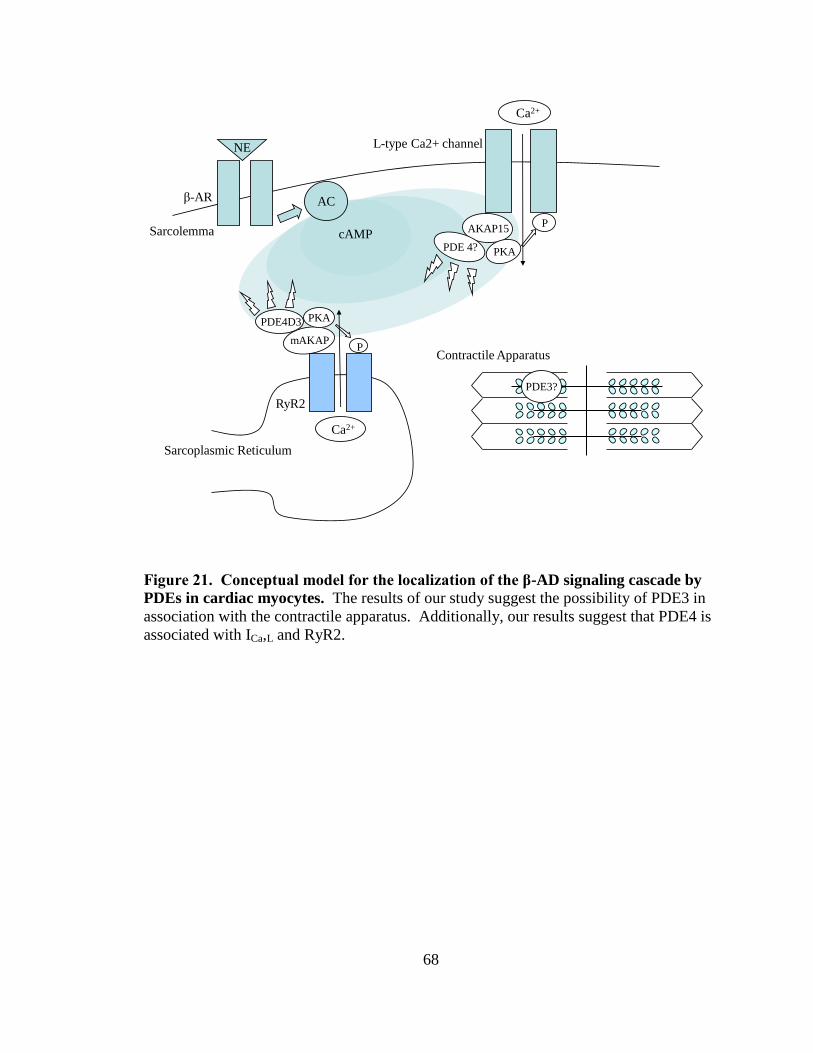
68
cAMP
AC
AKAP15
PDE 4? PKA
P
Ca2+
β-AR
NE
Sarcolemma
PKAPDE4D3
mAKAPP
RyR2
Ca2+
Sarcoplasmic Reticulum
PDE3?
Contractile Apparatus
L-type Ca2+ channel
Figure 21. Conceptual model for the localization of the β-AD signaling cascade by
PDEs in cardiac myocytes. The results of our study suggest the possibility of PDE3 in
association with the contractile apparatus. Additionally, our results suggest that PDE4 is
associated with ICa,L and RyR2.
69
hand, PDE3 inhibition and isoproterenol stimulation increased unloaded cell shortening
more than PDE4 inhibition and isoproterenol stimulation.
There is support in the literature for differential PDE3 and PDE4 localization.
Mongillo et al. (2004) found that PDE3 and PDE4 were localized differently in neonatal
rat cardiac myocytes; PDE3 was localized on internal membranes while PDE4 was
localized to the M-line and Z-line. The t-tubule network is closely apposed to Z-lines in
ventricular myocytes (Gao et al, 1997). A significant fraction of L-type Ca2+
channels are
localized to the t-tubules in proximity to SR Ca2+
release channels in cardiac myocytes
(Balijepalli et al. 2006). AKAP100 also co-localizes to the Z-line and transverse
tubule/junctional SR region in adult rat cardiac myocytes (Yang et al, 1998).
Additionally, the results of Hulme et al. (2003) indicate that PKA is bound to AKAP15,
which in turn binds to CaV1.2. Consequently, it is possible that an AKAP-PDE4-PKA
complex exists at the L-type calcium channel, similar to the one elucidated for RyR2
(Dodge et al., 2001; Lehnart et al., 2005). The existence of such a complex, or the
established presence of PDE4 in this domain, could explain why PDE4 inhibition and β-
AD stimulation resulted in larger (though non-significant) increase in calcium currents
with respect to PDE3 inhibition.
Like the L-type calcium channel and RyR, key elements of the β-AD signaling
cascade such as Gs and AC are concentrated at the t-tubules (Reviewed in Brette and
Orchard, 2003). Using isoproterenol in the presence of PDE inhibitors, Nikolaev et al.
(2006) found that cAMP generated by β-adrenergic stimulation was primarily regulated
by PDE4. Perry et al. (2002) found that β-arrestins recruit PDE4D isoforms to the β2-AR
to attenuate PKA activation. Blocking PDE4 would interfere with this method of
70
quenching the cAMP signal, and could, in part, explain the effects of PDE4 inhibition in
our study. Interestingly, Kerfant et al. (2007) found that PDE4D co-immunoprecipitated
with the SR-calcium uptake pump SERCA2a. Blocking PDE4 would lessen the amount
of cAMP “drained away” from SERCA2a in response to β-AD stimulation, and would
cause more calcium uptake into the SR. In fact, this is what was seen in our experiments;
PDE4 inhibition, but not PDE3 inhibition, resulted in an increased SR calcium load in
response to β-AD stimulation.
As such, PDE4 would seem to exert its effects in the vicinity of the t-tubules and
junctional sarcoplasmic reticulum. PDE3 does not seem to be as central to the regulation
of cAMP generated by β-adrenergic stimulation as PDE4. Nikolaev et al. (2006) found
PDE2, in fact, contributed more to hydrolysis of cAMP generated by β-AD stimulation
than PDE3, with a mechanism for PDE2 activity provided by (Mongillo et al., 2006).
However, PDE3 inhibition in humans with milrinone (Packer et al., 1991) and
theyophylline (Bittar and Friedman, 1991) is highly deleterious, whereas there is an
absence of evidence suggesting any negative cardiovascular effects of PDE4 inhibition.
Hambleton et al. (2005) set out to determine the localization of PDE3 activity in
the human myocardium. They found that PDE3 comprised the major cAMP hydrolytic
activity in the microsomal fraction under all conditions. However, PDE3 had a decreased
role in the microsome in the presence of elevated intracellular calcium and high cAMP,
characteristics of β-AD stimulation. Under these conditions, they found high levels of
non-PDE3 PDE activity in the cytosol. At reduced calcium and cAMP, there was a
reduced contribution from PDE1 and other PDEs in the cytosol and an increased role for
PDE3 (Hambleton et al. 2005).
71
The results of our study indicate that PDE3 is possibly somehow associated with
the contractile apparatus of adult rat ventricular myocytes. This would seem to run
counter to the results of Hambleton et al. (2005), who found that PDE3 was primarily
associated with the microsomal fraction under conditions which replicated β-AD
stimulation, although there could be experimental or species related differences at play.
The reason why our results indicate this possible association is because PDE3 inhibition
and isoproterenol administration caused a larger increase in cell shortening than PDE4
inhibition and isoproterenol administration, while it had no effect on SR calcium load.
This would tend to indicate that PDE3 is more associated with a contractile domain than
with the t-tubule and junctional SR domain proposed for PDE4.
The question remains of why, then, PDE3 inhibition and isoproterenol stimulation
affected calcium currents and calcium transients. It is possible that the increase in PDE3
inhibition and β-AD stimulation increased intracellular cAMP enough to cause spillover
of cAMP from the PDE3 domain to the PDE4 domains, which PDE4 was unable to
completely hydrolyze. In their 2004 study, Mongillo et al. found that β-AD stimulation,
in the presence of cilostamide resulted in a transient increase in cAMP, while β-AD
stimulation in the presence of Ro 20-1724 resulted in a stable increase. They explained
this by saying that cAMP not metabolized under conditions of PDE3 inhibition was
metabolized by PDE4. However, their studies were FRET measurements of cAMP in
quiescent myocytes, not functional measurements in actively contracting cells, and it is
possible that this contributed to the divergent results.
72
Limitations of Unloaded Cell Shortening Experiments
Calcium overload was a major factor in unloaded cell shortening and perforated
patch experiments. Unloaded cell shortening recordings lasted for 10 seconds, with a
stimulation frequency of 1Hz. Partial overload was defined as the presence of sub-
maximal contractions as well as maximal contractions for each recording. Complete
overload was defined as the absence of maximal contractions per recording. Oftentimes,
cells in complete overload began to contract uncontrollably, and were no longer
producing even sub-maximal contractions with the pulses. Cell death was defined in the
same way for unloaded cell shortening recordings as for calcium current, calcium
transient and SR calcium load recordings. Namely, cell death was defined as when cells
lost their rectangular shape and curled up into a ball.
The technical reasons for excluding cells from the final data were issues across all
unloaded cell shortening experimental groups. Two of the most common reasons were
that the cell had almost stopped contracting by t=0 minutes, and that there was a problem
with the edge detectors being able to reliably follow the cell edges. Cells were generally
selected that were initially contracting in the 5 to 7% range. All cells underwent a five
minute equilibration period, and a subsequent five minute period during which either
vehicle control or PDE inhibitors were added before the administration of isoproterenol at
t=0 minutes. During this period, some cells decreased in their contraction to 1 or 2% of
their resting lengths. As such, these cells were barely contracting by the time
isoproterenol was administered, and were consequently excluded from analysis. This
was one of the reasons for the large number of excluded cells in the 10nM group; three of
73
the cells excluded for technical reasons were noted to have almost stopped contracting
before drug administration.
Another common cause for excluding cells from the cell shortening data was
problems with the edge detectors, a device which uses light/dark contrast to follow the
edges of a cell as it contracts. The cells occasionally shifted, and this could cause the
edge detector to record contractility at an odd angle or to record multiple points of
contrast on the cell. Problems also arose when cells had attained maximal percent
shortening. At times, the edge detectors could no longer generate complete traces,
making analysis difficult. As such, cells with incomplete traces were often excluded
from analysis.
Other issues arose when recording cell shortening that also presented themselves
in the electrophysiology and fluorescence experiments. Problems of this nature included
changes in flow rate when switching the perfusion from vehicle control to drug-treatment
groups. After these instances, the flow-rate would be recalibrated, but if the flow rate had
been much too slow during drug perfusion, the cell would oftentimes be excluded from
analysis. However, the most pervasive issue common to all experimental types was when
a dead cell near the experimental cell would shift and come in contact with the
experimental cell. When this would occur, the experimental cell would be excluded from
analysis.
Limitations of Calcium Current Experiments
There were two calcium current traces per 10 second recording. Partial overload
was defined as when at least one maximal current was elicited per time point, if
74
necessary, by making multiple recordings. Maximal calcium currents were assessed by
simultaneously recording unloaded cell shortening with calcium currents. Cells were
defined to produce maximal calcium currents when they contracted upon stimulation,
whereas cells that contracted during the voltage ramp generated smaller currents and
interfered in our ability to record maximal calcium currents due to reactivation kinetics of
the channels. Complete overload occurred when cells only contracted during the voltage
ramp, or began fibrillating, and it became impossible to produce a single recording when
they contracted on the pulse.
An explanation for the large number of excluded cells in the isoproterenol group
is that we performed these recordings first and initially did not simultaneously record
fractional cell shortening. Many of these cells appeared to be in mild overload, and were
generating currents of slightly different sizes on different pulses. However, because we
were unable to correlate a current with a contraction, we excluded these cells and redid
the experiments while recording fractional cell shortening.
There were several reasons we excluded perforated patch cells. We excluded
cells that were contracting during the voltage ramp before the administration of any
drugs. This indicated that the cell was already in mild overload, and as such, treatments
designed to increase calcium entry into the cell produced variable results. Cells that took
on a blotchy appearance during the experiment and seemed to lose their striations were
also excluded. This was taken to be representative of poor cell health and viability.
Furthermore, we excluded cells that stopped contracting during the experiment.
Cells in the perforated patch configuration contract upon stimulation. We followed the
common practice of adding EGTA to our intracellular solution to provide us with a way
75
to assess whether the cells had gone into the whole cell configuration during the
experiment. If the cells did go whole cell, EGTA would diffuse in, chelate the
intracellular calcium and prevent contraction. Finally, we excluded cells that ended the
experiments with an access resistance of greater than 20 MΩ. The Ra of cells in
perforated patch should decrease from 20 MΩ at the beginning of the recording to less
than ten MΩ, ideally during the equilibration period before any drugs are administered.
If a cell has an Ra greater than 20 MΩ at the end of the experiment, this indicated that the
access resistance was increasing after the point at which it should have stabilized, usually
generating currents that were artificially smaller than they should have been.
A question arises as to why the overload present in the calcium current recordings
was more severe than that in the unloaded cell shortening recordings. The answer to this
question is probably related to the difference in the duration of the stimulus applied to
elicit either a calcium current or a contraction. For the perforated patch recordings, the
cells were held in a depolarized state for 300msec, during which calcium entered into the
cell and the calcium currents were recorded. In contrast, the cells were only exposed to
an electrical current for 5msec to elicit contraction in the unloaded cell shortening
recordings. Consequently, increases in the amount of calcium entry into the cells due to
drug treatment were more likely to cause overload in the perforated patch recordings with
respect to the unloaded cell shortening recordings. This is due to the fact that a great deal
more calcium was entering the cells in the perforated patch recordings to begin with.
76
Limitations of Calcium Transient and SR Calcium Loading Experiments
Calcium transient recordings lasted for 10 seconds, with a stimulation frequency
of 1Hz. SR calcium load recordings lasted for 75 or 90 seconds, with a stimulation
frequency of 1Hz to elicit calcium transients prior to the administration of caffeine. A
possible explanation for the comparative lack of overload in these experiments is that the
fluorescent indicators used for these experiments, either fluo-3 for calcium transients, or
fluo-4 for caffeine pulses, chelates intracellular calcium. Consequently, the presence of
these fluorescent dyes buffered the large increases in intracellular calcium present with
PDE inhibition and β-AD stimulation. This would also suggest a method whereby we
could eliminate the significant overload featured in the unloaded cell shortening, and
especially calcium current experiments.
As with the other experiments, there were technical reasons that lead to the
exclusion of calcium transient and caffeine pulse data from the results. Sometimes,
bubbles from the oil would move into the field of the microscope, changing the
diffraction of light and magnitude of fluorescence. On one occasion, the stimulator
moved, causing a shadow to develop over the cell. As in other experiments, dead cells
would sometimes shift to touch the experimental cell. Finally, the buffer perfusion
system would occasionally sweep cells off the plate. For the caffeine pulse experiments,
this would make sense given the rapid solution exchange and gravity-limited flow of the
caffeine containing buffer onto the plate. However, this also occurred for calcium
transient experiments. In total, the incidence of technical problems was much less for the
fluorescence experiments than for the unloaded cell shortening, and especially the
77
calcium current experiments. This can probably be at least partially attributed to the
negligible overload present in these cells due to intracellular calcium buffering by the
fluorescent dyes.
Comparison to Previous Studies
Previous investigations have used similar approaches to explore the concept of
PDE compartmentation (Rochais et al., 2006; Kerfant et al., 2007). Both of these studies
report findings that are both consistent and inconsistent with our study, which may be
partially explained by the experimental limitations discussed. It is possible to question
the necessity of our experiments given a paper recently published by Rochais et al.
(2006). They performed experiments testing the effects of cilostamide and Ro 20-1724
on ICa,L in the presence of the β-adrenergic agonist isoprenaline. These experiments seem
to be similar to the ones which we have proposed, but there are important differences.
Rochais et al. (2006) performed whole cell experiments in cultured myocytes to
examine the effects of cilostamide and Ro 20-1724 on ICa,L in the presence of the β-
adrenergic agonist isoprenaline. In comparison to our study, important differences are
the rundown of ICa,L during the control period evident in their recordings and the use of
adult ventricular myocytes subjected to tissue culture conditions for a 24 hour period
rather than freshly isolated myocytes. The latter is important because studies have shown
that changes in electrophysiological properties of cardiac myocytes can occur after a
single day in culture (Reviewed in Mitcheson et al., 1998). Additionally, Rochais et al.
performed their experiments by adding cilostamide in the presence of isoprenaline,
washing it out, and then adding Ro 20-1724 to the same cell. This introduces numerous
78
confounding variables, including the possibility of incomplete wash-out. We performed
our experiments by testing the effects of cilostamide and Ro-20 1724 on ICa,L in different
cells. Finally, Rocahis et al. (2006) did not study the effect of β-adrenergic stimulation
on contractility, calcium transients and SR calcium load in the presence of PDE3 and
PDE4 inhibition.
The results of our experiments are different than those found by Kerfant et al.
(2007). The focus of their study was on the effects of PI3Kγ knockout on ICa,L, calcium
transients and SR calcium load in the presence and absence of PDE3 and PDE4
inhibition. PI3Kγ acts as a kinase which can alter cardiac contractility and ECC through
its regulations of basal cAMP levels and phospholamban phosphorylation. PI3Kγ has
been found to stimulate PDE3B, and consequently may exert some of its effects through
the activation of PDEs to hydrolyze cAMP.
The work of Kerfant et al. (2007) is relevant because of discrepancies between
their control experiments and the control experiments of this study. They found PDE3
inhibition with milrinone or PDE4 inhibition with rolipram did not affect ICa,L, but
increased calcium transients and SR calcium content in left ventricular mouse myocytes.
These effects were present in the absence of a cAMP generating agonist such as
isoproterenol. Although no effects were evident on ICa,L, it is important to note that these
experimenters employed the whole cell patch technique. As previously mentioned, this
does not seem to be an optimal way to study second messenger microdomains, as whole
cell causes dialysis of the cellular contents by the pipette solution (Liem et al., 1995).
For example, Liem et al. (1995) specifically recommend using perforated patch to study
forskolin activation of cAMP in order to leave the intracellular machinery intact. In
79
addition, calcium current rundown in whole cell is well-known (Belles et al., 1988; Korn
and Horn, 1989; Fukumoto et al., 2005) and was experienced in our study, although none
was evident in the work of Kerfant et al. (2007).
Kerfant et al. (2007) also used very different methodologies than the current study
for measuring calcium transients and SR calcium load, both of which relied on whole cell
patch clamping. They recorded calcium transients simultaneously with ICa,L by adding
0.05mM fluo-3 to the pipette solution. Kerfant et al. (2007) estimated SR calcium load
by performing whole cell recordings of sodium-calcium exchange currents (INCX) in
response to 20mM caffeine. It is possible that the use of electrophysiology to measure
calcium transients and to estimate SR calcium load allowed Kerfant et al. (2007) to
record changes in response to PDE inhibition even in the absence of exogenous cAMP
stimulation. However, the increases they observed are fairly prominent, and we found no
effect of PDE inhibition in the absence of isoproterenol stimulation when recording
unloaded cell shortening, calcium currents, calcium transients and SR calcium load.
Additionally, as previously mentioned, the use of whole cell electrophysiology to study
second messenger microdomains is problematic.
Future directions
One of the largest problems encountered in this study was calcium overload of
actively contracting myocytes. This was probably a most significant problem for the
perforated patch calcium current recordings. Reducing the external calcium
concentration from 1mM to 0.5mM did not seem to remedy this problem. Even at this
calcium concentration, two out of three cells for which we administered isoproterenol in
80
the presence of cilostamide went into overload. However, two other options are
available; to perform the experiments with barium as the charge carrier (Thu et al., 2006),
or to use fluo-3 or fluo-4 to buffer intracellular calcium. The second option presented
itself upon the observation that there was very little calcium overload during the
fluorescence experiments (Tables 4, 5). Performing these experiments without overload
would enable us to better elucidate differences in PDE3 and PDE4 inhibition on calcium
currents.
It would also be useful to determine the effects of mAKAP disruption on the
aforementioned parameters using either mAKAP inhbitors or siRNA techniques.
mAKAPs have been shown to physically anchor PDE4 to RyR2 (Dodge et al., 2001;
Lehnart et al., 2005), and it would be interesting to investigate if their disruption
attenuates the effects of selective PDE inhibition. Finally, hormones other than
catecholamines result in the production of cAMP, including glucagon and prostaglandin
E1 (Rochais et al., 2006). According to the compartmentation theory, different PDEs
should be involved in the regulation of distinct pools of cAMP produced in response to
specific hormones. As such, it is possible that PDE control over the cAMP produced in
response to these agonists is different from that controlling cAMP generated by β-AD
stimulation.
81
Conclusions
It is exciting to think that differential phosphodiesterase localization contributes to
a widely conserved second messenger, cAMP, producing a highly specific signal.
Additionally, disruption of PDE localization can be demonstrated to have dramatic
consequences in living cells. The results of this study represent an opportunity and a
challenge to those attempting to explore phosphodiesterase inhibition for its potential
clinical applications. The opportunity stems from the fact that disruption of these
pathways has profound functional effects which could ideally be employed for a
therapeutic benefit. However, this opportunity also presents a challenge. Disruption of
PDE regulation of cAMP has been shown to have deleterious effects evident from the
level of the single cell to the entire organism. As such, phosphodiesterases represent an
important therapeutic target, so long as we find ways to alter finely tuned cAMP
pathways without producing cellular chaos.
82
REFERENCES
Balijepalli RC, Foell JD, Hall DD, Hell JW, Kamp TJ. (2006). Localization of cardiac L-
type Ca(2+) channels to a caveolar macromolecular signaling complex is required for
beta(2)-adrenergic regulation. Proceedings of the National Academy of Sciences 103,
7500-5.
Beavo JA, Brunton LL. (2002). Cyclic nucleotide research -- still expanding after half a
century. Nature Reviews Molecular Cellular Biology 3, 710-8.
Belles B, Malecot CO, Hescheler J, Trautwein W. (1988). "Run-down" of the Ca current
during long whole-cell recordings in guinea pig heart cells: role of phosphorylation and
intracellular calcium. Pflugers Archiv. European Journal of Physiology 411, 353-60.
Bittar G, Friedman HS. (1991). The arrhythmogenicity of theophylline. A multivariate
analysis of clinical determinants. Chest 99, 1415-20.
Brette F, Leroy J, Le Guennec JY, Sallé L. (2005). Ca2+
currents in cardiac myocytes:
Old stories, new insights. Progress in Biophysics and Molecular Biology 91, 1-82.
Review.
Brette F, Orchard C. (2003) T-tubule function in mammalian cardiac myocytes.
Circulation Research 92, 1182-92. Review.
Brillantes AMB, Ondrias K, Scott A, Kobrinsky E, Ondriasova E, Moschella MC,
Jayaraman T, Landers M, Ehrlich BE, Marks AR. (1994). Stabilization of calcium release
channel (ryanodine receptor) function by FK506-binding protein. Cell 77, 513-23.
Dodge KL, Khouangsathiene S, Kapiloff MS, Mouton R, Hill EV, Houslay MD,
Langeberg LK, Scott JD. (2001). mAKAP assembles a protein kinase A/PDE4
phosphodiesterase cAMP signaling module. The European Molecular Biology
Organization Journal 20, 1921-30.
Fukumoto GH, Lamp ST, Motter C, Bridge JH, Garfinkel A, Goldhaber JI. (2005).
Metabolic inhibition alters subcellular calcium release patterns in rat ventricular
myocytes: implications for defective excitation-contraction coupling during cardiac
ischemia and failure. Circulation Research 18, 551-57.
Gao T, Puri TS, Gerhardstein BL, Chien AJ, Green RD, Hosey MM. (1997).
Identification and subcellular localization of the subunits of L-type calcium channels and
adenylyl cyclase in cardiac myocytes. Journal of Biological Chemistry 272, 19401-7.
Gee KR, Brown KA, Chen WN, Bishop-Stewart J, Gray D, Johnson I. (2000). Chemical
and physiological characterization of fluo-4 Ca2+
-indicator dyes. Cell Calcium 27, 97-
106.
83
Hambleton R, Krall J, Tikishvili E, Honeggar M, Ahmad F, Manganiello VC, Movsesian
MA. (2005). Isoforms of cyclic nucleotide phosphodiesterase PDE3 and their
contribution to cAMP hydrolytic activity in subcellular fractions of human myocardium.
Journal of Biological Chemistry 280, 39168-74.
Hendrickson WA. (2005). Transduction of biochemical signals across cell membranes.
Quarterly Reviews of Biophysics 38, 321-30
Hulme JT, Lin TWC, Westenbroek RE, Scheuer T, Catterall WA. Β-adrenergic
regulation requires direct anchoring of PKA to cardiac CaV1.2 channels via a leucine
zipper interaction with a kinase-anchoring protein 15. Proceedings of the National
Academy of Sciences of the USA 100, 13093-98.
Iacovelli L, Sallese M, Mariggio S, de Blasi A. (1999). Regulation of G-protein-coupled
receptor kinase subtypes by calcium sensor proteins. FASEB Journal 13, 1-8. Review.
Insel PA, Head BP, Ostrom RS, Patel HH, Swaney JS, Tang CM, Roth DM. (2005).
Caveolae and lipid rafts: G protein-coupled receptor signaling microdomains in cardiac
myocytes. Annals of the New York Academy of Sciences 1047, 166-72. Review.
Jurevicius J and Fischmeister R. (1996). cAMP compartmentalization is responsible for a
local activation of cardiac Ca2+
channels by β-adrenergic agonists. Proceedings of the
National Academy of Sciences of the USA 93, 295-99.
Kerfant BG, Zhao D, Lorenzen-Schmidt I, Wilson LS, Cai S, Chen SR, Maurice DH,
Backx PH. (2007). PI3Kgamma is required for PDE4, not PDE3, activity in subcellular
microdomains containing the sarcoplasmic reticular calcium ATPase in cardiomyocytes.
Circulation Research 101, 400-8.
Korn SJ and Horn R. (1989) Influence of sodium-calcium exchange on calcium current
rundown and the duration of calcium-dependent chloride currents in pituitary cells,
studied with whole cell and perforated patch recording. Journal of General Physiology
94, 789–812
Krebs EG and Beavo JA. (1979). Phosphorylation-dephosphorylation of enzymes.
Annual Review of Biochemistry 48, 923-59.
Kohout TA, Lin FS, Perry SJ, Conner DA, Lefkowitz RJ. (2001). beta-Arrestin 1 and 2
differentially regulate heptahelical receptor signaling and trafficking. Proceedings of the
National Academy of Sciences 98, 1601-6.
Langan TA. (1968). Histone phosphorylation: stimulation by adenosine 3’,5’-
monophosphate. Science 162, 579-580.
84
Laflamme MA and Becker PL. (1999) Gs and adenylyl cyclase in transverse tubules of
the heart: implications for cAMP-dependent signaling. American Journal of Physiology –
Heart and Circulatory Physiology 277, 1841-48.
Lehnart SE, Wehrens XHT, Reiken S, Warrier S, Belevych AE, Harvey RD, Richter W,
Jin SLC, Conti M, Marks AR. (2005). Phosphodiesterase 4D deficiency in the ryanodine-
receptor complex promotes heart failure and arrhythmias. Cell 123, 25-35.
Liem LK, Simard JM, Song Y, Tewari K. (1995). The patch clamp technique.
Neurosurgery 36, 382-92. Review.
Lohmann SM, Walter U, Greengard P. (1980). Identification of endogenous substrate
proteins for cAMP-dependent protein kinase in bovine brain. Journal of Biological
Chemistry 255, 9985-92.
Maier LS, Bers DM. (2007). Role of Ca2+/calmodulin-dependent protein kinase (CaMK)
in excitation-contraction coupling in the heart. Cardiovascular Research 73, 631-40.
Review.
Marx S, Reiken S, Hisamatsu Y, Jayaraman T, Burkhoff D, Rosemblit N, Marks AR.
(2000). PKA phosphorylation dissociates FKBP12.6 from the calcium release channel
(ryanodine receptor): defective regulation in failing hearts Cell 101, 365-76.
Mitcheson JS, Hancox JC, Levi AJ. 1998. Cultured adult cardiac myocytes: future
applications, culture methods, morphological and electrophysiological properties.
Cardiovascular Research 39, 280-300. Review.
Mongillo M, McSorley T, Evellin S, Sood A, Lissandron V, Terrin A, Huston E,
Hannawacker A, Lohse MJ, Pozzan T, Houslay MD, Zaccolo M. (2004). Fluorescence
resonance energy transfer-based analysis of cAMP dynamics in live neonatal rat cardiac
myocytes reveals distinct functions of compartmentalized phosphodiesterases.
Circulation Research 95, 67-75.
Mongillo M, Tocchetti CG, Terrin A, Lissandron V, Cheung YF, Dostmann WR, Pozzan
T, Kass DA, Paolocci N, Houslay MD, Zaccolo M. (2006). Compartmentalized
phosphodiesterase-2 activity blunts beta-adrenergic cardiac inotropy via an NO/cGMP-
dependent pathway. Circulation Research 98, 226-34.
Mongillo M, Zaccolo M. (2006). A complex phosphodiesterase system controls beta-
adrenoceptor signalling in cardiomyocytes. Biochemical Society Transactions 34, 510-11.
Review.
Nagendran J, Archer SL, Soliman D, Gurtu V, Moudgil R, Haromy A, St Aubin C,
Webster L, Rebeyka IM, Ross DB, Light PE, Dyck JR, Michelakis ED. (2007).
Phosphodiesterase type 5 is highly expressed in the hypertrophied human right ventricle,
85
and acute inhibition of phosphodiesterase type 5 improves contractility. Circulation 116,
238-48.
Nikolaev VO, Bunemann M, Schmitteckert E, Lohse MJ, Engelhardt S. (2006) Cyclic
AMP imaging in adult cardiac myocytes reveals far-reaching beta1-adrenergic but locally
confined beta2-adrenergic receptor-mediated signaling. Circulation Research 99, 1084-
91.
Ono K, Fozzard HA. (1992). Phosphorylation restores activity of L-type calcium
channels after rundown in inside-out patches from rabbit cardiac cells. The Journal of
Physiology 454, 673-88.
Oude Weernink PA, Han L, Jakobs KH, Schmidt M. (2007). Dynamic phospholipid
signaling by G protein-coupled receptors. Biochimica et Biophysica Acta 1768, 888-900.
Review.
Packer M, Carver JR, Rodeheffer RJ, Ivanhoe RJ, Dibianco R, Zeldis SM, Hendrix GH,
Bommer WJ, Elkayam U, Kukin ML, Mallis GI, Sollano JA, Shannon J, Tandon PK,
DeMets DL. (1991). Effect of Oral Milrinone on Mortality in Sever Chronic Heart
Failure. The New England Journal of Medicine 325, 1468-75.
Perry SJ, Baillie GS, Kohout TA, McPhee I, Magiera MM, Ang KL, Miller WE, McLean
AJ, Conti M, Houslay MD, Lefkowitz RJ. (2002). Targeting of cyclic AMP degradation
to beta 2-adrenergic receptors by beta-arrestins. Science 298, 834-36.
Rall TW, Sutherland EW, Wosilait WD. (1956). The relationship of epinephrine and
glucagons to liver phosphorylase. III. Reactivation of liver phosphorylase in slices and in
extracts. Journal of Biological Chemistry 218, 483-495.
Rochais F, Abi-Gerges A, Horner K, Lefebvre F, Cooper DMF, Conti M, Fischmeister R
and Vandecasteele G. (2006). A specific pattern of phosphodiesterases controls the
cAMP signals generated by different Gs – coupled receptors in adult rat ventricular
myocytes. Circulation Research 98, 1081-88.
Rybin VO, Xu X, Lisanti MP, Steinberg SF. (2000). Differential targeting of beta -
adrenergic receptor subtypes and adenylyl cyclase to cardiomyocyte caveolae. A
mechanism to functionally regulate the cAMP signaling pathway. Journal of Biological
Chemistry 275, 41447-57.
Su Z, Li F, Spitzer KW, Yao A, Ritter M, Barry WH. (2003). Comparison of
sarcoplasmic reticulum Ca2+-ATPase function in human, dog, rabbit, and mouse
ventricular myocytes. Journal of Molecular and Cellular Cardiology 35, 761-767.
Thu le T, Ahn JR, Woo SH. (2006). Inhibition of L-type Ca2+ channel by mitochondrial
Na+-Ca2+ exchange inhibitor CGP-37157 in rat atrial myocytes. European Journal of
Pharmacology 552, 15-9.
86
Ward CA and Giles WR. (1997). Ionic mechanism of the effects of hydrogen peroxide in
rat ventricular myocytes. Journal of Physiology 500, 631-42.
Yang J, Drazba JA, Ferguson DG, Bond M. (1998) A-kinase anchoring protein 100
(AKAP100) is localized in multiple subcellular compartments in the adult rat heart.
Journal of Cell Biology 142, 511-22.
Wehrens XH, Lehnart SE, Huang F, Vest JA, Reiken SR, Mohler PJ, Sun J, Guatimosim
S, Song LS, Rosemblit N, D'Armiento JM, Napolitano C, Memmi M, Priori SG, Lederer
WJ, Marks AR. (2003). FKBP12.6 deficiency and defective calcium release channel
(ryanodine receptor) function linked to exercise-induced sudden cardiac death. Cell 113,
829-40.
Zaccolo M, Di Benedetto G, Lissandron V, Mancuso L, Terrin A, Zamparo I. (2006).
Restricted diffusion of a freely diffusible second messenger: mechanisms underlying
compartmentalized cAMP signalling. Biochemical Society Transactions 34, 495-97.
Review.
Zaccolo M, Movsesian MA. (2007). cAMP and cGMP signaling cross-talk: role of
phosphodiesterases and implications for cardiac pathophysiology. Circulation Research
100, 1569-78. Review.
Zaccolo M and Pozzan T. (2002). Discrete microdomains with high concentration of
cAMP in stimulated rat neonatal cardiac myocytes. Science 295, 1711-15.