THE EFFECTS OF DOPANTS AND COMPLEXIONS …THE EFFECTS OF DOPANTS AND COMPLEXIONS ON GRAIN BOUNDARY...
138
THE EFFECTS OF DOPANTS AND COMPLEXIONS ON GRAIN BOUNDARY DIFFUSION AND FRACTURE TOUGHNESS IN α-Al 2 O 3 BY LIN FENG DISSERTATION Submitted in partial fulfillment of the requirements for the degree of Doctor of Philosophy in Materials Science and Engineering in the Graduate College of the University of Illinois at Urbana-Champaign, 2017 Urbana, Illinois Doctoral Committee: Associate Professor Shen Dillon, Chair Professor John Lambros Assistant Professor Jessica Krogstad Assistant Professor Daniel Shoemaker
Transcript of THE EFFECTS OF DOPANTS AND COMPLEXIONS …THE EFFECTS OF DOPANTS AND COMPLEXIONS ON GRAIN BOUNDARY...
THE EFFECTS OF DOPANTS AND COMPLEXIONS ON GRAIN BOUNDARY DIFFUSION AND FRACTURE TOUGHNESS IN α-Al2O3
BY
LIN FENG
DISSERTATION
Submitted in partial fulfillment of the requirements
for the degree of Doctor of Philosophy in Materials Science and Engineering
in the Graduate College of the University of Illinois at Urbana-Champaign, 2017
Urbana, Illinois
Doctoral Committee:
Associate Professor Shen Dillon, Chair
Professor John Lambros Assistant Professor Jessica Krogstad Assistant Professor Daniel Shoemaker
ii
ABSTRACT
Grain boundaries often play a dominant role in determining material properties and
processing, which originates from their distinct local structures, chemistry, and properties.
Understanding and controlling grain boundary structure-property relationships has been an
ongoing challenge that is critical for engineering materials, and motivates this dissertation study.
Here, α-Al2O3 is chosen as a model system due its importance as a structural, optical, and high
temperature refractory ceramic whose grain boundary properties remain poorly understood
despite several decades of intensive investigation. Significant controversy still surrounds two
important properties of alumina that depend on its grain boundaries; diffusional transport and
mechanical fracture. Previously enigmatic grain boundary behavior in alumina, such as
abnormal grain growth, were found to derive from chemically or thermally induced grain
boundary phase transitions or complexion transitions. This work investigates the hypothesis
that such complexion transitions could also impact grain boundary diffusivity and grain
boundary mechanical strength. Scanning transmission electron microscopy based energy-
dispersive spectroscopy and secondary ion mass spectrometry are utilized to characterize
chemical diffusion profiles and quantify lattice and grain boundary diffusivity in Mg2+ and Si4+
doped alumina. It has found that Cr3+ cation chemical tracer diffusion in both the alumina
lattice and grain boundaries is insensitive to dopants and complexion type. We hypothesize that
extrinsic point defects mostly form bound clusters and are immobile. This fact coupled with
compensation by impurities makes the lattice diffusivity insensitive to dopant type. The lack of

iii
dopant effect on grain boundary diffusivity is difficult to rationalize, but we hypothesize that a
similar mechanism as described for the lattice may be active at the boundary, although charge
compensation is not necessary here. Lattice and grain boundary fracture toughness of alumina
is studied by a combination in-situ transmission electron microscopy based micro-cantilever
fracture and finite element simulation. These experiments allow the boundary properties to be
isolated from the microstructural geometry effects that influence the measured fracture
properties of polycrystals. The results suggest that samples with disordered complexions doped
with either Si2+ or Y3+ at high temperature exhibit boundaries weaker than the undoped
material. Whereas grain boundaries with ordered complexions doped by Y3+ are stronger than
the undoped boundaries. This embrittlment phenomenon is used to address anomalous grain
boundary strength versus grain size behavior that has been widely observed in the literatures.
iv
ACKNOWLEDGEMENT
Time flies by quickly, and the first day I came to the U of I, still feels like it was yesterday.
A large number of people have made unforgettable impressions and contributions during my
six-years as a grad student in Urbana. One of the important people giving me the most help is
my advisor, Professor Shen J. Dillon. Professor Dillon is a great advisor to do research with and
is a good friend. Without his help, I would not have survived my PhD study. I was a “trouble
maker” in the Dillon lab, but Professor Dillon was extremely patient and understanding during
my stay with him. I gained much interest and confidence in research, and obtained much
knowledge and understanding about interfaces and ceramic materials under his guidance. I
would also like to thank my doctoral committee members, Professor John Lambros, Jessica
Krogstad and Daniel Shoemaker for their time and effort in reviewing my dissertation, and their
suggestions to my research. Specifically, Professor Lambros who provided me with significant
insights and valuable suggestions for the fracture toughness part of this work.
My family has always been my biggest inspiration and a constant source of strength and
motivation. A loving and warm family atmosphere has helped me a positive outlook on life. My
dad and mom provided me with the best education they could, always ensuring that I had the
best of opportunities to study in many great schools. Although they did not hope I take a hard
mode of life, e.g. go to graduate school, they always provided me with their never-ending
support and helped me overcome any predicament that I had come across during my grad life. I
am so grateful that I grew up together with my sweet sister, Chang. I often found myself with
v
lack of time to talk with her after I came to the US, but I have a feeling she was always
telepathic and provided me with comfort during times of distress. I had a happy childhood with
my grandparents. Unfortunately, they passed away during my study in the US. If they were still
alive, I believe they would be very happy to know that their beloved granddaughter will
graduate and become a doctor. I know they will bless me always in heaven.
I am so grateful that I have many great friends at U of I. Audrey is the most important
friend. She is so considerate and sweet, and accompanied me through some of the hardest
phases of my grad life. Shiya, Wenxuan and I are from our home city, Shenyang, and we made
the “female engineering student team”. The afternoon teatime during weekend will always be a
memory to cherish. Alan is a friend to complain about each other, but he always helped and
provided me with the strength when I was struggling in the life (but I still think he is very
childish in many aspects). We had fun-filled crazy encounters. Jian and Kedi are also great
friends who helped me in my research, shared happiness in life and always gave me sweet
wishes during Chinese holidays. Li Gao helped me a lot in finding jobs and gave me very useful
suggestion about job interview. Hueihuei taught me to say “no” to people’s unreasonable
demands, which is hard for me. Selena is a good example to look up to for being a wonderful
female graduate student. I would also like to thank my labmates, who make our group a great
team, including the previous labmates, Kyong Wook Noh, Salman Arshad, Ke Sun, Yin Liu,
Shimin Mao, Bo huang, Daniel Anderson and Xuying Liu, and the current labmates, Jenny Tang,
Gowtham Jawaharram, John Vance and Yonghui Ma. They are also wonderful friends.
vi
I would like to thank all of the staff members in Frederick Seitz Materials research
laboratory (FS-MRL). They were very helpful and patient in training me to use the advanced
instruments. Doctor Tim Spila gave me much help and suggestions on SIMS, so that I had
chance to become one of few users of SIMS at UIUC. Although he said he gave me some hard
times, I know he is very kind and I appreciate that he helped me to run SIMS even during the
weekend. Steve Burdin is a super nice and skillful staff member, who helped to repair many
instruments that I needed to use. Doug Jeffers helped me solve many experiment problems,
which were outside of his duty. Jim Mabon is another a very nice staff who helped work with
the different TEMs. Fubo Rao and Tao Shang not only taught me about sample fabrication, but
also gave much help in life. Rick Haasch is a nice friend to talk just about anything, not just XPS
and Auger. There are many other great people at MRL but I cannot list all of their names here.
Without their professional training and help, it would be imposs ible to conduct these
experiments.
vii
TABLE OF CONTENTS
CHAPTER 1 INTRODUCTION ......................................................................................................1
1.1 OVERVIEW ....................................................................................................................1
1.2 STATEMENT OF THE PURPOSE...........................................................................................15
1.3 REFERENCES ................................................................................................................17
CHAPTER 2 THEORIES OF GRAIN BOUNDARY DIFFUSION AND FRACTURE TOUGHNESS .............23
2.1 GRAIN BOUNDARY DIFFUSION ..........................................................................................23
2.1.1 Basic models for grain boundary diffusion ..........................................................23
2.1.2 Kinetic classification of diffusion in polycrystals ..................................................25
2.1.3 Secondary Ion Mass Spectrometry Analysis of Grain Boundary Diffusion ..............30
2.2 FRACTURE TOUGHNESS...................................................................................................32
2.2.1 Models of fracture ............................................................................................33
2.2.2 Linear Elastic Fracture Mechanics ......................................................................33
2.2.3 Stress Intensity Factor .......................................................................................34
2.2.4 J integral and relation to stress intensity factor...................................................35
2.3 REFERENCES ................................................................................................................37
CHAPTER 3 CR3+ CHEMICAL DIFFUSIVITY IN ALIOVALENT DOPED ALUMINAS ............................41
3.1 INTRODUCTION ............................................................................................................41
3.2 EXPERIMENTAL PROCEDURE ............................................................................................44
3.3 RESULTS .....................................................................................................................48
3.4 DISCUSSION ................................................................................................................55
viii
3.5 CONCLUSIONS..............................................................................................................61
3.6 REFERENCES ................................................................................................................62
CHAPTER 4 CR3+ GRAIN BOUNDARY DIFFUSIVITY IN ALIOVALENT DOPED ALUMINAS................67
4.1 INTRODUCTION ............................................................................................................67
4.2 EXPERIMENTAL PROCEDURE ............................................................................................71
4.3 RESULTS .....................................................................................................................72
4.4 DISCUSSION ................................................................................................................78
4.5 CONCLUSIONS..............................................................................................................85
4.6 REFERENCES ................................................................................................................85
CHAPTER 5 THE EFFECTS OF DOPANTS AND COMPLEXION TRANSITIONS ON FRACTURE
TOUGHNESS OF ALUMINA..................................................................................92
5.1 INTRODUCTION ............................................................................................................92
5.2 EXPERIMENT PROCEDURE ...............................................................................................98
5.3 FINITE ELEMENT ANALYSIS ............................................................................................. 100
5.3.1 Mesh optimization .......................................................................................... 101
5.3.2 Comparison of 2D and 3D model...................................................................... 102
5.3.3 J integral optimization .................................................................................... 102
5.4 RESULT .................................................................................................................... 105
5.5 DISCUSSION .............................................................................................................. 116
5.6 CONCLUSION ............................................................................................................. 118
5.7 REFERENCES .............................................................................................................. 119
CHAPTER 6 CONCLUSION AND SUGGESTED FUTURE WORK.................................................... 126
ix
6.1 CONCLUSIONS RELATED TO THE EFFECTS OF DOPANTS AND COMPLEXION TRANSITIONS ON CR3+
GRAIN
BOUNDARY DIFFUSION IN ALUMINA ................................................................................ 126
6.2 FUTURE WORK RELATED TO THE EFFECTS OF DOPANTS AND COMPLEXION TRANSITIONS ON CR
3+ GRAIN
BOUNDARY DIFFUSION IN ALUMINA ................................................................................ 127
6.3 CONCLUSION RELATED TO THE EFFECTS OF DOPANTS AND COMPLEXION TRANSITIONS ON GRAIN
BOUNDARY FRACTURE TOUGHNESS IN ALUMINA ................................................................. 128
6.4 FUTURE WORK RELATED TO THE EFFECTS OF DOPANTS AND COMPLEXION TRANSITIONS ON GRAIN
BOUNDARY FRACTURE TOUGHNESS IN ALUMINA ................................................................. 128
6.5 REFERENCES .............................................................................................................. 129
1
CHAPTER 1
INTRODUCTION
1.1 Overview
Grain boundaries attract great interest due to their dominant role in governing materials
properties, processing, and performance.[1] The local structure and composition of grain
boundaries are usually quite complex and can differ markedly from the abutting crystals.
Unfortunately, this structure and chemistry is challenging to determine directly, due to the
buried nature of grain boundaries. Thus identifying the structure-property relationships for
grain boundaries along with strategies to engineer their performance is challenging.
Over the past decade, there has been a growing appreciation for the fact that grain
boundaries can undergo 2-D “phase” transitions analogous to 3-D bulk phase transitions.[1-7]
Just like bulk phase transitions result in discontinuous changes in bulk properties, grain
boundary “phase” transitions produce discontinuous changes in the grain boundary properties
that offer new potential routes to control materials properties. These 2-D phase transitions
have been called “complexion” transitions; a terminology that will be used herein. Just like bulk
phases, the stability of grain boundary complexions depends on thermodynamic parameters
such as chemical potential (composition), temperature, pressure, electric field, magnetic field,
etc. However, grain boundary complexions are stabilized by the adjoining crystals and are
sensitive to their orientations, thus complexions are not phases in the classical sense.[8, 9] It
has shown that complexion transition, consequently affecting grain boundary properties
2
including grain boundary energy,[10] mobility,[8] diffusivity,[11, 12] cohesive strength,[13] and
sliding resistance[14], are correlated to the dramatic change of materials ’ macroscopic
properties and phenomenon, such as embrittlement,[15, 16] corrosion,[17, 18] creep,[19]
abnormal grain growth,[20] and activated sintering[21] etc. The ability to predict and control
such phenomena is important in materials science and engineering, and thus we seek to better
understand the role of grain boundary complexions in influencing fundamental materials
properties.
While grain boundaries are by definition non-equilibrium features of a system, they tend
to establish local equilibrium through the minimization of the excess grain boundary energy, γ,
which is the reversible energy or work necessary to create a unit area of grain boundaries. Just
as we could define two different phases of a crystal (e.g. and ), we could similarly define
two different complexions (e.g. and ), which have different enthalpies, entropies, molar
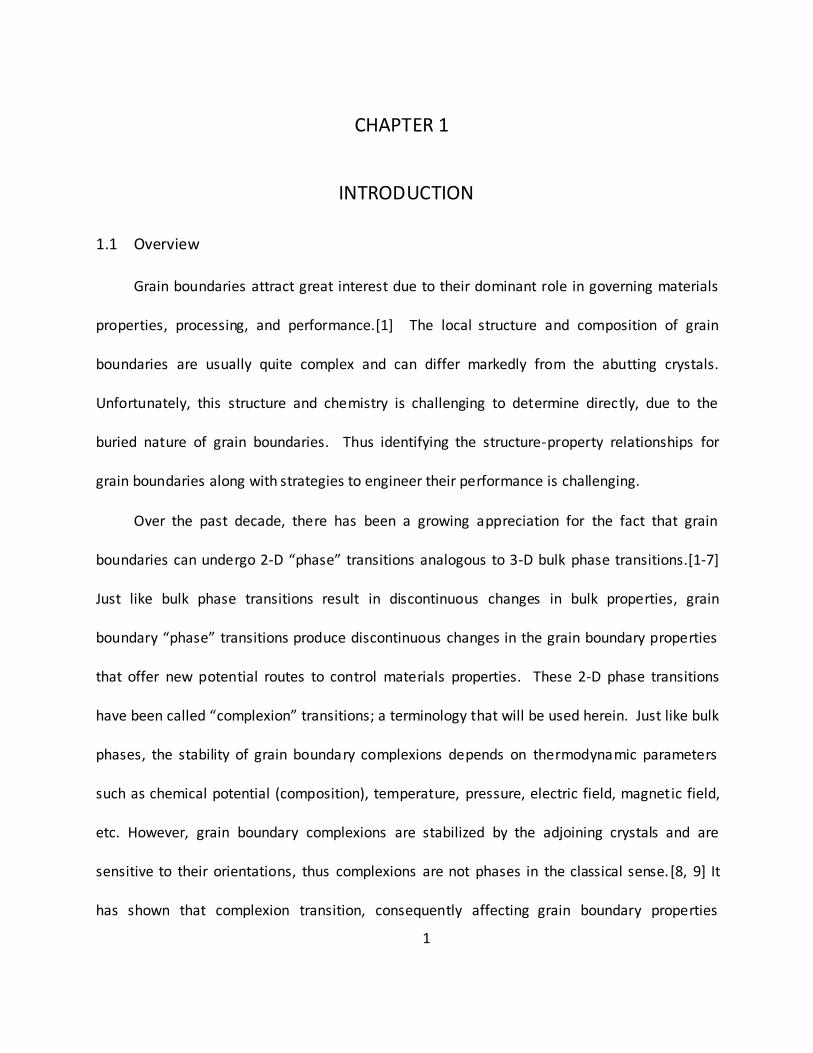
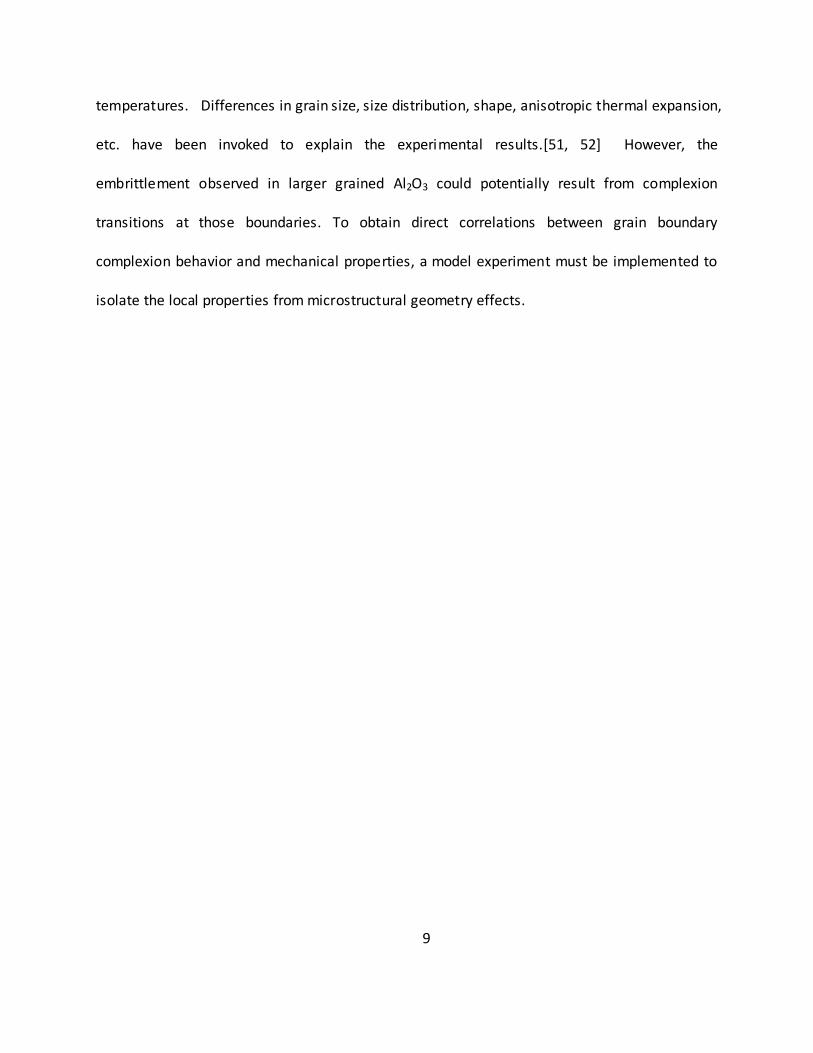
volumes, etc. An isobaric example (shown schematically in Fig. 1-1) demonstrates the basic
concept underlying a complexion transition in a pure system. Just like for the bulk phase
transition, the complexion (or phase) stable at high temperatures will have a higher enthalpy
and higher entropy, while the low temperature complexion (or phase) will have a lower entropy
and lower enthalpy. A complexion transition will occur in equilibrium at the temperature
where the grain boundary energies associated with each complexion are equivalent. [5] At
other temperatures, the lowest grain boundary energy complexion should exis t, although the
metastable grain boundary complexions can coexist just as is the case for bulk phases. It should
be noted that the value of γ at the transition point is continuous, which means that two or
3
more different types of complexion phases can coexist along a single boundary in equilibrium
(analogous to bulk phase co-existence such as solid liquid co-existence). Also, due to the
anisotropic nature of grain boundary energies and structures, it is possible for different
boundaries to undergo complexion transitions at different temperatures.
While complexion transitions have been predicted and observed in pure systems,[22, 23]
most observations have been in alloyed or doped systems.[8, 9, 15, 16, 24-27] The role of
solute adsorption on promoting first order complexion transitions was suggested by Hart in
1968 for understanding temper embrittlement of steel due to solute adsorption at grain
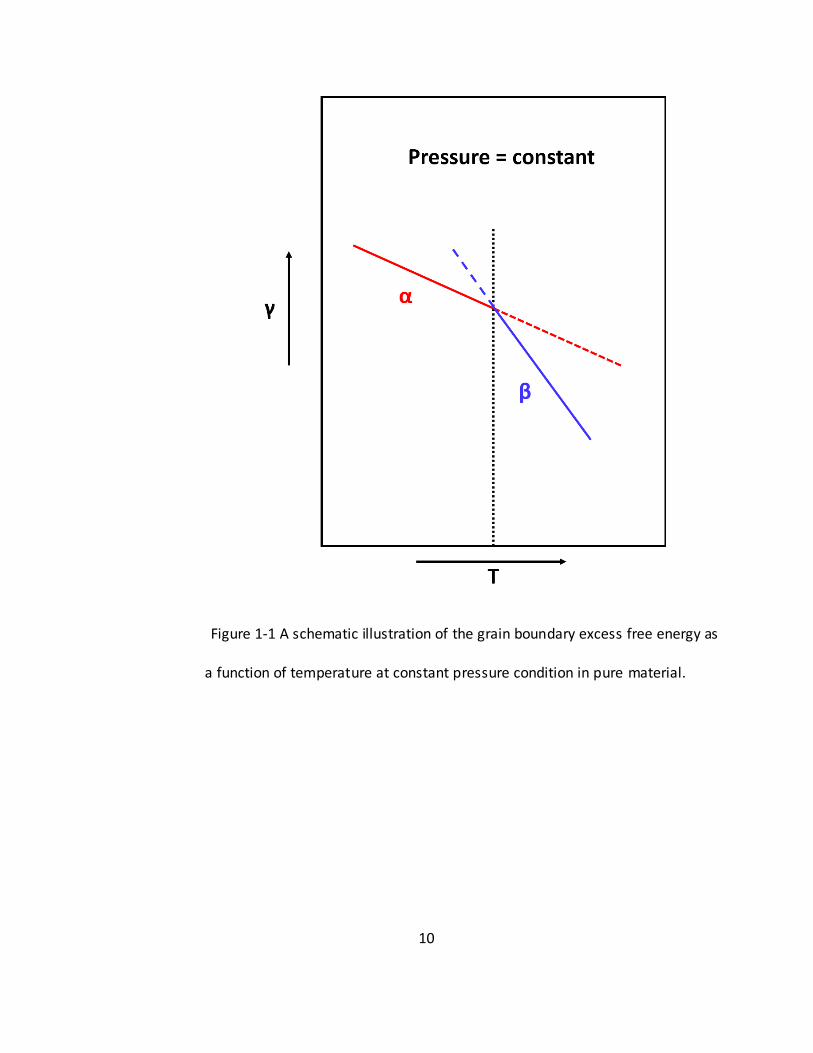
boundaries.[3] A simple thermodynamic model that captures grain boundary, or other
interfacial, adsorption transitions is the Fowler-Guggenheim isotherm,[28] which was originally
derived for surfaces that also undergo surface “phase” transitions. The isotherm is expressed
as:
(
(1)
where z is the coordination number, X is composition, ( and is an
parameter characterizing adsorbate-adsorbate interactions, which can be thought of as being
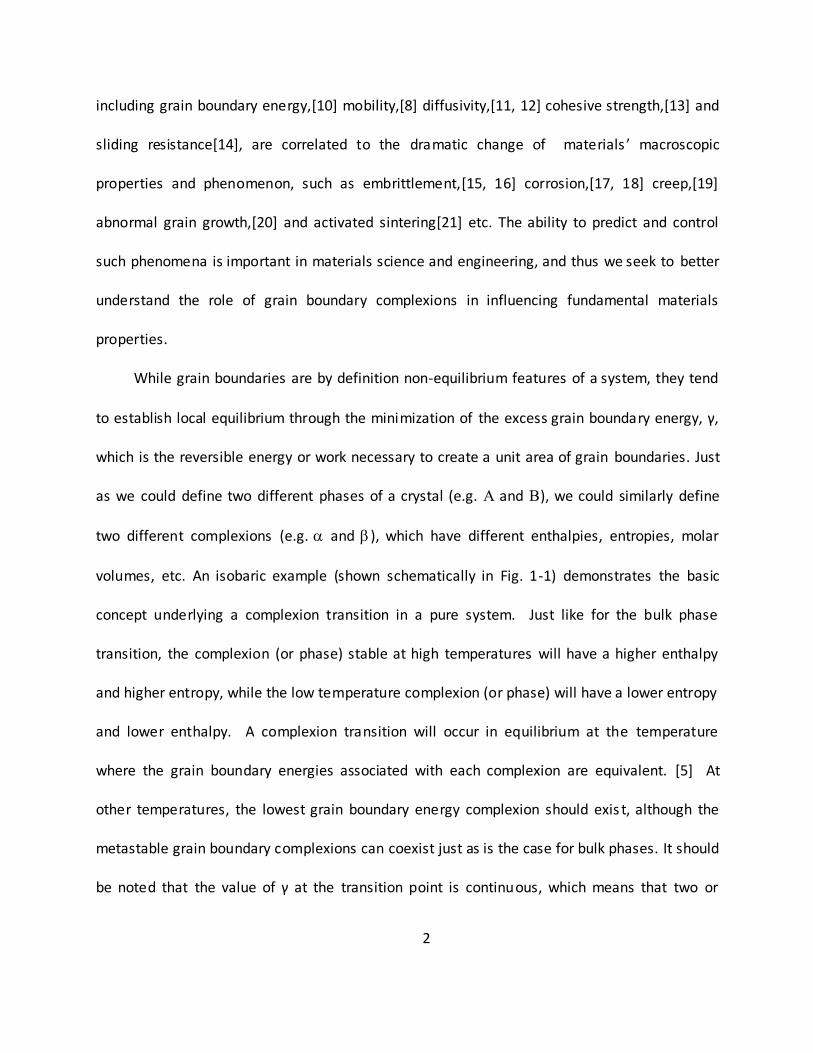
analogous to the bulk regular solution interaction parameter. At equilibrium, the stability of
different complexions depends on the adsorbate-adsorbate interaction, as shown in figure 1-2.
[29, 30] When , the solutes within the boundary interact like an ideal solution.
However, as increases there will be a tendency for solutes to want to cluster and phase
separate, which occurs when . Again, this is analogous to the regular solution
4
model where bulk phase separation occurs when the bulk interaction parameter, .
This model can be refined to account for composition dependent solute-solute interactions,
non-ideal entropy of mixing, etc., but captures the basic physics of the problem.
The nature of complexion transitions at different boundaries or in different systems can
vary significantly. For example, Frolov et al. observed transitions between “kite” and “split-kite”
like structures that composed 5 boundaries in FCC metals.[22] O’Brien et al. showed vicinal
twin boundaries reconstruct as a function of temperature by partial emission of Shockley partial
dislocations, although they did not distinguish if such reconstructions were first-order or
second-order.[31] Systems such as metal oxide doped Si3N4 and SiC are known to undergo
transitions from boundaries that are ‘dry’ to those containing intergranular films (dry simply
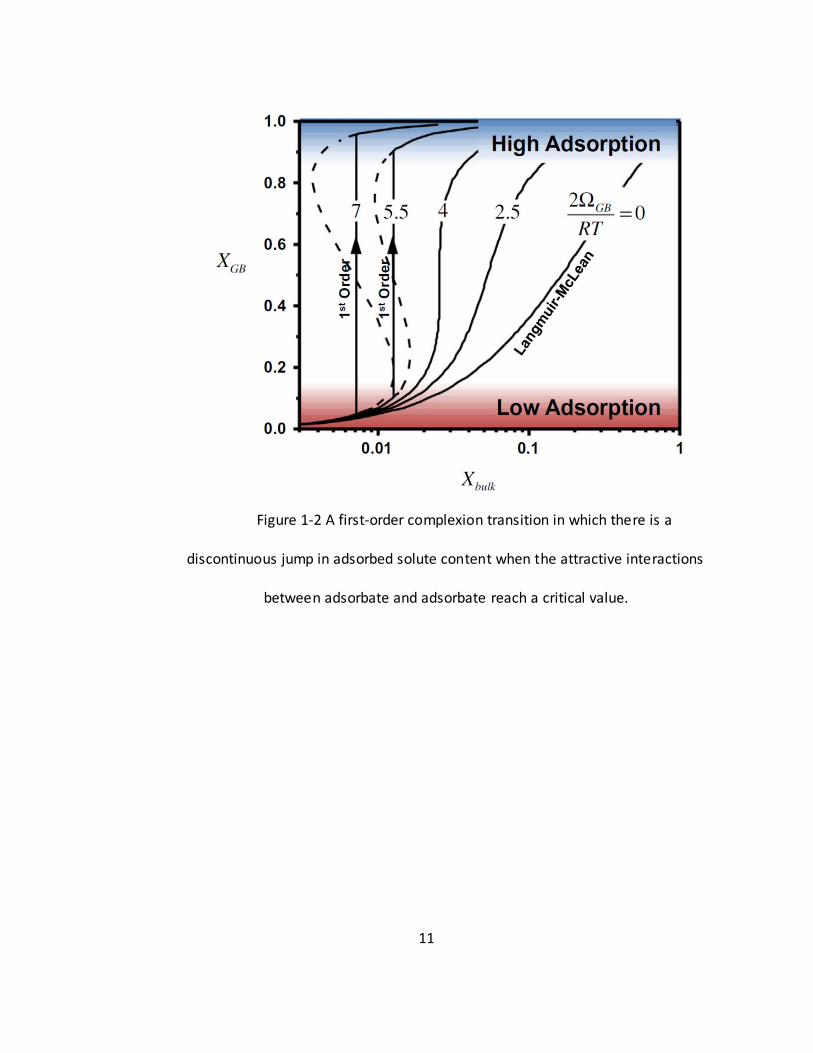
referring to a lack of intergranular film). One simple classification for complexions in doped or
alloy systems uses the idea based on multilayer adsorption to group grain boundaries by their
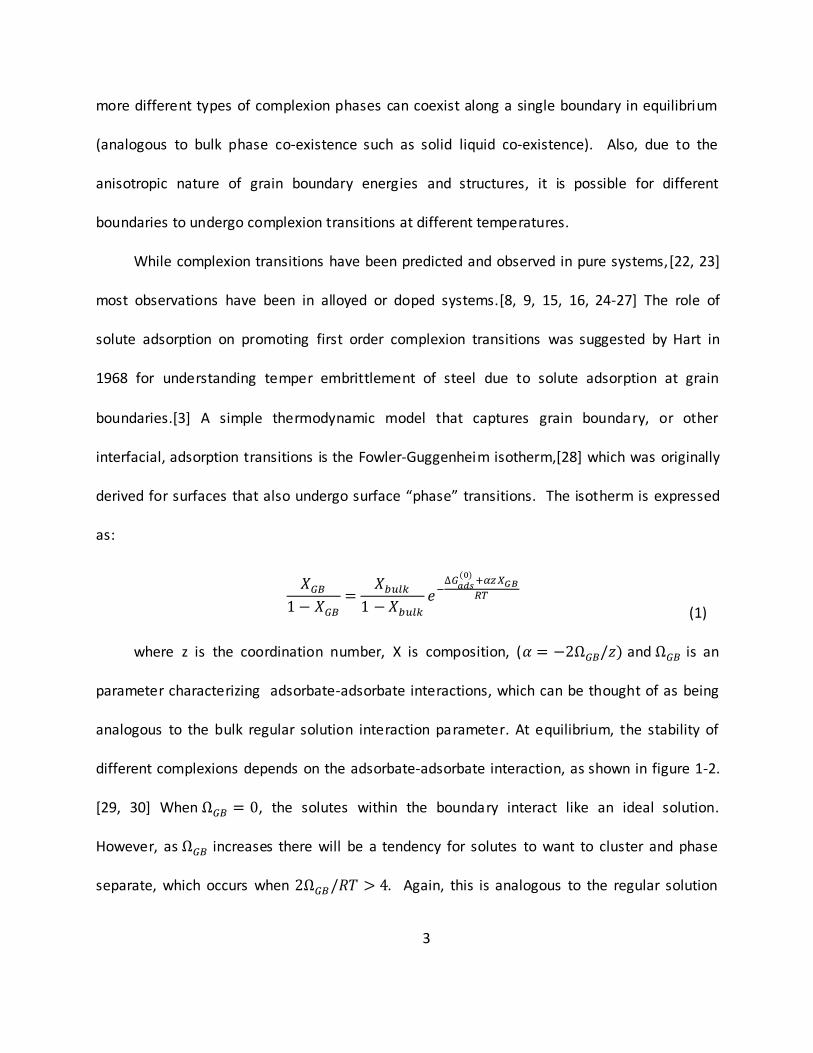
structural width. This was done in a study of doped Al2O3, where six types of complexion
behavior were identified and distinguished as shown in figure 1-3.[8] The complexions labeled
using Roman numbers are sub-monolayer (I), ‘clean’ (II), bilayer (III), trilayer (IV), thicker
multilayers (V), and wetting (VI). Here type II complexion represents the undoped Al 2O3 and in
terms of an adsorption model is not distinct from complexion I. Similarly, a bulk wetting film is
not explicitly a grain boundary complexion, but is instead a bulk phase. Nevertheless, Al2O3
demonstrates a great variety of complexion behavior that can exist in a system. It is worth
noting that other systems show multilayer adsorption where the structural width is not as
distinct (i.e. monolayer, bilayer, trilayer, etc.). For example, in systems like metal oxide doped
5
BaTiO3 or Si3N4 the structural width of the boundaries is not necessarily integer multiples of the
anion-cation bond length, suggesting more complicated atomic arrangements in those
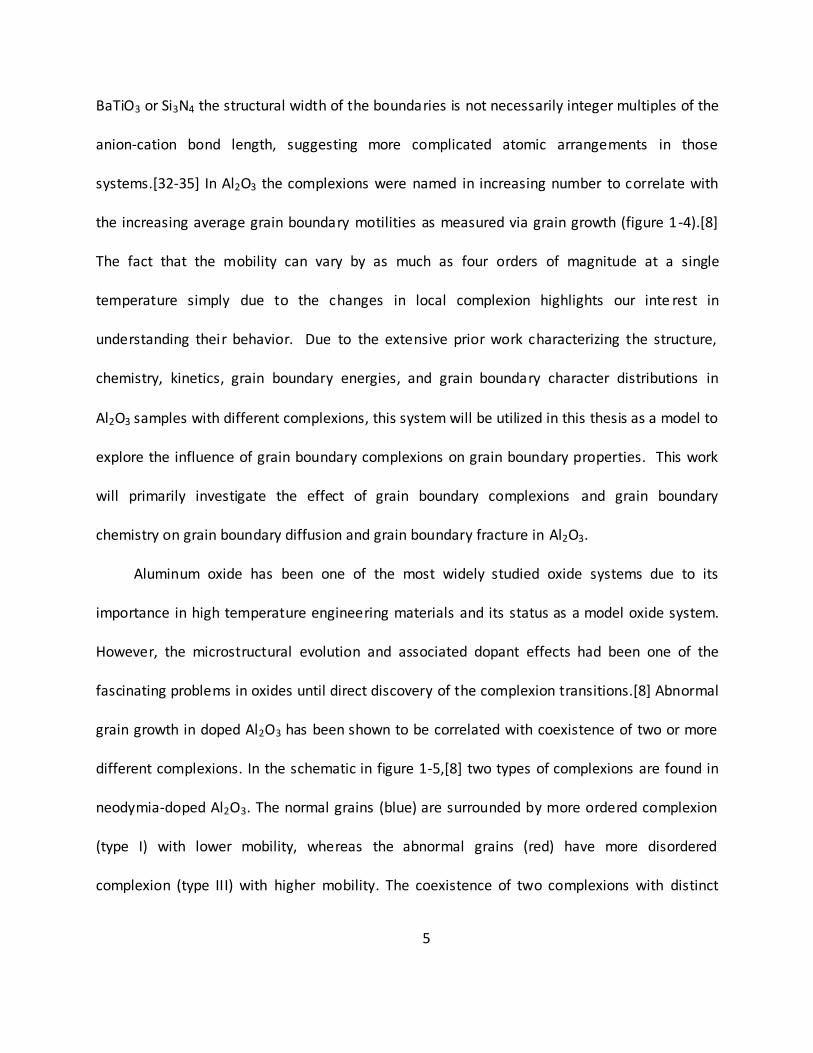
systems.[32-35] In Al2O3 the complexions were named in increasing number to correlate with
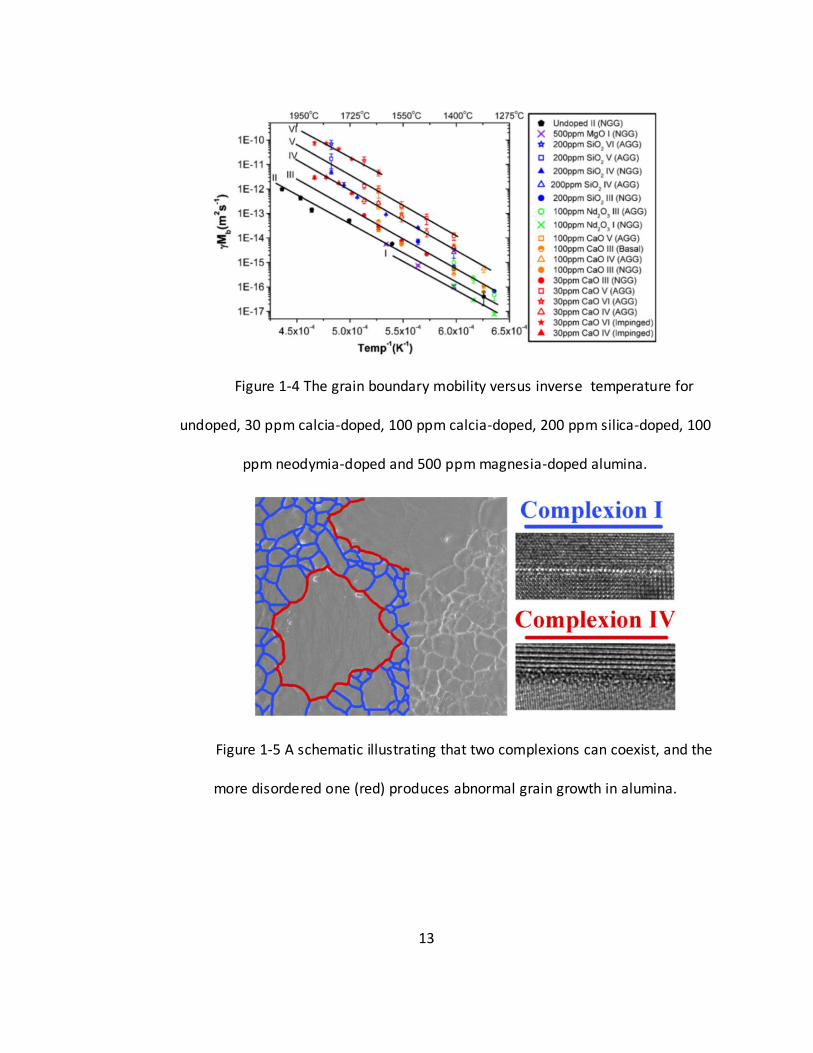
the increasing average grain boundary motilities as measured via grain growth (figure 1-4).[8]
The fact that the mobility can vary by as much as four orders of magnitude at a single
temperature simply due to the changes in local complexion highlights our inte rest in
understanding their behavior. Due to the extensive prior work characterizing the structure,
chemistry, kinetics, grain boundary energies, and grain boundary character distributions in
Al2O3 samples with different complexions, this system will be utilized in this thesis as a model to
explore the influence of grain boundary complexions on grain boundary properties. This work
will primarily investigate the effect of grain boundary complexions and grain boundary
chemistry on grain boundary diffusion and grain boundary fracture in Al2O3.
Aluminum oxide has been one of the most widely studied oxide systems due to its
importance in high temperature engineering materials and its status as a model oxide system.
However, the microstructural evolution and associated dopant effects had been one of the
fascinating problems in oxides until direct discovery of the complexion transitions.[8] Abnormal
grain growth in doped Al2O3 has been shown to be correlated with coexistence of two or more
different complexions. In the schematic in figure 1-5,[8] two types of complexions are found in
neodymia-doped Al2O3. The normal grains (blue) are surrounded by more ordered complexion
(type I) with lower mobility, whereas the abnormal grains (red) have more disordered
complexion (type III) with higher mobility. The coexistence of two complexions with distinct
6
motilities results in the abnormal grain growth. In literature, complexions with different
thickness have also been observed in various materials systems, including Cu-Bi,[36] Ni-Bi,[15]
Al-Ga,[37] and Mo-Ni[25] etc. The bilayer complexion structure (type III) has been found in Cu-
Bi or Ni-Bi, and trilayers and multilayers have been observed in Al-Ga and Mo-Ni, respectively.
Chemical tracer diffusion experiments demonstrated that the thermally induced complexion
transitions towards more disordered structure enhanced grain boundary diffusion in Cu-Bi and
Ni-Bi by > one order of magnitude.[12] Divinski et al.[11, 38] similarly demonstrated
complexion transitions in Cu-Bi that occurred isothermally as a function of composition that
also enhanced grain boundary tracer diffusivity by ≈2 orders of magnitude. Intergranular films
(type V) of thickness 1-2 nm have been found in Si3N4,[32, 39] SiC,[16] and other high-
temperature structural ceramics,[27, 40, 41] and are believed to be associated with activated
sintering, which enables the carbides and nitrides to be sintered at relatively low temperatures .
Grain growth, sintering, coarsening, oxidation, and solidification etc. all have grain boundary
diffusion as a principle unit process step.[40] However, the effect of complexion transitions on
grain boundary diffusion in Al2O3 has not been quantified. In Al2O3, both anion and cation could
be diffusion-control species. Numerous investigations of anion grain boundary diffusion have
been done in the past, and it has been shown that anion grain boundary diffusion is sensitive to
dopants.[42, 43] However, cation tracer diffusivity has not been as thoroughly studied due to
the lack of commercial Al26 isotope.[44] In these limited studies, people obtained contradictory
results from oxidation experiments and tracer diffusion experiments. In oxidation experiments,
grain boundary anion and cation diffusivity are comparable. This has been demonstrated via
7
double oxidation experiments with 16O and 18O that can track the formation of new oxide at the
oxide surface and the metal-oxide interface.[45, 46] The results have been particularly difficult
to rationalize, because tracer diffusivity measurements of 18O versus 26Al or chemical tracers
such as Cr3+ in bulk polycrystals indicate that anion diffusivity exceeds cation diffusivity by
several orders of magnitude.[42] This inconsistency between tracer diffusion experiments and
oxidation kinetics is a source of ongoing confusion, and partially motivates the current effort to
measure cation grain boundary diffusivity in Al2O3. The effects of dopants on cation grain
boundary diffusivity also need to be quantified, as the effect of impurities incorporated into
nominally doped Al2O3 is often a source of uncertainty. Moreover, complexion transitions are
very sensitive to dopants, and the relationship between complexion transition and grain
boundary diffusion also should be understood better.
Complexion transitions also offer new opportunities to refine our understanding of grain
boundary mechanics in Al2O3, which is arguably the most important high temperature
structural ceramic. In Al2O3, the thicker multilayer grain boundary complexions have been well
known since the late 1970’s and are often called intergranular films.[26, 32] Intergranular films
are well known to cause grain boundary embrittlement in ceramics such as SiC[16] and Si3N4[16,
32, 39, 41]. The presence of multilayer adsorption at FeCrAl-oxide scale interfaces has also been
correlated with the embrittlement of those interfaces.[47] Liquid metal embrittlement is also
well known in Ni-Bi,[15] Cu-Bi,[24, 36] and Al-Ga [37]etc., and has been attributed by some to
the existence of multilayer complexions at grain boundaries. Under the classic thermodynamic
8
consideration, the energy to create two free surfaces along grain boundary in brittle materials
is measured by the quantity of work of adhesion, Wad, which is:
(2)
where is the surface energy, and is the grain boundary energy. The relative energy of
grain boundary ( ) to the adjacent surface ( ) can be measured by dihedral angle ( ) of
grain boundary groove according to the Eqn. (3):
(3)
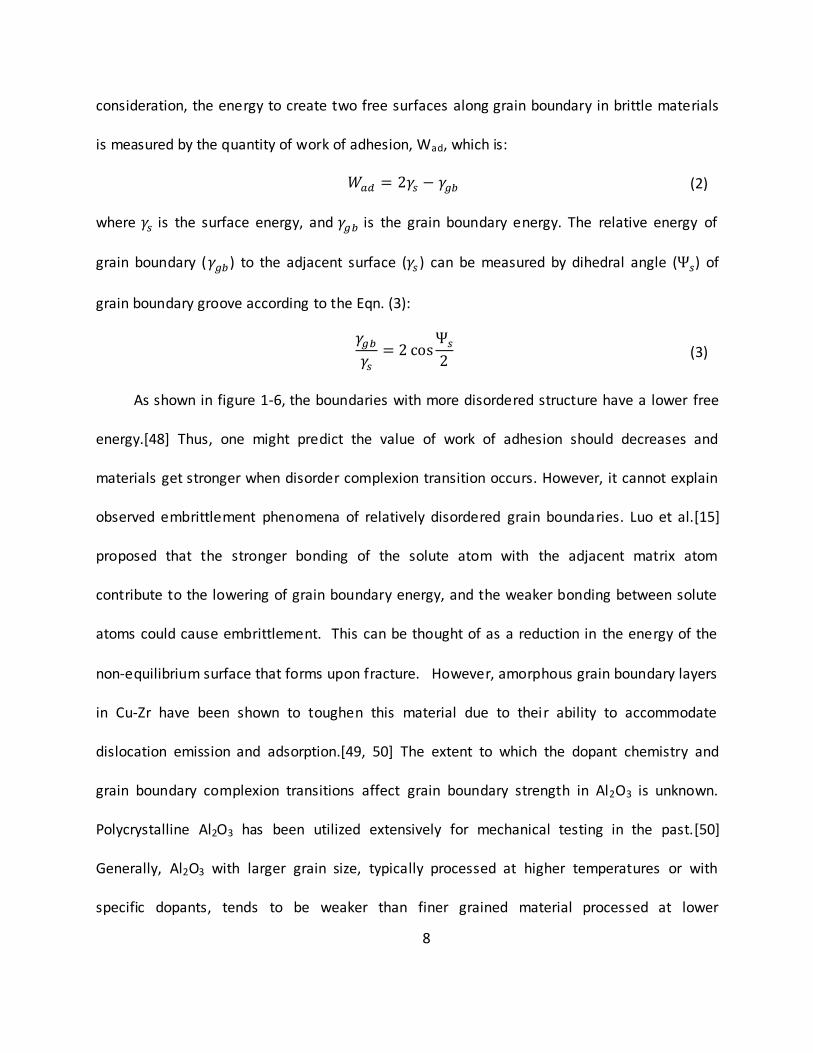
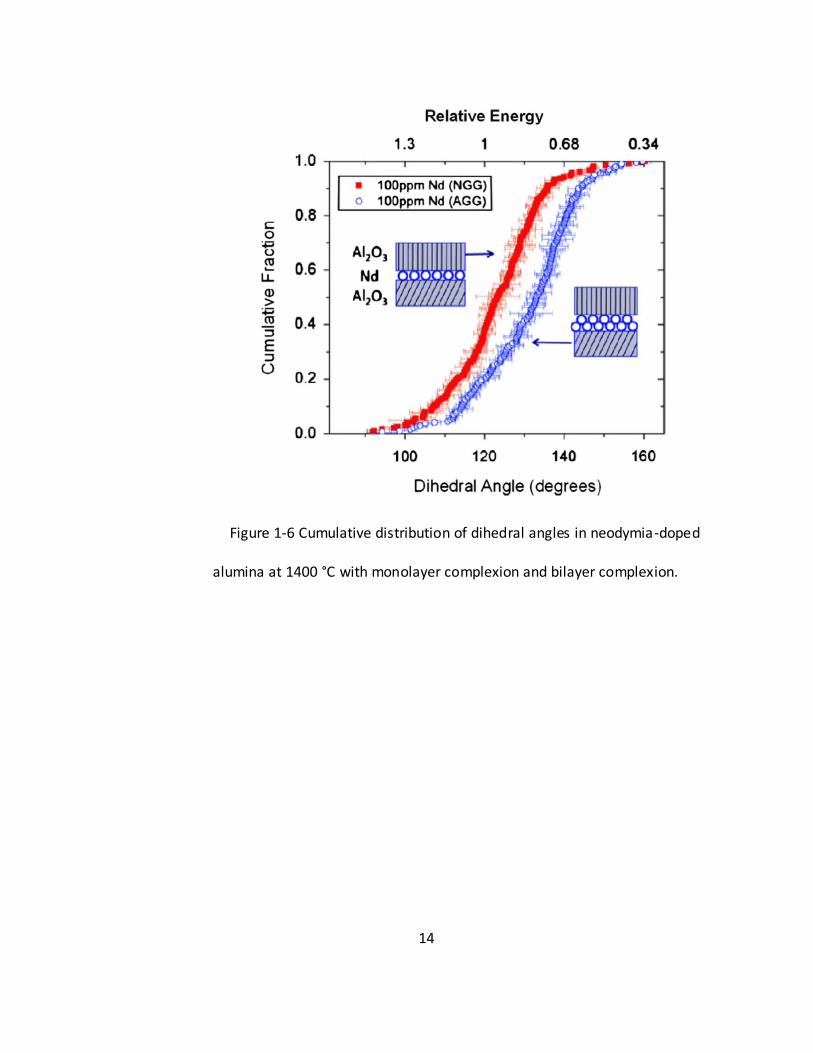
As shown in figure 1-6, the boundaries with more disordered structure have a lower free
energy.[48] Thus, one might predict the value of work of adhesion should decreases and
materials get stronger when disorder complexion transition occurs. However, it cannot explain
observed embrittlement phenomena of relatively disordered grain boundaries. Luo et al.[15]
proposed that the stronger bonding of the solute atom with the adjacent matrix atom
contribute to the lowering of grain boundary energy, and the weaker bonding between solute
atoms could cause embrittlement. This can be thought of as a reduction in the energy of the
non-equilibrium surface that forms upon fracture. However, amorphous grain boundary layers
in Cu-Zr have been shown to toughen this material due to their ability to accommodate
dislocation emission and adsorption.[49, 50] The extent to which the dopant chemistry and
grain boundary complexion transitions affect grain boundary strength in Al2O3 is unknown.
Polycrystalline Al2O3 has been utilized extensively for mechanical testing in the past.[50]
Generally, Al2O3 with larger grain size, typically processed at higher temperatures or with
specific dopants, tends to be weaker than finer grained material processed at lower
9
temperatures. Differences in grain size, size distribution, shape, anisotropic thermal expansion,
etc. have been invoked to explain the experimental results.[51, 52] However, the
embrittlement observed in larger grained Al2O3 could potentially result from complexion
transitions at those boundaries. To obtain direct correlations between grain boundary
complexion behavior and mechanical properties, a model experiment must be implemented to
isolate the local properties from microstructural geometry effects.
10
Figure 1-1 A schematic illustration of the grain boundary excess free energy as
a function of temperature at constant pressure condition in pure material.
11
Figure 1-2 A first-order complexion transition in which there is a
discontinuous jump in adsorbed solute content when the attractive interactions
between adsorbate and adsorbate reach a critical value.
12
Figure 1-3 High-angle annular dark-field scanning transmission electron
micrographs of six types of complexions in alumina and corresponding schematic.
13
Figure 1-4 The grain boundary mobility versus inverse temperature for
undoped, 30 ppm calcia-doped, 100 ppm calcia-doped, 200 ppm silica-doped, 100
ppm neodymia-doped and 500 ppm magnesia-doped alumina.
Figure 1-5 A schematic illustrating that two complexions can coexist, and the
more disordered one (red) produces abnormal grain growth in alumina.
14
Figure 1-6 Cumulative distribution of dihedral angles in neodymia-doped
alumina at 1400 °C with monolayer complexion and bilayer complexion.
15
1.2 Statement of the purpose
This thesis seeks to elucidate the effects of grain boundary complexion transitions in
Al2O3 on cation grain boundary diffusivity and grain boundary fracture. The results of the study
will provide important new insights into how to tailor the properties and performance of this
and other related systems through the control of complexion transitions. The work will be
broken down into two major components:
1. The effect of Mg2+ and Si4+ dopants and complexions on chemical tracer (Cr3+) lattice and
grain boundary diffusion in Al2O3 studied via EDS-STEM and SIMS, respectively. Knowledge of
dopant dependent lattice diffusivity is necessary to calculate grain boundary diffusivity in the
Harrison Type B regime (refer section 2.1.2). This is a considerable effort unto itself and is
treated separately in Chapter 3. The work addresses questions of how aliovalent dopants affect
cation lattice diffusivity in Al2O3, which has not been measured in detail previously. Chapter 4
then considers grain boundary diffusivity and addresses the following scientific questions .
Which species control transport for processes such as grain growth, oxidation, and creep? How
do dopants affect cation grain boundary diffusion, and what is the associated mechanisms?
What are the effects of complexion transitions on cation grain boundary diffusion?
2. The effect of Y3+ and Si4+ dopants and associated complexion transitions on the fracture
toughness of single Al2O3 grain boundaries. Single boundaries are isolated using focused ion
beam milling and associated micro-cantilever fracture experiments are performed via in-situ
TEM micro-mechanical testing. This work addresses the following questions: Do complexion

16
transitions in Al2O3 explain anomalous reductions on strength at large grain sizes? Is there any
relationship between dopant chemistry, grain boundary structure and fracture toughness.
17
1.3 References
[1] A.P. Sutton, R.W. Balluffi, Interfaces in crystalline materials, (1995).
[2] M.P. Harmer, The Phase Behavior of Interfaces, Science 332(6026) (2011) 182-183.
[3] E.W. Hart, Two-dimensional phase transformation in grain boundaries, Scripta Metallurgica
2(3) (1968) 179-182.
[4] P. Lejček, S. Hofmann, Thermodynamics and structural aspects of grain boundary
segregation, Critical Reviews in Solid State and Materials Sciences 20(1) (1995) 1-85.
[5] E.I. Rabkin, L.S. Shvindlerman, B.B. Straumal, Grain boundaries: Phase transitions and critical
phenomena, International Journal of Modern Physics B 05(19) (1991) 2989-3028.
[6] H.E.I.H.H. editor, The nature and behavior of grain boundaries, New York: Plenum (1972)
155.
[7] R. C., MRS Proc 238 (1991) 191.
[8] S.J. Dillon, M. Tang, W.C. Carter, M.P. Harmer, Complexion: A new concept for kinetic
engineering in materials science, Acta Materialia 55(18) (2007) 6208-6218.
[9] M. Tang, W.C. Carter, R.M. Cannon, Grain Boundary Transitions in Binary Alloys, Physical
Review Letters 97(7) (2006) 075502.
[10] W.D.a.M.K. L, Correlation between the structure and energy of grain boundaries in metals,
in: E. Wolf. D and Yip. S (Ed.), in Materials Interfaces: atomic-level structure and properties,,
Chapman and Hall, London, 1992.
18
[11] S. Divinski, M. Lohmann, C. Herzig, Grain boundary diffusion and segregation of Bi in Cu:
radiotracer measurements in B and C diffusion regimes, Acta Materialia 52(13) (2004) 3973-
3982.
[12] K. Tai, L. Feng, S.J. Dillon, Kinetics and thermodynamics associated with Bi adsorption
transitions at Cu and Ni grain boundaries, Journal of Applied Physics 113(19) (2013) 193507.
[13] C.J. McMahon, Temper embrittlement of steels: remaining issues, Materials Science
Forums 46 (1989) 61-76.
[14] T.G. Langdon, The role of grain boundaries in high temperature deformation, Materials
Science and Engineering: A 166(1) (1993) 67-79.
[15] J. Luo, H. Cheng, K.M. Asl, C.J. Kiely, M.P. Harmer, The Role of a Bilayer Interfacial Phase on
Liquid Metal Embrittlement, Science 333(6050) (2011) 1730-1733.
[16] H.-J. Kleebe, G. Pezzotti, T. NISHIDA, M. RÜ HLE, Role of interface structure on mechanical
properties of fluorine-doped Si3N4-SiC ceramics, Journal of the Ceramic Society of Japan
106(1229) (1998) 17-24.
[17] M. Yamashita, T. Mimaki, S. Hashimoto, S. Miura, Intergranular corrosion of copper and α-
Cu-Al alloy bicrystals, Philosophical Magazine A 63(4) (1991) 695-705.
[18] M. Yamashita, T. Mimaki, S. Hashimoto, S. Miura, Stress corrosion cracking of [110] and
[100] tilt boundaries of α-Cu-Al alloy, Philosophical Magazine A 63(4) (1991) 707-726.
[19] H.R. Tipler, The Influence of Purity on the Strength and Ductility in Creep of CrMoV Steels
of Varied Microstructures, Philosophical Transactions of the Royal Society of London. Series A,
Mathematical and Physical Sciences 295(1413) (1980) 213-233.
19
[20] S.J. Dillon, M.P. Harmer, Diffusion controlled abnormal grain growth in ceramics, Materials
science forum, Trans Tech Publ, 2007, pp. 1227-1236.
[21] V.K. Gupta, D.H. Yoon, H.M. Meyer Iii, J. Luo, Thin intergranular films and solid-state
activated sintering in nickel-doped tungsten, Acta Materialia 55(9) (2007) 3131-3142.
[22] T. Frolov, D.L. Olmsted, M. Asta, Y. Mishin, Structural phase transformations in metallic
grain boundaries, Nature Communications 4 (2013) 1899.
[23] E. Budke, T. Surholt, S.I. Prokofjev, L.S. Shvindlerman, C. Herzig, Tracer diffusion of Au and
Cu in a series of near Σ=5 (310)[001] symmetrical Cu tilt grain boundaries, Acta Materialia 47(2)
(1999) 385-395.
[24] K. Wolski, V. Laporte, N. Marié, M. Biscondi, About the Importance of Nanometer-Thick
Intergranular Penetration in the Analysis of Liquid Metal Embrittlement, Interface Science 9(3)
(2001) 183-189.
[25] X. Shi, J. Luo, Grain boundary wetting and prewetting in Ni-doped Mo, Applied Physics
Letters 94(25) (2009) 251908.
[26] D.R. Clarke, On the detection of thin intergranular films by electron microscopy,
Ultramicroscopy 4(1) (1979) 33-44.
[27] Chiang, Wang, Lee, HREM and STEM of intergranular films at zinc oxide varistor grain
boundaries, Journal of Microscopy 191(3) (1998) 275-285.
[28] R.H. Fowler, E.A. Guggenheim, Statistical thermodynamics, (1941).
[29] E.D. Hondros, M.P. Seah, The theory of grain boundary segregation in terms of surface
adsorption analogues, Metallurgical Transactions A 8(9) (1977) 1363-1371.
20
[30] P.R. Cantwell, M. Tang, S.J. Dillon, J. Luo, G.S. Rohrer, M.P. Harmer, Grain boundary
complexions, Acta Materialia 62 (2014) 1-48.
[31] C.J. O’Brien, S.M. Foiles, Hydrogen segregation to inclined twin grain boundaries in nickel,
Philosophical Magazine 96(26) (2016) 2808-2828.
[32] L.K.V. Lou, T.E. Mitchell, A.H. Heuer, Impurity Phases in Hot-Pressed Si3N4, Journal of the
American Ceramic Society 61(9-10) (1978) 392-396.
[33] D.R. Clarke, G. Thomas, Grain Boundary Phases in a Hot-Pressed MgO Fluxed Silicon Nitride,
Journal of the American Ceramic Society 60(11-12) (1977) 491-495.
[34] S.-Y. Choi, D.-Y. Yoon, S.-J.L. Kang, Kinetic formation and thickening of intergranular
amorphous films at grain boundaries in barium titanate, Acta Materialia 52(12) (2004) 3721-
3726.
[35] B.-K. Yoon, S.-Y. Choi, T. Yamamoto, Y. Ikuhara, S.-J.L. Kang, Grain boundary mobility and
grain growth behavior in polycrystals with faceted wet and dry boundaries, Acta Materialia 57(7)
(2009) 2128-2135.
[36] G. Duscher, M.F. Chisholm, U. Alber, M. Ruhle, Bismuth-induced embrittlement of copper
grain boundaries, Nat Mater 3(9) (2004) 621-626.
[37] W. Sigle, G. Richter, M. Rühle, S. Schmidt, Insight into the atomic-scale mechanism of liquid
metal embrittlement, Applied physics letters 89(12) (2006) 121911.
[38] S. Divinski, M. Lohmann, C. Herzig, B. Straumal, B. Baretzky, W. Gust, Grain-boundary
melting phase transition in the $\mathrm{Cu}\ensuremath{-}\mathrm{Bi}$ system, Physical
Review B 71(10) (2005) 104104.
21
[39] H.-J. Kleebe, G. Pezzotti, G. Ziegler, Microstructure and Fracture Toughness of Si3N4
Ceramics: Combined Roles of Grain Morphology and Secondary Phase Chemistry, Journal of the
American Ceramic Society 82(7) (1999) 1857-1867.
[40] A. Atkinson, C. Monty, Grain Boundary Diffusion in Ceramics, in: L.-C. Dufour, C. Monty, G.
Petot-Ervas (Eds.), Surfaces and Interfaces of Ceramic Materials, Springer Netherlands,
Dordrecht, 1989, pp. 273-284.
[41] D.R. Clarke, On the Equilibrium Thickness of Intergranular Glass Phases in Ceramic
Materials, Journal of the American Ceramic Society 70(1) (1987) 15-22.
[42] A.H. Heuer, Oxygen and aluminum diffusion in α-Al2O3: How much do we really
understand?, Journal of the European Ceramic Society 28(7) (2008) 1495-1507.
[43] A.H. Heuer, K.P.D. Lagerlof, Oxygen self-diffusion in corundum (alpha-Al2O3): A conundrum,
Philosophical Magazine Letters 79(8) (1999) 619-627.
[44] E.G. Moya, F. Moya, A. Sami, D. Juvé, D. Tréheux, C. Grattepain, Diffusion of chromium in
alumina single crystals, Philosophical Magazine A 72(4) (1995) 861-870.
[45] R. Prescott, M.J. Graham, The formation of aluminum oxide scales on high-temperature
alloys.
[46] W.J. Quadakkers, A. Elschner, W. Speier, H. Nickel, Composition and growth mechanisms of
alumina scales on FeCrAl-based alloys determined by SNMS, Applied Surface Science 52(4)
(1991) 271-287.
22
[47] K.G. Field, S.A. Briggs, P. Edmondson, X. Hu, K.C. Littrell, R. Howard, C.M. Parish, Y.
Yamamoto, Evaluation on the Effect of Composition on Radiation Hardening and Embrittlement
in Model FeCrAl Alloys, Oak Ridge National Lab.(ORNL), 2015.
[48] S.J. Dillon, M.P. Harmer, G.S. Rohrer, Influence of interface energies on solute partitioning
mechanisms in doped aluminas, Acta Materialia 58(15) (2010) 5097-5108.
[49] Z. Pan, T.J. Rupert, Effect of grain boundary character on segregation-induced structural
transitions, Physical Review B 93(13) (2016) 134113.
[50] Z. Pan, T.J. Rupert, Amorphous intergranular films as toughening structural features, Acta
Materialia 89 (2015) 205-214.
[51] R.W. Rice, Effects of environment and temperature on ceramic tensile strength–grain size
relations, Journal of Materials Science 32(12) (1997) 3071-3087.
[52] R.W. RICE, Ceramic tensile strength-grain size relations: grain sizes, slopes, and branch
intersections, Journal of Materials Science 32(7) (1997) 1673-1692.
23
CHAPTER 2
THEORIES OF GRAIN BOUNDARY DIFFUSION AND FRACTURE
TOUGHNESS
In this chapter, background knowledge relevant to well established theories for grain
boundary diffusion and fracture toughness will be introduced. The purpose of this section is to
supply the reader with the requisite background necessary to understand the acquisition,
analysis, and interpretation of data acquired in the subsequent chapters. More detailed
discussion of the relevant physical models and theories can be found in the following books [1-7]
and review papers[8-12].
2.1 Grain boundary diffusion
2.1.1 Basic models for grain boundary diffusion
The most simple model for diffusion along the length of grain boundaries was first
proposed by Fisher[13], the boundary is treated as an isotropic semi-infinite slab of uniform
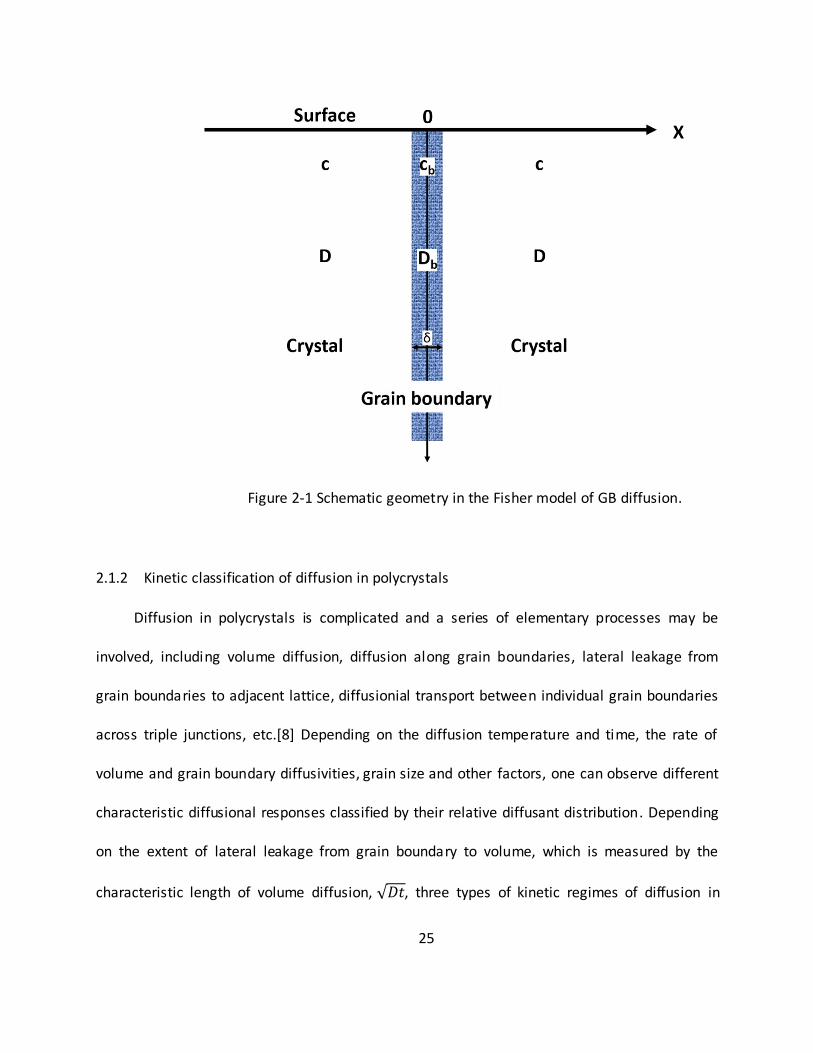
width, ẟ embedded in a semi-infinite perfect grain as shown in figure 2-1. The diffusant is
initially on the surface and transports perpendicular to the grain boundary, which is also
perpendicular to the free surface. Two parameters, the grain boundary width, , and the grain
boundary diffusivity, Db, are necessary to characterize the overall transport along the grain
boundary. In Fisher’s model, grain boundary is treated as a high diffusivity path, relative to, D,
the volume diffusion coefficient, thus Db>>D. During a diffusion experiment at temperature T
24
for time t, the diffusant atoms enter the specimen through grains and along grain boundaries.
Simultaneously, the atoms diffusing along grain boundary will also laterally leak into adjacent
lattice because of the diffusant concentration gradient between the interface of the grain
boundary and the abutting grain. The system is assumed to conform to the following
assumptions:
Diffusion directly into the crystal and grain boundary are both Fickian and follow
Fick’s second law.
The diffusion coefficients D and Db are isotropic and independent of concentration,
position, and time. This assumption is not explicitly true, but may provide a
reasonable approximation of polycrystalline response as discussed below.
The leakage of diffusant from the grain boundary to the adjacent crystal obeys
Fick’s first law as its flux boundary condition.
There are no concentration gradients across the grain boundary width, .
Following these assumptions the two diffusion processes in the lattice and grain
boundary are expressed as:
for (1)
for (2)
where C and Cb are the concentration in the volume concentration and grain boundary,
respectively.
25
Figure 2-1 Schematic geometry in the Fisher model of GB diffusion.
2.1.2 Kinetic classification of diffusion in polycrystals
Diffusion in polycrystals is complicated and a series of elementary processes may be
involved, including volume diffusion, diffusion along grain boundaries, lateral leakage from
grain boundaries to adjacent lattice, diffusionial transport between individual grain boundaries
across triple junctions, etc.[8] Depending on the diffusion temperature and time, the rate of
volume and grain boundary diffusivities, grain size and other factors, one can observe different
characteristic diffusional responses classified by their relative diffusant distribution. Depending
on the extent of lateral leakage from grain boundary to volume, which is measured by the
characteristic length of volume diffusion, , three types of kinetic regimes of diffusion in
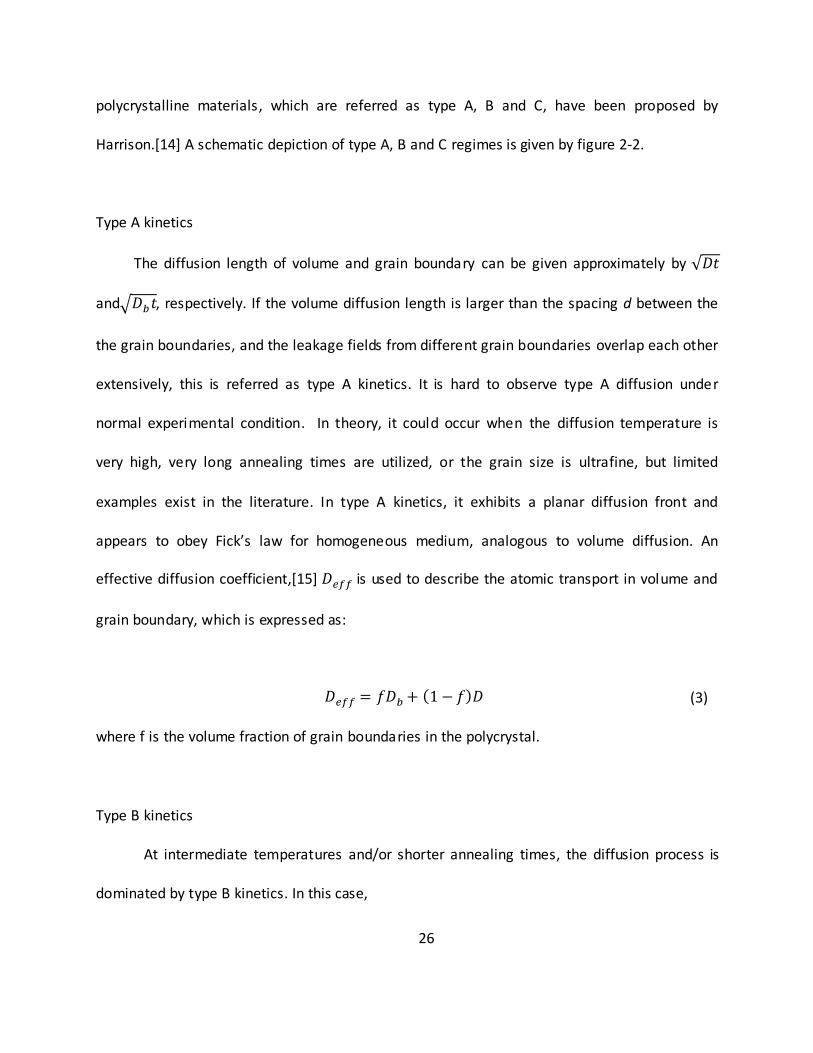
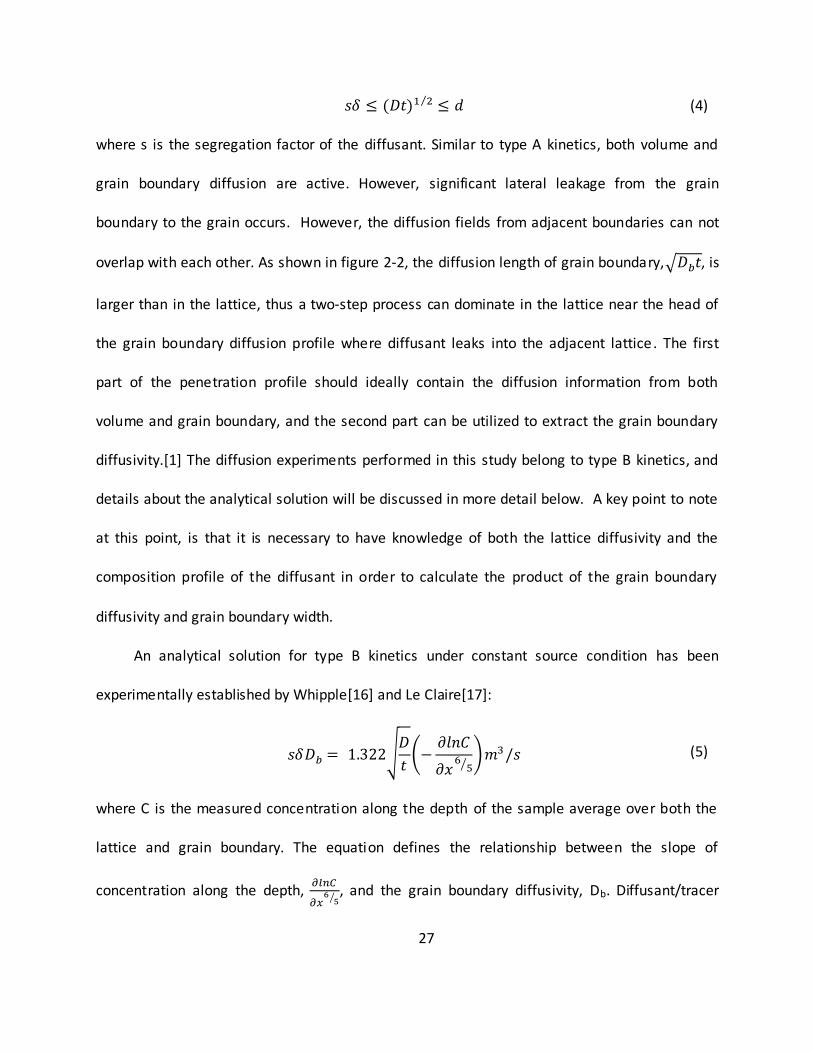
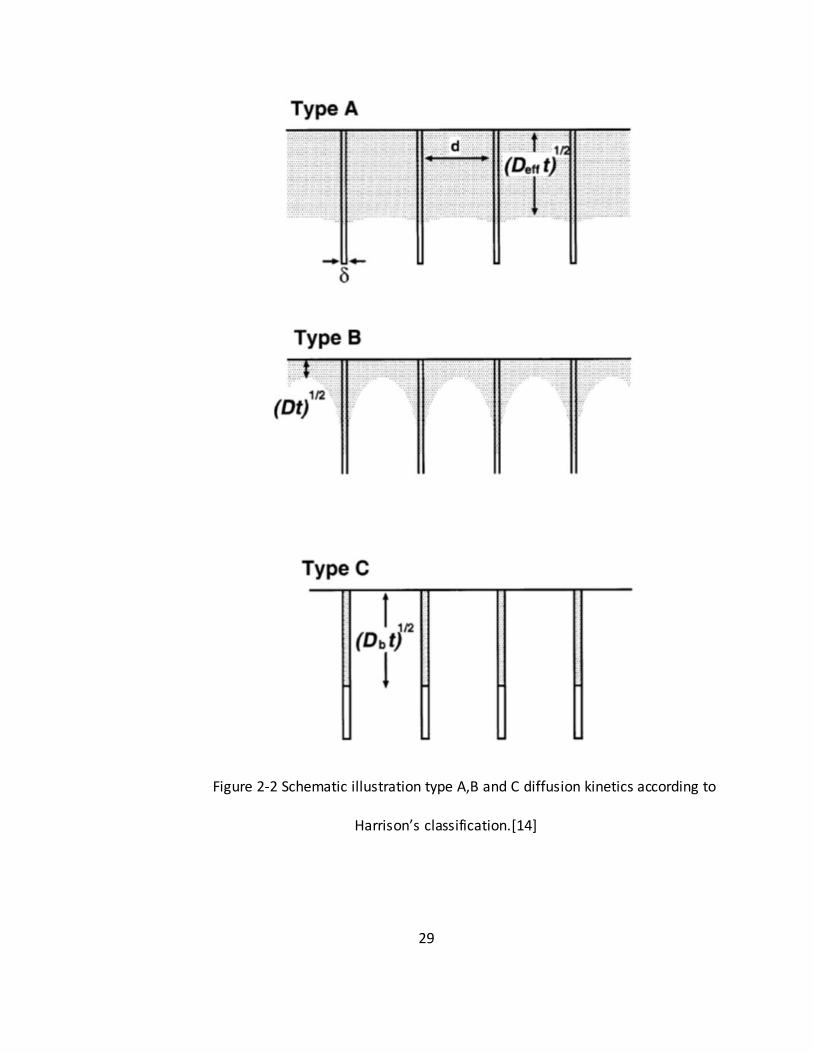
26
polycrystalline materials, which are referred as type A, B and C, have been proposed by
Harrison.[14] A schematic depiction of type A, B and C regimes is given by figure 2-2.
Type A kinetics
The diffusion length of volume and grain boundary can be given approximately by
and , respectively. If the volume diffusion length is larger than the spacing d between the
the grain boundaries, and the leakage fields from different grain boundaries overlap each other
extensively, this is referred as type A kinetics. It is hard to observe type A diffusion under
normal experimental condition. In theory, it could occur when the diffusion temperature is
very high, very long annealing times are utilized, or the grain size is ultrafine, but limited
examples exist in the literature. In type A kinetics, it exhibits a planar diffusion front and
appears to obey Fick’s law for homogeneous medium, analogous to volume diffusion. An
effective diffusion coefficient,[15] is used to describe the atomic transport in volume and
grain boundary, which is expressed as:
(3)
where f is the volume fraction of grain boundaries in the polycrystal.
Type B kinetics
At intermediate temperatures and/or shorter annealing times, the diffusion process is
dominated by type B kinetics. In this case,
27
(4)
where s is the segregation factor of the diffusant. Similar to type A kinetics, both volume and
grain boundary diffusion are active. However, significant lateral leakage from the grain
boundary to the grain occurs. However, the diffusion fields from adjacent boundaries can not
overlap with each other. As shown in figure 2-2, the diffusion length of grain boundary, , is
larger than in the lattice, thus a two-step process can dominate in the lattice near the head of
the grain boundary diffusion profile where diffusant leaks into the adjacent lattice. The first
part of the penetration profile should ideally contain the diffusion information from both
volume and grain boundary, and the second part can be utilized to extract the grain boundary
diffusivity.[1] The diffusion experiments performed in this study belong to type B kinetics, and
details about the analytical solution will be discussed in more detail below. A key point to note
at this point, is that it is necessary to have knowledge of both the lattice diffusivity and the
composition profile of the diffusant in order to calculate the product of the grain boundary
diffusivity and grain boundary width.
An analytical solution for type B kinetics under constant source condition has been
experimentally established by Whipple[16] and Le Claire[17]:
(5)
where C is the measured concentration along the depth of the sample average over both the
lattice and grain boundary. The equation defines the relationship between the slope of
concentration along the depth,
, and the grain boundary diffusivity, Db. Diffusant/tracer
28
concentration along the depth can be measured by sectioning the sample layer by layer. By
substituting the value of volume diffusivition coefficient, D, and diffusion time, t into the
equation, the product of can be obtained. The analytical solution for instantaneous
source is derived by Suzuoka, but will not apply to the diffusion process in this study. Interested
readers are referred to ref. [18] and [19] for details.
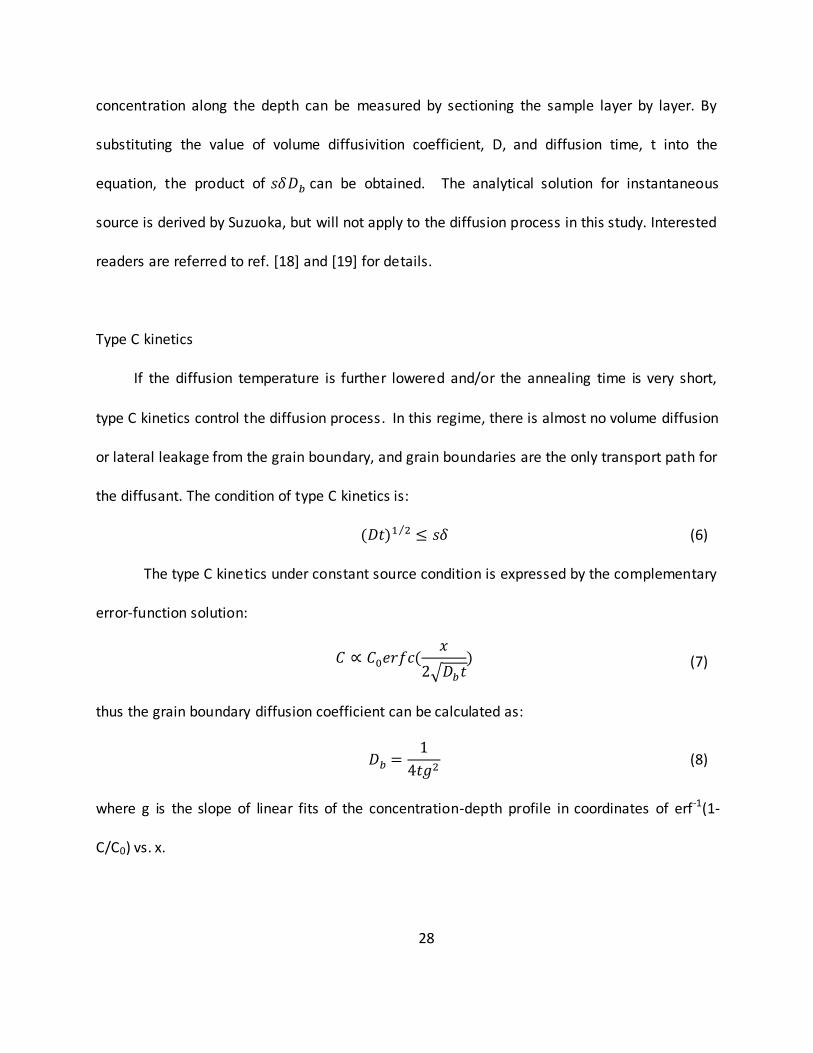
Type C kinetics
If the diffusion temperature is further lowered and/or the annealing time is very short,
type C kinetics control the diffusion process. In this regime, there is almost no volume diffusion
or lateral leakage from the grain boundary, and grain boundaries are the only transport path for
the diffusant. The condition of type C kinetics is:
(6)
The type C kinetics under constant source condition is expressed by the complementary
error-function solution:
(7)
thus the grain boundary diffusion coefficient can be calculated as:
(8)
where g is the slope of linear fits of the concentration-depth profile in coordinates of erf-1(1-
C/C0) vs. x.
29
Figure 2-2 Schematic illustration type A,B and C diffusion kinetics according to
Harrison’s classification.[14]
30
2.1.3 Secondary Ion Mass Spectrometry Analysis of Grain Boundary Diffusion
Secondary ion mass spectrometry (SIMS) is an analytical technique for measuring the
composition as a function of depth from the surface, although it also has many other useful
applications. A primary ion beam such as O+, Cs+, Ga+, Ar+ etc. accelerated to several keV is used
as incident beam to sputter the sample surface. The interaction between the energetic incident
beam and the sample leads to a series of collision cascades, that eject various particles
including electrons, ions with positive or negative charges, clusters , etc. from the surface. The
charged ions are extracted and focused by electrostatic and magnetic field, and then analyzed
by mass spectrometry.[3, 10, 11]
The dynamic mode of commercially manufactured SIMS is widely used to obtain
concentration-depth profiles from tracer diffusion experiments.[20-25] The basic equation for
quantifying composition as a function of depth from dynamic SIMS is:
(9)
where Ii is the secondary ion intensity of impurity species i, Ip is the primary ion flux, Yi is the
total sputter yield, α+ is ionization probability to positive ions, θ i is the fractional concentration
of m in the layer, and η is the transmission of the analysis system. In dynamic mode, the
secondary ion current of species is measured as a function of time. Assuming that a layer of
materials is sputtered uniformly from the surface as a function of time, we can obtain the
sputtering rate, . The depth of sputtering, Z, can be expressed as , thus the depth
profile Im versus Z can be obtained. The output signal of SIMS is the secondary ion intensity, I i,
which is quite sensitive to the incident beam and local chemical environment of samples. For a
31
given element, the secondary ion intensity can vary several orders of magnitude in samples
with different compositions, which is called the matrix effect. Two parameters, the sputter yield
of species m, Yi and the ionization probability, α, are very important. They are related to the
secondary ion intensity of SIMS through equation (9). Y i can be expressed as:
(10)
where Y is the total sputter yield for each incident ion. Y and α are associated with the incident
ion and the sample compositions. For example, the use of reactive incident beam(O2+, Cs+) can
cause a small total sputter yield but enhance the ionization probability, therefore the change of
Ii is quite complex. Relative sensitivity factor, accounting for differences in sputtering yield and
ionization probability of a given element in a given matrix, need to be used to compensate the
matrix effect and quantify element concentration. The RSF is defined by equation (11):
(11)
where Im is the matrix secondary ion intensity of the element of interest in a standard
calibration sample, is the impurity atom density in atom/cm3. From the definition, RSF has
unit of atom density, atoms/cm3, in a standard calibration sample. The RSF can be determined
from a standard calibration sample with a constant background ion intensity by equation (12):
(12)
where is the ion implant fluence in atom/cm2, C is the number of measurements, EM/FC is
the ratio of electron multiplier to Faraday cup counting efficiency (used only when the matrix is
measured on the FC and the impurity on the EM), is the sum of the impurity isotope
32
secondary ion counts over the depth profile, is the background ion intensity of Ii in
counts/data cycle, and t is the analysis time.
SIMS has high sensitivity to most elements. Compared to other surface composition
analysis techniques, such as AES or XPS which provide the detection levels on the order of 1
a.t.%, the detection limits of SIMS can be as low as parts per billion (ppb) for certain elements
at the surface, and parts per million (ppm) for almost all elements. The depth resolution of
SIMS is about 2-20 nm, and lateral resolution can vary from 20 nm – 1 m depending the
source of primary ion beam.[3] The instrument used in the current work has spatial resolution
of 3-15 nm. Under the neutralization aid of an electron gun, insulating samples, such as alumina,
can be measured by SIMS.
2.2 Fracture toughness
Fracture describes the separation of a single body into a greater number in response to
loading.[7] Fracture toughness is a measure of a materials ability to resist crack growth. Since
mechanical fracture should be sensitive to local bonding at the atomic level, it is anticipated
that microstructural defects like grain boundaries could have different fracture properties in
comparison to the surrounding lattice, particularly if measured at the local scale. For example,
in brittle materials exhibiting no plasticity the work of adhesion, Wad, is given by 2s, where s, is
the energy of the surfaces that form after fracture. For ideally brittle grain boundary fracture,
the work of adhesion is given by (2s-gb), where gb is the grain boundary energy. Since the
grain boundary energy is an excess energy that is by definition greater than 0, one would
expect it to affect the mechanical fracture toughness in such a brittle material.
33
2.2.1 Models of fracture
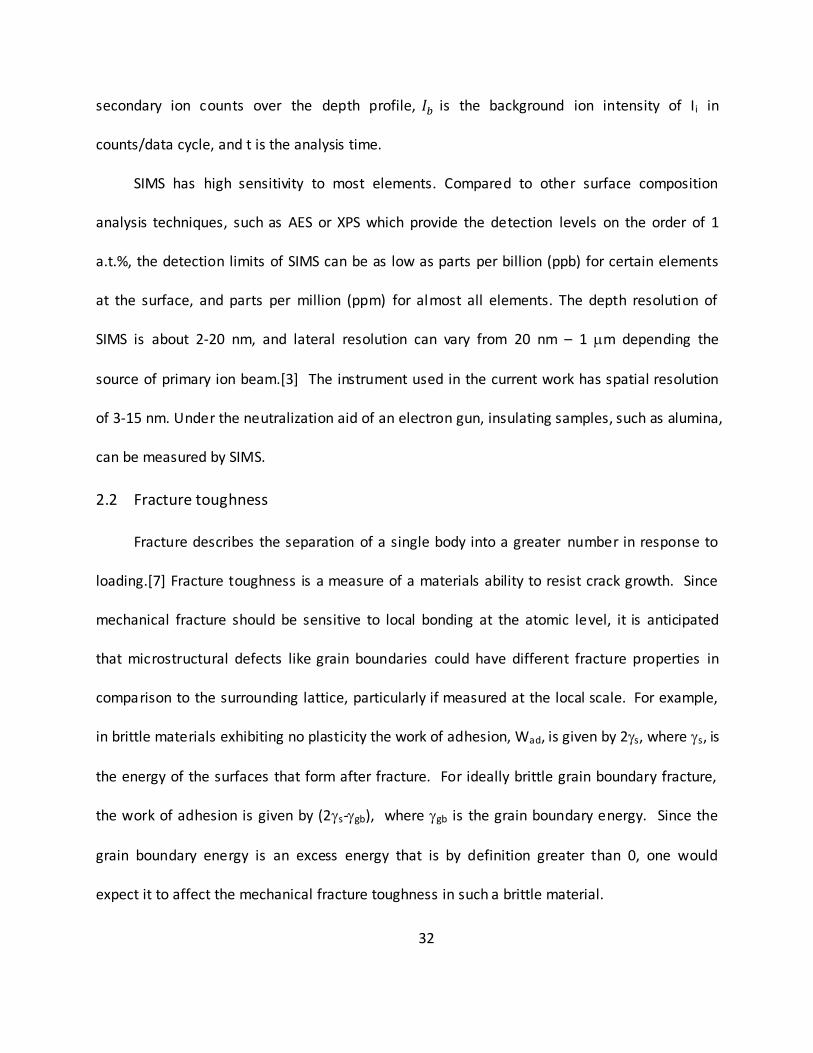
Three types of crack separation modes are classified as shown in figure 2-3:
Mode I, opening mode, when the crack loading is perpendicular to the crack plane.
Mode II, sliding mode, when the crack loading is parallel to the crack plane, and
perpendicular to the crack front.
Mode III, tearing mode, when the crack loading is parallel to the crack plane and
the crack front.
Figure 2-3 Schematic illustration of the three modes of fracture.
2.2.2 Linear Elastic Fracture Mechanics
For brittle materials, a crack will propagate very rapidly without apparent plastic
deformation. Linear elastic fracture mechanics (LFEM) theory may be applied to quantitatively
describe the fracture response.[7]
There are several basic hypotheses of LEFM as follows:
Cracks and associated flaws are inherently present in a material
34
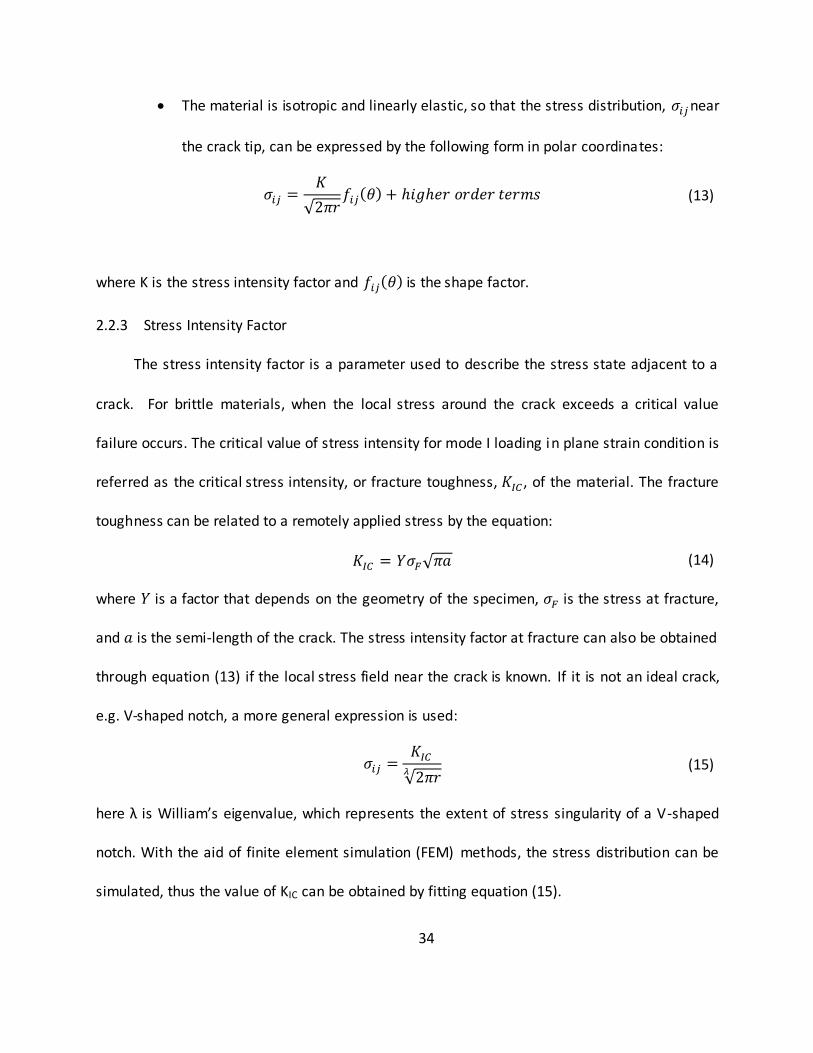
The material is isotropic and linearly elastic, so that the stress distribution, near
the crack tip, can be expressed by the following form in polar coordinates:
(13)
where K is the stress intensity factor and is the shape factor.
2.2.3 Stress Intensity Factor
The stress intensity factor is a parameter used to describe the stress state adjacent to a
crack. For brittle materials, when the local stress around the crack exceeds a critical value
failure occurs. The critical value of stress intensity for mode I loading in plane strain condition is
referred as the critical stress intensity, or fracture toughness, , of the material. The fracture
toughness can be related to a remotely applied stress by the equation:
(14)
where is a factor that depends on the geometry of the specimen, is the stress at fracture,
and is the semi-length of the crack. The stress intensity factor at fracture can also be obtained
through equation (13) if the local stress field near the crack is known. If it is not an ideal crack,
e.g. V-shaped notch, a more general expression is used:
(15)
here λ is William’s eigenvalue, which represents the extent of stress singularity of a V-shaped
notch. With the aid of finite element simulation (FEM) methods, the stress distribution can be
simulated, thus the value of KIC can be obtained by fitting equation (15).
35
2.2.4 J integral and relation to stress intensity factor
The J-integral represents the energy required to propagate a crack in elastic-plastic
materials, developed by Cherepanov[26] and Rice[27]. The two-dimensional J-integral was
firstly defined by Eshelby[28]:
(16)
where W(x1,x2) is the strain energy per unit volume, x1 and x2 are the coordinate directions, T is
the traction vector perpendicular to that points outside of the contour, u is the displacement
in the x1 direction, and ds is an element length along the contour. The unit of the J-integral is
energy per unit area (J/m2) or force per unit length (N/m).
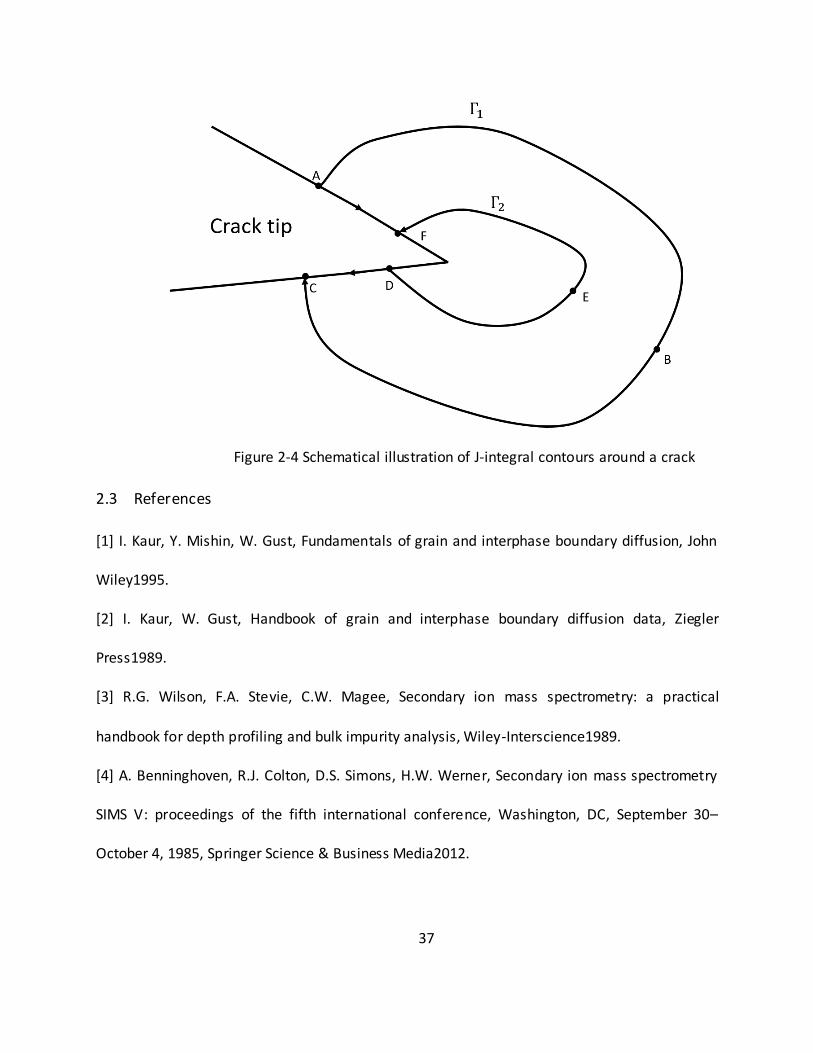
On the basis of the theory of conservation of energy, the integral of J equals to zero for a
closed contour. As shown in figure 2-4, a contour ABCDEFA around a crack is made, and the
total value of J must be zero,
Since, the traction T along AF and CD (crack surface) are equal to zero, thus,
and
Therefore, it can be concluded that the J-integral along two different paths around a
crack has the same value, which establishes the path-independent characteristic of J-integral.
36
From the perspective of energetic criteria of fracture, the failure of material takes place
when the crack driving force, , equals to the fracture energy, which is the energy used to
create two free fracture surfaces. According to Irwin’s relationship,[29] for mode I crack
propagation, the failure criterion provided by LEFM can be correlated with the energetic failure
criterion, which is
(17)
for the plane strain condition;
and
(18)
for the plane stress condition. Here E is Young’s modulus and is the Poisson’s ratio of the
material.
For linear elastic materials and for materials experiencing small -scale yielding, the J-
integral over a contour around a crack tip equals to the crack driving force, . Thus,
(19)
for the plane strain condition;
and
(20)
for the plane stress condition.
37
Figure 2-4 Schematical illustration of J-integral contours around a crack
2.3 References
[1] I. Kaur, Y. Mishin, W. Gust, Fundamentals of grain and interphase boundary diffusion, John
Wiley1995.
[2] I. Kaur, W. Gust, Handbook of grain and interphase boundary diffusion data, Ziegler
Press1989.
[3] R.G. Wilson, F.A. Stevie, C.W. Magee, Secondary ion mass spectrometry: a practical
handbook for depth profiling and bulk impurity analysis, Wiley-Interscience1989.
[4] A. Benninghoven, R.J. Colton, D.S. Simons, H.W. Werner, Secondary ion mass spectrometry
SIMS V: proceedings of the fifth international conference, Washington, DC, September 30–
October 4, 1985, Springer Science & Business Media2012.
38
[5] J. Begley, J. Landes, The J integral as a fracture criterion, Fracture Toughness: Part II, ASTM
International1972.
[6] T.L. Anderson, T. Anderson, Fracture mechanics: fundamentals and applications, CRC
press2005.
[7] R.W. Hertzberg, Deformation and fracture mechanics of engineering materials, (1989).
[8] Y. Mishin, C. Herzig, J. Bernardini, W. Gust, Grain boundary diffusion: fundamentals to
recent developments, International materials reviews 42(4) (1997) 155-178.
[9] C. Herzig, S.V. Divinski, Grain Boundary Diffusion in Metals: Recent Developments,
MATERIALS TRANSACTIONS 44(1) (2003) 14-27.
[10] P. Williams, Secondary ion mass spectrometry, Annual Review of Materials Science 15(1)
(1985) 517-548.
[11] A. Benninghoven, F. Rudenauer, H.W. Werner, Secondary ion mass spectrometry: basic
concepts, instrumental aspects, applications and trends, (1987).
[12] A. Benninghoven, Surface investigation of solids by the s tatical method of secondary ion
mass spectroscopy (SIMS), Surface Science 35 (1973) 427-457.
[13] J.C. Fisher, Calculation of diffusion penetration curves for surface and grain boundary
diffusion, Journal of Applied Physics 22(1) (1951) 74-77.
[14] L. Harrison, Influence of dislocations on diffusion kinetics in solids with particular reference
to the alkali halides, Transactions of the Faraday Society 57 (1961) 1191-1199.
[15] E. Hart, On the role of dislocations in bulk diffusion, Acta Metallurgica 5(10) (1957) 597.
39
[16] R. Whipple, CXXXVIII. Concentration contours in grain boundary diffusion, The London,
Edinburgh, and Dublin Philosophical Magazine and Journal of Science 45(371) (1954) 1225-1236.
[17] A. Le Claire, The analysis of grain boundary diffusion measurements, British Journal of
Applied Physics 14(6) (1963) 351.
[18] T. Suzuoka, Exact solutions of two ideal cases in grain boundary diffusion problem and the
application to sectioning method, Journal of the Physical Society of Japan 19(6) (1964) 839-851.
[19] T. Suzuoka, Lattice and grain boundary diffusion in polycrystals, Transactions of the Japan
Institute of Metals 2(1) (1961) 25-32.
[20] S. Swaroop, M. Kilo, C. Argirusis, G. Borchardt, A.H. Chokshi, Lattice and grain boundary
diffusion of cations in 3YTZ analyzed using SIMS, Acta materialia 53(19) (2005) 4975-4985.
[21] R. Milke, M. Wiedenbeck, W. Heinrich, Grain boundary diffusion of Si, Mg, and O in
enstatite reaction rims: a SIMS study using isotopically doped reactants, Contributions to
Mineralogy and Petrology 142(1) (2001) 15-26.
[22] T. Horita, N. Sakai, T. Kawada, H. Yokokawa, M. Dokiya, Grain‐Boundary Diffusion of
Strontium in (La, Ca) CrO3 Perovskite‐Type Oxide by SIMS, Journal of the American Ceramic
Society 81(2) (1998) 315-320.
[23] R. De Souza, J. Kilner, J. Walker, A SIMS study of oxygen tracer diffusion and surface
exchange in La 0.8 Sr 0.2 MnO 3+ δ, Materials Letters 43(1) (2000) 43-52.
[24] D. Clemens, K. Bongartz, W. Quadakkers, H. Nickel, H. Holzbrecher, J.-S. Becker,
Determination of lattice and grain boundary diffusion coefficients in protective alumina scales
40
on high temperature alloys using SEM, TEM and SIMS, Fresenius' journal of analytical chemistry
353(3-4) (1995) 267-270.
[25] D. Carlson, C. Magee, A SIMS analysis of deuterium diffusion in hydrogenated amorphous
silicon, Applied Physics Letters 33(1) (1978) 81-83.
[26] G. Cherepanov, The propagation of cracks in a continuous medium, Journal of Applied
Mathematics and Mechanics 31(3) (1967) 503-512.
[27] J.R. Rice, A path independent integral and the approximate analysis of strain concentration
by notches and cracks, ASME, 1968.
[28] J.D. Eshelby, The determination of the elastic field of an ellipsoidal inclusion, and related
problems, Proceedings of the Royal Society of London A: Mathematical, Physical and
Engineering Sciences, The Royal Society, 1957, pp. 376-396.
[29] G.R. Irwin, Analysis of stresses and strains near the end of a crack traversing a plate, Spie
Milestone series MS 137(167-170) (1997) 16.
41
CHAPTER 3
Cr3+ CHEMICAL DIFFUSIVITY IN ALIOVALENT DOPED ALUMINAS
3.1 Introduction
In this chapter, the lattice diffusivities of Cr3+ in undoped and doped alumina are
measured firstly. Lattice diffusion in α- Al2O3 is usually considered to be mediated by extrinsic
defects, due to its high intrinsic defect formation energies [1-5]. This fact alone should not result
in an ambiguous quantitative understanding of lattice diffusivity, since the concentration of
extrinsic defects is calculated simply from the impurity concentration and in most high purity
powders available dopant solubility limits can far exceed impurity concentrations. Aliovalent
dopants will often enhance or suppress anion or cation lattice diffusivity in a manner
qualitatively consistent with anticipated charge compensating point defect formation. However,
the quantitative variation in lattice diffusivity can be much different than anticipated by
assuming the concentration of charge compensating defects is proportional to dopant
concentration. In theory, one would expect measured lattice diffusivities of different
commercial powders to vary significantly with impurity content. However, some systems
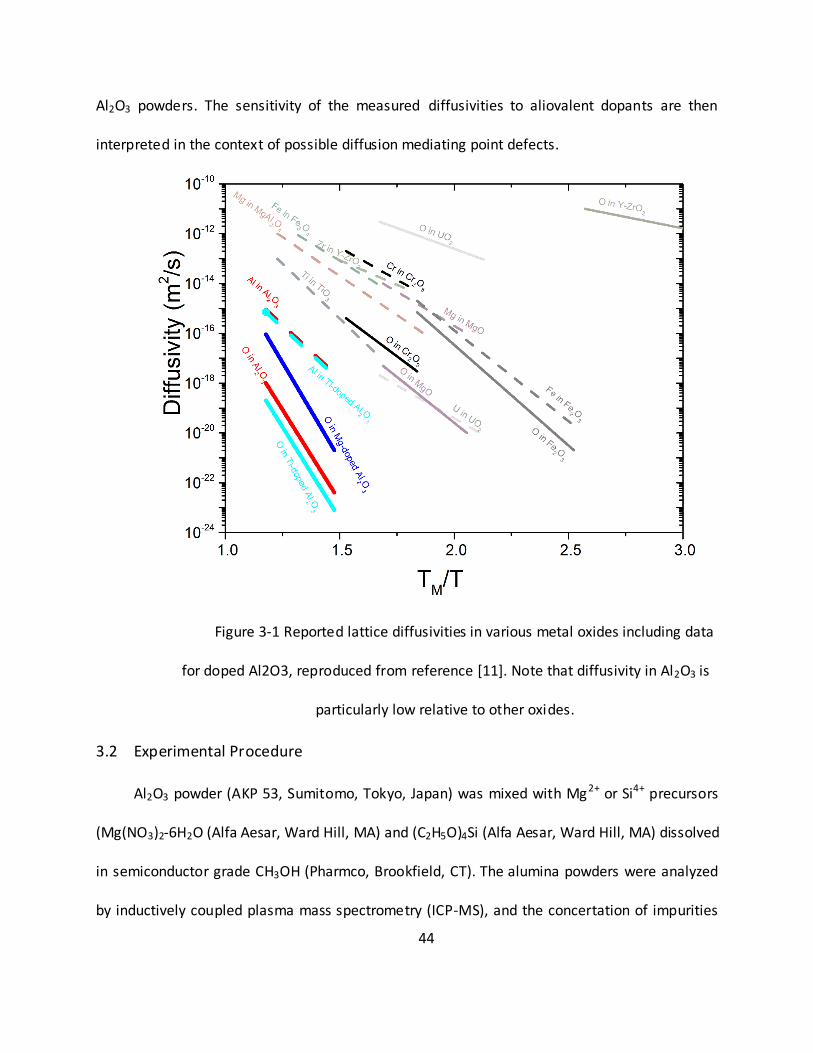
appear to be relatively insensitive to those impurities. Alumina has amongst the lowest anion
and cation lattice diffusivities of any oxide[6, 7] (see Figure 1). One would anticipate based on
simple defect chemistry arguments, that a high density of extrinsic diffusion mediating point
defects could be introduced relatively easily. However, lattice diffusion measurements in Al 2O3,
particularly on the anion sublattice, do not observe a strong extrinsic dopant effect.[8, 9]
42
Heuer et al. have highlighted this problem for anion (18O) diffusion in doped α-Al2O3.[8]
When doped with TiO2, Al2O3 should primarily form Al3+ vacancies, and when doped with MgO,
it should primarily form O2- vacancies. However, the addition of these dopants does not affect
the diffusivities proportionally to the calculated extrinsic vacancy concentrations. At the time,
they argued that the trends in their data, as well as in the literature, may be explained by the
impurity compensation effect. The idea derives from the fact that charge compensating
impurities present in the pristine powder can bind the dopant and suppress the formation of
extrinsic vacancies. For example, an equivalent concentration of TiO 2 and MgO dopant will
primarily bind to each other not contribute significantly to vacancy formation. Related
calculations[8, 10] demonstrate that certain relative levels of dopants and particular impurities
can produce the some of the trends observed experimentally. However, the behavior is still
highly sensitive to impurity and dopant content and the explanation alone may not be robust
enough to account for the range of situations actually sampled experimentally.
While a number of studies have measured anion diffusivity in Al2O3,[8, 9, 11-20] cation
diffusivity has only been considered in a few studies[21-24]. Additionally, the effect of
aliovalent doping on cation diffusivity in Al2O3 is not well studied.[7] The experimental
limitation is the lack of commercially available 26Al, which is not a stable isotope. Paladino and
Kingery provided early measures of 26Al lattice diffusivity, in what lower purity Al2O3 that was
available in the 1960’s.[24] This supposition about impurity content is supported by the large
plate-like abnormal grains observed in their microstructures, which are common in impure or
doped Al2O3. Paladino and Kingery’s measurements were performed on coarse-grained
43
polycrystals over a length scale that provided information about lattice diffusivity. More
recently, Fielitz et al measured 26Al lattice diffusivities in undoped and TiO2 doped sapphire and
found no measureable difference between the two systems.[21, 23] There could be some
concern about this result, since the tracer also introduced magnesium impurity.[21] However,
their results were quite consistent with those of Paladino and Kingery[24], suggesting that the
behavior may be insensitive to impurity levels and dopants. A number of studies have utilized
Cr2O3 as a chemical tracer for characterizing cation diffusivity, due to its complete miscibility in
Al2O3 and relatively weak enthalpic interactions.[25-28] It is interesting to note that the Cr2O3
diffusivity measurements in Al2O3 reported in the literature are also quite similar to one
another, within an order of magnitude across three studies.[25-27] These results again suggest
that cation diffusivity may be relatively insensitive to impurity level. However, few studies
directly consider the effect of aliovalent doping on Cr2O3 lattice diffusivity in Al2O3. One
potential reason that few studies have been performed is that single crystals of controlled
dopant chemistry are not commercially available for arbitrary chemistries. Such samples are
ideal, if not necessary, for traditional depth profiling methods utilized to characterize lattice
diffusivity.
In this chapter, we seek to characterize the effects of aliovalent SiO2 and MgO dopants on
the Cr2O3 chemical diffusion in Al2O3. The study utilizes scanning transmission electron
microscopy (STEM) based x-ray energy dispersive spectroscopy (EDS) to characterize
composition profiles within individual grains of doped polycrystals produced from high-purity
44
Al2O3 powders. The sensitivity of the measured diffusivities to aliovalent dopants are then
interpreted in the context of possible diffusion mediating point defects.
Figure 3-1 Reported lattice diffusivities in various metal oxides including data
for doped Al2O3, reproduced from reference [11]. Note that diffusivity in Al2O3 is
particularly low relative to other oxides.
3.2 Experimental Procedure
Al2O3 powder (AKP 53, Sumitomo, Tokyo, Japan) was mixed with Mg2+ or Si4+ precursors
(Mg(NO3)2-6H2O (Alfa Aesar, Ward Hill, MA) and (C2H5O)4Si (Alfa Aesar, Ward Hill, MA) dissolved
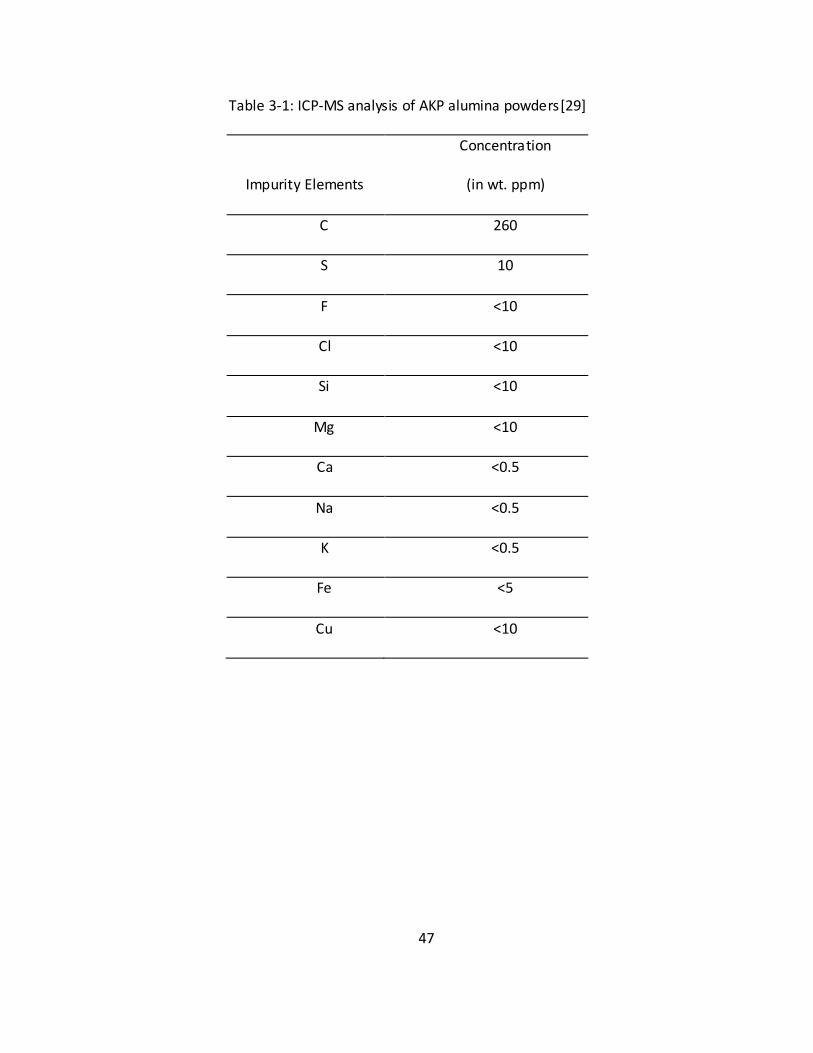
in semiconductor grade CH3OH (Pharmco, Brookfield, CT). The alumina powders were analyzed
by inductively coupled plasma mass spectrometry (ICP-MS), and the concertation of impurities
45
are listed in table 1.[29] Dopant concentrations of 500 ppm and 200 ppm were used,
respectively. In order to obtain fully dense samples, undoped and magnesium-doped samples
were hot pressed under 50 MPa at 1300 oC and silica-doped samples were hot pressed at 1200
oC in vacuum. The procedure is described in more detail in reference.[30]
Hot pressed samples were polished to a mirror finish using diamond lapping film down to
0.1 µm. Polished samples were pre-annealed at 1400 oC for 10 hours, in order to remove
surface damage produced by polishing. Annealing also promoted grain growth at this
temperature and subsequent diffusion anneals were all performed at lower temperatures for
shorter periods of time.
100 nm thick Cr thin films were deposited onto the surface of pre-annealed samples by E-
beam evaporation. Half of the sample surface was masked during deposition such that the
chemical tracer was only deposited on part of the surface. This provided a convenient way to
identify the Matano interface during subsequent scanning transmission electron microscopy
(STEM) characterization.
Diffusion anneals were performed in air in Al2O3 crucibles. Cr2O3 powder surrounded the
sample, but was not in direct contact. During annealing the Cr film oxidized and provided a
constant source for diffusion, however Cr2O3 has a high vapor pressure and the packing powder
was present to prevent vaporization of the film. Isothermal diffusion anneals were performed
at 1100, 1200, and 1300 oC.
Samples were characterized by scanning electron microscopy (SEM, 7000F, JEOL) and
STEM (2010F, JEOL) operated at 200 kV with an annular dark field detector. TEM samples were
46
prepared by Focused Ion Beam (FIB, Hellios, 600i, FEI) lift out. 200 nm Au or Cu thin films were
coated onto the sample surface as protective layers prior to lift out. A thin carbon film was
sputtered on the final samples to reduce charging.
Cr3+ diffusion profiles were measured by EDS (Gatan) in the STEM. EDS line scans were
obtained across the interface within single Al2O3 grains using an approximately 0.5 nm probe.
The lattice diffusivity, , of Cr3+ in Al2O3 was extracted by fitting the composition depth profile
to Fick’s second law assuming a constant source, which is expressed as:
(1)
where is the concentration of Cr at surface and is the concentration of Cr3+ at
penetration depth, , and is annealing time.
47
Table 3-1: ICP-MS analysis of AKP alumina powders[29]
Impurity Elements
Concentration
(in wt. ppm)
C 260
S 10
F <10
Cl <10
Si <10
Mg <10
Ca <0.5
Na <0.5
K <0.5
Fe <5
Cu <10
48
3.3 Results
Figure 2 depicts the microstructure of an undoped polycrystalline Al2O3 partially coated
with oxidized Cr. The underlying microstructure is relatively coarse grained and the partial
coating of the sample is useful for confirming the position of the Matano interface in the cross -
section. Figure 3 shows a cross-section HAADF-STEM image of the sample. No evidence of
dislocations is observed in bright-field TEM nor signs of Cr3+ diffusion along dislocations in dark-
field STEM. EDS line scans were measured just adjacent to the Cr layer as indicated by the red
line in figure 3. Since surface diffusion is many orders of magnitude faster than bulk diffusion,
the surface is considered to be at a fixed chemical potential adjacent to the Cr particle. This
analysis avoids any potential concerns about interface migration, the position of the Matano
interface, or the effect of counter ion diffusion (Al3+ in Cr2O3) affecting the measured Cr3+
diffusivity in Al2O3. In fact, the values measured below the Cr2O3 particles and below the free
surface adjacent to the Cr2O3 particles are the same within our experimental error. Figure 4
shows multiple composition profiles measured from different grains in undoped samples, after
annealing at 1300 oC for 15 minutes. The profiles are quite similar differing by a factor of 2 in
diffusivity. While some variation may reflect differences resulting from anisotropic diffusivity,
we consider this level of variation to be our experimental error. Cation lattice diffusivities were
measured in undoped Al2O3 at 1100, 1200, and 1300 oC. Example resulting composition profiles
are plotted in Figure 5a and the diffusivity values are shown on an Arrhenius plot in Figure 5b,
along with data from the literature.[25-27] The diffusivities measured can be described by the
following equation:
49
(2)
Our values for Cr3+ chemical diffusivity in undoped Al2O3 are quite consistent with
reported values.[25-27] The literature values are more explicitly Cr3+ chemical tracer
diffusivities measured in the dilute regime, which is not accessible to us by EDS. The
correspondence between our results and the literature values suggest that Cr3+ diffusivity in
Al2O3 does not vary significantly with Cr3+ concentrations up to ≈10%. For this reason, we
hypothesize that Cr3+ is a reasonably good chemical tracer even outside of the dilute regime
and that its chemical diffusivity may provide insights into the nature of diffusion mediating
point defects in Al2O3. We do note that Cr2O3 diffusivity in Al2O3 is consistently lower, and has
lower activation energy, than cation self-diffusion. Given the variation in the composition and
purity of commercially available powders, it is rather remarkable that diffusivities measured
from different samples characterized by different groups produce such consistent results.
Similar observations have been made previously for O2- lattice diffusivity in undoped Al2O3.[7]
Figure 6a shows example composition profiles of Cr3+ in SiO2-doped Al2O3 and MgO-
doped Al2O3 annealed at 1300oC for 15 min. While there are some differences in these profiles,
e.g. more mass transport occurring in the SiO2-doped sample, the results are not dramatically
different. This is also apparent for the values of diffusivity measured at other temperatures,
plotted in Figure 6b. The overall lattice diffusivity of Cr3+ in SiO2-doped Al2O3 is described by:
(3)
The diffusivity of Cr3+ in MgO-doped Al2O3 is described by:
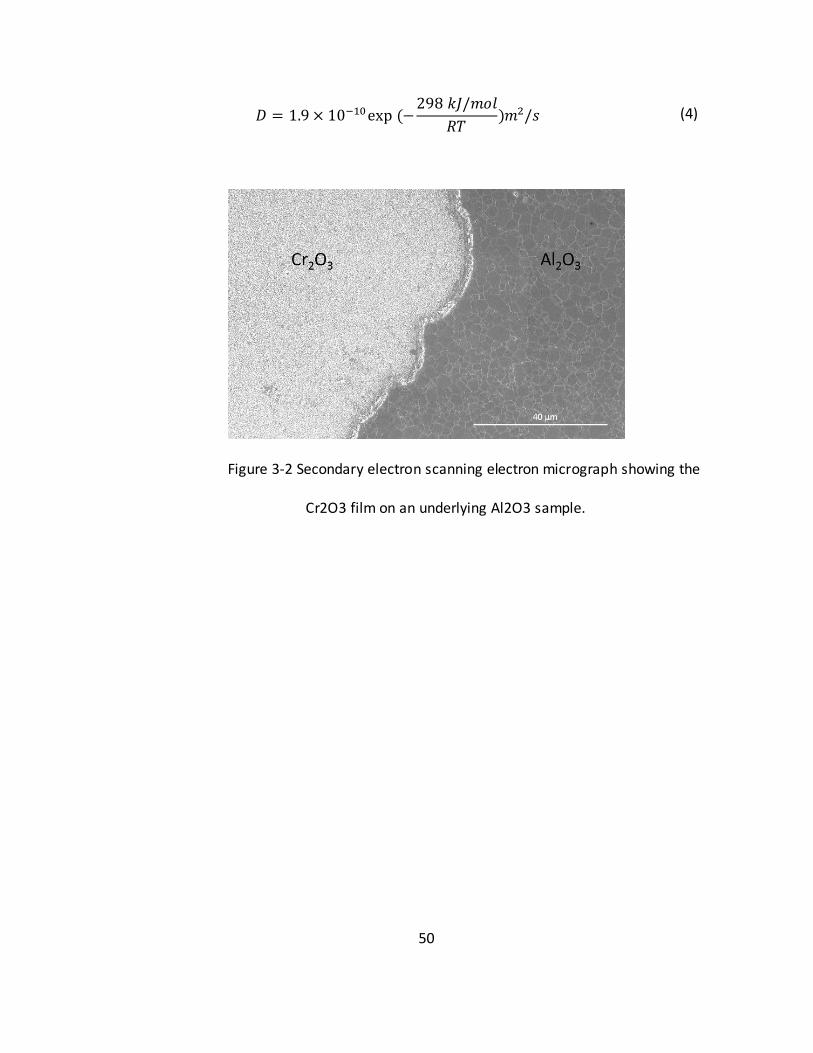
50
(4)
Figure 3-2 Secondary electron scanning electron micrograph showing the
Cr2O3 film on an underlying Al2O3 sample.
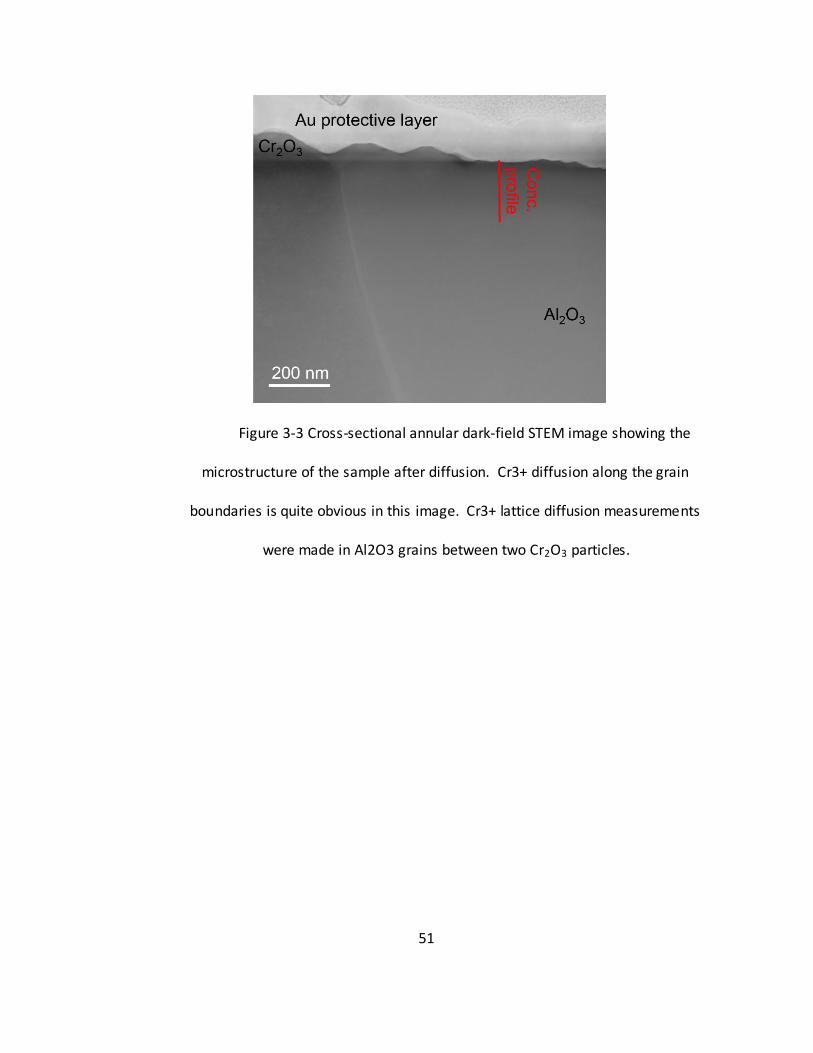
51
Figure 3-3 Cross-sectional annular dark-field STEM image showing the
microstructure of the sample after diffusion. Cr3+ diffusion along the grain
boundaries is quite obvious in this image. Cr3+ lattice diffusion measurements
were made in Al2O3 grains between two Cr2O3 particles.
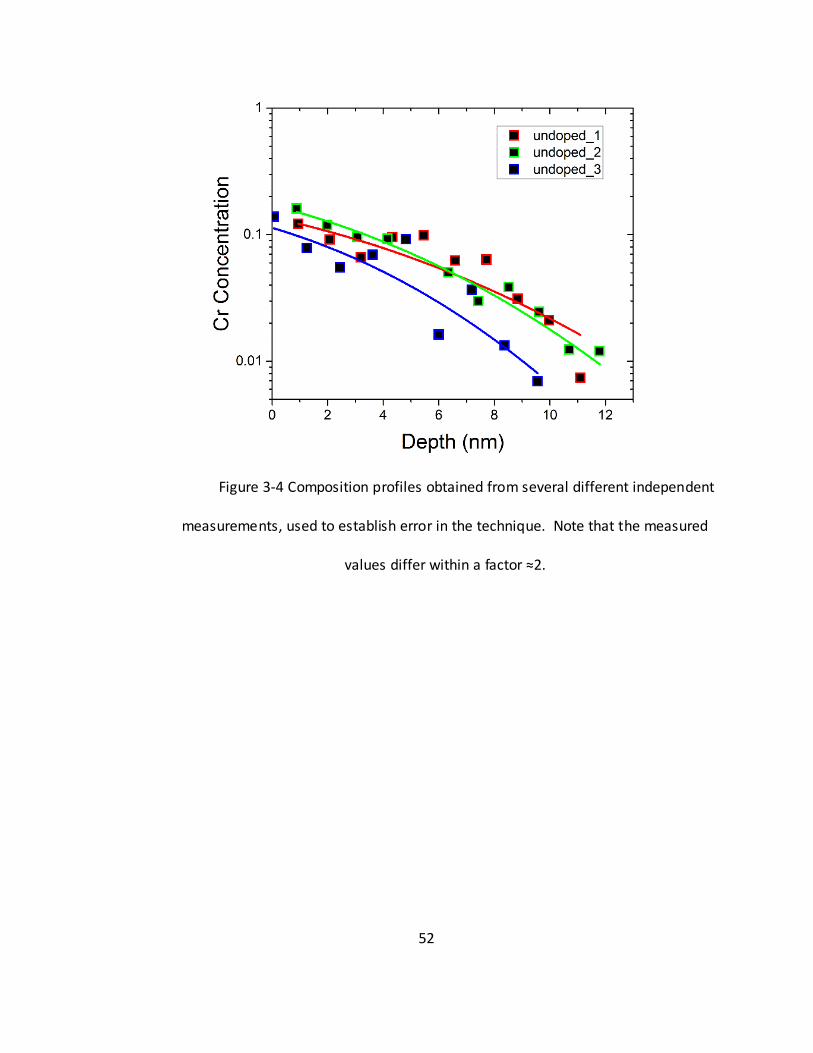
52
Figure 3-4 Composition profiles obtained from several different independent
measurements, used to establish error in the technique. Note that the measured
values differ within a factor ≈2.
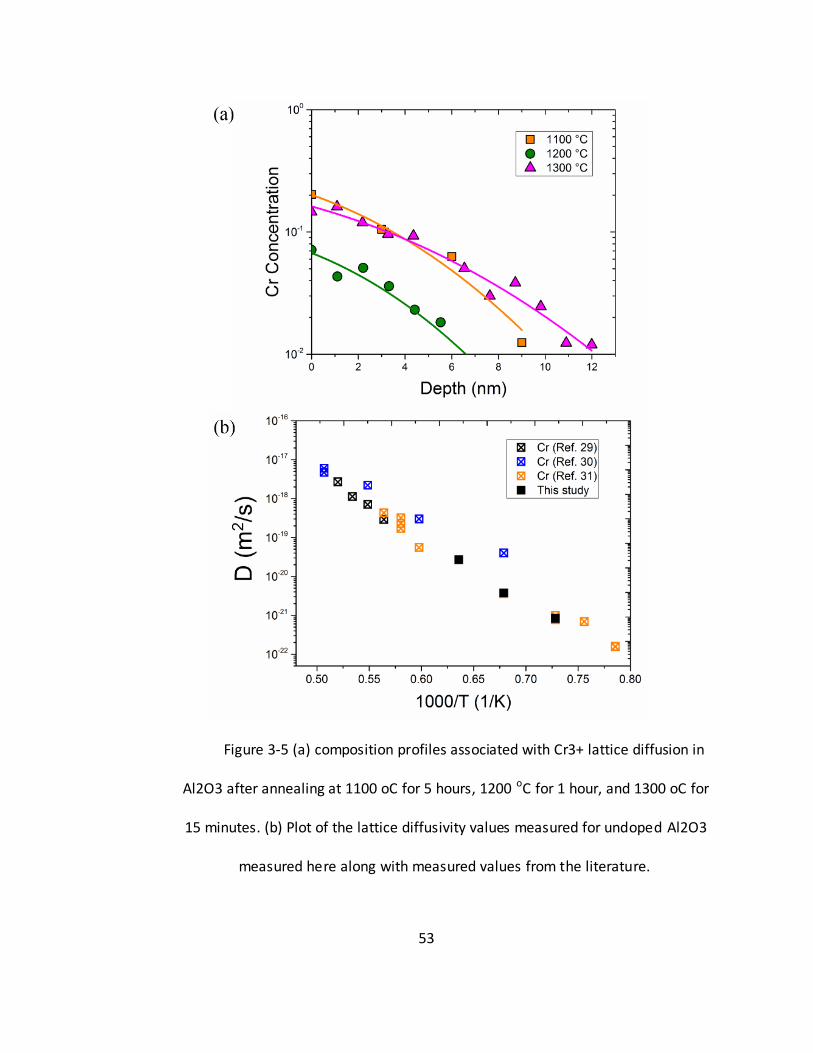
53
Figure 3-5 (a) composition profiles associated with Cr3+ lattice diffusion in
Al2O3 after annealing at 1100 oC for 5 hours, 1200 oC for 1 hour, and 1300 oC for
15 minutes. (b) Plot of the lattice diffusivity values measured for undoped Al2O3
measured here along with measured values from the literature.
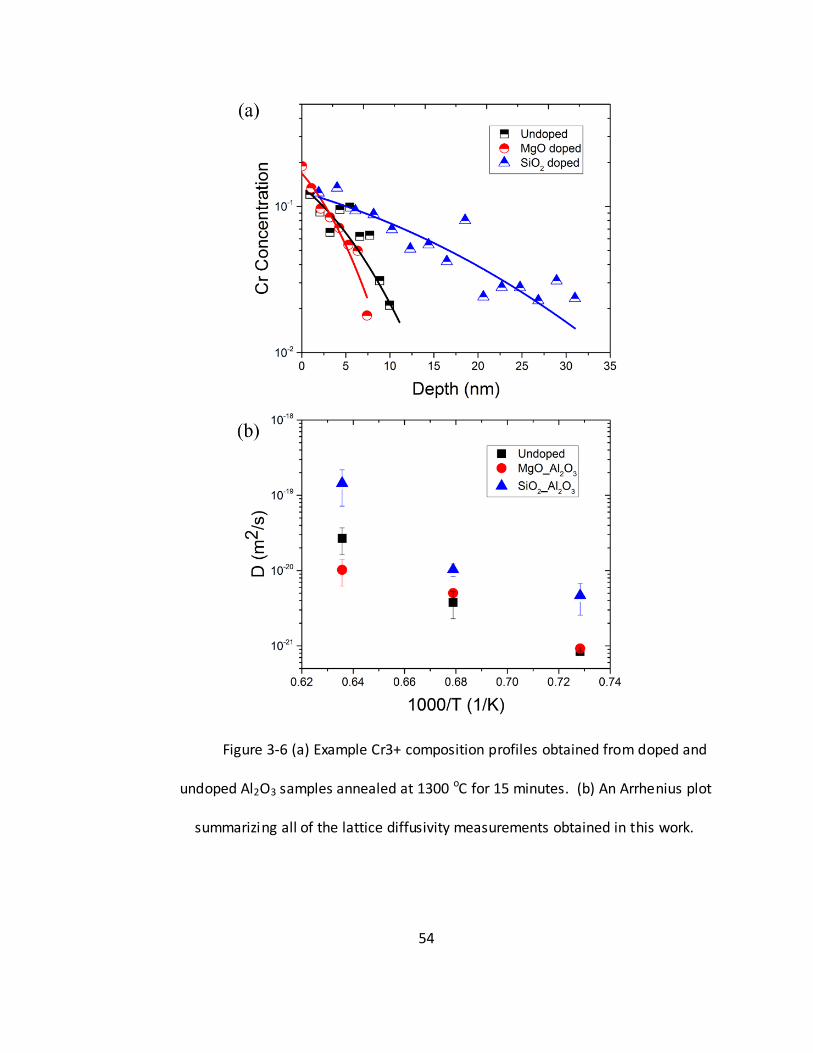
54
Figure 3-6 (a) Example Cr3+ composition profiles obtained from doped and
undoped Al2O3 samples annealed at 1300 oC for 15 minutes. (b) An Arrhenius plot
summarizing all of the lattice diffusivity measurements obtained in this work.
55
3.4 Discussion
The cation lattice diffusivities in these three different samples are surprisingly similar. In
fact, when comparing these values with reported measurements in the l iterature, in Figure 7,
the measurements are remarkably consistent, both for Cr3+ chemical tracer measurements[25-
28] and Al isotope measurements[21-24]. However, there are a few data that are outliers on
the plot in Figure 7 that appear red data points.[22, 28] The data from Le Gall et al. has been
the subject of controversy for some time.[22] The measured portions of their composition
profiles had two slopes, they fit the first 500-1000 nm of the profile and suggested that the
subsequent lower sloped portion of the curve was associated with dislocations. However, the
authors question the feasibility of sequential planar mechanical polishing with 50 nm resolution,
especially considering the initial surface roughness due to solution deposition of the tracer that
was likely on the order of 100’s of nm. If one assumes that the lower slope portion of the
composition profile is more closely associated with lattice diffusivity, then the measured values
appear to be closer to those reported by Paladino and Kingery[24] and Fielitz et al[21, 23].
However, if dislocations are in fact present at high concentrations, as reported in those samples,
then the data may not be interpretable in any case. The other data in Figure 7 that appears
inconsistent with our data is that of Cr3+ diffusion measured in Al2O3 based films on FeCrAl
alloys.[28] Diffusion measurements performed on Al2O3 scales typically differ from tracer
measurements performed on bulk ceramics. It has recently been shown that grain boundary
diffusivity in Al2O3 is sensitive to oxygen partial pressure and it has been proposed that
diffusion in scales is significantly affected by the presence of the metallic interface, which fixes
56
the oxygen activity to the metallic value at the interface.[31, 32] This lower oxygen partial
pressure is anticipated to enhance O vacancies and suppress Al vacancies near the interface.
While it is not obvious that this grain boundary effect must extend to the lattice, the idea is
consistent with the fact that the measured Cr3+ diffusivities in these scales[28] are lower than
what are measured in bulk tracer experiments[25-27].
Al2O3 is anticipated to be a highly extrinsic oxide due to the large intrinsic defect
formation energies (≈5.54/7.22 eV for anion/cation Frankel defects, and ≈5.15 eV for Schottky
defects).[1] However, our results indicate that cation lattice diffusivity in Al2O3 is relatively
insensitive to dopants and comparison with the literature (see Figure 7)[21-28] suggests that it
is also likely insensitive to impurity content and type. Comparison of our data to the literature
also indicates that Cr3+ chemical diffusion in the compositional regime measured here is
consistent with Cr3+ tracer diffusion in the dilute regime. Thus, we will assume that the
diffusion mediating point defects are approximately the same in both regimes. Simple defect
chemistry arguments would predict that lattice diffusivity in the SiO2-doped sample would be
more than an order of magnitude larger than in the undoped sample and more than 2 orders
larger than in the MgO-doped sample. This would be true even if one assumed that all of the
background impurities present in our samples could effectively charge compensate the dopants,
which is unlikely based on the ICP results. Instead, the values all differ by less than one order. A
similar issue has been described for anion diffusion in Al2O3, where the addition of MgO or TiO2
change the diffusivity by 1 to 2 orders of magnitude, with MgO producing the larger effect.[33]
The dopant effects on anion diffusivity are still smaller than anticipated from simple defect
57
chemistry arguments where 4+ dopants primarily produce Al3+ vacancies and 2+ dopants
primarily produce O2- vacancies. It has been hypothesized that the smaller than anticipated
effect of the dopant could result from the compensation effect, where background impurities
neutralize a significant fraction of the dopant; for example hypovalent impurities could bind
hypervalent impurities. Calculations[8] suggest that such effects can explain the trend, but the
effect is still quite sensitive to impurity type and concentration. Others have suggested that
larger defect complexes like AlO- vacancies are responsible for diffusion and must be
considered in detail to account for the dopant effects.[34, 35] It is difficult to find any of the
existing hypotheses completely sufficient to account for the small differences in lattice
diffusivity measured here.
One must conclude that the addition of SiO2 and MgO to Al2O3 has a negligible effect on
the concentration of cation lattice diffusion mediating point defects or point defect clusters. To
explain this result, we consider the additional complication of vacancy-solute defect binding.
Atkinson et al.[1] reported calculated solution and defect binding energies in Al2O3, and their
values will be used here to provide additional insights into our experimental results. While they
did not calculate the values for Si4+, values were provided for Rh4+, Ti4+, Ru4+, Mo4+, Sn4+, and
Pu4+. We will consider the values for Ti4+ as a reasonable approximation of Si4+. When doped
with such tetravalent cations the lowest energy defect in Al2O3 is:
(5)
The 4 extrinsic defects can bind via the reaction:
(6)
58
where the binding energy for the
defect cluster is 4.78 eV,[1] which is quite
significant relative to the intrinsic defect formation energy. The practical consequence of the
Al3+ vacancy being coordinated by 3 Si4+ cations is that any vacancy jumps that exchange with
an Al3+ cation debinds the defect, and thus these extrinsic defects can only mediate diffusion if
they debind. Considering the large binding energy of this defect, we hypothesize that it is
immobile and ineffective in mediating diffusion. In Ti4+-H+ co-doped Al2O3 a number of defect
cluster species were identified via optical spectroscopy.[36] Other optical spectroscopy results
also conclude that Al3+ vacancies and Ti4+ are spatially correlated.[37] Given the large binding
energies associated with
type defect clusters,[1] indications from optical
spectroscopy that related clusters are present in high concentrations ,[36, 37] and their limited
ability to migrate, we hypothesize that their formation causes the dopant to have limited
contribution to the extrinsic diffusivity in Al2O3 materials measured to date.
Similarly, divalent additions should favor the formation of O2- vacancies via the reaction:
(7)
with a defect binding reaction:
(8)
where the binding energy for the
is 2.71 eV.[1] While extrinsic O2- vacancy
motion should not affect cation diffusion directly, their concentration will influence the
concentration of isolated Al3+
vacancies through the equilibrium reaction:
(9)
59
However, the O2- vacancies in bound defect clusters will not have any influence on the
Al3+ vacancy concentration. Since most of the extrinsic O2- vacancies are bound in clusters,
there will be limited effect on the Al3+ vacancy concentration. The 3 defects in this cluster are
on both anion and cation sites, which allows the vacancies to readily exchange with adjacent
anions. In theory, the clusters could be somewhat mobile, if a cation vacancy is present to
facilitate Mg2+ diffusion. While the authors are unaware of direct evidence for defect clustering
in this system, results from paramagnetic resonance absorption spectrum measurements
performed on NiO-doped Al2O3 do indicate that localized charge compensation (i.e. defect
clustering) must be considered to explain the measured spectra.[38]
Figure 8 plots hypothetical calculated concentrations of defect clusters and isolated
defects associated with extrinsic doping along with the background impurity concentration for
hypothetical dopant concentrations of 100 ppm and impurity concentrations of 10 ppm. It is
noted that the calculated intrinsic concentrations of Al3+ and O2- vacancies remain many orders
of magnitude lower than the extrinsic concentration of isolated defects calculated. The
concentration of isolated extrinsic O2- vacancies associated with divalent doping is more than
an order of magnitude higher than the isolated Al3+ vacancies associated with tetravalent
doping. This, along with the potential mobility of the
cluster, may explain
why anion diffusivity is more sensitive to aliovalent dopants than cation diffusivity. The
calculated concentrations of isolated extrinsic defects resulting from aliovalent doping are low
relative to typical background impurity levels. These background impurities can also form
clusters with the dopants and vacancies. The problem is not possible to analyze at this time,
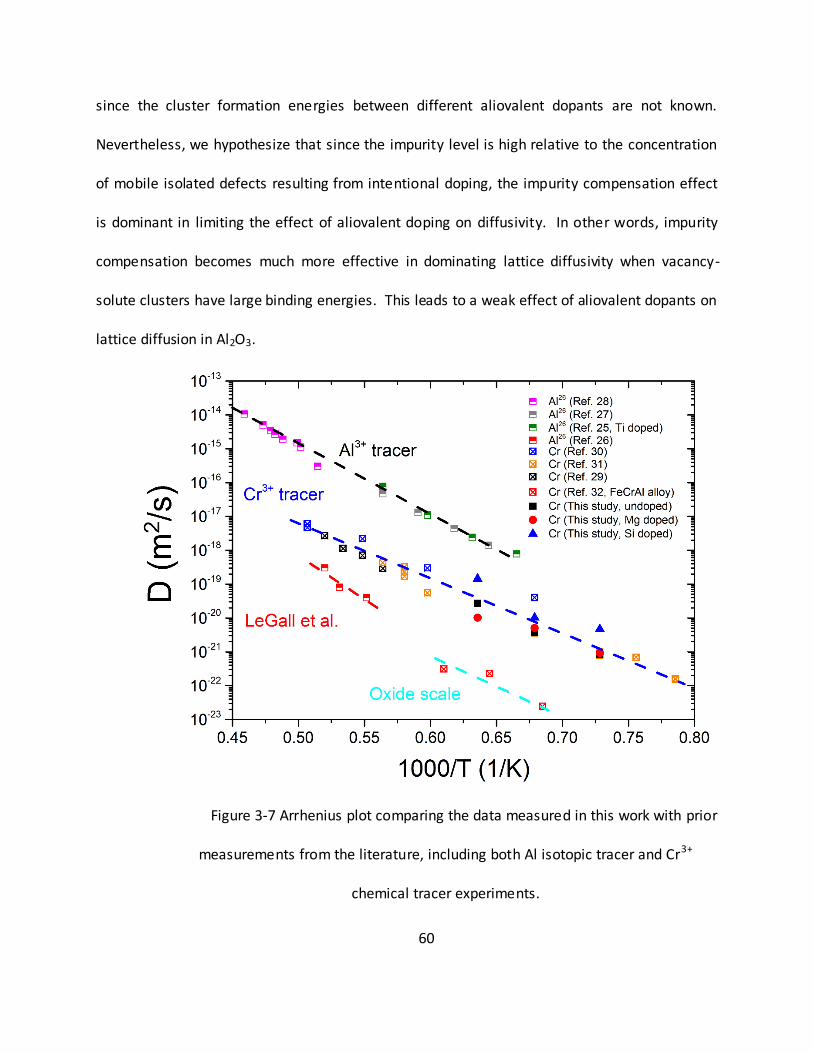
60
since the cluster formation energies between different aliovalent dopants are not known.
Nevertheless, we hypothesize that since the impurity level is high relative to the concentration
of mobile isolated defects resulting from intentional doping, the impurity compensation effect
is dominant in limiting the effect of aliovalent doping on diffusivity. In other words, impurity
compensation becomes much more effective in dominating lattice diffusivity when vacancy-
solute clusters have large binding energies. This leads to a weak effect of aliovalent dopants on
lattice diffusion in Al2O3.
Figure 3-7 Arrhenius plot comparing the data measured in this work with prior
measurements from the literature, including both Al isotopic tracer and Cr3+
chemical tracer experiments.
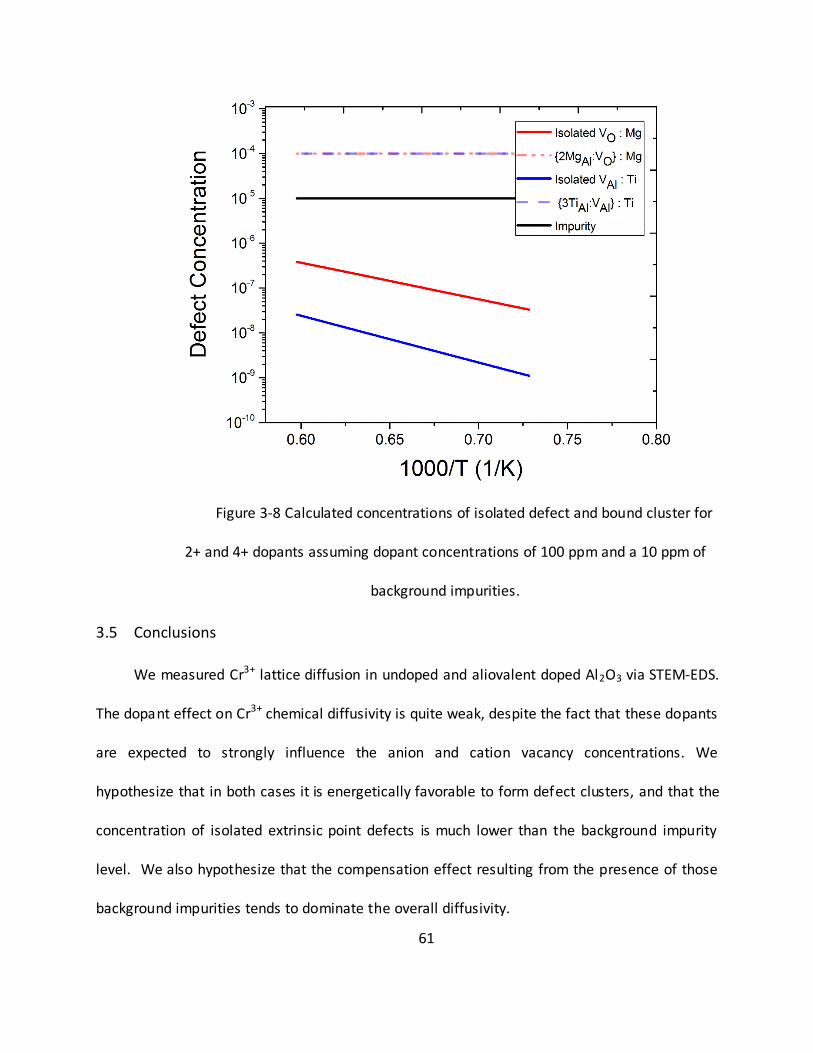
61
Figure 3-8 Calculated concentrations of isolated defect and bound cluster for
2+ and 4+ dopants assuming dopant concentrations of 100 ppm and a 10 ppm of
background impurities.
3.5 Conclusions
We measured Cr3+ lattice diffusion in undoped and aliovalent doped Al2O3 via STEM-EDS.
The dopant effect on Cr3+ chemical diffusivity is quite weak, despite the fact that these dopants
are expected to strongly influence the anion and cation vacancy concentrations. We
hypothesize that in both cases it is energetically favorable to form defect clusters, and that the
concentration of isolated extrinsic point defects is much lower than the background impurity
level. We also hypothesize that the compensation effect resulting from the presence of those
background impurities tends to dominate the overall diffusivity.
62
3.6 References
[1] K.J.W. Atkinson, R.W. Grimes, M.R. Levy, Z.L. Coull, T. English, Accommodation of impurities
in α-Al2O3, α-Cr2O3 and α-Fe2O3, Journal of the European Ceramic Society 23(16) (2003) 3059-
3070.
[2] C.R.A. Catlow, R. James, W.C. Mackrodt, R.F. Stewart, Defect energetics in
$\ensuremath{\alpha}$-${\mathrm{Al}}_{2}$${\mathrm{O}}_{3}$ and rutile
Ti${\mathrm{O}}_{2}$, Physical Review B 25(2) (1982) 1006-1026.
[3] P.W.M. Jacobs, E.A. Kotomin, Defect energies for pure corundum and for corundum doped
with transition metal ions, Philosophical Magazine A 68(4) (1993) 695-709.
[4] R.W. Grimes, Solution of MgO, CaO, and TiO2 in α-AI2O3, Journal of the American Ceramic
Society 77(2) (1994) 378-384.
[5] J. Sun, T. Stirner, A. Matthews, Calculation of native defect energies in α-A12O3 and α-
Cr2O3 using a modified Matsui potential, Surface and Coatings Technology 201(7) (2006) 4201-
4204.
[6] M.F. Fan, R.M. Cannon, H.K. Bowen, Grain boundary migration in ceramics, Ceramic
microstructure: with emphasis on energy related applications (1976) 276-307.
[7] A.H. Heuer, Oxygen and aluminum diffusion in α-Al2O3: How much do we really
understand?, Journal of the European Ceramic Society 28(7) (2008) 1495-1507.
[8] A.H. Heuer, K.P.D. Lagerlof, Oxygen self-diffusion in corundum (alpha-Al2O3): A conundrum,
Philosophical Magazine Letters 79(8) (1999) 619-627.
63
[9] K.P.R. Reddy, A.R. Cooper, Oxygen Diffusion in Sapphire, Journal of the American Ceramic
Society 65(12) (1982) 634-638.
[10] K.P.D. Lagerlöf, R.W. Grimes, The defect chemistry of sapphire (α-Al2O3), Acta Materialia
46(16) (1998) 5689-5700.
[11] J.D. Cawley, J.W. Halloran, Dopant Distribution in Nominally Yttrium-Doped Sapphire,
Journal of the American Ceramic Society 69(8) (1986) C-195-C-196.
[12] J.D. Cawley, J.W. Halloran, A.R. Cooper, Oxygen Tracer Diffusion in Single-Crystal Alumina,
Journal of the American Ceramic Society 74(9) (1991) 2086-2092.
[13] H. Haneda, C. Monty, Oxygen Self-Diffusion in Magnesium- or Titanium-Doped Alumina
Single Crystals, Journal of the American Ceramic Society 72(7) (1989) 1153-1157.
[14] M. LeGall, A.M. Huntz, B. Lesage, C. Monty, Self-diffusion in α[sbnd]Al2O3. III. Oxygen
diffusion in single crystals doped with Y2O3, Philosophical Magazine A 73(4) (1996) 919-934.
[15] T. Nakagawa, A. Nakamura, I. Sakaguchi, N. Shibata, K.P.D. Lagerlöf, T. Yamamoto, H.
Haneda, Y. Ikuhara, Oxygen pipe diffusion in sapphire basal dislocation, Nippon Seramikkusu
Kyokai Gakujutsu Ronbunshi/Journal of the Ceramic Society of Japan 114(1335) (2006) 1013-
1017.
[16] Y. Oishi, K. Ando, Y. Kubota, Self‐diffusion of oxygen in single crystal alumina, The Journal
of Chemical Physics 73(3) (1980) 1410-1412.
[17] Y. Oishi, K. Ando, N. Suga, W.D. Kingery, Effect of Surface Condition on Oxygen Self-
Diffusion Coefficients for Single-Crystal Al2O3, Journal of the American Ceramic Society 66(8)
(1983) C-130-C-131.
64
[18] Y. Oishi, W.D. Kingery, Self‐Diffusion of Oxygen in Single Crystal and Polycrystalline
Aluminum Oxide, The Journal of Chemical Physics 33(2) (1960) 480-486.
[19] D. Prot, C. Monty, Self-diffusion in α-Al2O3. II. Oxygen diffusion in ‘undoped’ single crystals,
Philosophical Magazine A 73(4) (1996) 899-917.
[20] D.J. Reed, B.J. Wuensch, Ion-Probe Measurement of Oxygen Self-Diffusion in Single-Crystal
Al2O3, Journal of the American Ceramic Society 63(1-2) (1980) 88-92.
[21] P. Fielitz, G. Borchardt, S. Ganschow, R. Bertram, A. Markwitz, 26Al tracer diffusion in
titanium doped single crystalline α-Al2O3, Solid State Ionics 179(11–12) (2008) 373-379.
[22] M.L. Gall, B. Lesage, J. Bernardini, Self-diffusion in α-Al2O3 I. Aluminium diffusion in single
crystals, Philosophical Magazine A 70(5) (1994) 761-773.
[23] G.B. P. Fielitz, S. Ganschow, R. Bertram, 26Al tracer diffusion in nominally undoped single
crystalline α-Al2O3, Defect and Diffusion Forum 323-325 (2012) 75-79.
[24] A.E. Paladino, W.D. Kingery, Aluminum Ion Diffusion in Aluminum Oxide, The Journal of
Chemical Physics 37(5) (1962) 957-962.
[25] Y.-K. Ahn, J.-G. Seo, J.-W. Park, Diffusion of chromium in sapphire: The effects of electron
beam irradiation, Journal of Crystal Growth 326(1) (2011) 45-49.
[26] B. Lesage, A.M. Huntz, G. Petot-ervas, Transport phenomena in undoped and chromium or
yttrium doped-alumina, Radiation Effects 75(1-4) (1983) 283-299.
[27] E.G. Moya, F. Moya, A. Sami, D. Juvé, D. Tréheux, C. Grattepain, Diffusion of chromium in
alumina single crystals, Philosophical Magazine A 72(4) (1995) 861-870.
65
[28] K. Messaoudi, A.M. Huntz, B. Lesage, Diffusion and growth mechanism of Al2O3 scales on
ferritic Fe-Cr-Al alloys, Materials Science and Engineering: A 247(1–2) (1998) 248-262.
[29] S.K. Behera, Atomic Structural Features of Dopant Segregated Grain Boundary Complxions
in Alumina by EXAFS, Lehigh University, 2010.
[30] S.J. Dillon, M. Tang, W.C. Carter, M.P. Harmer, Complexion: A new concept for kinetic
engineering in materials science, Acta Materialia 55(18) (2007) 6208-6218.
[31] T. Matsudaira, M. Wada, T. Saitoh, S. Kitaoka, Oxygen permeability in cation-doped
polycrystalline alumina under oxygen potential gradients at high temperatures, Acta Materialia
59(14) (2011) 5440-5450.
[32] A.H. Heuer, D.B. Hovis, J.L. Smialek, B. Gleeson, Alumina Scale Formation: A New
Perspective, Journal of the American Ceramic Society 94 (2011) s146-s153.
[33] K.P.D. Lagerlof, T.E. Mitchell, A.H. Heuer, Lattice Diffusion Kinetics in Undoped and
Impurity-Doped Sapphire (α-Al2O3): A Dislocation Loop Annealing Study, Journal of the
American Ceramic Society 72(11) (1989) 2159-2171.
[34] R.H. Doremus, Diffusion in alumina, Journal of Applied Physics 100(10) (2006) 101301.
[35] R.H. Doremus, Oxidation of alloys containing aluminum and diffusion in Al2O3, Journal of
Applied Physics 95(6) (2004) 3217-3222.
[36] A.R. Moon, M.R. Phillips, Defect clustering in H,Ti:α-Al2O3, Journal of Physics and
Chemistry of Solids 52(9) (1991) 1087-1099.
66
[37] G. Molnár, M. Benabdesselam, J. Borossay, D. Lapraz, P. Iacconi, V.S. Kortov, A.I. Surdo,
Photoluminescence and thermoluminescence of titanium ions in sapphire crystals, Radiation
Measurements 33(5) (2001) 663-667.
[38] S. Marshall, T. Kikuchi, A. Reinberg, Paramagnetic Resonance Absorption of Divalent Nickel
in α-Al 2 O 3 Single Crystal, Physical Review 125(2) (1962) 453.
67
CHAPTER 4
Cr3+ GRAIN BOUNDARY DIFFUSIVITY IN ALIOVALENT DOPED
ALUMINAS
4.1 Introduction
In chapter 3, the lattice diffusivities of Cr3+ in aliovalent doped alumina, necessary for
calculating grain boundary diffusion in the type B regime, were measured. This chapter focuses
on studying the effects of dopant and complexion transition on Cr3+ grain boundary diffusion in
alumina. In literature, numerous investigations of grain boundary diffusion in alumina have
been performed over several decades, but due to the complexity of grain boundary diffusion in
oxides, many basic questions still exist.[1] Some of the key findings from prior investigations
that motivate the current work are highlighted below.
Grain boundary anion and cation diffusivity are comparable during oxidation
experiments. This has been demonstrated via double oxidation experiments with 16O and 18O
that can track the formation of new oxide at the oxide surface and the metal -oxide interface.[2]
It has also been shown that during continued oxidation of preexisting scales, the formation of
new oxide occurs both above and below that preexisting oxide.[3-6] The results have been
particularly difficult to rationalize, because tracer diffusivity measurements of 18O versus 26Al or
chemical tracers such as Cr3+ in bulk polycrystals indicate that cation diffusivity exceeds anion
diffusivity by several orders of magnitude.[7-9] It should be noted that comparing results is
68
difficult because anion diffusivity varies by several orders of magnitude, depending on dopant
type and processing conditions. Overlapping tracer data has been recently demonstrated by
comparing anion diffusivity measured from a number of different specific boundaries, which
vary by several orders of magnitude depending on their character, to average cation grain
boundary measurements.[10, 11] Since this work cites currently and unpublished methods, we
avoid commenting extensively on the results. However, average polycrystalline values for tracer
measurements of cation diffusivity still appear to exceed those of anion diffusivity. Despite this,
the results of oxidation studies are quite consistent; that the anion and cation grain boundary
diffusivities are comparable.[12] The relatively low cation diffusivity during oxidations is the
source of the slow scale growth during oxidation, as other refractory oxides with close packed
oxygen sub-lattices exhibit high cation diffusivities that enable rapid oxidation. This
inconsistency between tracer diffusion experiments and oxidation kinetics is a source of
ongoing confusion. This partially motivates the current effort to quantify the effects of
aliovalent dopants on cation grain boundary diffusivity, as the effect of impurities incorporated
into growing oxide scales is often a source of uncertainty.
Anion tracer diffusivity is sensitive to dopant type and concentration. Heuer et al. have
thoroughly reviewed the relevant literature in references.[1, 13] Key findings include the
observation that for nominally undoped samples, O2- (oxygen anion) diffusivity falls within a
range of 1 order of magnitude. This variation is small relative to the anticipated variation in
background impurity, which is expected to dominate the O2- vacancy concentration. The results
have been rationalized in the context of aliovalent charge compensating impurities that tend to
69
balance one another in the undoped samples. However, significant variations in both O 2- lattice
(3 orders of magnitude) and grain boundary (4 orders of magnitude) diffusivity are observed
when samples are doped with different aliovalent cations. O2- diffusivities from tracer
measurements are similar to those measured from oxidation. It was also noted that the
experimentally measured lattice diffusion activation energies are consistently too large, as
compared to calculated values for vacancy migration enthalpies.[14-18]
Cation tracer diffusivity has not been as thoroughly studied. Except for the results from Le
Gall et al.,[19] the limited measurements of Al3+ lattice diffusivity made on nominally undoped
samples are reasonably consistent.[20, 21] Cr3+ lattice diffusion is 1 order slower than 26Al.[22-
24] The relatively consistent results in undoped materials might be explained, similarly, by the
compensation effect.[13] Again, the Cr3+ chemical tracer diffusivities far exceed those measured
from oxidation studies. The impact of aliovalent doping on cation grain boundary diffusivity
have not been quantified in detail. Bedu-Amissah[25] suggested that Y2O3 doping suppressed
Cr3+ grain boundary diffusivity in the temperature range 1250 to 1600 oC, and cited a site
blocking mechanism as the source of the variation. Results by Ikuhara et a l.[26] indicated a
similar mechanism affecting cation transport during creep. Aliovalent dopant effects on grain
boundary diffusivity are particularly difficult to understand on the basis of defect chemistry,
because charge compensation is not necessary. The effect of aliovalent dopants on Al2O3 grain
boundary diffusivity has not received significant attention. This study aims to specifically
quantify aliovalent doping effects on cation grain boundary diffusion.
70
Recent permeability studies suggest that an intrinsic-like mechanism dominates transport
through Al2O3 membranes, with cation and anion kinetics dominating at high and low oxygen
partial pressure respectively.[27] The pressure exponents of the intrinsic mechanisms are
difficult to distinguish from those of the extrinsic processes with only 3 data points. However,
the results are intriguing, since diffusion in Al2O3 is almost universally accepted to be mediate
by extrinsic defects. The oxygen activity dependence provides a potential explanation for why
Al3+ diffusion in alumina scales is low, since the metal substrate constrains the oxygen activity at
the scale-metal interface to the value of the alloy. This suppresses Al3+ diffusivity locally, which
reduces the total value averaged across the film. Some have suggested that the phenomena is
the result of kinetics limited by interface dislocations or disconnections.[10] An alternative
hypothesis that electron transport dominates the kinetics has also been proposed.[8]
As an additional complication, Al2O3 grain boundaries exhibit a number of anomalous
discontinuous transitions in structure and properties when processed at high temperatures
(>1200 oC); such as abnormal grain growth, activated sintering, anomalous embrittlement, and
widely varied creep response.[28-33] These phenomena are sensitive to dopant chemistry and
several have been correlated with complexion, or ‘grain boundary phase’, transitions at grain
boundaries. These complexion transitions cause grain growth to vary by several orders of
magnitude at a single temperature.[34] This observation complicates interpretation of
diffusivity measurements made at relatively high temperatures versus oxidation rates
measured at relatively low temperatures (<1200 oC). Existing literature would suggest that the
occurrence of complexion transitions might be rare at low temperatures, although it has not
71
been explicitly investigated.[35] In addition to measuring diffusivity along grain boundaries in
different aliovalent doped Al2O3 samples, this work also characterizes diffusion along
boundaries in samples shown previously to exhibit, on average, different types of grain
boundary complexions[34].
This work characterizes Cr3+ cation diffusion along grain boundaries in undoped, MgO-
doped, and SiO2-doped Al2O3. The goal of the work is to understand the roles of both aliovalent
doping and grain boundary complexion type on cation grain boundary diffusion in Al 2O3.
4.2 Experimental Procedure
The same samples in chapter 3 are used here. Samples were pre-annealed at 1400 oC for
10 hours. Pre-annealing was used to coarsen the grains and relax any mechanical damage
introduced during polishing and promote coarsening such that grain boundary migration is
limited during subsequent annealing. One set of samples was pre-annealed at 1600 oC for 10
hours after polishing. This was done because prior work showed that at this temperature on
average the grain boundaries transition to a more disordered grain boundary complexion type
with higher grain boundary mobility.[35] The two different samples will be referred to as SiO2-
1400 and SiO2-1600.
400 nm thick Cr films were deposited onto the surface of pre-annealed samples by E-
beam evaporation. During annealing in air this converted to Cr2O3. The samples were annealed
in Al2O3 crucibles with Cr2O3 powder surrounding, but not in direct contact with, the samples.
Isothermal diffusion was performed for all samples at 1100 oC for 20 hours, 1200 oC for 10
hours, and 1300 oC for 5 hours.
72
Microstructures of pre-annealed samples were characterized by scanning electron
microscopy (SEM, 7000F, JEOL) and annular dark-field scanning transmission electron
microscopy (ADF-STEM, 2010F, JOEL). Energy dispersive x-ray spectroscopy (EDS) was also
performed in the STEM. Diffusion depth profiles were measured using dynamic secondary ion
mass spectrometry (Cameca, ims 5f, Physical Electronics). An O 2+ beam (accelerating voltage 12
kv, beam current ~200 nA) was used as both the primary sputtering beam and analysis beam. A
250✕250 µm crater was used to obtain composition profiles. The depth of analyzed region was
measured ex-situ via surface profilometery (Dektak3, Sloan).
4.3 Results
The microstructures of each sample prior to diffusion anneals are shown in figure 1. The
grains in each sample are relatively equiaxed and microstructures were consistent with those
observed in prior studies.[34] Figure 2 shows ADF-STEM images of each of the different doped
and undoped samples after diffusion annealing. Note that the grain boundaries are observed
as bright features due to the presence of the heavier Cr3+ cations. The micron scale diffusion
along grain boundaries in the images is consistent with the diffusion of Cr3+ measured from
SIMS (see raw data in figure 3). While each of the boundaries in the polycrystal is not aligned
with the electron beam, it is clear that the boundaries do not exhibit the wavy morphology that
would be characteristic of the microstructure if diffusion induced grain boundary migration
(DIGM) were active. Significant DIGM has only been observed in the Al2O3-Cr2O3 literature at
temperatures in excess of 1500 oC, consistent with the fact that we observe none here.[36]
73
In two prior studies, we measured the grain growth kinetics [35, 37] and lattice
diffusivity[38] in these samples; this information is useful for determining the model used to fit
the diffusion profile. While the amount of grain growth occurring during the diffusion anneal is
not measureable, it does not preclude the possibility of grain boundary motion. At 1100 oC, the
average lattice diffusion, , distance, , is an order of magnitude longer than the
average distance of grain boundary motion. Due to the differences in activation energies, by
1300 oC these two distances become compa rable in all of the samples except those pre-
annealed at 1600 oC, for which grain growth is negligible. Based on this data, the diffusion
behavior is consistent with Harrison’s type B regime. The grain boundary diffusivity, , of Cr3+
is obtained from fitting the tail part in the composition depth profile by using the Whipple-
LeClaire model;
(1)
where is segregation factor, is the effective width of grain boundary, typically assumed to
be 0.3 nm to 1 nm, is diffusion length, is measured concentration ratio, and is time.
The lattice diffusivity, measured in reference [38] is listed below;
(2)
(3)
(4)
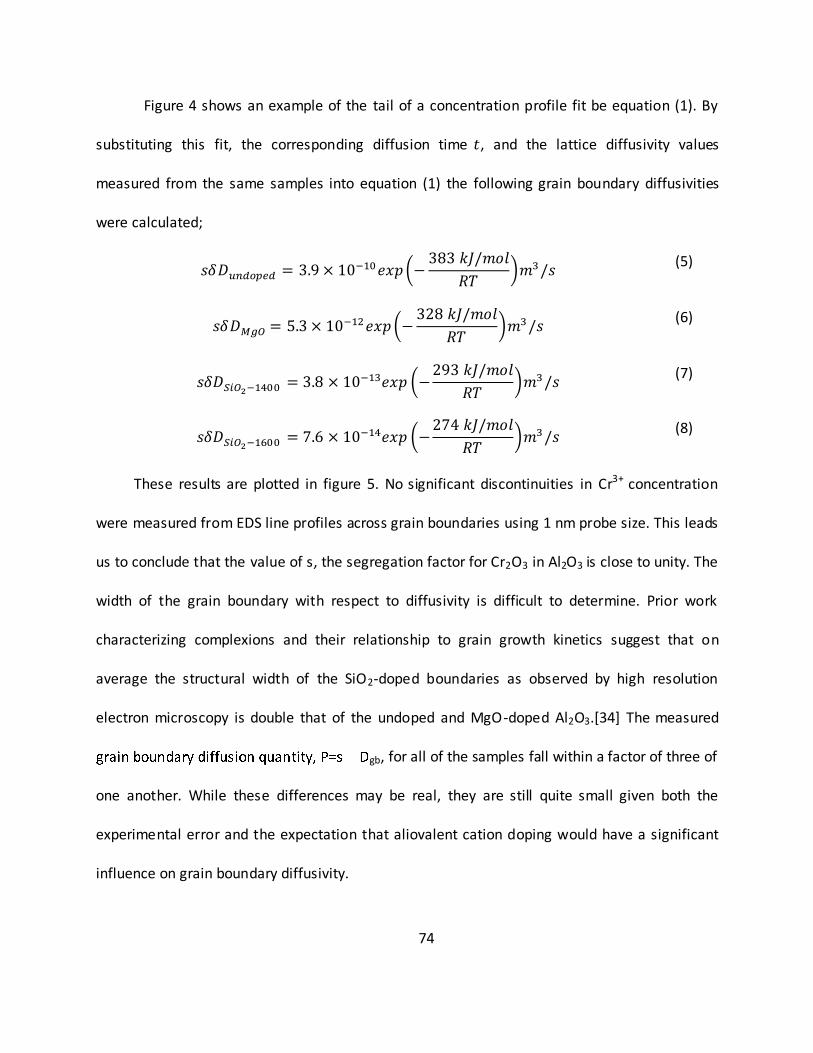
74
Figure 4 shows an example of the tail of a concentration profile fit be equation (1). By
substituting this fit, the corresponding diffusion time , and the lattice diffusivity values
measured from the same samples into equation (1) the following grain boundary diffusivities
were calculated;
(5)
(6)
(7)
(8)
These results are plotted in figure 5. No significant discontinuities in Cr3+ concentration
were measured from EDS line profiles across grain boundaries using 1 nm probe size. This leads
us to conclude that the value of s, the segregation factor for Cr2O3 in Al2O3 is close to unity. The
width of the grain boundary with respect to diffusivity is difficult to determine. Prior work
characterizing complexions and their relationship to grain growth kinetics suggest that on
average the structural width of the SiO2-doped boundaries as observed by high resolution
electron microscopy is double that of the undoped and MgO-doped Al2O3.[34] The measured
gb, for all of the samples fall within a factor of three of
one another. While these differences may be real, they are still quite small given both the
experimental error and the expectation that aliovalent cation doping would have a significant
influence on grain boundary diffusivity.
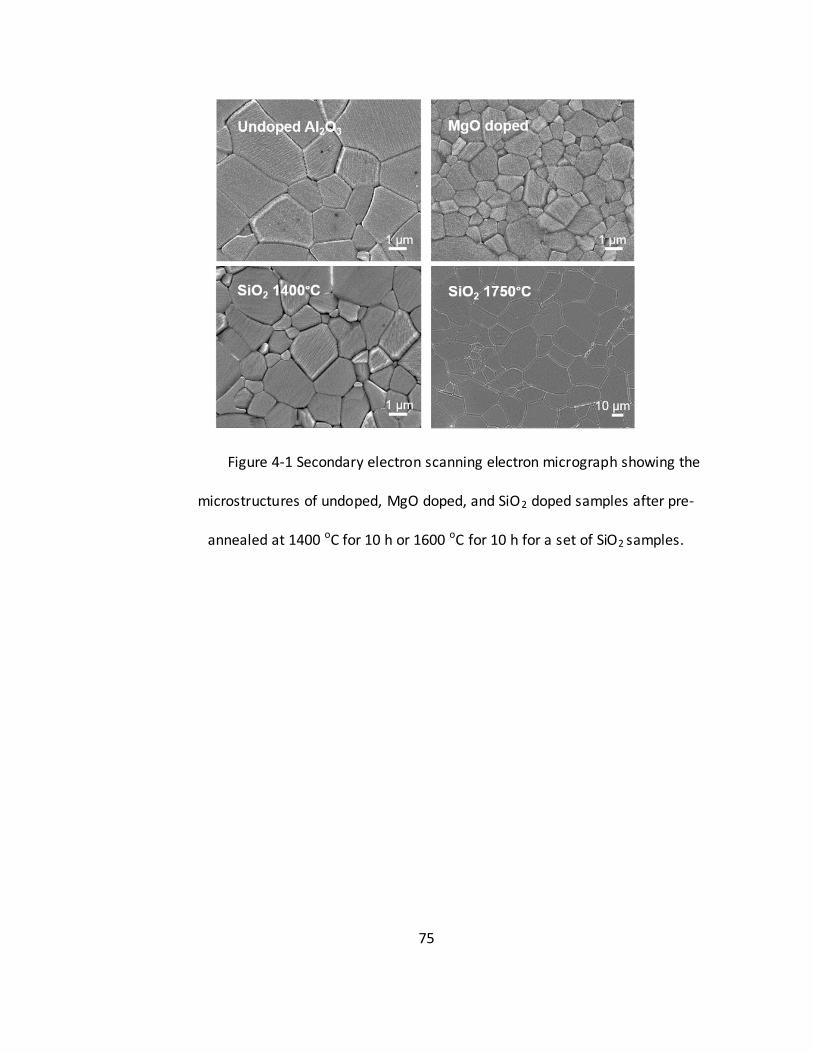
75
Figure 4-1 Secondary electron scanning electron micrograph showing the
microstructures of undoped, MgO doped, and SiO2 doped samples after pre-
annealed at 1400 oC for 10 h or 1600 oC for 10 h for a set of SiO2 samples.
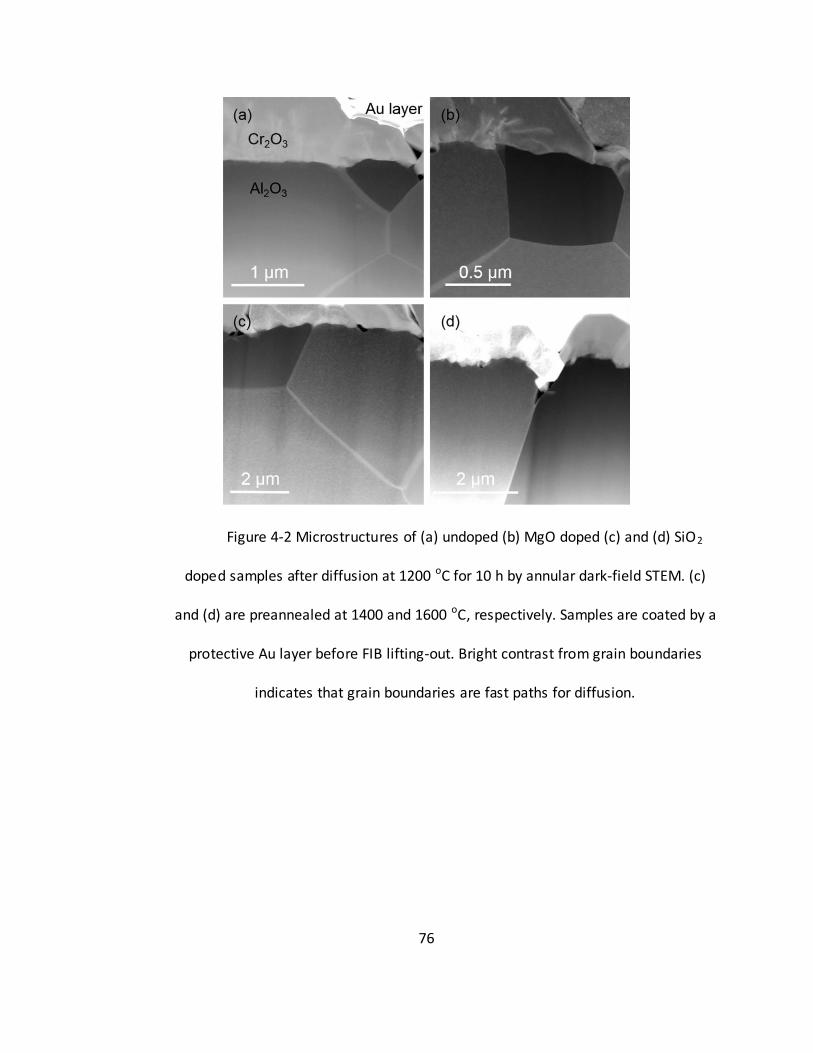
76
Figure 4-2 Microstructures of (a) undoped (b) MgO doped (c) and (d) SiO2
doped samples after diffusion at 1200 oC for 10 h by annular dark-field STEM. (c)
and (d) are preannealed at 1400 and 1600 oC, respectively. Samples are coated by a
protective Au layer before FIB lifting-out. Bright contrast from grain boundaries
indicates that grain boundaries are fast paths for diffusion.
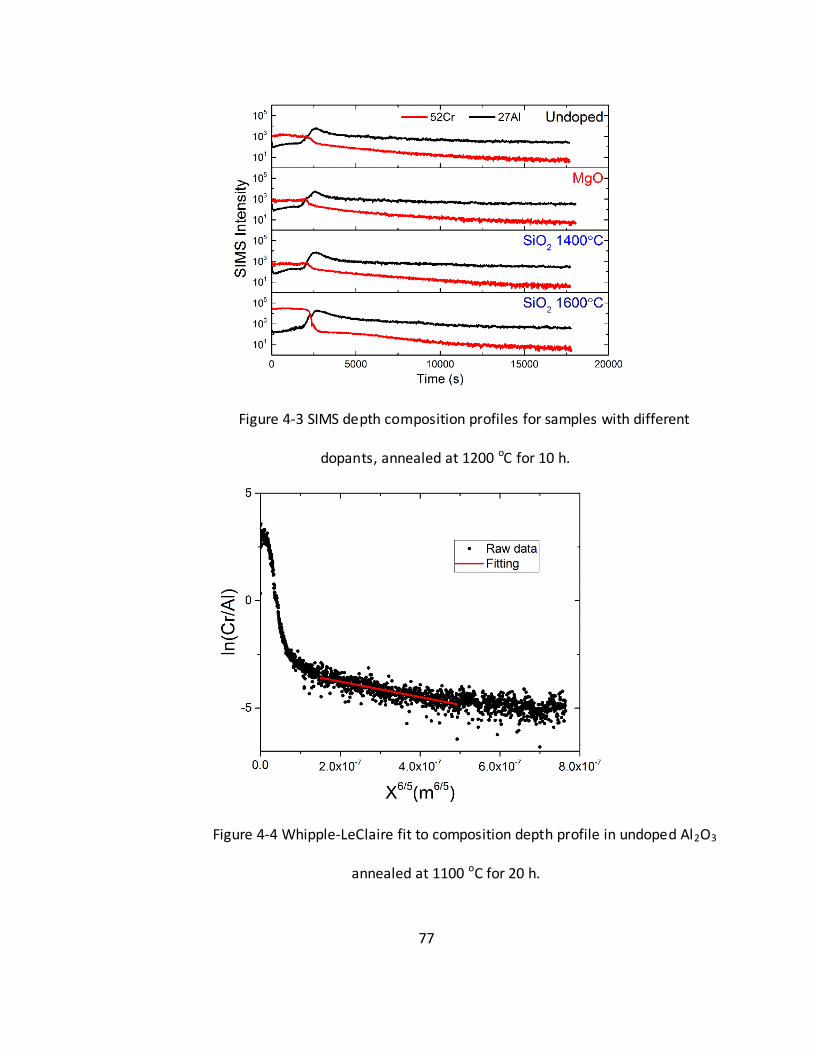
77
Figure 4-3 SIMS depth composition profiles for samples with different
dopants, annealed at 1200 oC for 10 h.
Figure 4-4 Whipple-LeClaire fit to composition depth profile in undoped Al2O3
annealed at 1100 oC for 20 h.
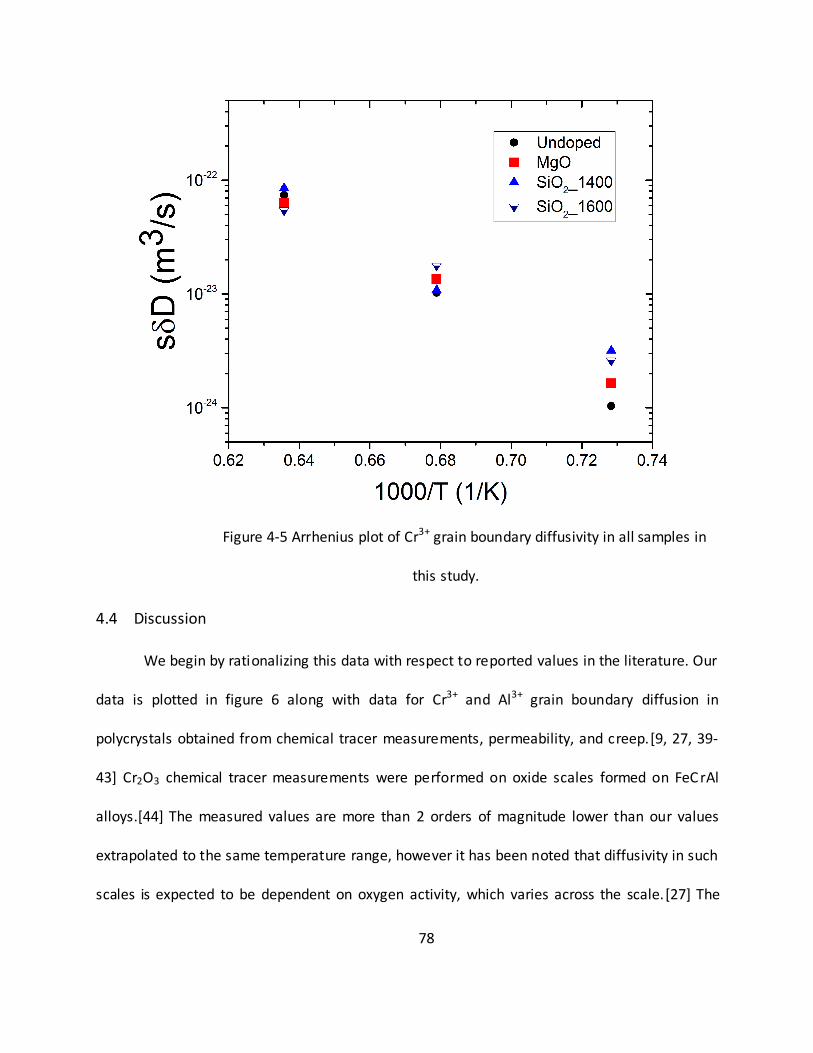
78
Figure 4-5 Arrhenius plot of Cr3+ grain boundary diffusivity in all samples in
this study.
4.4 Discussion
We begin by rationalizing this data with respect to reported values in the literature. Our
data is plotted in figure 6 along with data for Cr3+ and Al3+ grain boundary diffusion in
polycrystals obtained from chemical tracer measurements, permeability, and creep.[9, 27, 39-
43] Cr2O3 chemical tracer measurements were performed on oxide scales formed on FeC rAl
alloys.[44] The measured values are more than 2 orders of magnitude lower than our values
extrapolated to the same temperature range, however it has been noted that diffusivity in such
scales is expected to be dependent on oxygen activity, which varies across the scale.[27] The
79
anticipated result is that cation diffusivity in such scales is then lower than anion grain
boundary diffusivity measured via tracer experiments at ambient pressure. For this reason, this
data should not be directly compared to those measured at ambient oxygen partial pressure. In
one study, Cr2O3 chemical tracer measurements were also performed on undoped and Y2O3-
doped Al2O3.[9] The grain growth rates and lattice diffusivities reported in this work indicate
that the grain boundaries migration distance in the undoped Al2O3 exceeded the characteristic
width of the lattice diffusion profile. Therefore, we conclude that this data should not be fit to
the Harrison’s type B model and exclude it from figure 6. Reference[41] characterized Cr3+
chemical tracer diffusion and their measurements for undoped Al2O3 agree well with ours. They
also measured Y2O3-doped Al2O3 and noted slightly lower activation energies and diffusivity
values on the same order of magnitude as the undoped material in the temperature range
studied. Recently published Al26 tracer diffusion measurements in undoped and Y2O3 doped
Al2O3 find effectively no measureable effect of the dopant on grain boundary diffusivity, which
is also consistent with our results.[45] Cr2O3 chemical tracer diffusion along Al2O3 bicrystals has
also been studied, but we note that the values differ dramatically between boundaries of
different type and even along different crystallographic directions on the same boundary.[43]
For this reason, we do not compare them with average polycrystalline values, which average
over many boundaries of differing diffusivity. Cannon et al. measured values from creep in the
diffusion limited regime, which they attributed to Al3+ diffusion.[39] Their results for undoped
and MgO-doped Al2O3 were approximately the same within error. Those values are only slightly
lower than our Cr2O3 chemical tracer values and are reasonably consistent with values
80
measured from permeability studies[27, 40, 42] when extrapolated to higher temperatures. Al3+
tracer self-diffusion measured along grain boundaries in undoped Al2O3 are reasonably
consistent with these indirect measurements.[10] Overall, these results lead us to conclude that
existing measurements for Cr3+ chemical tracer diffusion along undoped Al2O3 are quite
consistent and correspond well with Al3+ grain boundary self-diffusion. The fact that these data
are quite reproducible is rather remarkable given that the samples were prepared from
powders of different purity, in different labs, and tested using different methods. The only
dopants or impurities observed to have any significant effect on diffusivity are certain rare-
earth dopants or co-dopants when measured via permeability experiments.[42]
Interpreting dopant effects on grain boundary diffusional transport has always been
challenging as grain boundaries form space charge layers and do not necessarily maintain
charge neutrality. Without performing detail atomistic calculations on a large population of
grain boundaries of distinct crystallographic character, it is difficult to make any definitive
conclusions. However, we can derive some meaning from what is known from both this work
and prior studies. (a) Our findings indicate that cation grain boundary diffusivity in Al2O3 is
insensitive to aliovalent MgO and SiO2 dopants. (b) Our prior experiments indicate that cation
lattice diffusivity in Al2O3 is also insensitive to aliovalent MgO and SiO2 dopants.[38] (c) Cr3+
grain boundary diffusion is not sensitive on average to complexion transitions. (d) Cation grain
boundary diffusivity in Al2O3 is more sensitive to strongly segregating rare-earth oxides and
most sensitive to co-doped rare-earth oxides.[42] (e) Cation and anion grain boundary
diffusivities are sensitive to oxygen partial pressure in a manner consistent with intrinsic
81
behavior.[27] (f) Measurements of cation diffusion along grain boundaries in undoped Al2O3 is
quite consistent and reproducible, despite the certainty that these materials contain different
amounts and types of chemical impurities, an different complexions. (g) Based on prior reports
in the literature[46-49], it is well known that dopants such as SiO2 and MgO segregate to grain
boundaries.
The weak aliovalent and impurity effect on cation grain boundary diffusivity suggests
that the dopants are not significantly affecting the concentration of cation transport mediating
defects. There are several possible explanations for this effect. (1) dopant induced charge
compensating defects are not formed at the grain boundary and thus the dopants do not
significantly influence boundary cation diffusivity. (2) The high binding energies between solute
and the compensating defects, such as calculated in the lattice,[38] also extend to grain
boundaries and those defect clusters are relatively immobile. (3) The concentration of intrinsic
diffusion mediating defects at the boundary is larger than that of extrinsic cation diffusion
mediating defects. The diffusion mediating defects could be a variety of species including; Al3+
vacancies, Al3+ interstitials, AlO- defect clusters,[50] grain boundary dislocations or
disconnections, cooperative defect motion, or some yet to be determined mechanisms. A
disconnection based mechanism for diffusion has been invoked to explain the apparent
‘intrinsic-like’ behavior of grain boundary diffusivity in Al2O3 as a function of oxygen partial
pressure.[10] The work suggests that diffusion is mediated by the motion of such defects. It is
difficult to substantiate or refute any of these mechanisms outright. We might expect that if
diffusion is mediated by disconnection motion at the boundaries, then it should be possible to
82
observe a heterogeneous distribution of Cr3+ along the boundaries on which it is diffusing.
Although we did not observe this, we note that such observations would likely need to be made
for much shorter diffusion times than used in this study, focusing on near low-
where the dislocations are well spaced, and possibly using atomic-resolution microscopy. It
should also be possible to test this hypothesis in the future by characterizing high temperature
oxidation in-situ in the TEM and characterizing interface dislocation or disconnection motion, as
has been done for grain growth in alloys.[51]
Based on our prior work,[34] grain boundaries in MgO-doped Al2O3 equilibrated in this
temperature range will be dominated by sub-monolayer type adsorption while the SiO2-doped
grain boundaries should be dominated by bi-layer type adsorption. We preannealed one SiO2
sample at 1600 oC to promote more disordered complexions, although we did not determine
whether or not those were in fact metastable under the conditions for diffusion annealing.
Nevertheless, it is clear that the differences in complexion type do not have an appreciable
effect on the average cation grain boundary diffusivity. For anion diffusivity, MgO doping
enhances grain boundary transport, as indicated by sintering kinetics, and this effect has
traditionally been attributed to excess O2- vacancies induced by doping.[52] Enhanced anion
transport and relatively unaffected cation diffusion in MgO-doped Al2O3 are at odds with
suppressed grain boundary mobility in this system. The reduced grain boundary mobility is
typically attributed to solute drag, but those drag effects do not inhibit boundaries containing
multilayer adsorbates. While it is not necessary that there is any correlation between diffusion
and grain boundary mobility, since the mechanisms can differ dramatically, one might expect
83
some correlation since all three processes, anion diffusion, cation diffusion, and grain growth,
are thermally activated in the grain boundary. For an interface dislocation or disconnection
mechanism, one would expect that a significant difference in boundary adsorption, and
therefore structure, might have a strong effect on diffusion. However, this is not observed. The
formation of immobile defect clusters could explain the diffusion results, especially since the
binding energy for a
defect cluster (2.7 eV in the lattice) is anticipated to be
significantly lower than a
defect cluster (≈4.8 eV in the lattice).[18] However,
this hypothesis does not provide any insights into why grain growth would be significantly
enhanced by multilayer adsorption.
Our results, and the literature values,[9, 27, 39-41, 43] for cation grain boundary
chemical tracer diffusivity exceed those reported for anion grain boundary tracer diffusivity by
about 2 orders of magnitude, at intermediate temperatures, even when comparing the smallest
cation values to the largest anion values. The weak impurity effect on cation diffusivity
suggests that the discrepancy between chemical tracer results and oxidation results cannot
likely be attributed to impurity effects. This is consistent with the notion that the oxyg en
activity gradient in alumina scales alters the relative anion versus cation diffusion rates
resulting in comparable values. One could hypothesize that the differences in grain boundary
character distributions in bulk polycrystals and Al2O3 scales could account for discrepancies
between measurements made on scales and polycrystals. We can not discount that possibility
here.
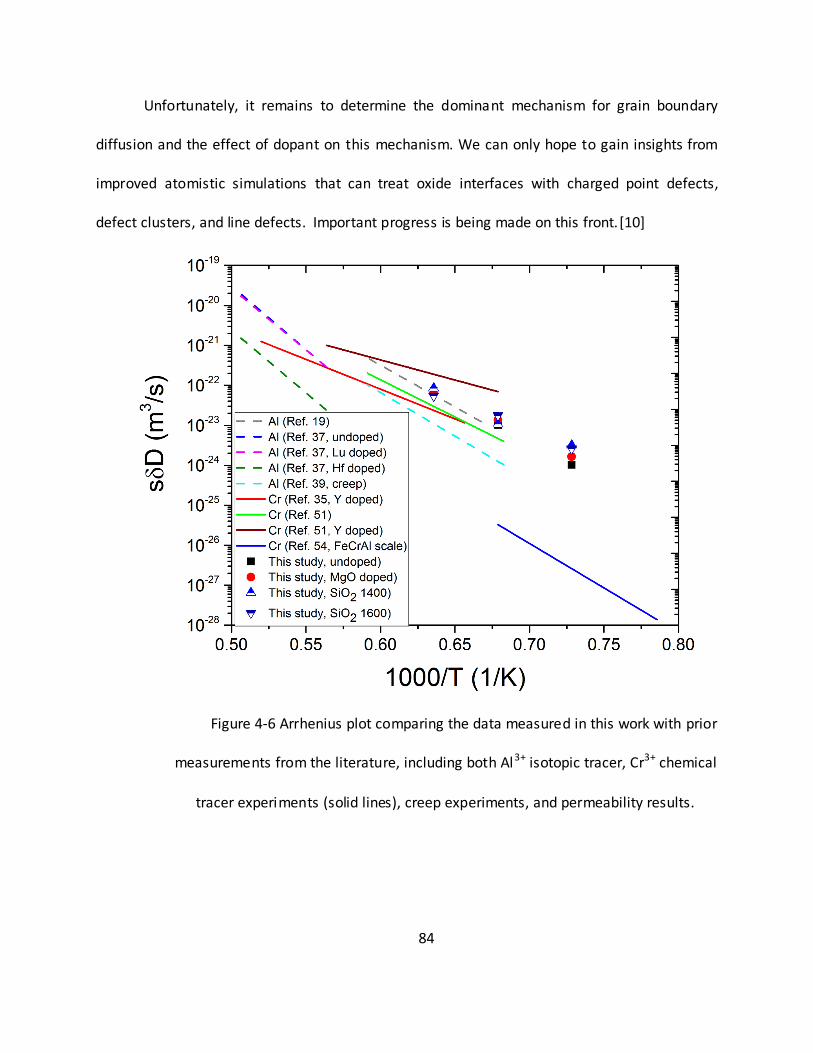
84
Unfortunately, it remains to determine the dominant mechanism for grain boundary
diffusion and the effect of dopant on this mechanism. We can only hope to gain insights from
improved atomistic simulations that can treat oxide interfaces with charged point defects,
defect clusters, and line defects. Important progress is being made on this front.[10]
Figure 4-6 Arrhenius plot comparing the data measured in this work with prior
measurements from the literature, including both Al3+ isotopic tracer, Cr3+ chemical
tracer experiments (solid lines), creep experiments, and permeability results.
85
4.5 Conclusions
In this study, we investigated dopant effects on Cr3+ grain boundary diffusion in aliovalent
doped Al2O3 using secondary ion mass spectrometry. The measured Cr3+ grain boundary
diffusivity in undoped Al2O3 is consistent with literature results, which were obtained via
several different techniques and from samples with different types and amounts of impurities.
We also found that neither MgO or SiO2 dopant produce measurable changes, outside
experimental error, in grain boundary diffusivity.
4.6 References
[1] A.H. Heuer, Oxygen and aluminum diffusion in α-Al2O3: How much do we really
understand?, Journal of the European Ceramic Society 28(7) (2008) 1495-1507.
[2] W.J. Quadakkers, A. Elschner, W. Speier, H. Nickel, Composition and growth mechanisms of
alumina scales on FeCrAl-based alloys determined by SNMS, Applied Surface Science 52(4)
(1991) 271-287.
[3] A. Atkinson, R.I. Taylor, P.D. Goode, Transport processes in the oxidation of Ni studied using
tracers in growing NiO scales, Oxidation of Metals 13(6) (1979) 519-543.
[4] S.N. Basu, J.W. Halloran, Tracer isotope distribution in growing oxide scales, Oxidation of
Metals 27(3) (1987) 143-155.
[5] J. Jedlinski, G. Borchardt, On the oxidation mechanism of alumina formers, Oxidation of
Metals 36(3) (1991) 317-337.
[6] J.A. Nychka, D.R. Clarke, Quantification of Aluminum Outward Diffusion During Oxidation of
FeCrAl Alloys, Oxidation of Metals 63(5) (2005) 325-352.
86
[7] D. Prot, M. Le Gall, B. Lesage, A.M. Huntz, C. Monty, Self-diffusion in α[sbnd]Al2O. IV.
Oxygen grain-boundary self-diffusion in undoped and yttria-doped alumina polycrystals,
Philosophical Magazine A 73(4) (1996) 935-949.
[8] A.H. Heuer, D.B. Hovis, J.L. Smialek, B. Gleeson, Alumina Scale Formation: A New Perspective,
Journal of the American Ceramic Society 94 (2011) s146-s153.
[9] K. Bedu-Amissah, J.M. Rickman, H.M. Chan, M.P. Harmer, Grain-Boundary Diffusion of Cr in
Pure and Y-Doped Alumina, Journal of the American Ceramic Society 90(5) (2007) 1551-1555.
[10] A.H. Heuer, T. Nakagawa, M.Z. Azar, D.B. Hovis, J.L. Smialek, B. Gleeson, N.D.M. Hine, H.
Guhl, H.S. Lee, P. Tangney, W.M.C. Foulkes, M.W. Finnis, On the growth of Al2O3 scales , Acta
Materialia 61(18) (2013) 6670-6683.
[11] T. Nakagawa, H. Nishimura, I. Sakaguchi, N. Shibata, K. Matsunaga, T. Yamamoto, Y.
Ikuhara, Grain boundary character dependence of oxygen grain boundary diffusion in α-Al2O3
bicrystals, Scripta Materialia 65(6) (2011) 544-547.
[12] P.Y. Hou, X.F. Zhang, R.M. Cannon, Impurity distribution in Al2O3 formed on an FeCrAl alloy,
Scripta Materialia 50(1) (2004) 45-49.
[13] A.H. Heuer, K.P.D. Lagerlof, Oxygen self-diffusion in corundum (alpha-Al2O3): A conundrum,
Philosophical Magazine Letters 79(8) (1999) 619-627.
[14] C.R.A. Catlow, R. James, W.C. Mackrodt, R.F. Stewart, Defect energetics in
$\ensuremath{\alpha}$-${\mathrm{Al}}_{2}$${\mathrm{O}}_{3}$ and rutile
Ti${\mathrm{O}}_{2}$, Physical Review B 25(2) (1982) 1006-1026.
87
[15] G.J. Dienes, D.O. Welch, C.R. Fischer, R.D. Hatcher, O. Lazareth, M. Samberg, Shell -model
calculation of some point-defect properties in $\ensuremath{\alpha}-
{\mathrm{Al}}_{2}{\mathrm{O}}_{3}$, Physical Review B 11(8) (1975) 3060-3070.
[16] P.W.M. Jacobs, E.A. Kotomin, Defect energies for pure corundum and for corundum doped
with transition metal ions, Philosophical Magazine A 68(4) (1993) 695-709.
[17] K.P.D. Lagerlöf, R.W. Grimes, The defect chemistry of sapphire (α-Al2O3), Acta Materialia
46(16) (1998) 5689-5700.
[18] K.J.W. Atkinson, R.W. Grimes, M.R. Levy, Z.L. Coull, T. English, Accommodation of
impurities in α-Al2O3, α-Cr2O3 and α-Fe2O3, Journal of the European Ceramic Society 23(16)
(2003) 3059-3070.
[19] M.L. Gall, B. Lesage, J. Bernardini, Self-diffusion in α-Al2O3 I. Aluminium diffusion in single
crystals, Philosophical Magazine A 70(5) (1994) 761-773.
[20] G.B. P. Fielitz, S. Ganschow, R. Bertram, 26Al tracer diffusion in nominally undoped single
crystalline α-Al2O3, Defect and Diffusion Forum 323-325 (2012) 75-79.
[21] A.E. Paladino, W.D. Kingery, Aluminum Ion Diffusion in Aluminum Oxide, The Journal of
Chemical Physics 37(5) (1962) 957-962.
[22] B. Lesage, A.M. Huntz, G. Petot-ervas, Transport phenomena in undoped and chromium or
yttrium doped-alumina, Radiation Effects 75(1-4) (1983) 283-299.
[23] E.G. Moya, F. Moya, A. Sami, D. Juvé, D. Tréheux, C. Grattepain, Diffusion of chromium in
alumina single crystals, Philosophical Magazine A 72(4) (1995) 861-870.
88
[24] Y.-K. Ahn, J.-G. Seo, J.-W. Park, Diffusion of chromium in sapphire: The effects of electron
beam irradiation, Journal of Crystal Growth 326(1) (2011) 45-49.
[25] K. Bedu‐Amissah, J. Rickman, H. Chan, M. Harmer, Grain‐Boundary Diffusion of Cr in Pure
and Y‐Doped Alumina, Journal of the American Ceramic Society 90(5) (2007) 1551-1555.
[26] J.P. Buban, K. Matsunaga, J. Chen, N. Shibata, W.Y. Ching, T. Yamamoto, Y. Ikuhara, Grain
Boundary Strengthening in Alumina by Rare Earth Impurities, Science 311(5758) (2006) 212-215.
[27] T. Matsudaira, M. Wada, T. Saitoh, S. Kitaoka, Oxygen permeability in cation-doped
polycrystalline alumina under oxygen potential gradients at high temperatures, Acta Materialia
59(14) (2011) 5440-5450.
[28] I.-J. Bae, S. Baik, Abnormal Grain Growth of Alumina, Journal of the American Ceramic
Society 80(5) (1997) 1149-1156.
[29] R. Cannon, W.H. Rhodes, A. Heuer, Plastic Deformation of Fine‐Grained Alumina (Al2O3): I,
Interface‐Controlled Diffusional Creep, Journal of the American Ceramic Society 63(1‐2) (1980)
46-53.
[30] J. Congleton, N. Petch, Dislocation movement in the brittle fracture of alumina, Acta
Metallurgica 14(10) (1966) 1179-1182.
[31] I.B. Cutler, C. Bradshaw, C.J. Christensen, E.P. Hyatt, Sintering of Alumina at Temperatures
of 1400°C. and Below, Journal of the American Ceramic Society 40(4) (1957) 134-139.
[32] P.A. Lessing, R.S. Gordon, Creep of polycrystalline alumina, pure and doped with transition
metal impurities, Journal of Materials Science 12(11) (1977) 2291-2302.
89
[33] A.G. Robertson, D.S. Wilkinson, C.H. Caceres, Creep and Creep Fracture in Hot‐Pressed
Alumina, Journal of the American Ceramic Society 74(5) (1991) 915-921.
[34] S.J. Dillon, M. Tang, W.C. Carter, M.P. Harmer, Complexion: A new concept for kinetic
engineering in materials science, Acta Materialia 55(18) (2007) 6208-6218.
[35] S.J. Dillon, M.P. Harmer, Relating Grain Boundary Complexion to Grain Boundary Kinetics II:
Silica-Doped Alumina, Journal of the American Ceramic Society 91(7) (2008) 2314-2320.
[36] H. Sang Chul, Y. Duk Yong, M.K. Brun, Migration of grain boundaries in alumina induced by
chromia addition, Acta Metallurgica et Materialia 43(3) (1995) 977-984.
[37] S.J. Dillon, M.P. Harmer, Intrinsic Grain Boundary Mobility in Alumina, Journal of the
American Ceramic Society 89(12) (2006) 3885-3887.
[38] L. Feng, S.J. Dillon, Cation Lattice Diffusivity in Aliovalent Doped Aluminas, Journal of the
European Ceramic Society Submmitted (2016).
[39] R.M. Cannon, W.H. Rhodes, A.H. Heuer, Plastic Deformation of Fine-Grained Alumina
(Al2O3): I, Interface-Controlled Diffusional Creep, Journal of the American Ceramic Society 63(1-
2) (1980) 46-53.
[40] S. Kitaoka, T. Matsudaira, M. Wada, Mass-Transfer Mechanism of Alumina Ceramics under
Oxygen Potential Gradients at High Temperatures, MATERIALS TRANSACTIONS 50(5) (2009)
1023-1031.
[41] M.H. Lagrange, M. Huntz A, J.Y. Laval, Effect of yttrium on the microstructure and diffusion
properties of α-alumina, Ann. Chim. Fr. 12 (1987) 9-12.
90
[42] T. Matsudaira, M. Wada, S. Kitaoka, Effect of Dopants on the Distribution of Aluminum and
Oxygen Fluxes in Polycrystalline Alumina Under Oxygen Potential Gradients at High
Temperatures, Journal of the American Ceramic Society 96(10) (2013) 3243-3251.
[43] J.W. Osenbach, V.S. Stubican, Grain boundary and lattice diffusion of 51Cr in alumina and
spinel, Adv. Ceram 10 (1984) 406-17.
[44] K. Messaoudi, A.M. Huntz, B. Lesage, Diffusion and growth mechanism of Al2O3 scales on
ferritic Fe-Cr-Al alloys, Materials Science and Engineering: A 247(1–2) (1998) 248-262.
[45] P. Fielitz, K. Kelm, R. Bertram, A.H. Chokshi, G. Borchardt, Aluminium-26 grain boundary
diffusion in pure and Y-doped polycrystalline α-alumina, Acta Materialia 127 (2017) 302-311.
[46] K.L. Gavrilov, S.J. Bennison, K.R. Mikeska, J.M. Chabala, R. Levi-Setti, Silica and Magnesia
Dopant Distributions in Alumina by High-Resolution Scanning Secondary Ion Mass Spectrometry,
Journal of the American Ceramic Society 82(4) (1999) 1001-1008.
[47] K.L. Gavrilov, S.J. Bennison, K.R. Mikeska, R. Levi-Setti, Grain boundary chemistry of
alumina by high-resolution imaging SIMS, Acta Materialia 47(15–16) (1999) 4031-4039.
[48] P.J. Jorgensen, J.H. Westbrook, Role of Solute Segregation at Grain Boundaries During
Final–Stage Sintering of Alumina, Journal of the American Ceramic Society 47(7) (1964) 332-338.
[49] K.K. Soni, A.M. Thompson, M.P. Harmer, D.B. Williams, J.M. Chabala, R. Levi‐Setti, Solute
segregation to grain boundaries in MgO‐doped alumina, Applied Physics Letters 66(21) (1995)
2795-2797.
[50] R.H. Doremus, Diffusion in alumina, Journal of Applied Physics 100(10) (2006) 101301.
91
[51] S.E. Babcock, R.W. Balluffi, Grain boundary kinetics—I. In situ observations of coupled grain
boundary dislocation motion, crystal translation and boundary displacement, Acta Metal lurgica
37(9) (1989) 2357-2365.
[52] K.A. Berry, M.P. Harmer, Effect of MgO Solute on Microstructure Development in Al2O3,
Journal of the American Ceramic Society 69(2) (1986) 143-149.
92
CHAPTER 5
THE EFFECTS OF DOPANTS AND COMPLEXION TRANSITIONS ON
FRACTURE TOUGHNESS OF ALUMINA
5.1 Introduction
Hall-Petch scaling often provides a basis for tailoring mechanical properties of
polycrystalline materials.[1-8] However, the grain size dependence of mechanical properties in
many ceramic systems remains anomalous. Experiments as diverse as mechanical tension,[9]
compression, three-point bending,[10] acoustic emission,[11] and dry sliding wear[12] all reveal
a discontinuous change in properties as a function of grain size for a wide range of structural
ceramics such as α-Al2O3, β-Al2O3, SiC, TiO2 B4C, MgAl2O4, Si3N4 and UO2.[9, 10, 13] At larger
grain sizes the systems tend to be embrittled relative to Hall-Petch extrapolations from finer
grain sizes. α-Al2O3 is amongst the most studied structural oxides and a discontinuity in
mechanical properties with grain size has been reported in a number of individual studies,
emerges a general trend in reviews of the subject, and has been appreciated since at least the
early 1970’s.[9, 13] Despite this, a lack of a satisfactory fundamental understanding of the
phenomenon persists, a common feature in these materials is that the plot of strength (σ)
versus inverse root grain size (G-1/2) is said to have two branches. The coarse grain branch of the
data tends to extrapolate towards zero strength with increasing grain size rather than the s ingle
crystal value anticipated by the Hall-Petch relation. The response persists across a wide range of
temperatures; for example in α-Al2O3 between -196 and 1000 oC. Figure 5-1 plots example α-
93
Al2O3 flexural σ-G-1/2 data from the literature, with the approximate single crystal value
highlighted.[9]
The published literature provides several potential explanations for the deviation from
the Hall-Petch behavior towards embrittlement with coarser microstructures.[9, 13] I) It was
suggested that using the average grain size, rather than the grain size at the crack initiation
point, where an abnormal grain is often located, introduces an error in the analysis. However,
detailed treatments suggest that this cannot account for all of the experimental results. II) Flaw
sensitivity has been proposed as an explanation, where the two branches on the σ -G-1/2 plot
intersect at the value grain size being equivalent to a critical flaw size, C. In the coarse grain
regime, the size of internal flaws such as pores scales with grain size. In the fine grain regime,
the largest flaws are surface and other processing defects that are relatively grain size
independent. In this case, the σ-G-1/2 slope in the coarse grained regime corresponds to KIC and
the fine grain slope is closer to 0 and most sensitive to sample preparation. However, the
fracture toughness values extracted from this analysis in the coarse grain branch are
consistently lower than measured values. Additionally, it is also known from more recent work
on nanograin ceramics that Hall-Petch strengthening continues to <10 nm grain sizes.[14] III)
Environmental sensitivity could play also play a role in the flaw sensitivity that impacts the σ -G-
1/2 trends. However, it has been found that for oxides such as Al2O3 exposure to H2O only
affects mechanical response in-situ and that pre-exposure has no measureable effect. However,
the two branch σ-G-1/2 behavior persists under a variety of environmental conditions and
temperatures. Measurements of acoustic emission during Hertzian contact as a function of
94
grain size, indicate a transition to grain boundary microcracking in a similar grain size regime,
where the σ-G-1/2 curve tends to embrittle.[11] This loading state will not be flaw sensitive, and
the behavior was attributed to a transition between length scales where the matrix is
effectively mechanically homogeneous or heterogeneous. However, an inherent
embrittlement of the grain boundaries could provide an alternative explanation. Dry sliding
wear experiments performed on Al2O3 also indicate an anomalous grain size dependent
response, in a similar size regime, where the deformation mechanism transitions from plasticity
and light erosion, to grain pull out.[15] Grain pull out often occurs during polishing of coarse
grained Al2O3, while it is less common in fine grained material. While the stress states during
these experiments are complex and hard to define, they are less flaw sensitive and one could
hypothesize that an underlying embrittlement may lead to the discontinuous response as a
function of grain size. A fundamental mechanism that sufficiently accounts for the anomalous
σ-G-1/2 branching remains elusive.
Annealing time and temperature have received little consideration in the interpretation
of the σ-G-1/2 response, where grain size is assumed to be an isolated variable. In fact, many
published studies do not describe heat treatments making re-interpretation of the data
challenging. Reported σ-G-1/2 measurements in Al2O3 often extend to grain sizes in the range of
200-400 μm. To achieve the largest grain sizes in high purity Al2O3, samples must be annealed
at, for example, 2020 oC for ≈100 hours or 1900 oC for >1000 hours.[16] Such high
temperatures and long annealing times were not utilized in the literatures.[9, 13] Instead, large
grain sizes were achieved via discontinuous or abnormal grain growth. Discontinuous and
95
abnormal grain growth both break self-similarity associated with normal grain growth, but
discontinuous growth results in a unimodal grain size distribution, whereas abnormal grain
growth produces a bi-modal or multimodal distribution. In both cases, a change in grain growth
mechanism typically occurs. The mechanisms for abnormal and discontinuous grain growth in
Al2O3 have been investigated extensively since Coble’s early work on controlled normal grain
growth.[17, 18] Dillon et al. demonstrated that abnormal grain growth in Al 2O3 was associated
with grain boundary ‘phase’ transitions called complexion transitions.[16] Grain boundaries in
this system can undergo an entropically induced transformation in the local equilibrium
structure and chemistry. Like in a bulk phase transition, the complexion transition produces a
discontinuous change in the properties, such as grain boundary mobility. The distribution of
high mobility boundaries surrounding a certain grain can al low it to grow abnormally fast
relative to grains coordinated by different lower mobility complexions. The full details of the
relationship between complexions and grain growth is beyond the scope of the current
introduction and further explanation can be found in the references[16, 19-21].
Al2O3 undergoes a series of complexion transitions as a function of temperature and/or
chemical potential, with 6 different general types of complexions having been observed. These
6 complexion types correlate with 6 different regimes of average grain boundary mobility. The
complexion transitions occur in a manner analogous to layering transitions associated with
adsorption at free surfaces, transitioning between ‘clean’, sub-monolayer, bilayer, trilayer,
thicker multilayers, and wetting. The thicker multilayer grain boundary complexions have been
well known since the late 1970’s and are often
96
called intergranular films.[22] Intergranular films are known to cause grain boundary
embrittlement in ceramics such as SiC and Si3N4.[23-25] The extent to which grain boundary
complexion transitions affect grain boundary strength in Al 2O3 is unknown. One could
reasonably hypothesize that intergranular films should similarly embrittle Al2O3. Complexion
transitions to bilayers or multilayers have been shown to be responsible for ‘liquid metal
embrittlement’ in systems such as Cu-Bi and Ni-Bi.[23] However, amorphous grain boundary
layers in some Cu-Zr have been shown to toughen this material due to their ability to
accommodate dislocation emission and adsorption.[26, 27]
Our introductory review of the literature suggests that the samples prepared in the
coarse grained branch of the σ-G-1/2 plot in Al2O3 (i.e. embrittled region) were likely to have
contained significant fractions of higher entropy complexions. We hypothesize that these
complexion transitions induce discontinuous changes in the grain boundary mechanical
properties that manifest as embrittlement for higher entropy complexions. Therefore the two
branches in the σ-G-1/2 behavior develop, at least partially, from different processing conditions
(time and temperature) rather than grain size. Most published work prepare significantly
different grain sizes by annealing at different temperatures. Complexion transitions display
hysteresis, such that comparing very short annealing times and long annealing times at the
same high temperature, necessary to produce significantly different sizes isothermally, can still
result in different complexions.[28] This is observed particularly clearly in SiO2-doped Al2O3
annealed at 1500 oC.[19]
97
In order to test the hypothesis that transitions to higher entropy grain boundary
complexions in Al2O3 induces grain boundary embrittlement we seek to isolate grain boundary
mechanics from grain size and local microstructure. To achieve this, single grain boundary
fracture toughness specimens are fabricated from bulk polycrystals annealed at different
temperatures known to produce, on average, different grain boundary complexions in the
microstructure. Several such single boundary experiments have been reported in the literature
for other ceramic and metal systems, mostly using SEM based techniques.[29-33] The samples
are tested via micro-cantilever fracture experiments performed in-situ in the transmission
electron microscope (TEM). Since intergranular films are already known to embrittle other
ceramic systems, this work mainly focuses on the behavior of ‘clean’, sub-monolayer, and
multilayer adsorbate complexions.
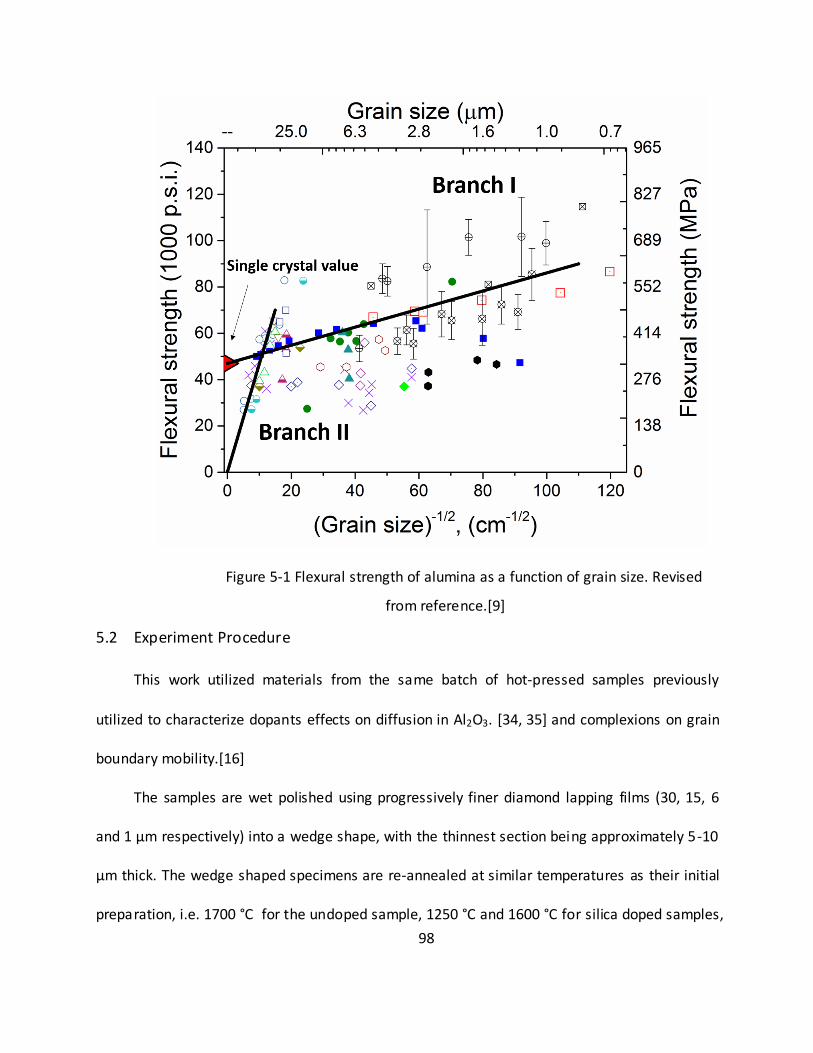
98
Figure 5-1 Flexural strength of alumina as a function of grain size. Revised
from reference.[9]
5.2 Experiment Procedure
This work utilized materials from the same batch of hot-pressed samples previously
utilized to characterize dopants effects on diffusion in Al2O3. [34, 35] and complexions on grain
boundary mobility.[16]
The samples are wet polished using progressively finer diamond lapping films (30, 15, 6
and 1 µm respectively) into a wedge shape, with the thinnest section being approximately 5-10
µm thick. The wedge shaped specimens are re-annealed at similar temperatures as their initial
preparation, i.e. 1700 °C for the undoped sample, 1250 °C and 1600 °C for silica doped samples,
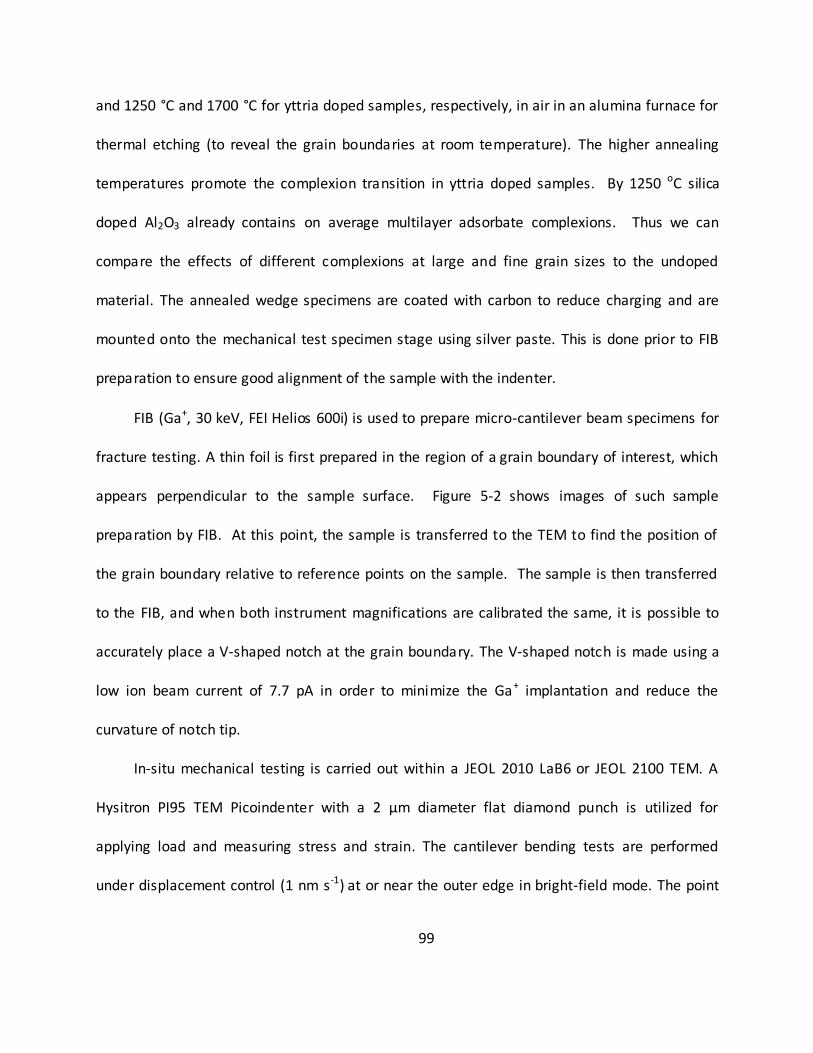
99
and 1250 °C and 1700 °C for yttria doped samples, respectively, in air in an alumina furnace for
thermal etching (to reveal the grain boundaries at room temperature). The higher annealing
temperatures promote the complexion transition in yttria doped samples. By 1250 oC silica
doped Al2O3 already contains on average multilayer adsorbate complexions. Thus we can
compare the effects of different complexions at large and fine grain sizes to the undoped
material. The annealed wedge specimens are coated with carbon to reduce charging and are
mounted onto the mechanical test specimen stage using silver paste. This is done prior to FIB
preparation to ensure good alignment of the sample with the indenter.
FIB (Ga+, 30 keV, FEI Helios 600i) is used to prepare micro-cantilever beam specimens for
fracture testing. A thin foil is first prepared in the region of a grain boundary of interest, which
appears perpendicular to the sample surface. Figure 5-2 shows images of such sample
preparation by FIB. At this point, the sample is transferred to the TEM to find the position of
the grain boundary relative to reference points on the sample. The sample is then transferred
to the FIB, and when both instrument magnifications are calibrated the same, it is possible to
accurately place a V-shaped notch at the grain boundary. The V-shaped notch is made using a
low ion beam current of 7.7 pA in order to minimize the Ga+ implantation and reduce the
curvature of notch tip.
In-situ mechanical testing is carried out within a JEOL 2010 LaB6 or JEOL 2100 TEM. A
Hysitron PI95 TEM Picoindenter with a 2 µm diameter flat diamond punch is utilized for
applying load and measuring stress and strain. The cantilever bending tests are performed
under displacement control (1 nm s-1) at or near the outer edge in bright-field mode. The point
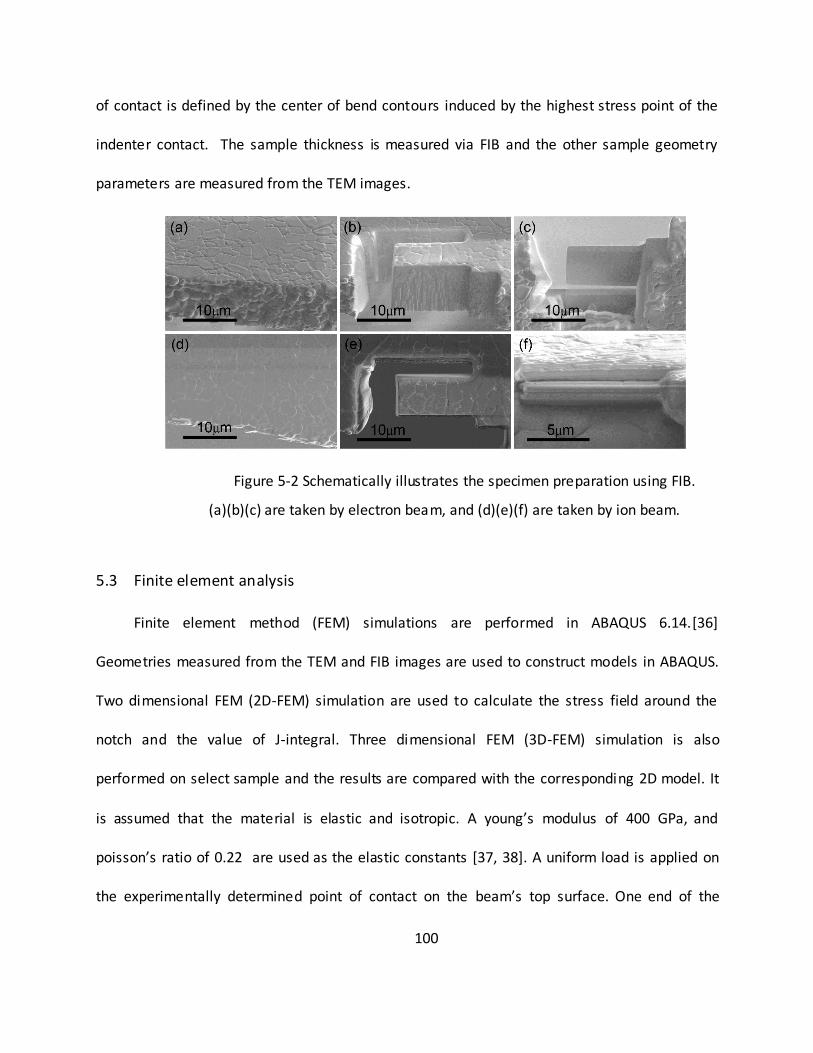
100
of contact is defined by the center of bend contours induced by the highest stress point of the
indenter contact. The sample thickness is measured via FIB and the other sample geometry
parameters are measured from the TEM images.
Figure 5-2 Schematically illustrates the specimen preparation using FIB.
(a)(b)(c) are taken by electron beam, and (d)(e)(f) are taken by ion beam.
5.3 Finite element analysis
Finite element method (FEM) simulations are performed in ABAQUS 6.14.[36]
Geometries measured from the TEM and FIB images are used to construct models in ABAQUS.
Two dimensional FEM (2D-FEM) simulation are used to calculate the stress field around the
notch and the value of J-integral. Three dimensional FEM (3D-FEM) simulation is also
performed on select sample and the results are compared with the corresponding 2D model. It
is assumed that the material is elastic and isotropic. A young’s modulus of 400 GPa, and
poisson’s ratio of 0.22 are used as the elastic constants [37, 38]. A uniform load is applied on
the experimentally determined point of contact on the beam’s top surface. One end of the
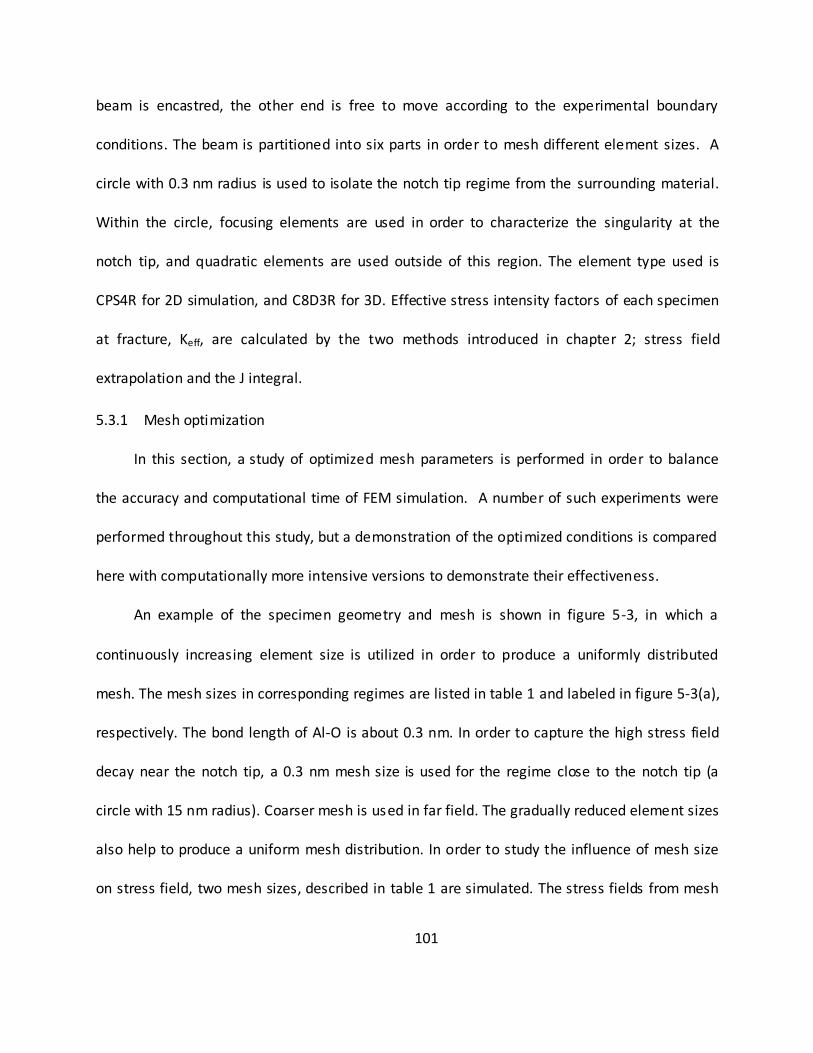
101
beam is encastred, the other end is free to move according to the experimental boundary
conditions. The beam is partitioned into six parts in order to mesh different element sizes. A
circle with 0.3 nm radius is used to isolate the notch tip regime from the surrounding material.
Within the circle, focusing elements are used in order to characterize the singularity at the
notch tip, and quadratic elements are used outside of this region. The element type used is
CPS4R for 2D simulation, and C8D3R for 3D. Effective stress intensity factors of each specimen
at fracture, Keff, are calculated by the two methods introduced in chapter 2; stress field
extrapolation and the J integral.
5.3.1 Mesh optimization
In this section, a study of optimized mesh parameters is performed in order to balance
the accuracy and computational time of FEM simulation. A number of such experiments were
performed throughout this study, but a demonstration of the optimized conditions is compared
here with computationally more intensive versions to demonstrate their effectiveness.
An example of the specimen geometry and mesh is shown in figure 5-3, in which a
continuously increasing element size is utilized in order to produce a uniformly distributed
mesh. The mesh sizes in corresponding regimes are listed in table 1 and labeled in figure 5-3(a),
respectively. The bond length of Al-O is about 0.3 nm. In order to capture the high stress field
decay near the notch tip, a 0.3 nm mesh size is used for the regime close to the notch tip (a
circle with 15 nm radius). Coarser mesh is used in far field. The gradually reduced element sizes
also help to produce a uniform mesh distribution. In order to study the influence of mesh size
on stress field, two mesh sizes, described in table 1 are simulated. The stress fields from mesh
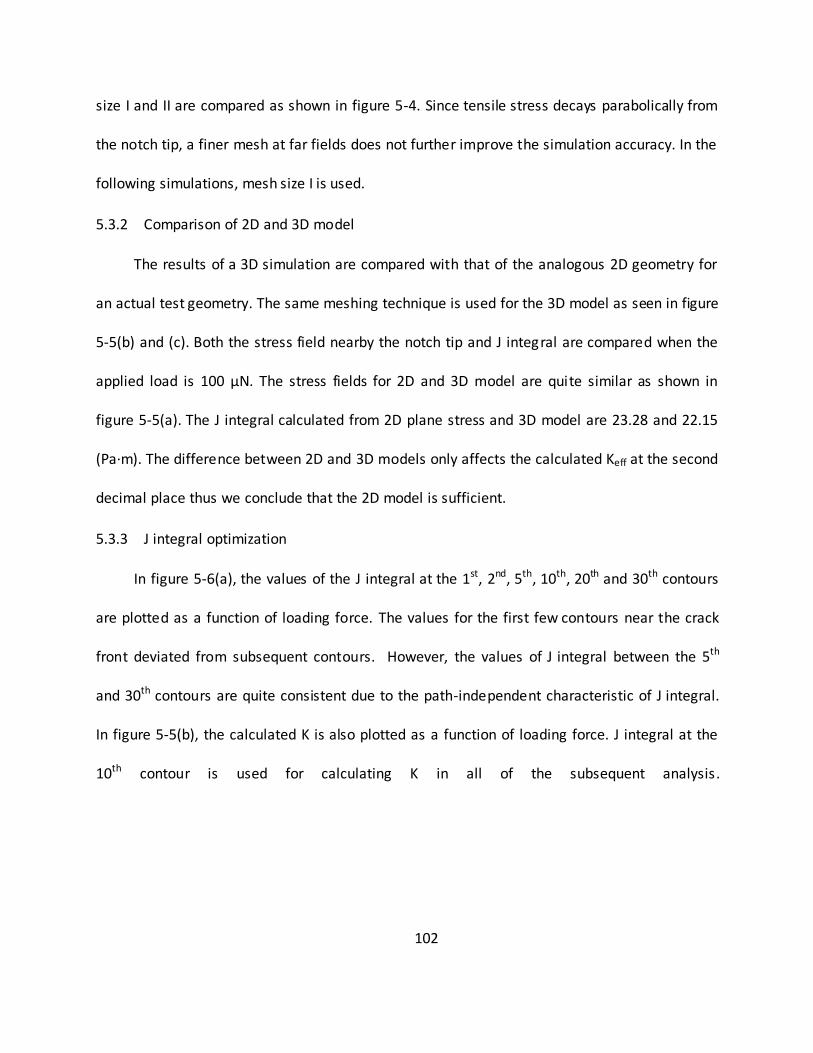
102
size I and II are compared as shown in figure 5-4. Since tensile stress decays parabolically from
the notch tip, a finer mesh at far fields does not further improve the simulation accuracy. In the
following simulations, mesh size I is used.
5.3.2 Comparison of 2D and 3D model
The results of a 3D simulation are compared with that of the analogous 2D geometry for
an actual test geometry. The same meshing technique is used for the 3D model as seen in figure
5-5(b) and (c). Both the stress field nearby the notch tip and J integral are compared when the
applied load is 100 µN. The stress fields for 2D and 3D model are quite similar as shown in
figure 5-5(a). The J integral calculated from 2D plane stress and 3D model are 23.28 and 22.15
(Pa∙m). The difference between 2D and 3D models only affects the calculated Keff at the second
decimal place thus we conclude that the 2D model is sufficient.
5.3.3 J integral optimization
In figure 5-6(a), the values of the J integral at the 1st, 2nd, 5th, 10th, 20th and 30th contours
are plotted as a function of loading force. The values for the first few contours near the crack
front deviated from subsequent contours. However, the values of J integral between the 5th
and 30th contours are quite consistent due to the path-independent characteristic of J integral.
In figure 5-5(b), the calculated K is also plotted as a function of loading force. J integral at the
10th contour is used for calculating K in all of the subsequent analysis.
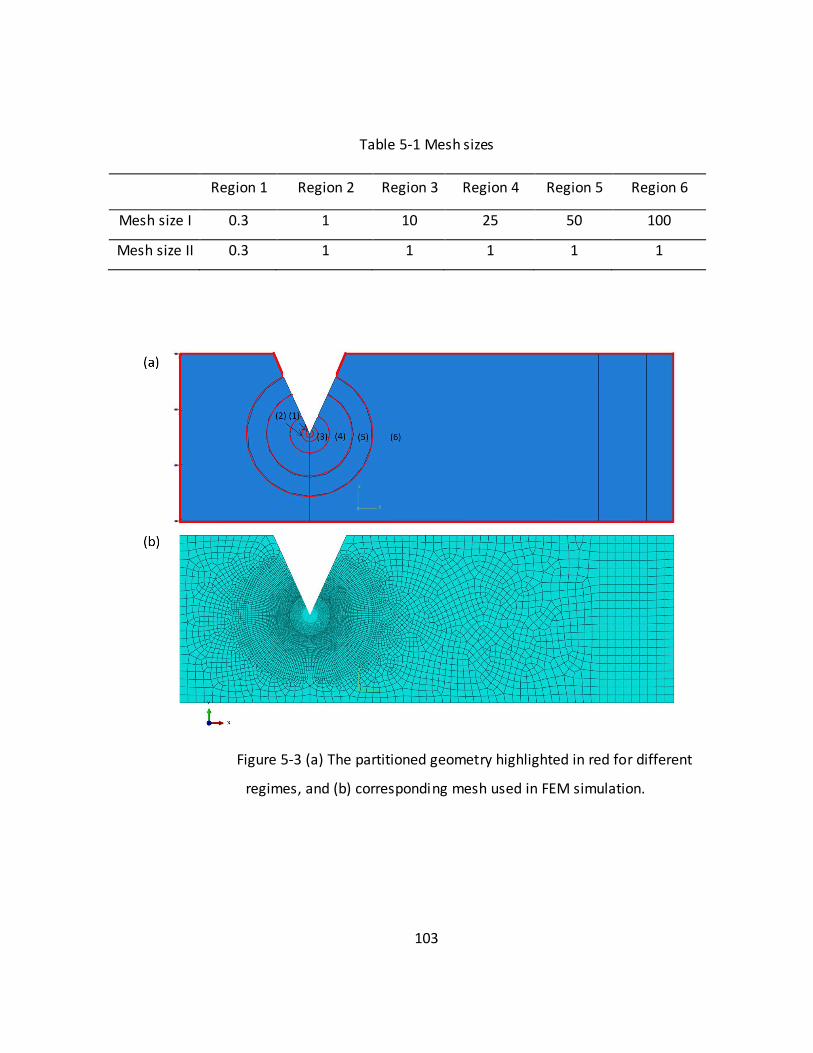
103
Table 5-1 Mesh sizes
Region 1 Region 2 Region 3 Region 4 Region 5 Region 6
Mesh size I 0.3 1 10 25 50 100
Mesh size II 0.3 1 1 1 1 1
Figure 5-3 (a) The partitioned geometry highlighted in red for different
regimes, and (b) corresponding mesh used in FEM simulation.
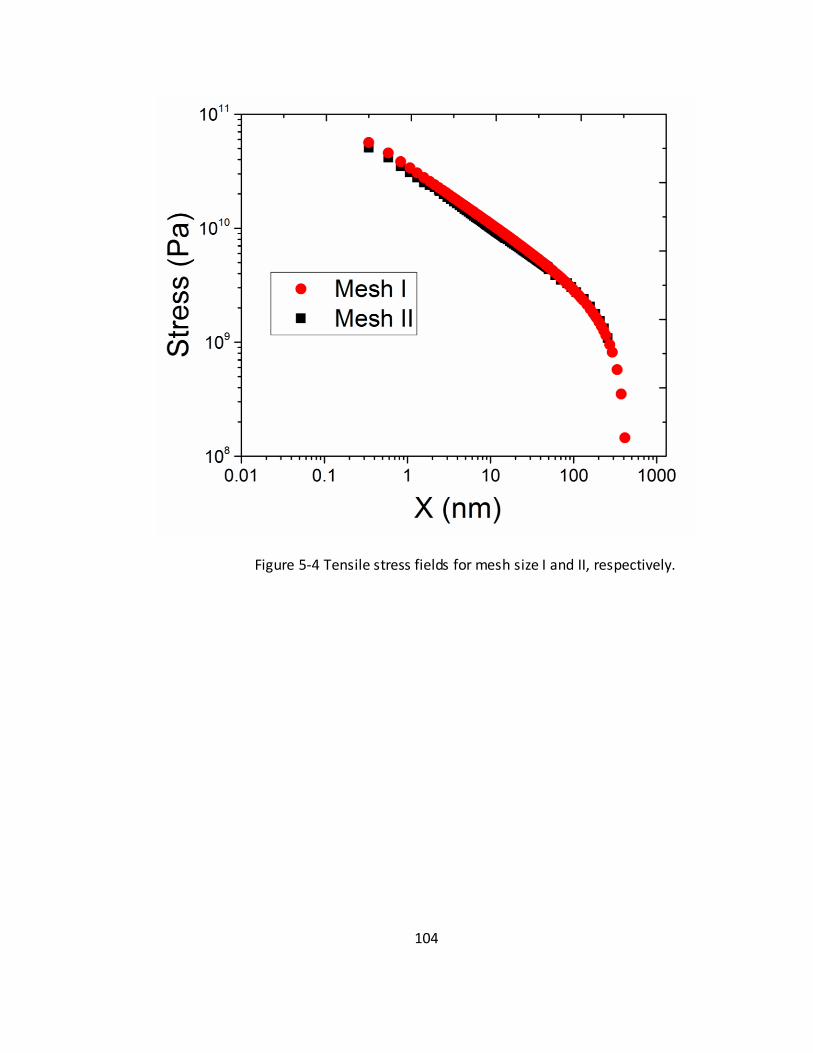
104
Figure 5-4 Tensile stress fields for mesh size I and II, respectively.
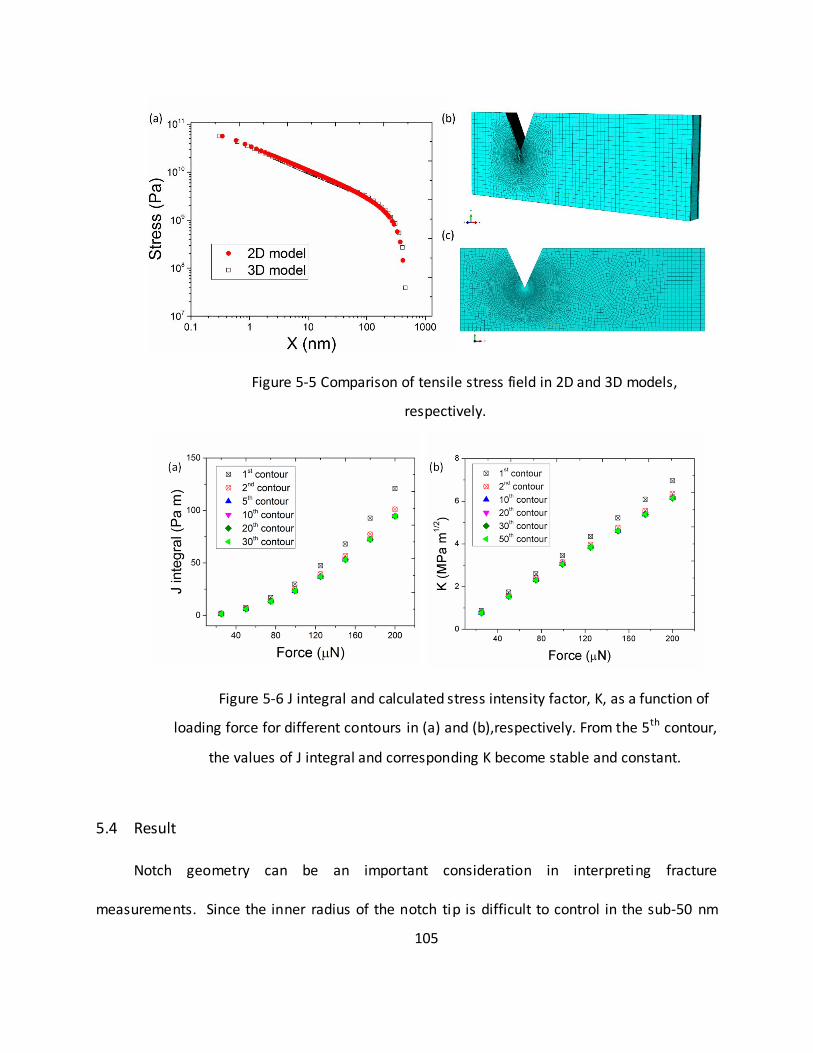
105
Figure 5-5 Comparison of tensile stress field in 2D and 3D models,
respectively.
Figure 5-6 J integral and calculated stress intensity factor, K, as a function of
loading force for different contours in (a) and (b),respectively. From the 5th contour,
the values of J integral and corresponding K become stable and constant.
5.4 Result
Notch geometry can be an important consideration in interpreting fracture
measurements. Since the inner radius of the notch tip is difficult to control in the sub-50 nm
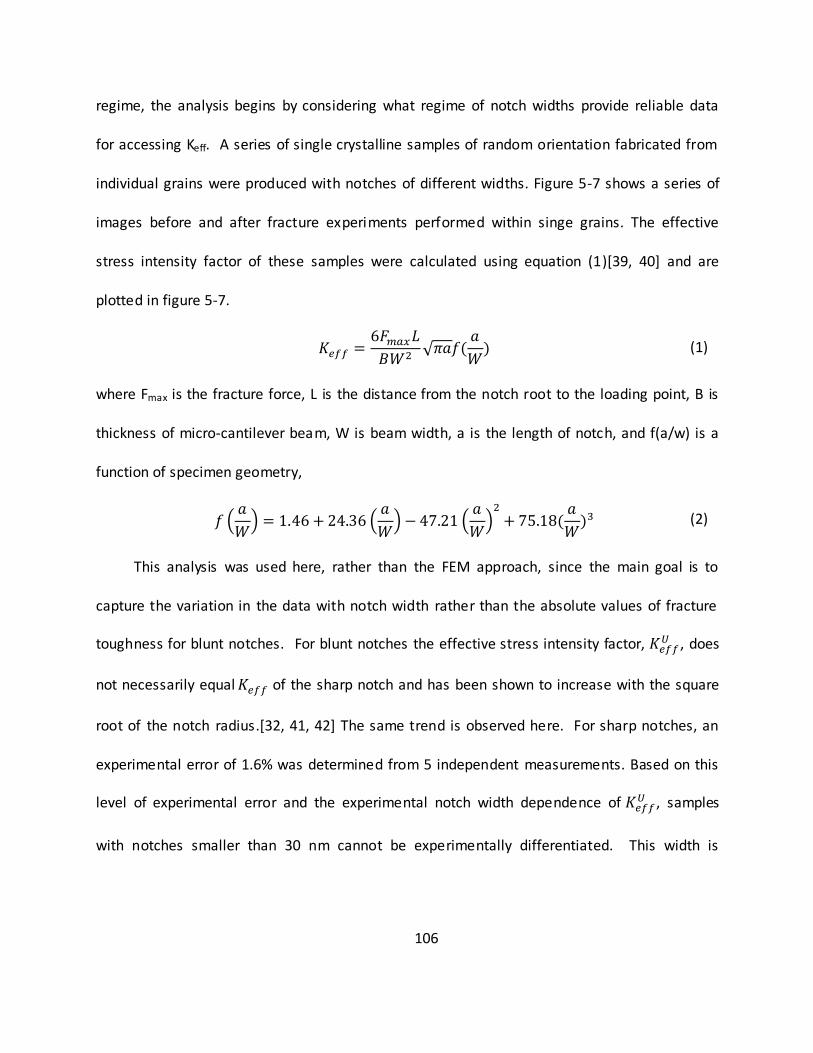
106
regime, the analysis begins by considering what regime of notch widths provide reliable data
for accessing Keff. A series of single crystalline samples of random orientation fabricated from
individual grains were produced with notches of different widths. Figure 5-7 shows a series of
images before and after fracture experiments performed within singe grains. The effective
stress intensity factor of these samples were calculated using equation (1)[39, 40] and are
plotted in figure 5-7.
(1)
where Fmax is the fracture force, L is the distance from the notch root to the loading point, B is
thickness of micro-cantilever beam, W is beam width, a is the length of notch, and f(a/w) is a
function of specimen geometry,
(2)
This analysis was used here, rather than the FEM approach, since the main goal is to
capture the variation in the data with notch width rather than the absolute values of fracture
toughness for blunt notches. For blunt notches the effective stress intensity factor, , does
not necessarily equal of the sharp notch and has been shown to increase with the square
root of the notch radius.[32, 41, 42] The same trend is observed here. For sharp notches, an
experimental error of 1.6% was determined from 5 independent measurements. Based on this
level of experimental error and the experimental notch width dependence of , samples
with notches smaller than 30 nm cannot be experimentally differentiated. This width is
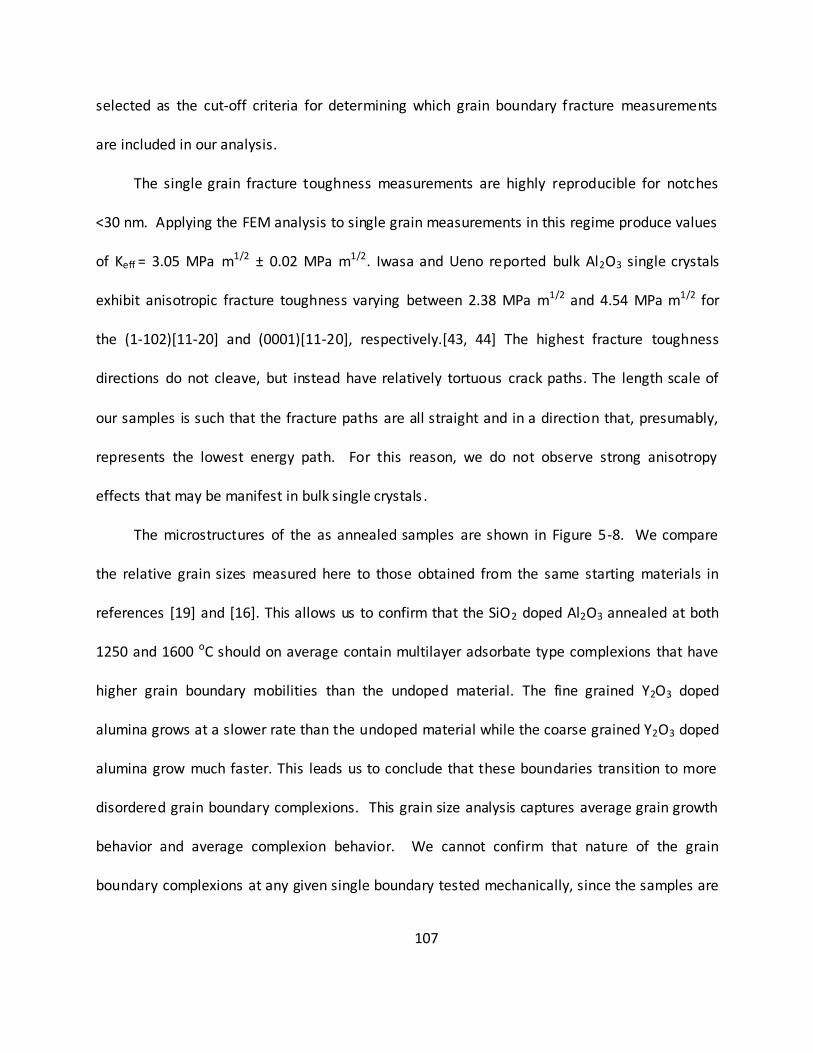
107
selected as the cut-off criteria for determining which grain boundary fracture measurements
are included in our analysis.
The single grain fracture toughness measurements are highly reproducible for notches
<30 nm. Applying the FEM analysis to single grain measurements in this regime produce values
of Keff = 3.05 MPa m1/2 ± 0.02 MPa m1/2. Iwasa and Ueno reported bulk Al2O3 single crystals
exhibit anisotropic fracture toughness varying between 2.38 MPa m1/2 and 4.54 MPa m1/2 for
the (1-102)[11-20] and (0001)[11-20], respectively.[43, 44] The highest fracture toughness
directions do not cleave, but instead have relatively tortuous crack paths. The length scale of
our samples is such that the fracture paths are all straight and in a direction that, presumably,
represents the lowest energy path. For this reason, we do not observe strong anisotropy
effects that may be manifest in bulk single crystals .
The microstructures of the as annealed samples are shown in Figure 5-8. We compare
the relative grain sizes measured here to those obtained from the same starting materials in
references [19] and [16]. This allows us to confirm that the SiO2 doped Al2O3 annealed at both
1250 and 1600 oC should on average contain multilayer adsorbate type complexions that have
higher grain boundary mobilities than the undoped material. The fine grained Y2O3 doped
alumina grows at a slower rate than the undoped material while the coarse grained Y2O3 doped
alumina grow much faster. This leads us to conclude that these boundaries transition to more
disordered grain boundary complexions. This grain size analysis captures average grain growth
behavior and average complexion behavior. We cannot confirm that nature of the grain
boundary complexions at any given single boundary tested mechanically, since the samples are
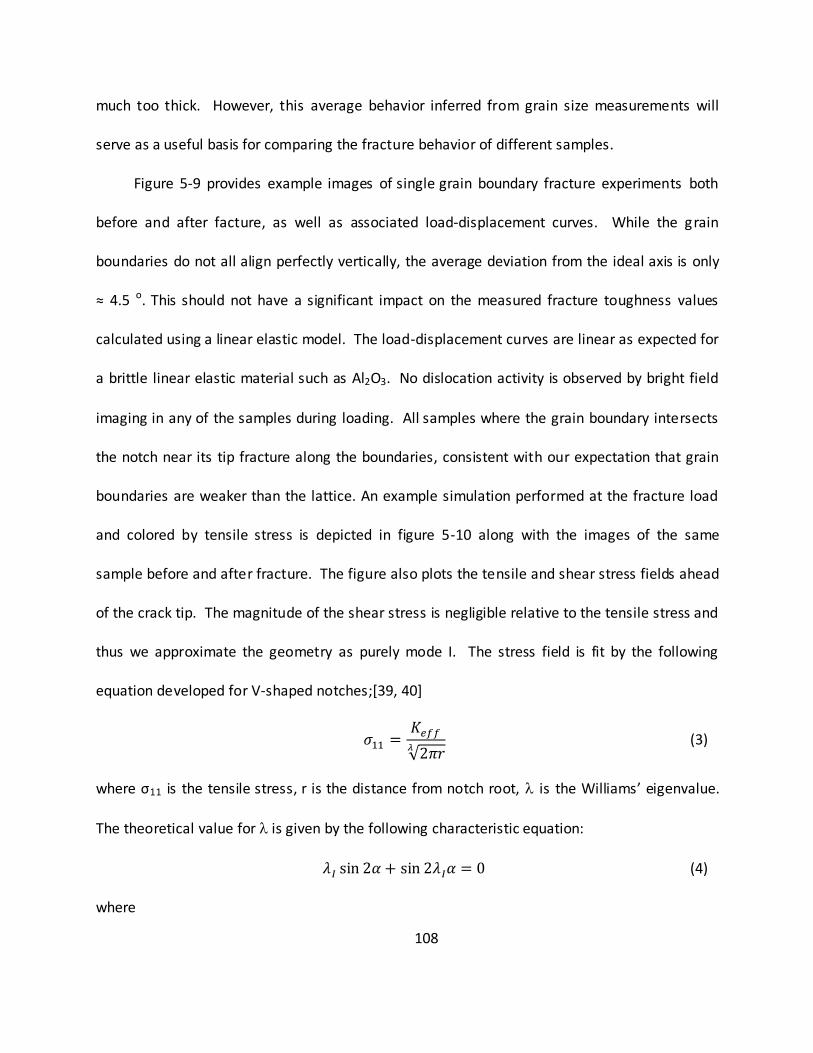
108
much too thick. However, this average behavior inferred from grain size measurements will
serve as a useful basis for comparing the fracture behavior of different samples.
Figure 5-9 provides example images of single grain boundary fracture experiments both
before and after facture, as well as associated load-displacement curves. While the grain
boundaries do not all align perfectly vertically, the average deviation from the ideal axis is only
≈ 4.5 o. This should not have a significant impact on the measured fracture toughness values
calculated using a linear elastic model. The load-displacement curves are linear as expected for
a brittle linear elastic material such as Al2O3. No dislocation activity is observed by bright field
imaging in any of the samples during loading. All samples where the grain boundary intersects
the notch near its tip fracture along the boundaries, consistent with our expectation that grain
boundaries are weaker than the lattice. An example simulation performed at the fracture load
and colored by tensile stress is depicted in figure 5-10 along with the images of the same
sample before and after fracture. The figure also plots the tensile and shear stress fields ahead
of the crack tip. The magnitude of the shear stress is negligible relative to the tensile stress and
thus we approximate the geometry as purely mode I. The stress field is fit by the following
equation developed for V-shaped notches;[39, 40]
(3)
where σ11 is the tensile stress, r is the distance from notch root, is the Williams’ eigenvalue.
The theoretical value for is given by the following characteristic equation:
(4)
where
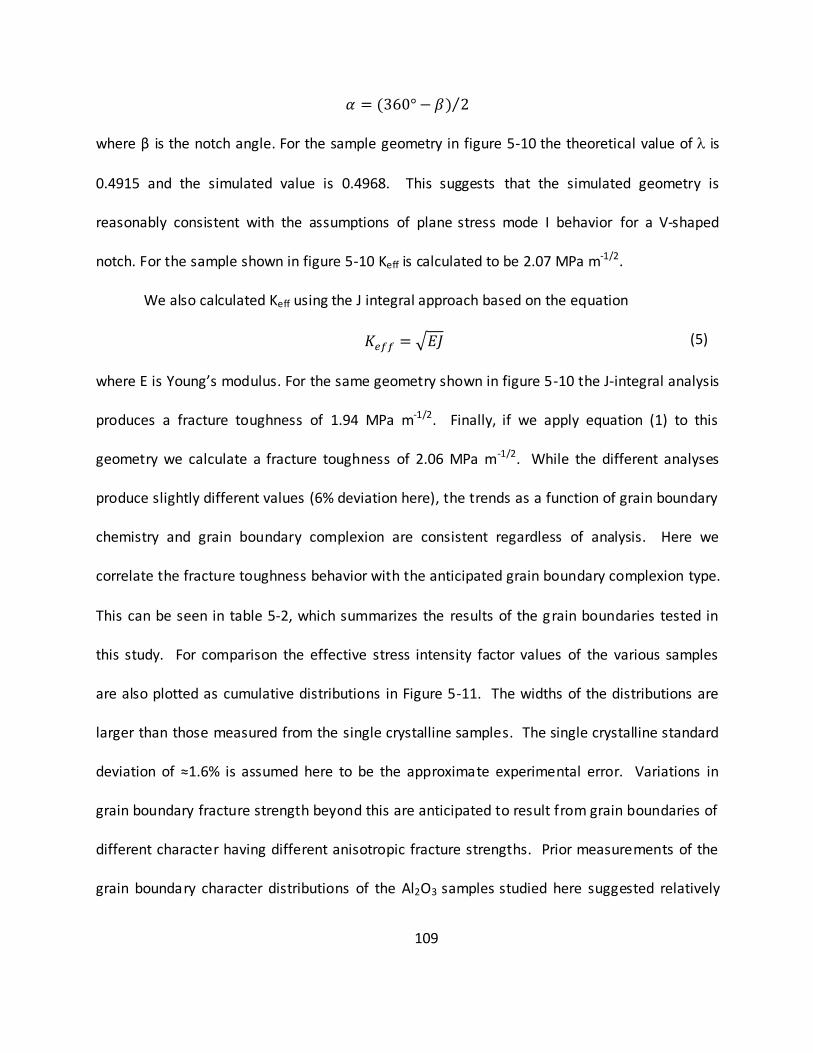
109
where β is the notch angle. For the sample geometry in figure 5-10 the theoretical value of is
0.4915 and the simulated value is 0.4968. This suggests that the simulated geometry is
reasonably consistent with the assumptions of plane stress mode I behavior for a V-shaped
notch. For the sample shown in figure 5-10 Keff is calculated to be 2.07 MPa m-1/2.
We also calculated Keff using the J integral approach based on the equation
(5)
where E is Young’s modulus. For the same geometry shown in figure 5-10 the J-integral analysis
produces a fracture toughness of 1.94 MPa m-1/2. Finally, if we apply equation (1) to this
geometry we calculate a fracture toughness of 2.06 MPa m-1/2. While the different analyses
produce slightly different values (6% deviation here), the trends as a function of grain boundary
chemistry and grain boundary complexion are consistent regardless of analysis. Here we
correlate the fracture toughness behavior with the anticipated grain boundary complexion type.
This can be seen in table 5-2, which summarizes the results of the grain boundaries tested in
this study. For comparison the effective stress intensity factor values of the various samples
are also plotted as cumulative distributions in Figure 5-11. The widths of the distributions are
larger than those measured from the single crystalline samples. The single crystalline standard
deviation of ≈1.6% is assumed here to be the approximate experimental error. Variations in
grain boundary fracture strength beyond this are anticipated to result from grain boundaries of
different character having different anisotropic fracture strengths. Prior measurements of the
grain boundary character distributions of the Al2O3 samples studied here suggested relatively
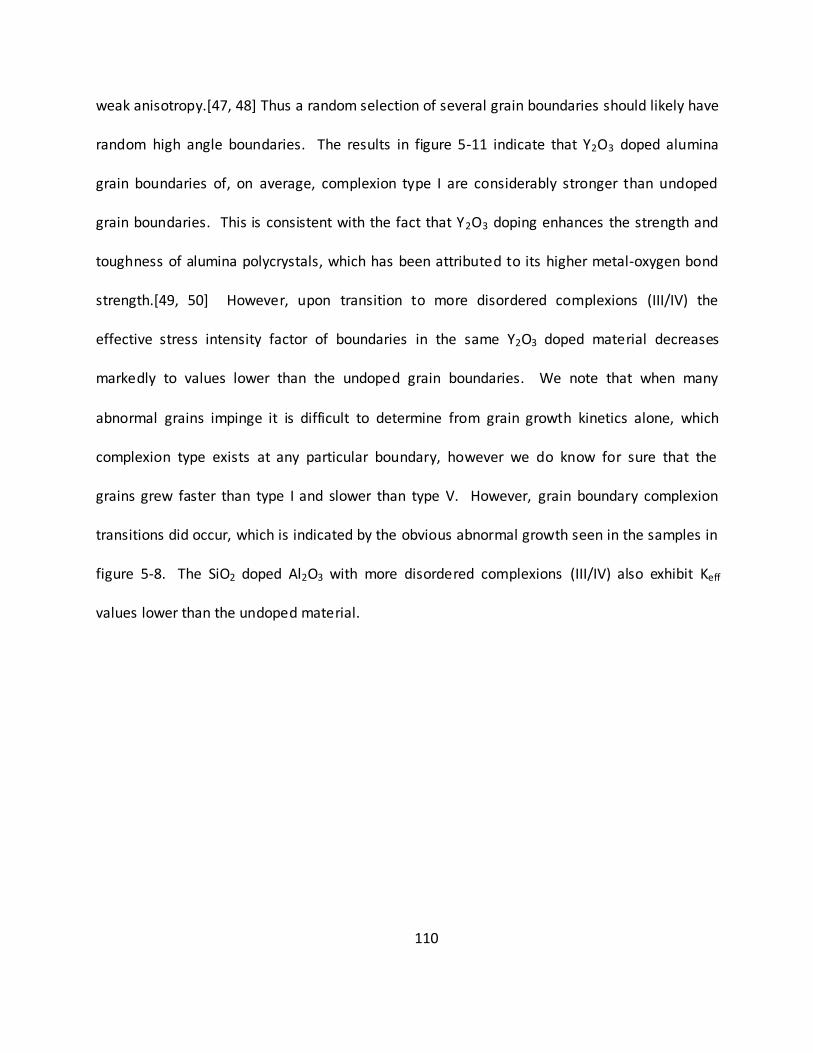
110
weak anisotropy.[47, 48] Thus a random selection of several grain boundaries should likely have
random high angle boundaries. The results in figure 5-11 indicate that Y2O3 doped alumina
grain boundaries of, on average, complexion type I are considerably stronger than undoped
grain boundaries. This is consistent with the fact that Y2O3 doping enhances the strength and
toughness of alumina polycrystals, which has been attributed to its higher metal-oxygen bond
strength.[49, 50] However, upon transition to more disordered complexions (III/IV) the
effective stress intensity factor of boundaries in the same Y2O3 doped material decreases
markedly to values lower than the undoped grain boundaries. We note that when many
abnormal grains impinge it is difficult to determine from grain growth kinetics alone, which
complexion type exists at any particular boundary, however we do know for sure that the
grains grew faster than type I and slower than type V. However, grain boundary complexion
transitions did occur, which is indicated by the obvious abnormal growth seen in the samples in
figure 5-8. The SiO2 doped Al2O3 with more disordered complexions (III/IV) also exhibit Keff
values lower than the undoped material.
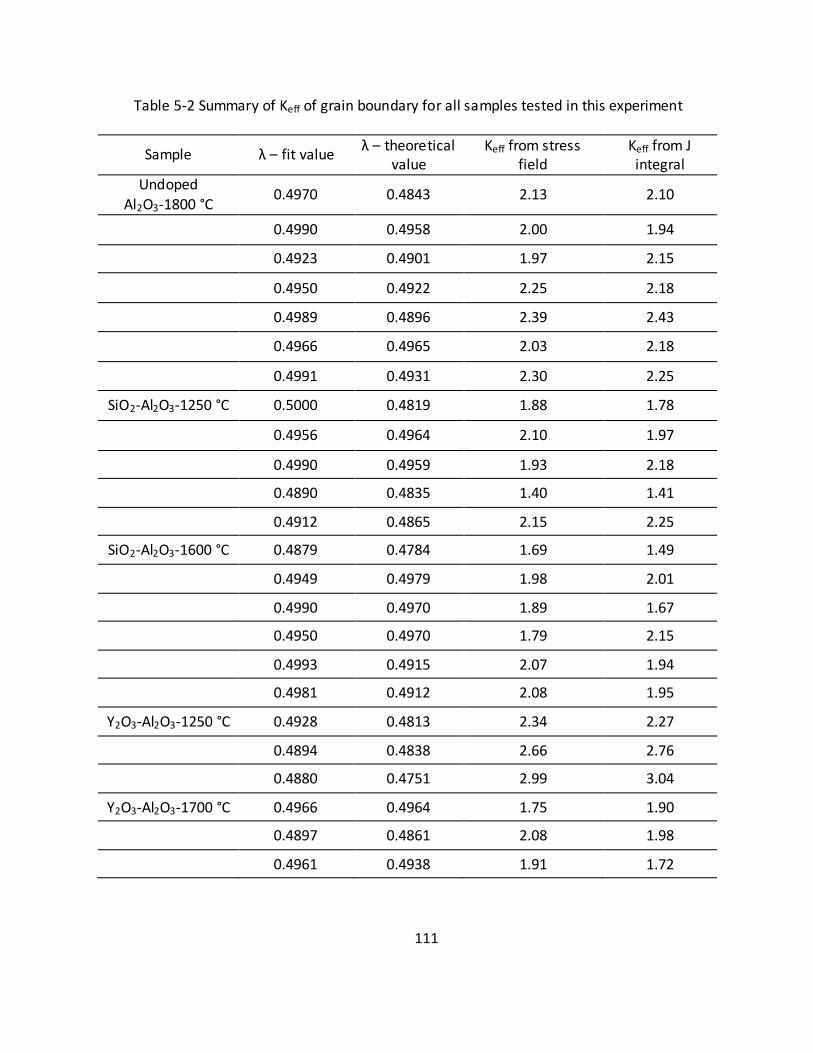
111
Table 5-2 Summary of Keff of grain boundary for all samples tested in this experiment
Sample λ – fit value λ – theoretical
value Keff from stress
field Keff from J integral
Undoped
Al2O3-1800 °C 0.4970 0.4843 2.13 2.10
0.4990 0.4958 2.00 1.94
0.4923 0.4901 1.97 2.15
0.4950 0.4922 2.25 2.18
0.4989 0.4896 2.39 2.43
0.4966 0.4965 2.03 2.18
0.4991 0.4931 2.30 2.25
SiO2-Al2O3-1250 °C 0.5000 0.4819 1.88 1.78
0.4956 0.4964 2.10 1.97
0.4990 0.4959 1.93 2.18
0.4890 0.4835 1.40 1.41
0.4912 0.4865 2.15 2.25
SiO2-Al2O3-1600 °C 0.4879 0.4784 1.69 1.49
0.4949 0.4979 1.98 2.01
0.4990 0.4970 1.89 1.67
0.4950 0.4970 1.79 2.15
0.4993 0.4915 2.07 1.94
0.4981 0.4912 2.08 1.95
Y2O3-Al2O3-1250 °C 0.4928 0.4813 2.34 2.27
0.4894 0.4838 2.66 2.76
0.4880 0.4751 2.99 3.04
Y2O3-Al2O3-1700 °C 0.4966 0.4964 1.75 1.90
0.4897 0.4861 2.08 1.98
0.4961 0.4938 1.91 1.72
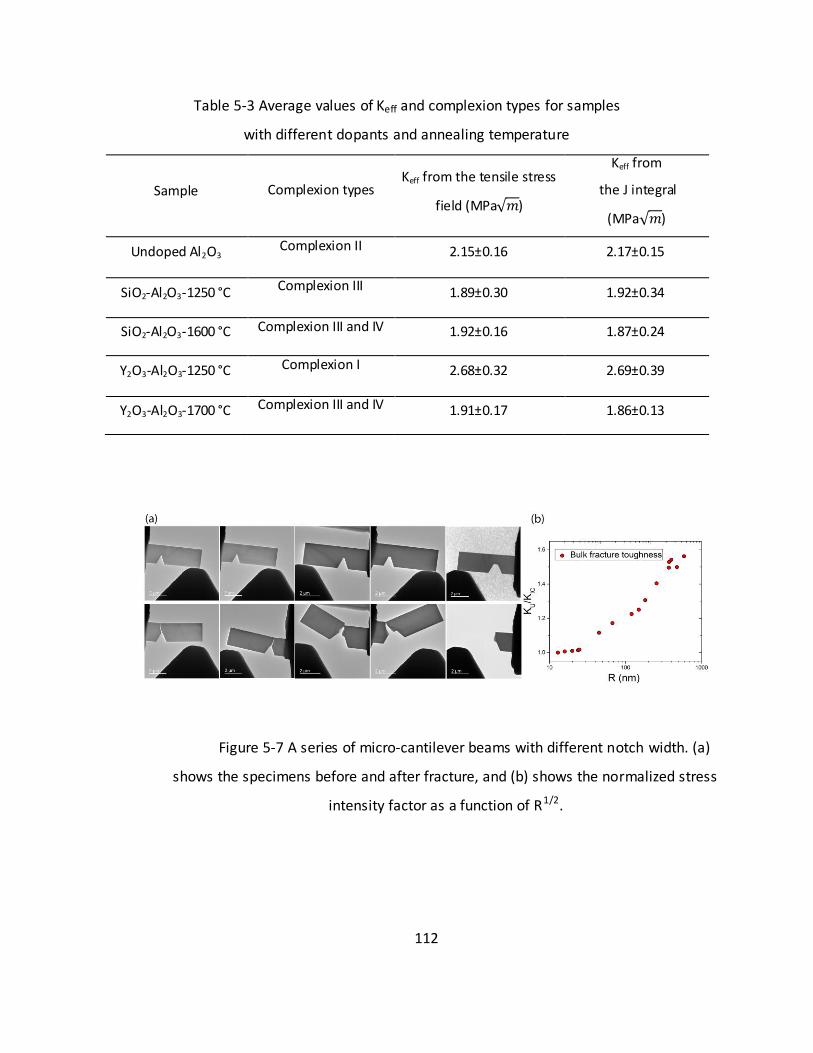
112
Table 5-3 Average values of Keff and complexion types for samples
with different dopants and annealing temperature
Sample
Complexion types Keff from the tensile stress
field (MPa )
Keff from
the J integral
(MPa )
Undoped Al2O3 Complexion II 2.15±0.16 2.17±0.15
SiO2-Al2O3-1250 °C Complexion III 1.89±0.30 1.92±0.34
SiO2-Al2O3-1600 °C Complexion III and IV 1.92±0.16 1.87±0.24
Y2O3-Al2O3-1250 °C Complexion I 2.68±0.32 2.69±0.39
Y2O3-Al2O3-1700 °C Complexion III and IV 1.91±0.17 1.86±0.13
Figure 5-7 A series of micro-cantilever beams with different notch width. (a)
shows the specimens before and after fracture, and (b) shows the normalized stress
intensity factor as a function of R1/2.
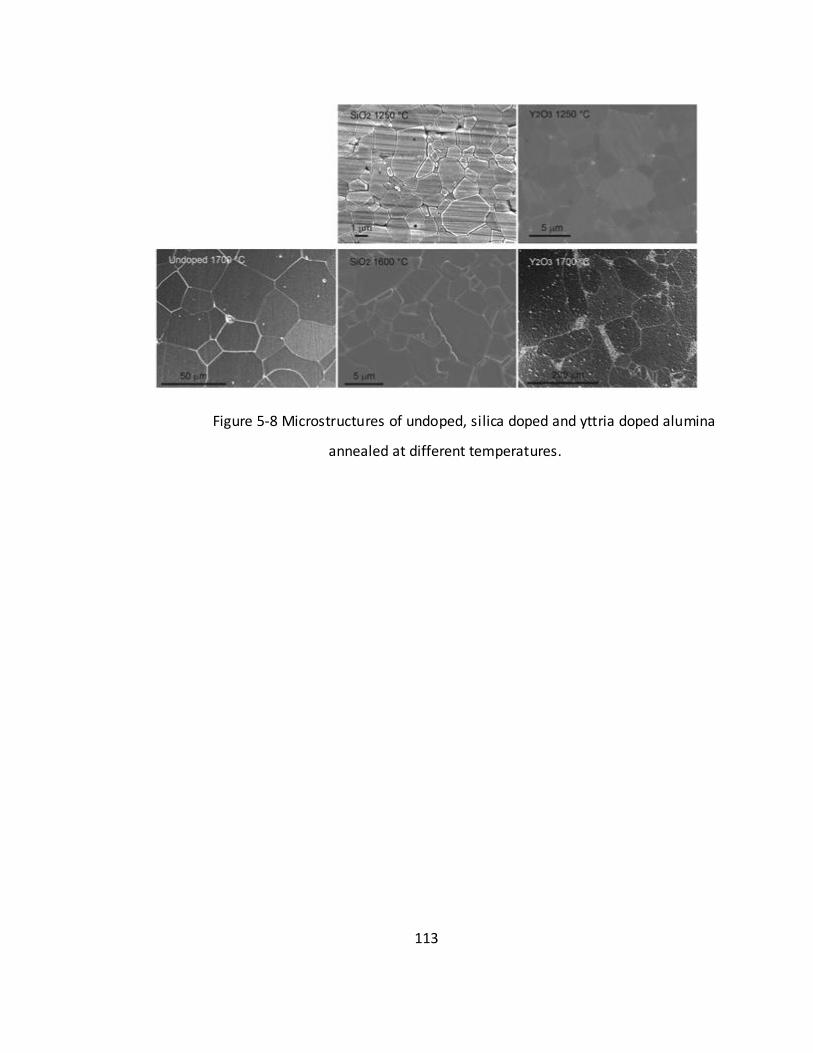
113
Figure 5-8 Microstructures of undoped, silica doped and yttria doped alumina
annealed at different temperatures.
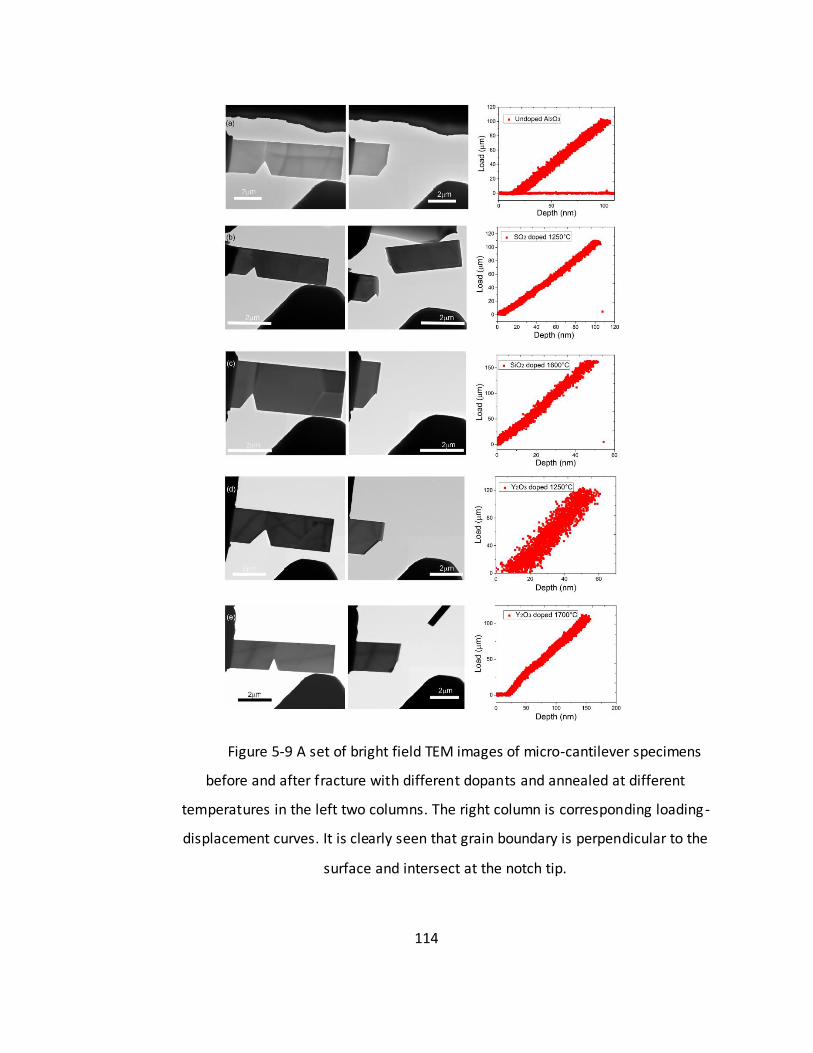
114
Figure 5-9 A set of bright field TEM images of micro-cantilever specimens
before and after fracture with different dopants and annealed at different
temperatures in the left two columns. The right column is corresponding loading-
displacement curves. It is clearly seen that grain boundary is perpendicular to the
surface and intersect at the notch tip.
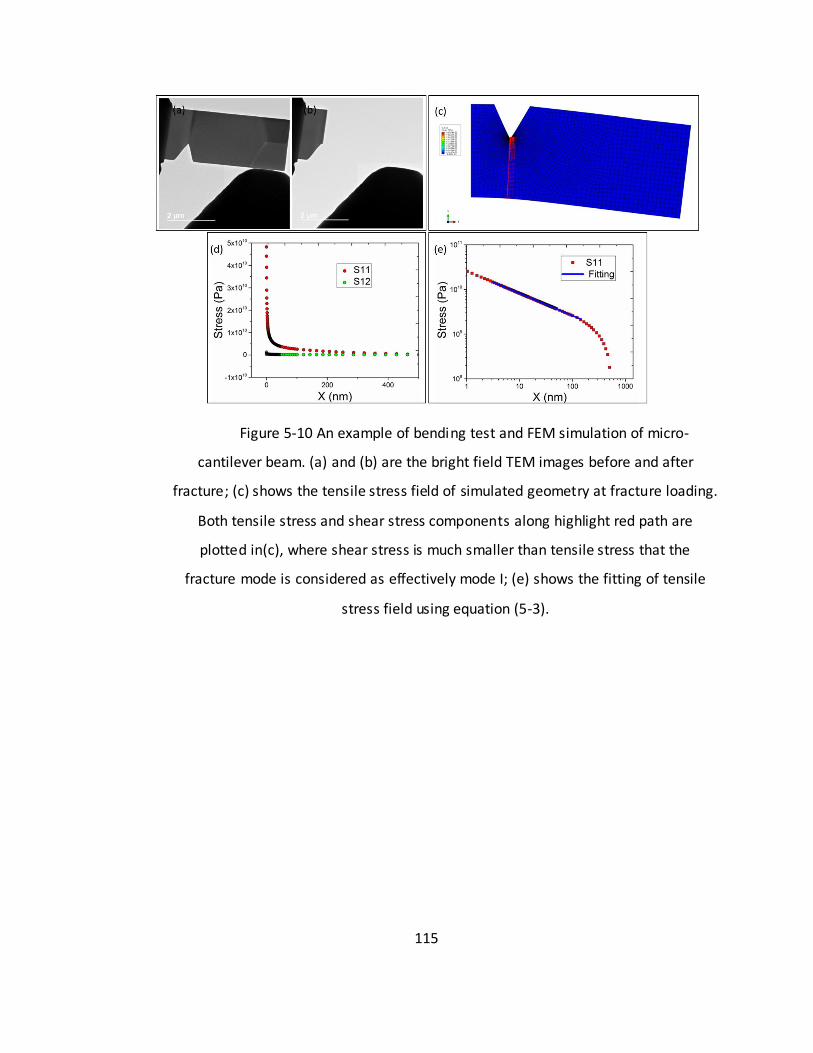
115
Figure 5-10 An example of bending test and FEM simulation of micro-
cantilever beam. (a) and (b) are the bright field TEM images before and after
fracture; (c) shows the tensile stress field of simulated geometry at fracture loading.
Both tensile stress and shear stress components along highlight red path are
plotted in(c), where shear stress is much smaller than tensile stress that the
fracture mode is considered as effectively mode I; (e) shows the fitting of tensile
stress field using equation (5-3).
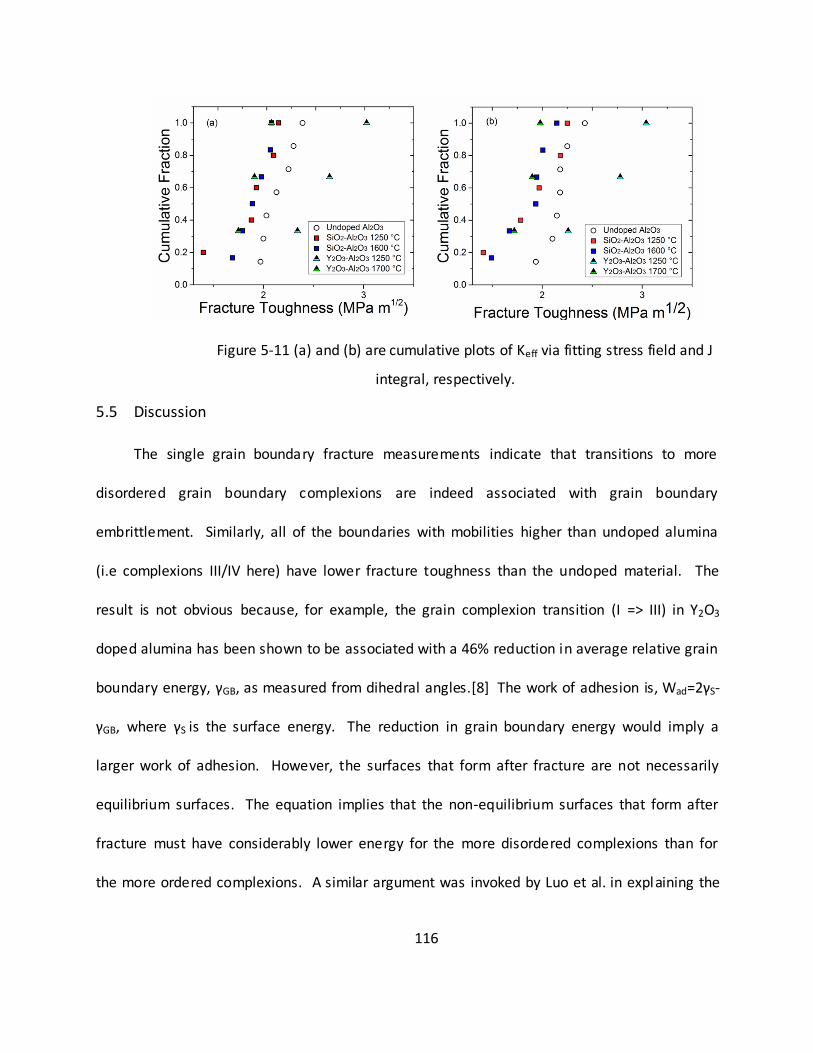
116
Figure 5-11 (a) and (b) are cumulative plots of Keff via fitting stress field and J
integral, respectively.
5.5 Discussion
The single grain boundary fracture measurements indicate that transitions to more
disordered grain boundary complexions are indeed associated with grain boundary
embrittlement. Similarly, all of the boundaries with mobilities higher than undoped alumina
(i.e complexions III/IV here) have lower fracture toughness than the undoped material. The
result is not obvious because, for example, the grain complexion transition (I => III) in Y2O3
doped alumina has been shown to be associated with a 46% reduction in average relative grain
boundary energy, γGB, as measured from dihedral angles.[8] The work of adhesion is, Wad=2γS-
γGB, where γS is the surface energy. The reduction in grain boundary energy would imply a
larger work of adhesion. However, the surfaces that form after fracture are not necessarily
equilibrium surfaces. The equation implies that the non-equilibrium surfaces that form after
fracture must have considerably lower energy for the more disordered complexions than for
the more ordered complexions. A similar argument was invoked by Luo et al. in explaining the
117
embrittlement of Ni by Bi.[51] They argued that the weaker Bi-Bi bonds would lead to a lower
fracture strength, but this can also be interpreted as a lower surface energy due to the
formation of a fracture surface with lower energy unsatisfied bonds.
Keff of the lattice measured here is 3.05 MPa m-1/2, and 1.40 to 3.04 MPa m-1/2 for single
grain boundaries. Reported literature values for polycrystalline range from 2.5 to 6.0 MPa m-
1/2.[37, 42, 52] The fracture toughness of polycrystals tends to exceed those of the constituent
components, lattice and grain boundaries, due to more tortuous crack paths, frictional forces
and adhesive forces experienced during crack opening. For these reasons the fracture
toughness can be sensitive to geometric factors alone, such as grain size, grain size distribution,
and grain shape.[53] While the more disordered complexion may directly lower the grain
boundary fracture strength, the relatively lower energy surfaces formed after grain boundary
fracture may also affect the adhesion and friction associated with crack opening. These effects
make the response of polycrystals challenging to predict and it is unclear how the complexion
transitions ultimately impact the overall fracture toughness of a polycrystal. However, it is
reasonable to assume that for comparable microstructures that a reduction in average grain
boundary fracture toughness at the single grain boundary level should reduce the overall
sample fracture toughness. While this study focused on average properties with small sample
size it is reasonable to assume that the tails in the anisotropic grain boundary property
distribution may also play an important role in determining the overall fracture toughness and
fracture path. The factors cited above make it challenging to quantify the extent to which
complexion induced grain boundary embrittlement may account for anomalous σ -G-1/2
118
branching. Rice suggested that the coarse grain branch of the σ-G-1/2 produced a slope too low
(2.6 MPa m-1/2) to account for the fracture toughness of Al2O3 (≈3.5 MPa m-1/2). Our
measurements indicate that the grain boundary fracture toughness is reduced by complexion
transitions typical of samples in the coarse branch of the σ-G-1/2 data. The measured reduction
in grain boundary fracture toughness could in fact account for the lower slope in the σ-G-1/2
data. Reimanis has also suggested that a peak in polycrystalline fracture toughness is typical of
non-cubic oxides due to the fact that fine grain material exhibit limited microcracking around
the crack tip, intermediate grain size materials dissipate energy through the microcracking
process, and coarse grain material does not microcrack because the nucleated cracks
propagate.[53] This leads to an inherent embrittlement of the coarse grain material. Again,
embrittlement at the single boundary level via complexion transitions will also influence the
relative degree of microcracking. Reinterpreting existing data is challenging in this respect, but
we similarly expect the single grain boundary embrittlement observed here to exacerbate the
embrittlement effect in the coarse grain regime. However, the trends in our experimental data
capture the major qualitative effects observed in the literature; leading us to conclude that
complexion transition induced embrittlement is a critical factor in explaining embrittlement
observed in much of the coarse grain Al2O3 previously reported in the literature.
5.6 Conclusion
In summary, we designed a novel sample preparation and testing method using FIB and
nanomechanical loading to evaluate single grain boundary fracture toughness of alumina. This
method can isolate the grain size effect from microstructural geometry effects, and is used to
119
study the roles of dopant and complexion transition on grain boundary strength. The
establishment of cut-off criteria of notch width ensures the validity of the measured results.
Our results indicate that yttira doped alumina has larger fracture toughness with type I
complexion, but it becomes less tough when the complexion transitions to more disordered
complexions, type III/IV. The silica doped alumina has smaller fracture toughness than undoped,
since usually silica promotes similarly disorder complexions at temperatures lower than the
processing temperature. We conclude that complexion effect should be related to the
anomalous σ-G-1/2 branching in this system.
5.7 References
[1] N. Petch, The cleavage strength of polycrystals, J. Iron Steel Inst. 174 (1953) 25-28.
[2] E. Hall, The deformation and ageing of mild steel: III discussion of results, Proceedings of the
Physical Society. Section B 64(9) (1951) 747.
[3] S.H.C. Park, Y.S. Sato, H. Kokawa, Microstructural evolution and its effect on Hall -Petch
relationship in friction stir welding of thixomolded Mg alloy AZ91D, Journal of Materials Science
38(21) (2003) 4379-4383.
[4] D.J. Abson, J.J. Jonas, The Hall–Petch Relation and High-Temperature Subgrains, Metal
Science Journal 4(1) (1970) 24-28.
[5] N. Ono, R. Nowak, S. Miura, Effect of deformation temperature on Hall–Petch relationship
registered for polycrystalline magnesium, Materials Letters 58(1–2) (2004) 39-43.
[6] P.M. Anderson, C. Li, Hall-Petch relations for multilayered materials, Nanostructured
Materials 5(3) (1995) 349-362.
120
[7] M. Chu, S. Sato, Y. Kobayashi, K. Ando, Damage healing and strengthening behaviour in
intelligent mullite/SiC ceramics, Fatigue & Fracture of Engineering Materials & Structures 18(9)
(1995) 1019-1029.
[8] S.J. Dillon, M.P. Harmer, G.S. Rohrer, The Relative Energies of Normally and Abnormally
Growing Grain Boundaries in Alumina Displaying Different Complexions, Journal of the
American Ceramic Society 93(6) (2010) 1796-1802.
[9] R.W. RICE, Ceramic tensile strength-grain size relations: grain sizes, slopes, and branch
intersections, Journal of Materials Science 32(7) (1997) 1673-1692.
[10] R.W. Davidge, A.G. Evans, The strength of ceramics, Materials Science and Engineering 6(5)
(1970) 281-298.
[11] F. Guiberteau, N.P. Padture, B.R. Lawn, Effect of grain size on Hertzian contact damage in
alumina, Journal of the American Ceramic Society 77(7) (1994) 1825-1831.
[12] Y. He, L. Winnubst, A.J. Burggraaf, H. Verweij, P.G.T. van der Varst, B. de With, Grain-Size
Dependence of Sliding Wear in Tetragonal Zirconia Polycrystals, Journal of the American
Ceramic Society 79(12) (1996) 3090-3096.
[13] R.W. Rice, Effects of environment and temperature on ceramic tensile strength–grain size
relations, Journal of Materials Science 32(12) (1997) 3071-3087.
[14] J.A. Wollmershauser, B.N. Feigelson, E.P. Gorzkowski, C.T. Ellis, R. Goswami, S.B. Qadri, J.G.
Tischler, F.J. Kub, R.K. Everett, An extended hardness limit in bulk nanoceramics, Acta
Materialia 69 (2014) 9-16.
121
[15] C.C. Wu, R.W. Rice, D. Johnson, B.A. Platt, Grain Size Dependence of Wear in Ceramics,
Proceedings of the 9th Annual Conference on Composites and Advanced Ceramic Materials:
Ceramic Engineering and Science Proceedings, John Wiley & Sons, Inc.2008, pp. 995-1011.
[16] S.J. Dillon, M. Tang, W.C. Carter, M.P. Harmer, Complexion: A new concept for kinetic
engineering in materials science, Acta Materialia 55(18) (2007) 6208-6218.
[17] W.C. Johnson, R.L. Coble, A Test of the Second-Phase and Impurity-Segregation Models for
MgO-Enhanced Densification of Sintered Alumina, Journal of the American Ceramic Society
61(3-4) (1978) 110-114.
[18] R.L. Coble, Transparent alumina and method of preparation, in: U.S. Patent (Ed.) 1962.
[19] S.J. Dillon, M.P. Harmer, Relating Grain Boundary Complexion to Grain Boundary Kinetics II:
Silica-Doped Alumina, Journal of the American Ceramic Society 91(7) (2008) 2314-2320.
[20] S.J. Dillon, M.P. Harmer, Demystifying the role of sintering additives with “complexion”,
Journal of the European Ceramic Society 28(7) (2008) 1485-1493.
[21] S.J. Dillon, M.P. Harmer, Multiple grain boundary transitions in ceramics: A case study of
alumina, Acta Materialia 55(15) (2007) 5247-5254.
[22] D.R. Clarke, On the detection of thin intergranular films by electron microscopy,
Ultramicroscopy 4(1) (1979) 33-44.
[23] L.K.V. Lou, T.E. Mitchell, A.H. Heuer, Impurity Phases in Hot-Pressed Si3N4, Journal of the
American Ceramic Society 61(9-10) (1978) 392-396.
122
[24] H.-J. Kleebe, G. Pezzotti, G. Ziegler, Microstructure and Fracture Toughness of Si3N4
Ceramics: Combined Roles of Grain Morphology and Secondary Phase Chemistry, Journal of the
American Ceramic Society 82(7) (1999) 1857-1867.
[25] H.-J. Kleebe, G. Pezzotti, T. NISHIDA, M. RÜ HLE, Role of interface structure on mechanical
properties of fluorine-doped Si3N4-SiC ceramics, Journal of the Ceramic Society of Japan
106(1229) (1998) 17-24.
[26] Z. Pan, T.J. Rupert, Effect of grain boundary character on segregation-induced structural
transitions, Physical Review B 93(13) (2016) 134113.
[27] Z. Pan, T.J. Rupert, Amorphous intergranular films as toughening structural features, Acta
Materialia 89 (2015) 205-214.
[28] P.R. Cantwell, S. Ma, S.A. Bojarski, G.S. Rohrer, M.P. Harmer, Expanding time–temperature-
transformation (TTT) diagrams to interfaces: A new approach for grain boundary engineering,
Acta Materialia 106 (2016) 78-86.
[29] D.E.J. Armstrong, M.E. Rogers, S.G. Roberts, Micromechanical testing of stress corrosion
cracking of individual grain boundaries, Scripta Materialia 61(7) (2009) 741-743.
[30] D. Kupka, Fracture experiments of single grain boundaries in ductile metals, 2013.
[31] M.J. McLean, C.A. Wade, M. Watanabe, R.P. Vinci, Microscale Fracture Toughness of
Bismuth Doped Copper Bicrystals Using Double Edge Notched Microtensile Tests, Experimental
Mechanics 54(4) (2014) 685-688.
123
[32] A.D. Norton, S. Falco, N. Young, J. Severs, R.I. Todd, Microcantilever investigation of
fracture toughness and subcritical crack growth on the scale of the microstructure in Al2O3,
Journal of the European Ceramic Society 35(16) (2015) 4521-4533.
[33] W. Cao, A. Kundu, Z. Yu, M.P. Harmer, R.P. Vinci, Direct correlations between fracture
toughness and grain boundary segregation behavior in ytterbium-doped magnesium aluminate
spinel, Scripta Materialia 69(1) (2013) 81-84.
[34] L. Feng, S.J. Dillon, Cation Lattice Diffusivity in Aliovalent Doped Aluminas, Journal of the
European Ceramic Society Submmitted (2016).
[35] L.F.a.S.J. Dillon, Dopants effect on Cr3+ grain boundary diffusion in doped aluminas,
submitted, Journal of European Ceramics and Society (2016).
[36] D. Systemès, ABAQUS Version 6.14, user documentation, Dassault Systemes, Providence,
RI (2014).
[37] B. Mussler, M.V. Swain, N. Claussen, Dependence of Fracture Toughness of Alumina on
Grain Size and Test Technique, Journal of the American Ceramic Society 65(11) (1982) 566-572.
[38] P.L. Swanson, C.J. Fairbanks, B.R. Lawn, Y.-W. Mai, B.J. Hockey, Crack-Interface Grain
Bridging as a Fracture Resistance I, Mechanism in Ceramics: I, Experimental Study on Alumina,
Journal of the American Ceramic Society 70(4) (1987) 279-289.
[39] A. Carpinteri, Stress-singularity and generalized fracture toughness at the vertex of re-
entrant corners, Engineering Fracture Mechanics 26(1) (1987) 143-155.
[40] A. Seweryn, Brittle fracture criterion for structures with sharp notches, Engineering
Fracture Mechanics 47(5) (1994) 673-681.
124
[41] F.J. Gómez, G.V. Guinea, M. Elices, Failure criteria for linear elastic materials with U-
notches, International Journal of Fracture 141(1) (2006) 99-113.
[42] T. Nishida, Y. Hanaki, G. Pezzotti, Effect of Notch-Root Radius on the Fracture Toughness of
a Fine-Grained Alumina, Journal of the American Ceramic Society 77(2) (1994) 606-608.
[43] M. Iwasa, T. Ueno, R.C. Bradt, Fracture Toughness of Quartz and Sapphire Single Crystals at
Room Temperature, Journal of the Society of Materials Science, Japan 30(337) (1981) 1001-
1004.
[44] M. Iwasa, R. Bradt, Fracture toughness of single-crystal alumina, Advances in ceramics 10
(1984) 767.
[45] G.R. Anstis, P. Chantikul, B.R. Lawn, D.B. Marshall, A Critical Evaluation of Indentation
Techniques for Measuring Fracture Toughness: I, Direct Crack Measurements, Journal of the
American Ceramic Society 64(9) (1981) 533-538.
[46] A.G. Evans, E.A. Charles, Fracture Toughness Determinations by Indentation, Journal of the
American Ceramic Society 59(7-8) (1976) 371-372.
[47] S.A. Bojarski, M. Stuer, Z. Zhao, P. Bowen, G.S. Rohrer, Influence of Y and La Additions on
Grain Growth and the Grain-Boundary Character Distribution of Alumina, Journal of the
American Ceramic Society 97(2) (2014) 622-630.
[48] S.J. Dillon, H. Miller, M.P. Harmer, G.S. Rohrer, Grain boundary plane distributions in
aluminas evolving by normal and abnormal grain growth and displaying different complexions,
International Journal of Materials Research 101(1) (2010) 50-56.
125
[49] W.-Y. Ching, Y.-N. Xu, M. Rühle, Ab-initio Calculation of Yttrium Substitutional Impurities in
alpha-Al2O3, Journal of the American Ceramic Society 80(12) (1997) 3199-3204.
[50] H. Yoshida, Y. Ikuhara, T. Sakuma, High-temperature creep resistance in lanthanoid ion-
doped polycrystalline Al2O3, Philosophical Magazine Letters 79(5) (1999) 249-256.
[51] J. Luo, H. Cheng, K.M. Asl, C.J. Kiely, M.P. Harmer, The Role of a Bilayer Interfacial Phase on
Liquid Metal Embrittlement, Science 333(6050) (2011) 1730-1733.
[52] T. Nishida, T. Shiono, T. Nishikawa, On the fracture toughness of polycrystalline alumina
measured by SEPB method, Journal of the European Ceramic Society 5(6) (1989) 379-383.
[53] I.E. Reimanis, A review of issues in the fracture of interfacial ceramics and ceramic
composites, Materials Science and Engineering: A 237(2) (1997) 159-167.
126
CHAPTER 6
CONCLUSION AND SUGGESTED FUTURE WORK
6.1 Conclusions related to the effects of dopants and complexion transitions on Cr3 +
grain boundary diffusion in alumina
In this work, we have demonstrated that both Mg2+ and Si4+ cation dopants have
negligible effects on lattice and grain boundary diffusion. We also do not observe a
measureable effect of complexion transitions on cation grain boundary diffusion. By comparing
the measured cation grain boundary diffusivities with oxygen grain boundary diffusivities in the
literature, we find that cations diffuse faster than oxygen in both the lattice and grain boundary.
This is in contrast to oxidation experiments where anion and cation grain boundary diffusion
rates are comparable. This effect may be due to the oxygen activity gradient through the oxide
scale. In this case, the concentration of defects mediating anion and cation diffusion varies
significantly across the scale. Simple defect chemistry theory cannot explain the weak aliovalent
dopant effects on lattice diffusivity. We hypothesize that background impurities could
compensate the extrinsic, and that many extrinsic defects are also bound and immobile. The
combination of these two effects can cause the mobile vacancy concentration to be insensitive
to 2+ and 4+ dopant concentrations.
127
6.2 Future work related to the effects of dopants and complexion transitions on Cr3+
grain boundary diffusion in alumina
Further investigations of the binding energies, configurations, and mobilities of extrinsic
defect clusters in doped alumina would provide a more quantitative basis to interpret our
diffusion measurements and may be obtained from a combination of experimental and
computational study. Electron paramagnetic resonance (EPR) or electron spin resonance (ESR)
spectroscopies can be utilized to probe the electronic state of defects. In references [1],[2]and
[3], it has been suggested that dopants are trapped by extrinsic defects, thus solute-defect
clusters with limited mobility are formed in alumina doped by Mg, Ti or Ni. Thermal stability
and mobility energy barriers of solute-defect cluster should be studied by computational
simulation. Recent work using a force field method[4] suggests that Mg2+ solutes are
energetically bound with up to three oxygen vacancies, which result in a significant reduction of
the free mobile oxygen vacancies necessary for mediating diffusion. The migration barrier of an
oxygen vacancy is also found to increase due to the interaction with the nearby Mg2+ solute by
a factor of 2. Moreover, radiation enhanced diffusion experiments can provide quantitative
analysis about bound cluster concentrations. At low temperature, extrinsic defects created by
irradiation dominate over the concentration of thermal equilibrium point defects, and they
increase linearly as function of temperature with fixed implantation dose until the thermal
equilibrium point defects become the dominant extrinsic defect at higher temperature.[5] The
bound solute-defect cluster concentration can be calculated by knowing the extrinsic
concentration created by irradiation and the enhanced diffusivity.
128
6.3 Conclusion related to the effects of dopants and complexion transitions on grain
boundary fracture toughness in alumina
In this part of work, single grain boundary fracture toughness has been evaluated by in-
situ bending experiments in TEM. It has found that both dopants and complexion transitions in
Al2O3 have significant impact on the grain boundary strength. Disordered complexions existing
in silica doped alumina and yttira doped alumina at high temperature result in a weaker grain
boundary than undoped sample, however, yttria doped alumina at lower temperature reveals a
stronger grain boundary due to more ordered complexion. Although many explanations
including maximum grain size, flaw size, or environment factors have been used to explain the
anomalous strength-grain size branching, here our study suggests that the complexion
transitions must be taken into account about the embrittlement at relative large sizes of
aluminas.
6.4 Future work related to the effects of dopants and complexion transitions on grain
boundary fracture toughness in alumina
In this study, we measured the average fracture toughness over a set of grain boundaries.
However, the fracture toughness is anisotropic and depends on the character of each individual
grain boundary. Both lattice misorientation and grain boundary plane orientation can affect
grain boundary energy and cohesion strength.[6] A detailed study about the relationship
between grain boundary anisotropy and grain boundary strength can be done using a
combination of electron backscatter diffraction (EBSD) and artificially fabri cated bicrystals of
known orientations. This would provide more insights into interpreting the distribution of grain
129
boundary strengths that may be necessary to predict bulk fracture toughness. It would also be
useful to gain a better understanding of how the introduction of microstructure, for example
several grain boundaries, introduces a more complex cohesive zone law. Such information
could form the basis for using the single grain boundary data and lattice data as building blocks
for accurate polycrystalline models.
6.5 References
[1] S. Mohapatra, F. Kröger, Defect Structure of α‐Al2O3 Doph with Magnesium, Journal of the
American Ceramic Society 60(3‐4) (1977) 141-148.
[2] S. Mohapatra, F. Kröger, Defect Structure of α‐Al2O3 Doped with Titanium, Journal of the
American Ceramic Society 60(9‐10) (1977) 381-387.
[3] R.P. Penrose, K.W.H. Stevens, The Paramagnetic Resonance from Nickel Fluosilicate,
Proceedings of the Physical Society. Section A 63(1) (1950) 29.
[4] A. Tewari, U. Aschauer, P. Bowen, Atomistic Modeling of Effect of Mg on Oxygen Vacancy
Diffusion in α‐Alumina, Journal of the American Ceramic Society 97(8) (2014) 2596-2601.
[5] R. Johnson, A.N. Orlov, Physics of radiation effects in crystals, Elsevier2012.
[6] G.S. Rohrer, Grain boundary energy anisotropy: a review, Journal of Materials Science 46(18)
(2011) 5881.