The Double Chooz collaboration - Springer2014)086.pdf · uUniversity of Notre Dame, Notre Dame,...
44
JHEP10(2014)086 Published for SISSA by Springer Received: July 18, 2014 Accepted: September 14, 2014 Published: October 14, 2014 Improved measurements of the neutrino mixing angle θ 13 with the Double Chooz detector The Double Chooz collaboration Y. Abe, aa J.C. dos Anjos, e J.C. Barriere, n E. Baussan, v I. Bekman, a M. Bergevin, i T.J.C. Bezerra, y L. Bezrukov, m E. Blucher, f C. Buck, s J. Busenitz, b A. Cabrera, d E. Caden, j L. Camilleri, h R. Carr, h M. Cerrada, g P.-J. Chang, o E. Chauveau, y P. Chimenti, ae A.P. Collin, s E. Conover, f J.M. Conrad, r J.I. Crespo-Anad´ on, g K. Crum, f A.S. Cucoanes, w E. Damon, j J.V. Dawson, d J. Dhooghe, i D. Dietrich, ad Z. Djurcic, c M. Dracos, v M. Elnimr, b A. Etenko, q M. Fallot, w F. von Feilitzsch, ac J. Felde, i,1 S.M. Fernandes, b V. Fischer, n D. Franco, d M. Franke, ac H. Furuta, y I. Gil-Botella, g L. Giot, w M. G¨ oger-Neff, ac L.F.G. Gonzalez, af L. Goodenough, c M.C. Goodman, c C. Grant, i N. Haag, ac T. Hara, p J. Haser, s M. Hofmann, ac G.A. Horton-Smith, o A. Hourlier, d M. Ishitsuka, aa J. Jochum, ad C. Jollet, v F. Kaether, s L.N. Kalousis, ag Y. Kamyshkov, x D.M. Kaplan, l T. Kawasaki, t E. Kemp, af H. de Kerret, d D. Kryn, d M. Kuze, aa,2 T. Lachenmaier, ad C.E. Lane, j T. Lasserre, n,d A. Letourneau, n D. Lhuillier, n H.P. Lima Jr, e M. Lindner, s J.M. L´ opez-Casta˜ no, g J.M. LoSecco, u B. Lubsandorzhiev, m S. Lucht, a J. Maeda, ab,3 C. Mariani, ag J. Maricic, j,4 J. Martino, w T. Matsubara, ab G. Mention, n A. Meregaglia, v T. Miletic, j R. Milincic, j,4 A. Minotti, v Y. Nagasaka, k Y. Nikitenko, m P. Novella, d L. Oberauer, ac M. Obolensky, d A. Onillon, w A. Osborn, x C. Palomares, g I.M. Pepe, e S. Perasso, d P. Pfahler, ac A. Porta, w G. Pronost, w J. Reichenbacher, b B. Reinhold, s,4 M. R¨ ohling, ad R. Roncin, d S. Roth, a B. Rybolt, x Y. Sakamoto, z R. Santorelli, g A.C. Schilithz, e S. Sch¨ onert, ac S. Schoppmann, a M.H. Shaevitz, h R. Sharankova, aa S. Shimojima, ab D. Shrestha, o V. Sibille, n V. Sinev, m M. Skorokhvatov, q E. Smith, j J. Spitz, r A. Stahl, a I. Stancu, b L.F.F. Stokes, ad M. Strait, f A. St¨ uken, a F. Suekane, y S. Sukhotin, q T. Sumiyoshi, ab Y. Sun, b,4 1 Now at Department of Physics, University of Maryland, College Park, Maryland 20742, U.S.A. 2 Corresponding author. 3 Now at Department of Physics, Kobe University, Kobe, 657-8501, Japan. 4 Now at Department of Physics & Astronomy, University of Hawaii at Manoa, Honolulu, Hawaii 96822, U.S.A. Open Access,c The Authors. Article funded by SCOAP 3 . doi:10.1007/JHEP10(2014)086
Transcript of The Double Chooz collaboration - Springer2014)086.pdf · uUniversity of Notre Dame, Notre Dame,...
JHEP10(2014)086
Published for SISSA by Springer
Received: July 18, 2014
Accepted: September 14, 2014
Published: October 14, 2014
Improved measurements of the neutrino mixing angle
θ13 with the Double Chooz detector
The Double Chooz collaborationY. Abe,aa J.C. dos Anjos,e J.C. Barriere,n E. Baussan,v I. Bekman,a M. Bergevin,i
T.J.C. Bezerra,y L. Bezrukov,m E. Blucher,f C. Buck,s J. Busenitz,b A. Cabrera,d
E. Caden,j L. Camilleri,h R. Carr,h M. Cerrada,g P.-J. Chang,o E. Chauveau,y
P. Chimenti,ae A.P. Collin,s E. Conover,f J.M. Conrad,r J.I. Crespo-Anadon,g
K. Crum,f A.S. Cucoanes,w E. Damon,j J.V. Dawson,d J. Dhooghe,i D. Dietrich,ad
Z. Djurcic,c M. Dracos,v M. Elnimr,b A. Etenko,q M. Fallot,w F. von Feilitzsch,ac
J. Felde,i,1 S.M. Fernandes,b V. Fischer,n D. Franco,d M. Franke,ac H. Furuta,y
I. Gil-Botella,g L. Giot,w M. Goger-Neff,ac L.F.G. Gonzalez,af L. Goodenough,c
M.C. Goodman,c C. Grant,i N. Haag,ac T. Hara,p J. Haser,s M. Hofmann,ac
G.A. Horton-Smith,o A. Hourlier,d M. Ishitsuka,aa J. Jochum,ad C. Jollet,v
F. Kaether,s L.N. Kalousis,ag Y. Kamyshkov,x D.M. Kaplan,l T. Kawasaki,t
E. Kemp,af H. de Kerret,d D. Kryn,d M. Kuze,aa,2 T. Lachenmaier,ad C.E. Lane,j
T. Lasserre,n,d A. Letourneau,n D. Lhuillier,n H.P. Lima Jr,e M. Lindner,s
J.M. Lopez-Castano,g J.M. LoSecco,u B. Lubsandorzhiev,m S. Lucht,a J. Maeda,ab,3
C. Mariani,ag J. Maricic,j,4 J. Martino,w T. Matsubara,ab G. Mention,n
A. Meregaglia,v T. Miletic,j R. Milincic,j,4 A. Minotti,v Y. Nagasaka,k Y. Nikitenko,m
P. Novella,d L. Oberauer,ac M. Obolensky,d A. Onillon,w A. Osborn,x C. Palomares,g
I.M. Pepe,e S. Perasso,d P. Pfahler,ac A. Porta,w G. Pronost,w J. Reichenbacher,b
B. Reinhold,s,4 M. Rohling,ad R. Roncin,d S. Roth,a B. Rybolt,x Y. Sakamoto,z
R. Santorelli,g A.C. Schilithz,e S. Schonert,ac S. Schoppmann,a M.H. Shaevitz,h
R. Sharankova,aa S. Shimojima,ab D. Shrestha,o V. Sibille,n V. Sinev,m
M. Skorokhvatov,q E. Smith,j J. Spitz,r A. Stahl,a I. Stancu,b L.F.F. Stokes,ad
M. Strait,f A. Stuken,a F. Suekane,y S. Sukhotin,q T. Sumiyoshi,ab Y. Sun,b,4
1Now at Department of Physics, University of Maryland, College Park, Maryland 20742, U.S.A.2Corresponding author.3Now at Department of Physics, Kobe University, Kobe, 657-8501, Japan.4Now at Department of Physics & Astronomy, University of Hawaii at Manoa, Honolulu, Hawaii 96822,
U.S.A.
Open Access, c© The Authors.
Article funded by SCOAP3.doi:10.1007/JHEP10(2014)086
JHEP10(2014)086
R. Svoboda,i K. Terao,r A. Tonazzo,d H.H. Trinh Thi,ac G. Valdiviesso,e
N. Vassilopoulos,v C. Veyssiere,n M. Vivier,n S. Wagner,s N. Walsh,i H. Watanabe,s
C. Wiebusch,a L. Winslow,r M. Wurm,ad,5 G. Yang,c,l F. Yermiaw and V. Zimmerac
aIII. Physikalisches Institut, RWTH Aachen University, 52056 Aachen, GermanybDepartment of Physics and Astronomy, University of Alabama,
Tuscaloosa, Alabama 35487, U.S.A.cArgonne National Laboratory, Argonne, Illinois 60439, U.S.A.dAstroParticule et Cosmologie, Universite Paris Diderot, CNRS/IN2P3, CEA/IRFU,
Observatoire de Paris, Sorbonne Paris Cite, 75205 Paris Cedex 13, FranceeCentro Brasileiro de Pesquisas Fısicas, Rio de Janeiro, RJ, 22290-180, BrazilfThe Enrico Fermi Institute, The University of Chicago, Chicago, Illinois 60637, U.S.A.gCentro de Investigaciones Energeticas, Medioambientales y Tecnologicas, CIEMAT,
28040, Madrid, SpainhColumbia University, New York, New York 10027, U.S.A.iUniversity of California, Davis, California 95616, U.S.A.jDepartment of Physics, Drexel University, Philadelphia, Pennsylvania 19104, U.S.A.kHiroshima Institute of Technology, Hiroshima, 731-5193, JapanlDepartment of Physics, Illinois Institute of Technology, Chicago, Illinois 60616, U.S.A.mInstitute of Nuclear Research of the Russian Academy of Sciences, Moscow 117312, RussianCommissariat a l’Energie Atomique et aux Energies Alternatives, Centre de Saclay, IRFU,
91191 Gif-sur-Yvette, FranceoDepartment of Physics, Kansas State University, Manhattan, Kansas 66506, U.S.A.pDepartment of Physics, Kobe University, Kobe, 657-8501, JapanqNRC Kurchatov Institute, 123182 Moscow, RussiarMassachusetts Institute of Technology, Cambridge, Massachusetts 02139, U.S.A.sMax-Planck-Institut fur Kernphysik, 69117 Heidelberg, GermanytDepartment of Physics, Niigata University, Niigata, 950-2181, JapanuUniversity of Notre Dame, Notre Dame, Indiana 46556, U.S.A.vIPHC, Universite de Strasbourg, CNRS/IN2P3, 67037 Strasbourg, FrancewSUBATECH, CNRS/IN2P3, Universite de Nantes, Ecole des Mines de Nantes,
44307 Nantes, FrancexDepartment of Physics and Astronomy, University of Tennessee,
Knoxville, Tennessee 37996, U.S.A.yResearch Center for Neutrino Science, Tohoku University, Sendai 980-8578, JapanzTohoku Gakuin University, Sendai, 981-3193, JapanaaDepartment of Physics, Tokyo Institute of Technology, Tokyo, 152-8551, JapanabDepartment of Physics, Tokyo Metropolitan University, Tokyo, 192-0397, JapanacPhysik Department, Technische Universitat Munchen, 85748 Garching, GermanyadKepler Center for Astro and Particle Physics, Universitat Tubingen, 72076 Tubingen, GermanyaeUniversidade Federal do ABC, UFABC, Santo Andre, SP, 09210-580, BrazilafUniversidade Estadual de Campinas-UNICAMP, Campinas, SP, 13083-970, BrazilagCenter for Neutrino Physics, Virginia Tech, Blacksburg, Virginia 24061, U.S.A.
E-mail: [email protected]
5Now at Institut fur Physik and Excellence Cluster PRISMA, Johannes Gutenberg-Universitat Mainz,
55128 Mainz, Germany.
JHEP10(2014)086
Abstract: The Double Chooz experiment presents improved measurements of the neu-
trino mixing angle θ13 using the data collected in 467.90 live days from a detector positioned
at an average distance of 1050 m from two reactor cores at the Chooz nuclear power plant.
Several novel techniques have been developed to achieve significant reductions of the back-
grounds and systematic uncertainties with respect to previous publications, whereas the
efficiency of the νe signal has increased. The value of θ13 is measured to be sin2 2θ13 =
0.090+0.032−0.029 from a fit to the observed energy spectrum. Deviations from the reactor νe
prediction observed above a prompt signal energy of 4 MeV and possible explanations are
also reported. A consistent value of θ13 is obtained from a fit to the observed rate as a func-
tion of the reactor power independently of the spectrum shape and background estimation,
demonstrating the robustness of the θ13 measurement despite the observed distortion.
Keywords: Oscillation, Neutrino Detectors and Telescopes
ArXiv ePrint: 1406.7763
JHEP10(2014)086
Contents
1 Introduction 1
2 Experimental setup 2
2.1 Double Chooz detector 2
2.2 Reactor and detector models 4
2.2.1 Reactor νe prediction 4
2.2.2 Detector simulation 5
3 Event reconstruction 6
3.1 FADC pulse reconstruction 6
3.2 Event vertex reconstruction 6
3.3 Energy reconstruction 7
3.3.1 Linearized PE calibration 7
3.3.2 Uniformity calibration 8
3.3.3 Energy scale calibration 8
3.3.4 Stability calibration 9
3.3.5 Energy non-linearity calibration 10
3.4 Muon track reconstruction 12
4 Neutrino selection 13
4.1 Single event selection 13
4.2 IBD selection 14
4.3 Background reduction 15
5 IBD detection efficiency 17
5.1 Gd fraction 17
5.2 IBD selection efficiency 19
5.2.1 Efficiency measurement by Cf neutron source 19
5.2.2 Efficiency measurement by IBD candidates 19
5.3 Spill-in/out 20
6 Backgrounds 21
6.1 Cosmogenic isotopes 22
6.2 Fast neutrons and stopping muons 23
6.3 Accidental background 25
7 Reactor-off measurement 26
– i –
JHEP10(2014)086
8 Neutrino oscillation analysis 26
8.1 Reactor rate modulation analysis 28
8.2 Rate + shape analysis 30
8.3 Sensitivity with near detector 33
9 Observed spectrum distortion 35
10 Conclusion 37
1 Introduction
In the standard three-flavor framework, the neutrino oscillation probability is determined
by three mixing angles, three mass-squared differences (of which two are independent) and
one CP-violation phase. Among the three mixing angles, θ13 has been measured recently
by νe disappearance in short-baseline experiments [1–5] and νµ → νe appearance in long-
baseline experiments [6, 7]. The other two angles had been measured before,1 while the
mass hierarchy of neutrinos and CP-violation phase are still unknown. The discovery
potential of future projects critically depends on the values of the mixing angles and,
therefore, a precise measurement of θ13 is essential for deep understandings of neutrino
physics expected in the following decades.
According to the current knowledge, one mass-squared difference is much smaller than
the other. This allows us to interpret the experimental data by a simple two-flavor oscilla-
tion scheme in many cases. In the two-flavor scheme, survival probability of νe with energy
Eν (MeV) after traveling a distance of L (m) is expressed as:
P = 1− sin2 2θ13 sin2(1.27 ∆m2
31(eV2)L/Eν). (1.1)
This equation is a good approximation to reactor neutrino oscillation for L less than a few
km, and the matter effect is negligible as well. Therefore, the value of θ13 can be directly
measured from the oscillation amplitude in reactor neutrino oscillation.
Reactor neutrinos are detected by a delayed coincidence technique through the inverse
β-decay (IBD) reaction on protons: νe + p → e+ + n. The positron is observed as the
prompt signal with the energy related to the neutrino energy as: Esignal ' Eν − 0.8 MeV.
The neutron is captured either on Gd or H in liquid scintillator with high efficiency. Gd
captures occur after a mean time of 31.1µs and emit a few γ-rays with a total energy of
8 MeV, which is well above the energy of natural radioactivity and easily distinguishable
from the random coincidence of such background. Double Chooz has developed a new
analysis of νe disappearance measurement using a coincidence with H captures [2], but
these additional captures are not used in the analysis presented in this paper.
Here we report on improved measurements of θ13 using the data collected by the Double
Chooz far detector (FD) in 467.90 live days with 66.5 GW-ton-years of exposure (reactor
1See [8] and 2013 partial update for the 2014 edition.
– 1 –
JHEP10(2014)086
power × detector mass × live time), corresponding to a factor of two more statistics com-
pared to the previous publication [1]. The analysis is based on a new method of energy
reconstruction described in section 3. After the delayed coincidence is required, remaining
backgrounds are mostly induced by cosmic muons, including long-lived cosmogenic iso-
topes, proton recoils by muon-induced spallation neutrons and stopping muons. Several
novel techniques have been developed in the new analysis to suppress such backgrounds
(section 4). In contrast, IBD signal efficiency has increased with the extended signal window
and, together with the newly developed analysis methods, detection systematic uncertain-
ties have been reduced by almost a factor of two with respect to the previous analysis (sec-
tion 5). Remaining backgrounds are estimated by dedicated studies described in section 6
and also directly measured in reactor-off running as shown in section 7. The value of θ13 is
extracted from a fit to the prompt energy spectrum. Additional deviations from the reactor
νe prediction are observed above 4 MeV although the impact on the θ13 measurement is
not significant. A consistent value of θ13 is also obtained by a fit to the observed rates as
a function of reactor power, which provides a complementary measurement independent of
the energy spectrum shape and background estimation. Results of the neutrino oscillation
analyses and investigation of observed spectral distortion are discussed in section 8 and 9.
In the current analysis, with only the far detector, the precision of θ13 measurement is
limited by the systematic uncertainty on the flux prediction. After the cancellation of the
flux and other systematic uncertainties using the near detector (ND), which is currently
under construction, uncertainties on the background should be dominant. Improvements
of the analysis described in this paper are therefore critical to enhance the sensitivity of the
future Double Chooz data taken with the ND. The projected sensitivity is studied based
on the improved analysis in section 8.3.
2 Experimental setup
The Double Chooz far detector is located at an average distance of 1,050 m from the two
reactor cores, in a hill topology with 300 meters water equivalent (m.w.e.) rock overburden
to shield cosmic muons. In this section, we briefly review the detector and the Monte Carlo
simulation. More details are given elsewhere [1].
2.1 Double Chooz detector
Double Chooz has developed a calorimetric liquid scintillator detector made of four con-
centric cylindrical vessels optimized for detection of reactor neutrinos. Figure 1 shows a
schematic view of the Double Chooz detector. The innermost volume, named ν-target
(NT), is filled with 10 m3 Gd-loaded liquid scintillator [9]. NT is surrounded by a 55 cm
thick Gd-free liquid scintillator layer, called the γ-catcher (GC). When neutrons from IBD
interactions are captured on Gd in the NT, γ-rays with a total energy of 8 MeV are emitted.
These γ-rays are detected either by the NT and/or the GC. The GC is further surrounded
by a 105 cm thick non-scintillating mineral oil layer, called the Buffer. The boundaries of
the NT, GC and Buffer are made of transparent acrylic vessels, while the Buffer volume
is surrounded by a steel tank and optically separated from an outer layer described below.
– 2 –
JHEP10(2014)086
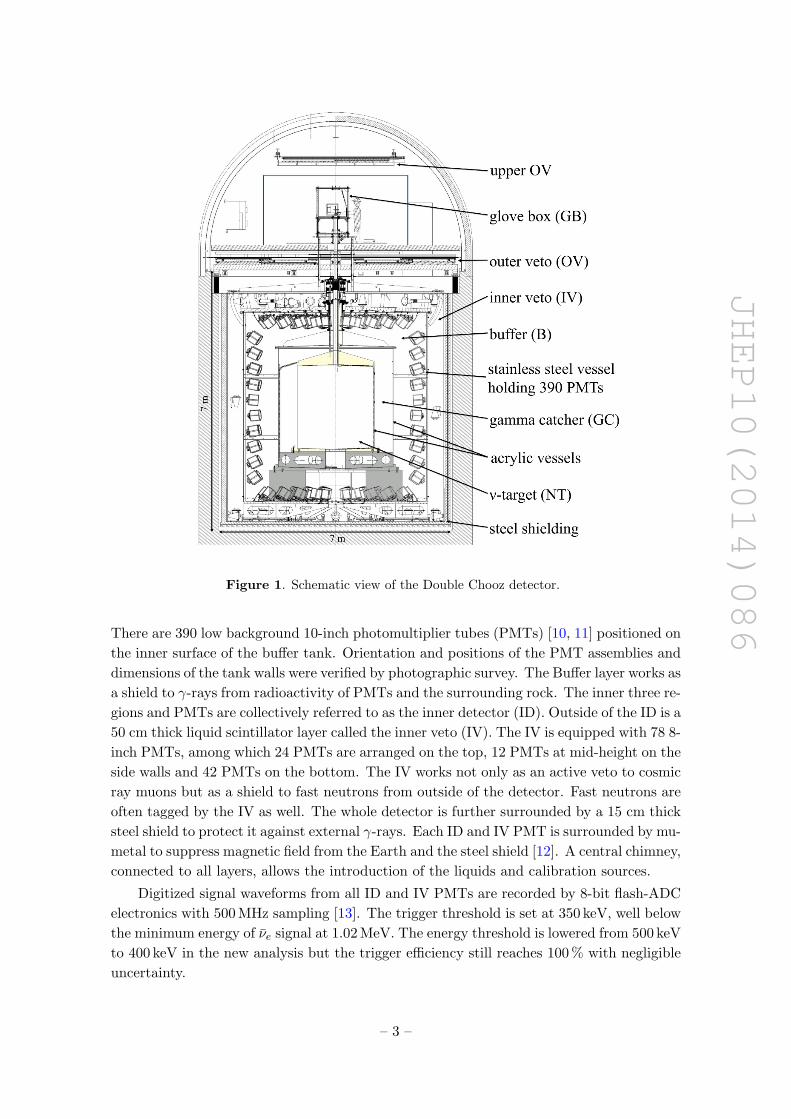
Figure 1. Schematic view of the Double Chooz detector.
There are 390 low background 10-inch photomultiplier tubes (PMTs) [10, 11] positioned on
the inner surface of the buffer tank. Orientation and positions of the PMT assemblies and
dimensions of the tank walls were verified by photographic survey. The Buffer layer works as
a shield to γ-rays from radioactivity of PMTs and the surrounding rock. The inner three re-
gions and PMTs are collectively referred to as the inner detector (ID). Outside of the ID is a
50 cm thick liquid scintillator layer called the inner veto (IV). The IV is equipped with 78 8-
inch PMTs, among which 24 PMTs are arranged on the top, 12 PMTs at mid-height on the
side walls and 42 PMTs on the bottom. The IV works not only as an active veto to cosmic
ray muons but as a shield to fast neutrons from outside of the detector. Fast neutrons are
often tagged by the IV as well. The whole detector is further surrounded by a 15 cm thick
steel shield to protect it against external γ-rays. Each ID and IV PMT is surrounded by mu-
metal to suppress magnetic field from the Earth and the steel shield [12]. A central chimney,
connected to all layers, allows the introduction of the liquids and calibration sources.
Digitized signal waveforms from all ID and IV PMTs are recorded by 8-bit flash-ADC
electronics with 500 MHz sampling [13]. The trigger threshold is set at 350 keV, well below
the minimum energy of νe signal at 1.02 MeV. The energy threshold is lowered from 500 keV
to 400 keV in the new analysis but the trigger efficiency still reaches 100 % with negligible
uncertainty.
– 3 –
JHEP10(2014)086
An outer veto (OV) covers the top of the detector tank. The OV consists of plastic
scintillator strips with cross-section of 5 cm × 1 cm. Two layers with orthogonally oriented
strip directions cover a 13 m × 7 m area except for around the chimney, and another two
layers are mounted above the chimney region. The full OV has been installed for 27.6 %
of the data presented in this paper, while only the lower two layers have been available for
56.7 % including the data taken with reactor off (see section 7). The remaining 15.7 % of
data have been recorded without OV.
Double Chooz developed several calibration systems to suppress systematic uncertain-
ties associated with the detector response. A laser system is used to illuminate ID PMTs
through an optical fiber and diffuser ball deployed inside the NT. The time offset for each
readout channel is measured by the laser system with an uncertainty of 0.15 ns. In addi-
tion, multi-wavelength LED-fiber systems are used to inject light into the ID and IV from a
set of fixed points mounted on the PMT covers. The data with the LED-fiber systems are
taken regularly to measure the characteristics of the readout electronics, i.e. time offset and
gain, and their stability during the operation. Radioisotopes, 68Ge, 137Cs, 60Co and 252Cf
have been deployed in the NT along the vertical symmetry axis and in the GC through a
tube along the boundaries to the NT and Buffer. Among them, 252Cf neutron source is
used to evaluate systematic uncertainties on the detection efficiency of neutron captures
on Gd. In addition to these calibration devices, abundant spallation neutrons captured on
H, Gd and C and Bi-Po decays from radio-impurity in the liquid scintillator are used for
various calibration purposes. These events are distributed over the detector volume and
constantly observed during data taking, and therefore suitable for extracting corrections
for the time stability and position dependence of the energy scale.
2.2 Reactor and detector models
Expectation of reactor νe events in the Double Chooz detector is calculated by a Monte
Carlo (MC) simulation. The MC has two constituents: IBD interaction of reactor νe in
the detector and simulation of the detector response. Neutrino oscillation is studied by
comparing the observed IBD candidates with the prediction from the MC. In addition,
MC data with radioactive sources are generated and used to evaluate the systematic un-
certainties on the energy scale and detection efficiency. However, the background rate and
energy spectrum are estimated with the data and the MC is used only for validation.
2.2.1 Reactor νe prediction
Double Chooz observes νe from the two reactor cores at Chooz nuclear power plant operated
by Electricite de France (EDF), both with 4.25 GWth thermal power. The instantaneous
thermal power of each reactor core is provided by EDF with time steps of < 1 minute with
an uncertainty of 0.5 % at the full reactor power. νe’s are produced in nuclear reactors
by the β-decay of fission products, in which more than 99.7 % of fissions originate from
four isotopes, 235U, 239Pu, 238U, and 241Pu. The reference νe spectra are derived for 235U,239Pu and 241Pu from fits to their β spectrum measured at the ILL research reactor [14–16]
considering the allowed transitions. It was highlighted that contribution of the forbidden
– 4 –
JHEP10(2014)086
Source Uncertainty (%)
Bugey4 measurement 1.4
Fractional fission rate of each isotope 0.8
Thermal power 0.5
IBD cross-section 0.2
Mean energy released per fission 0.2
Distance to reactor core < 0.1
Total 1.7
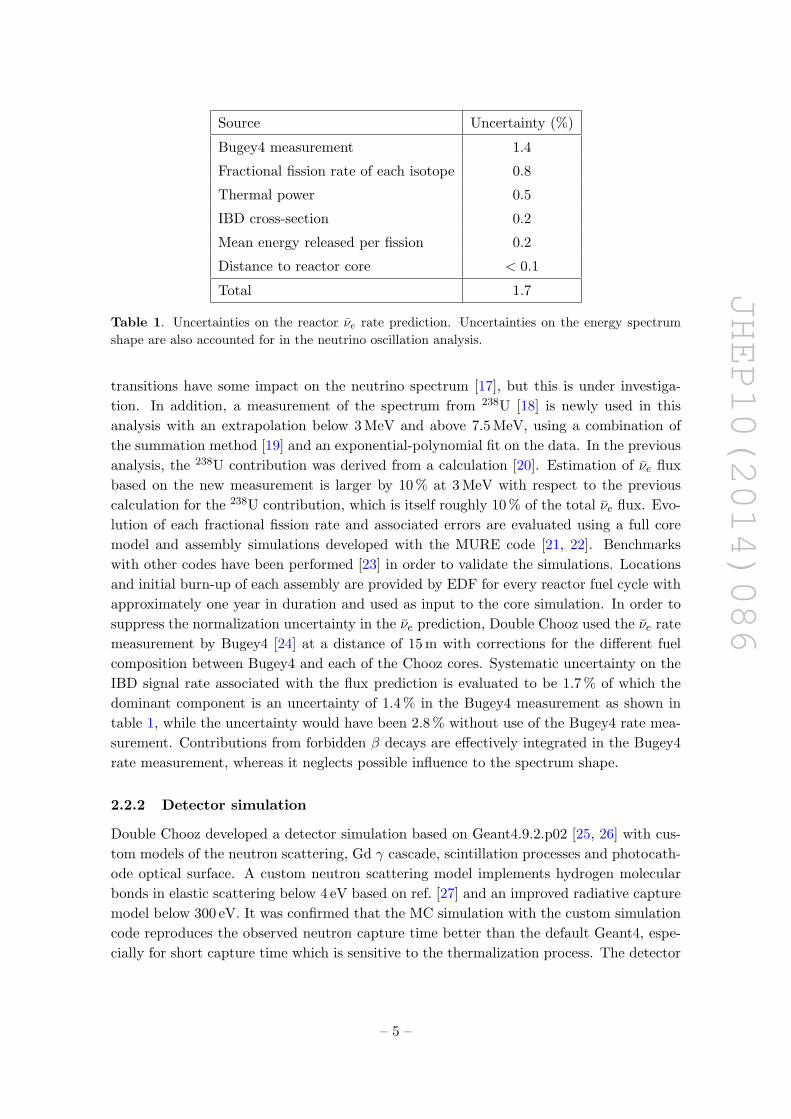
Table 1. Uncertainties on the reactor νe rate prediction. Uncertainties on the energy spectrum
shape are also accounted for in the neutrino oscillation analysis.
transitions have some impact on the neutrino spectrum [17], but this is under investiga-
tion. In addition, a measurement of the spectrum from 238U [18] is newly used in this
analysis with an extrapolation below 3 MeV and above 7.5 MeV, using a combination of
the summation method [19] and an exponential-polynomial fit on the data. In the previous
analysis, the 238U contribution was derived from a calculation [20]. Estimation of νe flux
based on the new measurement is larger by 10 % at 3 MeV with respect to the previous
calculation for the 238U contribution, which is itself roughly 10 % of the total νe flux. Evo-
lution of each fractional fission rate and associated errors are evaluated using a full core
model and assembly simulations developed with the MURE code [21, 22]. Benchmarks
with other codes have been performed [23] in order to validate the simulations. Locations
and initial burn-up of each assembly are provided by EDF for every reactor fuel cycle with
approximately one year in duration and used as input to the core simulation. In order to
suppress the normalization uncertainty in the νe prediction, Double Chooz used the νe rate
measurement by Bugey4 [24] at a distance of 15 m with corrections for the different fuel
composition between Bugey4 and each of the Chooz cores. Systematic uncertainty on the
IBD signal rate associated with the flux prediction is evaluated to be 1.7 % of which the
dominant component is an uncertainty of 1.4 % in the Bugey4 measurement as shown in
table 1, while the uncertainty would have been 2.8 % without use of the Bugey4 rate mea-
surement. Contributions from forbidden β decays are effectively integrated in the Bugey4
rate measurement, whereas it neglects possible influence to the spectrum shape.
2.2.2 Detector simulation
Double Chooz developed a detector simulation based on Geant4.9.2.p02 [25, 26] with cus-
tom models of the neutron scattering, Gd γ cascade, scintillation processes and photocath-
ode optical surface. A custom neutron scattering model implements hydrogen molecular
bonds in elastic scattering below 4 eV based on ref. [27] and an improved radiative capture
model below 300 eV. It was confirmed that the MC simulation with the custom simulation
code reproduces the observed neutron capture time better than the default Geant4, espe-
cially for short capture time which is sensitive to the thermalization process. The detector
– 5 –
JHEP10(2014)086
geometry is implemented in the simulation including the acrylic and steel vessels, support
structure, PMTs and mu-metal shields. Optical parameters of liquids including the light
yield of NT and GC liquid scintillators, photoemission time probabilities, light attenuation
and ionization quenching treatments are based on lab measurements.
Double Chooz also developed a custom readout simulation, which accounts for the
response of the full readout system including the PMT, front-end electronics, flash-ADC,
trigger system and data acquisition. The simulation implements a probability distribution
function to empirically characterize the response to each single photoelectron (p.e.) based
on measurements. Single p.e.’s are accumulated to produce the waveform signal for each
PMT, and the waveform is digitized by the flash-ADC conversion with a 2 ns time bin.
Channel-to-channel variations of the readout response such as gains, baselines and noise are
taken into account to accurately predict resolution effects. Reactor νe events are generated
over the detector volume by the full MC simulation and compared with the data.
3 Event reconstruction
3.1 FADC pulse reconstruction
Event reconstruction starts from pulse reconstruction, which extracts the signal charge
and time for each PMT from the digitized waveform recorded by the flash-ADC. Periodic
triggers are taken with a rate of 1 Hz for the full readout time window (256 ns) in order to
compute the mean ADC counts of the baseline, Bmean, and its fluctuation as RMS, Brms, for
each readout channel. The integrated charge is defined as the sum of ADC counts during
the integration time window after Bmean is subtracted. The length of the integration time
window (112 ns) is chosen to optimize the charge resolution of single p.e. signal, energy
resolution and charge integration efficiency. The start time of the integration time window
is determined to maximize the integrated charge for each channel for each event. For events
depositing up to a few MeV in the NT, most PMTs detect only one p.e., which typically has
an amplitude of about 6 ADC counts. In order to discriminate against noise fluctuations
in the absence of an actual p.e. signal, the following conditions are required: ≥ 2 ADC
counts in the maximum bin and q > Brms ×√Ns where q is the integrated charge and Ns
is the number of samples in the integration window (56 for a 112 ns window). Charge and
time in the MC simulation are extracted from digitized waveforms given by the readout
simulation following the same procedure as that for data.
3.2 Event vertex reconstruction
The vertex position of each event is reconstructed based on a maximum likelihood algorithm
using charge and time, assuming the event to be a point-like light source. The event
likelihood is defined as:
L(X) =∏qi=0
fq(0; q′i)∏qi>0
fq(qi; q′i)ft(ti; t
′i, q′i), (3.1)
where qi and ti are the observed charge and time for the i-th readout channel, respec-
tively. q′i and t′i are the expected charge and time for each channel from a point-like
– 6 –
JHEP10(2014)086
light source with the position, time and light intensity per unit solid angle (Φ) given by
X = (x, y, z, t,Φ). fq and ft are the probability to measure the charge and time given the
predictions. The best possible set of X is found by maximizing L(X), which is equivalent
to minimizing the negative log-likelihood function:
FV = − lnL(X). (3.2)
Effective light attenuation and PMT angular response used in the event vertex recon-
struction are tuned using source calibration data, and the charge and time likelihoods are
extracted from laser calibration data. Both the performance of the event vertex recon-
struction and agreement between the data and MC are improved with the tuning.
3.3 Energy reconstruction
Visible energy, Evis, is reconstructed from the total number of photoelectrons, Npe, as:
Evis = Npe × fdatau (ρ, z)× fdata
MeV × fs(E0vis, t) for the data (3.3)
and
Evis = Npe × fMCu (ρ, z)× fMC
MeV × fnl(E0vis) for the MC. (3.4)
The parameters ρ and z represent the vertex position in the detector coordinate with ρ
the radial distance from the central vertical axis and z the vertical coordinate and t is
the event time (elapsed days). Corrections for the uniformity (fu), absolute energy scale
(fMeV), time stability (fs) and non-linearity (fnl) are applied to get the final visible energy.
E0vis represents the energy after applying the uniformity correction, which is subsequently
subject to the energy-dependent corrections for the stability and non-linearity. Visible en-
ergy from the MC simulation is obtained following the same procedure as that for the data,
although the stability correction is applied only to the data and the non-linearity correction
is applied only to the MC. Each correction is explained in the following subsections.
3.3.1 Linearized PE calibration
The total number of photoelectrons is given as Npe =∑
i qi/gmi (qi, t) where i refers to each
readout channel and m refers to either data or MC. qi is the integrated charge by the pulse
reconstruction and gmi is a charge-to-p.e. conversion factor (referred to as gain) extracted
by calibration taking into account the variation in the course of the data taking (elapsed
days, t) and charge dependence, i.e. gain non-linearity. Due to limited sampling of the
waveform digitizer, the baseline estimation can be biased within ±1 ADC count, which
results in a gain non-linearity especially below a few photoelectrons [28]. Gain is measured
using the data taken with a constant light yield provided by the LED-fiber calibration
systems, as gi = α×σ2i /µi, where µi and σi are the mean and standard deviation (RMS) of
the observed charge distribution. The parameter α is used to correct for the intrinsic spread
in σi due to single p.e. width and electronic noise. It is considered to be constant for all
readout channels and is chosen by making the number of photoelectrons in the H capture
of spallation neutrons equal to the hit PMT multiplicity (n). Non-single p.e. contributions
are taken into account using Poisson statistics as: n = −NPMT ln (1−Nhits/NPMT), where
– 7 –
JHEP10(2014)086
Charge (Arbitrary Unit)
0 100 200 300 400 500 600
Ga
in (
Arb
itra
ry U
nit /
p.e
.)
70
75
80
85
90
95
100
105
110
115
120
Measured gain
Bestfit gain function
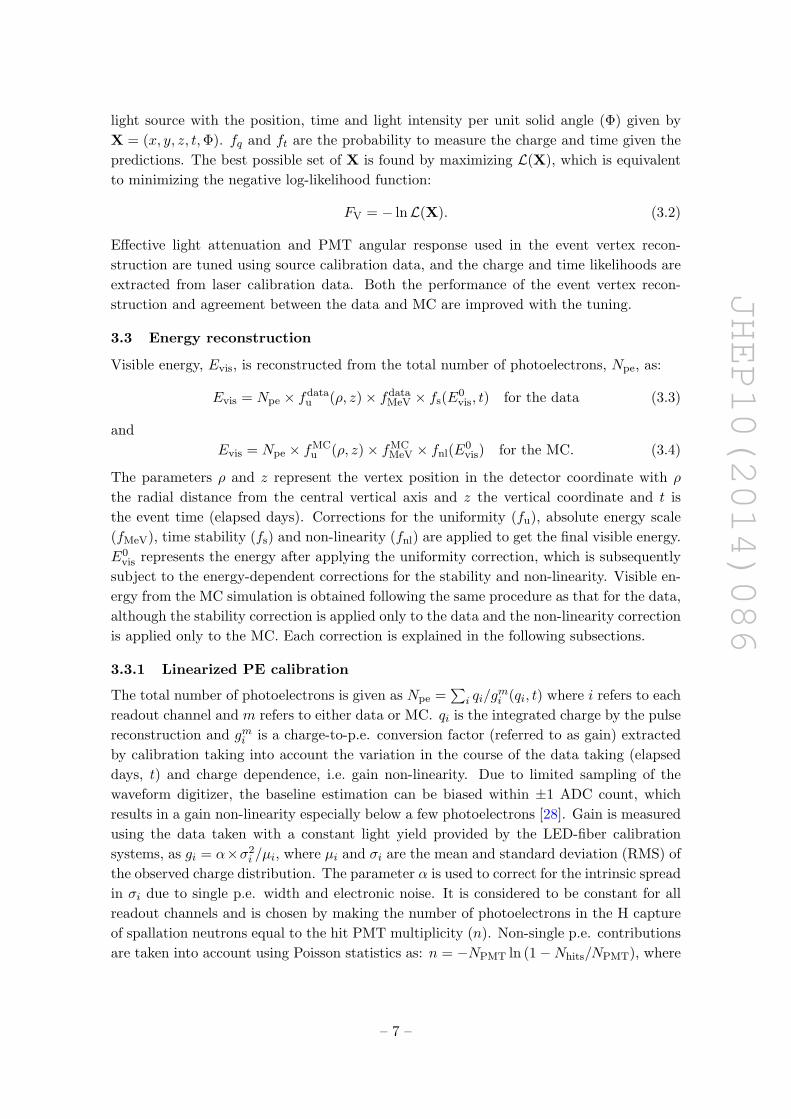
Figure 2. Gain as a function of integrated charge for a typical readout channel. Points show
the measurements and the line shows the gain function obtained from a fit with three parameters
explained in the text.
NPMT and Nhits are the number of all PMTs and hit PMTs, respectively. Calibration
data are taken with different light intensities and light injection positions to measure the
gain non-linearity of all channels. Figure 2 shows the measured gain as a function of
integrated charge for a typical readout channel, overlaid with the gain correction function
characterized by three parameters: constant gain at high charge, non-linearity slope at low
charge and the transition point. Since the gain and its non-linearity change after power
cycles of the readout electronics, the gain is measured upon each power-cycle period. Time
dependence during each power-cycle period is further corrected using natural calibration
sources as described in a later section.
3.3.2 Uniformity calibration
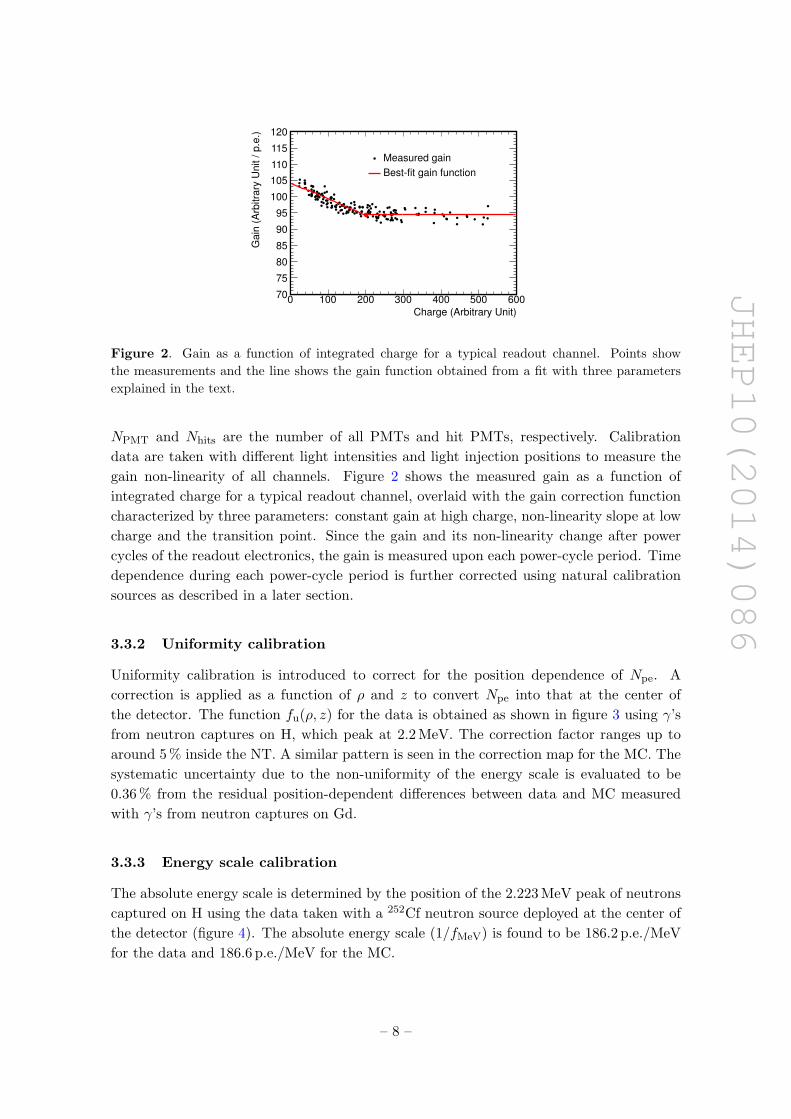
Uniformity calibration is introduced to correct for the position dependence of Npe. A
correction is applied as a function of ρ and z to convert Npe into that at the center of
the detector. The function fu(ρ, z) for the data is obtained as shown in figure 3 using γ’s
from neutron captures on H, which peak at 2.2 MeV. The correction factor ranges up to
around 5 % inside the NT. A similar pattern is seen in the correction map for the MC. The
systematic uncertainty due to the non-uniformity of the energy scale is evaluated to be
0.36 % from the residual position-dependent differences between data and MC measured
with γ’s from neutron captures on Gd.
3.3.3 Energy scale calibration
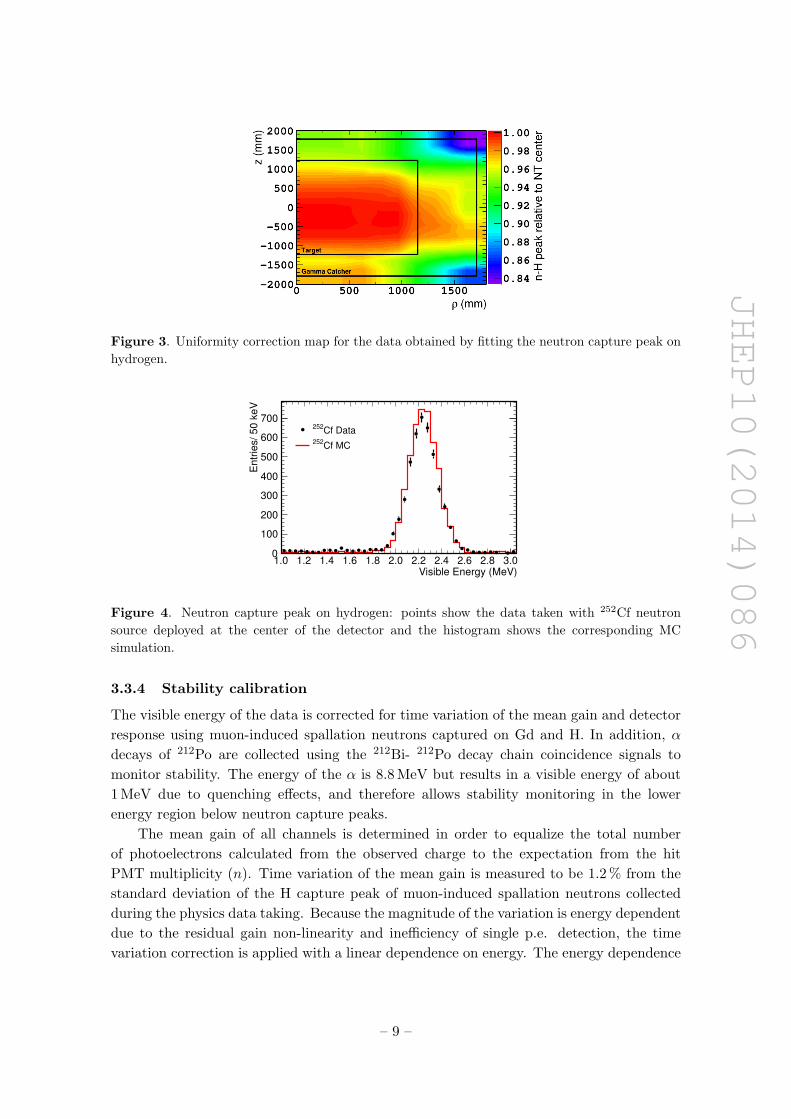
The absolute energy scale is determined by the position of the 2.223 MeV peak of neutrons
captured on H using the data taken with a 252Cf neutron source deployed at the center of
the detector (figure 4). The absolute energy scale (1/fMeV) is found to be 186.2 p.e./MeV
for the data and 186.6 p.e./MeV for the MC.
– 8 –
JHEP10(2014)086
Figure 3. Uniformity correction map for the data obtained by fitting the neutron capture peak on
hydrogen.
Visible Energy (MeV)1.0 1.2 1.4 1.6 1.8 2.0 2.2 2.4 2.6 2.8 3.0
En
trie
s/
50
ke
V
0
100
200
300
400
500
600
700Cf Data
252
Cf MC252
Figure 4. Neutron capture peak on hydrogen: points show the data taken with 252Cf neutron
source deployed at the center of the detector and the histogram shows the corresponding MC
simulation.
3.3.4 Stability calibration
The visible energy of the data is corrected for time variation of the mean gain and detector
response using muon-induced spallation neutrons captured on Gd and H. In addition, α
decays of 212Po are collected using the 212Bi- 212Po decay chain coincidence signals to
monitor stability. The energy of the α is 8.8 MeV but results in a visible energy of about
1 MeV due to quenching effects, and therefore allows stability monitoring in the lower
energy region below neutron capture peaks.
The mean gain of all channels is determined in order to equalize the total number
of photoelectrons calculated from the observed charge to the expectation from the hit
PMT multiplicity (n). Time variation of the mean gain is measured to be 1.2 % from the
standard deviation of the H capture peak of muon-induced spallation neutrons collected
during the physics data taking. Because the magnitude of the variation is energy dependent
due to the residual gain non-linearity and inefficiency of single p.e. detection, the time
variation correction is applied with a linear dependence on energy. The energy dependence
– 9 –
JHEP10(2014)086
Elapsed Days0 100 200 300 400 500 600 700
Re
lative
En
erg
y S
ca
le
0.97
0.98
0.99
1.00
1.01
1.02
1.03
1.04
1.05
Po (1 MeV)212 decay of α
nH capture (2.2 MeV)
nGd capture (8 MeV)
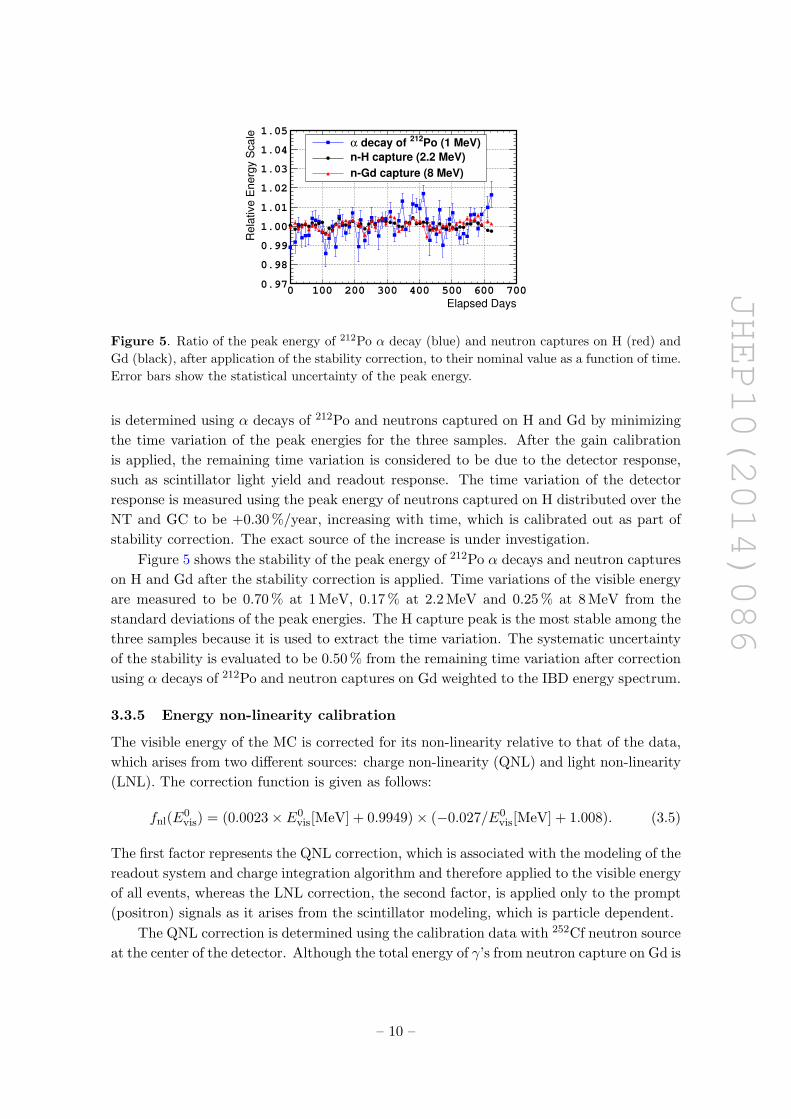
Figure 5. Ratio of the peak energy of 212Po α decay (blue) and neutron captures on H (red) and
Gd (black), after application of the stability correction, to their nominal value as a function of time.
Error bars show the statistical uncertainty of the peak energy.
is determined using α decays of 212Po and neutrons captured on H and Gd by minimizing
the time variation of the peak energies for the three samples. After the gain calibration
is applied, the remaining time variation is considered to be due to the detector response,
such as scintillator light yield and readout response. The time variation of the detector
response is measured using the peak energy of neutrons captured on H distributed over the
NT and GC to be +0.30 %/year, increasing with time, which is calibrated out as part of
stability correction. The exact source of the increase is under investigation.
Figure 5 shows the stability of the peak energy of 212Po α decays and neutron captures
on H and Gd after the stability correction is applied. Time variations of the visible energy
are measured to be 0.70 % at 1 MeV, 0.17 % at 2.2 MeV and 0.25 % at 8 MeV from the
standard deviations of the peak energies. The H capture peak is the most stable among the
three samples because it is used to extract the time variation. The systematic uncertainty
of the stability is evaluated to be 0.50 % from the remaining time variation after correction
using α decays of 212Po and neutron captures on Gd weighted to the IBD energy spectrum.
3.3.5 Energy non-linearity calibration
The visible energy of the MC is corrected for its non-linearity relative to that of the data,
which arises from two different sources: charge non-linearity (QNL) and light non-linearity
(LNL). The correction function is given as follows:
fnl(E0vis) = (0.0023× E0
vis[MeV] + 0.9949)× (−0.027/E0vis[MeV] + 1.008). (3.5)
The first factor represents the QNL correction, which is associated with the modeling of the
readout system and charge integration algorithm and therefore applied to the visible energy
of all events, whereas the LNL correction, the second factor, is applied only to the prompt
(positron) signals as it arises from the scintillator modeling, which is particle dependent.
The QNL correction is determined using the calibration data with 252Cf neutron source
at the center of the detector. Although the total energy of γ’s from neutron capture on Gd is
– 10 –
JHEP10(2014)086
Energy (MeV)γSingle 0.5 1.0 1.5 2.0
MC
/ V
is.
Ed
ata
Vis
ible
En
erg
y
0.985
0.990
0.995
1.000
1.005
1.010
1.015
Data vs. MC before LNL correction
After LNL correction
Cs137
Ge68
Cf)252
H (Co60
Cf)252
Gd (
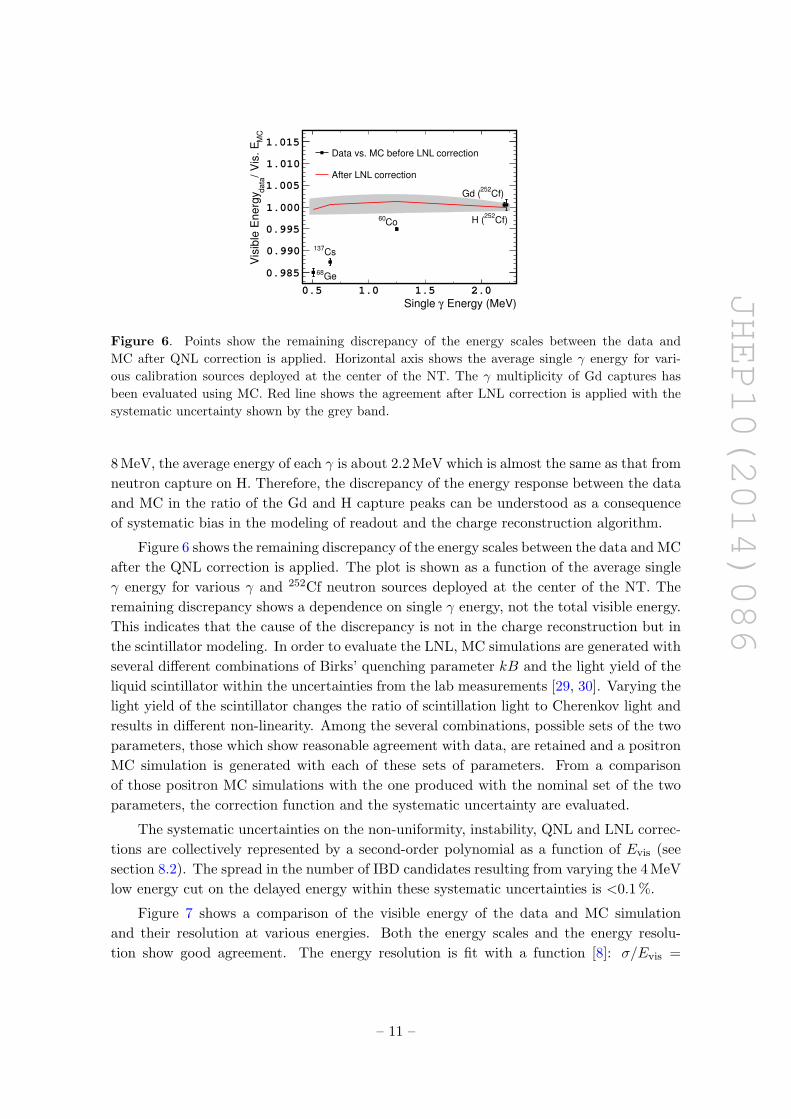
Figure 6. Points show the remaining discrepancy of the energy scales between the data and
MC after QNL correction is applied. Horizontal axis shows the average single γ energy for vari-
ous calibration sources deployed at the center of the NT. The γ multiplicity of Gd captures has
been evaluated using MC. Red line shows the agreement after LNL correction is applied with the
systematic uncertainty shown by the grey band.
8 MeV, the average energy of each γ is about 2.2 MeV which is almost the same as that from
neutron capture on H. Therefore, the discrepancy of the energy response between the data
and MC in the ratio of the Gd and H capture peaks can be understood as a consequence
of systematic bias in the modeling of readout and the charge reconstruction algorithm.
Figure 6 shows the remaining discrepancy of the energy scales between the data and MC
after the QNL correction is applied. The plot is shown as a function of the average single
γ energy for various γ and 252Cf neutron sources deployed at the center of the NT. The
remaining discrepancy shows a dependence on single γ energy, not the total visible energy.
This indicates that the cause of the discrepancy is not in the charge reconstruction but in
the scintillator modeling. In order to evaluate the LNL, MC simulations are generated with
several different combinations of Birks’ quenching parameter kB and the light yield of the
liquid scintillator within the uncertainties from the lab measurements [29, 30]. Varying the
light yield of the scintillator changes the ratio of scintillation light to Cherenkov light and
results in different non-linearity. Among the several combinations, possible sets of the two
parameters, those which show reasonable agreement with data, are retained and a positron
MC simulation is generated with each of these sets of parameters. From a comparison
of those positron MC simulations with the one produced with the nominal set of the two
parameters, the correction function and the systematic uncertainty are evaluated.
The systematic uncertainties on the non-uniformity, instability, QNL and LNL correc-
tions are collectively represented by a second-order polynomial as a function of Evis (see
section 8.2). The spread in the number of IBD candidates resulting from varying the 4 MeV
low energy cut on the delayed energy within these systematic uncertainties is <0.1 %.
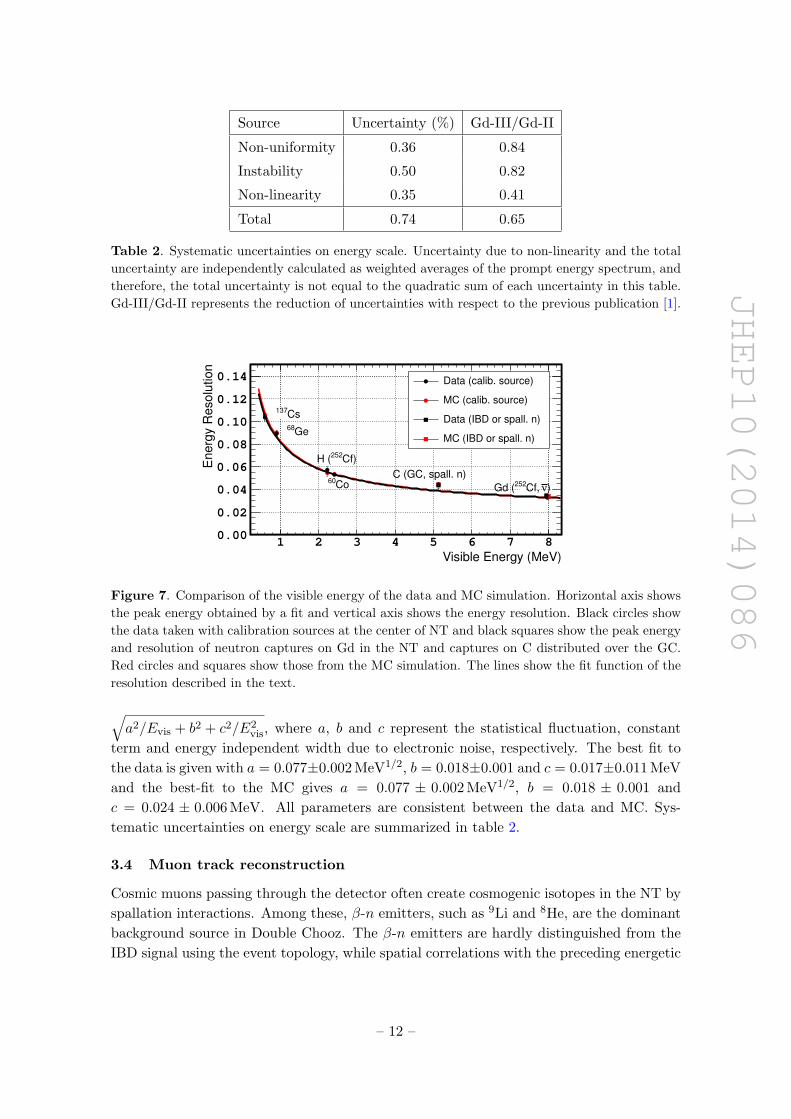
Figure 7 shows a comparison of the visible energy of the data and MC simulation
and their resolution at various energies. Both the energy scales and the energy resolu-
tion show good agreement. The energy resolution is fit with a function [8]: σ/Evis =
– 11 –
JHEP10(2014)086
Source Uncertainty (%) Gd-III/Gd-II
Non-uniformity 0.36 0.84
Instability 0.50 0.82
Non-linearity 0.35 0.41
Total 0.74 0.65
Table 2. Systematic uncertainties on energy scale. Uncertainty due to non-linearity and the total
uncertainty are independently calculated as weighted averages of the prompt energy spectrum, and
therefore, the total uncertainty is not equal to the quadratic sum of each uncertainty in this table.
Gd-III/Gd-II represents the reduction of uncertainties with respect to the previous publication [1].
Visible Energy (MeV)
1 2 3 4 5 6 7 8
En
erg
y R
eso
lutio
n
0.00
0.02
0.04
0.06
0.08
0.10
0.12
0.14
Cs137
Ge68
Cf)252H (
Co60)νCf, 252Gd (
C (GC, spall. n)
Data (calib. source)
MC (calib. source)
Data (IBD or spall. n)
MC (IBD or spall. n)
Figure 7. Comparison of the visible energy of the data and MC simulation. Horizontal axis shows
the peak energy obtained by a fit and vertical axis shows the energy resolution. Black circles show
the data taken with calibration sources at the center of NT and black squares show the peak energy
and resolution of neutron captures on Gd in the NT and captures on C distributed over the GC.
Red circles and squares show those from the MC simulation. The lines show the fit function of the
resolution described in the text.
√a2/Evis + b2 + c2/E2
vis, where a, b and c represent the statistical fluctuation, constant
term and energy independent width due to electronic noise, respectively. The best fit to
the data is given with a = 0.077±0.002 MeV1/2, b = 0.018±0.001 and c = 0.017±0.011 MeV
and the best-fit to the MC gives a = 0.077 ± 0.002 MeV1/2, b = 0.018 ± 0.001 and
c = 0.024 ± 0.006 MeV. All parameters are consistent between the data and MC. Sys-
tematic uncertainties on energy scale are summarized in table 2.
3.4 Muon track reconstruction
Cosmic muons passing through the detector often create cosmogenic isotopes in the NT by
spallation interactions. Among these, β-n emitters, such as 9Li and 8He, are the dominant
background source in Double Chooz. The β-n emitters are hardly distinguished from the
IBD signal using the event topology, while spatial correlations with the preceding energetic
– 12 –
JHEP10(2014)086
muons are used to preferentially identify the candidates. Two muon tracking algorithms are
used in the analysis. One utilizes the spatial pattern of the PMT hit times in the ID, which
was used in the previous publications, and also used this time to evaluate the 9Li and 8He
background rates (see section 6.1). In addition, a new algorithm has been developed using
full detector information, that is the ID, IV and OV (details are found in ref. [31]). This
new algorithm is employed in the calculation of the 9Li likelihood, which is used to suppress
the background (see section 4.3) and also to measure the 9Li+8He energy spectrum.
4 Neutrino selection
In Double Chooz, events are recorded at a trigger rate exceeding 150 Hz while the expected
reactor νe signal rate is approximately 50 events/day. Therefore, effective event selection
is required to select IBD signal from the large amount of background. Background from
random singles is largely suppressed by requiring time and space correlations between the
two triggers. Correlated backgrounds, mostly induced by cosmic muons, is suppressed
using their characteristic features. Stopping muons are mostly identified by the IV and
OV, but often enter from the chimney where the IV is not sensitive. Such events, with the
vertex position inside the chimney, have a different hit PMT pattern from IBD signal in
the NT due to different acceptance. Fast neutrons often leave energy deposits in the IV
and can be distinguished from IBD signal. Cosmogenic isotopes, such as 9Li and 8He, have
the same event topology as the IBD signal but can be suppressed using the correlations
with the parent muons. More details of each background are described in section 6, while
the selection criteria for the IBD signal are explained in this section.
4.1 Single event selection
As the first step of neutrino selection, primary cuts are applied. Events with a visible
energy below 0.4 MeV are rejected. An event is tagged as a muon and rejected if it satisfies
Evis > 20 MeV or EIV > 16 MeV, where EIV is the energy deposited in the IV. In addition,
events following a muon within a 1 ms time window are also rejected as these events are
mostly background induced by spallation neutrons and cosmogenic isotopes. Inefficiency
due to muon veto is 4.49 % with uncertainty of <0.01 %.
Events which satisfy at least one of the following criteria are discarded as light noise,
a known background caused by a spontaneous light emission from some PMT bases: 1)
qmax/qtot > 0.12, where qmax and qtot are the maximum charge recorded by a PMT and
the total charge in the event, respectively; 2) σt > 36 ns and σq > (464− 8σt) CU (charge
unit), where σt and σq are the standard deviation of the PMTs hit time and integrated
charge distributions, respectively; 3) Qdev > 3× 10⁴ CU where Qdev is defined as: Qdev =
1/N ×∑N
i (qmax − qi)2/qi, where N is the number of PMTs within a sphere of 1 m radius
centered at the PMT with maximum charge. The first criterion was used in the previous
publication but the cut condition is relaxed to minimize inefficiency of the IBD signals at
low energy. Criteria 2) and 3) are new cuts introduced for this analysis. A one-dimensional
cut on σt in the previous analysis is replaced by a two-dimensional cut on σt and σq,
resulting in an improved rejection performance despite the looser cut on σt for low energy
– 13 –
JHEP10(2014)086
Visible Energy (MeV)2 4 6 8 10 12 14 16 18 20
En
trie
s /
25
ke
V
210
310
410
510
610
710 Before light noise cut
After light noise cut
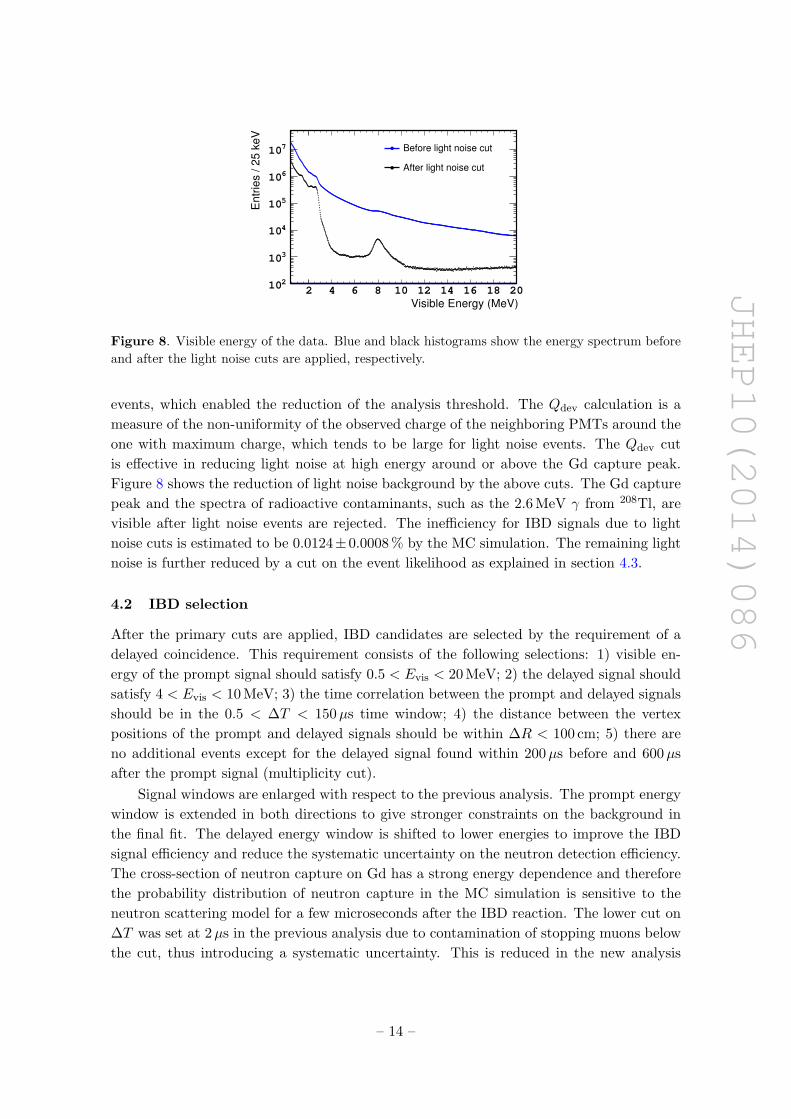
Figure 8. Visible energy of the data. Blue and black histograms show the energy spectrum before
and after the light noise cuts are applied, respectively.
events, which enabled the reduction of the analysis threshold. The Qdev calculation is a
measure of the non-uniformity of the observed charge of the neighboring PMTs around the
one with maximum charge, which tends to be large for light noise events. The Qdev cut
is effective in reducing light noise at high energy around or above the Gd capture peak.
Figure 8 shows the reduction of light noise background by the above cuts. The Gd capture
peak and the spectra of radioactive contaminants, such as the 2.6 MeV γ from 208Tl, are
visible after light noise events are rejected. The inefficiency for IBD signals due to light
noise cuts is estimated to be 0.0124±0.0008 % by the MC simulation. The remaining light
noise is further reduced by a cut on the event likelihood as explained in section 4.3.
4.2 IBD selection
After the primary cuts are applied, IBD candidates are selected by the requirement of a
delayed coincidence. This requirement consists of the following selections: 1) visible en-
ergy of the prompt signal should satisfy 0.5 < Evis < 20 MeV; 2) the delayed signal should
satisfy 4 < Evis < 10 MeV; 3) the time correlation between the prompt and delayed signals
should be in the 0.5 < ∆T < 150µs time window; 4) the distance between the vertex
positions of the prompt and delayed signals should be within ∆R < 100 cm; 5) there are
no additional events except for the delayed signal found within 200µs before and 600µs
after the prompt signal (multiplicity cut).
Signal windows are enlarged with respect to the previous analysis. The prompt energy
window is extended in both directions to give stronger constraints on the background in
the final fit. The delayed energy window is shifted to lower energies to improve the IBD
signal efficiency and reduce the systematic uncertainty on the neutron detection efficiency.
The cross-section of neutron capture on Gd has a strong energy dependence and therefore
the probability distribution of neutron capture in the MC simulation is sensitive to the
neutron scattering model for a few microseconds after the IBD reaction. The lower cut on
∆T was set at 2µs in the previous analysis due to contamination of stopping muons below
the cut, thus introducing a systematic uncertainty. This is reduced in the new analysis
– 14 –
JHEP10(2014)086
Correlation Distance (m)0.0 0.5 1.0 1.5 2.0 2.5 3.0 3.5 4.0 4.5 5.0
)/5
cm
1R
ate
(d
ay
310
210
110
1
10Data
IBD signal MC
Accidentals
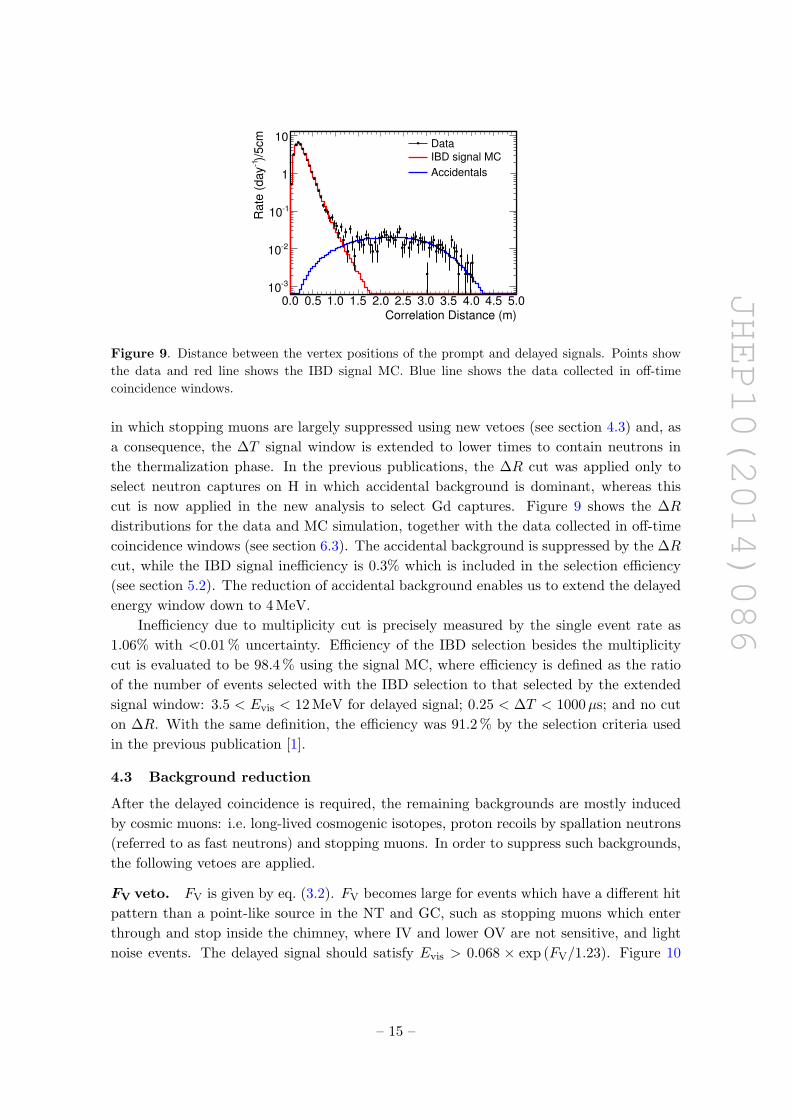
Figure 9. Distance between the vertex positions of the prompt and delayed signals. Points show
the data and red line shows the IBD signal MC. Blue line shows the data collected in off-time
coincidence windows.
in which stopping muons are largely suppressed using new vetoes (see section 4.3) and, as
a consequence, the ∆T signal window is extended to lower times to contain neutrons in
the thermalization phase. In the previous publications, the ∆R cut was applied only to
select neutron captures on H in which accidental background is dominant, whereas this
cut is now applied in the new analysis to select Gd captures. Figure 9 shows the ∆R
distributions for the data and MC simulation, together with the data collected in off-time
coincidence windows (see section 6.3). The accidental background is suppressed by the ∆R
cut, while the IBD signal inefficiency is 0.3% which is included in the selection efficiency
(see section 5.2). The reduction of accidental background enables us to extend the delayed
energy window down to 4 MeV.
Inefficiency due to multiplicity cut is precisely measured by the single event rate as
1.06% with <0.01 % uncertainty. Efficiency of the IBD selection besides the multiplicity
cut is evaluated to be 98.4 % using the signal MC, where efficiency is defined as the ratio
of the number of events selected with the IBD selection to that selected by the extended
signal window: 3.5 < Evis < 12 MeV for delayed signal; 0.25 < ∆T < 1000µs; and no cut
on ∆R. With the same definition, the efficiency was 91.2 % by the selection criteria used
in the previous publication [1].
4.3 Background reduction
After the delayed coincidence is required, the remaining backgrounds are mostly induced
by cosmic muons: i.e. long-lived cosmogenic isotopes, proton recoils by spallation neutrons
(referred to as fast neutrons) and stopping muons. In order to suppress such backgrounds,
the following vetoes are applied.
FV veto. FV is given by eq. (3.2). FV becomes large for events which have a different hit
pattern than a point-like source in the NT and GC, such as stopping muons which enter
through and stop inside the chimney, where IV and lower OV are not sensitive, and light
noise events. The delayed signal should satisfy Evis > 0.068 × exp (FV/1.23). Figure 10
– 15 –
JHEP10(2014)086
VF4 5 6 7 8 9 10
Vis
ible
En
erg
y (
MeV
)4
5
6
7
8
9
10 Before Fv veto is applied
Rejected by Fv veto
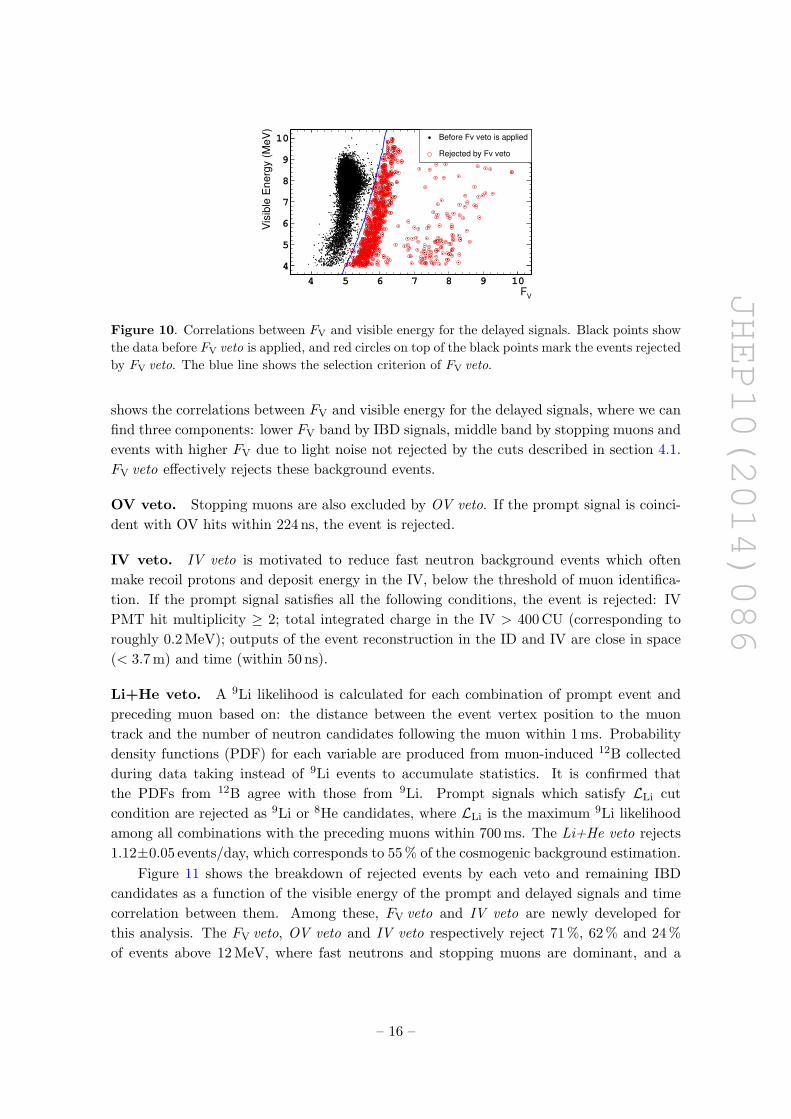
Figure 10. Correlations between FV and visible energy for the delayed signals. Black points show
the data before FV veto is applied, and red circles on top of the black points mark the events rejected
by FV veto. The blue line shows the selection criterion of FV veto.
shows the correlations between FV and visible energy for the delayed signals, where we can
find three components: lower FV band by IBD signals, middle band by stopping muons and
events with higher FV due to light noise not rejected by the cuts described in section 4.1.
FV veto effectively rejects these background events.
OV veto. Stopping muons are also excluded by OV veto. If the prompt signal is coinci-
dent with OV hits within 224 ns, the event is rejected.
IV veto. IV veto is motivated to reduce fast neutron background events which often
make recoil protons and deposit energy in the IV, below the threshold of muon identifica-
tion. If the prompt signal satisfies all the following conditions, the event is rejected: IV
PMT hit multiplicity ≥ 2; total integrated charge in the IV > 400 CU (corresponding to
roughly 0.2 MeV); outputs of the event reconstruction in the ID and IV are close in space
(< 3.7 m) and time (within 50 ns).
Li+He veto. A 9Li likelihood is calculated for each combination of prompt event and
preceding muon based on: the distance between the event vertex position to the muon
track and the number of neutron candidates following the muon within 1 ms. Probability
density functions (PDF) for each variable are produced from muon-induced 12B collected
during data taking instead of 9Li events to accumulate statistics. It is confirmed that
the PDFs from 12B agree with those from 9Li. Prompt signals which satisfy LLi cut
condition are rejected as 9Li or 8He candidates, where LLi is the maximum 9Li likelihood
among all combinations with the preceding muons within 700 ms. The Li+He veto rejects
1.12±0.05 events/day, which corresponds to 55 % of the cosmogenic background estimation.
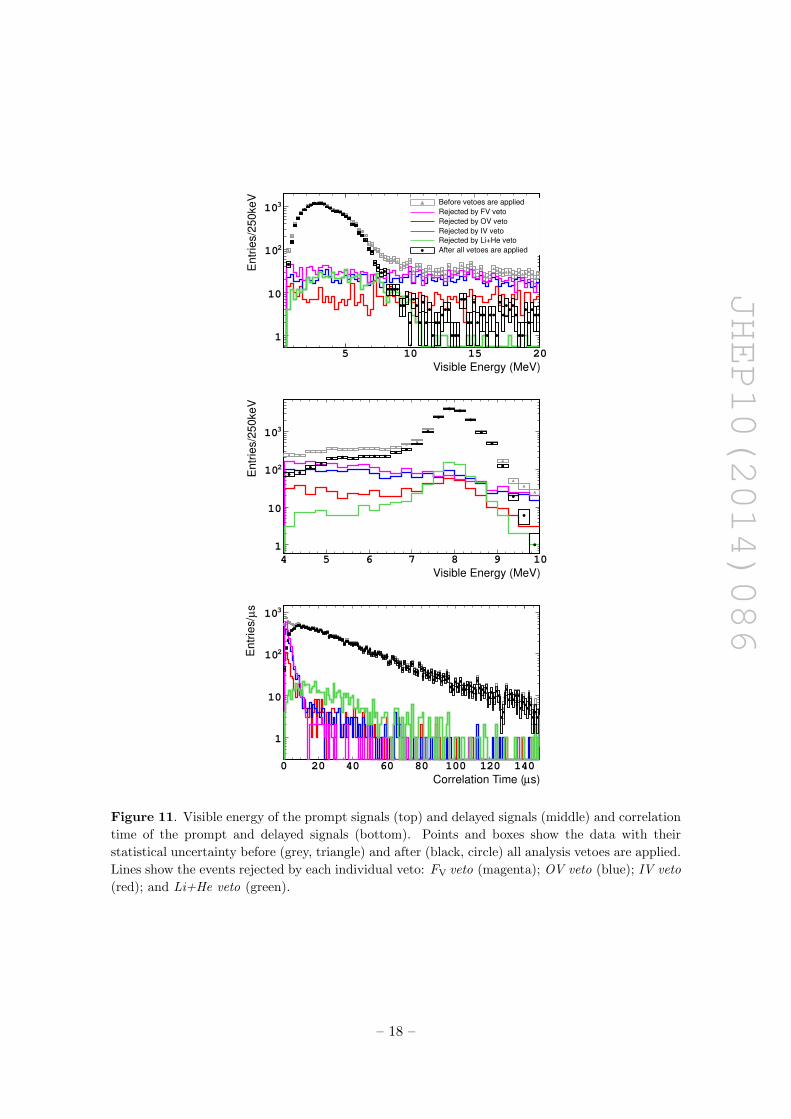
Figure 11 shows the breakdown of rejected events by each veto and remaining IBD
candidates as a function of the visible energy of the prompt and delayed signals and time
correlation between them. Among these, FV veto and IV veto are newly developed for
this analysis. The FV veto, OV veto and IV veto respectively reject 71 %, 62 % and 24 %
of events above 12 MeV, where fast neutrons and stopping muons are dominant, and a
– 16 –
JHEP10(2014)086
combination of the three vetoes rejects 90 % of these high energy events. The inefficiencies
of the IBD signal due to FV veto, OV veto and IV veto are 0.06± 0.11 %, 0.058± 0.001 %
and 0.035±0.014 %, respectively. In the previous analysis, in order to reject 9Li and 8He, a
longer veto interval was applied after energetic muons resulting in an additional 4.8 % dead
time. It is replaced by the likelihood-based cut, for which the inefficiency of IBD signals is
only 0.504±0.018 % for comparable reduction power. The energy spectrum and ∆T of the
rejected events are consistent with 9Li and 8He as shown in figure 11. More details about
the background events are described in section 6.
5 IBD detection efficiency
Double Chooz is taking data with a dead-time-free data acquisition system and the trigger
efficiency reaches 100 % at 500 keV with negligible uncertainty. The detection efficiency of
the prompt signal is determined to be close to 100 %. On the other hand, various physics
issues are involved in the detection of the delayed signal, such as Gd concentration, neutron
scattering models, energy scale and vertex resolution. The systematic uncertainty on the
detection of the delayed signal is evaluated using calibration data taken with the 252Cf
source and IBD candidate events. Data are compared with the MC simulation to extract the
correction factor for the MC normalization, integrated over the volume, and its systematic
uncertainties. The correction consists of the product of three independent contributions:
CGdF corrects for the fraction of neutron captures on Gd; CEff corrects for the IBD selection
efficiency over the full volume; and CSio corrects for the modeling of spill in/out by the
MC simulation. Each factor and its systematic uncertainty is described in this section.
5.1 Gd fraction
Neutrons in the NT are captured dominantly on Gd and H. The fraction of neutron captures
on Gd depends mainly on the relative Gd concentration in the liquid scintillator. The
fraction is measured using calibration data with a 252Cf source at the center of the detector
as a ratio of the number of coincidence events selected by two different delayed energy
windows. Neutrons are emitted in the spontaneous fission of 252Cf together with γ’s,
which are detected as the prompt signal followed by the neutron captures. The window is
set to be 3.5 < Evis < 10 MeV for the numerator to select only Gd capture (small fraction
of C captures are also included) and 0.5 < Evis < 10 MeV for the denominator to include
H captures. In order to suppress background contamination in the 252Cf data, two cuts
are applied in addition to the standard IBD selection criteria: 1) Evis > 4 MeV where Evis
is the visible energy of the prompt signal; 2) more than one neutron are detected after
the prompt signal (252Cf emits 3.8 neutrons on average [32]). 2) is applied to eliminate a
correlated background contribution. The accidental background is measured using the off-
time coincidence windows and subtracted. The Gd fraction is measured to be 85.30±0.08 %
for the data and 87.49 ± 0.04 % for the MC simulation with the above definition. The
correction factor for the Gd fraction is measured from the ratio of the data to that of the MC
to be CGdF = 0.9750±0.0011(stat)±0.0041(syst). The systematic uncertainty is evaluated
by varying the energy windows. Consistent values are obtained from the 252Cf calibration
– 17 –
JHEP10(2014)086
Visible Energy (MeV)
5 10 15 20
En
trie
s/2
50
ke
V
1
10
210
310
Before vetoes are applied
Rejected by FV veto
Rejected by OV veto
Rejected by IV veto
Rejected by Li+He veto
After all vetoes are applied
Visible Energy (MeV)
4 5 6 7 8 9 10
En
trie
s/2
50keV
1
10
210
310
s)µCorrelation Time (
0 20 40 60 80 100 120 140
sµ
En
trie
s/
1
10
210
310
Figure 11. Visible energy of the prompt signals (top) and delayed signals (middle) and correlation
time of the prompt and delayed signals (bottom). Points and boxes show the data with their
statistical uncertainty before (grey, triangle) and after (black, circle) all analysis vetoes are applied.
Lines show the events rejected by each individual veto: FV veto (magenta); OV veto (blue); IV veto
(red); and Li+He veto (green).
– 18 –
JHEP10(2014)086
data taken at different times and positions, which confirm the Gd concentration in the liquid
scintillator is stable and uniform over the NT. In addition, the Gd fraction is measured
using the IBD candidates and spallation neutrons and they agree within the uncertainties.
5.2 IBD selection efficiency
The correction factor for IBD selection efficiency is evaluated by two methods, one using
the 252Cf calibration data and the other using IBD candidates, both described in this
section. Both methods yield correction factors consistent with unity (i.e. no correction)
within the uncertainty of a few per mil. The final correction factor is determined from the
combination of those obtained by the two methods as: CEff = 1.0000± 0.0019.
5.2.1 Efficiency measurement by Cf neutron source
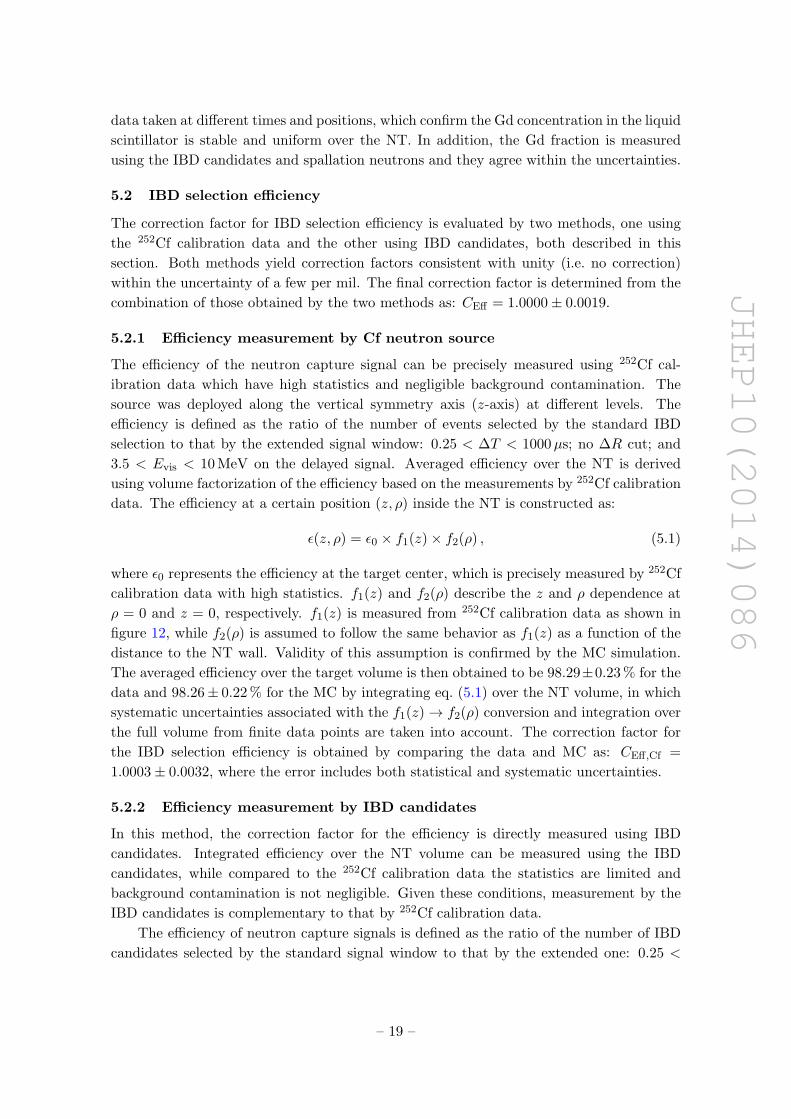
The efficiency of the neutron capture signal can be precisely measured using 252Cf cal-
ibration data which have high statistics and negligible background contamination. The
source was deployed along the vertical symmetry axis (z-axis) at different levels. The
efficiency is defined as the ratio of the number of events selected by the standard IBD
selection to that by the extended signal window: 0.25 < ∆T < 1000µs; no ∆R cut; and
3.5 < Evis < 10 MeV on the delayed signal. Averaged efficiency over the NT is derived
using volume factorization of the efficiency based on the measurements by 252Cf calibration
data. The efficiency at a certain position (z, ρ) inside the NT is constructed as:
ε(z, ρ) = ε0 × f1(z)× f2(ρ) , (5.1)
where ε0 represents the efficiency at the target center, which is precisely measured by 252Cf
calibration data with high statistics. f1(z) and f2(ρ) describe the z and ρ dependence at
ρ = 0 and z = 0, respectively. f1(z) is measured from 252Cf calibration data as shown in
figure 12, while f2(ρ) is assumed to follow the same behavior as f1(z) as a function of the
distance to the NT wall. Validity of this assumption is confirmed by the MC simulation.
The averaged efficiency over the target volume is then obtained to be 98.29±0.23 % for the
data and 98.26± 0.22 % for the MC by integrating eq. (5.1) over the NT volume, in which
systematic uncertainties associated with the f1(z)→ f2(ρ) conversion and integration over
the full volume from finite data points are taken into account. The correction factor for
the IBD selection efficiency is obtained by comparing the data and MC as: CEff,Cf =
1.0003± 0.0032, where the error includes both statistical and systematic uncertainties.
5.2.2 Efficiency measurement by IBD candidates
In this method, the correction factor for the efficiency is directly measured using IBD
candidates. Integrated efficiency over the NT volume can be measured using the IBD
candidates, while compared to the 252Cf calibration data the statistics are limited and
background contamination is not negligible. Given these conditions, measurement by the
IBD candidates is complementary to that by 252Cf calibration data.
The efficiency of neutron capture signals is defined as the ratio of the number of IBD
candidates selected by the standard signal window to that by the extended one: 0.25 <
– 19 –
JHEP10(2014)086
zaxis position (mm)
1000 0 1000
Rela
tive e
ffic
iency
0.94
0.96
0.98
Cf data252
MC after correction
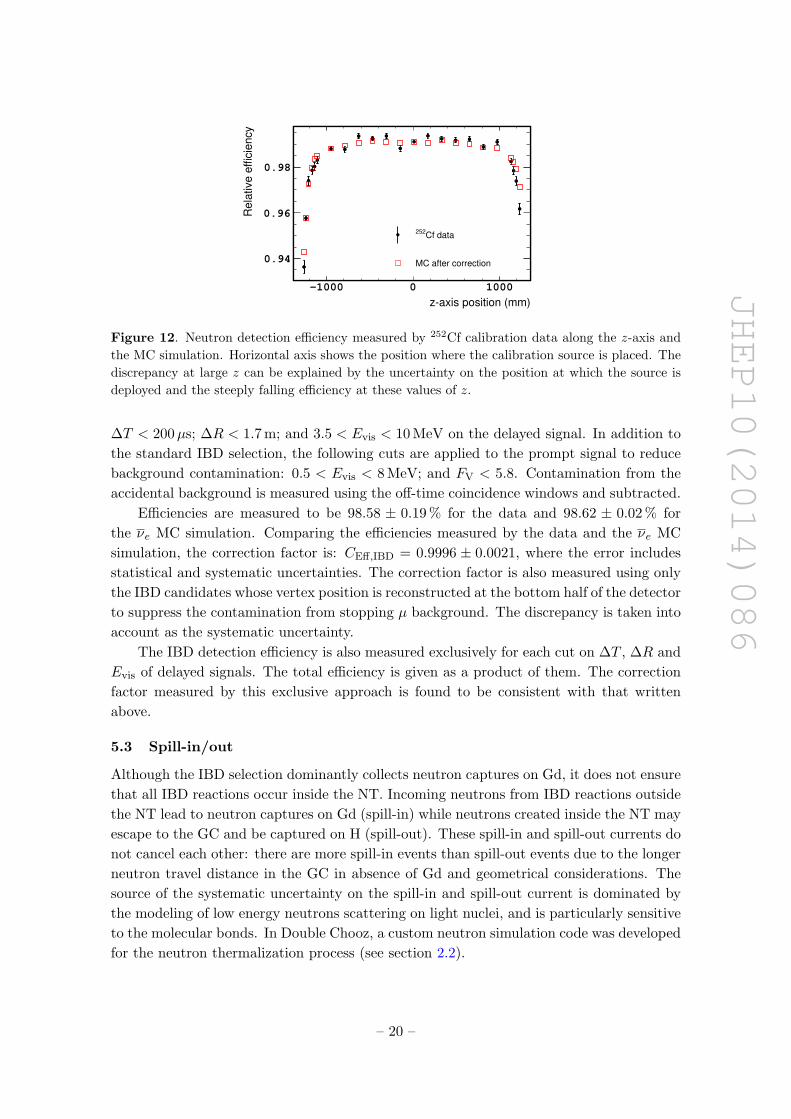
Figure 12. Neutron detection efficiency measured by 252Cf calibration data along the z-axis and
the MC simulation. Horizontal axis shows the position where the calibration source is placed. The
discrepancy at large z can be explained by the uncertainty on the position at which the source is
deployed and the steeply falling efficiency at these values of z.
∆T < 200µs; ∆R < 1.7 m; and 3.5 < Evis < 10 MeV on the delayed signal. In addition to
the standard IBD selection, the following cuts are applied to the prompt signal to reduce
background contamination: 0.5 < Evis < 8 MeV; and FV < 5.8. Contamination from the
accidental background is measured using the off-time coincidence windows and subtracted.
Efficiencies are measured to be 98.58 ± 0.19 % for the data and 98.62 ± 0.02 % for
the νe MC simulation. Comparing the efficiencies measured by the data and the νe MC
simulation, the correction factor is: CEff,IBD = 0.9996 ± 0.0021, where the error includes
statistical and systematic uncertainties. The correction factor is also measured using only
the IBD candidates whose vertex position is reconstructed at the bottom half of the detector
to suppress the contamination from stopping µ background. The discrepancy is taken into
account as the systematic uncertainty.
The IBD detection efficiency is also measured exclusively for each cut on ∆T , ∆R and
Evis of delayed signals. The total efficiency is given as a product of them. The correction
factor measured by this exclusive approach is found to be consistent with that written
above.
5.3 Spill-in/out
Although the IBD selection dominantly collects neutron captures on Gd, it does not ensure
that all IBD reactions occur inside the NT. Incoming neutrons from IBD reactions outside
the NT lead to neutron captures on Gd (spill-in) while neutrons created inside the NT may
escape to the GC and be captured on H (spill-out). These spill-in and spill-out currents do
not cancel each other: there are more spill-in events than spill-out events due to the longer
neutron travel distance in the GC in absence of Gd and geometrical considerations. The
source of the systematic uncertainty on the spill-in and spill-out current is dominated by
the modeling of low energy neutrons scattering on light nuclei, and is particularly sensitive
to the molecular bonds. In Double Chooz, a custom neutron simulation code was developed
for the neutron thermalization process (see section 2.2).
– 20 –
JHEP10(2014)086
Correction source MC Correction Uncertainty (%)
DAQ & Trigger 1.000 < 0.1
Veto for 1 ms after muon 0.955 < 0.1
IBD selection 0.989 0.2
FV, OV, IV, Li+He veto 0.993 0.1
Scintillator proton number 1.000 0.3
Gd fraction 0.975 0.4
Spill in/out 1.000 0.3
Total 0.915 0.6
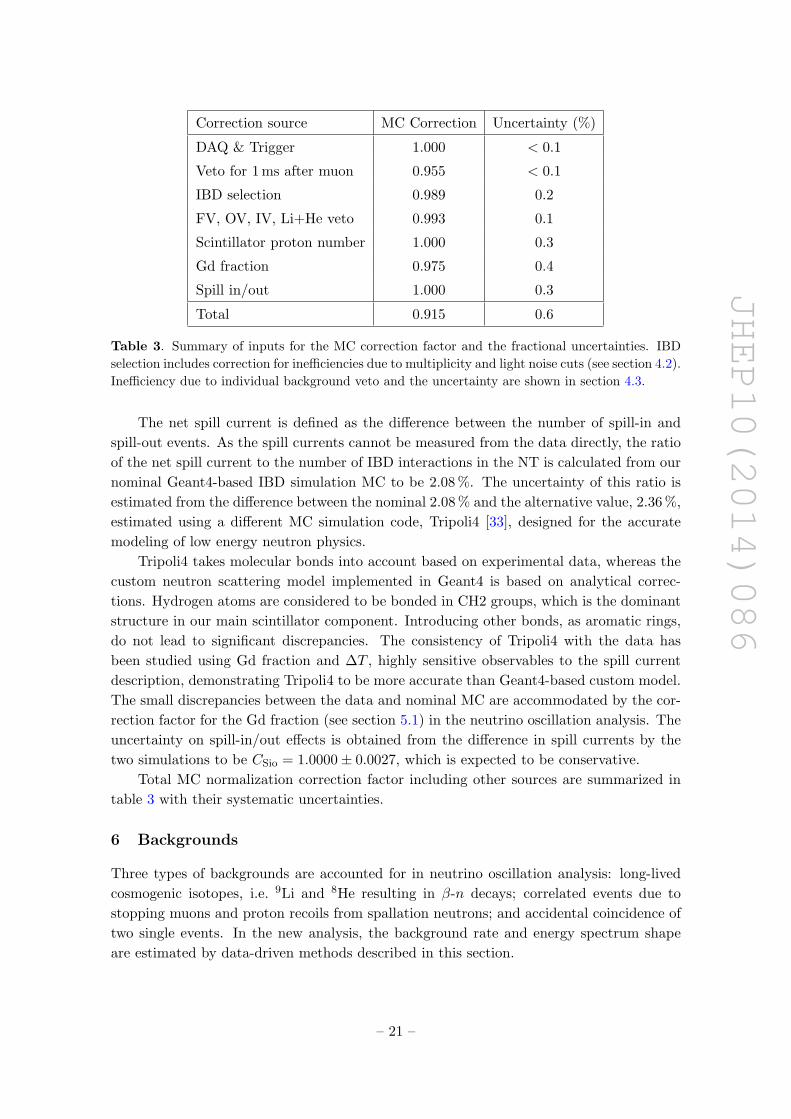
Table 3. Summary of inputs for the MC correction factor and the fractional uncertainties. IBD
selection includes correction for inefficiencies due to multiplicity and light noise cuts (see section 4.2).
Inefficiency due to individual background veto and the uncertainty are shown in section 4.3.
The net spill current is defined as the difference between the number of spill-in and
spill-out events. As the spill currents cannot be measured from the data directly, the ratio
of the net spill current to the number of IBD interactions in the NT is calculated from our
nominal Geant4-based IBD simulation MC to be 2.08 %. The uncertainty of this ratio is
estimated from the difference between the nominal 2.08 % and the alternative value, 2.36 %,
estimated using a different MC simulation code, Tripoli4 [33], designed for the accurate
modeling of low energy neutron physics.
Tripoli4 takes molecular bonds into account based on experimental data, whereas the
custom neutron scattering model implemented in Geant4 is based on analytical correc-
tions. Hydrogen atoms are considered to be bonded in CH2 groups, which is the dominant
structure in our main scintillator component. Introducing other bonds, as aromatic rings,
do not lead to significant discrepancies. The consistency of Tripoli4 with the data has
been studied using Gd fraction and ∆T , highly sensitive observables to the spill current
description, demonstrating Tripoli4 to be more accurate than Geant4-based custom model.
The small discrepancies between the data and nominal MC are accommodated by the cor-
rection factor for the Gd fraction (see section 5.1) in the neutrino oscillation analysis. The
uncertainty on spill-in/out effects is obtained from the difference in spill currents by the
two simulations to be CSio = 1.0000± 0.0027, which is expected to be conservative.
Total MC normalization correction factor including other sources are summarized in
table 3 with their systematic uncertainties.
6 Backgrounds
Three types of backgrounds are accounted for in neutrino oscillation analysis: long-lived
cosmogenic isotopes, i.e. 9Li and 8He resulting in β-n decays; correlated events due to
stopping muons and proton recoils from spallation neutrons; and accidental coincidence of
two single events. In the new analysis, the background rate and energy spectrum shape
are estimated by data-driven methods described in this section.
– 21 –
JHEP10(2014)086
Distance to muon track (mm)0 200 400 600 800 1000 1200 1400 1600 1800 2000
n d
eca
ys/1
00
mm
βN
um
be
r o
f
0
20
40
60
80
100
120
Measured distance
Bestfit function
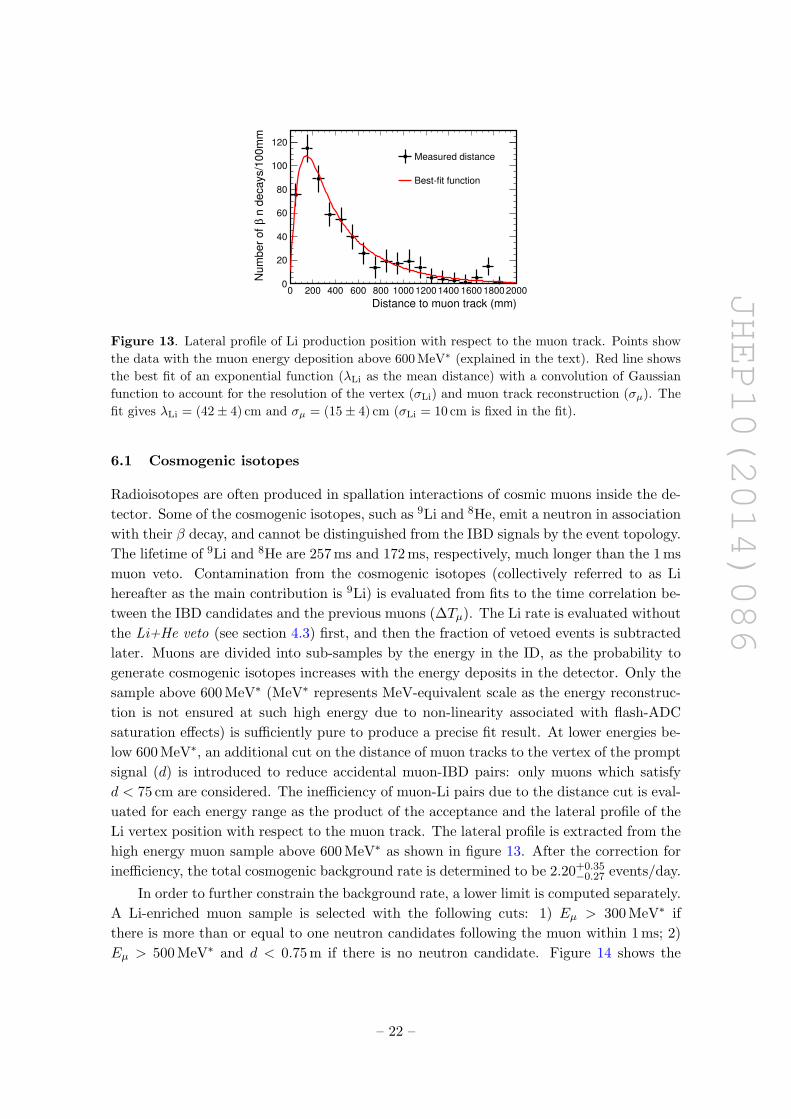
Figure 13. Lateral profile of Li production position with respect to the muon track. Points show
the data with the muon energy deposition above 600 MeV∗ (explained in the text). Red line shows
the best fit of an exponential function (λLi as the mean distance) with a convolution of Gaussian
function to account for the resolution of the vertex (σLi) and muon track reconstruction (σµ). The
fit gives λLi = (42± 4) cm and σµ = (15± 4) cm (σLi = 10 cm is fixed in the fit).
6.1 Cosmogenic isotopes
Radioisotopes are often produced in spallation interactions of cosmic muons inside the de-
tector. Some of the cosmogenic isotopes, such as 9Li and 8He, emit a neutron in association
with their β decay, and cannot be distinguished from the IBD signals by the event topology.
The lifetime of 9Li and 8He are 257 ms and 172 ms, respectively, much longer than the 1 ms
muon veto. Contamination from the cosmogenic isotopes (collectively referred to as Li
hereafter as the main contribution is 9Li) is evaluated from fits to the time correlation be-
tween the IBD candidates and the previous muons (∆Tµ). The Li rate is evaluated without
the Li+He veto (see section 4.3) first, and then the fraction of vetoed events is subtracted
later. Muons are divided into sub-samples by the energy in the ID, as the probability to
generate cosmogenic isotopes increases with the energy deposits in the detector. Only the
sample above 600 MeV∗ (MeV∗ represents MeV-equivalent scale as the energy reconstruc-
tion is not ensured at such high energy due to non-linearity associated with flash-ADC
saturation effects) is sufficiently pure to produce a precise fit result. At lower energies be-
low 600 MeV∗, an additional cut on the distance of muon tracks to the vertex of the prompt
signal (d) is introduced to reduce accidental muon-IBD pairs: only muons which satisfy
d < 75 cm are considered. The inefficiency of muon-Li pairs due to the distance cut is eval-
uated for each energy range as the product of the acceptance and the lateral profile of the
Li vertex position with respect to the muon track. The lateral profile is extracted from the
high energy muon sample above 600 MeV∗ as shown in figure 13. After the correction for
inefficiency, the total cosmogenic background rate is determined to be 2.20+0.35−0.27 events/day.
In order to further constrain the background rate, a lower limit is computed separately.
A Li-enriched muon sample is selected with the following cuts: 1) Eµ > 300 MeV∗ if
there is more than or equal to one neutron candidates following the muon within 1 ms; 2)
Eµ > 500 MeV∗ and d < 0.75 m if there is no neutron candidate. Figure 14 shows the
– 22 –
JHEP10(2014)086
T (ms)∆
200 400 600 800 1000 1200 1400 1600 1800 2000
En
trie
s/2
0m
s
0
20
40
60
80
100
120
140
160
180
200
He enriched data8Li+9
Bestfit function
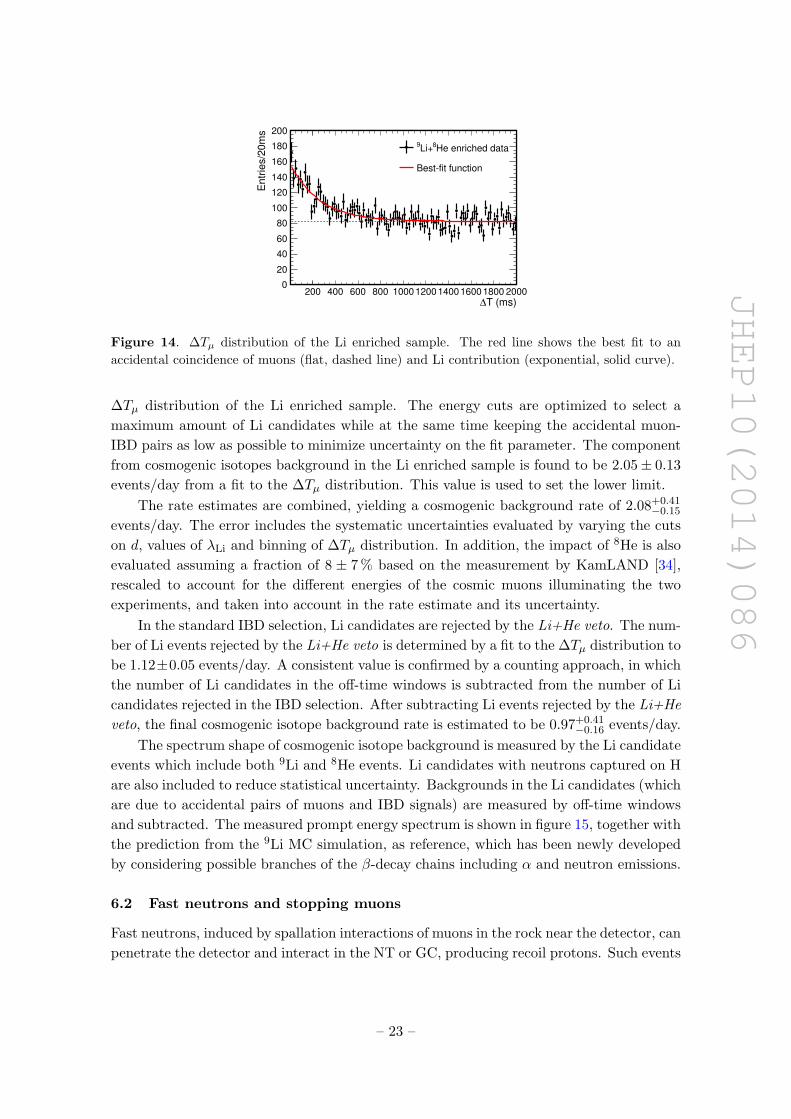
Figure 14. ∆Tµ distribution of the Li enriched sample. The red line shows the best fit to an
accidental coincidence of muons (flat, dashed line) and Li contribution (exponential, solid curve).
∆Tµ distribution of the Li enriched sample. The energy cuts are optimized to select a
maximum amount of Li candidates while at the same time keeping the accidental muon-
IBD pairs as low as possible to minimize uncertainty on the fit parameter. The component
from cosmogenic isotopes background in the Li enriched sample is found to be 2.05± 0.13
events/day from a fit to the ∆Tµ distribution. This value is used to set the lower limit.
The rate estimates are combined, yielding a cosmogenic background rate of 2.08+0.41−0.15
events/day. The error includes the systematic uncertainties evaluated by varying the cuts
on d, values of λLi and binning of ∆Tµ distribution. In addition, the impact of 8He is also
evaluated assuming a fraction of 8 ± 7 % based on the measurement by KamLAND [34],
rescaled to account for the different energies of the cosmic muons illuminating the two
experiments, and taken into account in the rate estimate and its uncertainty.
In the standard IBD selection, Li candidates are rejected by the Li+He veto. The num-
ber of Li events rejected by the Li+He veto is determined by a fit to the ∆Tµ distribution to
be 1.12±0.05 events/day. A consistent value is confirmed by a counting approach, in which
the number of Li candidates in the off-time windows is subtracted from the number of Li
candidates rejected in the IBD selection. After subtracting Li events rejected by the Li+He
veto, the final cosmogenic isotope background rate is estimated to be 0.97+0.41−0.16 events/day.
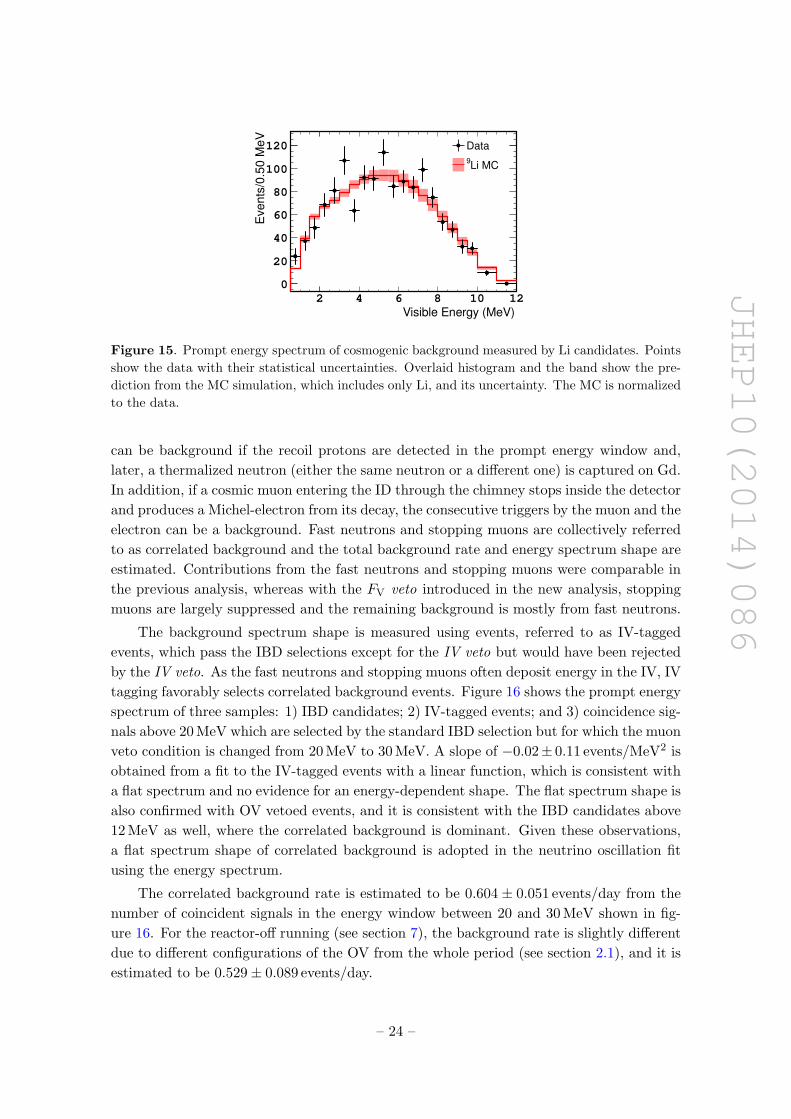
The spectrum shape of cosmogenic isotope background is measured by the Li candidate
events which include both 9Li and 8He events. Li candidates with neutrons captured on H
are also included to reduce statistical uncertainty. Backgrounds in the Li candidates (which
are due to accidental pairs of muons and IBD signals) are measured by off-time windows
and subtracted. The measured prompt energy spectrum is shown in figure 15, together with
the prediction from the 9Li MC simulation, as reference, which has been newly developed
by considering possible branches of the β-decay chains including α and neutron emissions.
6.2 Fast neutrons and stopping muons
Fast neutrons, induced by spallation interactions of muons in the rock near the detector, can
penetrate the detector and interact in the NT or GC, producing recoil protons. Such events
– 23 –
JHEP10(2014)086
Visible Energy (MeV)2 4 6 8 10 12
Events
/0.5
0 M
eV
0
20
40
60
80
100
120 Data
Li MC9
Figure 15. Prompt energy spectrum of cosmogenic background measured by Li candidates. Points
show the data with their statistical uncertainties. Overlaid histogram and the band show the pre-
diction from the MC simulation, which includes only Li, and its uncertainty. The MC is normalized
to the data.
can be background if the recoil protons are detected in the prompt energy window and,
later, a thermalized neutron (either the same neutron or a different one) is captured on Gd.
In addition, if a cosmic muon entering the ID through the chimney stops inside the detector
and produces a Michel-electron from its decay, the consecutive triggers by the muon and the
electron can be a background. Fast neutrons and stopping muons are collectively referred
to as correlated background and the total background rate and energy spectrum shape are
estimated. Contributions from the fast neutrons and stopping muons were comparable in
the previous analysis, whereas with the FV veto introduced in the new analysis, stopping
muons are largely suppressed and the remaining background is mostly from fast neutrons.
The background spectrum shape is measured using events, referred to as IV-tagged
events, which pass the IBD selections except for the IV veto but would have been rejected
by the IV veto. As the fast neutrons and stopping muons often deposit energy in the IV, IV
tagging favorably selects correlated background events. Figure 16 shows the prompt energy
spectrum of three samples: 1) IBD candidates; 2) IV-tagged events; and 3) coincidence sig-
nals above 20 MeV which are selected by the standard IBD selection but for which the muon
veto condition is changed from 20 MeV to 30 MeV. A slope of −0.02± 0.11 events/MeV2 is
obtained from a fit to the IV-tagged events with a linear function, which is consistent with
a flat spectrum and no evidence for an energy-dependent shape. The flat spectrum shape is
also confirmed with OV vetoed events, and it is consistent with the IBD candidates above
12 MeV as well, where the correlated background is dominant. Given these observations,
a flat spectrum shape of correlated background is adopted in the neutrino oscillation fit
using the energy spectrum.
The correlated background rate is estimated to be 0.604 ± 0.051 events/day from the
number of coincident signals in the energy window between 20 and 30 MeV shown in fig-
ure 16. For the reactor-off running (see section 7), the background rate is slightly different
due to different configurations of the OV from the whole period (see section 2.1), and it is
estimated to be 0.529± 0.089 events/day.
– 24 –
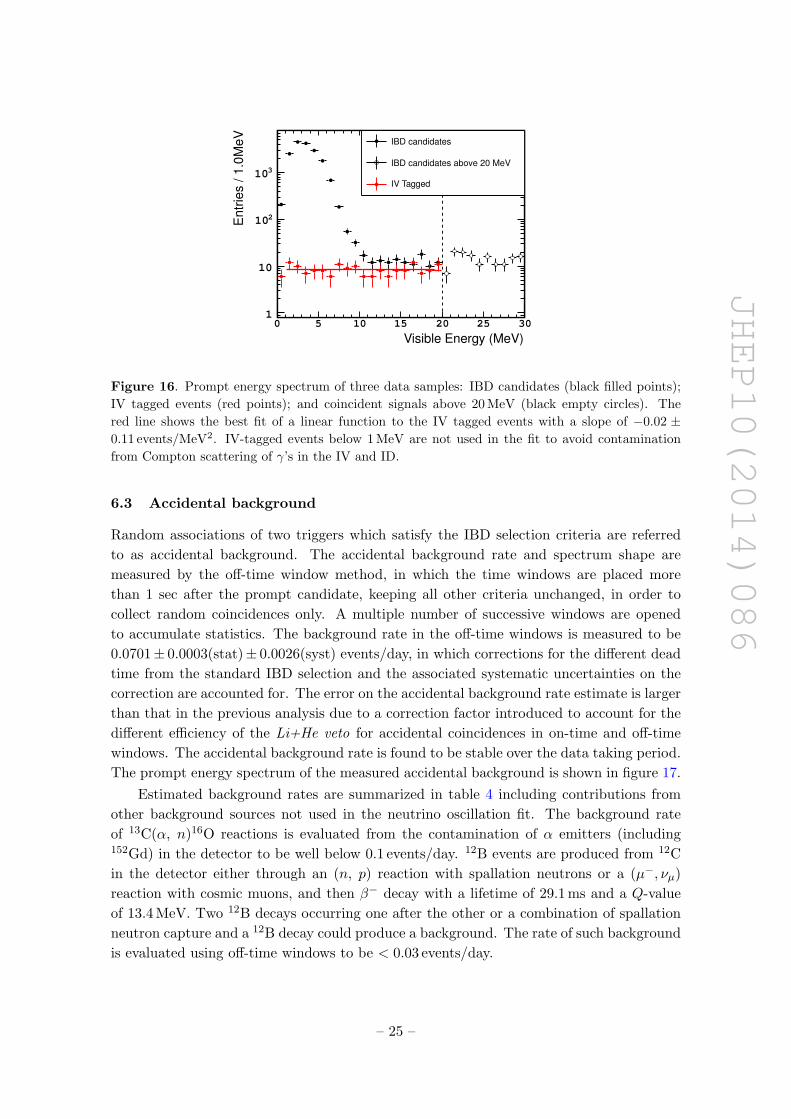
JHEP10(2014)086
Visible Energy (MeV)
0 5 10 15 20 25 30
En
trie
s /
1.0
Me
V
1
10
210
310
IBD candidates
IBD candidates above 20 MeV
IV Tagged
Figure 16. Prompt energy spectrum of three data samples: IBD candidates (black filled points);
IV tagged events (red points); and coincident signals above 20 MeV (black empty circles). The
red line shows the best fit of a linear function to the IV tagged events with a slope of −0.02 ±0.11 events/MeV2. IV-tagged events below 1 MeV are not used in the fit to avoid contamination
from Compton scattering of γ’s in the IV and ID.
6.3 Accidental background
Random associations of two triggers which satisfy the IBD selection criteria are referred
to as accidental background. The accidental background rate and spectrum shape are
measured by the off-time window method, in which the time windows are placed more
than 1 sec after the prompt candidate, keeping all other criteria unchanged, in order to
collect random coincidences only. A multiple number of successive windows are opened
to accumulate statistics. The background rate in the off-time windows is measured to be
0.0701± 0.0003(stat)± 0.0026(syst) events/day, in which corrections for the different dead
time from the standard IBD selection and the associated systematic uncertainties on the
correction are accounted for. The error on the accidental background rate estimate is larger
than that in the previous analysis due to a correction factor introduced to account for the
different efficiency of the Li+He veto for accidental coincidences in on-time and off-time
windows. The accidental background rate is found to be stable over the data taking period.
The prompt energy spectrum of the measured accidental background is shown in figure 17.
Estimated background rates are summarized in table 4 including contributions from
other background sources not used in the neutrino oscillation fit. The background rate
of 13C(α, n)16O reactions is evaluated from the contamination of α emitters (including152Gd) in the detector to be well below 0.1 events/day. 12B events are produced from 12C
in the detector either through an (n, p) reaction with spallation neutrons or a (µ−, νµ)
reaction with cosmic muons, and then β− decay with a lifetime of 29.1 ms and a Q-value
of 13.4 MeV. Two 12B decays occurring one after the other or a combination of spallation
neutron capture and a 12B decay could produce a background. The rate of such background
is evaluated using off-time windows to be < 0.03 events/day.
– 25 –
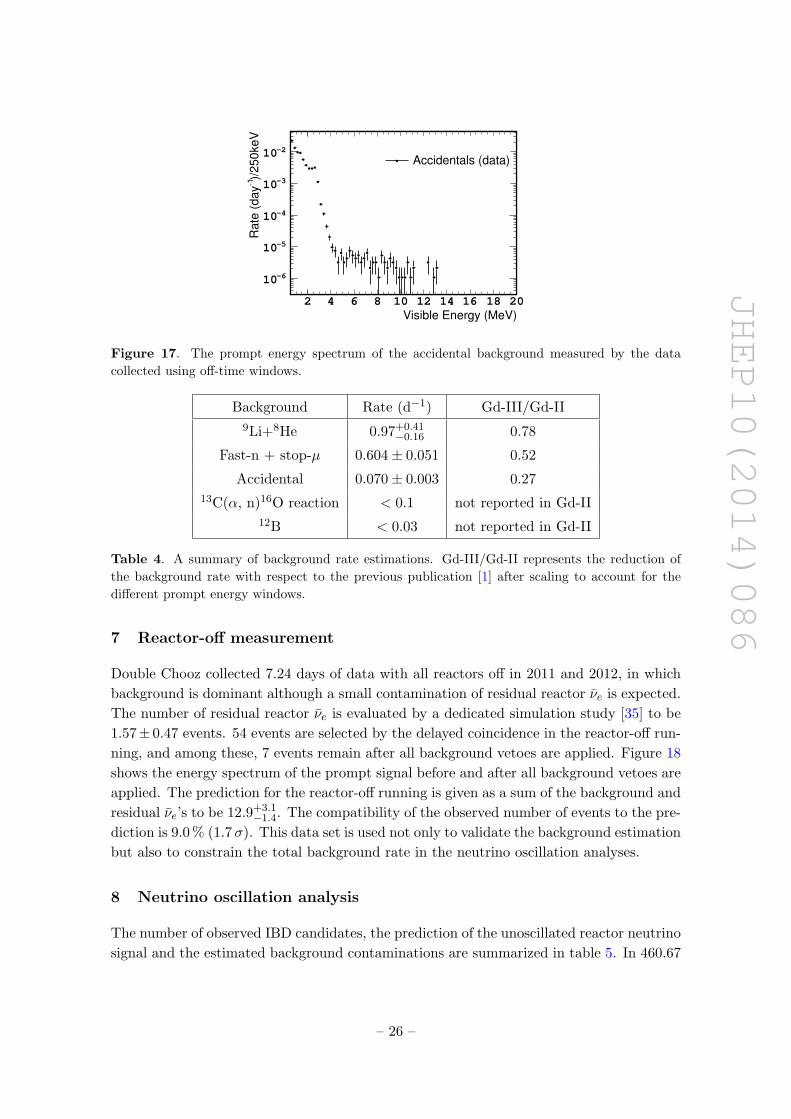
JHEP10(2014)086
Visible Energy (MeV)2 4 6 8 10 12 14 16 18 20
)/2
50
ke
V1
Ra
te (
da
y
610
510
410
310
210
Accidentals (data)
Figure 17. The prompt energy spectrum of the accidental background measured by the data
collected using off-time windows.
Background Rate (d−1) Gd-III/Gd-II
9Li+8He 0.97+0.41−0.16 0.78
Fast-n + stop-µ 0.604± 0.051 0.52
Accidental 0.070± 0.003 0.27
13C(α, n)16O reaction < 0.1 not reported in Gd-II
12B < 0.03 not reported in Gd-II
Table 4. A summary of background rate estimations. Gd-III/Gd-II represents the reduction of
the background rate with respect to the previous publication [1] after scaling to account for the
different prompt energy windows.
7 Reactor-off measurement
Double Chooz collected 7.24 days of data with all reactors off in 2011 and 2012, in which
background is dominant although a small contamination of residual reactor νe is expected.
The number of residual reactor νe is evaluated by a dedicated simulation study [35] to be
1.57± 0.47 events. 54 events are selected by the delayed coincidence in the reactor-off run-
ning, and among these, 7 events remain after all background vetoes are applied. Figure 18
shows the energy spectrum of the prompt signal before and after all background vetoes are
applied. The prediction for the reactor-off running is given as a sum of the background and
residual νe’s to be 12.9+3.1−1.4. The compatibility of the observed number of events to the pre-
diction is 9.0 % (1.7σ). This data set is used not only to validate the background estimation
but also to constrain the total background rate in the neutrino oscillation analyses.
8 Neutrino oscillation analysis
The number of observed IBD candidates, the prediction of the unoscillated reactor neutrino
signal and the estimated background contaminations are summarized in table 5. In 460.67
– 26 –
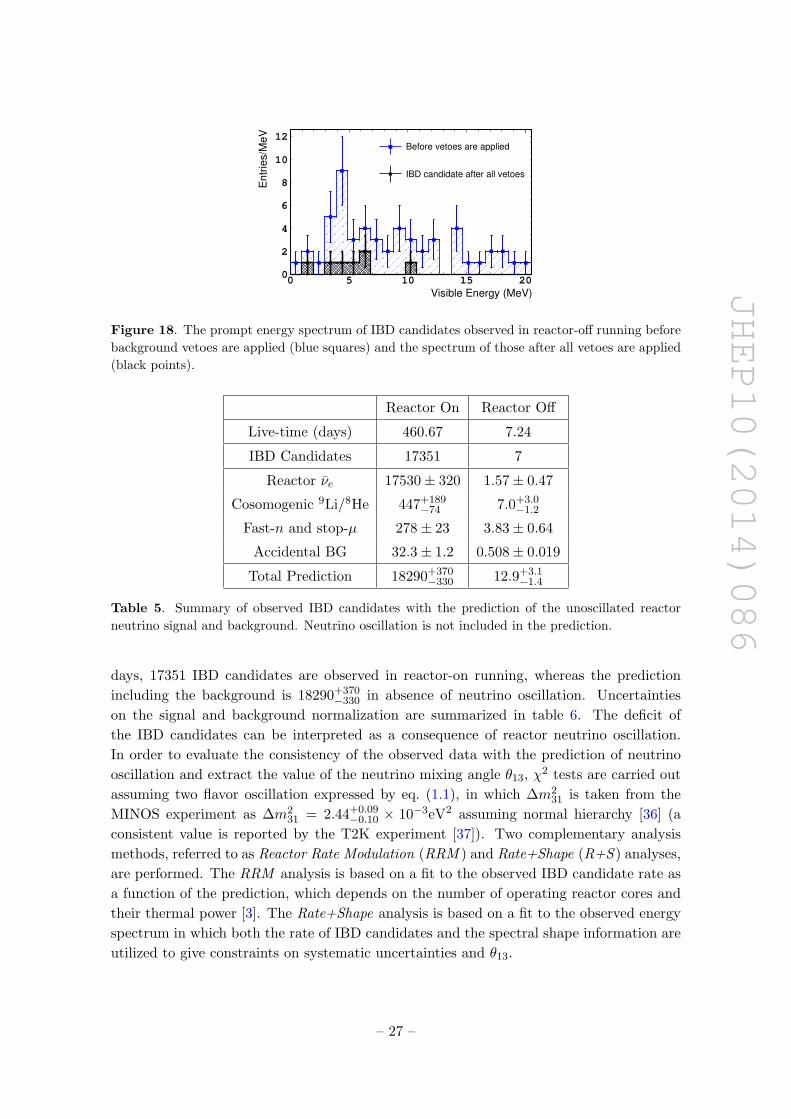
JHEP10(2014)086
Visible Energy (MeV)
0 5 10 15 20
En
trie
s/M
eV
0
2
4
6
8
10
12
Before vetoes are applied
IBD candidate after all vetoes
Figure 18. The prompt energy spectrum of IBD candidates observed in reactor-off running before
background vetoes are applied (blue squares) and the spectrum of those after all vetoes are applied
(black points).
Reactor On Reactor Off
Live-time (days) 460.67 7.24
IBD Candidates 17351 7
Reactor νe 17530± 320 1.57± 0.47
Cosomogenic 9Li/8He 447+189−74 7.0+3.0
−1.2
Fast-n and stop-µ 278± 23 3.83± 0.64
Accidental BG 32.3± 1.2 0.508± 0.019
Total Prediction 18290+370−330 12.9+3.1
−1.4
Table 5. Summary of observed IBD candidates with the prediction of the unoscillated reactor
neutrino signal and background. Neutrino oscillation is not included in the prediction.
days, 17351 IBD candidates are observed in reactor-on running, whereas the prediction
including the background is 18290+370−330 in absence of neutrino oscillation. Uncertainties
on the signal and background normalization are summarized in table 6. The deficit of
the IBD candidates can be interpreted as a consequence of reactor neutrino oscillation.
In order to evaluate the consistency of the observed data with the prediction of neutrino
oscillation and extract the value of the neutrino mixing angle θ13, χ2 tests are carried out
assuming two flavor oscillation expressed by eq. (1.1), in which ∆m231 is taken from the
MINOS experiment as ∆m231 = 2.44+0.09
−0.10 × 10⁻³eV2 assuming normal hierarchy [36] (a
consistent value is reported by the T2K experiment [37]). Two complementary analysis
methods, referred to as Reactor Rate Modulation (RRM ) and Rate+Shape (R+S ) analyses,
are performed. The RRM analysis is based on a fit to the observed IBD candidate rate as
a function of the prediction, which depends on the number of operating reactor cores and
their thermal power [3]. The Rate+Shape analysis is based on a fit to the observed energy
spectrum in which both the rate of IBD candidates and the spectral shape information are
utilized to give constraints on systematic uncertainties and θ13.
– 27 –
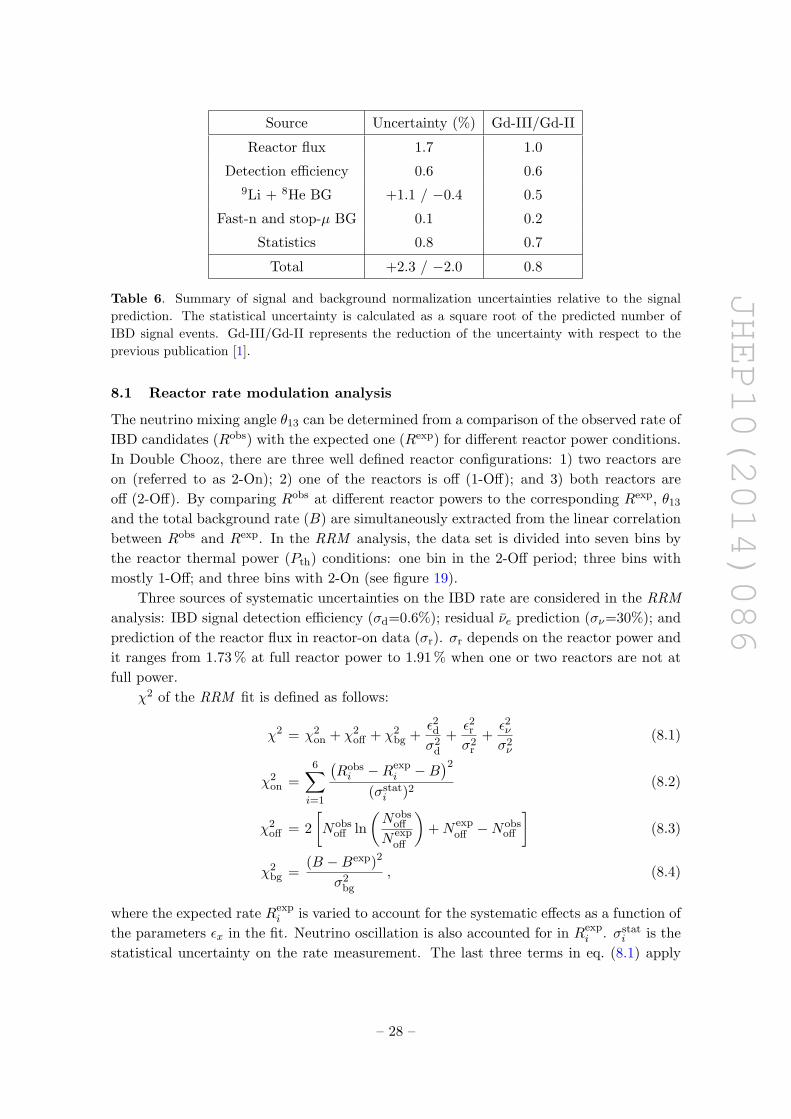
JHEP10(2014)086
Source Uncertainty (%) Gd-III/Gd-II
Reactor flux 1.7 1.0
Detection efficiency 0.6 0.6
9Li + 8He BG +1.1 / −0.4 0.5
Fast-n and stop-µ BG 0.1 0.2
Statistics 0.8 0.7
Total +2.3 / −2.0 0.8
Table 6. Summary of signal and background normalization uncertainties relative to the signal
prediction. The statistical uncertainty is calculated as a square root of the predicted number of
IBD signal events. Gd-III/Gd-II represents the reduction of the uncertainty with respect to the
previous publication [1].
8.1 Reactor rate modulation analysis
The neutrino mixing angle θ13 can be determined from a comparison of the observed rate of
IBD candidates (Robs) with the expected one (Rexp) for different reactor power conditions.
In Double Chooz, there are three well defined reactor configurations: 1) two reactors are
on (referred to as 2-On); 2) one of the reactors is off (1-Off); and 3) both reactors are
off (2-Off). By comparing Robs at different reactor powers to the corresponding Rexp, θ13
and the total background rate (B) are simultaneously extracted from the linear correlation
between Robs and Rexp. In the RRM analysis, the data set is divided into seven bins by
the reactor thermal power (Pth) conditions: one bin in the 2-Off period; three bins with
mostly 1-Off; and three bins with 2-On (see figure 19).
Three sources of systematic uncertainties on the IBD rate are considered in the RRM
analysis: IBD signal detection efficiency (σd=0.6%); residual νe prediction (σν=30%); and
prediction of the reactor flux in reactor-on data (σr). σr depends on the reactor power and
it ranges from 1.73 % at full reactor power to 1.91 % when one or two reactors are not at
full power.
χ2 of the RRM fit is defined as follows:
χ2 = χ2on + χ2
off + χ2bg +
ε2dσ2
d
+ε2rσ2
r
+ε2νσ2ν
(8.1)
χ2on =
6∑i=1
(Robsi −Rexp
i −B)2
(σstati )2
(8.2)
χ2off = 2
[Nobs
off ln
(Nobs
off
N expoff
)+N exp
off −Nobsoff
](8.3)
χ2bg =
(B −Bexp)2
σ2bg
, (8.4)
where the expected rate Rexpi is varied to account for the systematic effects as a function of
the parameters εx in the fit. Neutrino oscillation is also accounted for in Rexpi . σstat
i is the
statistical uncertainty on the rate measurement. The last three terms in eq. (8.1) apply
– 28 –
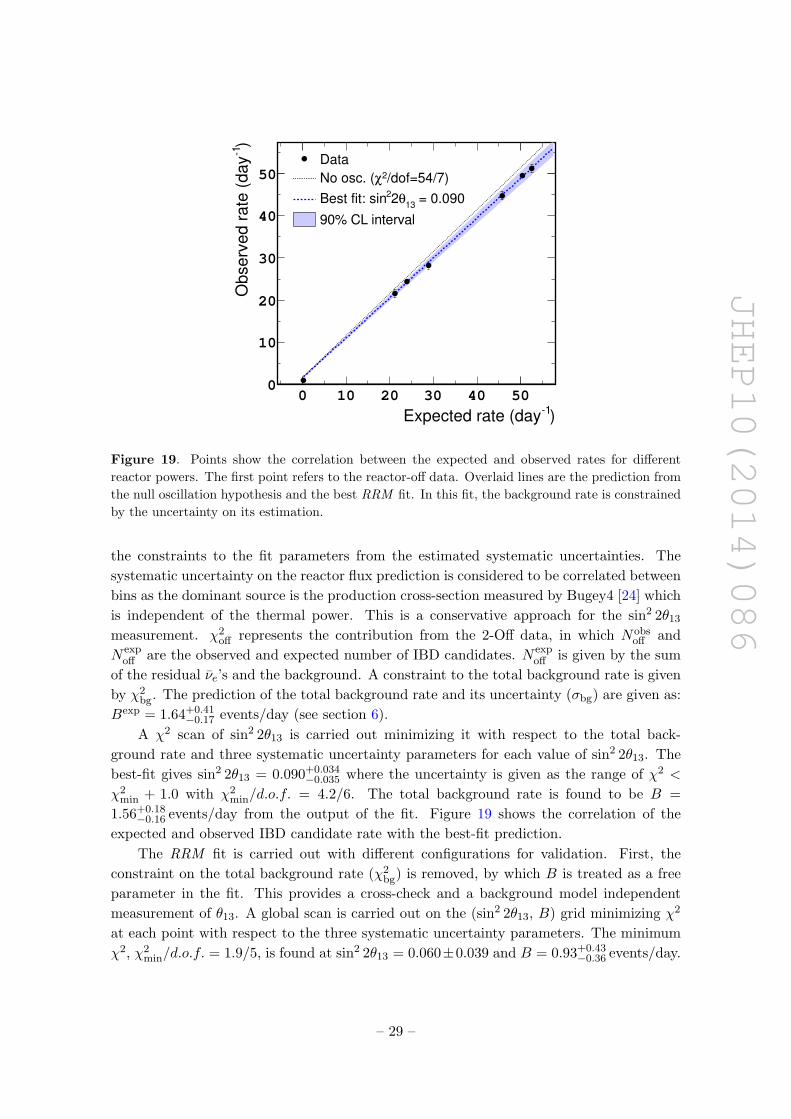
JHEP10(2014)086
)1Expected rate (day
0 10 20 30 40 50
)1
Ob
se
rve
d r
ate
(d
ay
0
10
20
30
40
50
Data
/dof=54/7)2χNo osc. (
= 0.09013
θ22Best fit: sin
90% CL interval
Figure 19. Points show the correlation between the expected and observed rates for different
reactor powers. The first point refers to the reactor-off data. Overlaid lines are the prediction from
the null oscillation hypothesis and the best RRM fit. In this fit, the background rate is constrained
by the uncertainty on its estimation.
the constraints to the fit parameters from the estimated systematic uncertainties. The
systematic uncertainty on the reactor flux prediction is considered to be correlated between
bins as the dominant source is the production cross-section measured by Bugey4 [24] which
is independent of the thermal power. This is a conservative approach for the sin2 2θ13
measurement. χ2off represents the contribution from the 2-Off data, in which Nobs
off and
N expoff are the observed and expected number of IBD candidates. N exp
off is given by the sum
of the residual νe’s and the background. A constraint to the total background rate is given
by χ2bg. The prediction of the total background rate and its uncertainty (σbg) are given as:
Bexp = 1.64+0.41−0.17 events/day (see section 6).
A χ2 scan of sin2 2θ13 is carried out minimizing it with respect to the total back-
ground rate and three systematic uncertainty parameters for each value of sin2 2θ13. The
best-fit gives sin2 2θ13 = 0.090+0.034−0.035 where the uncertainty is given as the range of χ2 <
χ2min + 1.0 with χ2
min/d.o.f. = 4.2/6. The total background rate is found to be B =
1.56+0.18−0.16 events/day from the output of the fit. Figure 19 shows the correlation of the
expected and observed IBD candidate rate with the best-fit prediction.
The RRM fit is carried out with different configurations for validation. First, the
constraint on the total background rate (χ2bg) is removed, by which B is treated as a free
parameter in the fit. This provides a cross-check and a background model independent
measurement of θ13. A global scan is carried out on the (sin2 2θ13, B) grid minimizing χ2
at each point with respect to the three systematic uncertainty parameters. The minimum
χ2, χ2min/d.o.f. = 1.9/5, is found at sin2 2θ13 = 0.060±0.039 and B = 0.93+0.43
−0.36 events/day.
– 29 –
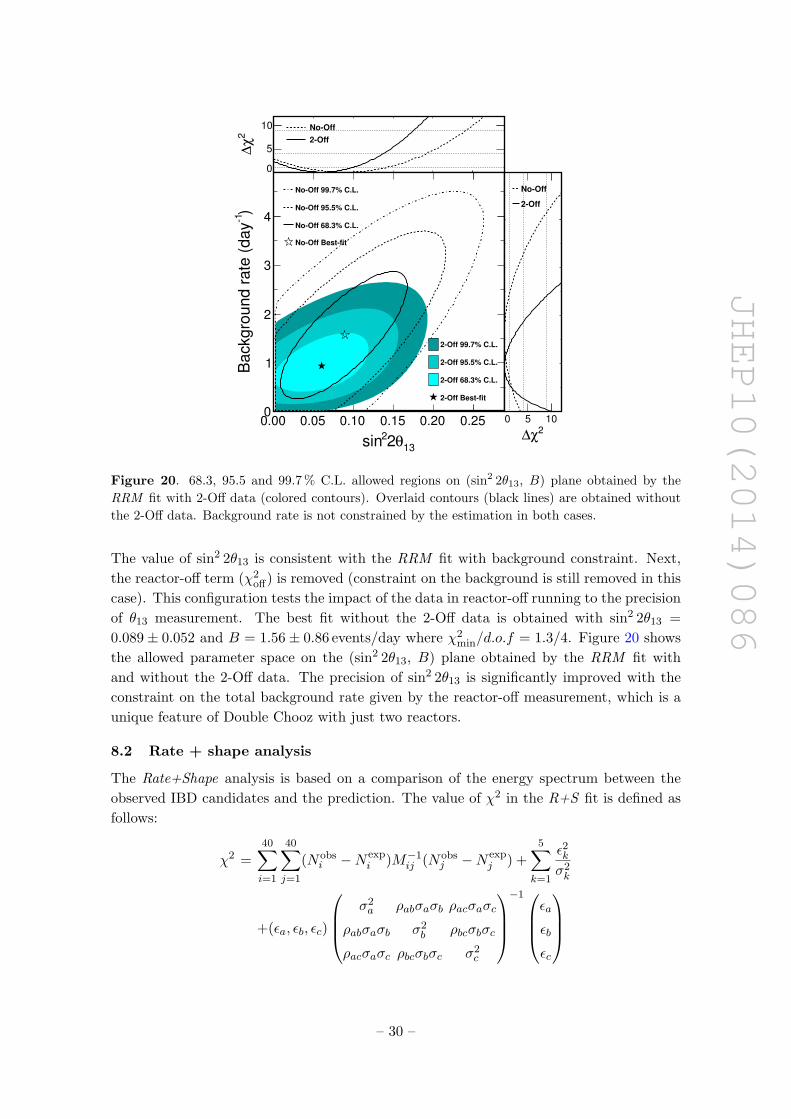
JHEP10(2014)086
0.00 0.05 0.10 0.15 0.20 0.25
2χ
∆
NoOff
2Off
0
5
10
13θ22sin
0.00 0.05 0.10 0.15 0.20 0.25
)1
Backgro
und r
ate
(day
0
1
2
3
4
2Off 99.7% C.L.
2Off 95.5% C.L.
2Off 68.3% C.L.
2Off Bestfit
NoOff 99.7% C.L.
NoOff 95.5% C.L.
NoOff 68.3% C.L.
NoOff Bestfit
2χ∆
0 5 10
NoOff
2Off
Figure 20. 68.3, 95.5 and 99.7 % C.L. allowed regions on (sin2 2θ13, B) plane obtained by the
RRM fit with 2-Off data (colored contours). Overlaid contours (black lines) are obtained without
the 2-Off data. Background rate is not constrained by the estimation in both cases.
The value of sin2 2θ13 is consistent with the RRM fit with background constraint. Next,
the reactor-off term (χ2off) is removed (constraint on the background is still removed in this
case). This configuration tests the impact of the data in reactor-off running to the precision
of θ13 measurement. The best fit without the 2-Off data is obtained with sin2 2θ13 =
0.089± 0.052 and B = 1.56± 0.86 events/day where χ2min/d.o.f = 1.3/4. Figure 20 shows
the allowed parameter space on the (sin2 2θ13, B) plane obtained by the RRM fit with
and without the 2-Off data. The precision of sin2 2θ13 is significantly improved with the
constraint on the total background rate given by the reactor-off measurement, which is a
unique feature of Double Chooz with just two reactors.
8.2 Rate + shape analysis
The Rate+Shape analysis is based on a comparison of the energy spectrum between the
observed IBD candidates and the prediction. The value of χ2 in the R+S fit is defined as
follows:
χ2 =40∑i=1
40∑j=1
(Nobsi −N exp
i )M−1ij (Nobs
j −N expj ) +
5∑k=1
ε2kσ2k
+(εa, εb, εc)
σ2a ρabσaσb ρacσaσc
ρabσaσb σ2b ρbcσbσc
ρacσaσc ρbcσbσc σ2c
−1
εa
εb
εc
– 30 –
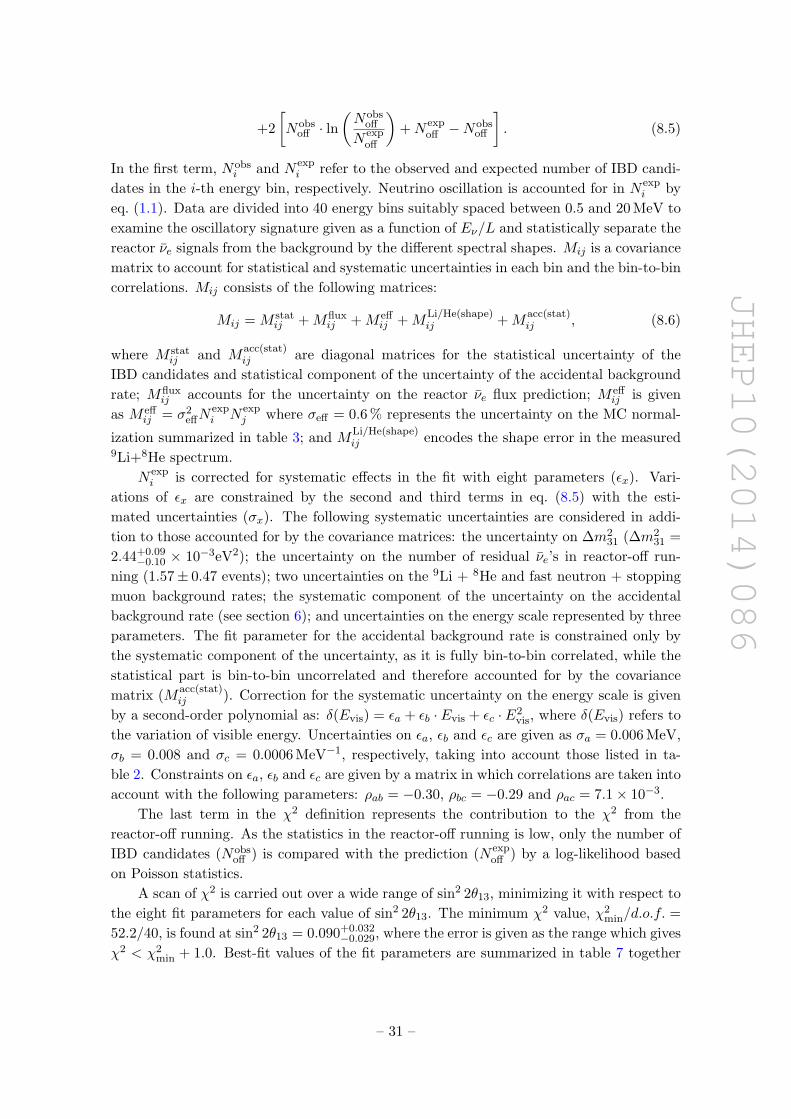
JHEP10(2014)086
+2
[Nobs
off · ln(Nobs
off
N expoff
)+N exp
off −Nobsoff
]. (8.5)
In the first term, Nobsi and N exp
i refer to the observed and expected number of IBD candi-
dates in the i-th energy bin, respectively. Neutrino oscillation is accounted for in N expi by
eq. (1.1). Data are divided into 40 energy bins suitably spaced between 0.5 and 20 MeV to
examine the oscillatory signature given as a function of Eν/L and statistically separate the
reactor νe signals from the background by the different spectral shapes. Mij is a covariance
matrix to account for statistical and systematic uncertainties in each bin and the bin-to-bin
correlations. Mij consists of the following matrices:
Mij = M statij +Mflux
ij +M effij +M
Li/He(shape)ij +M
acc(stat)ij , (8.6)
where M statij and M
acc(stat)ij are diagonal matrices for the statistical uncertainty of the
IBD candidates and statistical component of the uncertainty of the accidental background
rate; Mfluxij accounts for the uncertainty on the reactor νe flux prediction; M eff
ij is given
as M effij = σ2
effNexpi N exp
j where σeff = 0.6 % represents the uncertainty on the MC normal-
ization summarized in table 3; and MLi/He(shape)ij encodes the shape error in the measured
9Li+8He spectrum.
N expi is corrected for systematic effects in the fit with eight parameters (εx). Vari-
ations of εx are constrained by the second and third terms in eq. (8.5) with the esti-
mated uncertainties (σx). The following systematic uncertainties are considered in addi-
tion to those accounted for by the covariance matrices: the uncertainty on ∆m231 (∆m2
31 =
2.44+0.09−0.10 × 10⁻³eV2); the uncertainty on the number of residual νe’s in reactor-off run-
ning (1.57± 0.47 events); two uncertainties on the 9Li + 8He and fast neutron + stopping
muon background rates; the systematic component of the uncertainty on the accidental
background rate (see section 6); and uncertainties on the energy scale represented by three
parameters. The fit parameter for the accidental background rate is constrained only by
the systematic component of the uncertainty, as it is fully bin-to-bin correlated, while the
statistical part is bin-to-bin uncorrelated and therefore accounted for by the covariance
matrix (Macc(stat)ij ). Correction for the systematic uncertainty on the energy scale is given
by a second-order polynomial as: δ(Evis) = εa + εb ·Evis + εc ·E2vis, where δ(Evis) refers to
the variation of visible energy. Uncertainties on εa, εb and εc are given as σa = 0.006 MeV,
σb = 0.008 and σc = 0.0006 MeV−1, respectively, taking into account those listed in ta-
ble 2. Constraints on εa, εb and εc are given by a matrix in which correlations are taken into
account with the following parameters: ρab = −0.30, ρbc = −0.29 and ρac = 7.1× 10⁻³.
The last term in the χ2 definition represents the contribution to the χ2 from the
reactor-off running. As the statistics in the reactor-off running is low, only the number of
IBD candidates (Nobsoff ) is compared with the prediction (N exp
off ) by a log-likelihood based
on Poisson statistics.
A scan of χ2 is carried out over a wide range of sin2 2θ13, minimizing it with respect to
the eight fit parameters for each value of sin2 2θ13. The minimum χ2 value, χ2min/d.o.f. =
52.2/40, is found at sin2 2θ13 = 0.090+0.032−0.029, where the error is given as the range which gives
χ2 < χ2min + 1.0. Best-fit values of the fit parameters are summarized in table 7 together
– 31 –
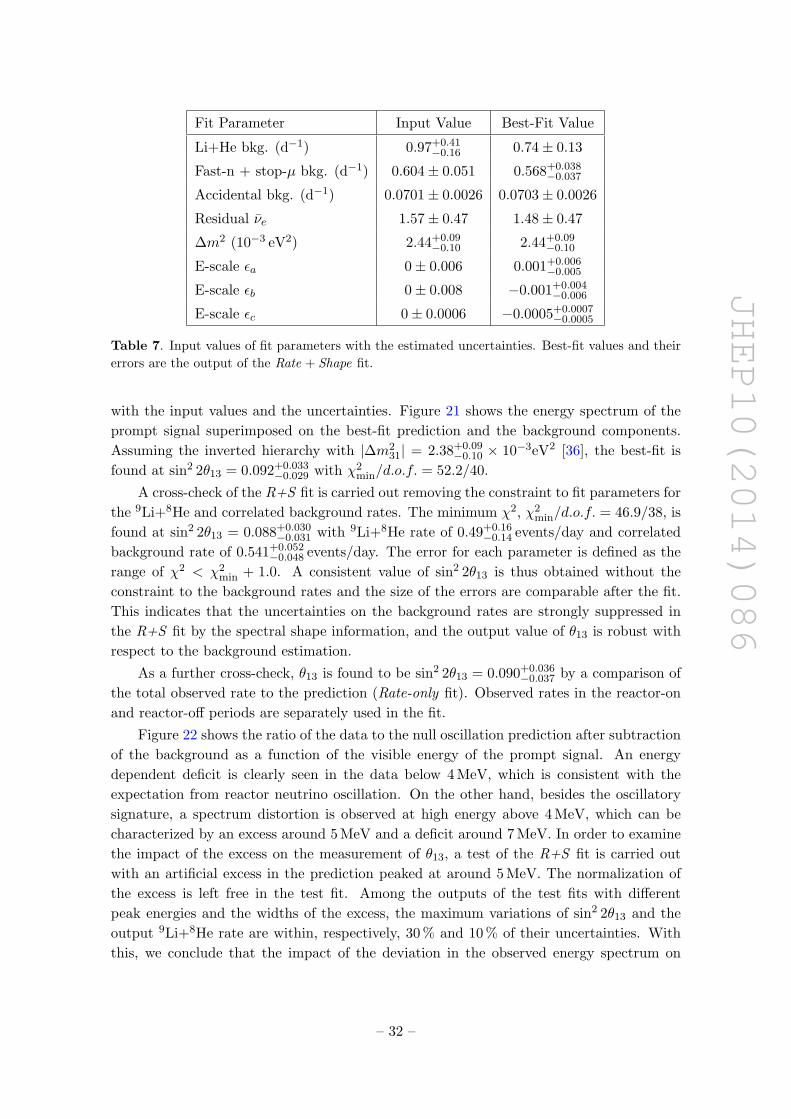
JHEP10(2014)086
Fit Parameter Input Value Best-Fit Value
Li+He bkg. (d−1) 0.97+0.41−0.16 0.74± 0.13
Fast-n + stop-µ bkg. (d−1) 0.604± 0.051 0.568+0.038−0.037
Accidental bkg. (d−1) 0.0701± 0.0026 0.0703± 0.0026
Residual νe 1.57± 0.47 1.48± 0.47
∆m2 (10−3 eV2) 2.44+0.09−0.10 2.44+0.09
−0.10
E-scale εa 0± 0.006 0.001+0.006−0.005
E-scale εb 0± 0.008 −0.001+0.004−0.006
E-scale εc 0± 0.0006 −0.0005+0.0007−0.0005
Table 7. Input values of fit parameters with the estimated uncertainties. Best-fit values and their
errors are the output of the Rate + Shape fit.
with the input values and the uncertainties. Figure 21 shows the energy spectrum of the
prompt signal superimposed on the best-fit prediction and the background components.
Assuming the inverted hierarchy with |∆m231| = 2.38+0.09
−0.10 × 10⁻³eV2 [36], the best-fit is
found at sin2 2θ13 = 0.092+0.033−0.029 with χ2
min/d.o.f. = 52.2/40.
A cross-check of the R+S fit is carried out removing the constraint to fit parameters for
the 9Li+8He and correlated background rates. The minimum χ2, χ2min/d.o.f. = 46.9/38, is
found at sin2 2θ13 = 0.088+0.030−0.031 with 9Li+8He rate of 0.49+0.16
−0.14 events/day and correlated
background rate of 0.541+0.052−0.048 events/day. The error for each parameter is defined as the
range of χ2 < χ2min + 1.0. A consistent value of sin2 2θ13 is thus obtained without the
constraint to the background rates and the size of the errors are comparable after the fit.
This indicates that the uncertainties on the background rates are strongly suppressed in
the R+S fit by the spectral shape information, and the output value of θ13 is robust with
respect to the background estimation.
As a further cross-check, θ13 is found to be sin2 2θ13 = 0.090+0.036−0.037 by a comparison of
the total observed rate to the prediction (Rate-only fit). Observed rates in the reactor-on
and reactor-off periods are separately used in the fit.
Figure 22 shows the ratio of the data to the null oscillation prediction after subtraction
of the background as a function of the visible energy of the prompt signal. An energy
dependent deficit is clearly seen in the data below 4 MeV, which is consistent with the
expectation from reactor neutrino oscillation. On the other hand, besides the oscillatory
signature, a spectrum distortion is observed at high energy above 4 MeV, which can be
characterized by an excess around 5 MeV and a deficit around 7 MeV. In order to examine
the impact of the excess on the measurement of θ13, a test of the R+S fit is carried out
with an artificial excess in the prediction peaked at around 5 MeV. The normalization of
the excess is left free in the test fit. Among the outputs of the test fits with different
peak energies and the widths of the excess, the maximum variations of sin2 2θ13 and the
output 9Li+8He rate are within, respectively, 30 % and 10 % of their uncertainties. With
this, we conclude that the impact of the deviation in the observed energy spectrum on
– 32 –
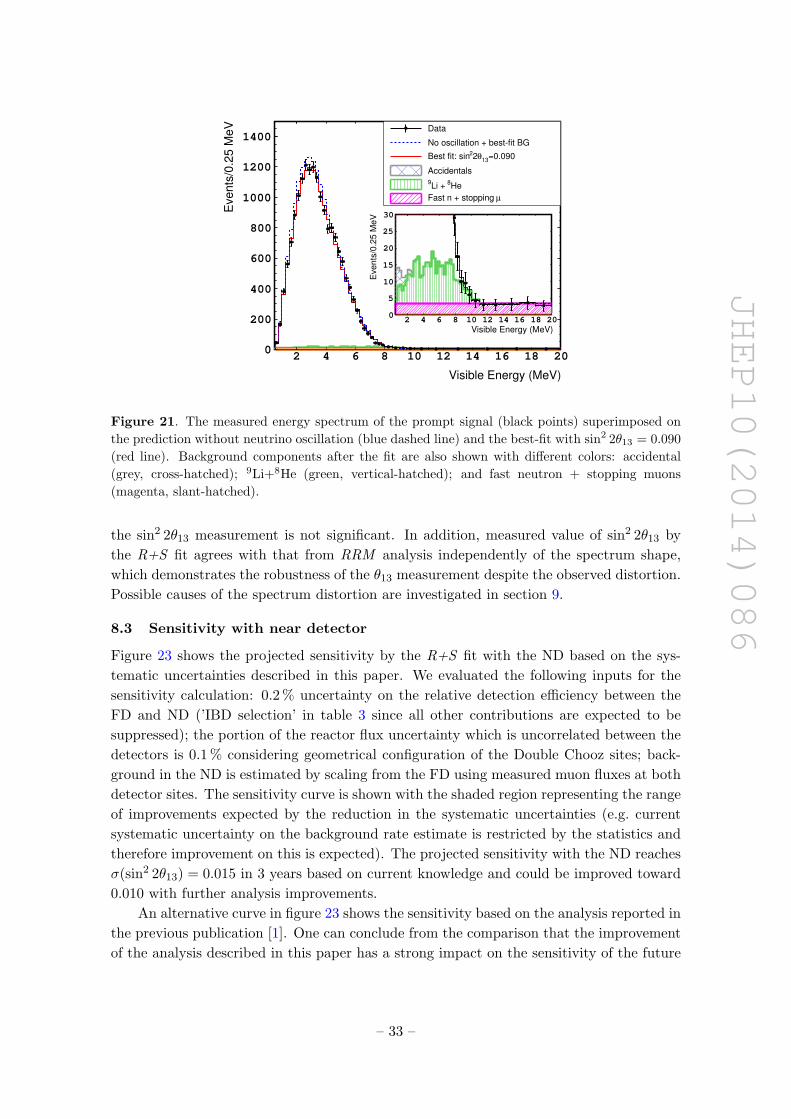
JHEP10(2014)086
Visible Energy (MeV)
2 4 6 8 10 12 14 16 18 20
Events
/0.2
5 M
eV
0
200
400
600
800
1000
1200
1400Data
No oscillation + bestfit BG
=0.09013
θ22Best fit: sin
Accidentals
He8Li + 9
µFast n + stopping
Visible Energy (MeV)2 4 6 8 10 12 14 16 18 20
Eve
nts
/0.2
5 M
eV
0
5
10
15
20
25
30
Figure 21. The measured energy spectrum of the prompt signal (black points) superimposed on
the prediction without neutrino oscillation (blue dashed line) and the best-fit with sin2 2θ13 = 0.090
(red line). Background components after the fit are also shown with different colors: accidental
(grey, cross-hatched); 9Li+8He (green, vertical-hatched); and fast neutron + stopping muons
(magenta, slant-hatched).
the sin2 2θ13 measurement is not significant. In addition, measured value of sin2 2θ13 by
the R+S fit agrees with that from RRM analysis independently of the spectrum shape,
which demonstrates the robustness of the θ13 measurement despite the observed distortion.
Possible causes of the spectrum distortion are investigated in section 9.
8.3 Sensitivity with near detector
Figure 23 shows the projected sensitivity by the R+S fit with the ND based on the sys-
tematic uncertainties described in this paper. We evaluated the following inputs for the
sensitivity calculation: 0.2 % uncertainty on the relative detection efficiency between the
FD and ND (’IBD selection’ in table 3 since all other contributions are expected to be
suppressed); the portion of the reactor flux uncertainty which is uncorrelated between the
detectors is 0.1 % considering geometrical configuration of the Double Chooz sites; back-
ground in the ND is estimated by scaling from the FD using measured muon fluxes at both
detector sites. The sensitivity curve is shown with the shaded region representing the range
of improvements expected by the reduction in the systematic uncertainties (e.g. current
systematic uncertainty on the background rate estimate is restricted by the statistics and
therefore improvement on this is expected). The projected sensitivity with the ND reaches
σ(sin2 2θ13) = 0.015 in 3 years based on current knowledge and could be improved toward
0.010 with further analysis improvements.
An alternative curve in figure 23 shows the sensitivity based on the analysis reported in
the previous publication [1]. One can conclude from the comparison that the improvement
of the analysis described in this paper has a strong impact on the sensitivity of the future
– 33 –
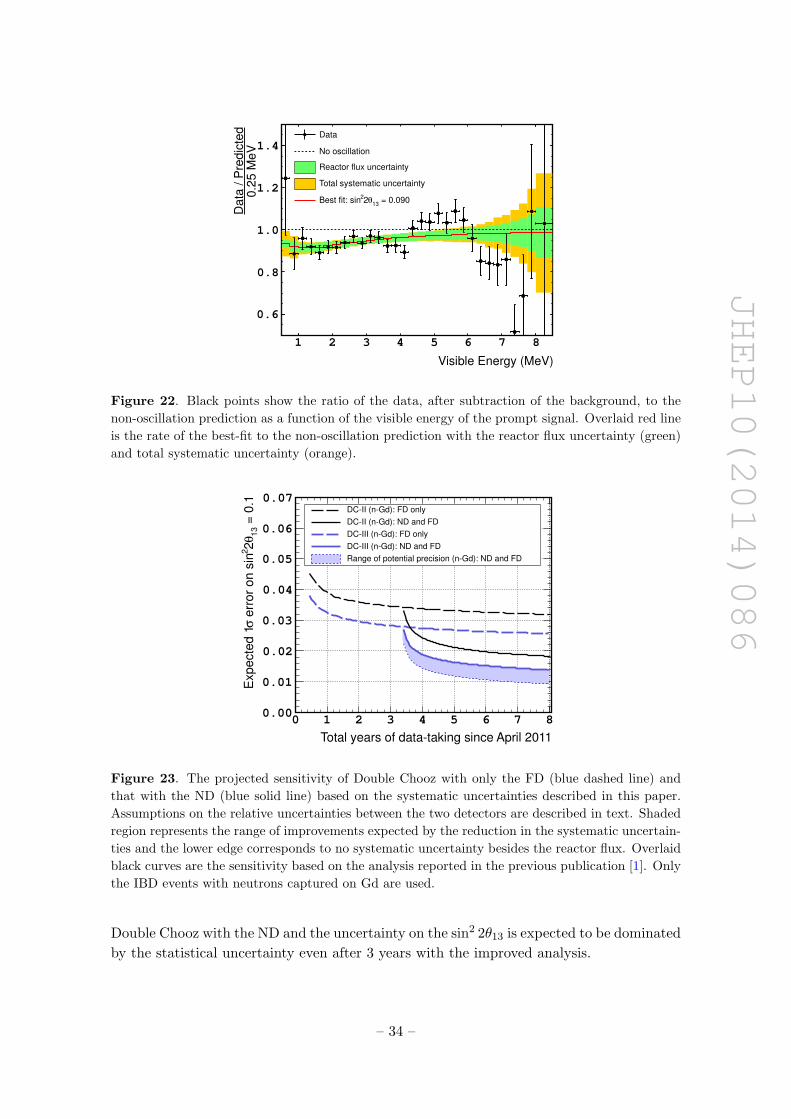
JHEP10(2014)086
Visible Energy (MeV)
1 2 3 4 5 6 7 8
0.2
5 M
eV
Data
/ P
redic
ted
0.6
0.8
1.0
1.2
1.4
Data
No oscillation
Reactor flux uncertainty
Total systematic uncertainty
= 0.09013
θ22
Best fit: sin
Figure 22. Black points show the ratio of the data, after subtraction of the background, to the
non-oscillation prediction as a function of the visible energy of the prompt signal. Overlaid red line
is the rate of the best-fit to the non-oscillation prediction with the reactor flux uncertainty (green)
and total systematic uncertainty (orange).
Total years of datataking since April 2011
0 1 2 3 4 5 6 7 8
= 0
.11
3θ
22
err
or
on s
inσ
Expecte
d 1
0.00
0.01
0.02
0.03
0.04
0.05
0.06
0.07
DCII (nGd): FD only
DCII (nGd): ND and FD
DCIII (nGd): FD only
DCIII (nGd): ND and FD
Range of potential precision (nGd): ND and FD
Figure 23. The projected sensitivity of Double Chooz with only the FD (blue dashed line) and
that with the ND (blue solid line) based on the systematic uncertainties described in this paper.
Assumptions on the relative uncertainties between the two detectors are described in text. Shaded
region represents the range of improvements expected by the reduction in the systematic uncertain-
ties and the lower edge corresponds to no systematic uncertainty besides the reactor flux. Overlaid
black curves are the sensitivity based on the analysis reported in the previous publication [1]. Only
the IBD events with neutrons captured on Gd are used.
Double Chooz with the ND and the uncertainty on the sin2 2θ13 is expected to be dominated
by the statistical uncertainty even after 3 years with the improved analysis.
– 34 –
JHEP10(2014)086
9 Observed spectrum distortion
As is shown in figure 22, a spectrum distortion is found above 4 MeV of the prompt en-
ergy. This trend is confirmed in the energy spectra reported in past publications: neutron
captures on Gd and H by Double Chooz [1, 2] and neutron captures on Gd by the CHOOZ
experiment [38]. The observed IBD rates are higher than the prediction around 5 MeV in
these earlier publications although they are not significant enough to conclude the existence
of an excess. Without making any hypothesis on the overall shape of the distortion,2 the
bump around 5 MeV has been selected as the major feature to estimate its significance.
The approaches used for this investigation are described in this section.
The energy scale around 5 MeV is confirmed by spallation neutrons captured on car-
bon(C) which, due to the smaller capture cross section on C than on Gd, occur predomi-
nantly in the GC and result in an energy peak at 5 MeV. The energy scale of the C capture
peaks agrees well, within 0.5 %, between the data and MC simulation. Note that the en-
ergy resolution of the data is also in good agreement with that of the MC. In addition,
β decays of 12B collected in the data are used to further test the energy scale as a cause
of the excess. No distortion is observed in the comparison of the energy spectrum of 12B
between the data and MC simulation.
Deviation from reactor flux prediction. If the excess around 5 MeV is due to un-
known backgrounds, the rate of the excess should be independent of the reactor power,
while if it is due to the reactor flux, the rate of the excess should be proportional to the
reactor power. In order to evaluate the consistency of data with the reactor flux and
background predictions, an energy-binned RRM fit (eRRM fit) is carried out with differ-
ent configurations from section 8.1. The data are divided into five samples by the visible
energy of the prompt signal to investigate the energy dependence, where the energy bin-
ning is optimized to pick up excess around 5 MeV. The eRRM fit utilizes a correlation
between the observed rate and reactor power and therefore is sensitive in distinguishing
the background and reactor flux hypotheses as the cause of the excess. First, constraints
to the background rate and reactor flux are removed while a constraint to θ13 is given as
sin2 2θ13 = 0.090+0.009−0.008 from the Daya Bay experiment [4]. Figure 24 shows the best-fit of
the background rate and relative normalization of the reactor flux for each energy range.
Background rates are consistent with the estimation and also consistent with the observed
background rate in reactor-off running after subtracting the residual νe. On the other
hand, the output of the reactor flux normalization from the eRRM fit is higher by 2.0σ
than the prediction between 4.25 and 6 MeV and lower by 1.5σ between 6 and 8 MeV.
The implication is that the observed spectrum distortion originates from the reactor flux
prediction, while the unknown background hypothesis is not favored.
In order to evaluate the deviation from reactor flux prediction, we incorporate the
background rate estimation as a constraint in the eRRM fit. The significance of the excess
2During the final revision of this manuscript, a paper [39] has been posted that tries to explain the
possible origin of the excess in 4 < Evis < 6 MeV region.
– 35 –
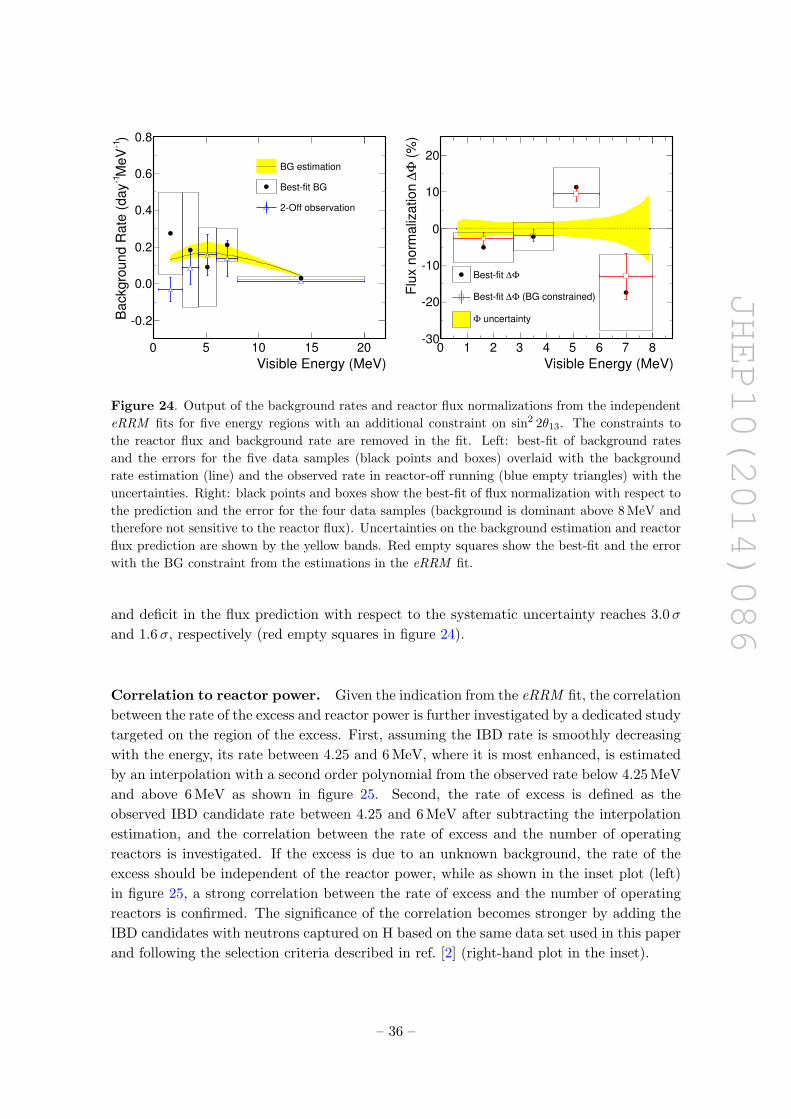
JHEP10(2014)086
Visible Energy (MeV)
0 5 10 15 20
)1
MeV
1B
ackgro
und R
ate
(day
0.2
0.0
0.2
0.4
0.6
0.8
BG estimation
Bestfit BG
2Off observation
Visible Energy (MeV)
0 1 2 3 4 5 6 7 8
(%
)Φ
∆F
lux n
orm
aliz
ation
30
20
10
0
10
20
Φ∆Bestfit
(BG constrained)Φ∆Bestfit
uncertaintyΦ
Figure 24. Output of the background rates and reactor flux normalizations from the independent
eRRM fits for five energy regions with an additional constraint on sin2 2θ13. The constraints to
the reactor flux and background rate are removed in the fit. Left: best-fit of background rates
and the errors for the five data samples (black points and boxes) overlaid with the background
rate estimation (line) and the observed rate in reactor-off running (blue empty triangles) with the
uncertainties. Right: black points and boxes show the best-fit of flux normalization with respect to
the prediction and the error for the four data samples (background is dominant above 8 MeV and
therefore not sensitive to the reactor flux). Uncertainties on the background estimation and reactor
flux prediction are shown by the yellow bands. Red empty squares show the best-fit and the error
with the BG constraint from the estimations in the eRRM fit.
and deficit in the flux prediction with respect to the systematic uncertainty reaches 3.0σ
and 1.6σ, respectively (red empty squares in figure 24).
Correlation to reactor power. Given the indication from the eRRM fit, the correlation
between the rate of the excess and reactor power is further investigated by a dedicated study
targeted on the region of the excess. First, assuming the IBD rate is smoothly decreasing
with the energy, its rate between 4.25 and 6 MeV, where it is most enhanced, is estimated
by an interpolation with a second order polynomial from the observed rate below 4.25 MeV
and above 6 MeV as shown in figure 25. Second, the rate of excess is defined as the
observed IBD candidate rate between 4.25 and 6 MeV after subtracting the interpolation
estimation, and the correlation between the rate of excess and the number of operating
reactors is investigated. If the excess is due to an unknown background, the rate of the
excess should be independent of the reactor power, while as shown in the inset plot (left)
in figure 25, a strong correlation between the rate of excess and the number of operating
reactors is confirmed. The significance of the correlation becomes stronger by adding the
IBD candidates with neutrons captured on H based on the same data set used in this paper
and following the selection criteria described in ref. [2] (right-hand plot in the inset).
– 36 –
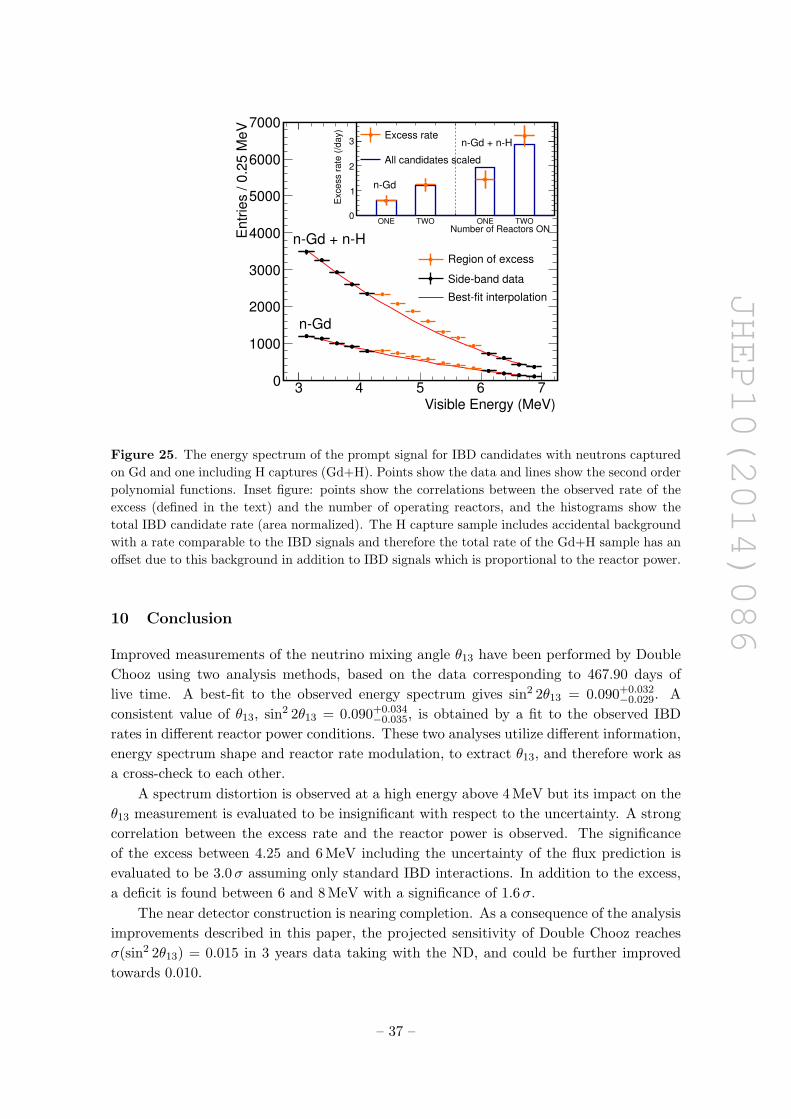
JHEP10(2014)086
Visible Energy (MeV)3 4 5 6 7
Entr
ies / 0
.25 M
eV
0
1000
2000
3000
4000
5000
6000
7000
nGd
nGd + nH
Region of excess
Sideband data
Bestfit interpolation
Number of Reactors ON ONE TWO ONE TWO
Exce
ss r
ate
(/d
ay)
0
1
2
3Excess rate
All candidates scaled
nGd
nGd + nH
Figure 25. The energy spectrum of the prompt signal for IBD candidates with neutrons captured
on Gd and one including H captures (Gd+H). Points show the data and lines show the second order
polynomial functions. Inset figure: points show the correlations between the observed rate of the
excess (defined in the text) and the number of operating reactors, and the histograms show the
total IBD candidate rate (area normalized). The H capture sample includes accidental background
with a rate comparable to the IBD signals and therefore the total rate of the Gd+H sample has an
offset due to this background in addition to IBD signals which is proportional to the reactor power.
10 Conclusion
Improved measurements of the neutrino mixing angle θ13 have been performed by Double
Chooz using two analysis methods, based on the data corresponding to 467.90 days of
live time. A best-fit to the observed energy spectrum gives sin2 2θ13 = 0.090+0.032−0.029. A
consistent value of θ13, sin2 2θ13 = 0.090+0.034−0.035, is obtained by a fit to the observed IBD
rates in different reactor power conditions. These two analyses utilize different information,
energy spectrum shape and reactor rate modulation, to extract θ13, and therefore work as
a cross-check to each other.
A spectrum distortion is observed at a high energy above 4 MeV but its impact on the
θ13 measurement is evaluated to be insignificant with respect to the uncertainty. A strong
correlation between the excess rate and the reactor power is observed. The significance
of the excess between 4.25 and 6 MeV including the uncertainty of the flux prediction is
evaluated to be 3.0σ assuming only standard IBD interactions. In addition to the excess,
a deficit is found between 6 and 8 MeV with a significance of 1.6σ.
The near detector construction is nearing completion. As a consequence of the analysis
improvements described in this paper, the projected sensitivity of Double Chooz reaches
σ(sin2 2θ13) = 0.015 in 3 years data taking with the ND, and could be further improved
towards 0.010.
– 37 –
JHEP10(2014)086
Acknowledgments
We thank the French electricity company EDF; the European fund FEDER; the Region
de Champagne Ardenne; the Departement des Ardennes; and the Communaute des Com-
munes Ardennes Rives de Meuse. We acknowledge the support of the CEA, CNRS/IN2P3,
the computer center CCIN2P3, and LabEx UnivEarthS in France (ANR-11-IDEX-0005-
02); the Ministry of Education, Culture, Sports, Science and Technology of Japan (MEXT)
and the Japan Society for the Promotion of Science (JSPS); the Department of Energy and
the National Science Foundation of the United States; the Ministerio de Ciencia e Inno-
vacion (MICINN) of Spain; the Max Planck Gesellschaft, and the Deutsche Forschungsge-
meinschaft DFG (SBH WI 2152), the Transregional Collaborative Research Center TR27,
the excellence cluster “Origin and Structure of the Universe”, and the Maier-Leibnitz-
Laboratorium Garching in Germany; the Russian Academy of Science, the Kurchatov
Institute and RFBR (the Russian Foundation for Basic Research); the Brazilian Ministry
of Science, Technology and Innovation (MCTI), the Financiadora de Estudos e Projetos
(FINEP), the Conselho Nacional de Desenvolvimento Cientıfico e Tecnologico (CNPq), the
Sao Paulo Research Foundation (FAPESP), and the Brazilian Network for High Energy
Physics (RENAFAE) in Brazil.
Open Access. This article is distributed under the terms of the Creative Commons
Attribution License (CC-BY 4.0), which permits any use, distribution and reproduction in
any medium, provided the original author(s) and source are credited.
References
[1] Double CHOOZ collaboration, Y. Abe et al., Reactor electron antineutrino disappearance
in the Double CHOOZ experiment, Phys. Rev. D 86 (2012) 052008 [arXiv:1207.6632]
[INSPIRE].
[2] Double CHOOZ collaboration, Y. Abe et al., First measurement of θ13 from delayed
neutron capture on hydrogen in the Double CHOOZ experiment, Phys. Lett. B 723 (2013) 66
[arXiv:1301.2948] [INSPIRE].
[3] Double CHOOZ collaboration, Y. Abe et al., Background-independent measurement of θ13in Double CHOOZ, Phys. Lett. B 735 (2014) 51 [arXiv:1401.5981] [INSPIRE].
[4] Daya Bay collaboration, F.P. An et al., Spectral measurement of electron antineutrino
oscillation amplitude and frequency at Daya Bay, Phys. Rev. Lett. 112 (2014) 061801
[arXiv:1310.6732] [INSPIRE].
[5] RENO collaboration, J.K. Ahn et al., Observation of reactor electron antineutrino
disappearance in the RENO experiment, Phys. Rev. Lett. 108 (2012) 191802
[arXiv:1204.0626] [INSPIRE].
[6] MINOS collaboration, P. Adamson et al., Electron neutrino and antineutrino appearance in
the full MINOS data sample, Phys. Rev. Lett. 110 (2013) 171801 [arXiv:1301.4581]
[INSPIRE].
[7] T2K collaboration, K. Abe et al., Observation of electron neutrino appearance in a muon
neutrino beam, Phys. Rev. Lett. 112 (2014) 061802 [arXiv:1311.4750] [INSPIRE].
– 38 –
JHEP10(2014)086
[8] Particle Data Group collaboration, J. Beringer et al., Review of particle physics (RPP),
Phys. Rev. D 86 (2012) 010001 [INSPIRE].
[9] C. Aberle et al., Large scale Gd-beta-diketonate based organic liquid scintillator production
for antineutrino detection, 2012 JINST 7 P06008 [arXiv:1112.5941] [INSPIRE].
[10] T. Matsubara et al., Evaluation of 400 low background 10 in. photo-multiplier tubes for the
Double CHOOZ experiment, Nucl. Instrum. Meth. A 661 (2012) 16 [INSPIRE].
[11] C. Bauer et al., Qualification tests of 474 photomultiplier tubes for the inner detector of the
Double CHOOZ experiment, 2011 JINST 6 P06008 [arXiv:1104.0758] [INSPIRE].
[12] E. Calvo et al., Characterization of large area photomutipliers under low magnetic fields:
design and performance of the magnetic shielding for the Double CHOOZ neutrino
experiment, Nucl. Instrum. Meth. A 621 (2010) 222 [arXiv:0905.3246] [INSPIRE].
[13] A. Cabrera, The Double CHOOZ detector, Nucl. Instrum. Meth. A 617 (2010) 473 [INSPIRE].
[14] K. Schreckenbach, G. Colvin, W. Gelletly and F. Von Feilitzsch, Determination of the
anti-neutrino spectrum from 235U thermal neutron fission products up to 9.5 MeV, Phys.
Lett. B 160 (1985) 325 [INSPIRE].
[15] F. Von Feilitzsch, A.A. Hahn and K. Schreckenbach, Experimental beta-spectra from 239Pu
and 235U thermal neutron fission products and their correlated antineutrino spectra, Phys.
Lett. B 118 (1982) 162 [INSPIRE].
[16] A.A. Hahn et al., Anti-neutrino spectra from 241Pu and 239Pu thermal neutron fission
products, Phys. Lett. B 218 (1989) 365 [INSPIRE].
[17] A.C. Hayes, J.L. Friar, G.T. Garvey, G. Jungman and G. Jonkmans, Systematic
uncertainties in the analysis of the reactor neutrino anomaly, Phys. Rev. Lett. 112 (2014)
202501 [arXiv:1309.4146] [INSPIRE].
[18] N. Haag et al., Experimental determination of the antineutrino spectrum of the fission
products of 238U, Phys. Rev. Lett. 112 (2014) 122501 [arXiv:1312.5601] [INSPIRE].
[19] M. Fallot et al., New antineutrino energy spectra predictions from the summation of beta
decay branches of the fission products, Phys. Rev. Lett. 109 (2012) 202504
[arXiv:1208.3877] [INSPIRE].
[20] Th.A. Mueller et al., Improved predictions of reactor antineutrino spectra, Phys. Rev. C 83
(2011) 054615 [arXiv:1101.2663] [INSPIRE].
[21] O. Meplan et al., MURE: MCNP utility for reactor evolution — description of the methods,
first applications and results, in ENC 2005: European Nuclear Conference; nuclear power for
the XXIst century: from basic research to high-tech industry, (2005).
[22] MURE, MCNP utility for reactor evolution: couples Monte-Carlo transport with fuel burnup
calculations, http://www.oecd-nea.org/tools/abstract/detail/nea-1845, NEA-1845/01,
(2009).
[23] C.L. Jones et al., Reactor simulation for antineutrino experiments using DRAGON and
MURE, Phys. Rev. D 86 (2012) 012001 [arXiv:1109.5379] [INSPIRE].
[24] Y. Declais et al., Study of reactor anti-neutrino interaction with proton at Bugey nuclear
power plant, Phys. Lett. B 338 (1994) 383 [INSPIRE].
[25] J. Allison et al., GEANT4 developments and applications, IEEE Trans. Nucl. Sci. 53 (2006)
270 [INSPIRE].
– 39 –
JHEP10(2014)086
[26] GEANT4 collaboration, S. Agostinelli et al., GEANT4: a simulation toolkit, Nucl. Instrum.
Meth. A 506 (2003) 250 [INSPIRE].
[27] J.R. Granada, Slow-neutron scattering by molecular gases: a synthetic scattering function,
Phys. Rev. B 31 (1985) 4167.
[28] Y. Abe et al., The waveform digitiser of the Double CHOOZ experiment: performance and
quantisation effects on photomultiplier tube signals, 2013 JINST 8 P08015
[arXiv:1307.4917] [INSPIRE].
[29] C. Aberle, C. Buck, F.X. Hartmann, S. Schonert and S. Wagner, Light output of Double
CHOOZ scintillators for low energy electrons, 2011 JINST 6 P11006 [INSPIRE].
[30] C. Aberle, C. Buck, F.X. Hartmann and S. Schonert, Light yield and energy transfer in a
new Gd-loaded liquid scintillator, Chem. Phys. Lett. 516 (2011) 257 [INSPIRE].
[31] Double CHOOZ collaboration, Y. Abe et al., Precision muon reconstruction in Double
CHOOZ, Nucl. Instrum. Meth. A 764 (2014) 330 [arXiv:1405.6227] [INSPIRE].
[32] E.J. Axton and A.G. Bardell, Neutron yield from the spontaneous fission of 252Cf(ν),
Metrologia 21 (1985) 59.
[33] TRIPOLI-4 version 8.1, 3D general purpose continuous energy Monte Carlo transport code,
NEA-1716/07, http://www.oecd-nea.org/tools/abstract/detail/nea-1716, (2013).
[34] KamLAND collaboration, S. Abe et al., Production of radioactive isotopes through cosmic
muon spallation in KamLAND, Phys. Rev. C 81 (2010) 025807 [arXiv:0907.0066]
[INSPIRE].
[35] Double CHOOZ collaboration, Y. Abe et al., Direct measurement of backgrounds using
reactor-off data in Double CHOOZ, Phys. Rev. D 87 (2013) 011102 [arXiv:1210.3748]
[INSPIRE].
[36] MINOS collaboration, P. Adamson et al., Combined analysis of νµ disappearance and
νµ → νe appearance in MINOS using accelerator and atmospheric neutrinos, Phys. Rev. Lett.
112 (2014) 191801 [arXiv:1403.0867] [INSPIRE].
[37] T2K collaboration, K. Abe et al., Precise measurement of the neutrino mixing parameter θ23from muon neutrino disappearance in an off-axis beam, Phys. Rev. Lett. 112 (2014) 181801
[arXiv:1403.1532] [INSPIRE].
[38] CHOOZ collaboration, M. Apollonio et al., Limits on neutrino oscillations from the
CHOOZ experiment, Phys. Lett. B 466 (1999) 415 [hep-ex/9907037] [INSPIRE].
[39] D.A. Dwyer and T.J. Langford, Spectral structure of electron antineutrinos from nuclear
reactors, arXiv:1407.1281 [INSPIRE].
– 40 –