The analysis of fat-soluble vitamins in dairy cow milk by ...
140
The analysis of fat-soluble vitamins in dairy cow milk by high performance liquid chromatography-ion trap mass spectrometry Submitted by Timothy Edward Plozza, B.App.Sc. Thesis submitted in fulfilment of the requirements for the degree of Master of Science College of Engineering & Science Victoria University Werribee, Victoria 3030 Australia February 2017
Transcript of The analysis of fat-soluble vitamins in dairy cow milk by ...
The analysis of fat-soluble vitamins in dairy cow milk by high
performance liquid chromatography-ion trap mass
spectrometry
Submitted by
Timothy Edward Plozza, B.App.Sc.
Thesis submitted in fulfilment of the requirements for the degree of
Master of Science
College of Engineering & Science
Victoria University
Werribee, Victoria 3030
Australia
February 2017
ii
Abstract
Fat-soluble vitamins A, D, E, and vitamin A precursor β-carotene are essential nutrients
for the human body. The analysis of these compounds is difficult due to low levels (ppt
- ppm), and physical and chemical similarity to other compounds present in foods.
Traditionally, the determinative step uses high performance liquid chromatography
(HPLC) coupled to either ultraviolet-visible (A, D, E and β-carotene) or fluorescence (A
and E) detection.
The work described in this thesis demonstrates that HPLC coupled with mass
spectrometry (MS) is a viable alternative due to its superior selectivity and sensitivity,
reducing the need for time-consuming sample preparation, and enabling the analysis of
several vitamins in a single analytical method.
High performance liquid chromatography-ion trap mass spectrometry (HPLC-MSn) and
high performance liquid chromatography-tandem mass spectrometry (HPLC-MS/MS)
methods were developed to measure the levels of vitamin D3 in fortified commercial
cow’s milk (2 μg/100 ml), unfortified commercial and fresh cow’s milk (0.01-0.05
μg/100 ml). An additional solid phase extraction step enabled the lower levels (<0.1
μg/100 ml) to be measured. 25-hydroxyvitamin D3 was also measured, although the
extraction procedure was not fully optimised for this compound.
A single HPLC-MSn method suitable for the analysis of all trans-retinol (vitamin A), α-
tocopherol (vitamin E) and β-carotene in cow’s milk was also developed. This method
was used to measure the effects of different supplementary feeding regimes on the fat-
soluble vitamin content of milk from pasture-fed dairy cows. Typical levels were all
trans-retinol, 45 μg/100 ml; α-tocopherol, 150 μg/100 ml; and β-carotene, 12 μg/100
ml.
The results from the feeding experiment showed reductions in the levels of β-carotene
and α-tocopherol in milk due to the feeding of Partial Mixed Rations, most likely due to
reduced intake of pasture, which was the major source of these compounds in the cows’
diet.
iii
Declaration of authenticity
I, Timothy Edward Plozza, declare that the Master by Research thesis entitled “The
analysis of fat-soluble vitamins in dairy cow milk by high performance liquid
chromatography-ion trap mass spectrometry” is no more than 60,000 words in length
including quotes and exclusive of tables, figures, appendices, bibliography, references
and footnotes. This thesis contains no material that has been submitted previously, in
whole or in part, for the award of any other academic degree or diploma. Except where
otherwise indicated, this thesis is my own work.
Timothy Edward Plozza
14 February 2017
iv
Acknowledgements
Thank you to my principal supervisor, Dr Domenico Caridi, and industry supervisor, Dr
Craige Trenerry, for their support and guidance to conduct this research as a Masters
degree. And thank you Craige for your help and encouragement to publish my work.
I would like to extend my appreciation to the staff of Department of Primary Industries
Ellinbank, in particular Dr William Wales head of the project, Dr Martin Auldist, Jae
Greenwood, the farm staff for their help with the collection of milk samples, and
Murray Hannah, who provided biometrical advice.
Thank you to my work colleagues over the years, particularly Dario Stefanelli, Ian
Porter and Bruce Shelley for their support and encouragement to complete the write up
of this thesis.
Thanks to Dr Simone Rochfort, Agribio-Centre for AgriBioscience, Department of
Primary Industries Bundoora, for demonstrating how to use the high performance liquid
chromatography-ion trap mass spectrometer.
Financial assistance for this research was provided by Department of Primary Industries
and Victoria University. The dairy feeding systems experiment was funded by
Department of Primary Industries and Dairy Australia.
Finally, I would like to thank my family that grew by three children while I completed
this project. They have been a source of much distraction, but that is life ☺
v
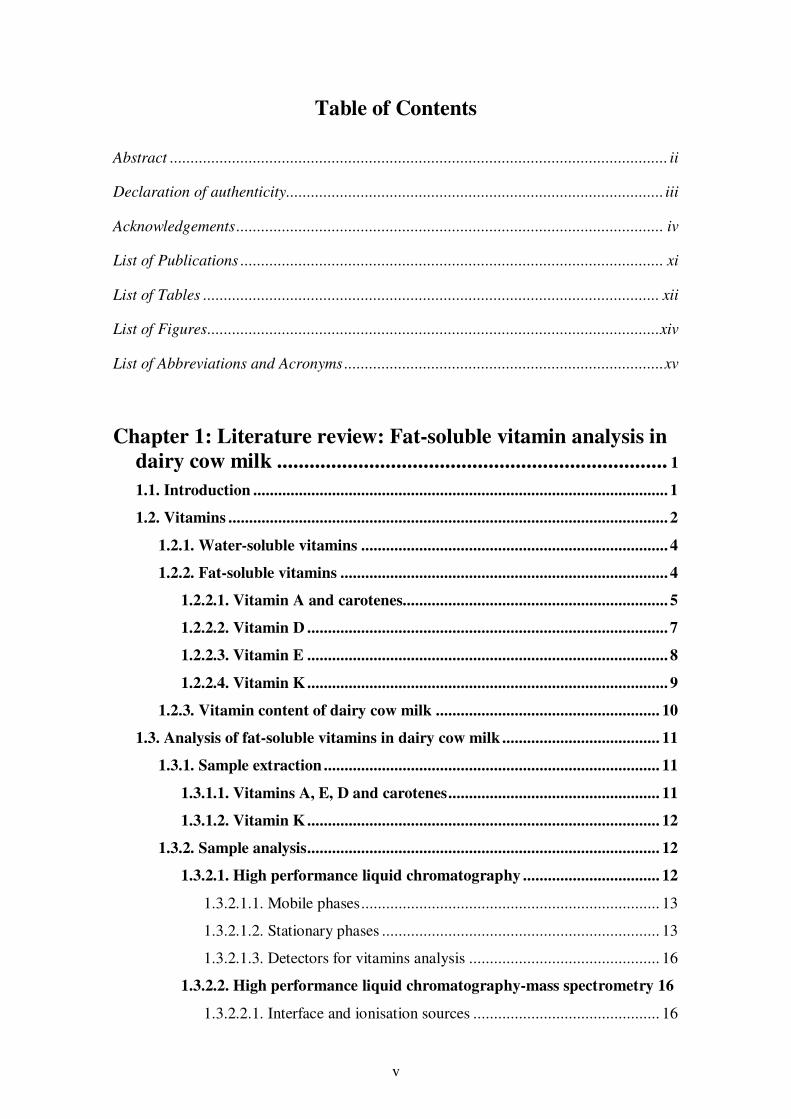
Table of Contents
Abstract ........................................................................................................................ ii
Declaration of authenticity ........................................................................................... iii
Acknowledgements ....................................................................................................... iv
List of Publications ...................................................................................................... xi
List of Tables .............................................................................................................. xii
List of Figures ............................................................................................................. xiv
List of Abbreviations and Acronyms ............................................................................. xv
Chapter 1: Literature review: Fat-soluble vitamin analysis in
dairy cow milk ........................................................................ 1
1.1. Introduction .................................................................................................... 1
1.2. Vitamins .......................................................................................................... 2
1.2.1. Water-soluble vitamins .......................................................................... 4
1.2.2. Fat-soluble vitamins ............................................................................... 4
1.2.2.1. Vitamin A and carotenes................................................................ 5
1.2.2.2. Vitamin D ....................................................................................... 7
1.2.2.3. Vitamin E ....................................................................................... 8
1.2.2.4. Vitamin K ....................................................................................... 9
1.2.3. Vitamin content of dairy cow milk ...................................................... 10
1.3. Analysis of fat-soluble vitamins in dairy cow milk ...................................... 11
1.3.1. Sample extraction ................................................................................. 11
1.3.1.1. Vitamins A, E, D and carotenes ................................................... 11
1.3.1.2. Vitamin K ..................................................................................... 12
1.3.2. Sample analysis ..................................................................................... 12
1.3.2.1. High performance liquid chromatography ................................. 12
1.3.2.1.1. Mobile phases ........................................................................ 13
1.3.2.1.2. Stationary phases ................................................................... 13
1.3.2.1.3. Detectors for vitamins analysis .............................................. 16
1.3.2.2. High performance liquid chromatography-mass spectrometry 16
1.3.2.2.1. Interface and ionisation sources ............................................. 16
vi
Electrospray ionisation .................................................................... 18
Atmospheric pressure chemical ionisation ....................................... 19
1.3.2.2.2. Mass analysers ....................................................................... 20
Single quadrupole ............................................................................ 20
Triple quadrupole (tandem mass spectrometer) ............................... 20
Ion trap ............................................................................................ 20
Time of flight, Fourier transform ion cyclotron resonance and
Orbitrap .......................................................................................... 21
1.3.2.2.3. Interferences .......................................................................... 22
1.3.2.2.4. Internal standards ................................................................... 23
1.3.2.2.5. Mobile phase additives .......................................................... 23
1.4. Analytical method validation ....................................................................... 24
1.5. Significance ................................................................................................... 26
1.6. Objectives of this study ................................................................................. 26
Chapter 2: Materials and methods ........................................... 28
2.1. Introduction .................................................................................................. 28
2.2. Materials ....................................................................................................... 29
2.3. Analytical methods ....................................................................................... 33
2.4. Standard preparation ................................................................................... 33
2.4.1. Calculation of stock standard concentrations ..................................... 33
2.4.2. Preparation of vitamin D3 and 25-hydroxyvitamin D3 standards ....... 34
2.4.2.1. Analytical standards for the analysis of non-fortified samples .. 34
2.4.2.2. Analytical standards for the analysis of fortified samples .......... 34
2.4.3. Preparation of all trans-retinol, α-tocopherol and β-carotene
standards ............................................................................................. 35
2.4.3.1. Analytical standards .................................................................... 35
2.5. Sampling, preparation and storage of milk ................................................. 35
2.5.1. Vitamin D3 ............................................................................................ 35
2.5.2. Vitamin A, E and β-carotene................................................................ 36
2.6. Vitamin D ...................................................................................................... 36
2.6.1. Sample extraction ................................................................................. 36
2.6.1.1. Fortified commercial cow milk and infant formula .................... 36
2.6.1.2. Non-fortified commercial cow milk and fresh cow milk ............. 37
vii
2.6.2. Analysis ................................................................................................. 37
2.6.2.1. High performance liquid chromatography-ion trap mass
spectrometry .................................................................................. 37
2.6.2.1.1. Fortified samples ................................................................... 38
2.6.2.1.2. Non-fortified samples ............................................................ 38
2.6.2.2. High performance liquid chromatography-tandem mass
spectrometry .................................................................................. 38
2.7. Vitamin A, E and β-carotene ........................................................................ 41
2.7.1. Sample extraction ................................................................................. 41
2.7.2. Analysis ................................................................................................. 41
2.7.2.1. High performance liquid chromatography-ion trap mass
spectrometry .................................................................................. 41
2.7.2.2. HPLC-UV/Vis and HPLC-Fl ....................................................... 42
2.7.2.2.1. All trans-retinol and α-tocopherol .......................................... 42
2.7.2.2.2. β-carotene .............................................................................. 42
2.8. Dairy cow feeding systems experiment ........................................................ 44
2.8.1. Experimental design ............................................................................. 44
2.8.2. Dietary treatments ................................................................................ 45
2.8.3. Sample collection .................................................................................. 47
2.8.4. Sample analysis ..................................................................................... 48
2.8.5. Statistical analysis................................................................................. 48
Chapter 3: Vitamin D analytical method ................................. 49
3.1. Introduction .................................................................................................. 49
3.2. Method development .................................................................................... 49
3.2.1. Mass spectrometer ................................................................................ 50
3.2.1.1. Atmospheric pressure ionisation interface .................................. 50
3.2.1.1.1. Electrospray ionisation........................................................... 51
3.2.1.1.2. Atmospheric pressure chemical ionisation ............................. 51
3.2.1.2. Mass spectrometer fragmentations ............................................. 51
3.2.2. High performance liquid chromatography column and mobile
phase .................................................................................................... 52
3.2.3. Sample extraction ................................................................................. 53
3.2.3.1. Fortified milk samples ................................................................. 53
viii
3.2.3.2. Non-fortified milk samples .......................................................... 53
3.2.4. Analytical method................................................................................. 54
3.2.4.1. Validation ..................................................................................... 54
3.3. Results ........................................................................................................... 55
3.3.1. Mass spectrometer ................................................................................ 55
3.3.1.1. Ion trap mass spectrometer ......................................................... 55
3.3.1.1.1. Atmospheric pressure ionisation interface .............................. 55
Electrospray ionisation .................................................................... 55
Atmospheric pressure chemical ionisation ....................................... 55
3.3.1.1.2. Ion trap mass spectrometer fragmentations............................. 57
3.3.1.2. Triple quadrupole mass spectrometer ......................................... 59
3.3.1.2.1. Atmospheric pressure ionisation interface .............................. 59
Electrospray ionisation .................................................................... 59
Atmospheric pressure chemical ionisation ....................................... 59
3.3.1.2.2. Tandem mass spectrometry fragmentations ............................ 60
3.3.2. High performance liquid chromatography ......................................... 60
3.3.2.1. Phenomenex Luna C18(2) ............................................................ 60
3.3.2.2. Varian Pursuit diphenyl .............................................................. 60
3.3.2.3. Varian Polaris C18-A ................................................................... 61
3.3.3. Sample extraction ................................................................................. 61
3.3.3.1. Fortified milk samples ................................................................. 61
3.3.3.2. Non-fortified samples ................................................................... 61
3.3.4. Method validation................................................................................. 64
3.3.4.1. Linearity ....................................................................................... 64
3.3.4.2. Precision ....................................................................................... 65
3.3.4.3. Trueness or bias ........................................................................... 65
3.3.4.4. Recovery ....................................................................................... 66
3.3.4.5. Reproducibility............................................................................. 66
3.3.4.6. Limit of quantification ................................................................. 66
3.4. Discussion ...................................................................................................... 67
3.5. Conclusion ..................................................................................................... 70
ix
Chapter 4: Vitamins A, E and β-carotene analytical method 71
4.1. Introduction .................................................................................................. 71
4.2. Method development .................................................................................... 72
4.2.1. Mass spectrometer ................................................................................ 72
4.2.1.1. Atmospheric pressure ionisation interface .................................. 72
4.2.1.1.1. Atmospheric pressure chemical ionisation ............................. 72
4.2.1.1.2. Ion trap fill time ..................................................................... 73
4.2.1.1.3. Ion optics voltages ................................................................. 73
4.2.1.2. Ion trap fragmentations ............................................................... 73
4.2.2. High performance liquid chromatography ......................................... 73
4.2.2.1. Column ......................................................................................... 74
4.2.2.2. Mobile phase................................................................................. 74
4.2.2.3. Flow rate and column temperature ............................................. 74
4.2.3. Sample extraction ................................................................................. 74
4.2.4. Analytical method................................................................................. 76
4.2.4.1. Validation ..................................................................................... 76
4.2.4.2. Measurement uncertainty ............................................................ 76
4.3. Results ........................................................................................................... 76
4.3.1. Mass spectrometer ................................................................................ 76
4.3.1.1. Atmospheric pressure chemical ionisation .................................. 76
4.3.1.2. Ion trap fragmentations ............................................................... 77
4.3.2. High performance liquid chromatography ......................................... 81
4.3.2.1. Column ......................................................................................... 81
4.3.2.2. Mobile phase................................................................................. 81
4.3.2.2.1. Isocratic conditions ................................................................ 81
4.3.2.2.2. Gradient conditions ................................................................ 81
4.3.3. Sample extraction ................................................................................. 82
4.3.4. Method validation................................................................................. 83
4.3.4.1. Linearity ....................................................................................... 83
4.3.4.2. Vitamin levels in fresh milk samples ........................................... 85
4.3.4.3. Proficiency sample data ............................................................... 85
4.3.4.4. Recovery ....................................................................................... 86
4.3.4.5. Instrument repeatability .............................................................. 86
x
4.3.4.6. Method repeatability .................................................................... 87
4.3.4.7. Limit of quantification ................................................................. 88
4.3.4.8. Measurement uncertainty ............................................................ 88
4.3.5. Unknown compound ............................................................................ 88
4.4. Discussion ...................................................................................................... 89
4.5. Conclusion ..................................................................................................... 92
Chapter 5: Feeding experiment ................................................ 93
5.1. Introduction .................................................................................................. 93
5.2. Results ........................................................................................................... 94
5.2.1. Milk samples ......................................................................................... 94
5.2.2. Vitamin content of the dairy cow diets ................................................ 96
5.3. Discussion ...................................................................................................... 97
5.4. Conclusion ..................................................................................................... 99
Chapter 6: General discussion ................................................ 100
6.1. Introduction ................................................................................................ 100
6.2. Summary of major findings........................................................................ 102
6.2.1. Vitamin D3 .......................................................................................... 102
6.2.2. Vitamins A, E and β-carotene ............................................................ 103
6.2.3. Feeding systems experiment ............................................................... 104
6.3. Application and implication of these results.............................................. 104
6.4. Conclusions ................................................................................................. 106
References ................................................................................ 107
Appendix 1. Examples of HPLC conditions used in the analysis of fat-soluble
vitamins .............................................................................................................. 115
Appendix 2. The complete set of analytical results of the feeding experiment ..... 123
xi
List of Publications
Publications arising from this thesis are presented below:
Plozza, T., Trenerry, V.C., Caridi, D. (2012). The simultaneous determination of
vitamins A, E and β-carotene in bovine milk by high performance liquid
chromatography-ion trap mass spectrometry (HPLC-MSn). Food Chemistry, 134(1)
559-563.
Tim Plozza, Craige Trenerry, Domenico Caridi. The determination of vitamins A, E and
β-carotene in milk by LC-ion trap MS. 12th Government Food Analysts Conference.
22-24 February 2011, Brisbane (Presentation).
Trenerry, V.C., Plozza, T., Caridi, D., Murphy, S. (2011). The determination of vitamin
D3 in bovine milk by liquid chromatography mass spectrometry. Food Chemistry,
125(4) 1314-1319.
Trenerry, V.C., Plozza, T., Caridi, D., Murphy, S. Milk, vitamin D3 and liquid
chromatography-mass spectrometry. 11th Government Food Analysts Conference. 22-24
February 2009, Melbourne (Poster).
xii
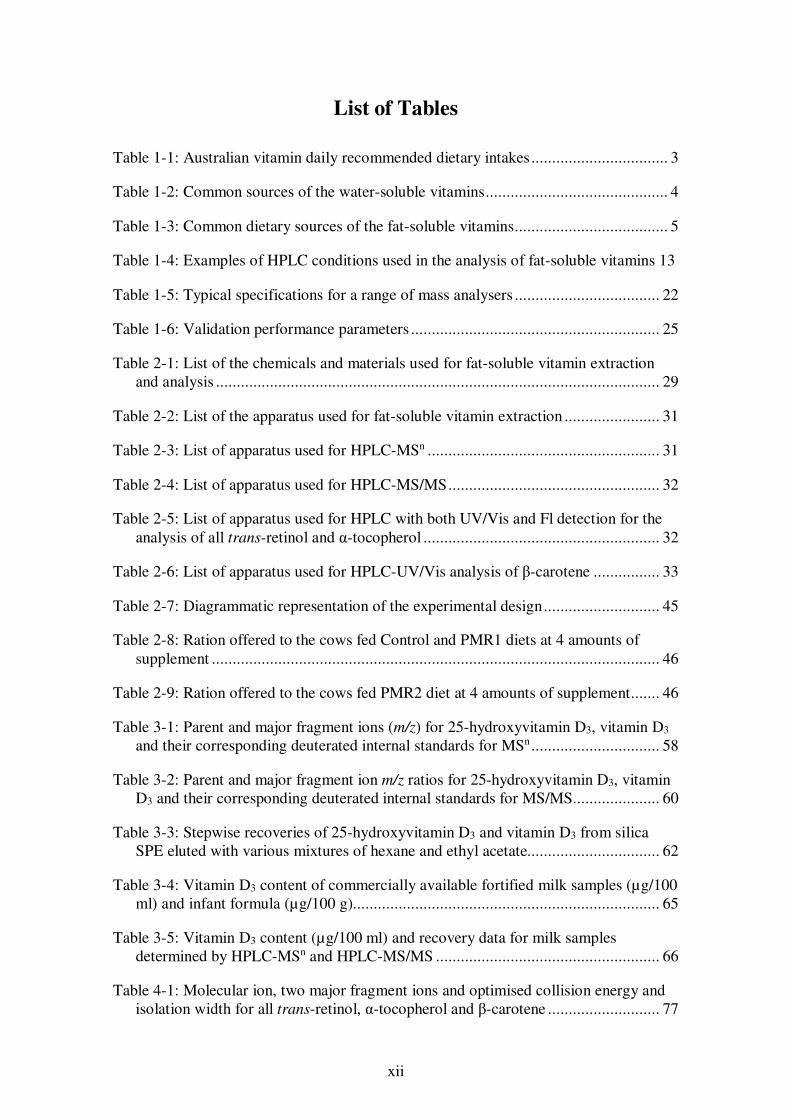
List of Tables
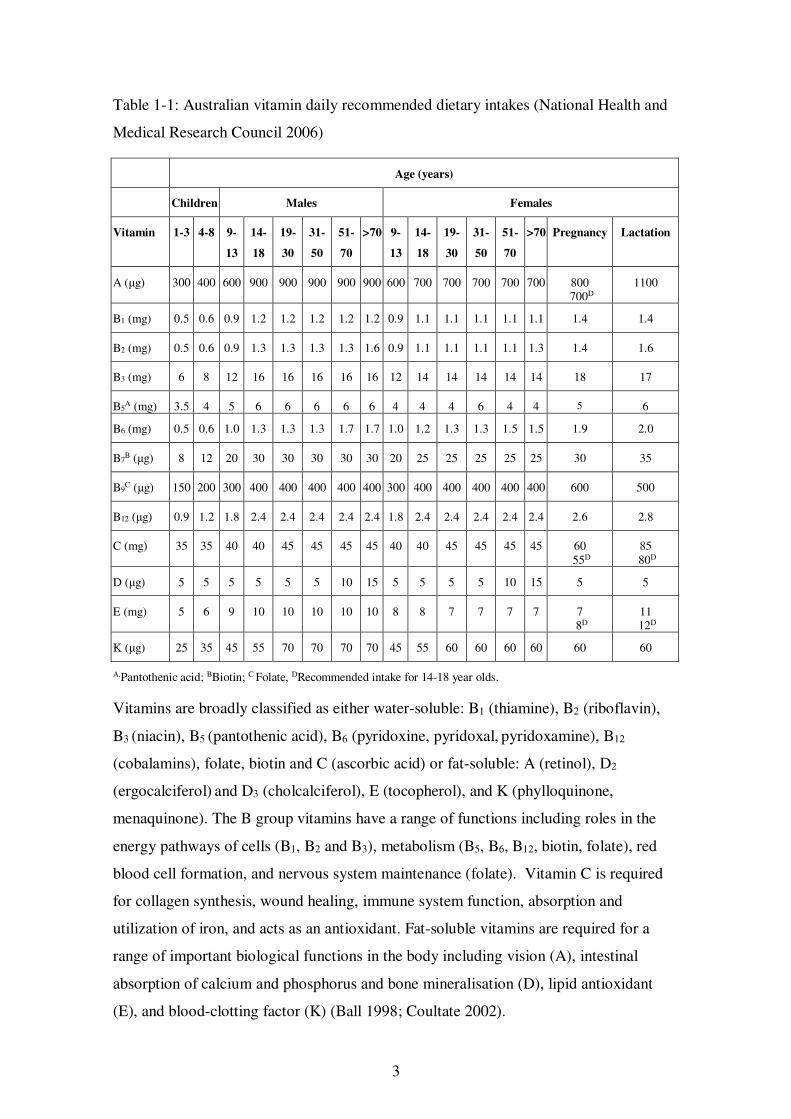
Table 1-1: Australian vitamin daily recommended dietary intakes ................................. 3
Table 1-2: Common sources of the water-soluble vitamins ............................................ 4
Table 1-3: Common dietary sources of the fat-soluble vitamins..................................... 5
Table 1-4: Examples of HPLC conditions used in the analysis of fat-soluble vitamins 13
Table 1-5: Typical specifications for a range of mass analysers ................................... 22
Table 1-6: Validation performance parameters ............................................................ 25
Table 2-1: List of the chemicals and materials used for fat-soluble vitamin extraction and analysis ........................................................................................................... 29
Table 2-2: List of the apparatus used for fat-soluble vitamin extraction ....................... 31
Table 2-3: List of apparatus used for HPLC-MSn ........................................................ 31
Table 2-4: List of apparatus used for HPLC-MS/MS ................................................... 32
Table 2-5: List of apparatus used for HPLC with both UV/Vis and Fl detection for the analysis of all trans-retinol and α-tocopherol ......................................................... 32
Table 2-6: List of apparatus used for HPLC-UV/Vis analysis of β-carotene ................ 33
Table 2-7: Diagrammatic representation of the experimental design ............................ 45
Table 2-8: Ration offered to the cows fed Control and PMR1 diets at 4 amounts of supplement ............................................................................................................ 46
Table 2-9: Ration offered to the cows fed PMR2 diet at 4 amounts of supplement ....... 46
Table 3-1: Parent and major fragment ions (m/z) for 25-hydroxyvitamin D3, vitamin D3 and their corresponding deuterated internal standards for MSn ............................... 58
Table 3-2: Parent and major fragment ion m/z ratios for 25-hydroxyvitamin D3, vitamin D3 and their corresponding deuterated internal standards for MS/MS..................... 60
Table 3-3: Stepwise recoveries of 25-hydroxyvitamin D3 and vitamin D3 from silica SPE eluted with various mixtures of hexane and ethyl acetate................................ 62
Table 3-4: Vitamin D3 content of commercially available fortified milk samples (µg/100 ml) and infant formula (µg/100 g).......................................................................... 65
Table 3-5: Vitamin D3 content (µg/100 ml) and recovery data for milk samples determined by HPLC-MSn and HPLC-MS/MS ...................................................... 66
Table 4-1: Molecular ion, two major fragment ions and optimised collision energy and isolation width for all trans-retinol, α-tocopherol and β-carotene ........................... 77
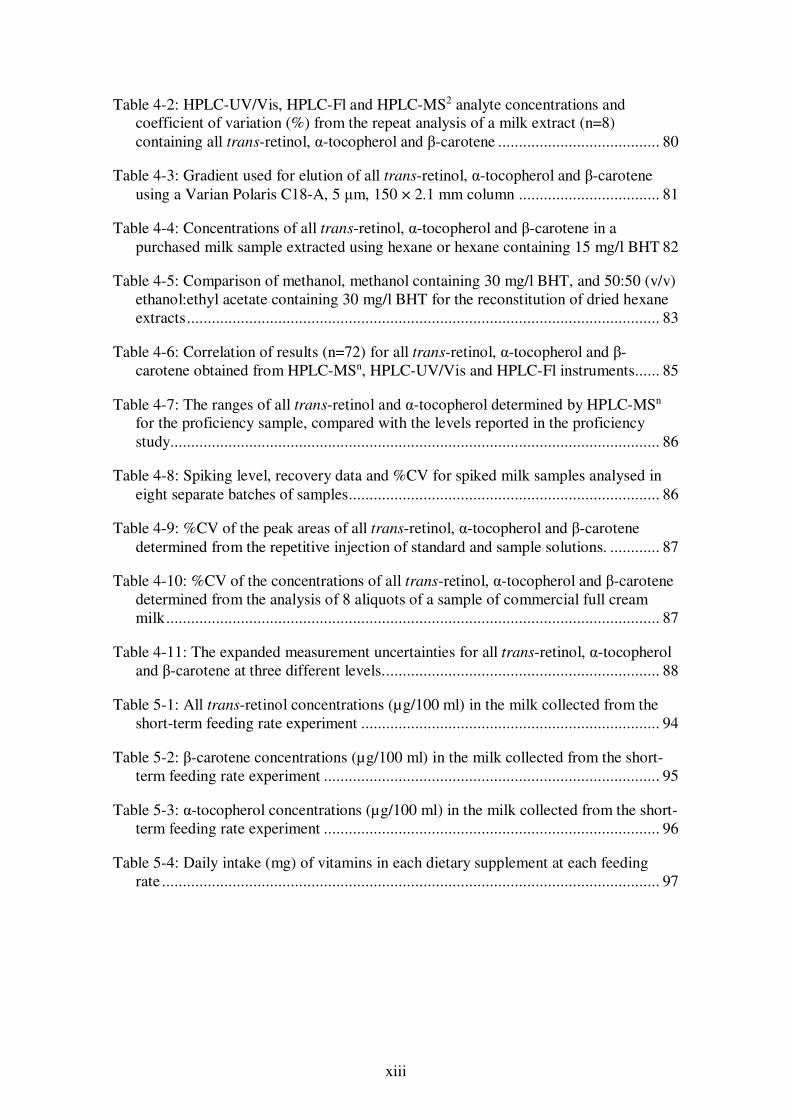
xiii
Table 4-2: HPLC-UV/Vis, HPLC-Fl and HPLC-MS2 analyte concentrations and coefficient of variation (%) from the repeat analysis of a milk extract (n=8) containing all trans-retinol, α-tocopherol and β-carotene ....................................... 80
Table 4-3: Gradient used for elution of all trans-retinol, α-tocopherol and β-carotene using a Varian Polaris C18-A, 5 μm, 150 × 2.1 mm column .................................. 81
Table 4-4: Concentrations of all trans-retinol, α-tocopherol and β-carotene in a purchased milk sample extracted using hexane or hexane containing 15 mg/l BHT 82
Table 4-5: Comparison of methanol, methanol containing 30 mg/l BHT, and 50:50 (v/v) ethanol:ethyl acetate containing 30 mg/l BHT for the reconstitution of dried hexane extracts .................................................................................................................. 83
Table 4-6: Correlation of results (n=72) for all trans-retinol, α-tocopherol and β-carotene obtained from HPLC-MSn, HPLC-UV/Vis and HPLC-Fl instruments...... 85
Table 4-7: The ranges of all trans-retinol and α-tocopherol determined by HPLC-MSn for the proficiency sample, compared with the levels reported in the proficiency study...................................................................................................................... 86
Table 4-8: Spiking level, recovery data and %CV for spiked milk samples analysed in eight separate batches of samples ........................................................................... 86
Table 4-9: %CV of the peak areas of all trans-retinol, α-tocopherol and β-carotene determined from the repetitive injection of standard and sample solutions. ............ 87
Table 4-10: %CV of the concentrations of all trans-retinol, α-tocopherol and β-carotene determined from the analysis of 8 aliquots of a sample of commercial full cream milk ....................................................................................................................... 87
Table 4-11: The expanded measurement uncertainties for all trans-retinol, α-tocopherol and β-carotene at three different levels. .................................................................. 88
Table 5-1: All trans-retinol concentrations (µg/100 ml) in the milk collected from the short-term feeding rate experiment ........................................................................ 94
Table 5-2: β-carotene concentrations (µg/100 ml) in the milk collected from the short-term feeding rate experiment ................................................................................. 95
Table 5-3: α-tocopherol concentrations (µg/100 ml) in the milk collected from the short-term feeding rate experiment ................................................................................. 96
Table 5-4: Daily intake (mg) of vitamins in each dietary supplement at each feeding rate ........................................................................................................................ 97
xiv
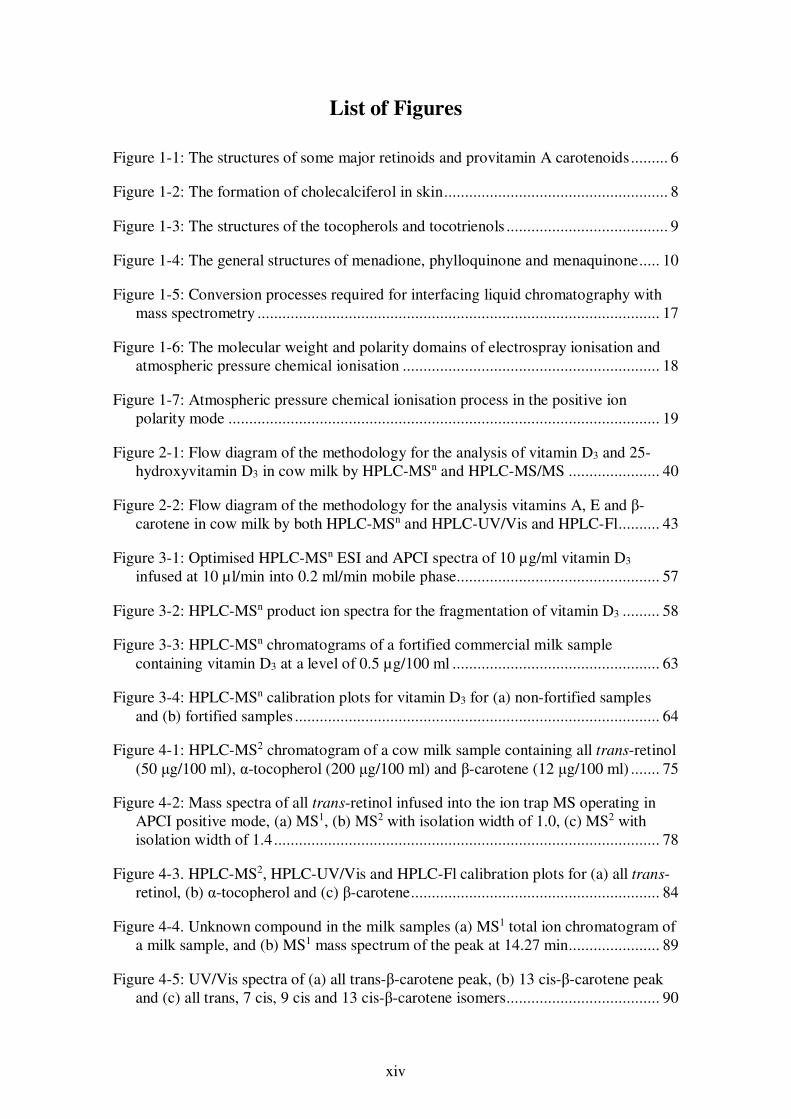
List of Figures
Figure 1-1: The structures of some major retinoids and provitamin A carotenoids ......... 6
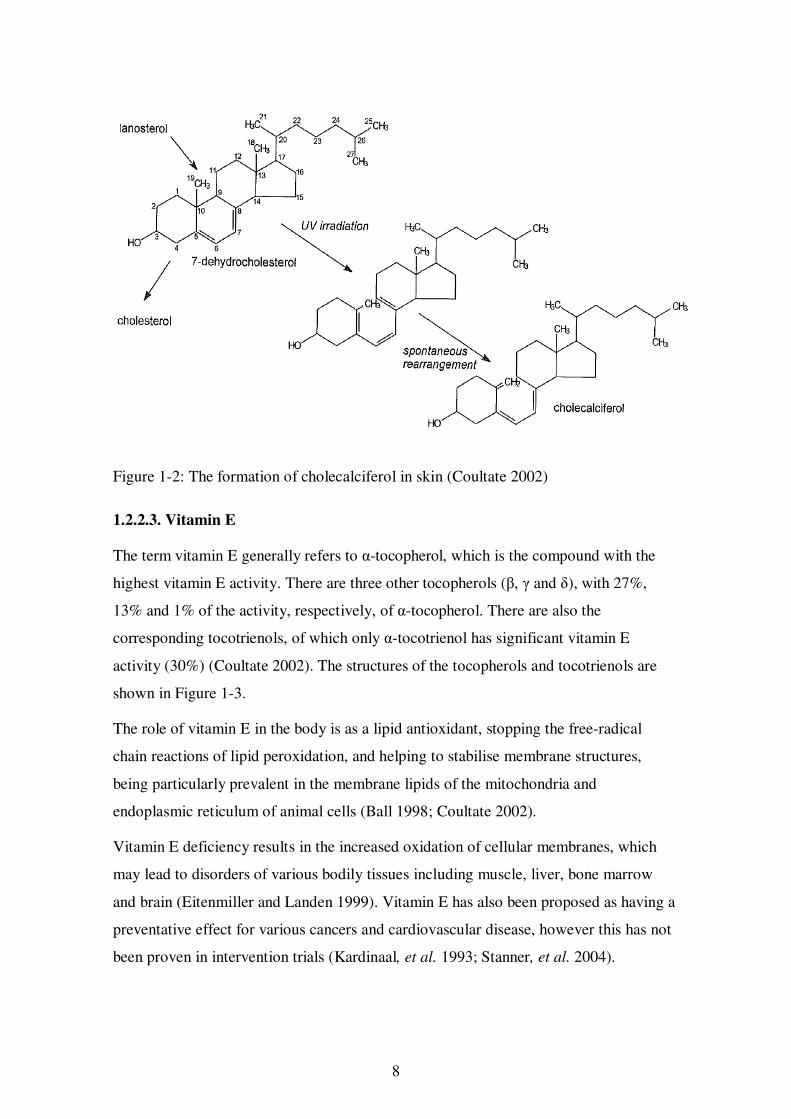
Figure 1-2: The formation of cholecalciferol in skin ...................................................... 8
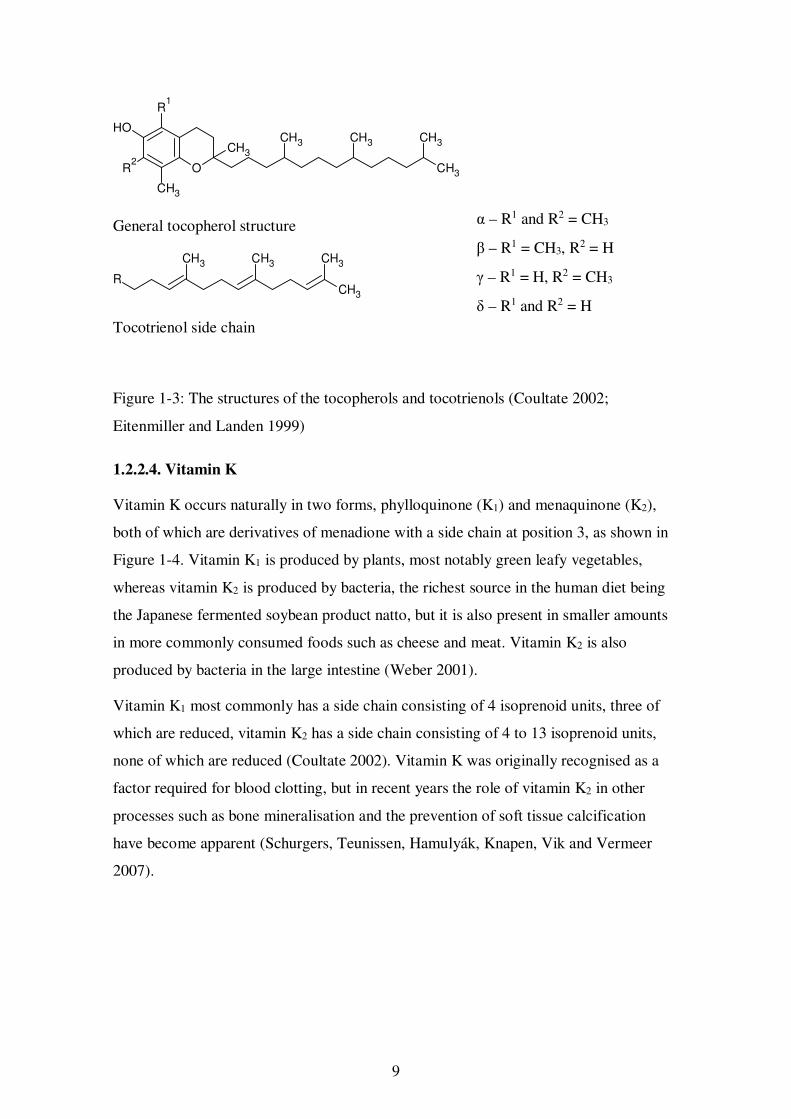
Figure 1-3: The structures of the tocopherols and tocotrienols ....................................... 9
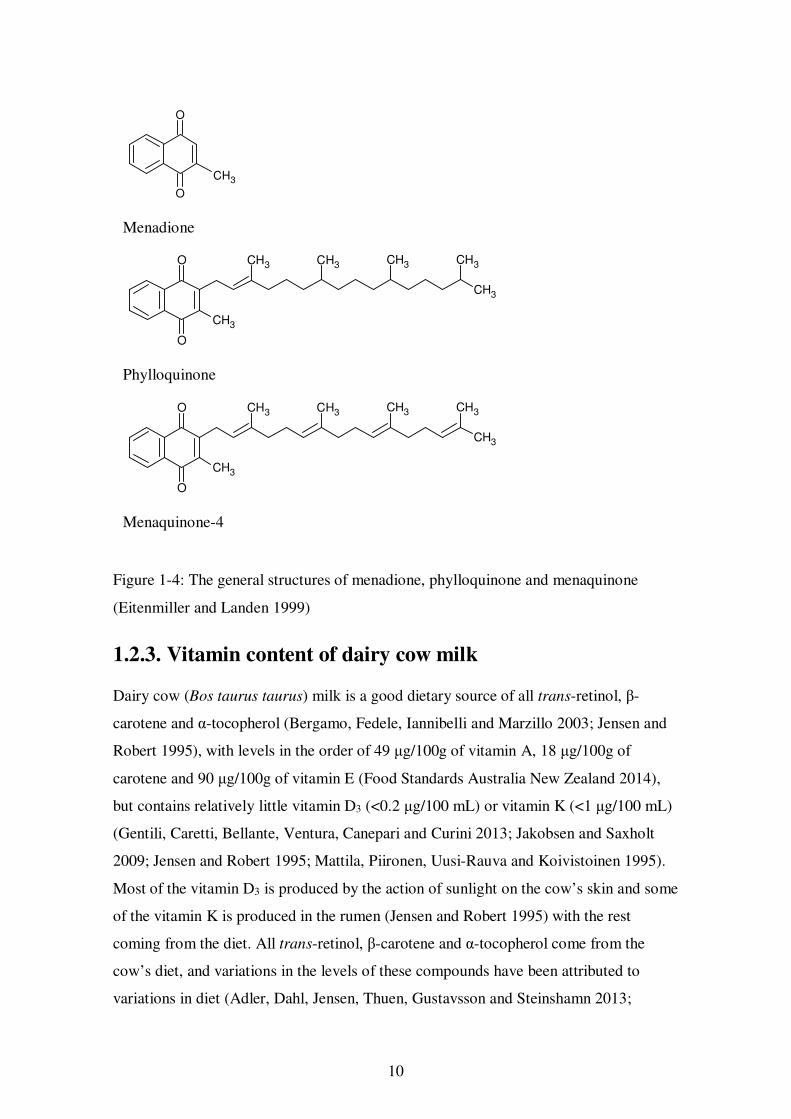
Figure 1-4: The general structures of menadione, phylloquinone and menaquinone ..... 10
Figure 1-5: Conversion processes required for interfacing liquid chromatography with mass spectrometry ................................................................................................. 17
Figure 1-6: The molecular weight and polarity domains of electrospray ionisation and atmospheric pressure chemical ionisation .............................................................. 18
Figure 1-7: Atmospheric pressure chemical ionisation process in the positive ion polarity mode ........................................................................................................ 19
Figure 2-1: Flow diagram of the methodology for the analysis of vitamin D3 and 25-hydroxyvitamin D3 in cow milk by HPLC-MSn and HPLC-MS/MS ...................... 40
Figure 2-2: Flow diagram of the methodology for the analysis vitamins A, E and β-carotene in cow milk by both HPLC-MSn and HPLC-UV/Vis and HPLC-Fl .......... 43
Figure 3-1: Optimised HPLC-MSn ESI and APCI spectra of 10 µg/ml vitamin D3 infused at 10 µl/min into 0.2 ml/min mobile phase................................................. 57
Figure 3-2: HPLC-MSn product ion spectra for the fragmentation of vitamin D3 ......... 58
Figure 3-3: HPLC-MSn chromatograms of a fortified commercial milk sample containing vitamin D3 at a level of 0.5 µg/100 ml .................................................. 63
Figure 3-4: HPLC-MSn calibration plots for vitamin D3 for (a) non-fortified samples and (b) fortified samples ........................................................................................ 64
Figure 4-1: HPLC-MS2 chromatogram of a cow milk sample containing all trans-retinol (50 μg/100 ml), α-tocopherol (200 μg/100 ml) and β-carotene (12 μg/100 ml) ....... 75
Figure 4-2: Mass spectra of all trans-retinol infused into the ion trap MS operating in APCI positive mode, (a) MS1, (b) MS2 with isolation width of 1.0, (c) MS2 with isolation width of 1.4 ............................................................................................. 78
Figure 4-3. HPLC-MS2, HPLC-UV/Vis and HPLC-Fl calibration plots for (a) all trans-retinol, (b) α-tocopherol and (c) β-carotene ............................................................ 84
Figure 4-4. Unknown compound in the milk samples (a) MS1 total ion chromatogram of a milk sample, and (b) MS1 mass spectrum of the peak at 14.27 min...................... 89
Figure 4-5: UV/Vis spectra of (a) all trans-β-carotene peak, (b) 13 cis-β-carotene peak and (c) all trans, 7 cis, 9 cis and 13 cis-β-carotene isomers ..................................... 90
xv
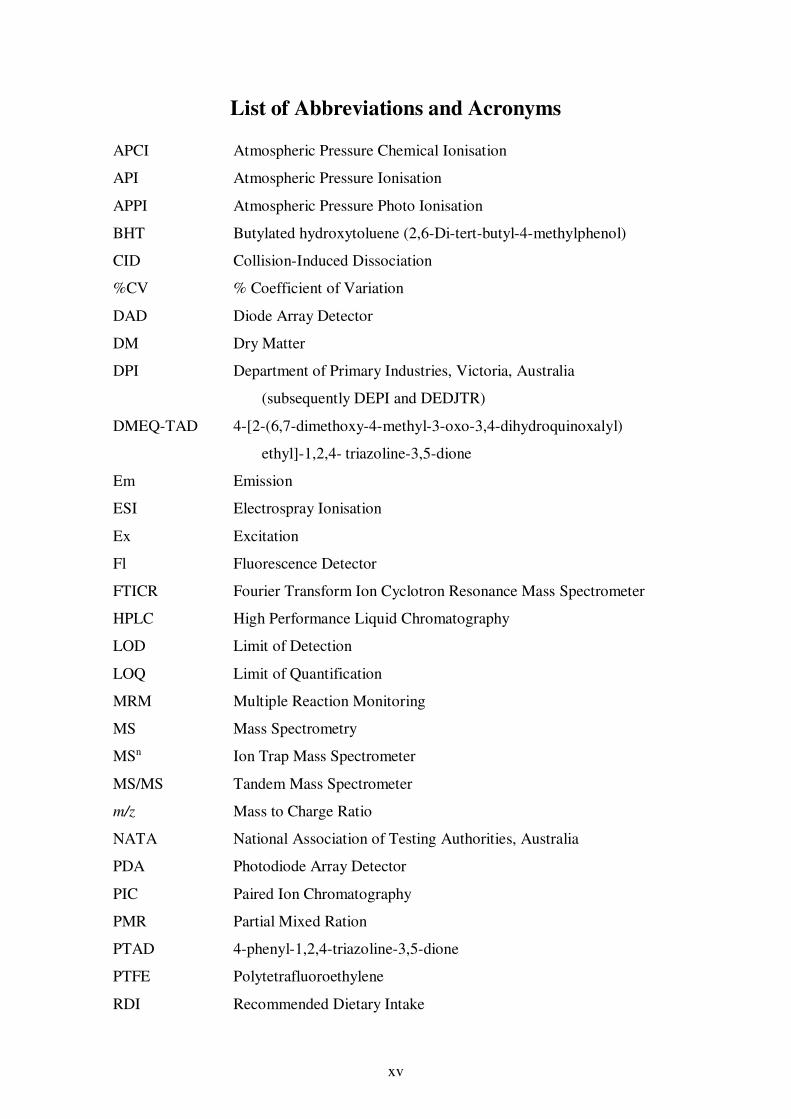
List of Abbreviations and Acronyms
APCI Atmospheric Pressure Chemical Ionisation
API Atmospheric Pressure Ionisation
APPI Atmospheric Pressure Photo Ionisation
BHT Butylated hydroxytoluene (2,6-Di-tert-butyl-4-methylphenol)
CID Collision-Induced Dissociation
%CV % Coefficient of Variation
DAD Diode Array Detector
DM Dry Matter
DPI Department of Primary Industries, Victoria, Australia
(subsequently DEPI and DEDJTR)
DMEQ-TAD 4-[2-(6,7-dimethoxy-4-methyl-3-oxo-3,4-dihydroquinoxalyl)
ethyl]-1,2,4- triazoline-3,5-dione
Em Emission
ESI Electrospray Ionisation
Ex Excitation
Fl Fluorescence Detector
FTICR Fourier Transform Ion Cyclotron Resonance Mass Spectrometer
HPLC High Performance Liquid Chromatography
LOD Limit of Detection
LOQ Limit of Quantification
MRM Multiple Reaction Monitoring
MS Mass Spectrometry
MSn Ion Trap Mass Spectrometer
MS/MS Tandem Mass Spectrometer
m/z Mass to Charge Ratio
NATA National Association of Testing Authorities, Australia
PDA Photodiode Array Detector
PIC Paired Ion Chromatography
PMR Partial Mixed Ration
PTAD 4-phenyl-1,2,4-triazoline-3,5-dione
PTFE Polytetrafluoroethylene
RDI Recommended Dietary Intake
xvi
S/N Signal to Noise ratio
SPE Solid Phase Extraction
SRM Selected Reaction Monitoring
TOF Time of Flight Mass Spectrometer
UHPLC Ultra-High Performance Liquid Chromatography
UV/Vis Ultraviolet Visible Detector
2D LC Two-dimensional Liquid Chromatography
25(OH)D2 25-hydroxyvitamin D2
25(OH)D3 25-hydroxyvitamin D3
1
Chapter 1: Literature review:
Fat-soluble vitamin analysis in dairy cow milk
1.1. Introduction
Fat-soluble vitamins are essential nutrients that are required in sufficient amounts from
the diet to perform vital functions within the body, for example vitamin A is an essential
component of the retina and has a recommended dietary intake of 900 µg/day in adult
males (Ball 1998; National Health and Medical Research Council 2006). Vitamin
determinations in food are carried out for a range of reasons, including nutritional
labelling, quality assurance of fortified products, nutritional surveys, food composition
tables and to assess the effects of environmental and seasonal conditions on levels in
food (Ball 1998).
Fat-soluble vitamin analysis is difficult due to the complexity of the compounds, their
low levels in foods, and their physical and chemical similarity to other compounds
present in foods. Thus, to avoid interferences, the analytical method must extract the
vitamins from the sample matrix, separate them from co-extracted compounds and then
selectively detect their concentration. This is a tedious, time consuming process, and
has traditionally used high performance liquid chromatography (HPLC) to separate the
compounds followed by either ultraviolet visible detection (UV/Vis), for vitamins A, D,
K and carotenes, or fluorescence detector (Fl) for vitamins A, E, K (Ball 1998;
Byrdwell 2009; Byrdwell, DeVries, Exler, Harnly, Holden, Holick, et al. 2008;
Department of Primary Industries 2007; Heudi, Trisconi and Blake 2004; Hulshof, van
Roekel-Jansen, van de Bovenkamp and West 2006; Kurmann and Indyk 1994; Lanina,
Toledo, Sampels, Kamal-Eldin and Jastrebova 2007). However, the compounds are
usually assayed individually due to their chemical diversity and varying levels within
samples.
The relatively recent, rapid advances in HPLC coupled with mass spectrometric
detection (HPLC-MS) have seen it emerge as a major breakthrough in analytical science
(Willoughby 2002). This technique combines the separating power of HPLC with the
extra sensitivity, selectivity and powerful structure elucidation ability of mass
spectrometry, potentially allowing for the analysis of all fat-soluble vitamins with one
analytical method. Numerous HPLC-MS methods for the analysis of fat-soluble
2
vitamins in a variety of matrices have been published, including the analysis of vitamins
A, D, E, and K in breastmilk (Kamao, Tsugawa, Suhara, Wada, Mori, Murata, et al.
2007) and human blood serum (Capote, Jiménez, Granados and De Castro 2007) by
HPLC-MS/MS, vitamin D in fortified foods by HPLC-MS/MS (Byrdwell 2009),
vitamins A, D, and E in infant formula (Heudi, et al. 2004), vitamin D in human blood
serum and fat tissue (Blum, Dolnikowski, Seyoum, Harris, Booth, Peterson, et al.
2008), and tocopherols in sunflower oil and milk by HPLC-MS (Lanina, et al. 2007).
The development of a ‘one-method-fits-all’ method for the determination of fat-soluble
vitamins and β-carotene in milk using HPLC-MSn or HPLC-MS/MS would reduce the
time and increase the cost effectiveness of the analysis of a broad range of fat-soluble
vitamins. HPLC-MSn would also allow for the concurrent acquisition of full-scan MS
data, permitting the retrospective analysis of the full-scan data to search for other fat-
soluble compounds of biological significance e.g. sterols, which may be of interest at a
later date.
1.2. Vitamins
Vitamins are organic compounds in food which are essential for human life, but cannot
be synthesised in our bodies (Coultate 2002). Vitamins D and K are the two exceptions
to this definition: the body can synthesise its own vitamin D through exposure to
ultraviolet B radiation (sunlight), and vitamin K2 is produced by bacteria in the large
intestine. However, in certain circumstances these may be insufficient to meet the
body’s needs, in which case the vitamins must be sourced from the diet. Australian
Recommended Dietary Intakes (RDI) are defined as the average daily dietary intake
level that is sufficient to meet the nutrient requirements of 97–98 per cent of healthy
individuals in a particular life stage and gender group (National Health and Medical
Research Council 2006). The RDI of the vitamins at the various stages of life are
summarised in Table 1-1.
3
Table 1-1: Australian vitamin daily recommended dietary intakes (National Health and
Medical Research Council 2006)
Age (years)
Children Males Females
Vitamin 1-3 4-8 9-
13
14-
18
19-
30
31-
50
51-
70
>70 9-
13
14-
18
19-
30
31-
50
51-
70
>70 Pregnancy Lactation
A (μg) 300 400 600 900 900 900 900 900 600 700 700 700 700 700 800 700D
1100
B1 (mg) 0.5 0.6 0.9 1.2 1.2 1.2 1.2 1.2 0.9 1.1 1.1 1.1 1.1 1.1 1.4 1.4
B2 (mg) 0.5 0.6 0.9 1.3 1.3 1.3 1.3 1.6 0.9 1.1 1.1 1.1 1.1 1.3 1.4 1.6
B3 (mg) 6 8 12 16 16 16 16 16 12 14 14 14 14 14 18 17
B5A (mg) 3.5 4 5 6 6 6 6 6 4 4 4 6 4 4 5 6
B6 (mg) 0.5 0.6 1.0 1.3 1.3 1.3 1.7 1.7 1.0 1.2 1.3 1.3 1.5 1.5 1.9 2.0
B7B (μg) 8 12 20 30 30 30 30 30 20 25 25 25 25 25 30 35
B9C (μg) 150 200 300 400 400 400 400 400 300 400 400 400 400 400 600 500
B12 (μg) 0.9 1.2 1.8 2.4 2.4 2.4 2.4 2.4 1.8 2.4 2.4 2.4 2.4 2.4 2.6 2.8
C (mg) 35 35 40 40 45 45 45 45 40 40 45 45 45 45 60 55D
85 80D
D (μg) 5 5 5 5 5 5 10 15 5 5 5 5 10 15 5 5
E (mg) 5 6 9 10 10 10 10 10 8 8 7 7 7 7 7 8D
11 12D
K (μg) 25 35 45 55 70 70 70 70 45 55 60 60 60 60 60 60
A.Pantothenic acid; BBiotin; C Folate, DRecommended intake for 14-18 year olds.
Vitamins are broadly classified as either water-soluble: B1 (thiamine), B2 (riboflavin),
B3 (niacin), B5 (pantothenic acid), B6 (pyridoxine, pyridoxal, pyridoxamine), B12
(cobalamins), folate, biotin and C (ascorbic acid) or fat-soluble: A (retinol), D2
(ergocalciferol) and D3 (cholcalciferol), E (tocopherol), and K (phylloquinone,
menaquinone). The B group vitamins have a range of functions including roles in the
energy pathways of cells (B1, B2 and B3), metabolism (B5, B6, B12, biotin, folate), red
blood cell formation, and nervous system maintenance (folate). Vitamin C is required
for collagen synthesis, wound healing, immune system function, absorption and
utilization of iron, and acts as an antioxidant. Fat-soluble vitamins are required for a
range of important biological functions in the body including vision (A), intestinal
absorption of calcium and phosphorus and bone mineralisation (D), lipid antioxidant
(E), and blood-clotting factor (K) (Ball 1998; Coultate 2002).
4
1.2.1. Water-soluble vitamins
Water-soluble vitamins travel freely throughout the body and excess amounts are
usually excreted by the kidneys. The body needs most of the water-soluble vitamins in
frequent small doses. These vitamins are not likely to reach toxic levels, but niacin, B6,
folate, and ascorbic acid have recommended upper consumption limits since prolonged
excessive intake can cause adverse effects (National Health and Medical Research
Council 2006). A balanced diet usually provides enough of these vitamins, however,
vegans in particular may need to use supplements to get enough B12, as specified in
Table 1-1 (National Health and Medical Research Council 2006). Common sources of
the water-soluble vitamins are shown in Table 1-2.
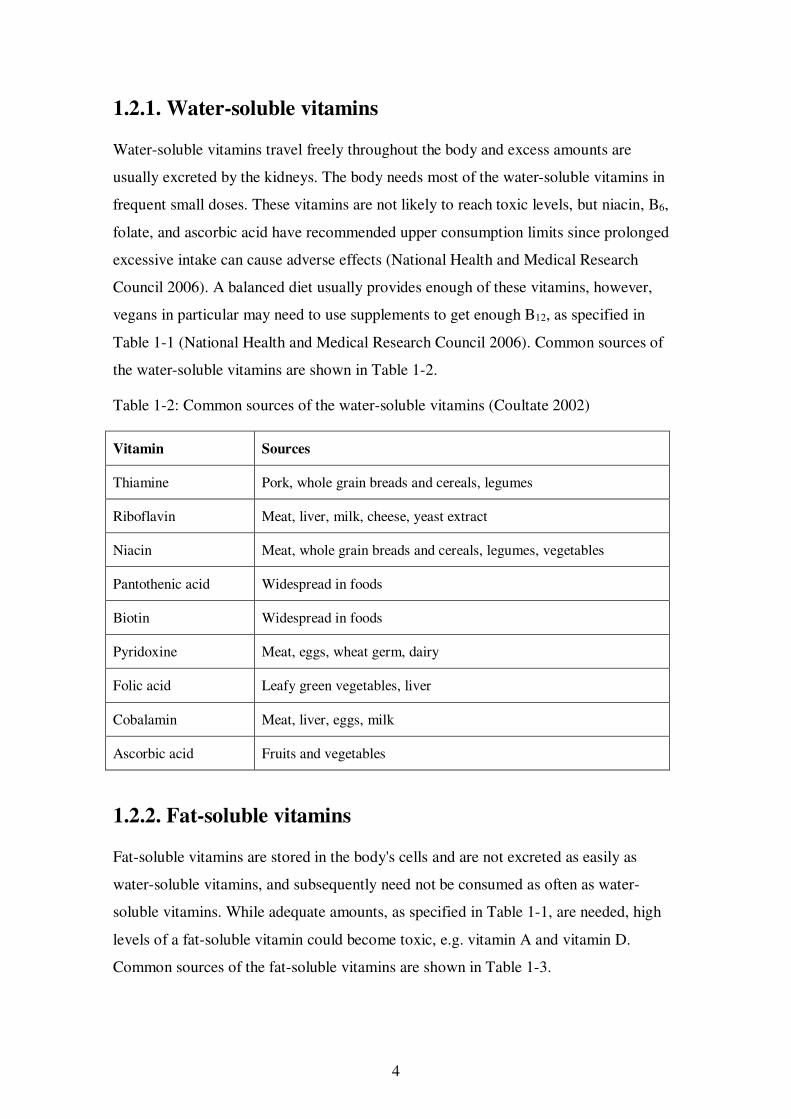
Table 1-2: Common sources of the water-soluble vitamins (Coultate 2002)
Vitamin Sources
Thiamine Pork, whole grain breads and cereals, legumes
Riboflavin Meat, liver, milk, cheese, yeast extract
Niacin Meat, whole grain breads and cereals, legumes, vegetables
Pantothenic acid Widespread in foods
Biotin Widespread in foods
Pyridoxine Meat, eggs, wheat germ, dairy
Folic acid Leafy green vegetables, liver
Cobalamin Meat, liver, eggs, milk
Ascorbic acid Fruits and vegetables
1.2.2. Fat-soluble vitamins
Fat-soluble vitamins are stored in the body's cells and are not excreted as easily as
water-soluble vitamins, and subsequently need not be consumed as often as water-
soluble vitamins. While adequate amounts, as specified in Table 1-1, are needed, high
levels of a fat-soluble vitamin could become toxic, e.g. vitamin A and vitamin D.
Common sources of the fat-soluble vitamins are shown in Table 1-3.
5
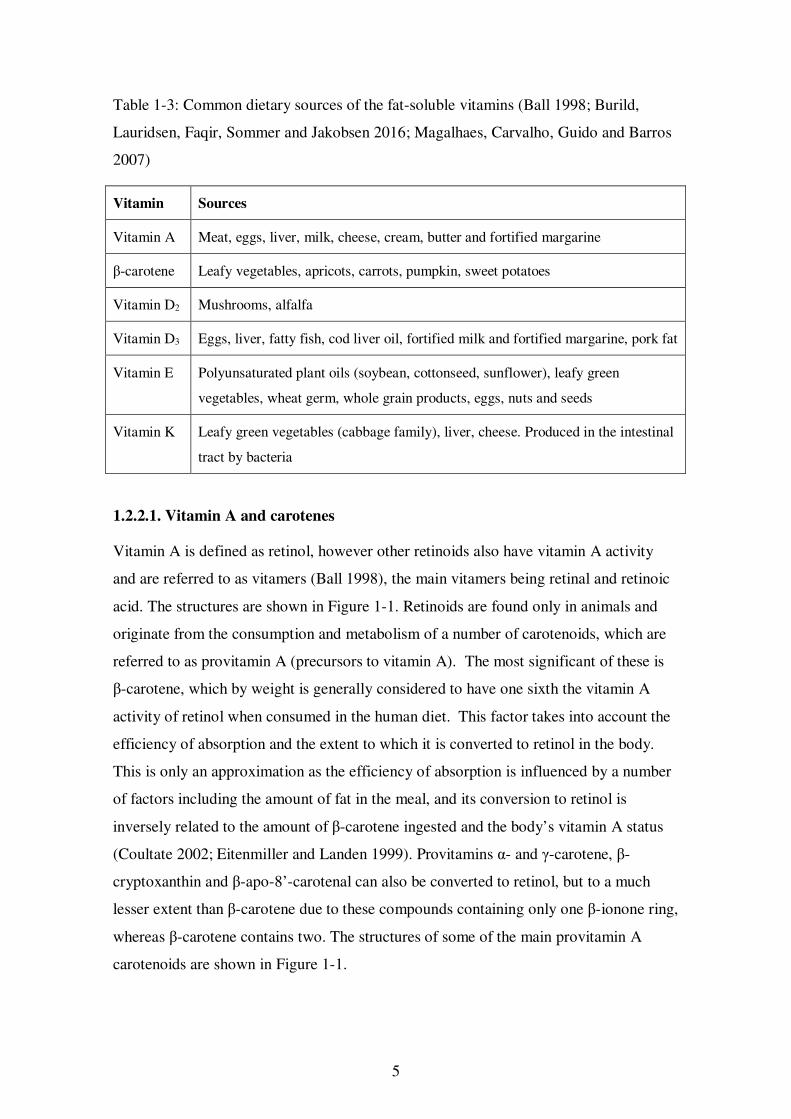
Table 1-3: Common dietary sources of the fat-soluble vitamins (Ball 1998; Burild,
Lauridsen, Faqir, Sommer and Jakobsen 2016; Magalhaes, Carvalho, Guido and Barros
2007)
Vitamin Sources
Vitamin A Meat, eggs, liver, milk, cheese, cream, butter and fortified margarine
β-carotene Leafy vegetables, apricots, carrots, pumpkin, sweet potatoes
Vitamin D2 Mushrooms, alfalfa
Vitamin D3 Eggs, liver, fatty fish, cod liver oil, fortified milk and fortified margarine, pork fat
Vitamin E Polyunsaturated plant oils (soybean, cottonseed, sunflower), leafy green
vegetables, wheat germ, whole grain products, eggs, nuts and seeds
Vitamin K Leafy green vegetables (cabbage family), liver, cheese. Produced in the intestinal
tract by bacteria
1.2.2.1. Vitamin A and carotenes
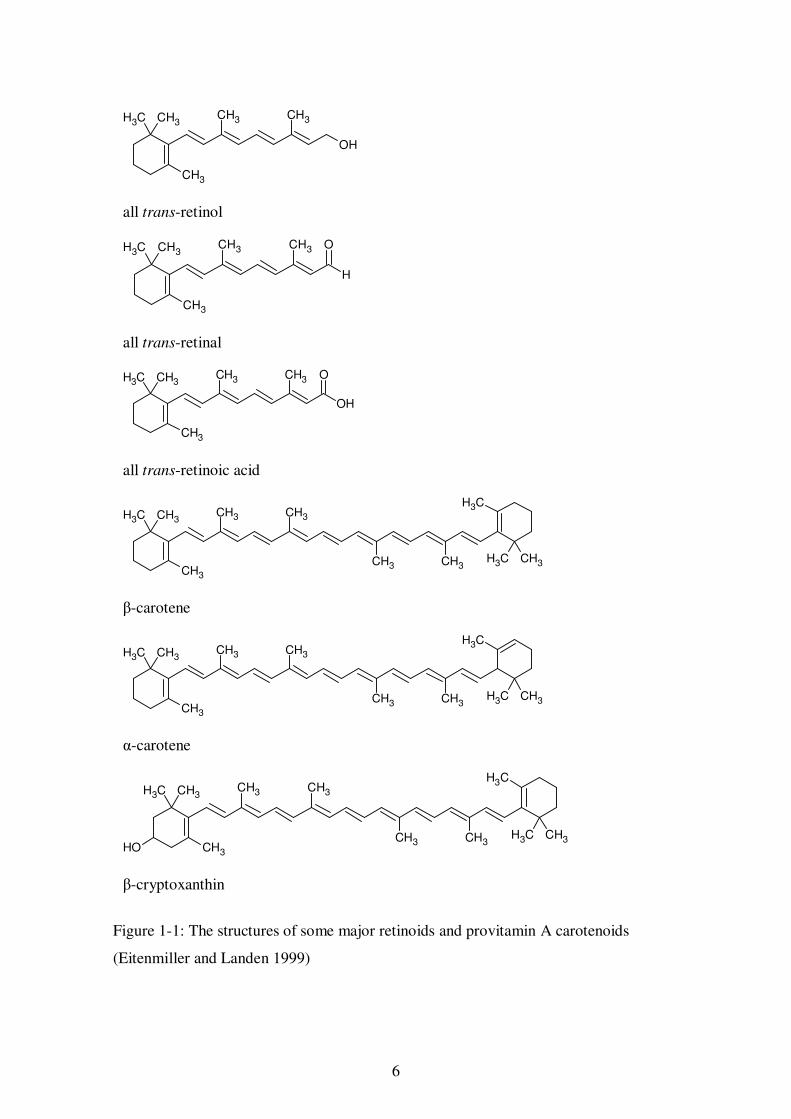
Vitamin A is defined as retinol, however other retinoids also have vitamin A activity
and are referred to as vitamers (Ball 1998), the main vitamers being retinal and retinoic
acid. The structures are shown in Figure 1-1. Retinoids are found only in animals and
originate from the consumption and metabolism of a number of carotenoids, which are
referred to as provitamin A (precursors to vitamin A). The most significant of these is
β-carotene, which by weight is generally considered to have one sixth the vitamin A
activity of retinol when consumed in the human diet. This factor takes into account the
efficiency of absorption and the extent to which it is converted to retinol in the body.
This is only an approximation as the efficiency of absorption is influenced by a number
of factors including the amount of fat in the meal, and its conversion to retinol is
inversely related to the amount of β-carotene ingested and the body’s vitamin A status
(Coultate 2002; Eitenmiller and Landen 1999). Provitamins α- and γ-carotene, β-
cryptoxanthin and β-apo-8’-carotenal can also be converted to retinol, but to a much
lesser extent than β-carotene due to these compounds containing only one β-ionone ring,
whereas β-carotene contains two. The structures of some of the main provitamin A
carotenoids are shown in Figure 1-1.
6
Figure 1-1: The structures of some major retinoids and provitamin A carotenoids
(Eitenmiller and Landen 1999)
OH
CH3
CH3CH3CH3 CH3
all trans-retinol
H
CH3
CH3CH3CH3 CH3 O
all trans-retinal
OH
CH3
CH3CH3CH3 CH3 O
all trans-retinoic acid
CH3
CH3CH3CH3 CH3
CH3
CH3 CH3CH3CH3
β-carotene
CH3
CH3CH3CH3 CH3
CH3
CH3 CH3CH3CH3
α-carotene
CH3
CH3CH3CH3 CH3
CH3
CH3 CH3CH3CH3OH
β-cryptoxanthin
7
Vitamin A is an essential compound for vision due to its role in the detection of light in
the retina. Other important biological functions in the body include regulation of cell
and tissue growth and differentiation. Carotenoids may also act as important
antioxidants with a preventative effect for cardiovascular disease, macular degeneration
and certain types of cancer (Coultate 2002; Kardinaal, van't Veer, Kok, Ringstad,
Gómez-Aracena, Mazaev, et al. 1993; Krinsky, Landrum and Bone 2003; Stahl and Sies
2005; Stanner, Hughes, Kelly and Buttriss 2004).
1.2.2.2. Vitamin D
The two major forms of vitamin D are cholcalciferol (D3) and ergocalciferol (D2). Both
are considered to have the same vitamin D activity. Cholecalciferol is produced in
animals (and humans) by the action of ultraviolet light (from sunlight) on 7-
dehydrocholesterol in the epidermal cells of the skin and its production is therefore
strongly influenced by the amount of sun exposure (Liu, Greenfield, Strobel and Fraser
2013). This reaction is shown in Figure 1-2. Similarly, ergocalciferol is produced by the
ultraviolet irradiation of ergosterol, found in plants, fungi and invertebrates. Vitamin
D(2 or 3) is then converted in the liver to 25-hydroxyvitamin D(2 or 3) (25(OH)D(2 or 3))
which in turn is converted in the kidneys to the physiologically active compound 1,25-
dihydroxyvitamin D(2 or 3), which promotes the synthesis of the proteins that transport
calcium and phosphate ions through cell membranes, thus enabling the uptake of these
ions from the intestine and their use for bone growth (Coultate 2002). Vitamin D
deficiency in children causes rickets, which is a failure of proper bone development, but
adequate levels are important throughout life to maintain bone density and avoid
osteoporosis. Toxic levels of vitamin D can result in hypercalcemia, which is caused by
excessive consumption of pharmaceutical products, and not from normal diets or sun
exposure (Ball 1998).
8
Figure 1-2: The formation of cholecalciferol in skin (Coultate 2002)
1.2.2.3. Vitamin E
The term vitamin E generally refers to α-tocopherol, which is the compound with the
highest vitamin E activity. There are three other tocopherols (β, γ and δ), with 27%,
13% and 1% of the activity, respectively, of α-tocopherol. There are also the
corresponding tocotrienols, of which only α-tocotrienol has significant vitamin E
activity (30%) (Coultate 2002). The structures of the tocopherols and tocotrienols are
shown in Figure 1-3.
The role of vitamin E in the body is as a lipid antioxidant, stopping the free-radical
chain reactions of lipid peroxidation, and helping to stabilise membrane structures,
being particularly prevalent in the membrane lipids of the mitochondria and
endoplasmic reticulum of animal cells (Ball 1998; Coultate 2002).
Vitamin E deficiency results in the increased oxidation of cellular membranes, which
may lead to disorders of various bodily tissues including muscle, liver, bone marrow
and brain (Eitenmiller and Landen 1999). Vitamin E has also been proposed as having a
preventative effect for various cancers and cardiovascular disease, however this has not
been proven in intervention trials (Kardinaal, et al. 1993; Stanner, et al. 2004).
9
O
OH
CH3
R2
CH3
CH3
CH3 CH3CH3
R1
General tocopherol structure
CH3
CH3
CH3 CH3
R
Tocotrienol side chain
Figure 1-3: The structures of the tocopherols and tocotrienols (Coultate 2002;
Eitenmiller and Landen 1999)
1.2.2.4. Vitamin K
Vitamin K occurs naturally in two forms, phylloquinone (K1) and menaquinone (K2),
both of which are derivatives of menadione with a side chain at position 3, as shown in
Figure 1-4. Vitamin K1 is produced by plants, most notably green leafy vegetables,
whereas vitamin K2 is produced by bacteria, the richest source in the human diet being
the Japanese fermented soybean product natto, but it is also present in smaller amounts
in more commonly consumed foods such as cheese and meat. Vitamin K2 is also
produced by bacteria in the large intestine (Weber 2001).
Vitamin K1 most commonly has a side chain consisting of 4 isoprenoid units, three of
which are reduced, vitamin K2 has a side chain consisting of 4 to 13 isoprenoid units,
none of which are reduced (Coultate 2002). Vitamin K was originally recognised as a
factor required for blood clotting, but in recent years the role of vitamin K2 in other
processes such as bone mineralisation and the prevention of soft tissue calcification
have become apparent (Schurgers, Teunissen, Hamulyák, Knapen, Vik and Vermeer
2007).
α – R1 and R2 = CH3
β – R1 = CH3, R2 = H
γ – R1 = H, R2 = CH3
δ – R1 and R2 = H
10
Figure 1-4: The general structures of menadione, phylloquinone and menaquinone
(Eitenmiller and Landen 1999)
1.2.3. Vitamin content of dairy cow milk
Dairy cow (Bos taurus taurus) milk is a good dietary source of all trans-retinol, β-
carotene and α-tocopherol (Bergamo, Fedele, Iannibelli and Marzillo 2003; Jensen and
Robert 1995), with levels in the order of 49 μg/100g of vitamin A, 18 μg/100g of
carotene and 90 μg/100g of vitamin E (Food Standards Australia New Zealand 2014),
but contains relatively little vitamin D3 (<0.2 μg/100 mL) or vitamin K (<1 μg/100 mL)
(Gentili, Caretti, Bellante, Ventura, Canepari and Curini 2013; Jakobsen and Saxholt
2009; Jensen and Robert 1995; Mattila, Piironen, Uusi-Rauva and Koivistoinen 1995).
Most of the vitamin D3 is produced by the action of sunlight on the cow’s skin and some
of the vitamin K is produced in the rumen (Jensen and Robert 1995) with the rest
coming from the diet. All trans-retinol, β-carotene and α-tocopherol come from the
cow’s diet, and variations in the levels of these compounds have been attributed to
variations in diet (Adler, Dahl, Jensen, Thuen, Gustavsson and Steinshamn 2013;
O
O
CH3
Menadione
O
O
CH3
CH3 CH3 CH3
CH3
CH3
Phylloquinone
O
O
CH3
CH3 CH3 CH3
CH3
CH3
Menaquinone-4
11
Bergamo, et al. 2003; Hulshof, et al. 2006; Marino, Schadt, Carpino, Caccamo, La
Terra, Guardiano, et al. 2014; Nozière, Grolier, Durand, Ferlay, Pradel and Martin
2006; Slots, Butler, Leifert, Kristensen, Skibsted and Nielsen 2009). β-Carotene is the
predominant (>90%) carotenoid found in milk, followed by lutein (1-10%) (Havemose,
Weisbjerg, Bredie and Nielsen 2004; Hulshof, et al. 2006), although the process of
carotenoid absorption in ruminants is not well understood (Nozière, Graulet, Lucas,
Martin, Grolier and Doreau 2006). α-Tocopherol is the predominant tocopherol in milk
(>94%), followed by γ (<5%) and β (~1%) (Gentili, et al. 2013; Lanina, et al. 2007).
1.3. Analysis of fat-soluble vitamins in dairy cow milk
1.3.1. Sample extraction
1.3.1.1. Vitamins A, E, D and carotenes
The milk sample is commonly saponified in a boiling mixture of potassium hydroxide,
ethanol and water to remove the fat as well as hydrolyse esterified vitamins to the native
vitamins (Ball 1998; Byrdwell 2009; Byrdwell, et al. 2008; Department of Primary
Industries 2007; Heudi, et al. 2004; Hulshof, et al. 2006; Kurmann and Indyk 1994;
Lanina, et al. 2007). Cold (room temperature) saponification can also be used but it is
more time consuming (Gentili, et al. 2013). The vitamins are then extracted from the
alkaline mixture with non-polar solvents (e.g. hexane, diethyl ether), and the extract
washed with water to remove the soaps (free fatty acids). The organic phase is then
concentrated, further purified using solid phase extraction or semi-preparative HPLC if
required (D) (Byrdwell, et al. 2008; Kurmann and Indyk 1994), and then assayed using
HPLC-UV/Vis or HPLC-PDA (A, D, E, carotenes), HPLC-Fl (A, E) or HPLC-MS
analysis (A, D, E, carotenes). More recently, Abernethy (2012) described a direct
solvent extraction procedure using methanol and isooctane, which avoided the
saponification step for vitamin D analysis in fortified milk and milk powder. Vitamin D
and its metabolites can also be derivatised with either 4-phenyl-1,2,4-triazoline-3,5-
dione (PTAD) (Abernethy 2012; Aronov, Hall, Dettmer, Stephensen and Hammock
2008; Mitamura, Nambu, Tanaka, Kawanishi, Kitahori and Shimada 1999; Shimada and
Higashi 2002) or 4-[2-(6,7-dimethoxy-4-methyl-3-oxo-3,4-dihydroquinoxalyl)ethyl]-
1,2,4- triazoline-3,5-dione (DMEQ-TAD) (Higashi, Awada and Shimada 2001; Kamao,
Tsugawa, Suhara, Wada, et al. 2007; Shimada and Higashi 2002) prior to HPLC
12
analysis to improve the sensitivity, resulting in a lower limit of detection (LOD) and
limit of quantification (LOQ).
1.3.1.2. Vitamin K
Vitamin K cannot be assayed by saponification as it is unstable at high pH (pH 13) (Ball
1998; Kamao, Tsugawa, Suhara, Wada, et al. 2007), so lipase is used to release vitamin
K from the fat prior to solvent extraction, concentration and HPLC analysis.
Quantification of vitamin K can be complicated due to the number of related
compounds found in milk that possess vitamin K activity, such as phylloquinone and
menaquinones 4 - 9 (Ball 1998; Eitenmiller and Landen 1999; Gentili, et al. 2013).
1.3.2. Sample analysis
1.3.2.1. High performance liquid chromatography
High performance liquid chromatography is a technique whereby a liquid, referred to as
the mobile phase, is pumped at high pressure (up to 400 bar) through a column packed
with a stationary phase. When a sample is injected into the mobile phase it travels
through the column and the various components of the sample separate according to
their partitioning between the mobile and stationary phases, the more the compound
resides in the stationary phase, the longer it will take to elute from the column and the
longer its retention time. Modification of the properties of the mobile and stationary
phases can be used to alter the retention of compounds of interest, and thus a suitable
separation of these compounds can be achieved. Recent advances in chromatographic
column technology such as small particle size stationary phases (1.7 μm) specifically
designed for ultra-high performance liquid chromatography (UHPLC) have the potential
to further improve the chromatographic performance by virtue of the greater efficiency
of the smaller particles, leading to greater peak capacity and better peak resolution
(Rivera and Canela-Garayoa 2012).
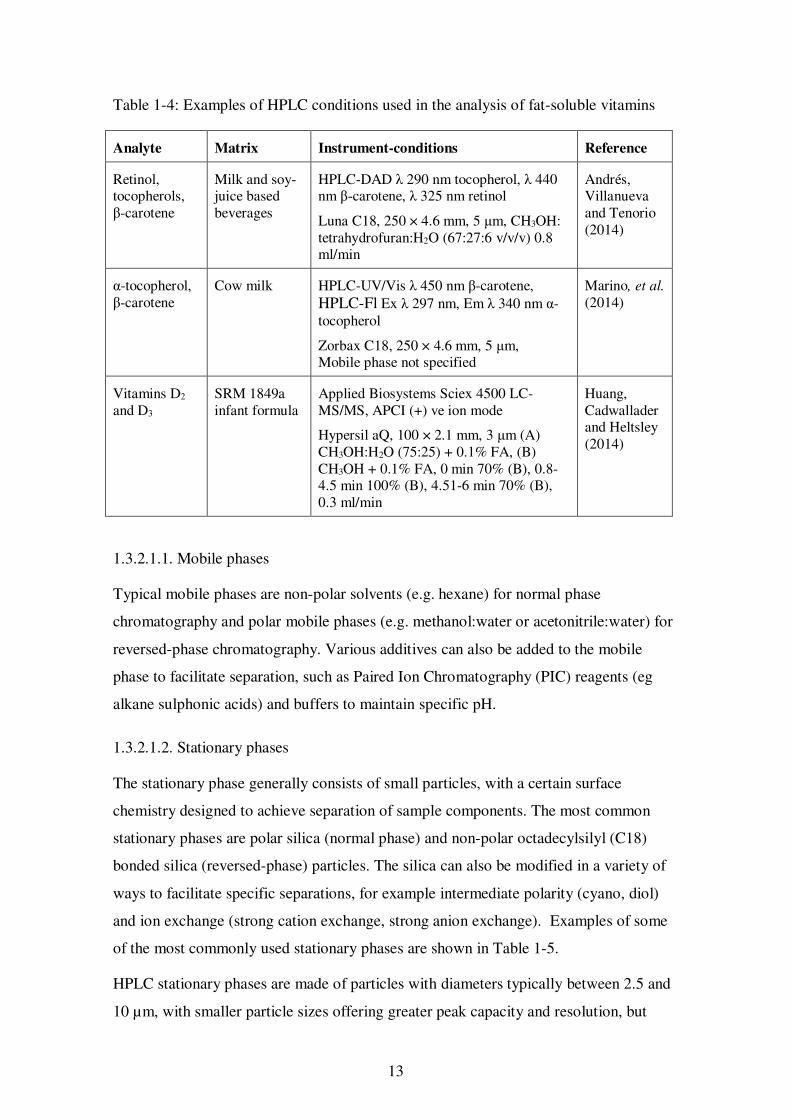
Some examples of the analysis of fat-soluble vitamins demonstrating the various HPLC
conditions are presented in Table 1-4. A more extensive list of examples is presented in
Appendix 1.
13
Table 1-4: Examples of HPLC conditions used in the analysis of fat-soluble vitamins
Analyte Matrix Instrument-conditions Reference
Retinol, tocopherols, β-carotene
Milk and soy-juice based beverages
HPLC-DAD λ 290 nm tocopherol, λ 440 nm β-carotene, λ 325 nm retinol
Luna C18, 250 × 4.6 mm, 5 μm, CH3OH: tetrahydrofuran:H2O (67:27:6 v/v/v) 0.8 ml/min
Andrés, Villanueva and Tenorio (2014)
α-tocopherol, β-carotene
Cow milk HPLC-UV/Vis λ 450 nm β-carotene, HPLC-Fl Ex λ 297 nm, Em λ 340 nm α-tocopherol
Zorbax C18, 250 × 4.6 mm, 5 μm, Mobile phase not specified
Marino, et al. (2014)
Vitamins D2
and D3 SRM 1849a infant formula
Applied Biosystems Sciex 4500 LC-MS/MS, APCI (+) ve ion mode
Hypersil aQ, 100 × 2.1 mm, 3 μm (A) CH3OH:H2O (75:25) + 0.1% FA, (B) CH3OH + 0.1% FA, 0 min 70% (B), 0.8-4.5 min 100% (B), 4.51-6 min 70% (B), 0.3 ml/min
Huang, Cadwallader and Heltsley (2014)
1.3.2.1.1. Mobile phases
Typical mobile phases are non-polar solvents (e.g. hexane) for normal phase
chromatography and polar mobile phases (e.g. methanol:water or acetonitrile:water) for
reversed-phase chromatography. Various additives can also be added to the mobile
phase to facilitate separation, such as Paired Ion Chromatography (PIC) reagents (eg
alkane sulphonic acids) and buffers to maintain specific pH.
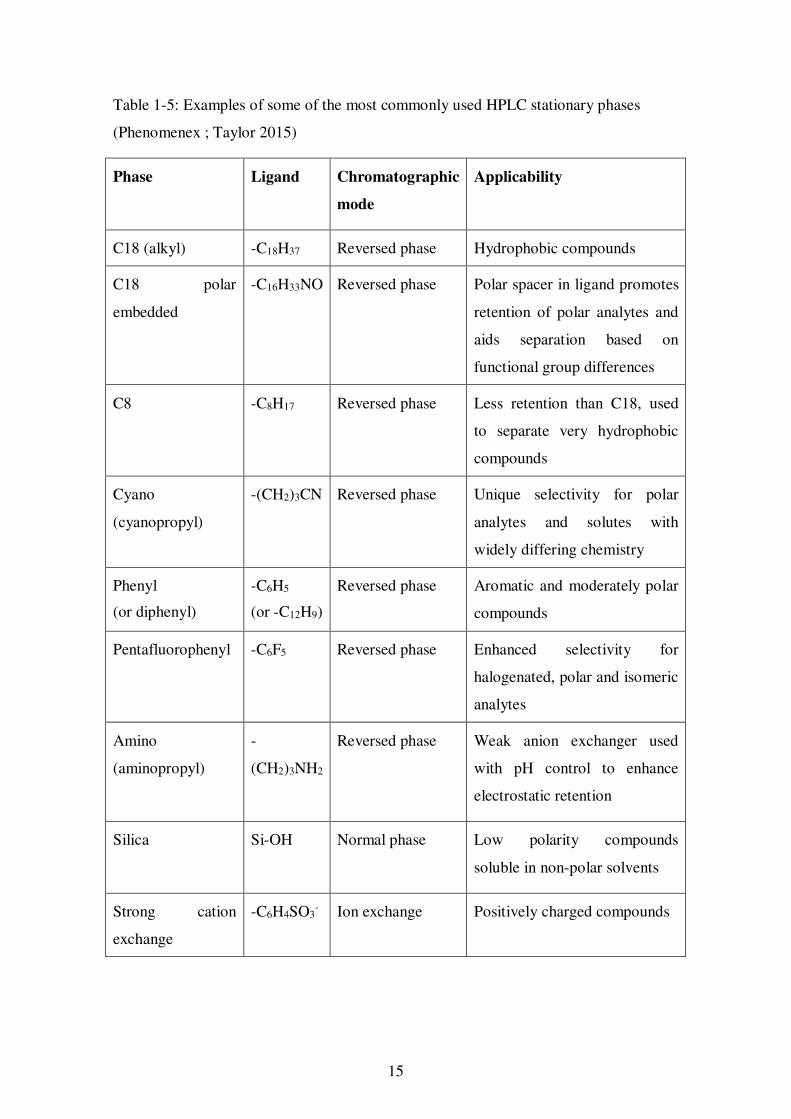
1.3.2.1.2. Stationary phases
The stationary phase generally consists of small particles, with a certain surface
chemistry designed to achieve separation of sample components. The most common
stationary phases are polar silica (normal phase) and non-polar octadecylsilyl (C18)
bonded silica (reversed-phase) particles. The silica can also be modified in a variety of
ways to facilitate specific separations, for example intermediate polarity (cyano, diol)
and ion exchange (strong cation exchange, strong anion exchange). Examples of some
of the most commonly used stationary phases are shown in Table 1-5.
HPLC stationary phases are made of particles with diameters typically between 2.5 and
10 µm, with smaller particle sizes offering greater peak capacity and resolution, but
14
higher backpressures. Modern ‘state of the art’ stationary phases can have particle sizes
<2 µm, however the high back pressures created by these small particles make them
unsuitable for conventional HPLC (Rivera and Canela-Garayoa 2012). The introduction
of UHPLC instruments, which can operate at pressures up to 1200 bar, has enabled
superior analyte separation and so has become the benchmark for liquid
chromatographic separations. Recently, Hampel, York and Allen (2012) reported an
ultra-high performance liquid chromatography tandem mass-spectrometry (UHPLC-
MS/MS) procedure for the simultaneous analysis of thiamine, riboflavin, flavin
dinucleotide, nicotinamide and pyridoxal in human milk using a 50 × 2.1 mm, 1.8 μm
HSS T3 column, gradient elution with 10 mM aqueous ammonium formate (A) and
acetonitrile (B), a flow rate of 0.3 ml/min and a run time of 4 min. By contrast,
(Sakurai, Furukawa, Asoh, KANNO, KOJIMA and YONEKUBO 2005) required three
separate HPLC methods and a microbiological assay to determine a similar range of
compounds in human breast milk.
Greater peak capacity can also be achieved with two-dimensional liquid
chromatography (2D LC) (Quinto Tranchida, Dugo, Dugo and Mondello 2004; Wong
and Shalliker 2004). Schadt, Gossl, Seibel and Aebischer (2012) used 2D LC for the
on-line clean-up and analysis of sample extracts, reducing the time and effort required
to prepare samples for vitamin D analysis.
15
Table 1-5: Examples of some of the most commonly used HPLC stationary phases
(Phenomenex ; Taylor 2015)
Phase Ligand Chromatographic
mode
Applicability
C18 (alkyl) -C18H37 Reversed phase Hydrophobic compounds
C18 polar
embedded
-C16H33NO Reversed phase Polar spacer in ligand promotes
retention of polar analytes and
aids separation based on
functional group differences
C8 -C8H17 Reversed phase Less retention than C18, used
to separate very hydrophobic
compounds
Cyano
(cyanopropyl)
-(CH2)3CN Reversed phase Unique selectivity for polar
analytes and solutes with
widely differing chemistry
Phenyl
(or diphenyl)
-C6H5
(or -C12H9)
Reversed phase Aromatic and moderately polar
compounds
Pentafluorophenyl -C6F5 Reversed phase Enhanced selectivity for
halogenated, polar and isomeric
analytes
Amino
(aminopropyl)
-
(CH2)3NH2
Reversed phase Weak anion exchanger used
with pH control to enhance
electrostatic retention
Silica Si-OH Normal phase Low polarity compounds
soluble in non-polar solvents
Strong cation
exchange
-C6H4SO3- Ion exchange Positively charged compounds
16
1.3.2.1.3. Detectors for vitamins analysis
After separation of the compounds in the column, the mobile phase then flows to a
suitable detector, with either UV/Vis (A, D, K, carotenes) or Fl (A, E, K) detection
being the most common choices for the analysis of fat-soluble vitamins in milk (Ball
1998; Bergamo, et al. 2003; Byrdwell, et al. 2008; Department of Primary Industries
2007; Hulshof, et al. 2006; Kamao, Tsugawa, Suhara and Okano 2007; Kurmann and
Indyk 1994). The compounds are usually assayed individually due to their chemical
diversity and varying levels within samples.
1.3.2.2. High performance liquid chromatography-mass spectrometry
The relatively recent, rapid advances in HPLC coupled with mass spectrometric
detection (HPLC-MS) have seen it emerge as a major breakthrough in analytical science
(Willoughby 2002). This technique combines the separating power of liquid
chromatography with the extra sensitivity, selectivity and powerful structure elucidation
ability of mass spectrometry. The selectivity of mass spectrometry is an advantage over
conventional HPLC detectors, particularly when analysing complex sample matrices.
Because compounds are separated according to their mass to charge ratio (m/z), as long
as co-eluting compounds have differing m/z values they can be distinguished by the
mass spectrometer. The use of collision-induced dissociation (CID) can give further
selectivity and specificity to the analysis by fragmenting ions of interest and detecting
the resulting product ions (Willoughby 2002).
1.3.2.2.1. Interface and ionisation sources
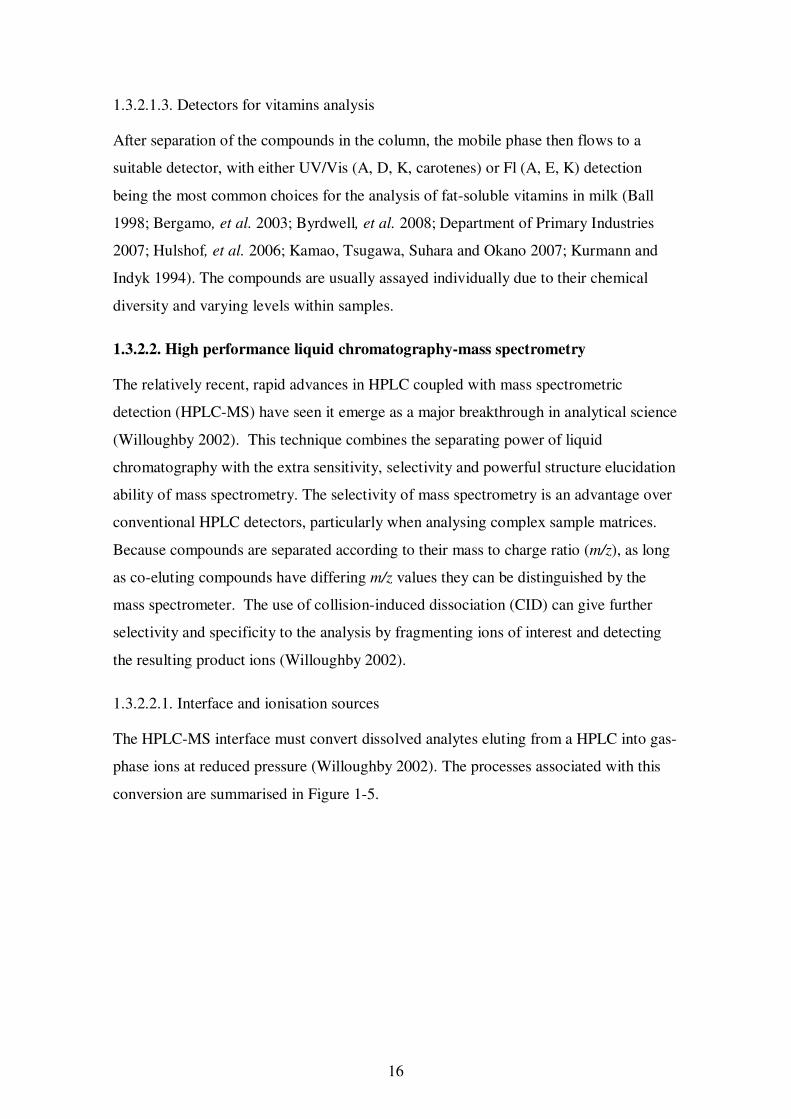
The HPLC-MS interface must convert dissolved analytes eluting from a HPLC into gas-
phase ions at reduced pressure (Willoughby 2002). The processes associated with this
conversion are summarised in Figure 1-5.
17
Figure 1-5: Conversion processes required for interfacing liquid chromatography with
mass spectrometry (Willoughby 2002)
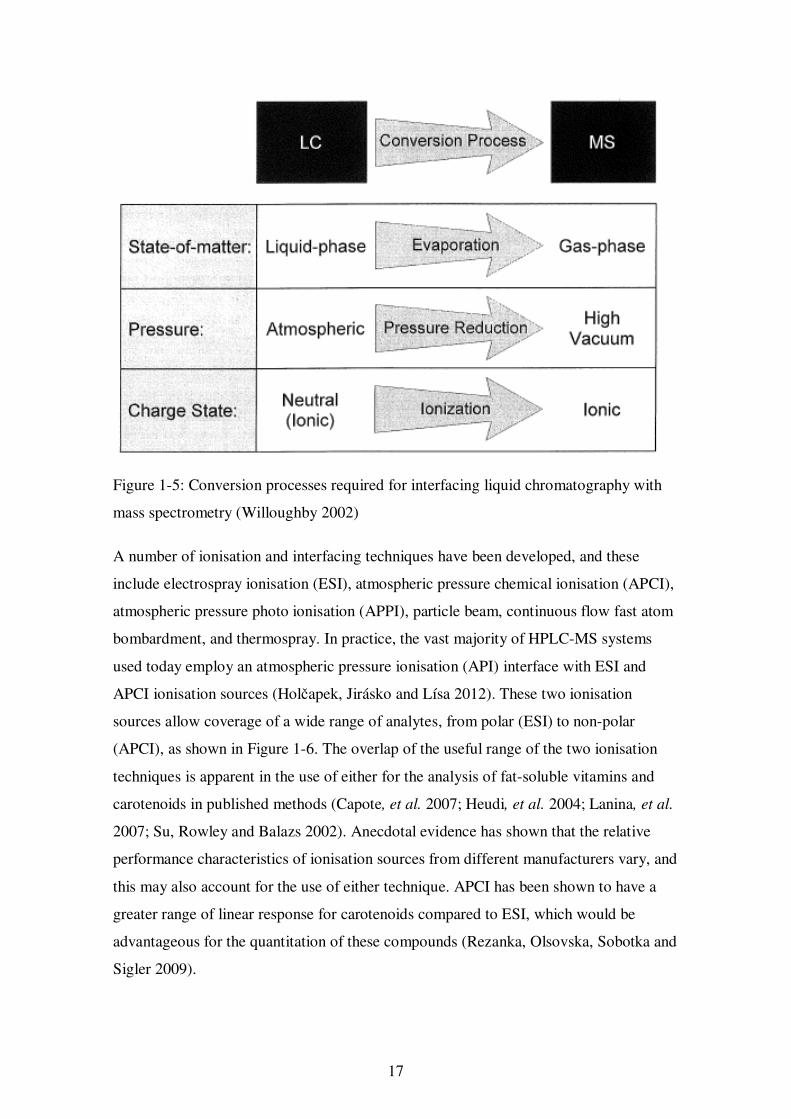
A number of ionisation and interfacing techniques have been developed, and these
include electrospray ionisation (ESI), atmospheric pressure chemical ionisation (APCI),
atmospheric pressure photo ionisation (APPI), particle beam, continuous flow fast atom
bombardment, and thermospray. In practice, the vast majority of HPLC-MS systems
used today employ an atmospheric pressure ionisation (API) interface with ESI and
APCI ionisation sources (Holčapek, Jirásko and Lísa 2012). These two ionisation
sources allow coverage of a wide range of analytes, from polar (ESI) to non-polar
(APCI), as shown in Figure 1-6. The overlap of the useful range of the two ionisation
techniques is apparent in the use of either for the analysis of fat-soluble vitamins and
carotenoids in published methods (Capote, et al. 2007; Heudi, et al. 2004; Lanina, et al.
2007; Su, Rowley and Balazs 2002). Anecdotal evidence has shown that the relative
performance characteristics of ionisation sources from different manufacturers vary, and
this may also account for the use of either technique. APCI has been shown to have a
greater range of linear response for carotenoids compared to ESI, which would be
advantageous for the quantitation of these compounds (Rezanka, Olsovska, Sobotka and
Sigler 2009).
18
Figure 1-6: The molecular weight and polarity domains of electrospray ionisation and
atmospheric pressure chemical ionisation. Adapted from Willoughby 2002.
Electrospray ionisation
Electrospray ionisation is the most widely used ionisation technique for HPLC-MS
(Holčapek, et al. 2012), due to its simplicity and applicability to a wide range of
compounds. The main prerequisite is that the analyte exists in solution as an ion
(Willoughby 2002). Willoughby (2002) described it as a ‘soft’ ionisation technique, as
it imparts very little energy to the analyte, and can therefore be used to create molecular
ions from relatively unstable compounds such as large biomolecules and pharmaceutical
products, which may fragment when ionised by other techniques (Manisali, Chen and
Schneider 2006). In principle, the column effluent from the HPLC flows through a
hollow needle which is kept at a high electrical potential (approx. 2-5 kV) relative to the
entrance to the mass spectrometer. As the liquid exits the tip of the needle, it forms a
spray (generally with the assistance of a concentric flow of nitrogen gas) of highly
charged droplets. As these droplets evaporate, the charge on each droplet is
concentrated, and the repulsion of the like-charged ions leads to the expulsion of
solvated ions which quickly desolvate to leave quasi-molecular ions (Willoughby 2002).
The ions formed by this process may take on more than one charge if there is more than
one ionisable site, and have the form [M+nH]n+ when the ion source is operated in the
positive ionisation mode or [M-nH]n- in negative ionisation mode. Approximately 1% of
the ions produced by this process pass through the sampling orifice and into the vacuum
region of the mass spectrometer to the detector, which detects the m/z ratio and
abundance of the ions.
19
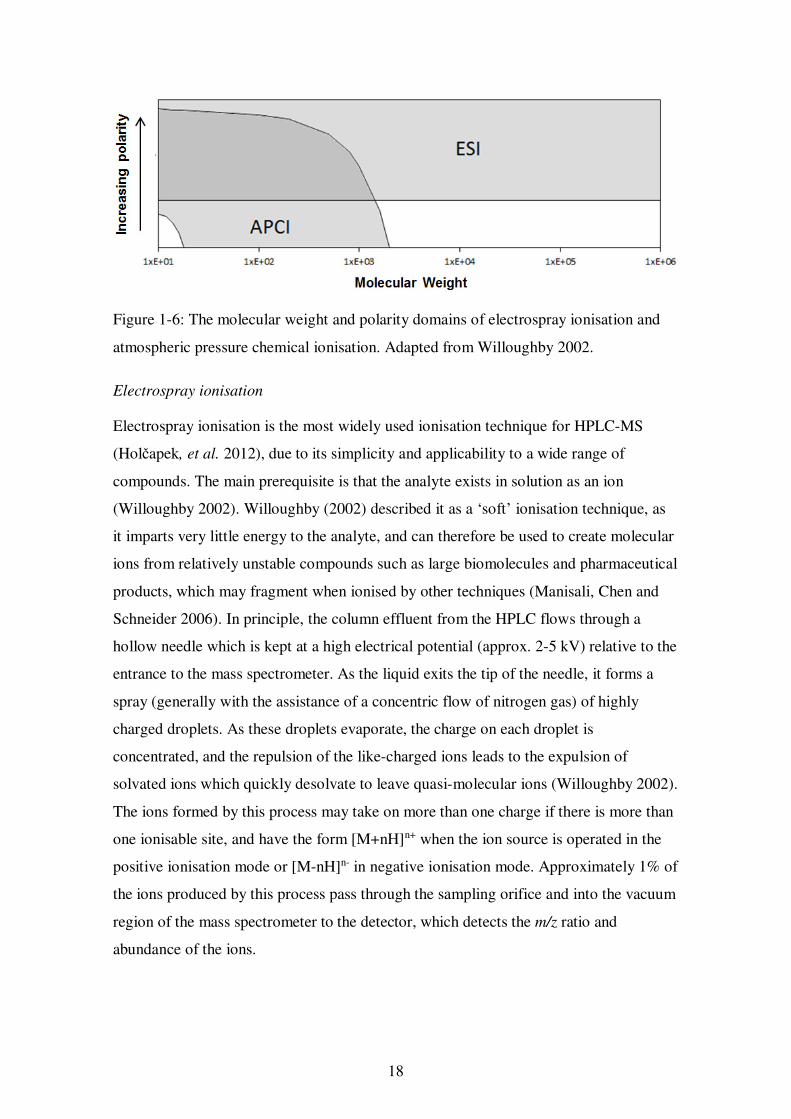
Atmospheric pressure chemical ionisation
Atmospheric pressure chemical ionisation is also a relatively soft ionisation technique,
although not as soft as ESI. The HPLC column effluent is sprayed through a heated
(approx. 200-500°C) nebuliser, which evaporates both the solvent and solutes, and into
a corona discharge (Rezanka, et al. 2009). Electron ionisation of the source gases and
mobile phase components by the corona creates reagent gases, which ionise the analytes
as they travel towards the sampling orifice, as shown in Figure 1-7. Similar to ESI,
approximately 1% of the ions produced are then drawn into the mass spectrometer.
Compared to ESI, APCI is generally more rugged, reliable and less susceptible to
chemical interferences such as the formation of adducts (Willoughby 2002).
Figure 1-7: Atmospheric pressure chemical ionisation process in the positive ion
polarity mode (Thermo Electron Corporation 2003)
20
1.3.2.2.2. Mass analysers
There are many different types of mass analysers that are typically used for HPLC-MS:
low resolution, low mass accuracy instruments such as single quadrupole (MS), triple
quadrupole/tandem (MS/MS) and ion trap (MSn), and high resolution, accurate mass
instruments such as time of flight (TOF), Fourier transform ion cyclotron resonance
(FTICR) and Orbitrap. There are also a variety of specialised ‘combination
instruments’, such as ion trap-Orbitrap, ion trap-FTICR and ion trap-TOF which are
used primarily for research applications.
Single quadrupole
Single quadrupole instruments primarily yield information about the molecular ion, for
example a protonated molecule [M + H]+ has a mass/charge ratio one amu higher than
the mass of the molecule. Structural information from the formation of product ions is
limited to the use of in-source CID.
Triple quadrupole (tandem mass spectrometer)
Triple quadrupole instruments enable isolation and fragmentation of the molecular ion
to yield product ions, allowing further structural information. The ability of the triple
quadrupole instrument to select a molecular ion, fragment the ion and monitor the
product ions is known as selected reaction monitoring (SRM) or multiple reaction
monitoring (MRM), and makes it the instrument of choice for quantification of targeted
analytes at the parts-per-million (ppm) and parts-per-billion (ppb) levels due to its
superior sensitivity and selectivity compared to MS, MSn and TOF instruments (Zhang,
Rose and Trenerry 2009).
Ion trap
Ion trap mass spectrometers cover a similar m/z range as triple quadrupole mass
spectrometers, as shown in Table 1-5, and can also operate in full scan mode at high and
low resolution. The major advantage of MSn instruments is the capability of performing
successive fragmentation steps (up to n=10), which provides more structural
information than other mass analysers. This information can then be used to assist in
the identification of unknown compounds. The sensitivity of traditional three-
dimensional ion trap instruments is an order of magnitude less than triple quadrupole
mass spectrometers, however, linear ion trap mass spectrometers exhibit sensitivities
21
approaching that of triple quadrupole mass spectrometers, making them a viable
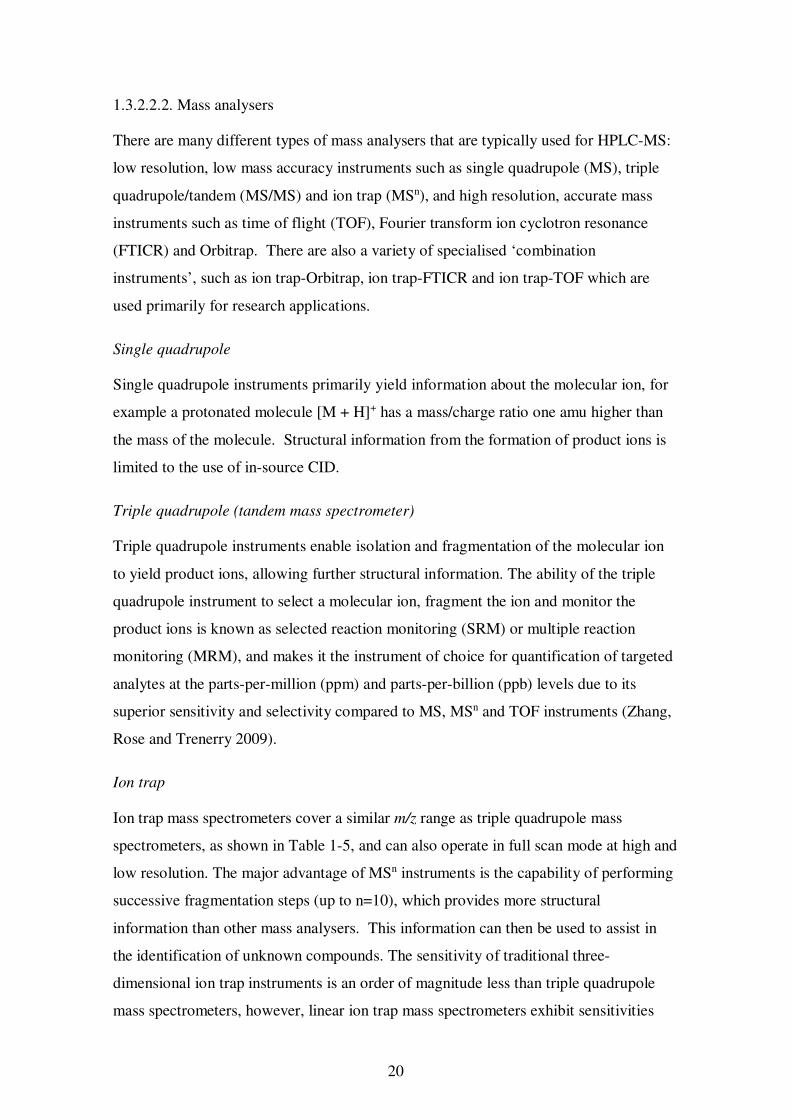
alternative for quantification and metabolomics studies (Rochfort, Trenerry, Imsic,
Panozzo and Jones 2008). Figure 1-8 shows internal components of the Thermo LTQ
linear ion trap mass spectrometer.
Figure 1-8: Internal components of the linear ion trap mass spectrometer (Thermo
Electron Corporation 2003)
Time of flight, Fourier transform ion cyclotron resonance and Orbitrap
Accurate mass instruments (TOF, FTICR, Orbitrap) are very useful for compound
identification, as the accurate mass data can be used to deduce the molecular formula of
a compound. TOF and FTICR instruments are generally more expensive and not as well
suited to targeted analysis as triple quadrupole or ion trap instruments, which have a
larger linear range and generally better sensitivity (Holčapek, et al. 2012; Willoughby
2002). Typical specifications for different mass analysers are shown in Table 1-5.
22
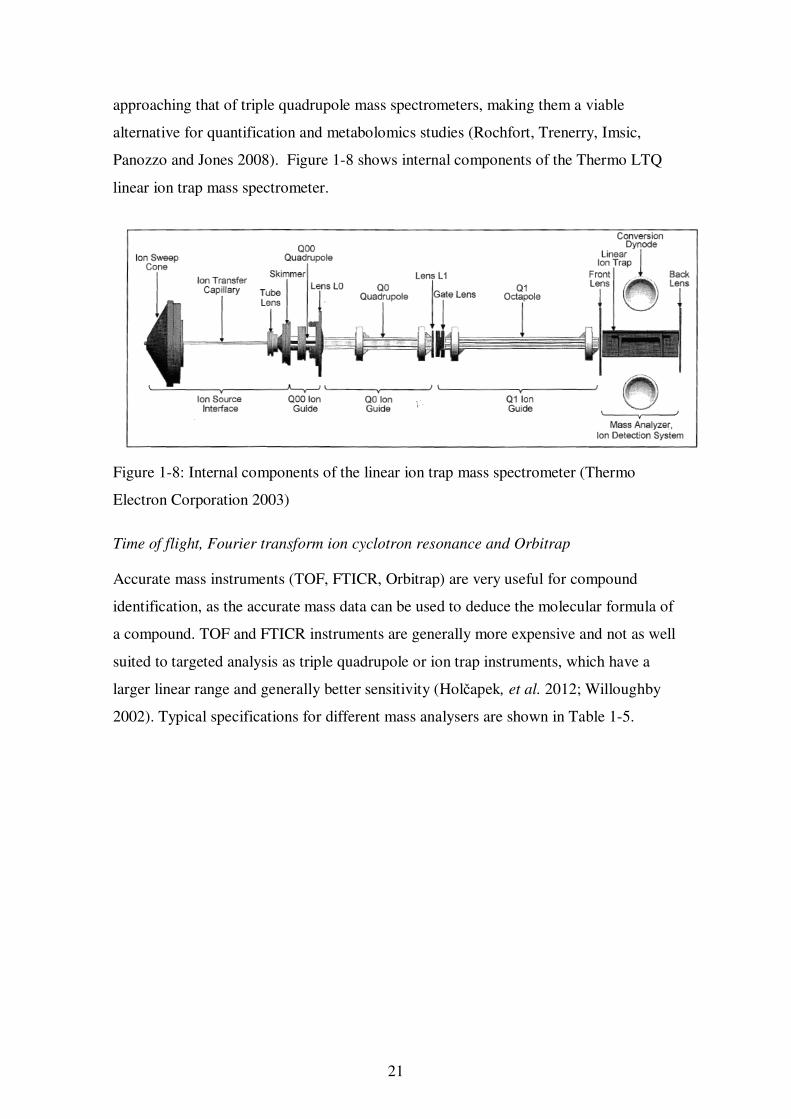
Table 1-5: Typical specifications for a range of mass analysers (Hart-Smith and
Blanksby 2012)
Mass
analyser
Mass
resolving
power
Mass
accuracy
Mass
range
Linear
dynamic
range
Abundance
sensitivity
Other
MS MS/MS
100-1000 100 ppm 4000 1×10⁷ 1×10⁴-1×10⁶ Low cost, low space requirements
3D MSn 1000- 10 000
50-100 ppm 4000 1×10²-1×10³ 1×10²-1×10³ Low cost, low space requirements
Linear MSn 1000- 10 000
50-100 ppm 4000 1×10³-1×10⁴ 1×10³-1×10⁴ Low cost, low space requirements
TOF 1000- 40 000
5-50 ppm >100 000 1×10⁶ 1×10⁶ Moderate cost, moderate space requirements
Orbitrap 10 000-150 000
2-5 ppm 6000 1×10³-1×10⁴ 1×10⁴ Moderate cost, low space requirements
FTICR 10 000- 1 000 000
1-5 ppm >10 000 1×10³-1×10⁴ 1×10³-1×10⁴ High cost, large space requirements
1.3.2.2.3. Interferences
The compounds present in the sample matrix may affect the ability to obtain accurate
identification and quantification with the mass spectrometer in a number of ways,
therefore it is generally necessary to obtain a good separation of sample components by
HPLC prior to MS analysis. The matrix can cause spectral, chemical or physical
interferences (Willoughby 2002). Spectral interference occurs when co-eluting
compounds yield ions that overlap with the analyte ions. Chemical interference occurs
when other compounds in the sample matrix suppress or enhance the response of the
analyte through a chemical process, e.g. the formation of adducts, which alter the
apparent mass of the analyte. Adducts are more prevalent with ESI than APCI. Physical
interferences may suppress or enhance the response of the analyte through a physical
process, e.g. high concentrations of interfering components leading to increased surface
tension and reduced desolvation in the API interface, reducing ionisation efficiency.
The separation of the analytes by HPLC prior to mass spectral analysis also gives
retention time data which can be compared to that of an authentic standard, improving
the confidence of the analyte identification in targeted analysis.
23
1.3.2.2.4. Internal standards
In HPLC-MS analysis, internal standards are often used to correct for the quantitative
variations caused by ion suppression or ion enhancement, especially when the target
analytes are present in low levels (ppb), e.g. pesticide residues and antibiotic residues in
biological samples (Hernández, Sancho and Pozo 2005; Plozza, Trenerry, Zeglinski,
Nguyen and Johnstone 2011). Ion suppression is more common in ESI than other
ionisation techniques (Stokvis, Rosing and Beijnen 2005). Compounds that exhibit
similar chromatographic performance and ionising properties are often chosen as
internal standards. For instance, dihydrotachysterol was used as the internal standard for
the analysis of vitamins D2 and D3 in food (Dimartino 2009) as it is not present in food
and has a similar structure to the target analytes. Similarly, vitamin D2 and 25-
hydroxyvitamin D2 were used as internal standards for the quantification of vitamin D3
and 25-hydroxyvitamin D3 in foodstuffs (Bilodeau, Dufresne, Deeks, Clément,
Bertrand, Turcotte, et al. 2011). Isotopically labelled internal standards, where several
atoms in the analyte have been replaced by their stable isotopes, e.g. 2H (deuterium), 13C, 15N or 17O, make ideal internal standards as they share the same physical properties
as the target analyte. It is preferable to have at least three stable isotopes incorporated
into the structure, so that the molecular ion and key fragment ions are well separated in
the mass analyser to prevent ‘cross-talk’ interference, which occurs when the isotope
peaks of the analyte interfere with the signal of the internal standard by virtue of their
identical m/z ratio(Stokvis, et al. 2005). As the abundance of the isotope peaks of a
compound become insignificant greater than two mass units higher than the main
isotope, an internal standard with m/z 3 units or higher than the analyte will avoid this
problem. Kalman, Mujahid, Mottier and Heudi (2003) used deuterium labelled
tocopherol to quantify α-tocopherol in infant formula, while Abernethy (2012) used
26,26,26,27,27,27-2H6 vitamin D3 for the quantitative analysis of vitamin D3 in fortified
infant formula, milk and milk powder.
1.3.2.2.5. Mobile phase additives
The choice of mobile phase additives, e.g. acids, bases and buffers is more limited in
HPLC-MS compared to other HPLC techniques as any mobile phase additives must be
volatile to prevent fouling of the ion source during mobile phase evaporation. Thus,
volatile acids (e.g. formic acid), bases (e.g. ammonia) and buffers (e.g. ammonium
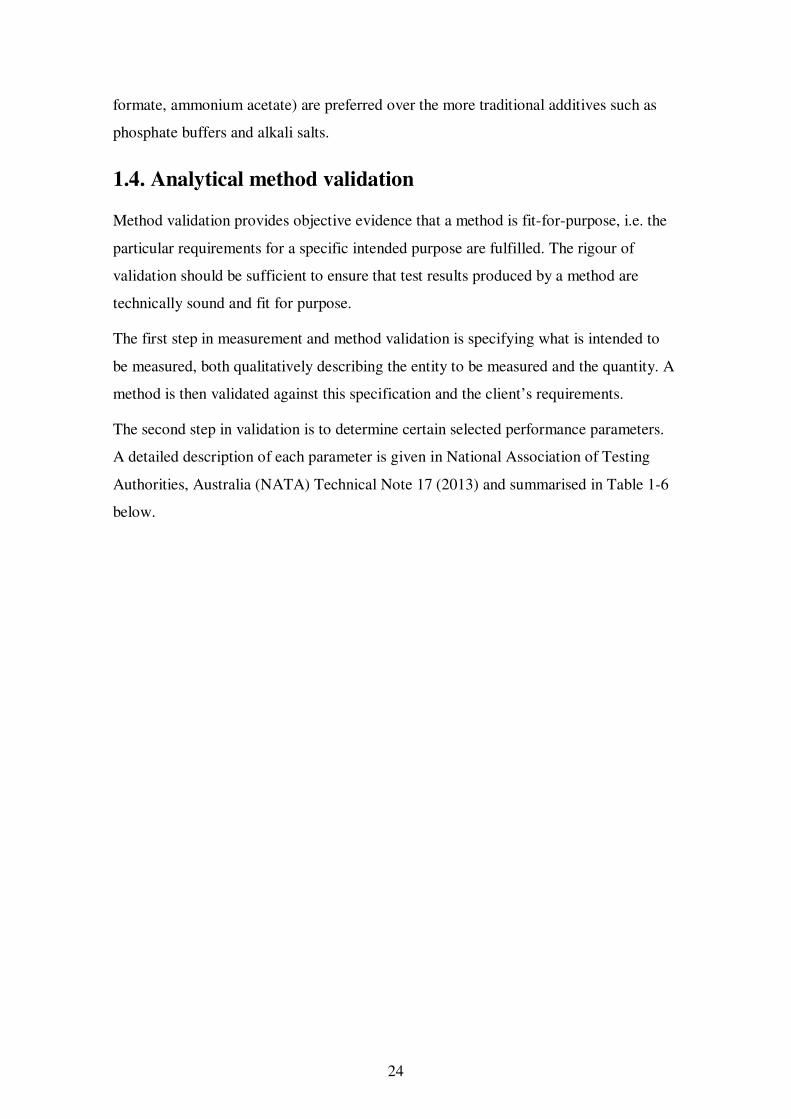
24
formate, ammonium acetate) are preferred over the more traditional additives such as
phosphate buffers and alkali salts.
1.4. Analytical method validation
Method validation provides objective evidence that a method is fit-for-purpose, i.e. the
particular requirements for a specific intended purpose are fulfilled. The rigour of
validation should be sufficient to ensure that test results produced by a method are
technically sound and fit for purpose.
The first step in measurement and method validation is specifying what is intended to
be measured, both qualitatively describing the entity to be measured and the quantity. A
method is then validated against this specification and the client’s requirements.
The second step in validation is to determine certain selected performance parameters.
A detailed description of each parameter is given in National Association of Testing
Authorities, Australia (NATA) Technical Note 17 (2013) and summarised in Table 1-6
below.
25
Table 1-6: Validation performance parameters (National Association of Testing
Authorities 2013)
Characteristics to
be evaluated
Procedure to be followed
Linearity Analysis of calibration standards
Sensitivity Analysis of spiked samples or standards prepared in sample extract solution
Selectivity Consideration of potential interferences, analysis of samples spiked with possible interferences (method development may have overcome potential issues)
Trueness; bias Analysis of: • Certified Reference Materials (CRMs) • Other Reference Materials (RMs) • Sample spikes • Comparison with Standard Methods • Results from collaborative studies
Precision; intra-laboratory reproducibility
Replicate analysis of samples, including multiple analysts conducting the analysis: if possible selected to contain analytes at concentrations most relevant to users of test results
Limits of detection (LOD); limits of quantification (LOQ)
Analysis of samples containing low levels of analytes. The determination of LOD and LOQ is normally only required for methods intended to determine analytes at about these concentrations.
Working range Evaluation of data from bias and possibly LOQ determinations
Ruggedness Consider those steps of the method, which if varied marginally, would possibly affect the results.
Investigate if necessary (1) single variable test and (11) multi variable test
Measurement uncertainty
Calculate a reasonable fit-for-purpose estimate of measurement uncertainty, which is the range where the true measurement could be found. Ensure estimates are aligned with the concentrations most relevant to the users of the results.
Utilise other validation data, combined with any other complementary data available, e.g. results from collaborative studies, proficiency tests, round robin tests, in house QC data
26
1.5. Significance
The development of a single method for the analysis of a large number of fat-soluble
vitamins and carotenoids in milk would be a significant advance in the analysis of these
compounds since it could potentially reduce the complexity and cost of analysis. The
use of mass spectrometric detection could reduce the amount of sample preparation
(only 1 extract, not 2 or 3) required and substantially reduce instrument time since one
HPLC-MS will replace several HPLC instruments. Achieving good chromatographic
performance (acceptable peak shape and separation of compounds from one another and
from matrix interferences) and good mass spectrometric performance (good ionisation
and fragmentation efficiency with compound specific fragments) without the use of
derivatising reagents is preferred in order to keep complexity and cost to a minimum.
HPLC-MSn has the potential to identify other biologically important compounds in the
extract, such as other vitamers and phytosterols, whose levels might change with
different feeding regimes.
1.6. Objectives of this study
The aim of this work was to develop a validated method for the determination of a
number of fat-soluble vitamins in cow milk by HPLC-MSn. The method was then used
to determine if there are significant differences in the fat-soluble vitamin concentrations
of milk sourced from cows fed different feeding regimes.
The specific objectives of this work are:
• Develop and validate a HPLC-MSn method for the determination of vitamin D3
in cow milk.
• Develop and validate a HPLC-MSn method for the simultaneous determination
of vitamins A (all trans-retinol), E (α-tocopherol), and β-carotene in cow milk.
• Compare these results with those obtained using HPLC with Fluorescence (Fl)
and/or Photodiode array (PDA) detection (vitamins A, E and β-carotene) and
HPLC-MS/MS (vitamin D3).
• Determine the levels of these vitamins and β-carotene in milk samples sourced
from a dairy cow feeding experiment conducted at the Department of Primary
Industries (DPI), Ellinbank, Victoria, Australia.

27
• Assess whether there is any significant difference in fat-soluble vitamin and β-
carotene concentrations in the milk resulting from the different feeding regimes.
28
Chapter 2: Materials and methods
2.1. Introduction
This chapter provides the details of the materials used for the development and
validation of methods for the analysis of fat-soluble vitamins in cow milk, specifically
vitamin D3 and 25-hydroxyvitamin D3 using HPLC-MSn and HPLC-MS/MS, and all
trans-retinol, α-tocopherol and β-carotene using HPLC- MSn. The methods that were
developed are described in Chapters 3 and 4.
Milk samples were sourced from a dairy cow feeding systems experiment. Details of the
feeding experiment are provided in this Chapter. The feeding experiment samples were
used for (1) validation of the all trans-retinol, α-tocopherol and β-carotene analytical
method, and (2) to assess the effects of the feeding experiment on the levels of these
compounds in the milk (see section 2.8.).
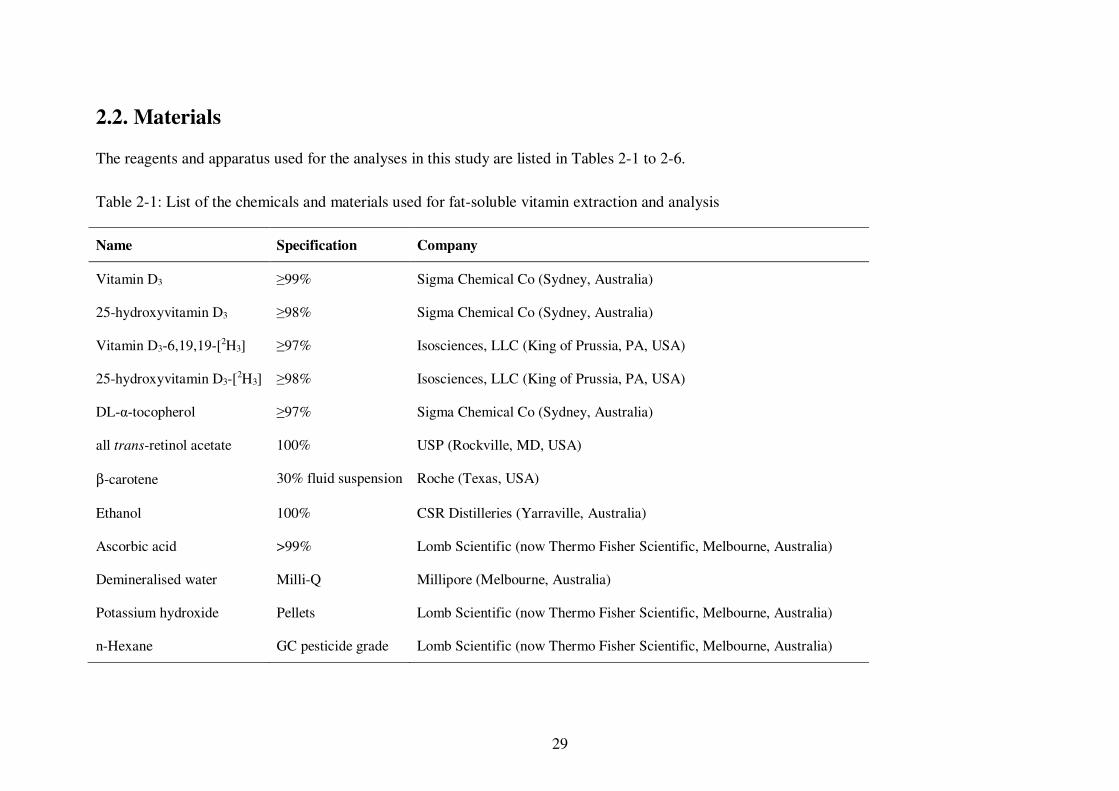
29
2.2. Materials
The reagents and apparatus used for the analyses in this study are listed in Tables 2-1 to 2-6.
Table 2-1: List of the chemicals and materials used for fat-soluble vitamin extraction and analysis
Name Specification Company
Vitamin D3 ≥99% Sigma Chemical Co (Sydney, Australia)
25-hydroxyvitamin D3 ≥98% Sigma Chemical Co (Sydney, Australia)
Vitamin D3-6,19,19-[2H3] ≥97% Isosciences, LLC (King of Prussia, PA, USA)
25-hydroxyvitamin D3-[2H3] ≥98% Isosciences, LLC (King of Prussia, PA, USA)
DL-α-tocopherol ≥97% Sigma Chemical Co (Sydney, Australia)
all trans-retinol acetate 100% USP (Rockville, MD, USA)
β-carotene 30% fluid suspension Roche (Texas, USA)
Ethanol 100% CSR Distilleries (Yarraville, Australia)
Ascorbic acid >99% Lomb Scientific (now Thermo Fisher Scientific, Melbourne, Australia)
Demineralised water Milli-Q Millipore (Melbourne, Australia)
Potassium hydroxide Pellets Lomb Scientific (now Thermo Fisher Scientific, Melbourne, Australia)
n-Hexane GC pesticide grade Lomb Scientific (now Thermo Fisher Scientific, Melbourne, Australia)
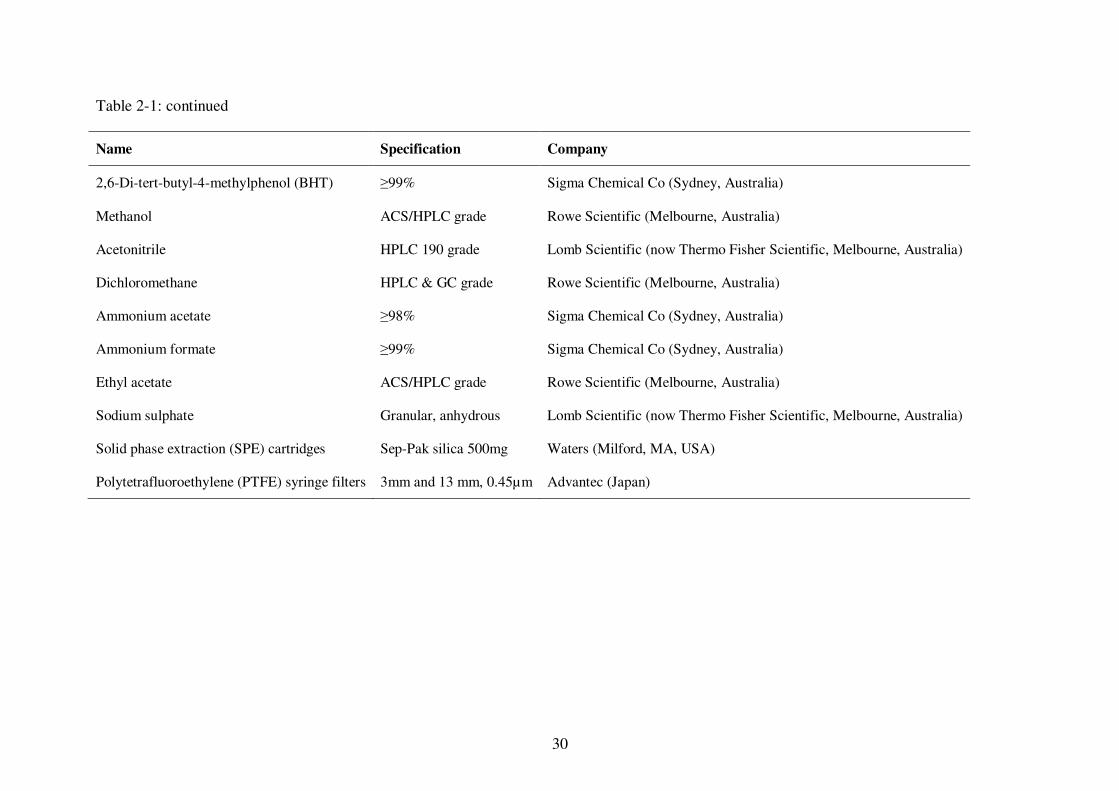
30
Table 2-1: continued
Name Specification Company
2,6-Di-tert-butyl-4-methylphenol (BHT) ≥99% Sigma Chemical Co (Sydney, Australia)
Methanol ACS/HPLC grade Rowe Scientific (Melbourne, Australia)
Acetonitrile HPLC 190 grade Lomb Scientific (now Thermo Fisher Scientific, Melbourne, Australia)
Dichloromethane HPLC & GC grade Rowe Scientific (Melbourne, Australia)
Ammonium acetate ≥98% Sigma Chemical Co (Sydney, Australia)
Ammonium formate ≥99% Sigma Chemical Co (Sydney, Australia)
Ethyl acetate ACS/HPLC grade Rowe Scientific (Melbourne, Australia)
Sodium sulphate Granular, anhydrous Lomb Scientific (now Thermo Fisher Scientific, Melbourne, Australia)
Solid phase extraction (SPE) cartridges Sep-Pak silica 500mg Waters (Milford, MA, USA)
Polytetrafluoroethylene (PTFE) syringe filters 3mm and 13 mm, 0.45µm Advantec (Japan)
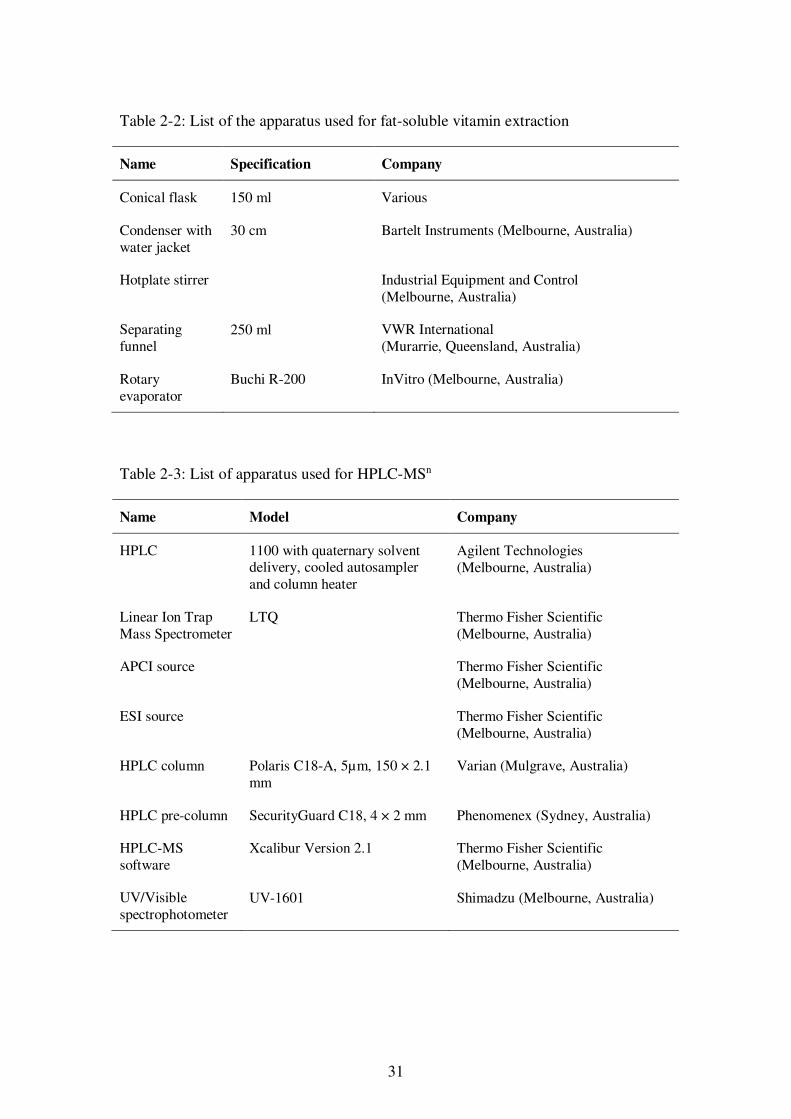
31
Table 2-2: List of the apparatus used for fat-soluble vitamin extraction
Name Specification Company
Conical flask 150 ml Various
Condenser with water jacket
30 cm Bartelt Instruments (Melbourne, Australia)
Hotplate stirrer Industrial Equipment and Control (Melbourne, Australia)
Separating funnel
250 ml VWR International (Murarrie, Queensland, Australia)
Rotary evaporator
Buchi R-200 InVitro (Melbourne, Australia)
Table 2-3: List of apparatus used for HPLC-MSn
Name Model Company
HPLC 1100 with quaternary solvent delivery, cooled autosampler and column heater
Agilent Technologies (Melbourne, Australia)
Linear Ion Trap Mass Spectrometer
LTQ Thermo Fisher Scientific (Melbourne, Australia)
APCI source Thermo Fisher Scientific (Melbourne, Australia)
ESI source Thermo Fisher Scientific (Melbourne, Australia)
HPLC column Polaris C18-A, 5µm, 150 × 2.1 mm
Varian (Mulgrave, Australia)
HPLC pre-column SecurityGuard C18, 4 × 2 mm Phenomenex (Sydney, Australia)
HPLC-MS software
Xcalibur Version 2.1 Thermo Fisher Scientific (Melbourne, Australia)
UV/Visible spectrophotometer
UV-1601 Shimadzu (Melbourne, Australia)
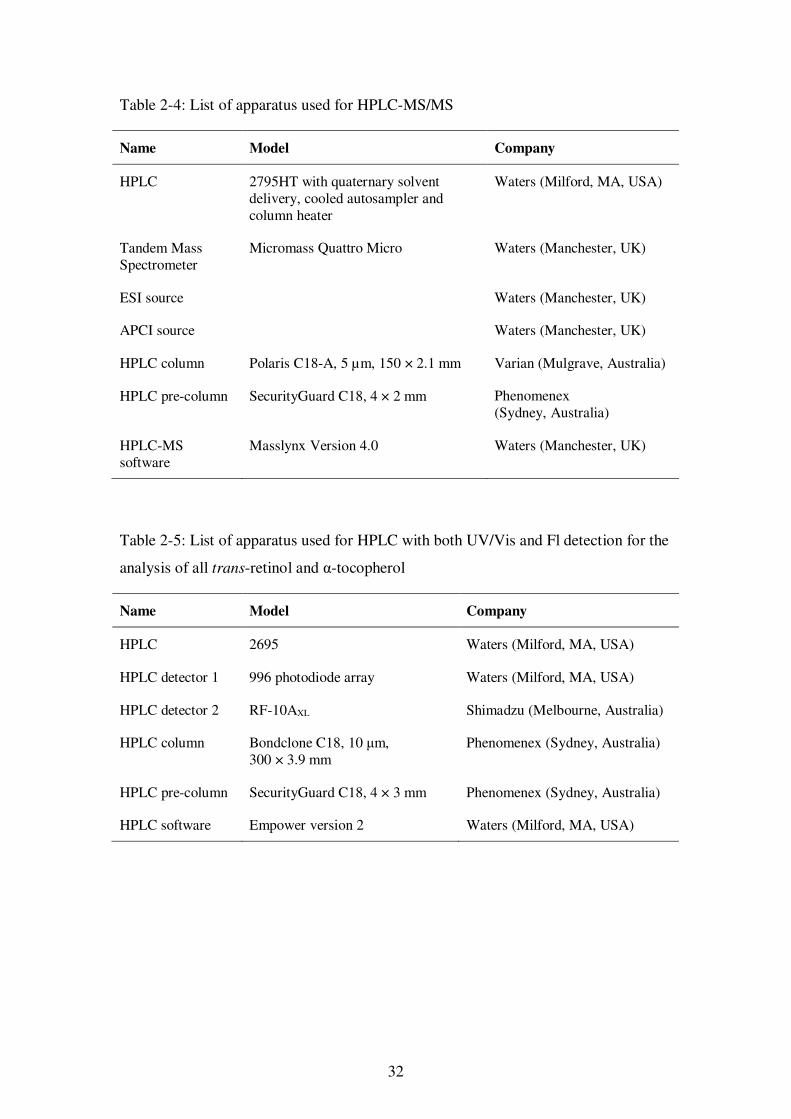
32
Table 2-4: List of apparatus used for HPLC-MS/MS
Name Model Company
HPLC 2795HT with quaternary solvent delivery, cooled autosampler and column heater
Waters (Milford, MA, USA)
Tandem Mass Spectrometer
Micromass Quattro Micro Waters (Manchester, UK)
ESI source Waters (Manchester, UK)
APCI source Waters (Manchester, UK)
HPLC column Polaris C18-A, 5 µm, 150 × 2.1 mm Varian (Mulgrave, Australia)
HPLC pre-column SecurityGuard C18, 4 × 2 mm Phenomenex (Sydney, Australia)
HPLC-MS software
Masslynx Version 4.0 Waters (Manchester, UK)
Table 2-5: List of apparatus used for HPLC with both UV/Vis and Fl detection for the
analysis of all trans-retinol and α-tocopherol
Name Model Company
HPLC 2695 Waters (Milford, MA, USA)
HPLC detector 1 996 photodiode array Waters (Milford, MA, USA)
HPLC detector 2 RF-10AXL Shimadzu (Melbourne, Australia)
HPLC column Bondclone C18, 10 μm, 300 × 3.9 mm
Phenomenex (Sydney, Australia)
HPLC pre-column SecurityGuard C18, 4 × 3 mm Phenomenex (Sydney, Australia)
HPLC software Empower version 2 Waters (Milford, MA, USA)
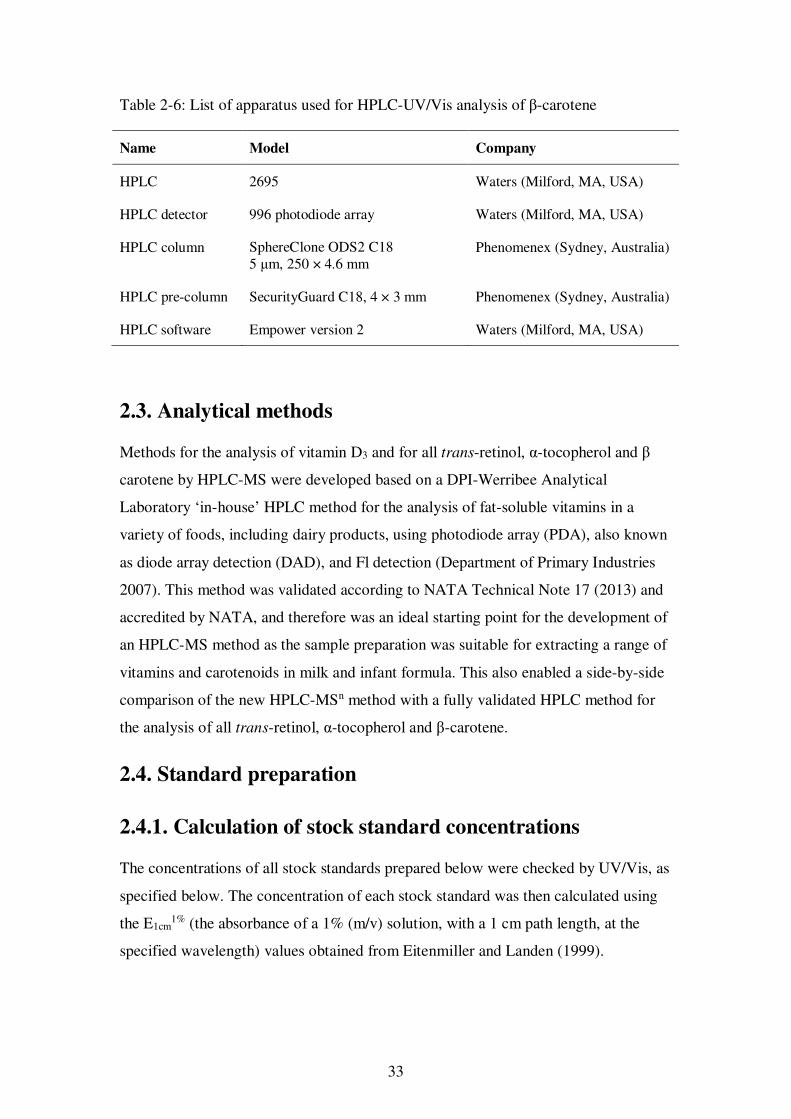
33
Table 2-6: List of apparatus used for HPLC-UV/Vis analysis of β-carotene
Name Model Company
HPLC 2695 Waters (Milford, MA, USA)
HPLC detector 996 photodiode array Waters (Milford, MA, USA)
HPLC column SphereClone ODS2 C18 5 μm, 250 × 4.6 mm
Phenomenex (Sydney, Australia)
HPLC pre-column SecurityGuard C18, 4 × 3 mm Phenomenex (Sydney, Australia)
HPLC software Empower version 2 Waters (Milford, MA, USA)
2.3. Analytical methods
Methods for the analysis of vitamin D3 and for all trans-retinol, α-tocopherol and β
carotene by HPLC-MS were developed based on a DPI-Werribee Analytical
Laboratory ‘in-house’ HPLC method for the analysis of fat-soluble vitamins in a
variety of foods, including dairy products, using photodiode array (PDA), also known
as diode array detection (DAD), and Fl detection (Department of Primary Industries
2007). This method was validated according to NATA Technical Note 17 (2013) and
accredited by NATA, and therefore was an ideal starting point for the development of
an HPLC-MS method as the sample preparation was suitable for extracting a range of
vitamins and carotenoids in milk and infant formula. This also enabled a side-by-side
comparison of the new HPLC-MSn method with a fully validated HPLC method for
the analysis of all trans-retinol, α-tocopherol and β-carotene.
2.4. Standard preparation
2.4.1. Calculation of stock standard concentrations
The concentrations of all stock standards prepared below were checked by UV/Vis, as
specified below. The concentration of each stock standard was then calculated using
the E1cm1% (the absorbance of a 1% (m/v) solution, with a 1 cm path length, at the
specified wavelength) values obtained from Eitenmiller and Landen (1999).
34
2.4.2. Preparation of vitamin D3 and 25-hydroxyvitamin D3
standards
Stock, intermediate and working standards of vitamin D3, 25-hydroxyvitamin D3,
vitamin D3-[2H3] and 25-hydroxyvitamin D3-[2H3] were prepared in methanol.
Stock standard solutions (121 µg/ml vitamin D3, 68 µg/ml 25-hydroxyvitamin D3, 53
µg/ml vitamin D3-[2H3] and 83 µg/ml 25-hydroxyvitamin D3-[2H3]) were shown to be
stable for at least 6 months when stored at -20°C.
The intermediate standard solution (0.968 µg/ml vitamin D3, 0.676 µg/ml 25-
hydroxyvitamin D3) was prepared from stock solutions and was shown to be stable for
at least 1 month when stored at -20°C.
The working standard (0.0968 µg/ml vitamin D3, 0.0676 µg/ml 25-hydroxyvitamin
D3) was prepared daily from the intermediate standards.
The intermediate internal standard solution (0.5 µg/ml vitamin D3-[2H3], 0.04 µg/ml
25-hydroxyvitamin D3-[2H3]) was prepared from stock solutions and was shown to be
stable for at least 2 months when stored at -20°C.
The sample reconstituting solution (0.1 µg/ml vitamin D3-[2H3], 0.008 µg/ml 25-
hydroxyvitamin D3-[2H3]) was prepared weekly from the intermediate standard and
stored at -20°C.
2.4.2.1. Analytical standards for the analysis of non-fortified samples
A series of four standards containing between 0.0025 µg/ml and 0.025 µg/ml vitamin
D3, between 0.0017 µg/ml and 0.017 µg/ml 25-hydroxyvitamin D3, and each
containing vitamin D3-[2H3] (0.1 µg/ml) and 25-hydroxyvitamin D3-[2H3] (0.008
µg/ml) as internal standards, were prepared daily, in methanol, from the working
standard and intermediate internal standard solution.
2.4.2.2. Analytical standards for the analysis of fortified samples
A series of six standards containing between 0.01 µg/ml and 0.4 µg/ml were prepared
for quantification. Each solution contained vitamin D3-[2H3] (0.1 µg/ml) as the
internal standard.
35
2.4.3. Preparation of all trans-retinol, α-tocopherol and β-
carotene standards
Stock standard solutions of all trans-retinyl acetate (82 µg/ml), α-tocopherol (520
µg/ml) and β-carotene (170 µg/ml) were prepared in hexane and the concentrations
checked weekly by UV/Vis spectroscopy. Stock standard solutions were stable for at
least 3 months when stored at 4°C.
A standard solution of all trans-retinol (37 µg/ml) in methanol was prepared weekly
by saponification of an aliquot of the all trans-retinol acetate stock standard, using the
procedure described in section 2.7.1, with the exception that the retinol was extracted
using hexane rather than hexane containing 15 mg/l butylated hydroxytoluene (BHT).
After removal of the hexane in vaccuo, the all trans-retinol was dissolved in 4 ml
methanol and the concentration checked by UV/Vis spectrometry. The all trans-
retinol standard solution was then stored at -20°C.
A spiking standard solution containing all trans-retinyl acetate (3.3 µg/ml), α-
tocopherol (10 µg/ml) and β-carotene (1.7 µg/ml) was prepared daily, in hexane, from
the stock standard solutions.
An intermediate standard solution containing α-tocopherol (63 µg/ml) and β-carotene
(7 µg/ml) was prepared daily in methanol.
2.4.3.1. Analytical standards
A series of five standards containing approximately 0.05 - 1.2 µg/ml all trans-retinol,
0.3 - 6.5 µg/ml α-tocopherol and 0.03 - 0.7 µg/ml β-carotene were prepared daily, in
methanol, from the all trans-retinol standard and the α-tocopherol and β-carotene
intermediate standard.
2.5. Sampling, preparation and storage of milk
2.5.1. Vitamin D3
Samples of fresh cow milk were sourced from a private dairy farm in Trafalgar,
Gippsland, Victoria and DPI Ellinbank research dairy. Commercial cow milk samples
were purchased from a retail outlet in Vermont South, Victoria, Australia. All samples
were stored at 4°C and assayed within 3 days for the fresh milk samples and before
36
the recommended use by date for the commercial samples. The homogenised
powdered infant formula was kindly supplied by the National Measurement Institute,
Port Melbourne, Victoria, Australia. The milk samples were mixed thoroughly by
inversion ten times before assaying. The powdered infant formula was mixed with
water according to the manufacturer’s instructions (1 g with 9 ml water) immediately
before analysis. To avoid the destruction of the vitamin by exposure to light, all
experiments were conducted under yellow fluorescent lighting which excludes light
of less than 500 nm wavelength (Ball 1998), and amber glassware was used where
appropriate.
2.5.2. Vitamin A, E and β-carotene
Fresh cow milk was sourced from DPI Ellinbank research dairy, see section 2.8 for
details. All samples were stored at 4°C for one day, sub-sampled, and the sub-
samples stored at -70°C prior to analysis. The thawed milk samples were mixed
thoroughly before assaying. A powdered infant formula sample received from
Proficiency Testing Australia was used as a control sample for all trans-retinol and α-
tocopherol. The infant formula was dissolved in water (1 g with 9 ml water)
immediately before analysis. Commercial full cream milk was purchased from a local
retail outlet, stored at 4°C and assayed before the recommended use by date. All
experiments were conducted under yellow fluorescent lighting and amber glassware
used where appropriate.
2.6. Vitamin D
2.6.1. Sample extraction
2.6.1.1. Fortified commercial cow milk and infant formula
A suitable aliquot of the sample (10 ml) was mixed with 0.5 g of ascorbic acid, 40 ml
of ethanol and 10 ml of 1:1 (w/v) potassium hydroxide in water and heated at reflux
with stirring for 30 minutes. The mixture was cooled in an ice bath and diluted with
50 ml water and 10 ml ethanol. The solution was transferred to a separating funnel
and the analytes extracted into 50 ml hexane containing 15 mg/l BHT with gentle
mixing. The aqueous phase was separated and extracted twice with 20 ml portions of
hexane containing 15 mg/l BHT. The hexane extracts were combined and washed
37
with water (3 × 100 ml). The hexane solution was transferred to an amber flask and
the solvent removed in vaccuo at 40°C. The residue was reconstituted with 1.0 ml
internal standard solution (vitamin D3-[2H3], 0.1 µg/ml) and filtered through a 3 mm
0.45 µm PTFE filter disc before analysis.
2.6.1.2. Non-fortified commercial cow milk and fresh cow milk
The samples were saponified and extracted as described above. The residue remaining
after removal of the solvent in vaccuo was re-constituted in 5 ml hexane. For vitamin
D3, 2 ml of the hexane solution was loaded onto a 500 mg Silica solid phase
extraction (SPE) cartridge. The cartridge was first washed with 3 ml hexane, followed
by 3 ml of hexane: ethyl acetate (90:10 v/v) and the vitamin D3 eluted with 6 ml
hexane: ethyl acetate (80:20 v/v). The solvents were removed with a stream of
nitrogen, the residue reconstituted with 0.25 ml internal standard solution (vitamin
D3-[2H3], 0.1 µg/ml) and filtered through a 3 mm 0.45 µm PTFE filter into a tapered
vial prior to analysis.
For 25-hydroxyvitamin D3, a separate 2 ml aliquot of the hexane solution was loaded
onto a 500 mg Silica SPE cartridge. The cartridge was washed with 3 ml hexane, 3 ml
of hexane: ethyl acetate (90:10 v/v) and the 25-hydroxyvitamin D3 eluted with 6 ml
hexane: ethyl acetate (60:40 v/v). The solvents were removed with a stream of
nitrogen, the residue reconstituted with 0.25 ml internal standard solution (25-
hydroxyvitamin D3-[2H3], 0.008 µg/ml) and filtered through a 3 mm 0.45 µm PTFE
filter into a tapered vial prior to analysis.
2.6.2. Analysis
2.6.2.1. High performance liquid chromatography-ion trap mass spectrometry
The analyses were performed with an Agilent series 1100 quaternary solvent delivery
system and a cooled autosampler (4°C) connected to a Thermo Electron LTQ linear
ion trap mass spectrometer operating in the positive ion Atmospheric Pressure
Chemical Ionisation (APCI) mode. The compounds were separated on a 150 × 2.1
mm 5 µm Polaris C18-A column fitted with a C18 guard column and maintained at
30°C. The mobile phase consisted of methanol:water (92:8 v/v) and the flow rate was
0.2 ml/min. The APCI vaporizer temperature was 200°C, the ion current 4.5 µA, the
heated capillary was maintained at 200°C and the sheath and auxiliary gases were at
38
20 and 5 units respectively. Source voltage was 4.4 kV and the capillary voltage set at
16 V. Prior to data acquisition, the system was tuned using a 10 μg/ml vitamin D3
standard solution. The solution was infused via syringe pump through a T-piece at a
rate of 10 μl/min and mixed with HPLC mobile phase (0.2 ml/min) before entering
the mass spectrometer. Excalibur V2.1 software was used to process the data.
2.6.2.1.1. Fortified samples
A full scan protocol (3-10 min) with a mass range of m/z 150-800 was used for 25-
hydroxyvitamin D3, (m/z 401). Three scan events (10-26 min) were used for vitamin
D3 (m/z 385.5) and vitamin D3-[2H3] (m/z 388.5). The first scan event was a full scan
from m/z 150-800. For the second scan event, m/z 385.5 was isolated and fragmented
to m/z 367.4 and m/z 259. For the third scan event, m/z 388.5 was isolated and
fragmented to m/z 370.4. Ion max times of 200 milli sec, isolation widths of 1.0 and
normalized collision energies of 20% were used for all SRM transitions.
2.6.2.1.2. Non-fortified samples
Three scan events (3-10 min) were used for 25-hydroxyvitmin D3 (m/z 401) and 25-
hydroxyvitamin D3-[2H3] (m/z 404). The first scan event was a full scan from m/z 150-
800. For the second scan event, m/z 401 was isolated and fragmented to m/z 383 and
m/z 365.2. For the third scan event, m/z 404 was isolated and fragmented to m/z 386.
Ion max times of 200 milli sec, isolation widths of 3.5 and collision energies of 23%
were used for all SRM transitions. Three scan events (10-20.9 min) were used for
vitamin D3 (m/z 385.5) and vitamin D3-[2H3] (m/z 388.5). The first scan event was a
full scan from m/z 150-800. For the second scan event, m/z 385.5 was isolated and
fragmented to m/z 367.4 and m/z 259. For the third scan event, m/z 388.5 was isolated
and fragmented to m/z 370.4. Ion max times of 200 milli sec, isolation widths of 2.0
and collision energies of 25% were used for all SRM transitions.
2.6.2.2. High performance liquid chromatography-tandem mass spectrometry
The analyses were performed with a Waters Alliance HT 2795 quaternary solvent
delivery system and a cooled autosampler (4°C) interfaced to a Waters Micromass
Quattro Micro tandem mass spectrometer operating in the positive ion ESI mode. The
compounds were separated on a 150 × 2.1 mm 5 µm Polaris C18 column fitted with a
C18 guard column using a mobile phase consisting of methanol:water (92:8 v/v)
39
containing 5 mM ammonium formate and a flow rate of 0.2 ml/min. The column was
maintained at 30°C. Multiple reaction monitoring transitions were: vitamin D3 m/z
385.2 → 107, 159.2, 259.4; vitamin D3-[2H3] m/z 388.3→110, 162.2, 259.4, 370.4;
25-hydroxyvitamin D3 m/z 401.2 → 105, 159 and 383. The Quattro Micro tandem
mass spectrometer capillary voltage was set at 2.6 kV, the cone voltage 23 V and the
source and desolvation temperatures set to 100°C and 400°C respectively. The
nitrogen gas flow rates were 60 l/h and 500 l/h for the cone gas flow and desolvation
gas flow respectively. Argon was used as a collision gas at 3 × 10⁻³ mbar. MRM
functions were divided into three groups (MRM1 25-hydroxyvitamin D3 0-8 min,
MRM2 vitamin D3 and MRM3 vitamin D3-[2H3] 14-24 min) with dwell time of 0.1
sec. Masslynx V4.0 software was used to process the data.
The methodology for vitamin D3 analysis is summarised in Figure 2-1.
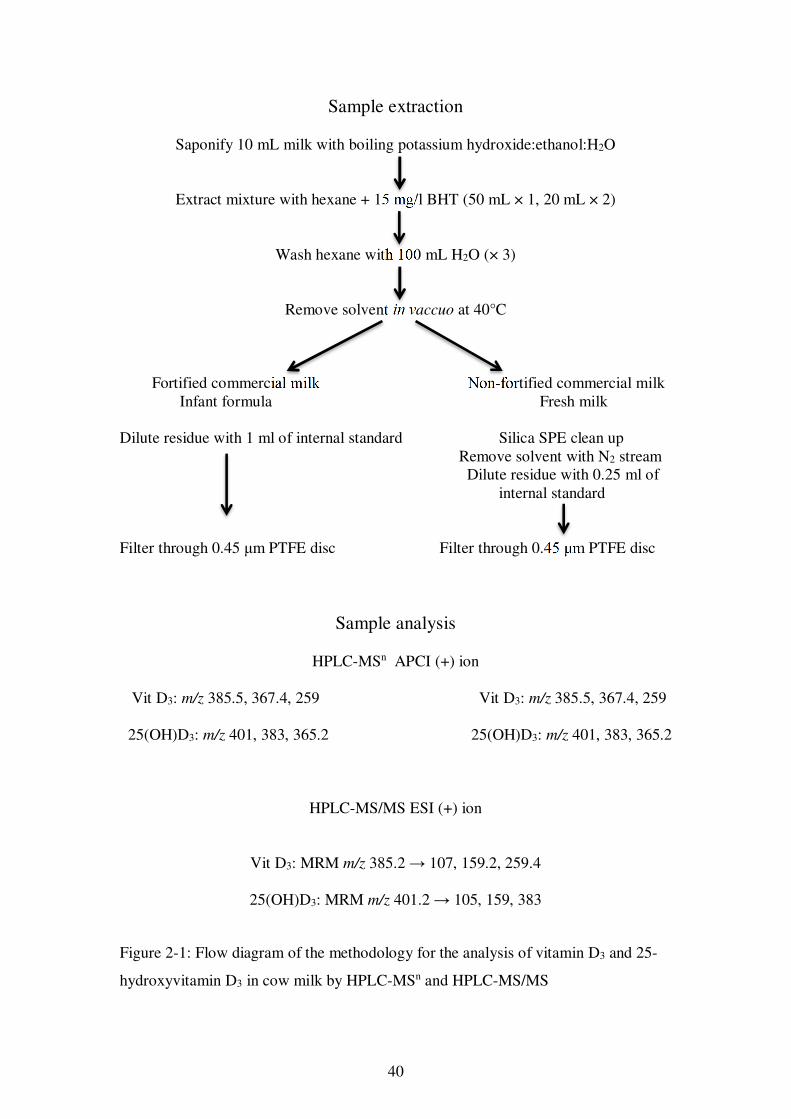
40
Sample extraction
Saponify 10 mL milk with boiling potassium hydroxide:ethanol:H2O
Extract mixture with hexane + 15 mg/l BHT (50 mL × 1, 20 mL × 2)
Wash hexane with 100 mL H2O (× 3)
Remove solvent in vaccuo at 40°C
Fortified commercial milk Non-fortified commercial milk Infant formula Fresh milk
Dilute residue with 1 ml of internal standard Silica SPE clean up Remove solvent with N2 stream Dilute residue with 0.25 ml of internal standard
Filter through 0.45 μm PTFE disc Filter through 0.45 μm PTFE disc
Sample analysis
HPLC-MSn APCI (+) ion
Vit D3: m/z 385.5, 367.4, 259 Vit D3: m/z 385.5, 367.4, 259 25(OH)D3: m/z 401, 383, 365.2 25(OH)D3: m/z 401, 383, 365.2
HPLC-MS/MS ESI (+) ion
Vit D3: MRM m/z 385.2 → 107, 159.2, 259.4
25(OH)D3: MRM m/z 401.2 → 105, 159, 383
Figure 2-1: Flow diagram of the methodology for the analysis of vitamin D3 and 25-
hydroxyvitamin D3 in cow milk by HPLC-MSn and HPLC-MS/MS
41
2.7. Vitamin A, E and β-carotene
2.7.1. Sample extraction
A 10 ml aliquot of cow milk was mixed with 0.5 g of ascorbic acid, 40 ml of ethanol
and 10 ml of 1:1 potassium hydroxide in water and heated at reflux with stirring for
30 minutes. The mixture was cooled in an ice bath and quantitatively transferred to a
separating funnel with 50 ml water, 10 ml ethanol and 50 ml hexane containing 15
mg/l BHT. The separating funnel was shaken vigorously for 2 minutes and the phases
allowed to separate. The aqueous phase was removed and extracted twice more with
20 ml portions of hexane containing 15 mg/l BHT. The hexane extracts were
combined, washed three times with 100 ml of water and then made to 100 ml with
hexane. 10 ml of the hexane solution was then transferred to a glass tube and the
solvent removed under a flow of nitrogen at room temperature. The residue was
reconstituted with 1.0 ml of methanol and filtered through a 13 mm 0.45 µm PTFE
filter disc into three separate vials for concurrent analysis by HPLC-MSn, HPLC-
UV/Vis and HPLC-Fl.
2.7.2. Analysis
2.7.2.1. High performance liquid chromatography-ion trap mass spectrometry
The analyses were performed with an Agilent 1100 series quaternary solvent delivery
system with a cooled autosampler (4°C) connected to a Thermo LTQ ion trap mass
spectrometer operating in the positive ion APCI mode. The compounds were
separated with a Polaris 150 × 2.1 mm, 5 μm C18-A column fitted with a C18 guard
column and maintained at 30°C. The mobile phase consisted of (A) water and (B)
methanol with a flow rate of 0.2 ml/min. The elution profile was: 0 min, 95% B; 5
min, 95% B; 10 min, 100% B (linear gradient); 25 min, 100% B; 26 min, 95% B, and
the column equilibrated for 5 min at a flow rate of 0.4 ml/min before the next
injection.
The mass spectrometer was tuned by infusing a 10 µg/ml solution of each compound
at a rate of 10 µg/100 ml, mixed with 0.2 ml/min HPLC mobile phase via a T-piece
before entering the mass spectrometer.
42
The APCI vaporizer temperature was set at 250°C, the ion current 4.5 mA, the heated
capillary was maintained at 200°C and the sheath and auxiliary gases were at 20 and 5
units respectively. Source voltage was set to 4.4 kV and the capillary voltage set at 16
V. A full scan MS2 protocol was used with the following settings; all trans-retinol,
parent mass m/z 269, normalized collision energy of 30, scan range of m/z 70 to 250,
quantification ions m/z 213 and m/z 199, α-tocopherol, parent mass m/z 431,
normalized collision energy of 20, scan range of m/z 130 to 180, quantification ion
m/z 165 and β-carotene, parent mass m/z 537, normalized collision energy of 22, scan
range of m/z 150 to 490, quantification ion m/z 413. Excalibur V2.1 software was
used to process the data.
2.7.2.2. HPLC-UV/Vis and HPLC-Fl
2.7.2.2.1. All trans-retinol and α-tocopherol
The analyses were performed with a Waters series 2695 quaternary solvent delivery
system with a cooled autosampler at 4°C and heated column compartment at 30°C,
coupled in series to a Waters 996 PDA detector (all trans-retinol λ 320 nm) and a
Shimadzu RF-10AXL Fl detector (α -tocopherol Ex 295 nm, Em 330 nm). The
compounds were separated on a Bondclone 300 × 3.9 mm, 10 μm C18 column fitted
with a C18 guard column. The mobile phase consisted of water:methanol (5:95 v/v),
at a flow rate of 1 ml/min.
2.7.2.2.2. β-carotene
The analyses were performed with a Waters series 2695 quaternary solvent delivery
system with a cooled autosampler at 4°C and heated column compartment at 30°C,
coupled to a Waters 996 PDA (λ 450 nm). The compounds were separated on a
Sphereclone 250 × 4.6 mm, 5 μm ODS2 C18 column fitted with a C18 guard column.
The mobile phase consisted of acetonitrile:50 mM ammonium acetate in
methanol:dichloromethane (75:20:5 v/v) and containing 0.05% v/v triethylamine and
0.1% w/v BHT, at a flow rate of 2 ml/min.
The methodology for the analysis vitamins A, E and β-carotene in milk is summarised
in Figure 2-2.
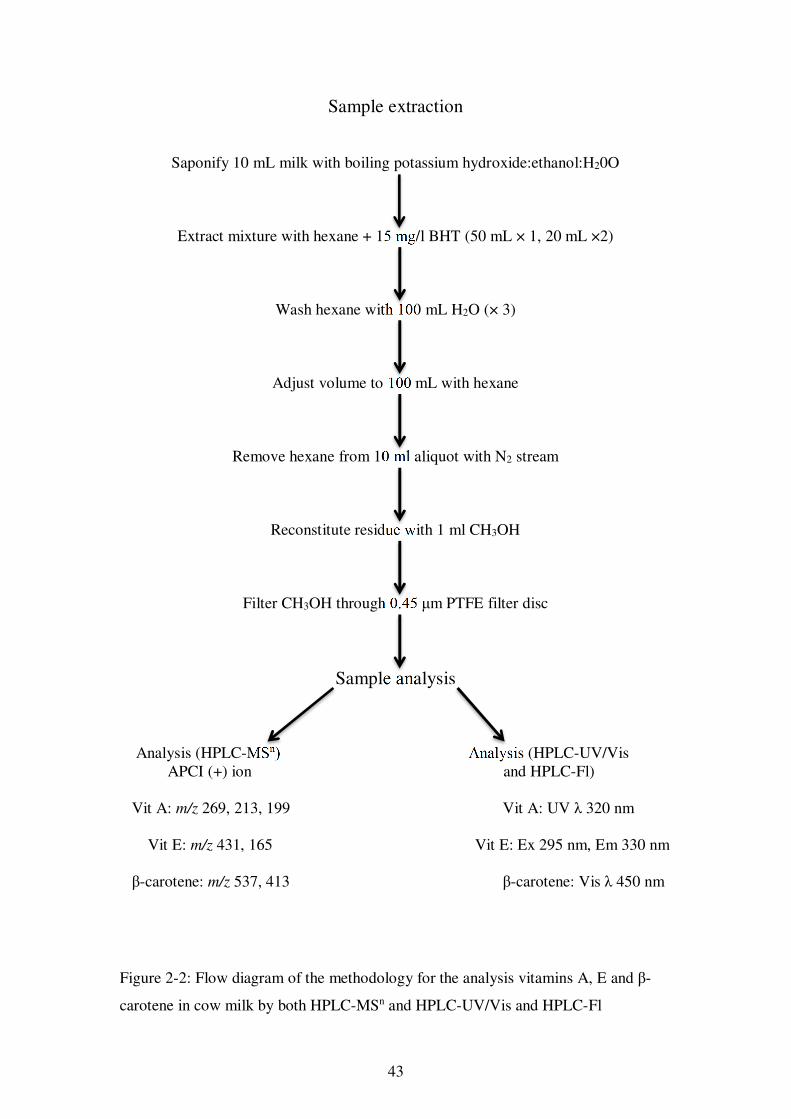
43
Sample extraction
Saponify 10 mL milk with boiling potassium hydroxide:ethanol:H20O
Extract mixture with hexane + 15 mg/l BHT (50 mL × 1, 20 mL ×2)
Wash hexane with 100 mL H2O (× 3)
Adjust volume to 100 mL with hexane
Remove hexane from 10 ml aliquot with N2 stream
Reconstitute residue with 1 ml CH3OH
Filter CH3OH through 0.45 μm PTFE filter disc
Sample analysis
Analysis (HPLC-MSn) Analysis (HPLC-UV/Vis APCI (+) ion and HPLC-Fl)
Vit A: m/z 269, 213, 199 Vit A: UV λ 320 nm
Vit E: m/z 431, 165 Vit E: Ex 295 nm, Em 330 nm
β-carotene: m/z 537, 413 β-carotene: Vis λ 450 nm
Figure 2-2: Flow diagram of the methodology for the analysis vitamins A, E and β-
carotene in cow milk by both HPLC-MSn and HPLC-UV/Vis and HPLC-Fl
44
2.8. Dairy cow feeding systems experiment
The milk samples analysed in this study were obtained from a short-term feeding rate
experiment that was a component of an experiment primarily designed to examine
milk production response curves for dairy cows fed different supplement regimes in
addition to the traditional pasture-based diet. The experiment was designed to mimic
conditions of low pasture availability and high supplement intake. It was conducted
at the DPI Ellinbank research farm, Victoria, Australia (latitude 38°14‘S, longitude
145°56‘E). All procedures were conducted in accordance with the Australian Code of
Practice for the Care and Use of Animals for Scientific Purposes (National Health and
Medical Research Council 2004). Approval to proceed was obtained from the DPI
Agricultural Research and Extension Animal Ethics Committee.
2.8.1. Experimental design
The primary study commenced in September 2009 with the selection of 216 cows,
which had calved in late winter-early spring and were in at least their second
lactation. The cows were allocated into 6 herds of 36 cows, which were balanced for
days in milk, age, body weight and prevailing production of milk, milk protein and
milk fat according to the method of Baird (1994). Two herds of 36 cows were then
randomly allocated to each of three feeding systems and were fed their various rations
at a rate of 10 kg DM total supplement/cow per day. The feeding systems are outlined
in section 2.8.2. below.
The short-term feeding rate experiment, a component of the primary experiment,
commenced in November 2009 with the division of each herd of 36 cows into four
groups of nine cows which were randomly assigned to one of four amounts of
supplementary feeding (6, 8, 10 or 12 kg DM total supplement/cow per day). This
gave a total of 24 treatment groups, as shown in Table 2-7.
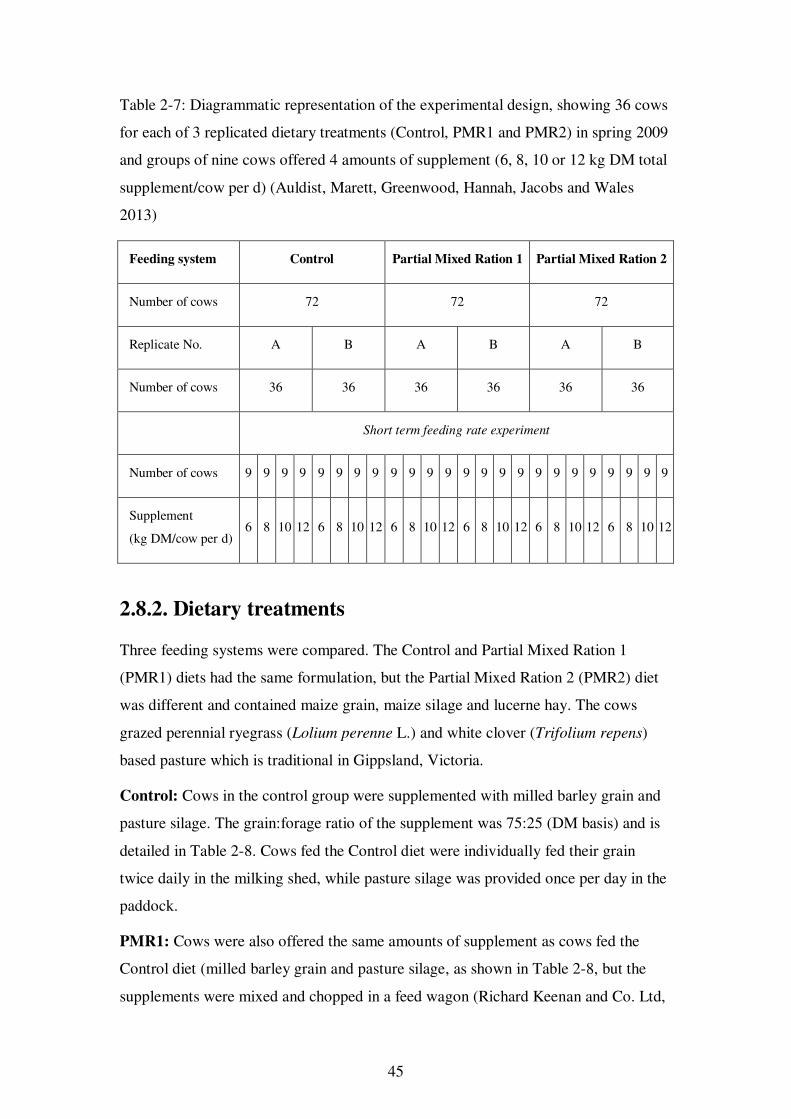
45
Table 2-7: Diagrammatic representation of the experimental design, showing 36 cows
for each of 3 replicated dietary treatments (Control, PMR1 and PMR2) in spring 2009
and groups of nine cows offered 4 amounts of supplement (6, 8, 10 or 12 kg DM total
supplement/cow per d) (Auldist, Marett, Greenwood, Hannah, Jacobs and Wales
2013)
Feeding system Control Partial Mixed Ration 1 Partial Mixed Ration 2
Number of cows 72 72 72
Replicate No. A B A B A B
Number of cows 36 36 36 36 36 36
Short term feeding rate experiment
Number of cows 9 9 9 9 9 9 9 9 9 9 9 9 9 9 9 9 9 9 9 9 9 9 9 9
Supplement
(kg DM/cow per d) 6 8 10 12 6 8 10 12 6 8 10 12 6 8 10 12 6 8 10 12 6 8 10 12
2.8.2. Dietary treatments
Three feeding systems were compared. The Control and Partial Mixed Ration 1
(PMR1) diets had the same formulation, but the Partial Mixed Ration 2 (PMR2) diet
was different and contained maize grain, maize silage and lucerne hay. The cows
grazed perennial ryegrass (Lolium perenne L.) and white clover (Trifolium repens)
based pasture which is traditional in Gippsland, Victoria.
Control: Cows in the control group were supplemented with milled barley grain and
pasture silage. The grain:forage ratio of the supplement was 75:25 (DM basis) and is
detailed in Table 2-8. Cows fed the Control diet were individually fed their grain
twice daily in the milking shed, while pasture silage was provided once per day in the
paddock.
PMR1: Cows were also offered the same amounts of supplement as cows fed the
Control diet (milled barley grain and pasture silage, as shown in Table 2-8, but the
supplements were mixed and chopped in a feed wagon (Richard Keenan and Co. Ltd,
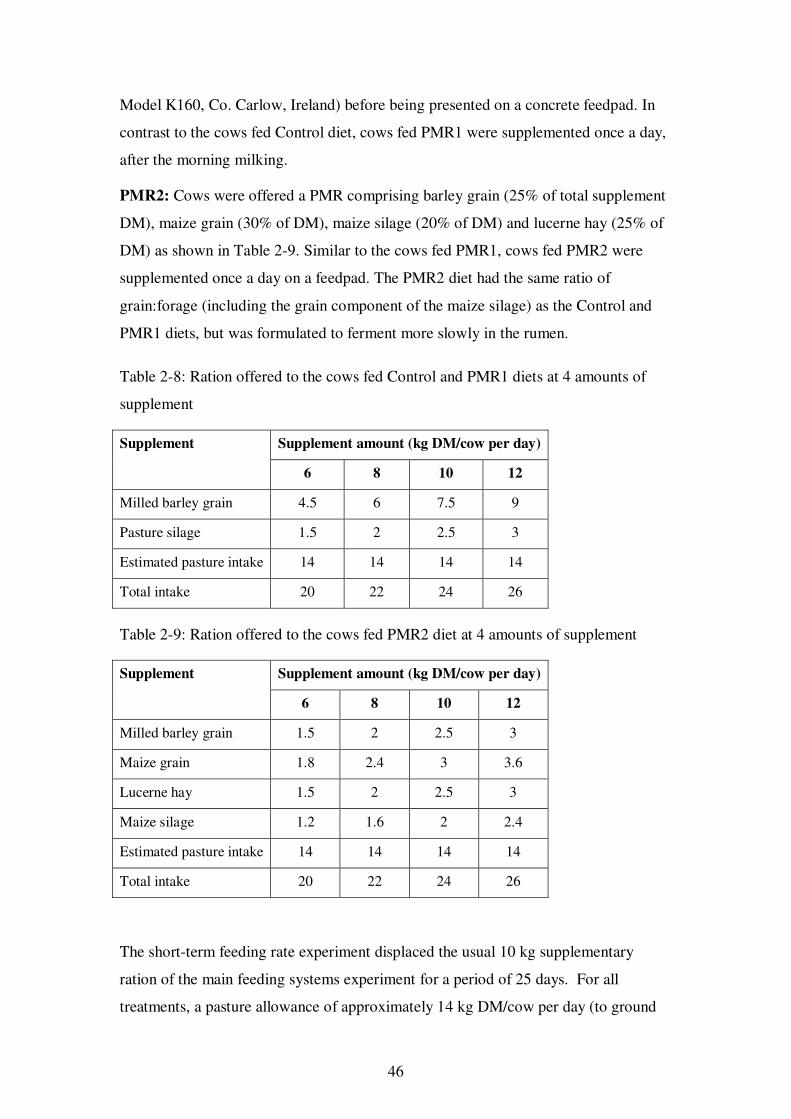
46
Model K160, Co. Carlow, Ireland) before being presented on a concrete feedpad. In
contrast to the cows fed Control diet, cows fed PMR1 were supplemented once a day,
after the morning milking.
PMR2: Cows were offered a PMR comprising barley grain (25% of total supplement
DM), maize grain (30% of DM), maize silage (20% of DM) and lucerne hay (25% of
DM) as shown in Table 2-9. Similar to the cows fed PMR1, cows fed PMR2 were
supplemented once a day on a feedpad. The PMR2 diet had the same ratio of
grain:forage (including the grain component of the maize silage) as the Control and
PMR1 diets, but was formulated to ferment more slowly in the rumen.
Table 2-8: Ration offered to the cows fed Control and PMR1 diets at 4 amounts of
supplement
Supplement Supplement amount (kg DM/cow per day)
6 8 10 12
Milled barley grain 4.5 6 7.5 9
Pasture silage 1.5 2 2.5 3
Estimated pasture intake 14 14 14 14
Total intake 20 22 24 26
Table 2-9: Ration offered to the cows fed PMR2 diet at 4 amounts of supplement
Supplement Supplement amount (kg DM/cow per day)
6 8 10 12
Milled barley grain 1.5 2 2.5 3
Maize grain 1.8 2.4 3 3.6
Lucerne hay 1.5 2 2.5 3
Maize silage 1.2 1.6 2 2.4
Estimated pasture intake 14 14 14 14
Total intake 20 22 24 26
The short-term feeding rate experiment displaced the usual 10 kg supplementary
ration of the main feeding systems experiment for a period of 25 days. For all
treatments, a pasture allowance of approximately 14 kg DM/cow per day (to ground
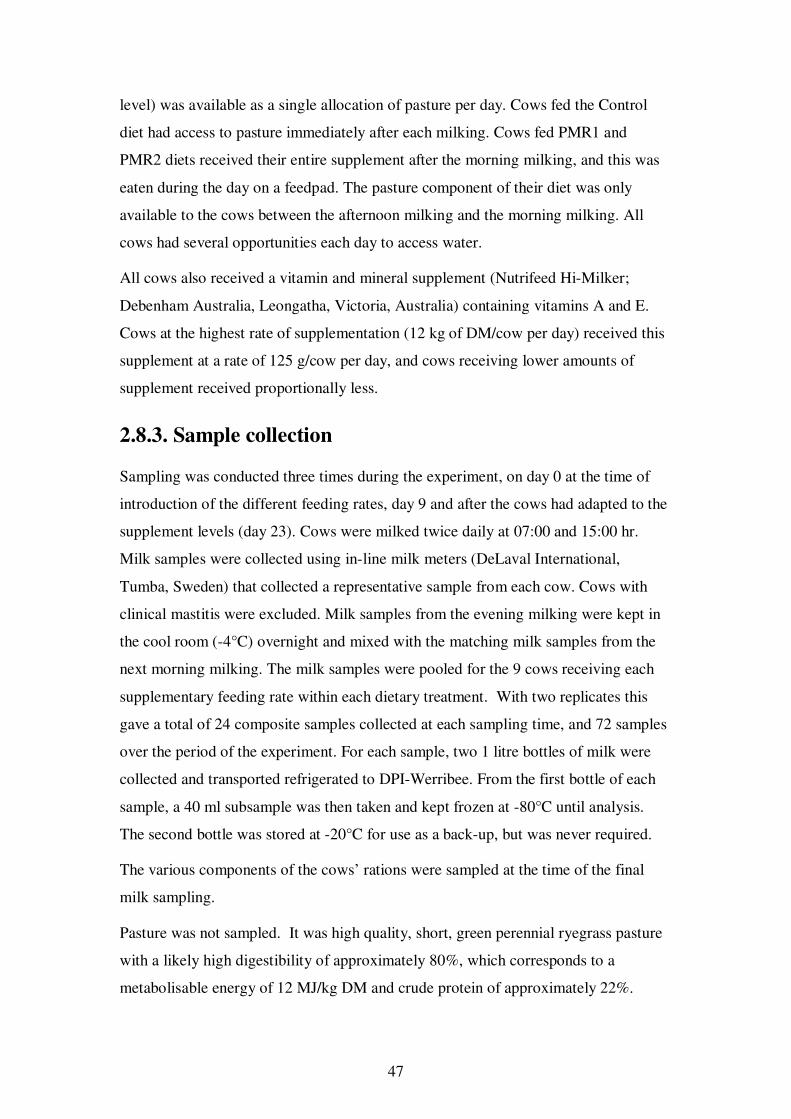
47
level) was available as a single allocation of pasture per day. Cows fed the Control
diet had access to pasture immediately after each milking. Cows fed PMR1 and
PMR2 diets received their entire supplement after the morning milking, and this was
eaten during the day on a feedpad. The pasture component of their diet was only
available to the cows between the afternoon milking and the morning milking. All
cows had several opportunities each day to access water.
All cows also received a vitamin and mineral supplement (Nutrifeed Hi-Milker;
Debenham Australia, Leongatha, Victoria, Australia) containing vitamins A and E.
Cows at the highest rate of supplementation (12 kg of DM/cow per day) received this
supplement at a rate of 125 g/cow per day, and cows receiving lower amounts of
supplement received proportionally less.
2.8.3. Sample collection
Sampling was conducted three times during the experiment, on day 0 at the time of
introduction of the different feeding rates, day 9 and after the cows had adapted to the
supplement levels (day 23). Cows were milked twice daily at 07:00 and 15:00 hr.
Milk samples were collected using in-line milk meters (DeLaval International,
Tumba, Sweden) that collected a representative sample from each cow. Cows with
clinical mastitis were excluded. Milk samples from the evening milking were kept in
the cool room (-4°C) overnight and mixed with the matching milk samples from the
next morning milking. The milk samples were pooled for the 9 cows receiving each
supplementary feeding rate within each dietary treatment. With two replicates this
gave a total of 24 composite samples collected at each sampling time, and 72 samples
over the period of the experiment. For each sample, two 1 litre bottles of milk were
collected and transported refrigerated to DPI-Werribee. From the first bottle of each
sample, a 40 ml subsample was then taken and kept frozen at -80°C until analysis.
The second bottle was stored at -20°C for use as a back-up, but was never required.
The various components of the cows’ rations were sampled at the time of the final
milk sampling.
Pasture was not sampled. It was high quality, short, green perennial ryegrass pasture
with a likely high digestibility of approximately 80%, which corresponds to a
metabolisable energy of 12 MJ/kg DM and crude protein of approximately 22%.
48
Fibre content could be quite high given the time of year and the perennial ryegrass
content of the pasture.
2.8.4. Sample analysis
Milk samples were analysed for all trans-retinol, α-tocopherol and β-carotene
according to the method described in Chapter 4 of this thesis.
Milk fat was determined by Hico Australia (Herd Improvement Co-Operative
Australia Ltd, Korumburra, Australia) using an infra-red milk analyser (Model 2000,
Bentley Instruments, Chaska, MN) (Auldist, et al. 2013).
The various components of the cow’s rations were analysed for vitamins A, E and β-
carotene concentrations using the Werribee Analytical Laboratory ‘in-house’ HPLC
method with UV/Vis and Fl detection.
These concentrations were then used to calculate the daily intake of vitamins in the
feed ration of the cows, taking into account the moisture content of the feeds, which
was measured by staff at DPI Ellinbank.
2.8.5. Statistical analysis
Milk sample data was subjected to analysis of variance (ANOVA) using Genstat 14th
edition.
49
Chapter 3: Vitamin D analytical method
3.1. Introduction
As detailed in the Materials and Methods chapter, two HPLC-MS methods were
developed for the analysis of vitamin D3. Vitamin D3 has similar chemical
characteristics to the other fat-soluble vitamins (vitamins A and E), therefore the
extraction protocol and choice of HPLC conditions were based on a NATA certified
DPI ‘in-house’ HPLC-UV/Vis method for the determination of vitamins A, E and β-
carotene in food (Department of Primary Industries 2007). Published HPLC-UV/Vis
methods for the analysis of vitamin D3 incorporate extra clean-up steps, either SPE,
preparative HPLC or a combination of both (Ball 1998). HPLC-MS offers at least
one order of magnitude sensitivity increase over HPLC-UV/Vis, however, it was
anticipated that at least one extra clean-up procedure would be required to provide a
cleaner and more concentrated extract for analysis, as instrument sensitivity may not
be adequate and matrix interferences may be more of an issue due to the very low
levels of vitamin D3 in milk. For this reason, the determination of vitamin D3 in milk
was developed as a separate method to that used for the other fat-soluble vitamins.
However, both methods use the same saponification and extraction protocols, and
therefore there is scope for partial integration of the two methods.
Milk sample extracts were assayed on both HPLC-MSn and HPLC-MS/MS to enable
an assessment of the suitability of the linear ion trap mass spectrometer for this work.
Vitamin D3-[2H3] and 25-hydroxyvitamin D3-[2H3] were used as internal standards for
the quantification of vitamin D3 and 25-hydroxyvitamin D3 respectively.
The development of these methods is described below and has been published as ‘The
determination of vitamin D3 in bovine milk by Liquid Chromatography-Mass
Spectrometry’ in Food Chemistry (Trenerry, Plozza, Caridi and Murphy 2011).
3.2. Method development
The HPLC-MSn and the HPLC-MS/MS methods were developed simultaneously in
the following order:
1. The mass spectrometer conditions, API interface and fragmentation patterns, were
optimised to give the maximum ion abundance for the ions of interest.
50
2. The chromatography conditions (choice of HPLC column and mobile phase
components) were optimised using the conditions identified in the API optimisation.
3. The sample extraction protocols were developed. The initial work focussed on
fortified milk samples, in which the levels of vitamin D3 were expected to be at least
one order of magnitude greater than in fresh milk (fortified milk 0.5-2 µg/100 ml,
fresh milk 0.05 µg/100 ml). These conditions were further modified for the analysis
of fresh milk.
4. The following method characteristics were evaluated for method validation:
• Linearity
• Precision
• Trueness/bias
• Sensitivity
• Reproducibility
• Limit of Quantification
3.2.1. Mass spectrometer
3.2.1.1. Atmospheric pressure ionisation interface
The same approach was used to optimise the API interfaces for the HPLC-MSn and
HPLC-MS/MS instruments.
Optimisation of the mass spectrometer conditions to give the best peak signal to noise
(S/N) ratio was performed whilst infusing a 10 µg/ml solution of each standard (25-
hydroxyvitamin D3, vitamin D3 and vitamin D3-[2H3]) at 10 µl/min into the API
interface via a T-piece where it was mixed with HPLC mobile phase (for example,
methanol:water 92:8 v/v) at a flow rate of 0.2 ml/min. This allowed optimisation at
the flow rate used for the analysis, and also facilitated easy modification of mobile
phase components when assessing different solvents or mobile phase modifiers.
The ion trap maximum fill time was set at 200 milli sec for all experiments.
The voltages of the various components of the ion trap mass spectrometer ion optics,
which are located after the API interface (ie. inside the mass spectrometer) were
optimised using the instrument’s auto-tune function.
51
Two ionisation sources were considered: ESI and APCI.
3.2.1.1.1. Electrospray ionisation
All user-adjustable parameters (positive/negative ionisation mode, spray voltage,
sheath, auxiliary and sweep gas flow rates, capillary temperature and probe fore/aft
position and insertion depth), were optimised independently, generally starting from
the lower end of the available range of adjustment and working incrementally
upwards until the value corresponding to maximum sensitivity had been reached.
Various mobile phase solvents (methanol, acetonitrile and water) and mobile phase
modifiers (ammonium acetate, ammonium formate, formic acid) were also trialled to
assess which mobile phase composition gave the best ionisation performance. Only
volatile mobile phase modifiers were used for this work as non-volatile compounds
deposit in the API causing blockages and loss of signal.
3.2.1.1.2. Atmospheric pressure chemical ionisation
All user-adjustable parameters (positive/negative ionisation mode, discharge current,
vaporizer temperature, sheath, auxiliary and sweep gas flow rates, capillary
temperature and probe fore/aft position and insertion depth), were optimised
independently, as were the choice of mobile phase solvents (methanol, acetonitrile
and water) and mobile phase modifiers (ammonium acetate, ammonium formate,
formic acid), as described above for ESI.
3.2.1.2. Mass spectrometer fragmentations
The fragmentation conditions for each analyte were optimised while infusing a
solution of each standard into the ion source as detailed above. The precursor ion was
selected, then a collision energy was applied to cause fragmentation. The collision
energy was adjusted to maximise the abundance of the fragment ions, of which the
two most abundant ions were chosen for ion trap MS2 experiments. For the triple
quadrupole mass spectrometer, the three or four most abundant fragment ions were
selected for MRM experiments.
For the ion trap MS, the isolation width was set at the instrument default value of 1.0
for initial work with fortified milk samples, but for later work with fresh milk
samples, the isolation width was optimised for sensitivity according to the instrument
manufacturer’s instructions.
52
3.2.2. High performance liquid chromatography column and
mobile phase
Three different reversed-phase HPLC columns with differing bonded phase polarities
(Phenomenex Luna C18(2) 5 µm, 150 × 2 mm and Varian Polaris C18-A 5 µm, 150 ×
2.1 mm) and structure (Varian Pursuit diphenyl 3 µm, 150 × 2 mm) were trialled with
a combination of different mobile phases to achieve a suitable separation of the
analytes from each other as well as from other compounds present in the sample
extract. The smaller particle size of the diphenyl column may have afforded some
improvement in peak resolution compared to the two C18 columns, however this was
not expected to be significant compared to the selectivity differences between the
different phases.
Samples of commercial milk and a fortified milk powder were saponified using hot
ethanolic potassium hydroxide and extracted with hexane according to the HPLC-
UV/Vis method for the determination of vitamin A, vitamin E and β-carotene
(Department of Primary Industries 2007). These extracts, as well as extracts spiked
with vitamin D3, were injected onto each column using isocratic elution with a variety
of methanol: water mixtures (75-100% methanol) to determine the ideal column and
mobile phase combination. Separation of vitamin D3 from endogenous interferences
proved to be the key criteria, but peak shape, sensitivity and run time were also
considered. Once a suitable column was identified, a gradient elution was assessed to
see if this gave sharper, taller peaks (and hence better sensitivity), and also to see if
vitamin D3 could be better separated from other endogenous peaks in the extract.
A mobile phase flow rate of 0.2 ml/min was used for all chromatographic work,
except where stated otherwise. 0.2 ml/min is commonly used for HPLC-MS as it
affords optimum performance of the ion interface. The column dimensions used for
this work are the optimum size for this flow rate, as recommended by the column
manufacturer.
Column temperature is a parameter which can be manipulated to alter a
chromatographic separation, however elevated column temperatures accelerate
degradation of the column bonded phase and in this case an adequate separation was
achieved at 30ºC. This was high enough above the room temperature for the column
53
heater to be able to maintain good temperature stability without being affected by
fluctuations in the room temperature.
3.2.3. Sample extraction
3.2.3.1. Fortified milk samples
The samples were extracted using the conditions described for the HPLC-UV/Vis
analysis of vitamins A, E and β-carotene (Department of Primary Industries 2007).
Two modifications were made:
1. The antioxidant BHT was added to the hexane extractant, as preliminary
extractions of spiked samples showed unacceptable variation in recoveries, which was
found to be alleviated by the addition of BHT at a rate of 15mg/l, as per the method of
Dimartino (2007).
2. The complete hexane extract was dried and reconstituted with methanol prior to
analysis to maximise the concentration of vitamin D3 in the final extract.
3.2.3.2. Non-fortified milk samples
A silica solid phase extraction (SPE) method based on the work of Kurmann and
Indyk (1994) was developed to provide a cleaner and more concentrated solution for
analysis.
All solvents used for silica SPE were dried over sodium sulphate. Water is a very
strong solvent for this normal phase system, and even small amounts of water in the
solvents could cause inconsistent results.
Aliquots of 25-hydroxyvitamin D3 and vitamin D3 standard solutions in methanol
were dried and redissolved in 1 ml hexane. The solutions were applied to separate
silica SPE cartridges pre-wet with 6 ml of hexane. The vials were washed twice with
hexane (1 ml) to quantitatively transfer the analytes to the cartridge. Each cartridge
was then eluted with 2 x 1.5 ml aliquots of 90:10 (v/v) hexane:ethyl acetate followed
by 4 x 1.5 ml aliquots of 80:20 (v/v) hexane:ethyl acetate for vitamin D3 elution and 3
x 3 ml aliquots of 60:40 (v/v) hexane:ethyl acetate for 25-hydroxyvitamin D3 elution.
As each solution was applied to the cartridge, the solvent eluting from each cartridge
was isolated as a separate fraction, dried under a flow of nitrogen gas, reconstituted
54
with 1 ml of methanol containing vitamin D3-[2H3] and analysed by HPLC-MS,
monitoring the most abundant MS2 fragment for each compound.
The effect of an alternative polar solvent (diethyl ether) and various eluent additives
(ammonia, acetic acid, triethylamine and ammonium acetate) on the recovery of the
vitamins from the cartridges was also trialled.
3.2.4. Analytical method
The various aspects of the method development were combined to produce a
straightforward analytical method suitable for the analysis of fortified commercial
milk samples containing greater than 0.1 µg/100 ml of vitamin D3, and a more
complex method for analysis of 25-hydroxyvitamin D3 and vitamin D3 in fresh and
commercial non-fortified milk samples. The complete method is detailed in section
2.6.
3.2.4.1. Validation
The method was validated according to NATA Technical Note 17 (2013) by
simultaneously analysing fortified and non-fortified milk sample extracts, fortified
infant formula extracts and spiked extracts by HPLC-MSn and HPLC-MS/MS. The
HPLC-MS/MS was operated in the positive ion ESI mode, and the levels of vitamin
D3 were determined by summing the areas from the MRM transitions (m/z 385.2
→107, 159.2, 259.4). For HPLC-MSn, the levels of vitamin D3 were calculated from
individual MS1 or MS2 ions.
The method was further validated through participation in a Proficiency Testing
Australia study for the determination of vitamin D3 in fortified infant formula, in
which two identical samples (S1 and S2) were assayed in duplicate (Bunt 2010).
55
3.3. Results
3.3.1. Mass spectrometer
3.3.1.1. Ion trap mass spectrometer
3.3.1.1.1. Atmospheric pressure ionisation interface
Electrospray ionisation
The optimal ionisation efficiency (signal intensity 1.03 × 10⁵) was achieved in the
positive ionisation mode, as shown in Figure 3-1, with a mobile phase composed of
methanol containing 0.1 M ammonium acetate. Ammonium acetate was used as the
mobile phase modifier as the use of plain methanol or methanol containing other
common HPLC additives, such as sodium acetate, resulted in the formation of
sodiated adducts, for example [vitamin D3 +Na]+ (m/z 407), which complicated the
mass spectra and made it difficult to identify the molecular ion and associated
fragment ions.
The addition of acetonitrile and acidic mobile phase modifiers to the mobile phase
had a severe detrimental effect on the ionisation efficiency.
The optimal ionisation efficiency was achieved with the following ESI settings:
Spray voltage 2.8 kV
Sheath gas flow rate 26 arbitrary units
Auxiliary gas flow rate 0 arbitrary units
Sweep gas flow rate 18 arbitrary units
Capillary voltage 16 V
Capillary temperature 200°C
Atmospheric pressure chemical ionisation
The optimal ionisation efficiency (signal intensity 2.57 × 10⁶) was achieved in the
positive ionisation mode, as shown in Figure 3-1, with a methanol:water mobile phase
containing 0-10% water. The addition of ammonium acetate to the mobile phase had
little effect on the ionisation efficiency but produced more chemical noise for
m/z<300, and was therefore not added.
56
The addition of acetonitrile and acidic mobile phase modifiers to the mobile phase
had a detrimental effect on the ionisation efficiency.
The optimal ionisation efficiency was achieved with the following APCI settings:
Capillary temperature 200°C
Vaporizer temperature 200°C
Sheath gas flow rate 20 arbitrary units
Auxiliary gas flow rate 5 arbitrary units
Sweep gas flow rate 0 arbitrary units
Source current 4.5 µA
Capillary voltage 16 V
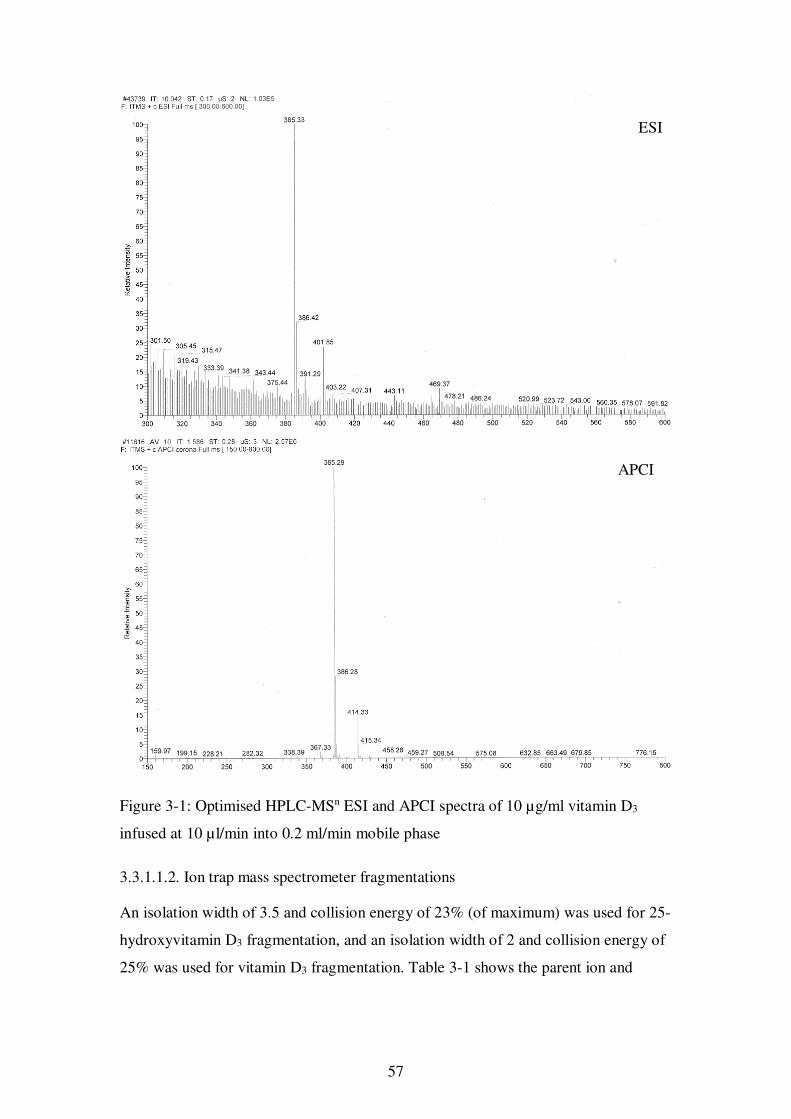
57
Figure 3-1: Optimised HPLC-MSn ESI and APCI spectra of 10 µg/ml vitamin D3
infused at 10 µl/min into 0.2 ml/min mobile phase
3.3.1.1.2. Ion trap mass spectrometer fragmentations
An isolation width of 3.5 and collision energy of 23% (of maximum) was used for 25-
hydroxyvitamin D3 fragmentation, and an isolation width of 2 and collision energy of
25% was used for vitamin D3 fragmentation. Table 3-1 shows the parent ion and
APCI
ESI
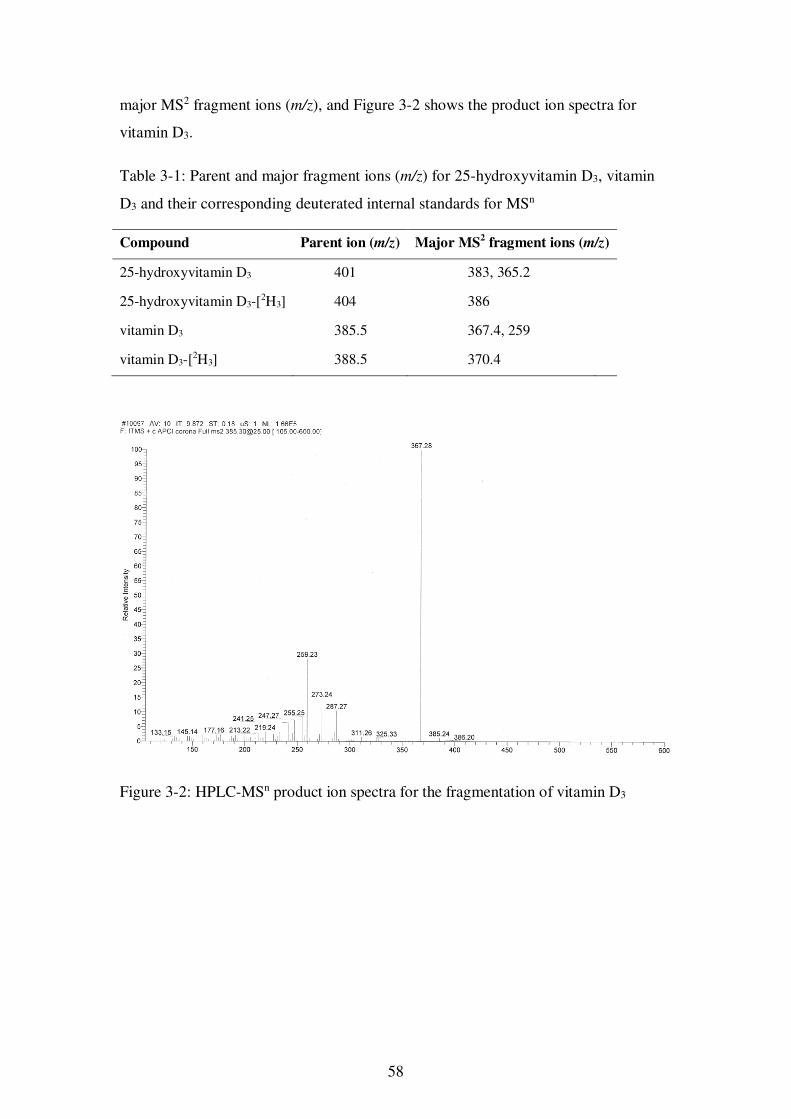
58
major MS2 fragment ions (m/z), and Figure 3-2 shows the product ion spectra for
vitamin D3.
Table 3-1: Parent and major fragment ions (m/z) for 25-hydroxyvitamin D3, vitamin
D3 and their corresponding deuterated internal standards for MSn
Compound Parent ion (m/z) Major MS2 fragment ions (m/z)
25-hydroxyvitamin D3 401 383, 365.2
25-hydroxyvitamin D3-[2H3] 404 386
vitamin D3 385.5 367.4, 259
vitamin D3-[2H3] 388.5 370.4
Figure 3-2: HPLC-MSn product ion spectra for the fragmentation of vitamin D3
59
3.3.1.2. Triple quadrupole mass spectrometer
3.3.1.2.1. Atmospheric pressure ionisation interface
Electrospray ionisation
The optimal ionisation efficiency (× 15 gain at full scale whilst infusing 5 µg/ml
vitamin D3 standard solution at 10 µl/min) was achieved with a mobile phase
composed of methanol and up to 20% water, with the addition of the most effective
mobile phase modifier, 5 mM ammonium formate, increasing ionisation efficiency by
a factor of 20.
The use of acetonitrile instead of methanol decreased sensitivity by approximately a
factor of two.
The optimal ionisation efficiency was achieved with the following ESI settings:
Capillary voltage 2.6 kV
Cone voltage 23 V
Source temperature 100°C
Desolvation temperature 400°C
Cone gas flow 60 l/h
Desolvation gas flow 500 l/h
Atmospheric pressure chemical ionisation
The optimal ionisation efficiency (× 180 gain at full scale whilst infusing 1 ug/ml
vitamin D3 standard solution at 20 µl/min) was achieved with a mobile phase
consisting of 95% methanol, 5% water and 5 mM ammonium formate.
The optimal ionisation efficiency was achieved with the following APCI settings:
Corona current 0.3 µA
Cone voltage 22 V
Source temperature 130°C
Desolvation temperature 550°C
Cone gas flow 50 l/h
Desolvation gas flow 250 l/h
60
3.3.1.2.2. Tandem mass spectrometry fragmentations
The collision energy was adjusted to maximise the intensity of each fragment, and a
dwell time of 0.1 sec was used. The argon collision gas was set at 3 × 10⁻³ mbar.
Table 3-2 shows the parent ion and major MS/MS fragment ions (m/z).
Table 3-2: Parent and major fragment ion m/z ratios for 25-hydroxyvitamin D3,
vitamin D3 and their corresponding deuterated internal standards for MS/MS
Compound Parent ion (m/z) Major MS/MS fragment ions (m/z)
25-hydroxyvitamin D3 401.2 383, 159, 105
vitamin D3 385.2 259.4, 159.2, 107
vitamin D3-[2H3] 388.3 370.4, 259.4, 162.2, 110
3.3.2. High performance liquid chromatography
3.3.2.1. Phenomenex Luna C18(2)
The best chromatographic performance was achieved using an isocratic mobile phase
containing methanol:water (90:10). This enabled separation of 25-hydroxyvitamin D3
from endogenous interferences, however it was not possible to obtain an interference-
free chromatogram for vitamin D3.
3.3.2.2. Varian Pursuit diphenyl
The best chromatographic performance was achieved using an isocratic mobile phase
containing methanol:water (80:20). This column also gave separation of 25-
hydroxyvitamin D3 from endogenous interferences. Vitamin D3 eluted in-between two
other peaks, which was sufficient to allow analysis to a lower limit of 0.05 µg/ml in
solution, which is equivalent to 0.5 µg/100 ml in the fortified milk sample.
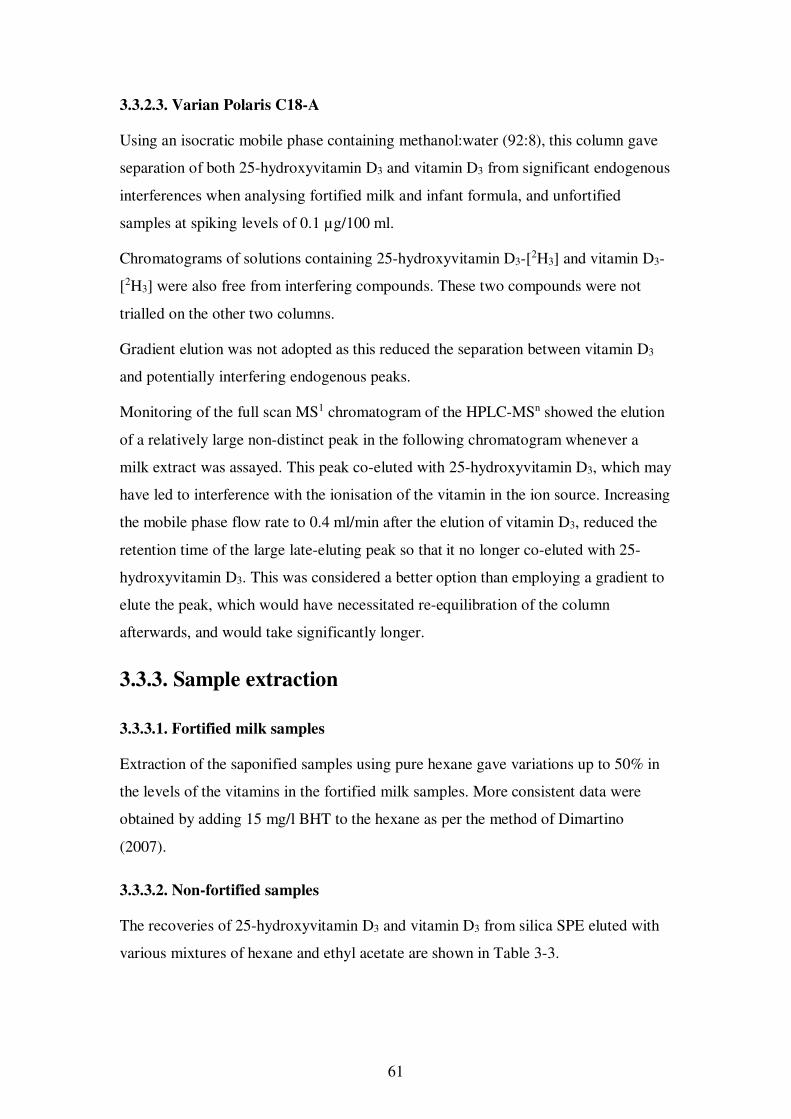
61
3.3.2.3. Varian Polaris C18-A
Using an isocratic mobile phase containing methanol:water (92:8), this column gave
separation of both 25-hydroxyvitamin D3 and vitamin D3 from significant endogenous
interferences when analysing fortified milk and infant formula, and unfortified
samples at spiking levels of 0.1 µg/100 ml.
Chromatograms of solutions containing 25-hydroxyvitamin D3-[2H3] and vitamin D3-
[2H3] were also free from interfering compounds. These two compounds were not
trialled on the other two columns.
Gradient elution was not adopted as this reduced the separation between vitamin D3
and potentially interfering endogenous peaks.
Monitoring of the full scan MS1 chromatogram of the HPLC-MSn showed the elution
of a relatively large non-distinct peak in the following chromatogram whenever a
milk extract was assayed. This peak co-eluted with 25-hydroxyvitamin D3, which may
have led to interference with the ionisation of the vitamin in the ion source. Increasing
the mobile phase flow rate to 0.4 ml/min after the elution of vitamin D3, reduced the
retention time of the large late-eluting peak so that it no longer co-eluted with 25-
hydroxyvitamin D3. This was considered a better option than employing a gradient to
elute the peak, which would have necessitated re-equilibration of the column
afterwards, and would take significantly longer.
3.3.3. Sample extraction
3.3.3.1. Fortified milk samples
Extraction of the saponified samples using pure hexane gave variations up to 50% in
the levels of the vitamins in the fortified milk samples. More consistent data were
obtained by adding 15 mg/l BHT to the hexane as per the method of Dimartino
(2007).
3.3.3.2. Non-fortified samples
The recoveries of 25-hydroxyvitamin D3 and vitamin D3 from silica SPE eluted with
various mixtures of hexane and ethyl acetate are shown in Table 3-3.
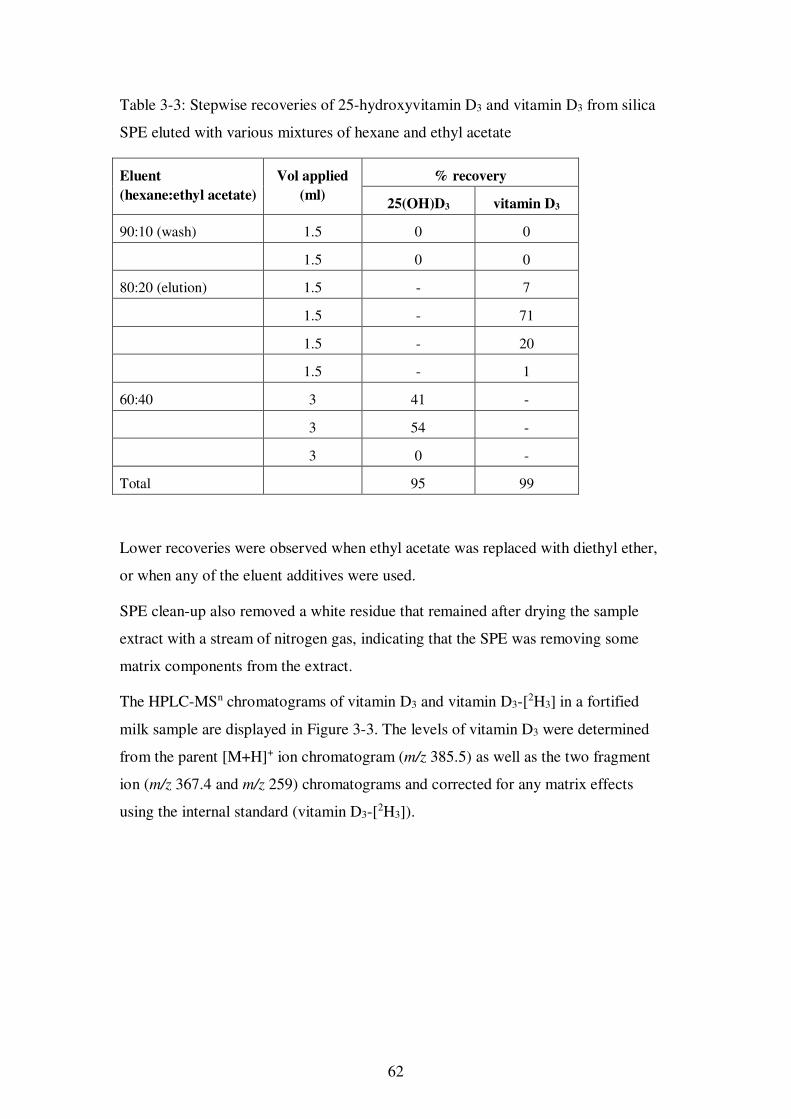
62
Table 3-3: Stepwise recoveries of 25-hydroxyvitamin D3 and vitamin D3 from silica
SPE eluted with various mixtures of hexane and ethyl acetate
Eluent
(hexane:ethyl acetate)
Vol applied
(ml)
% recovery
25(OH)D3 vitamin D3
90:10 (wash) 1.5 0 0
1.5 0 0
80:20 (elution) 1.5 - 7
1.5 - 71
1.5 - 20
1.5 - 1
60:40 3 41 -
3 54 -
3 0 -
Total 95 99
Lower recoveries were observed when ethyl acetate was replaced with diethyl ether,
or when any of the eluent additives were used.
SPE clean-up also removed a white residue that remained after drying the sample
extract with a stream of nitrogen gas, indicating that the SPE was removing some
matrix components from the extract.
The HPLC-MSn chromatograms of vitamin D3 and vitamin D3-[2H3] in a fortified
milk sample are displayed in Figure 3-3. The levels of vitamin D3 were determined
from the parent [M+H]+ ion chromatogram (m/z 385.5) as well as the two fragment
ion (m/z 367.4 and m/z 259) chromatograms and corrected for any matrix effects
using the internal standard (vitamin D3-[2H3]).
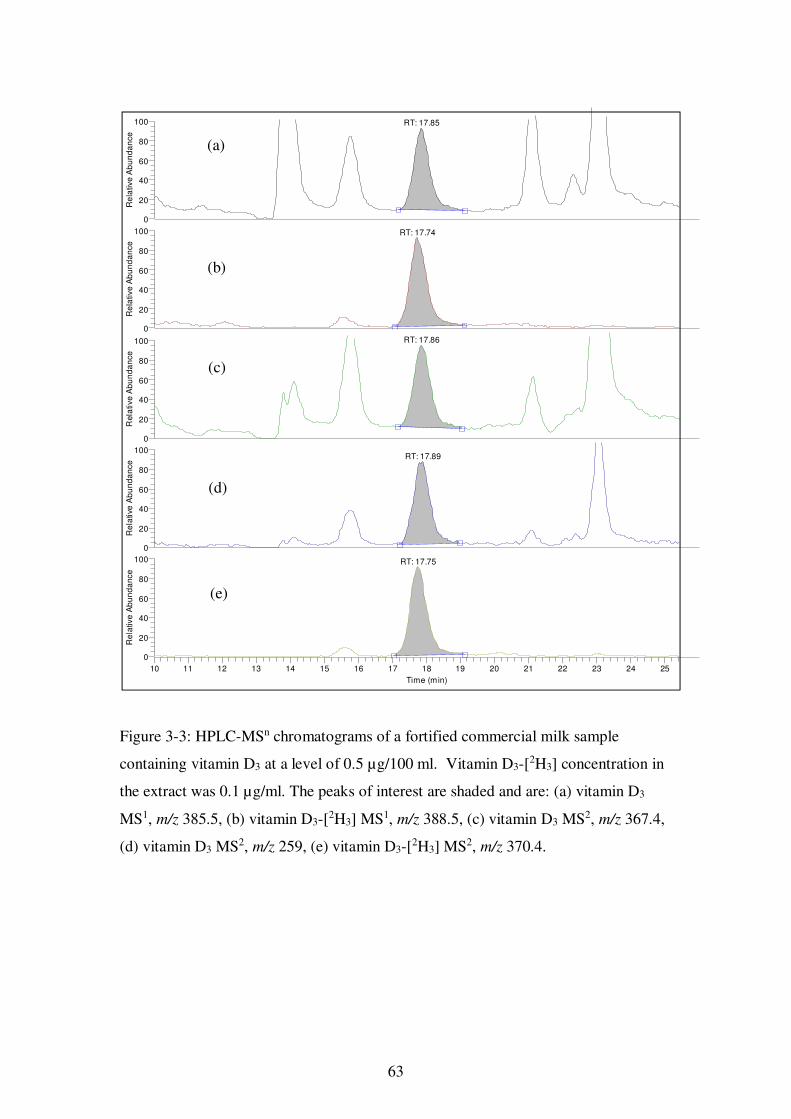
63
Figure 3-3: HPLC-MSn chromatograms of a fortified commercial milk sample
containing vitamin D3 at a level of 0.5 µg/100 ml. Vitamin D3-[2H3] concentration in
the extract was 0.1 µg/ml. The peaks of interest are shaded and are: (a) vitamin D3
MS1, m/z 385.5, (b) vitamin D3-[2H3] MS1, m/z 388.5, (c) vitamin D3 MS2, m/z 367.4,
(d) vitamin D3 MS2, m/z 259, (e) vitamin D3-[2H3] MS2, m/z 370.4.
10 11 12 13 14 15 16 17 18 19 20 21 22 23 24 25
Time (min)
0
20
40
60
80
100
Re
lativ
e A
bu
nd
ance
0
20
40
60
80
100
Re
lative
Ab
un
da
nce
0
20
40
60
80
100
Rela
tive
Ab
un
da
nce
0
20
40
60
80
100
Re
lative
Ab
un
da
nce
0
20
40
60
80
100R
ela
tive
Ab
un
da
nce
RT: 17.85
RT: 17.74
RT: 17.86
RT: 17.89
RT: 17.75
(a)
(b)
(c)
(d)
(e)
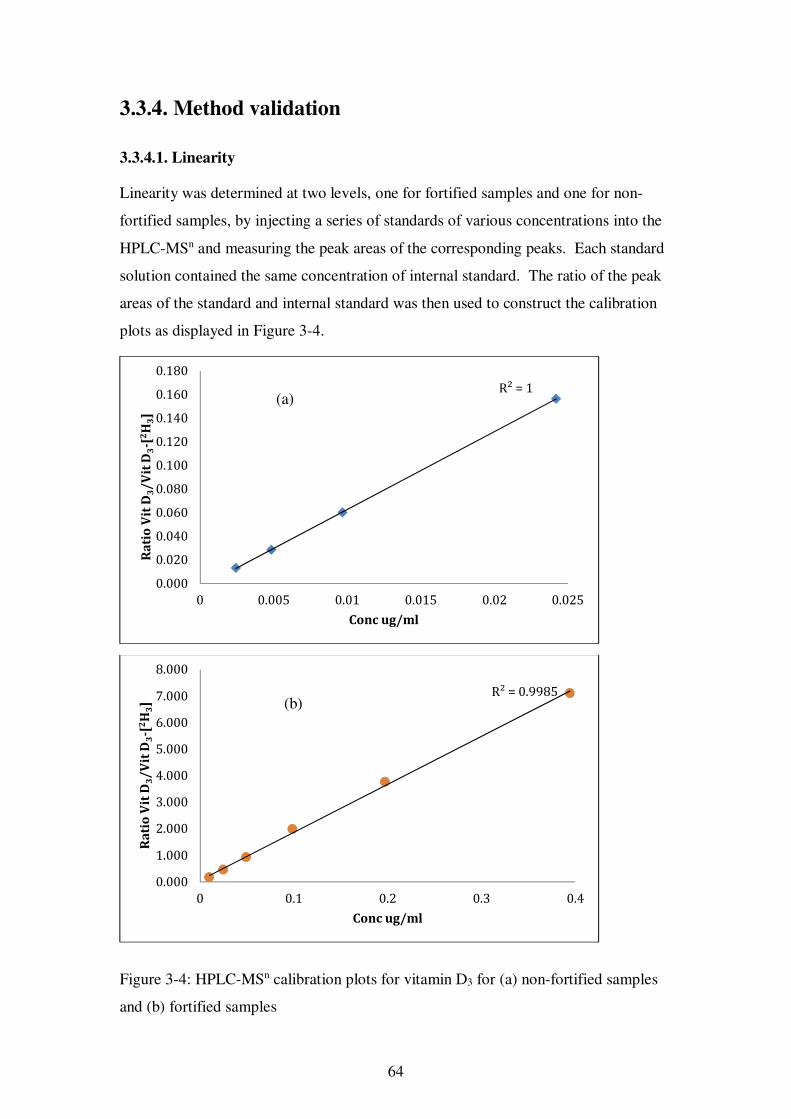
64
3.3.4. Method validation
3.3.4.1. Linearity
Linearity was determined at two levels, one for fortified samples and one for non-
fortified samples, by injecting a series of standards of various concentrations into the
HPLC-MSn and measuring the peak areas of the corresponding peaks. Each standard
solution contained the same concentration of internal standard. The ratio of the peak
areas of the standard and internal standard was then used to construct the calibration
plots as displayed in Figure 3-4.
Figure 3-4: HPLC-MSn calibration plots for vitamin D3 for (a) non-fortified samples
and (b) fortified samples
R² = 1
0.000
0.020
0.040
0.060
0.080
0.100
0.120
0.140
0.160
0.180
0 0.005 0.01 0.015 0.02 0.025
Ra
tio
Vit
D3/
Vit
D3-[
2H
3]
Conc ug/ml
R² = 0.9985
0.000
1.000
2.000
3.000
4.000
5.000
6.000
7.000
8.000
0 0.1 0.2 0.3 0.4
Ra
tio
Vit
D3/
Vit
D3-[
2H
3]
Conc ug/ml
(a)
(b)
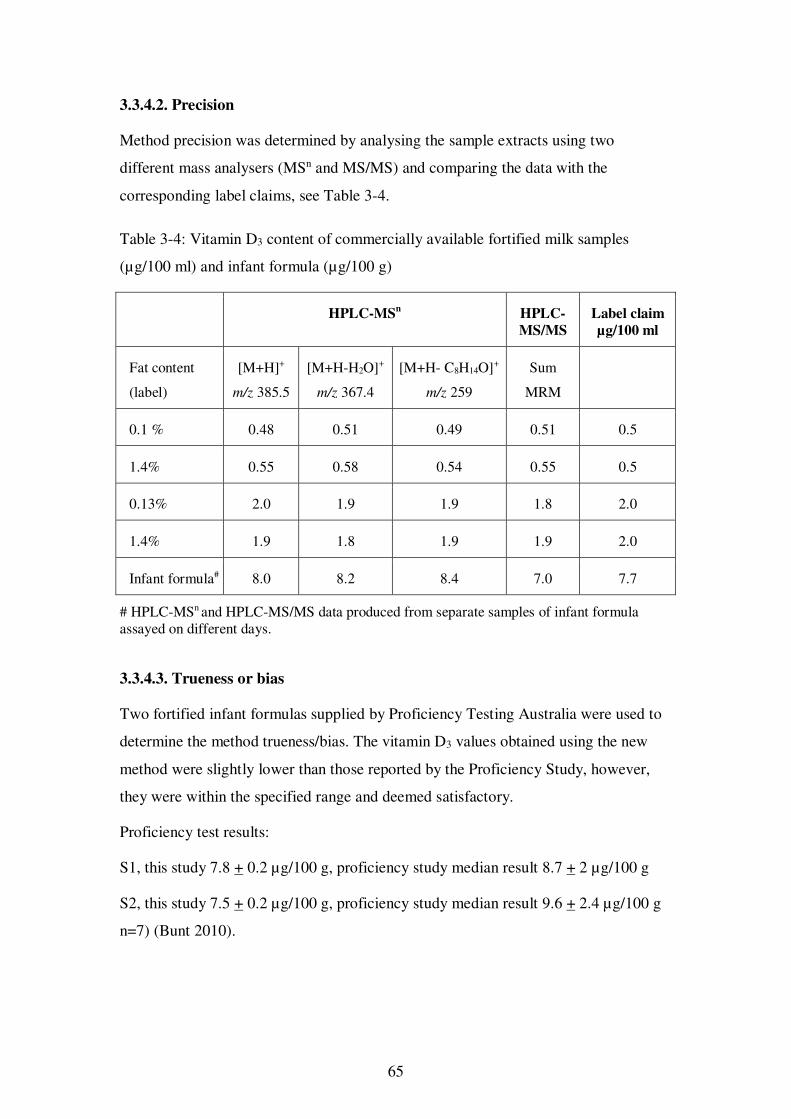
65
3.3.4.2. Precision
Method precision was determined by analysing the sample extracts using two
different mass analysers (MSn and MS/MS) and comparing the data with the
corresponding label claims, see Table 3-4.
Table 3-4: Vitamin D3 content of commercially available fortified milk samples
(µg/100 ml) and infant formula (µg/100 g)
HPLC-MSn HPLC-
MS/MS
Label claim
µg/100 ml
Fat content
(label)
[M+H]+
m/z 385.5
[M+H-H2O]+
m/z 367.4
[M+H- C8H14O]+
m/z 259
Sum
MRM
0.1 % 0.48 0.51 0.49 0.51 0.5
1.4% 0.55 0.58 0.54 0.55 0.5
0.13% 2.0 1.9 1.9 1.8 2.0
1.4% 1.9 1.8 1.9 1.9 2.0
Infant formula# 8.0 8.2 8.4 7.0 7.7
# HPLC-MSn and HPLC-MS/MS data produced from separate samples of infant formula assayed on different days.
3.3.4.3. Trueness or bias
Two fortified infant formulas supplied by Proficiency Testing Australia were used to
determine the method trueness/bias. The vitamin D3 values obtained using the new
method were slightly lower than those reported by the Proficiency Study, however,
they were within the specified range and deemed satisfactory.
Proficiency test results:
S1, this study 7.8 + 0.2 µg/100 g, proficiency study median result 8.7 + 2 µg/100 g
S2, this study 7.5 + 0.2 µg/100 g, proficiency study median result 9.6 + 2.4 µg/100 g
n=7) (Bunt 2010).
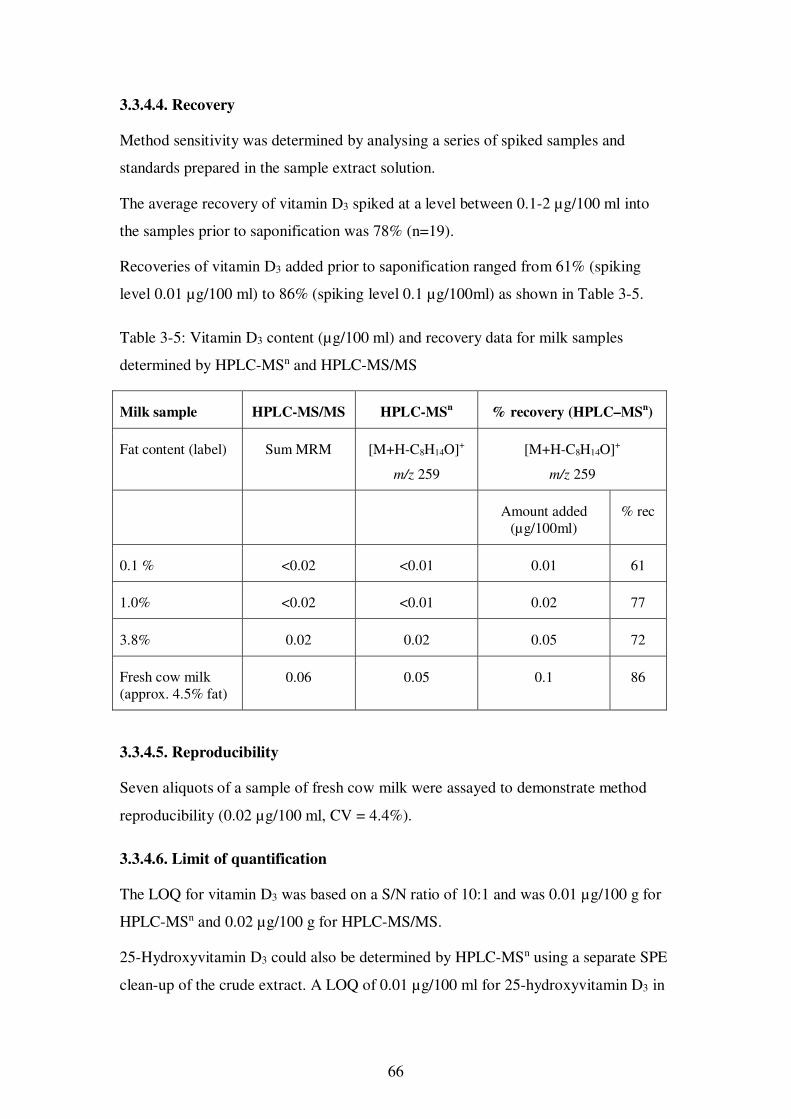
66
3.3.4.4. Recovery
Method sensitivity was determined by analysing a series of spiked samples and
standards prepared in the sample extract solution.
The average recovery of vitamin D3 spiked at a level between 0.1-2 µg/100 ml into
the samples prior to saponification was 78% (n=19).
Recoveries of vitamin D3 added prior to saponification ranged from 61% (spiking
level 0.01 µg/100 ml) to 86% (spiking level 0.1 µg/100ml) as shown in Table 3-5.
Table 3-5: Vitamin D3 content (µg/100 ml) and recovery data for milk samples
determined by HPLC-MSn and HPLC-MS/MS
Milk sample HPLC-MS/MS HPLC-MSn % recovery (HPLC–MS
n)
Fat content (label) Sum MRM [M+H-C8H14O]+
m/z 259
[M+H-C8H14O]+
m/z 259
Amount added (µg/100ml)
% rec
0.1 % <0.02 <0.01 0.01 61
1.0% <0.02 <0.01 0.02 77
3.8% 0.02 0.02 0.05 72
Fresh cow milk (approx. 4.5% fat)
0.06 0.05 0.1 86
3.3.4.5. Reproducibility
Seven aliquots of a sample of fresh cow milk were assayed to demonstrate method
reproducibility (0.02 µg/100 ml, CV = 4.4%).
3.3.4.6. Limit of quantification
The LOQ for vitamin D3 was based on a S/N ratio of 10:1 and was 0.01 µg/100 g for
HPLC-MSn and 0.02 µg/100 g for HPLC-MS/MS.
25-Hydroxyvitamin D3 could also be determined by HPLC-MSn using a separate SPE
clean-up of the crude extract. A LOQ of 0.01 µg/100 ml for 25-hydroxyvitamin D3 in
67
a sample of fresh cow milk was achieved despite an overall recovery of between 30
and 40%.
25-hydroxyvitamin D3 was not present at levels greater than LOQ in any of the
samples analysed.
3.4. Discussion
For HPLC-MSn, positive ion APCI was approximately 25 times more sensitive than
positive ion ESI, and so APCI was chosen for the ionisation source for the instrument.
In contrast, for the triple quadrupole mass spectrometer, ESI was approximately 5
times more sensitive than APCI. This was unexpected, and highlights the difference
in relative performance of API sources from different instrument manufacturers such
as Thermo Fisher Scientific and Waters.
Despite using compound-specific precursor and fragment ions, the analysis of milk
samples still produced numerous interfering endogenous peaks, thus the choice of
column and mobile phase was important to achieve chromatographic separation of the
analytes from any potential interferences. Of the three columns trialled for this work,
the Varian Polaris C18-A column gave the best separation of the analytes from major
endogenous interferences, with the optimum elution conditions being an isocratic
mobile phase consisting of 92% methanol and 8% water (and containing 5 mM
ammonium formate for HPLC-MS/MS).
Initial work using fortified and spiked unfortified milk samples showed that no
additional clean-up was required after the initial saponification and extraction when
the level of vitamin D3 in the milk was > 0.1 ug/100 ml. The data presented in Table
3-4 shows that the levels of vitamin D3 in fortified milks determined by HPLC-MSn
(m/z 385.5, 367.4 and 259) and HPLC-MS/MS were nearly identical, and comparable
with the levels stated on the label.
When the HPLC-MSn methodology was applied to a selection of non-fortified
commercial milk samples with differing fat contents as well as samples of fresh cow
milk, only the m/z 259 ion could be used for quantification, as co-eluting compounds
interfered with the m/z 385.5 and m/z 367.4 ions. The quantitative data from the
HPLC-MS/MS instrument were also inconsistent. However, silica SPE clean-up of
the extract produced a suitable extract for HPLC-MS/MS analysis. The HPLC-MSn
68
m/z 259 chromatogram was also cleaner after SPE treatment, however, SPE clean-up
failed to completely remove the interfering compounds in the HPLC-MSn
chromatograms for the m/z 385.5 and m/z 367.4 ions. The levels of vitamin D3 in the
samples determined by HPLC-MSn (m/z 259) and by HPLC-MS/MS after SPE were
similar and were also similar to the levels present in milk samples reported in the
literature (Jakobsen and Saxholt 2009; Kurmann and Indyk 1994).
After the completion of the experimental part of this project, Huang, et al. (2014)
reported a systematic error caused by the use of 6,19,19 2H3 labelled vitamin D3,
which is the same deuterated internal standard as was used for this project. The error
relates to the conversion of vitamin D3 to pre-vitamin D3, a process which occurs
more rapidly at the elevated temperatures used for hot saponification. The positioning
of the deuterium atoms in the molecule results in an increased rate of conversion of 2H3-vitamin D3 to 2H3-pre-vitamin D3, resulting in a decrease in the peak area of the
internal standard relative to the peak area of the analyte, causing a higher calculated
result. The work of Huang, et al. (2014) involved the addition of the internal standard
prior to saponification, whereas for this project, the internal standard was added
immediately before mass spectrometric analysis. For this reason, the internal standard
would not have converted to the pre-vitamin but the analyte would have, and this may
explain the slightly lower result obtained for the proficiency samples.
Silica SPE was chosen for sample clean-up since the retention mechanism was
orthogonal, that is, unrelated to the hydrophobic mechanism utilised in the reversed-
phase analytical chromatography (Pellett, Lukulay, Mao, Bowen, Reed, Ma, et al.
2006). Therefore, it was considered more likely to remove the interfering compounds
than a reversed-phase SPE cartridge. Further adjustment of the wash and elution
parameters or use of an alternative phase may have achieved a cleaner extract,
however time constraints prevented further exploration of the SPE clean-up
procedure.
Anecdotal evidence within our laboratory has shown that when analysing antioxidant
compounds such as vitamins by HPLC, problems can arise which affect the overall
quality of the analytical data, such as non-linear calibrations and unstable peak areas
throughout the batch of samples. It is thought that these problems are due to areas of
oxidation within the HPLC fluidics which oxidise the analytes, resulting in a loss of
analytical signal. To reduce, or ‘pacify’, these areas of oxidation and minimise their
69
potential effects on the analysis, six 100µl injections of the highest analytical standard
were made at the beginning of each analytical batch of samples run on each of the
HPLC systems used for this project. This was then followed by an injection of
methanol, prior to injecting the series of calibration standards and samples.
For both HPLC-MS instruments, a number of injections of sample extract were also
required to achieve a stable signal, particularly after cleaning the API interface. This
effect has been observed previously with nearly all HPLC-MS assays performed in
this laboratory, and it is assumed this phenomenon is due to an equilibration of the
API interface as it becomes coated in compounds from the sample matrix.
Accordingly, six injections of sample extract pacified the HPLC fluidics as well as
equilibrating the API interface, ensuring a stable and reproducible signal prior to
analysis of the analytical standards and test samples.
The lower recoveries of 25-hydroxyvitamin D3 in comparison to vitamin D3 were
largely due to the more polar nature of the metabolite. Improved recoveries of the
metabolite could have been achieved by extracting the samples with a more polar
solvent such as a hexane:ethyl acetate mixture, as detailed by Kamao, Tsugawa,
Suhara, Wada, et al. (2007), however this was not pursued as the main focus of this
work was vitamin D3.
Limitations of the method include the presence of isobaric interferences in
chromatograms, which at present limit the LOQ of the method for the analysis of
endogenous levels of vitamin D3 and 25-hydroxyvitamin D3 in milk samples. Sample
throughput is limited due to the use of liquid-liquid extraction in separating funnels
and rotary evaporation of samples. Quicker alternatives may be needed for usage of
the method by a commercial laboratory.
Measurement uncertainty would need to be calculated for full validation of the
method, however at present there is insufficient data to accurately characterise the
method. The time and expense of creating the validation data was not warranted since
the method was not used for analysing samples from the feeding study.
70
3.5. Conclusion
A straight forward, robust method for determining the levels of vitamin D3 in a range
of commercially available fortified and non-fortified cow milk, infant formula and
fresh cow milk using HPLC-MSn has been developed. The use of HPLC-MSn was
validated against an HPLC-MS/MS instrument and found to produce comparable
results. Recoveries of vitamin D3 added to the samples prior to saponification were
satisfactory (60-90%). The LOQ were 0.01 µg/100 g and 0.02 µg/100 g for HPLC-
MSn and HPLC-MS/MS respectively. 25-hydroxyvitamin D3 could also be
determined in fresh milk samples using this procedure, although the extraction
conditions were not fully optimized for this compound and it gave lower recoveries.
71
Chapter 4: Vitamins A, E and β-carotene analytical method
4.1. Introduction
Traditionally, fat-soluble vitamins are analysed separately by either HPLC-UV/Vis
(vitamin A and carotenes) or HPLC with Fl detection (vitamins A and E). HPLC-
MSn, due to the greater selectivity of the MS analyser, provides an opportunity to
assay these compounds in a single run, thus facilitating a faster sample turnaround for
large batches of samples that are often collected for research studies. HPLC-MSn also
has the potential to provide mass and structural data on other compounds present in
the extracts which can be useful for metabolomics studies.
All trans-retinol and α–tocopherol are the major A and E vitamers present in milk
(Lanina, et al. 2007), and so to reduce complexity, only the levels of these two
compounds were measured in this study. A number of positional isomers of retinol
and α-tocopherol do exist, however these compounds are not resolved by the
reversed-phase chromatographic systems used for this work. β-carotene, on the other
hand, exists as a number of isomers that can be separated to some extent by reversed-
phase chromatography. The levels of the major isomer, all trans-β-carotene, were
determined in this work as it is the most abundant carotenoid present in milk
(Havemose, et al. 2004; Hulshof, et al. 2006). The HPLC-MSn method was based on
a fully validated ‘in-house’ HPLC-UV/Vis and HPLC-Fl method for the analysis of
fat-soluble vitamins in foods (Department of Primary Industries 2007). This HPLC-
MSn method was used for the analysis of 72 milk samples collected from the feeding
experiment conducted at DPI Ellinbank, Victoria.
In contrast to vitamin D3, these compounds occur naturally at much higher levels in
milk, and therefore no additional clean-up of the sample was expected after the initial
saponification and extraction into hexane.
This work has been published as ‘The simultaneous determination of vitamins A, E
and β-carotene in bovine milk by high performance liquid chromatography-ion trap
mass spectrometry (HPLC-MSn)’ in Food Chemistry (Plozza, Trenerry and Caridi
2012). The development of the method is described below and used the same protocol
as for vitamin D3.
72
4.2. Method development
The HPLC-MSn method was developed in the following order:
1. The mass spectrometer conditions were optimised (API interface and fragmentation
patterns).
2. Suitable chromatography conditions were developed.
3. The sample extraction method was developed, taking into account the
concentrations of the analytes, the LOQ of the instruments, and the observation that
the addition of BHT to the extraction solvent improved the performance of the
method for the extraction of vitamin D3, see section 3.2.3.1.
4. Method validation.
4.2.1. Mass spectrometer
4.2.1.1. Atmospheric pressure ionisation interface
Optimisation was performed while infusing an approximately 10 µg/ml solution of
each standard (all trans-retinol, α-tocopherol and β-carotene) at 10 µl/min into the
API interface via a T-piece where it was mixed with HPLC mobile phase
(methanol:water 98:2) at a flow rate of 0.2 µl/min. This mixture was chosen as it gave
the best ionisation for vitamin D3 in the previous study, see section 3.3.1.1.1.
Infusing the standard solutions into the API interface via the T-piece enabled
optimisation at the flow rate to be used for the analysis, and also facilitated easy
modification of mobile phase components when assessing different solvents or mobile
phase modifiers.
4.2.1.1.1. Atmospheric pressure chemical ionisation
All user-adjustable parameters (positive/negative ionisation mode, discharge current,
vaporizer temperature, sheath, auxiliary and sweep gas flow rates, capillary
temperature and probe fore/aft position and insertion depth) were optimised
independently.
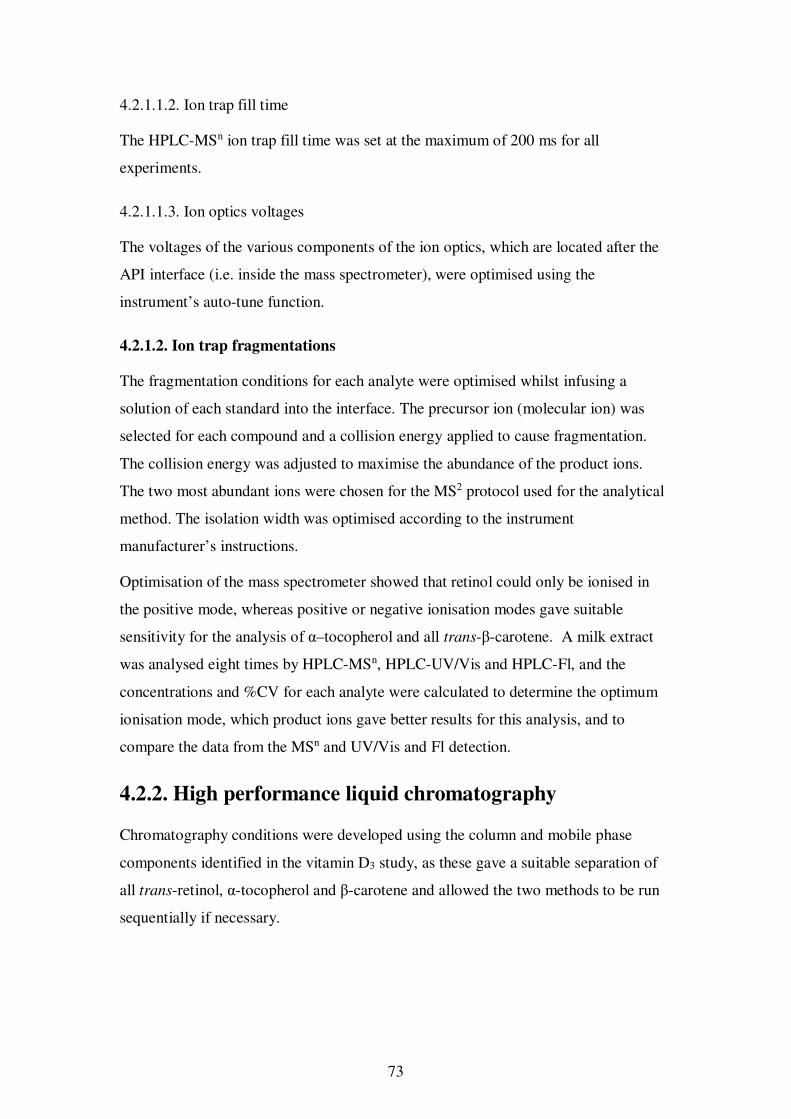
73
4.2.1.1.2. Ion trap fill time
The HPLC-MSn ion trap fill time was set at the maximum of 200 ms for all
experiments.
4.2.1.1.3. Ion optics voltages
The voltages of the various components of the ion optics, which are located after the
API interface (i.e. inside the mass spectrometer), were optimised using the
instrument’s auto-tune function.
4.2.1.2. Ion trap fragmentations
The fragmentation conditions for each analyte were optimised whilst infusing a
solution of each standard into the interface. The precursor ion (molecular ion) was
selected for each compound and a collision energy applied to cause fragmentation.
The collision energy was adjusted to maximise the abundance of the product ions.
The two most abundant ions were chosen for the MS2 protocol used for the analytical
method. The isolation width was optimised according to the instrument
manufacturer’s instructions.
Optimisation of the mass spectrometer showed that retinol could only be ionised in
the positive mode, whereas positive or negative ionisation modes gave suitable
sensitivity for the analysis of α–tocopherol and all trans-β-carotene. A milk extract
was analysed eight times by HPLC-MSn, HPLC-UV/Vis and HPLC-Fl, and the
concentrations and %CV for each analyte were calculated to determine the optimum
ionisation mode, which product ions gave better results for this analysis, and to
compare the data from the MSn and UV/Vis and Fl detection.
4.2.2. High performance liquid chromatography
Chromatography conditions were developed using the column and mobile phase
components identified in the vitamin D3 study, as these gave a suitable separation of
all trans-retinol, α-tocopherol and β-carotene and allowed the two methods to be run
sequentially if necessary.
74
4.2.2.1. Column
The Varian Polaris C18-A, 5µm, 150 × 2.1 mm HPLC column used in the vitamin D3
work was chosen for this analysis.
4.2.2.2. Mobile phase
Isocratic elution using methanol:water (98:2 v/v), and a gradient elution starting at
methanol:water (95:5 v/v) and increasing to methanol (100%) were trialled to
optimise the separation of the three analytes in standard solutions and a variety of
purchased milk sample extracts.
4.2.2.3. Flow rate and column temperature
A mobile phase flow rate of 0.2 ml/min and column temperature of 30 ºC were used
for the reasons outlined in 3.2.2.
4.2.3. Sample extraction
The extraction conditions were identical to the ‘in-house’ HPLC-UV/Vis and HPLC-
Fl method, except for the addition of 15 mg/l of the antioxidant BHT to the hexane
extractant as described for the extraction of vitamin D3 from milk. Briefly, 10 ml of
milk was mixed with 0.5 g of ascorbic acid, 40 ml of ethanol and 10 ml of 1:1
potassium hydroxide in water and heated at reflux with stirring for 30 minutes. The
mixture was cooled in an ice bath, mixed with 50 ml water, 10 ml ethanol and the
vitamins quantitatively extracted into hexane containing BHT. The hexane extracts
were washed with water and then made to volume (100 ml) with hexane containing
BHT. A 10 ml aliquot of the hexane solution was then transferred to a glass tube and
the solvent removed under a flow of nitrogen. The residue was reconstituted with 1 ml
methanol, sonicated and finally filtered through 0.45 µm PTFE filter disc prior to
analysis.
The HPLC–MS2 chromatogram of a cow milk sample containing all trans-retinol (50
μg/100 ml), α-tocopherol (200 μg/100 ml) and β-carotene (12 μg/100 ml) using the
gradient conditions described in section 4.3.2.2.1 is shown in Figure 4.1.
75
Figure 4-1: HPLC-MS2 chromatogram of a cow milk sample containing all trans-
retinol (50 μg/100 ml), α-tocopherol (200 μg/100 ml) and β-carotene (12 μg/100 ml)
76
4.2.4. Analytical method
4.2.4.1. Validation
The method was validated according to NATA Technical Note 17 (2013) by
analysing both unspiked and spiked samples.
Extracts were assayed concurrently on HPLC-MSn, HPLC-UV/Vis and HPLC-Fl (all
trans-retinol and α-tocopherol) and HPLC-UV/Vis (β-carotene) so that the
performance of the HPLC-MSn method could be compared with fully validated
methods commonly used for this analysis.
A fortified infant formula supplied by Proficiency Testing Australia as part of a
proficiency study (Bunt 2010) was used to further validate the method. For quality
control purposes, the infant formula reference material was used as an ‘in-house’
reference material and assayed for all trans-retinol and α-tocopherol in every batch of
samples.
4.2.4.2. Measurement uncertainty
‘In-house’ validation data were used to estimate the measurement uncertainty for each
analyte at three different levels according to the method of Plozza, et al. (2011). The
major sources of uncertainty were homogeneity, method recovery and the analytical
standard calibration curves. Homogeneity uncertainty was estimated from the relative
standard deviation of duplicate analyses run in nine batches of samples. The
uncertainty due to the purity of the analytical standards was shown to be insignificant
and not included.
4.3. Results
4.3.1. Mass spectrometer
4.3.1.1. Atmospheric pressure chemical ionisation
Methanol and water were used as mobile phase components as these gave the best
ionisation efficiency for vitamin D3 analysis.
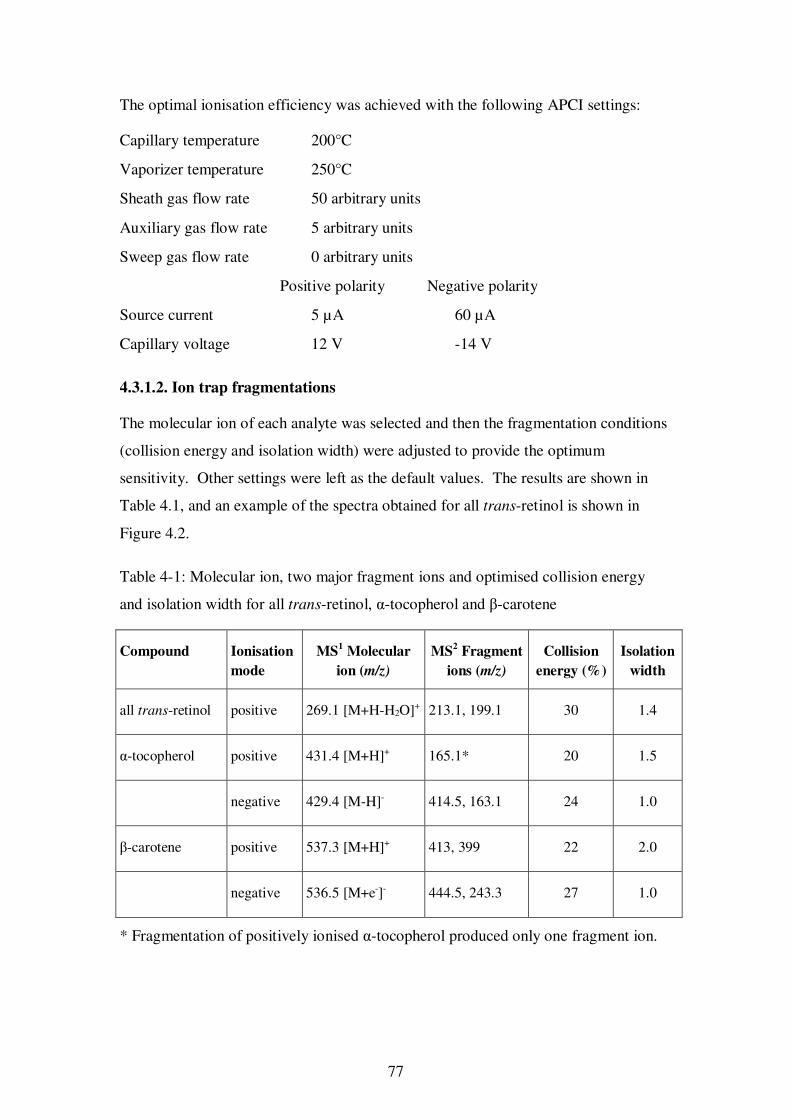
77
The optimal ionisation efficiency was achieved with the following APCI settings:
Capillary temperature 200°C
Vaporizer temperature 250°C
Sheath gas flow rate 50 arbitrary units
Auxiliary gas flow rate 5 arbitrary units
Sweep gas flow rate 0 arbitrary units
Positive polarity Negative polarity
Source current 5 µA 60 µA
Capillary voltage 12 V -14 V
4.3.1.2. Ion trap fragmentations
The molecular ion of each analyte was selected and then the fragmentation conditions
(collision energy and isolation width) were adjusted to provide the optimum
sensitivity. Other settings were left as the default values. The results are shown in
Table 4.1, and an example of the spectra obtained for all trans-retinol is shown in
Figure 4.2.
Table 4-1: Molecular ion, two major fragment ions and optimised collision energy
and isolation width for all trans-retinol, α-tocopherol and β-carotene
Compound Ionisation
mode
MS1 Molecular
ion (m/z)
MS2 Fragment
ions (m/z)
Collision
energy (%)
Isolation
width
all trans-retinol positive 269.1 [M+H-H2O]+ 213.1, 199.1 30 1.4
α-tocopherol positive 431.4 [M+H]+ 165.1* 20 1.5
negative 429.4 [M-H]- 414.5, 163.1 24 1.0
β-carotene positive 537.3 [M+H]+ 413, 399 22 2.0
negative 536.5 [M+e-]- 444.5, 243.3 27 1.0
* Fragmentation of positively ionised α-tocopherol produced only one fragment ion.
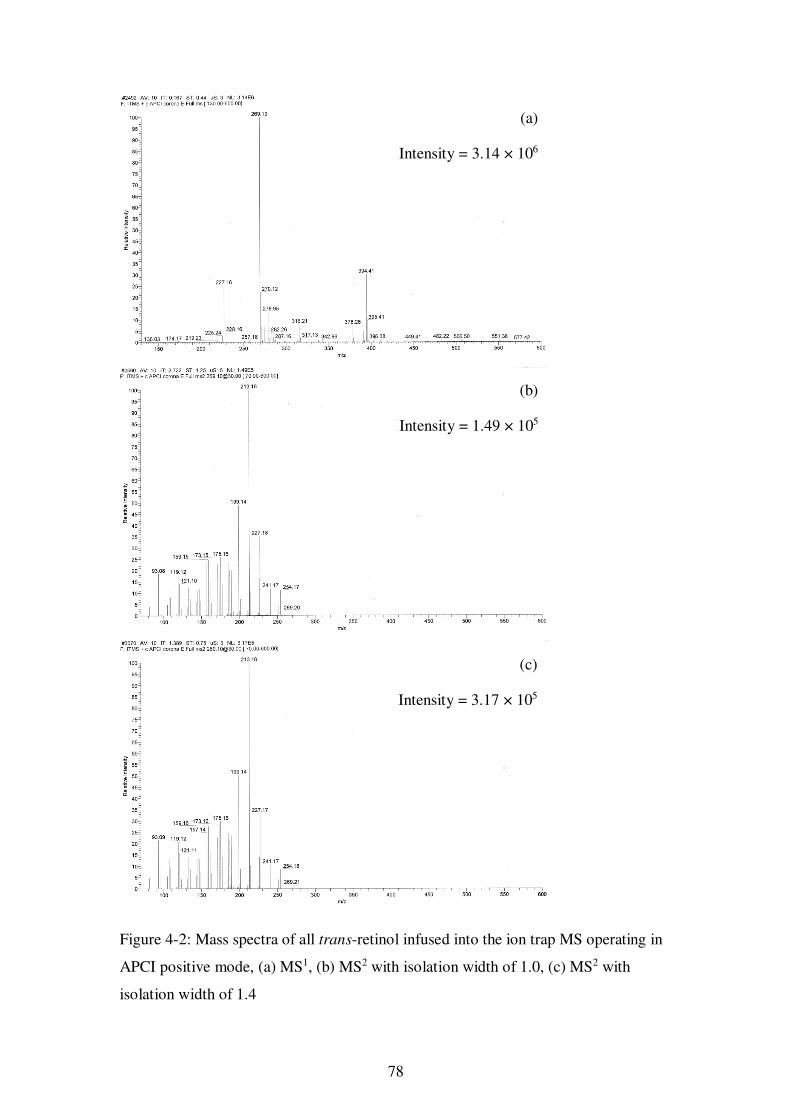
78
Figure 4-2: Mass spectra of all trans-retinol infused into the ion trap MS operating in
APCI positive mode, (a) MS1, (b) MS2 with isolation width of 1.0, (c) MS2 with
isolation width of 1.4
(a)
Intensity = 3.14 × 10⁶
(b)
Intensity = 1.49 × 10⁵
(c)
Intensity = 3.17 × 10⁵

79
The parent and the two most intense fragment ions for each compound, along with the
%CV of the concentration of each analyte determined from eight successive analyses
of a milk extract are shown in Table 4.2.
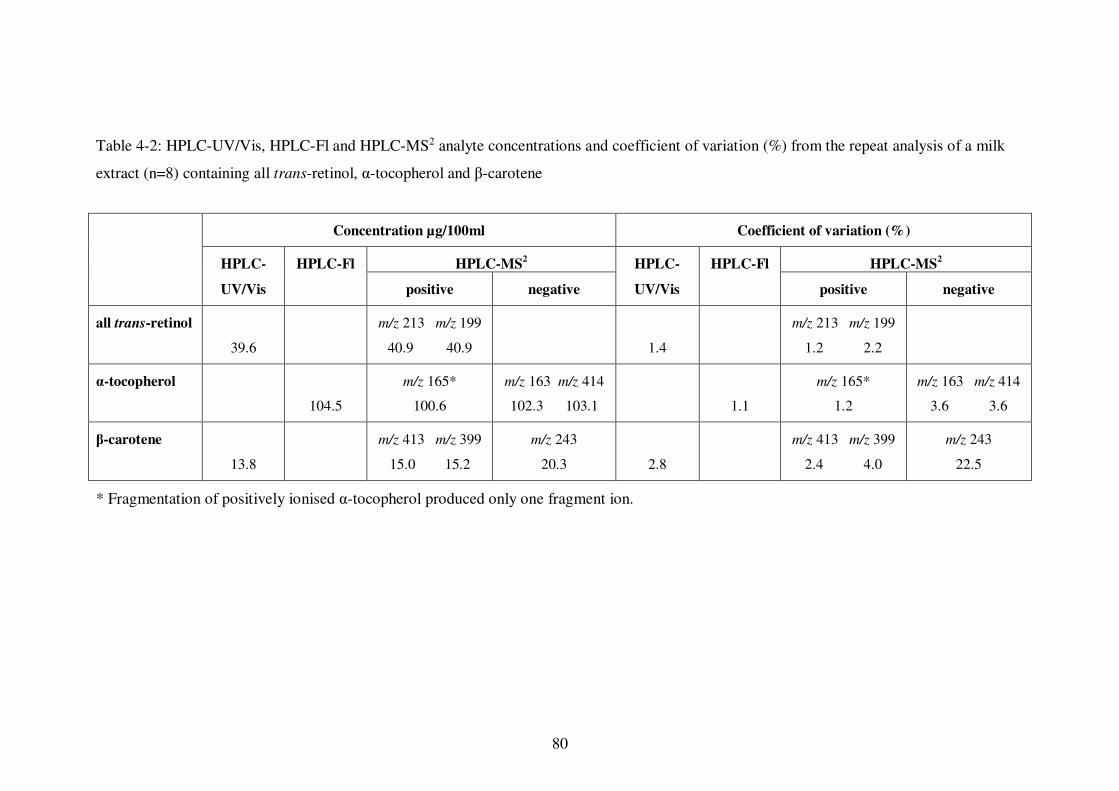
80
Table 4-2: HPLC-UV/Vis, HPLC-Fl and HPLC-MS2 analyte concentrations and coefficient of variation (%) from the repeat analysis of a milk
extract (n=8) containing all trans-retinol, α-tocopherol and β-carotene
* Fragmentation of positively ionised α-tocopherol produced only one fragment ion.
Concentration µg/100ml Coefficient of variation (%)
HPLC- HPLC-Fl HPLC-MS2 HPLC- HPLC-Fl HPLC-MS
2
UV/Vis positive negative UV/Vis positive negative
all trans-retinol
39.6
m/z 213 m/z 199
40.9 40.9
1.4
m/z 213 m/z 199
1.2 2.2
α-tocopherol
104.5
m/z 165*
100.6
m/z 163 m/z 414
102.3 103.1
1.1
m/z 165*
1.2
m/z 163 m/z 414
3.6 3.6
β-carotene
13.8
m/z 413 m/z 399
15.0 15.2
m/z 243
20.3
2.8
m/z 413 m/z 399
2.4 4.0
m/z 243
22.5
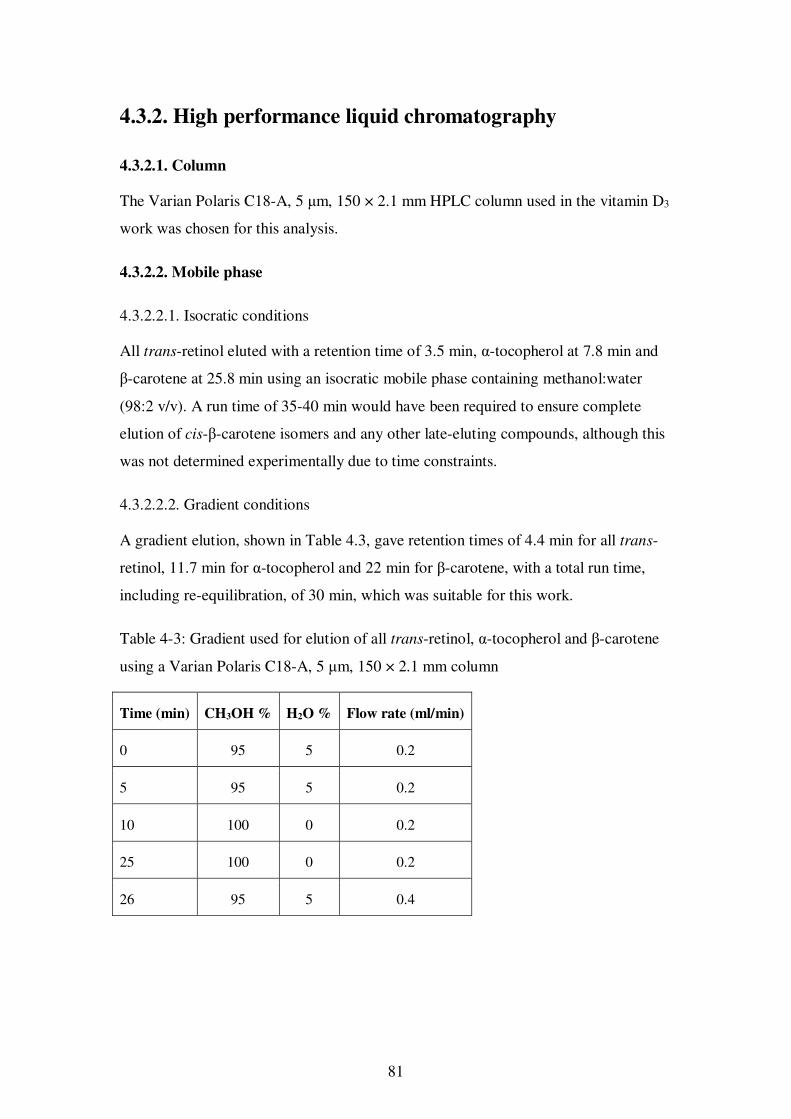
81
4.3.2. High performance liquid chromatography
4.3.2.1. Column
The Varian Polaris C18-A, 5 μm, 150 × 2.1 mm HPLC column used in the vitamin D3
work was chosen for this analysis.
4.3.2.2. Mobile phase
4.3.2.2.1. Isocratic conditions
All trans-retinol eluted with a retention time of 3.5 min, α-tocopherol at 7.8 min and
β-carotene at 25.8 min using an isocratic mobile phase containing methanol:water
(98:2 v/v). A run time of 35-40 min would have been required to ensure complete
elution of cis-β-carotene isomers and any other late-eluting compounds, although this
was not determined experimentally due to time constraints.
4.3.2.2.2. Gradient conditions
A gradient elution, shown in Table 4.3, gave retention times of 4.4 min for all trans-
retinol, 11.7 min for α-tocopherol and 22 min for β-carotene, with a total run time,
including re-equilibration, of 30 min, which was suitable for this work.
Table 4-3: Gradient used for elution of all trans-retinol, α-tocopherol and β-carotene
using a Varian Polaris C18-A, 5 μm, 150 × 2.1 mm column
Time (min) CH3OH % H2O % Flow rate (ml/min)
0 95 5 0.2
5 95 5 0.2
10 100 0 0.2
25 100 0 0.2
26 95 5 0.4
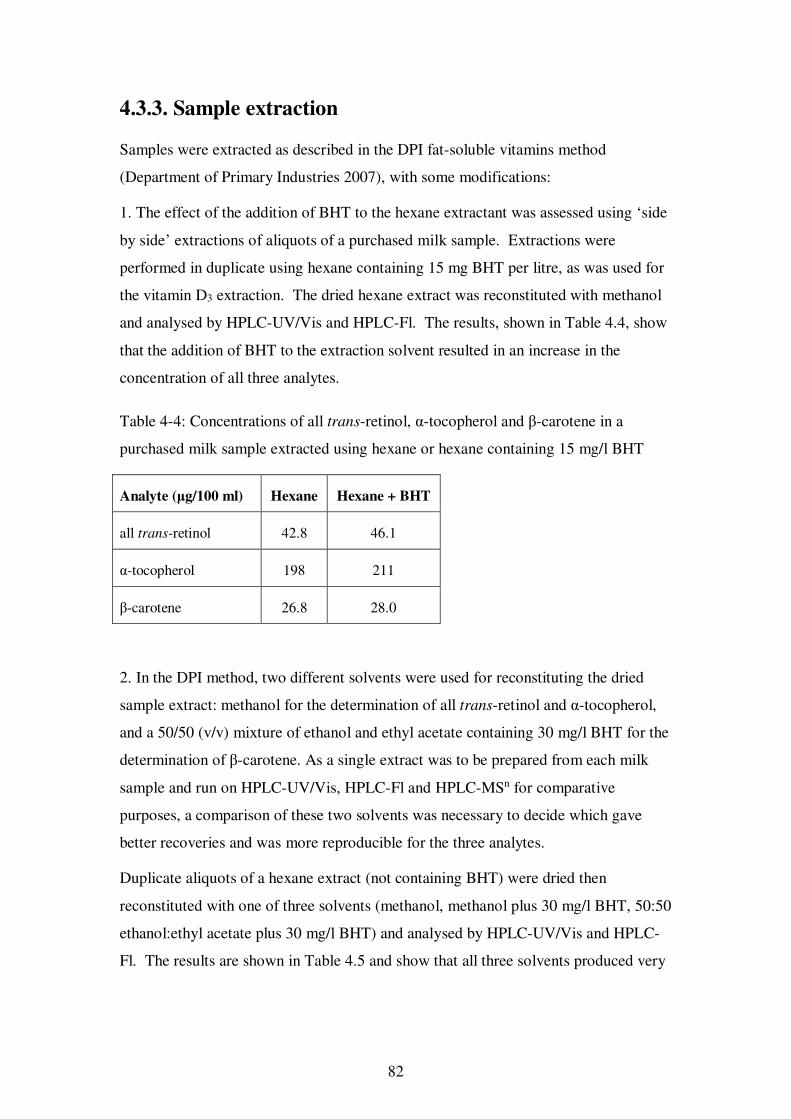
82
4.3.3. Sample extraction
Samples were extracted as described in the DPI fat-soluble vitamins method
(Department of Primary Industries 2007), with some modifications:
1. The effect of the addition of BHT to the hexane extractant was assessed using ‘side
by side’ extractions of aliquots of a purchased milk sample. Extractions were
performed in duplicate using hexane containing 15 mg BHT per litre, as was used for
the vitamin D3 extraction. The dried hexane extract was reconstituted with methanol
and analysed by HPLC-UV/Vis and HPLC-Fl. The results, shown in Table 4.4, show
that the addition of BHT to the extraction solvent resulted in an increase in the
concentration of all three analytes.
Table 4-4: Concentrations of all trans-retinol, α-tocopherol and β-carotene in a
purchased milk sample extracted using hexane or hexane containing 15 mg/l BHT
Analyte (μg/100 ml) Hexane Hexane + BHT
all trans-retinol 42.8 46.1
α-tocopherol 198 211
β-carotene 26.8 28.0
2. In the DPI method, two different solvents were used for reconstituting the dried
sample extract: methanol for the determination of all trans-retinol and α-tocopherol,
and a 50/50 (v/v) mixture of ethanol and ethyl acetate containing 30 mg/l BHT for the
determination of β-carotene. As a single extract was to be prepared from each milk
sample and run on HPLC-UV/Vis, HPLC-Fl and HPLC-MSn for comparative
purposes, a comparison of these two solvents was necessary to decide which gave
better recoveries and was more reproducible for the three analytes.
Duplicate aliquots of a hexane extract (not containing BHT) were dried then
reconstituted with one of three solvents (methanol, methanol plus 30 mg/l BHT, 50:50
ethanol:ethyl acetate plus 30 mg/l BHT) and analysed by HPLC-UV/Vis and HPLC-
Fl. The results are shown in Table 4.5 and show that all three solvents produced very
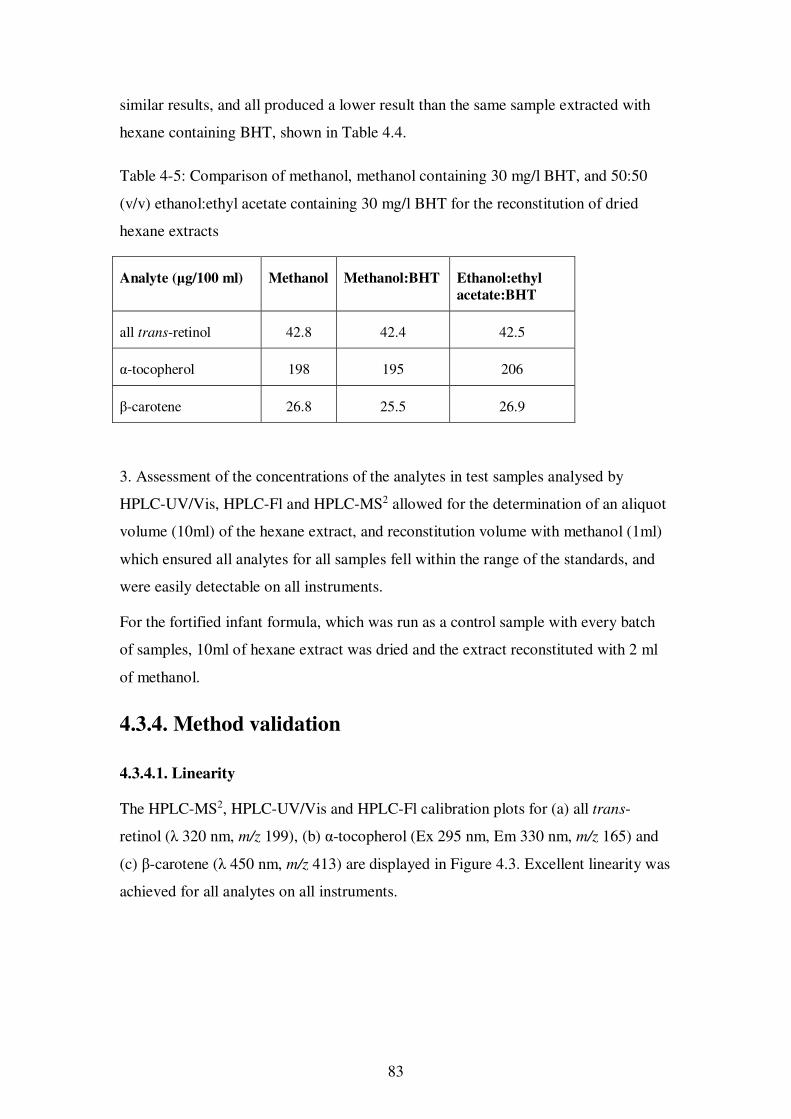
83
similar results, and all produced a lower result than the same sample extracted with
hexane containing BHT, shown in Table 4.4.
Table 4-5: Comparison of methanol, methanol containing 30 mg/l BHT, and 50:50
(v/v) ethanol:ethyl acetate containing 30 mg/l BHT for the reconstitution of dried
hexane extracts
Analyte (μg/100 ml) Methanol Methanol:BHT Ethanol:ethyl
acetate:BHT
all trans-retinol 42.8 42.4 42.5
α-tocopherol 198 195 206
β-carotene 26.8 25.5 26.9
3. Assessment of the concentrations of the analytes in test samples analysed by
HPLC-UV/Vis, HPLC-Fl and HPLC-MS2 allowed for the determination of an aliquot
volume (10ml) of the hexane extract, and reconstitution volume with methanol (1ml)
which ensured all analytes for all samples fell within the range of the standards, and
were easily detectable on all instruments.
For the fortified infant formula, which was run as a control sample with every batch
of samples, 10ml of hexane extract was dried and the extract reconstituted with 2 ml
of methanol.
4.3.4. Method validation
4.3.4.1. Linearity
The HPLC-MS2, HPLC-UV/Vis and HPLC-Fl calibration plots for (a) all trans-
retinol (λ 320 nm, m/z 199), (b) α-tocopherol (Ex 295 nm, Em 330 nm, m/z 165) and
(c) β-carotene (λ 450 nm, m/z 413) are displayed in Figure 4.3. Excellent linearity was
achieved for all analytes on all instruments.
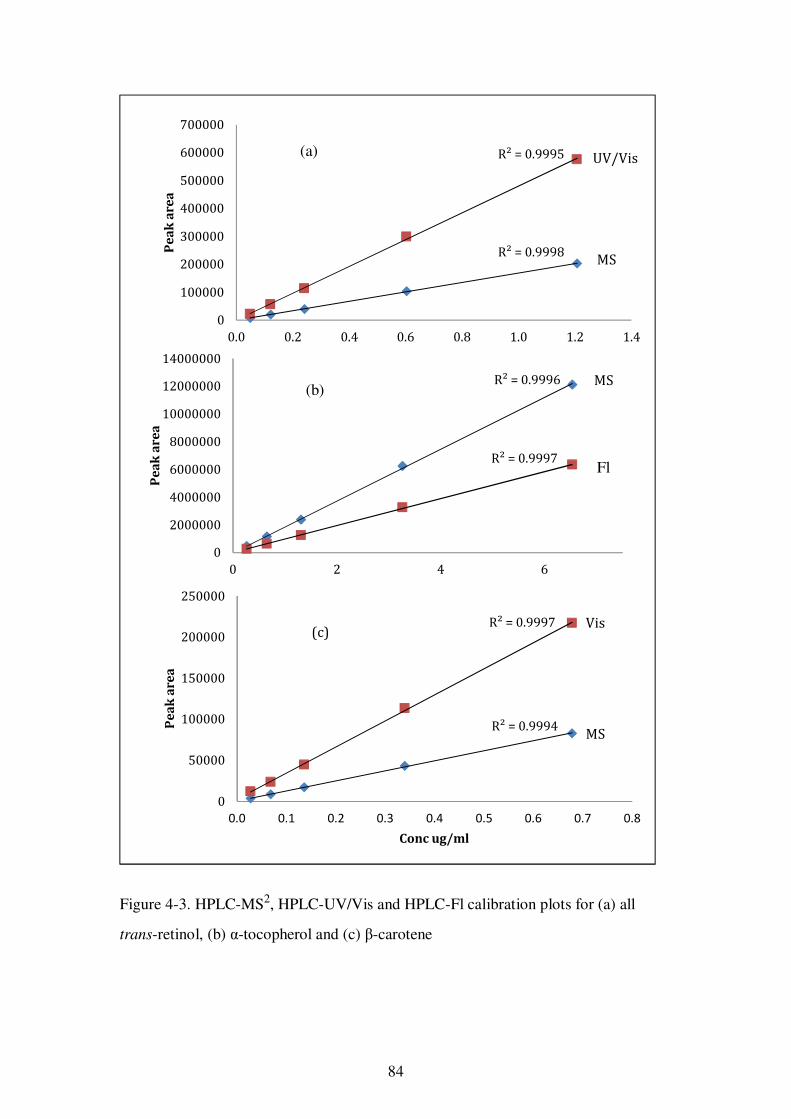
84
Figure 4-3. HPLC-MS2, HPLC-UV/Vis and HPLC-Fl calibration plots for (a) all
trans-retinol, (b) α-tocopherol and (c) β-carotene
R² = 0.9998
R² = 0.9995
0
100000
200000
300000
400000
500000
600000
700000
0.0 0.2 0.4 0.6 0.8 1.0 1.2 1.4
Pe
ak
are
a
Conc ug/ml
(a) UV/Vis
R² = 0.9996
R² = 0.9997
0
2000000
4000000
6000000
8000000
10000000
12000000
14000000
0 2 4 6
Pe
ak
are
a
Conc ug/ml
(b)
R² = 0.9994
R² = 0.9997
0
50000
100000
150000
200000
250000
0.0 0.1 0.2 0.3 0.4 0.5 0.6 0.7 0.8
Pe
ak
are
a
Conc ug/ml
MS
Vis(c)
MS
MS
Fl
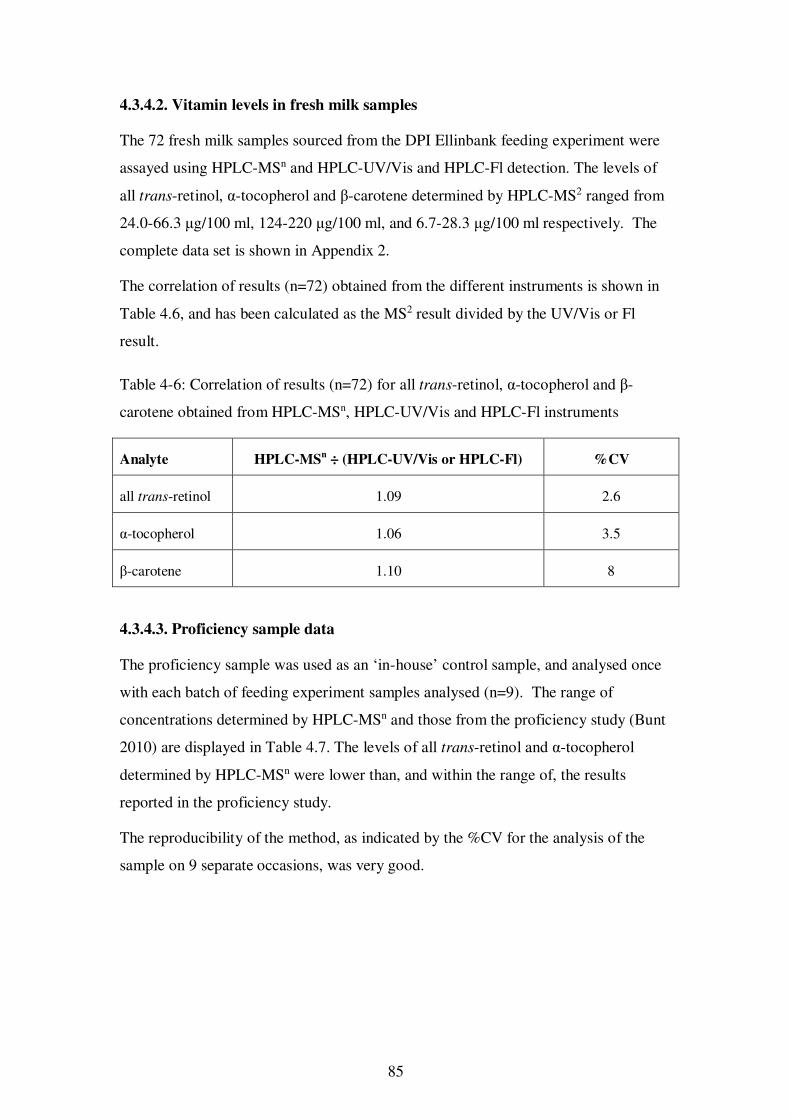
85
4.3.4.2. Vitamin levels in fresh milk samples
The 72 fresh milk samples sourced from the DPI Ellinbank feeding experiment were
assayed using HPLC-MSn and HPLC-UV/Vis and HPLC-Fl detection. The levels of
all trans-retinol, α-tocopherol and β-carotene determined by HPLC-MS2 ranged from
24.0-66.3 μg/100 ml, 124-220 μg/100 ml, and 6.7-28.3 μg/100 ml respectively. The
complete data set is shown in Appendix 2.
The correlation of results (n=72) obtained from the different instruments is shown in
Table 4.6, and has been calculated as the MS2 result divided by the UV/Vis or Fl
result.
Table 4-6: Correlation of results (n=72) for all trans-retinol, α-tocopherol and β-
carotene obtained from HPLC-MSn, HPLC-UV/Vis and HPLC-Fl instruments
Analyte HPLC-MSn ÷ (HPLC-UV/Vis or HPLC-Fl) %CV
all trans-retinol 1.09 2.6
α-tocopherol 1.06 3.5
β-carotene 1.10 8
4.3.4.3. Proficiency sample data
The proficiency sample was used as an ‘in-house’ control sample, and analysed once
with each batch of feeding experiment samples analysed (n=9). The range of
concentrations determined by HPLC-MSn and those from the proficiency study (Bunt
2010) are displayed in Table 4.7. The levels of all trans-retinol and α-tocopherol
determined by HPLC-MSn were lower than, and within the range of, the results
reported in the proficiency study.
The reproducibility of the method, as indicated by the %CV for the analysis of the
sample on 9 separate occasions, was very good.

86
Table 4-7: The ranges of all trans-retinol and α-tocopherol determined by HPLC-MSn
for the proficiency sample, compared with the levels reported in the proficiency study
Analyte This study Proficiency study
Range (mg/100 g) %CV Range (mg/100 g) %CV
all trans-retinol 0.61-0.74 7.1, n=9 0.78-1.2 19.7, n=7
α-tocopherol 9.5-11.8 6.2, n=9 10.5-14.3 8.9, n=6
4.3.4.4. Recovery
Recoveries of spiked milk samples from eight separate analytical batches assayed by
HPLC-MSn are summarised in Table 4.8.
Table 4-8: Spiking level, recovery data and %CV for spiked milk samples analysed in
eight separate batches of samples
Analyte Spiking level
µg/100 ml
Recovery %
(range and mean)
%CV
all trans-retinol 29 91-114; 101 7.6
α-tocopherol 105 91-115; 100 8.3
β-carotene 17 83-112; 93 12.4
4.3.4.5. Instrument repeatability
Instrument repeatability, expressed as the %CV of the peak area, was determined by
repetitive injection of standard and sample solutions on HPLC-MSn, HPLC-UV/Vis
and HPLC-Fl. The data are presented in Table 4.9 and show the similar instrument
repeatability of HPLC-MSn in comparison to HPLC-UV/Vis and HPLC-Fl.
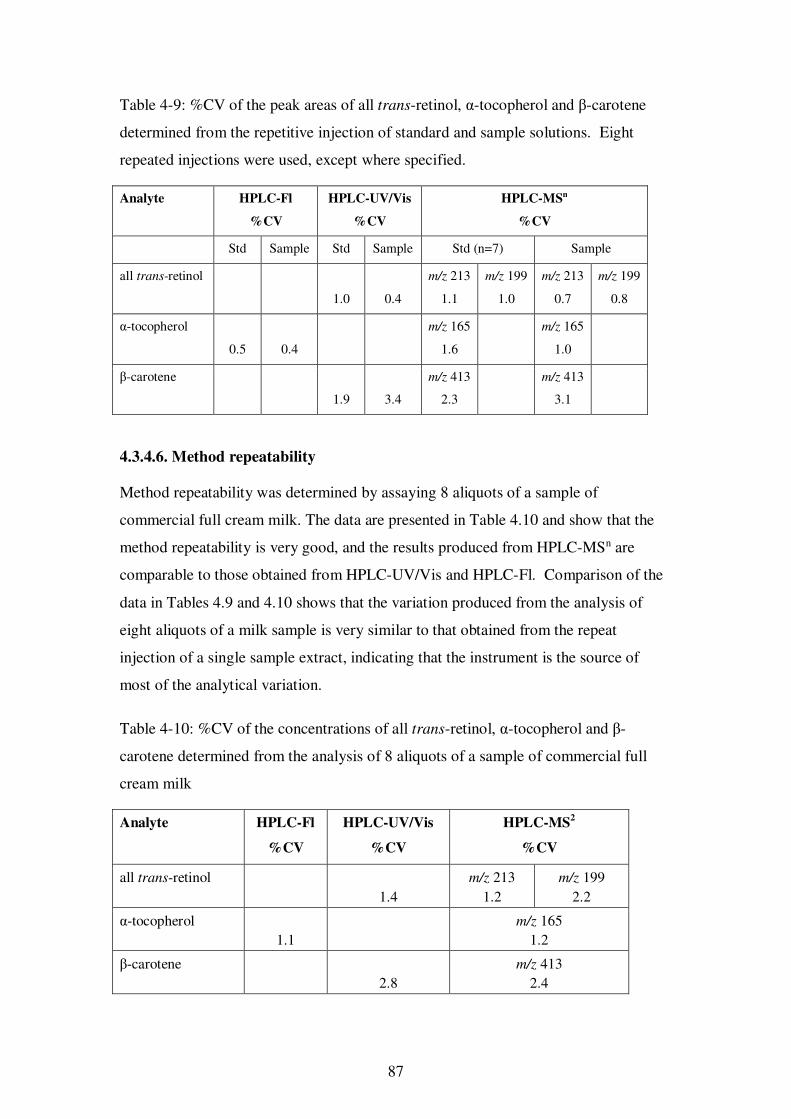
87
Table 4-9: %CV of the peak areas of all trans-retinol, α-tocopherol and β-carotene
determined from the repetitive injection of standard and sample solutions. Eight
repeated injections were used, except where specified.
Analyte HPLC-Fl
%CV
HPLC-UV/Vis
%CV
HPLC-MSn
%CV
Std Sample Std Sample Std (n=7) Sample
all trans-retinol
1.0
0.4
m/z 213
1.1
m/z 199
1.0
m/z 213
0.7
m/z 199
0.8
α-tocopherol
0.5
0.4
m/z 165
1.6
m/z 165
1.0
β-carotene
1.9
3.4
m/z 413
2.3
m/z 413
3.1
4.3.4.6. Method repeatability
Method repeatability was determined by assaying 8 aliquots of a sample of
commercial full cream milk. The data are presented in Table 4.10 and show that the
method repeatability is very good, and the results produced from HPLC-MSn are
comparable to those obtained from HPLC-UV/Vis and HPLC-Fl. Comparison of the
data in Tables 4.9 and 4.10 shows that the variation produced from the analysis of
eight aliquots of a milk sample is very similar to that obtained from the repeat
injection of a single sample extract, indicating that the instrument is the source of
most of the analytical variation.
Table 4-10: %CV of the concentrations of all trans-retinol, α-tocopherol and β-
carotene determined from the analysis of 8 aliquots of a sample of commercial full
cream milk
Analyte HPLC-Fl
%CV
HPLC-UV/Vis
%CV
HPLC-MS2
%CV
all trans-retinol 1.4
m/z 213 1.2
m/z 199 2.2
α-tocopherol 1.1
m/z 165 1.2
β-carotene 2.8
m/z 413 2.4
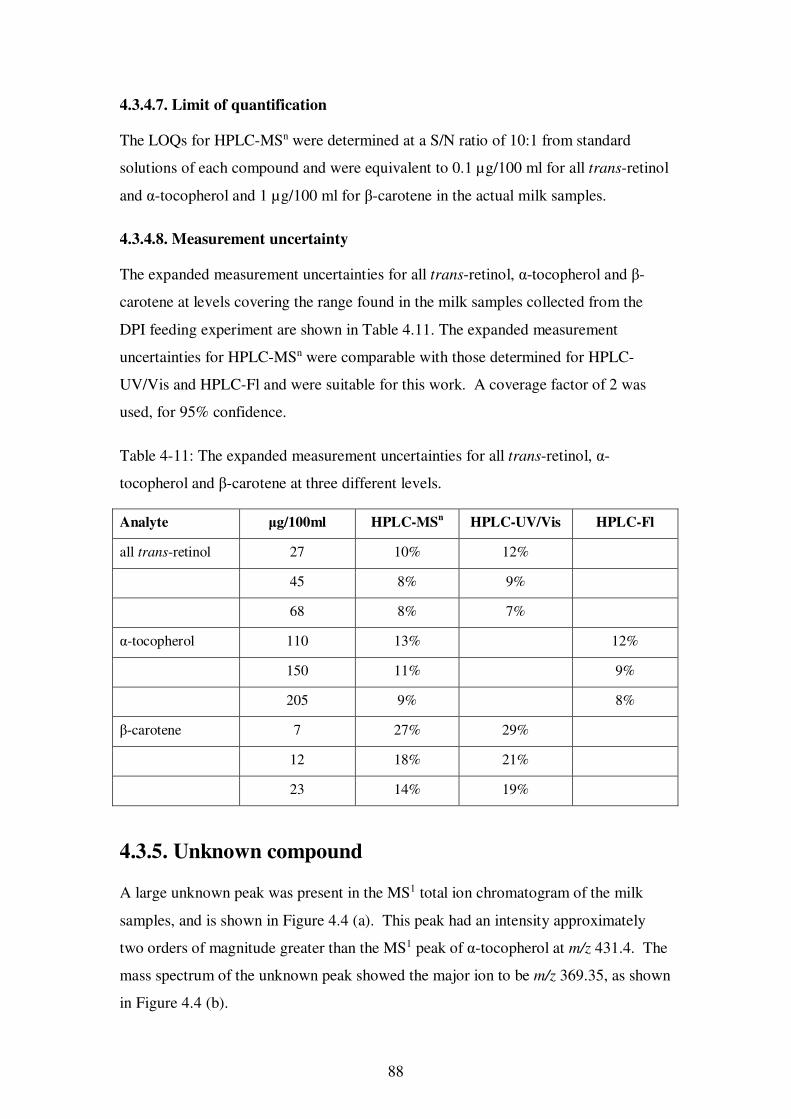
88
4.3.4.7. Limit of quantification
The LOQs for HPLC-MSn were determined at a S/N ratio of 10:1 from standard
solutions of each compound and were equivalent to 0.1 µg/100 ml for all trans-retinol
and α-tocopherol and 1 µg/100 ml for β-carotene in the actual milk samples.
4.3.4.8. Measurement uncertainty
The expanded measurement uncertainties for all trans-retinol, α-tocopherol and β-
carotene at levels covering the range found in the milk samples collected from the
DPI feeding experiment are shown in Table 4.11. The expanded measurement
uncertainties for HPLC-MSn were comparable with those determined for HPLC-
UV/Vis and HPLC-Fl and were suitable for this work. A coverage factor of 2 was
used, for 95% confidence.
Table 4-11: The expanded measurement uncertainties for all trans-retinol, α-
tocopherol and β-carotene at three different levels.
Analyte μg/100ml HPLC-MSn HPLC-UV/Vis HPLC-Fl
all trans-retinol 27 10% 12%
45 8% 9%
68 8% 7%
α-tocopherol 110 13% 12%
150 11% 9%
205 9% 8%
β-carotene 7 27% 29%
12 18% 21%
23 14% 19%
4.3.5. Unknown compound
A large unknown peak was present in the MS1 total ion chromatogram of the milk
samples, and is shown in Figure 4.4 (a). This peak had an intensity approximately
two orders of magnitude greater than the MS1 peak of α-tocopherol at m/z 431.4. The
mass spectrum of the unknown peak showed the major ion to be m/z 369.35, as shown
in Figure 4.4 (b).
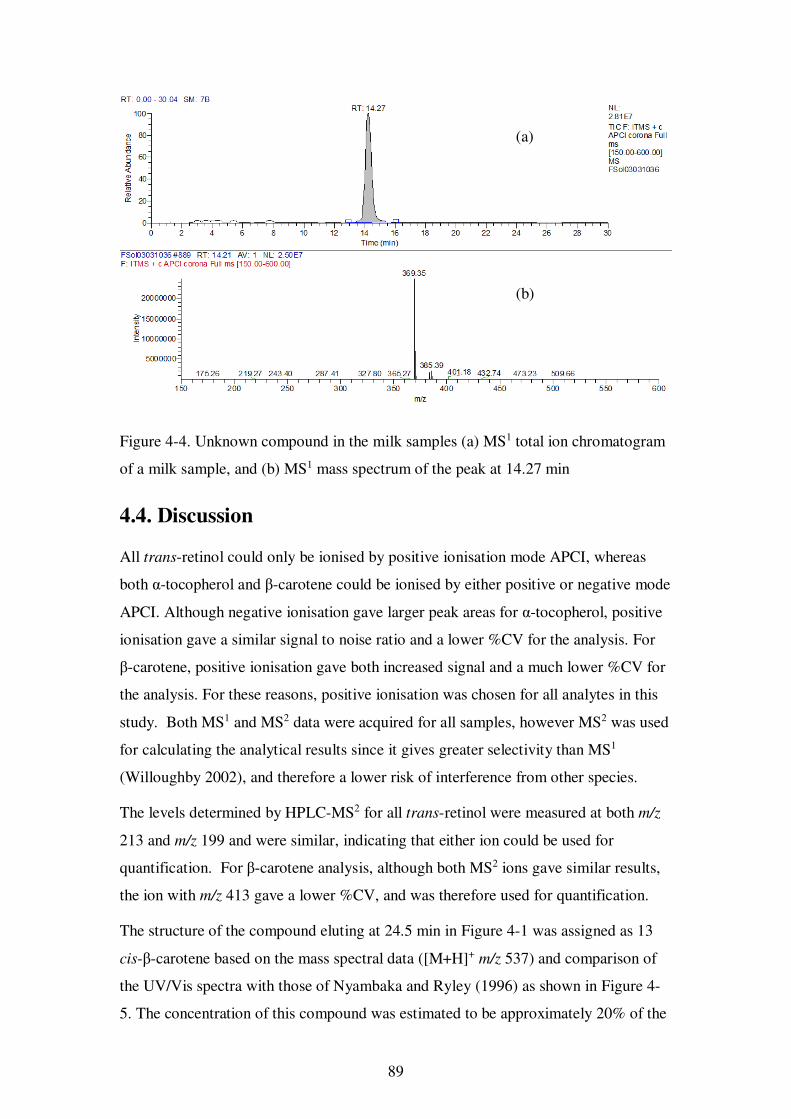
89
Figure 4-4. Unknown compound in the milk samples (a) MS1 total ion chromatogram
of a milk sample, and (b) MS1 mass spectrum of the peak at 14.27 min
4.4. Discussion
All trans-retinol could only be ionised by positive ionisation mode APCI, whereas
both α-tocopherol and β-carotene could be ionised by either positive or negative mode
APCI. Although negative ionisation gave larger peak areas for α-tocopherol, positive
ionisation gave a similar signal to noise ratio and a lower %CV for the analysis. For
β-carotene, positive ionisation gave both increased signal and a much lower %CV for
the analysis. For these reasons, positive ionisation was chosen for all analytes in this
study. Both MS1 and MS2 data were acquired for all samples, however MS2 was used
for calculating the analytical results since it gives greater selectivity than MS1
(Willoughby 2002), and therefore a lower risk of interference from other species.
The levels determined by HPLC-MS2 for all trans-retinol were measured at both m/z
213 and m/z 199 and were similar, indicating that either ion could be used for
quantification. For β-carotene analysis, although both MS2 ions gave similar results,
the ion with m/z 413 gave a lower %CV, and was therefore used for quantification.
The structure of the compound eluting at 24.5 min in Figure 4-1 was assigned as 13
cis-β-carotene based on the mass spectral data ([M+H]+ m/z 537) and comparison of
the UV/Vis spectra with those of Nyambaka and Ryley (1996) as shown in Figure 4-
5. The concentration of this compound was estimated to be approximately 20% of the
(b)
(a)
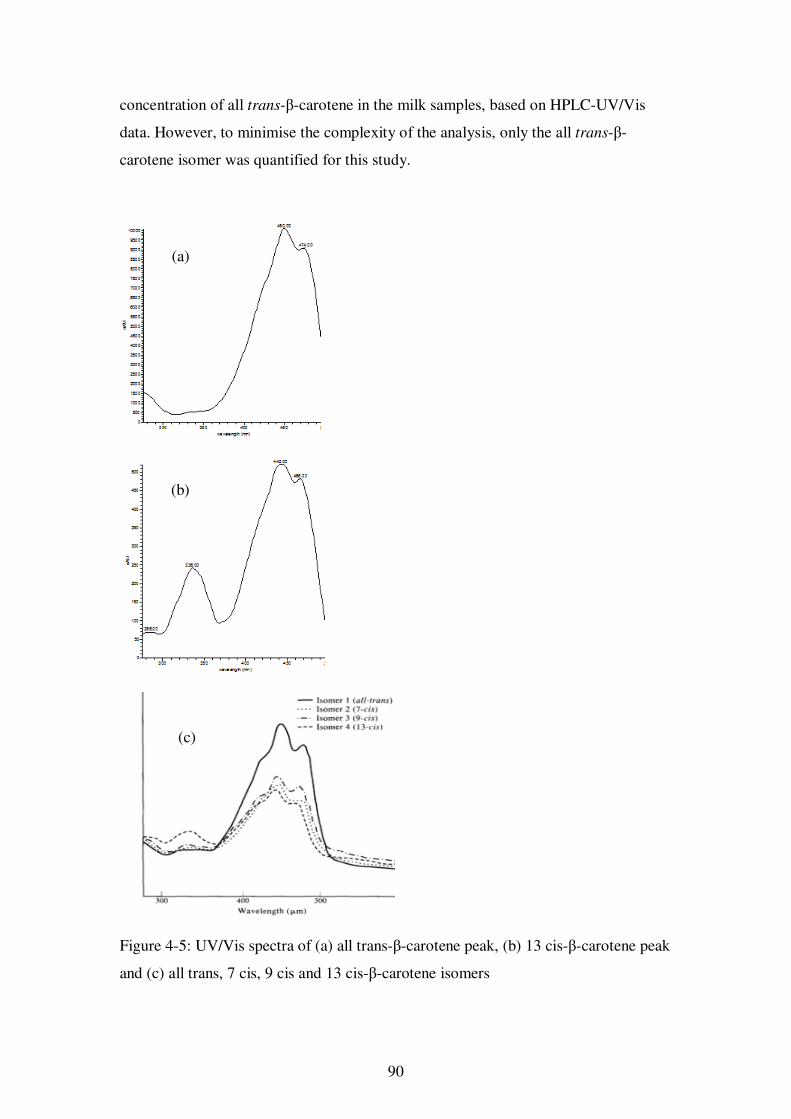
90
concentration of all trans-β-carotene in the milk samples, based on HPLC-UV/Vis
data. However, to minimise the complexity of the analysis, only the all trans-β-
carotene isomer was quantified for this study.
Figure 4-5: UV/Vis spectra of (a) all trans-β-carotene peak, (b) 13 cis-β-carotene peak
and (c) all trans, 7 cis, 9 cis and 13 cis-β-carotene isomers
(a)
(b)
(c)
91
Gradient elution of the mobile phase was preferred over isocratic elution of the
mobile phase as the lower concentration of methanol at the commencement of the
analytical run (0 min) gave a slightly longer retention time for all trans-retinol,
potentially giving a better separation from any early eluting compounds that might
facilitate suppression or enhancement of the ionisation of the molecular ion. The
higher concentration of methanol later in the gradient reduced the retention time of β-
carotene and enabled a significantly shorter chromatographic run time for the gradient
elution compared to the isocratic elution.
The addition of BHT to the hexane used to extract the analytes from the saponified
milk resulted in an increase in the concentration of the analytes. BHT is a synthetic
antioxidant and presumably afforded some protection of the analytes from oxidation
due to oxygen exposure either during the liquid/liquid extraction step or the drying
step of the sample preparation.
An internal standard was not used for this work as the expected levels of all trans-
retinol, α–tocopherol and all trans-β-carotene in milk (40 μg/ml, 200 μg/ml and 30
μg/ml respectively) were sufficiently high enough to make any irregularities in the ion
source of the mass spectrometer of minor significance. The HPLC-MSn instrument
repeatability for each compound was similar to those for the traditional HPLC-
UV/Vis (all trans-retinol and β-carotene) and HPLC-Fl (α-tocopherol) instruments,
and excellent correlation was achieved between the levels of the analytes in milk
determined by HPLC-MSn and the levels determined by validated HPLC-UV/Vis and
HPLC-Fl methods. This indicates that the extra expense of isotopically labelled
internal standards may not be warranted for this analysis.
The levels of all trans-retinol and α-tocopherol in the Proficiency Testing Australia
sample determined by the HPLC-MSn method were slightly lower than those obtained
from participants in the proficiency study, however the data were useful as a control
sample to indicate batch-to-batch method performance. Degradation of the
proficiency sample due to aging is possible, but is not expected to have contributed
significantly to the lower results, as the sample was only 2-3 months old at the time
this analysis was performed, and the results appeared to be stable during the time it
was in use.
92
The large unknown peak in the milk extract chromatogram shown in Figure 4.4 had a
MS1 m/z of 369.35, corresponding to cholesterol, which forms the ion [M+H-H2O]+
when ionised by APCI in the positive ionisation mode (Raith, Brenner, Farwanah,
Müller, Eder and Neubert 2005). Milk contains approximately 14 mg/100 g
cholesterol (Belitz and Grosch 1999), a fat-soluble compound which is expected to
extract from milk along with the fat-soluble vitamins. No further action was taken to
positively identify the peak. If this peak was found to be cholesterol, the
concentration could be determined from the MS1 data by comparison to the peak area
of a cholesterol standard solution or, for better confidence in the results, a MS2
protocol for cholesterol could be added to the existing mass spectrometer method and
the samples re-analysed along with a series of cholesterol standards.
The main limitation to the usage of this method is the much greater cost of the mass
spectrometer compared to UV/Vis and fluorescence detectors, as well as the greater
maintenance requirements of the mass spectrometer. Depending on the requirements
for the analytical data, these extra expenses may be prohibitive to its adoption as a
routine detector for this analysis.
4.5. Conclusion
A straight forward, robust method for determining the levels of all trans-retinol, α-
tocopherol and β-carotene in cow milk using HPLC-MSn has been developed. The
method was validated using repeatability studies, duplicate analyses, recovery
experiments, proficiency study data and comparison with previously validated HPLC-
UV/Vis and HPLC-Fl procedures used in our laboratory. The HPLC-MSn method
was faster than using the two separate HPLC methods (UV/Vis and Fl) and could also
be used to provide mass data on other compounds present in the extract, which could
be useful for retrospective analysis of samples for a new compound of interest or
metabolomics studies. The method can also be used in conjunction with the method
for determining vitamin D3 in cow milk by HPLC-MSn.
93
Chapter 5: Feeding experiment
5.1. Introduction
The dairy industry is the third largest rural industry in Australia, behind the wheat and
beef industries, with a value of $13.5 billion in 2014/15 (Dairy Australia 2016).
Gippsland in eastern Victoria is a major dairy region in Australia, producing 1.9
billion litres of milk annually, or 21% of the national milk production (Dairy
Australia 2017). The diet of dairy cows in Victoria are based on perennial ryegrass
and white clover, with supplementation from grain or pelleted concentrate fed in the
dairy shed (Auldist, et al. 2013). In times of drought, the lack of pasture is
compensated for by increasing supplementary feed (Wales, Marett, Greenwood,
Wright, Thornhill, Jacobs, et al. 2013). High amounts of grain supplements fed to
dairy cows at milking times causes fluctuations in rumen pH and can limit milk
production (Wales and Doyle 2003). Researchers at DPI Ellinbank, Victoria,
Australia undertook a substantial dairy cow feeding systems experiment to investigate
the potential to maximise the quantity and quality of milk by using alternative
supplementary rations available throughout the day (Auldist, et al. 2013). The
effectiveness of the new HPLC-MSn method for analysis of milk samples will be
demonstrated using a series of samples from one of these research programs.
Milk samples were collected from dairy cows in the feeding systems experiment and
were analysed for all trans-retinol, α-tocopherol and β-carotene using the HPLC-MSn
method detailed in Chapter 4.
In an unrelated feeding experiment carried out at DPI Ellinbank, the newly developed
vitamin D method was used to analyse for 25-hydroxyvitamin D3 and vitamin D3 in
milk collected from cows fed 25-hydroxyvitamin D3 to investigate the effect on the
levels of both 25-hydroxyvitamin D3 and vitamin D3 in the milk. The data showed
that even when fed 25-hydroxyvitamin D3 for 10 weeks, the milk contained low levels
of both 25-hydroxyvitamin D3 (≤ 0.05 µg/100 ml) and vitamin D3 (<0.02 µg/100 ml)
(H. Gill, 2009, pers. comm.).
Due to the low levels of vitamin D3 in the milk samples collected from the 25-
hydroxyvitamin D3 feeding experiment, the samples from the feeding experiment
described in Chapter 5 of this thesis were not analysed for vitamin D3 or it’s 25-
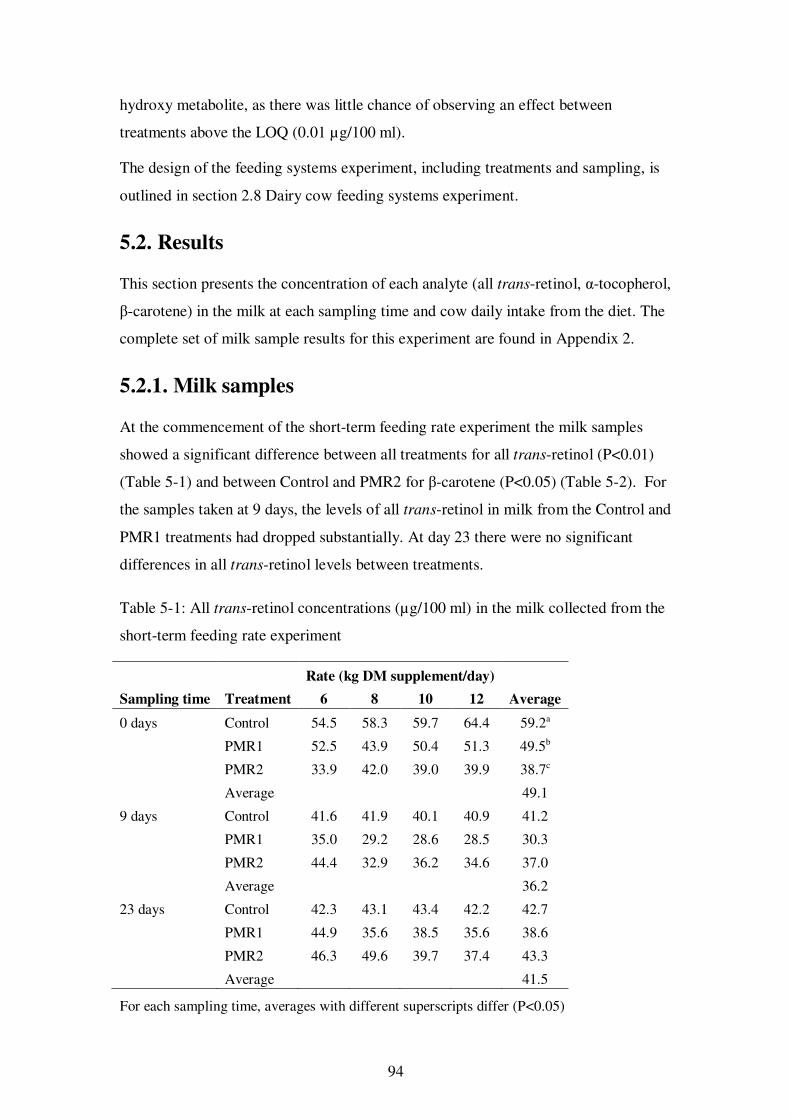
94
hydroxy metabolite, as there was little chance of observing an effect between
treatments above the LOQ (0.01 µg/100 ml).
The design of the feeding systems experiment, including treatments and sampling, is
outlined in section 2.8 Dairy cow feeding systems experiment.
5.2. Results
This section presents the concentration of each analyte (all trans-retinol, α-tocopherol,
β-carotene) in the milk at each sampling time and cow daily intake from the diet. The
complete set of milk sample results for this experiment are found in Appendix 2.
5.2.1. Milk samples
At the commencement of the short-term feeding rate experiment the milk samples
showed a significant difference between all treatments for all trans-retinol (P<0.01)
(Table 5-1) and between Control and PMR2 for β-carotene (P<0.05) (Table 5-2). For
the samples taken at 9 days, the levels of all trans-retinol in milk from the Control and
PMR1 treatments had dropped substantially. At day 23 there were no significant
differences in all trans-retinol levels between treatments.
Table 5-1: All trans-retinol concentrations (µg/100 ml) in the milk collected from the
short-term feeding rate experiment
Rate (kg DM supplement/day)
Sampling time Treatment 6 8 10 12 Average
0 days Control 54.5 58.3 59.7 64.4 59.2a
PMR1 52.5 43.9 50.4 51.3 49.5b
PMR2 33.9 42.0 39.0 39.9 38.7c
Average 49.1
9 days Control 41.6 41.9 40.1 40.9 41.2
PMR1 35.0 29.2 28.6 28.5 30.3
PMR2 44.4 32.9 36.2 34.6 37.0
Average 36.2
23 days Control 42.3 43.1 43.4 42.2 42.7
PMR1 44.9 35.6 38.5 35.6 38.6
PMR2 46.3 49.6 39.7 37.4 43.3
Average 41.5
For each sampling time, averages with different superscripts differ (P<0.05)

95
Table 5-2: β-carotene concentrations (µg/100 ml) in the milk collected from the short-
term feeding rate experiment
Rate (kg DM supplement/day)
Sampling time Treatment 6 8 10 12 Average
0 days Control 19.0 15.5 23.6 20.7 19.7a
PMR1 19.6 12.0 18.6 17.7 17.0
PMR2 15.8 13.4 16.6 16.1 15.5b
Average 17.4
9 days Control 23.5 23.6 26.8 27.0 25.2
PMR1 15.1 15.7 16.6 18.0 16.3
PMR2 12.8 14.9 12.4 10.4 12.6
Average 18.1
23 days Control 17.8 12.5 15.8 18.0 16.0 a
PMR1 12.4 10.5 10.1 11.9 11.2 b
PMR2 10.7 11.4 8.7 7.6 9.6 b
Average 12.3
For each sampling time, averages with different superscripts differ (P<0.05)
There was a significant difference (P<0.05) in β-carotene levels between Control and
both PMR treatments at 23 days, with higher β-carotene levels in the milk of Control
cows compared with PMR1 and PMR2 milk. There was an observed decline in β-
carotene levels with increasing feeding rate for PMR2, however this was not
statistically significant (Table 5-2).
At each sampling time, there was no significant difference in α-tocopherol levels
between treatments (Table 5-3), however a significant (P<0.05) negative feeding rate
effect was apparent for PMR2 at 9 days and at 23 days, that is, as the rate of
supplement increased the level of α-tocopherol in the milk decreased. PMR1 also
showed a negative feeding rate effect, although it was not shown to be statistically
significant. There was no apparent effect of feeding rate on α-tocopherol level in the
milk for the Control treatment.
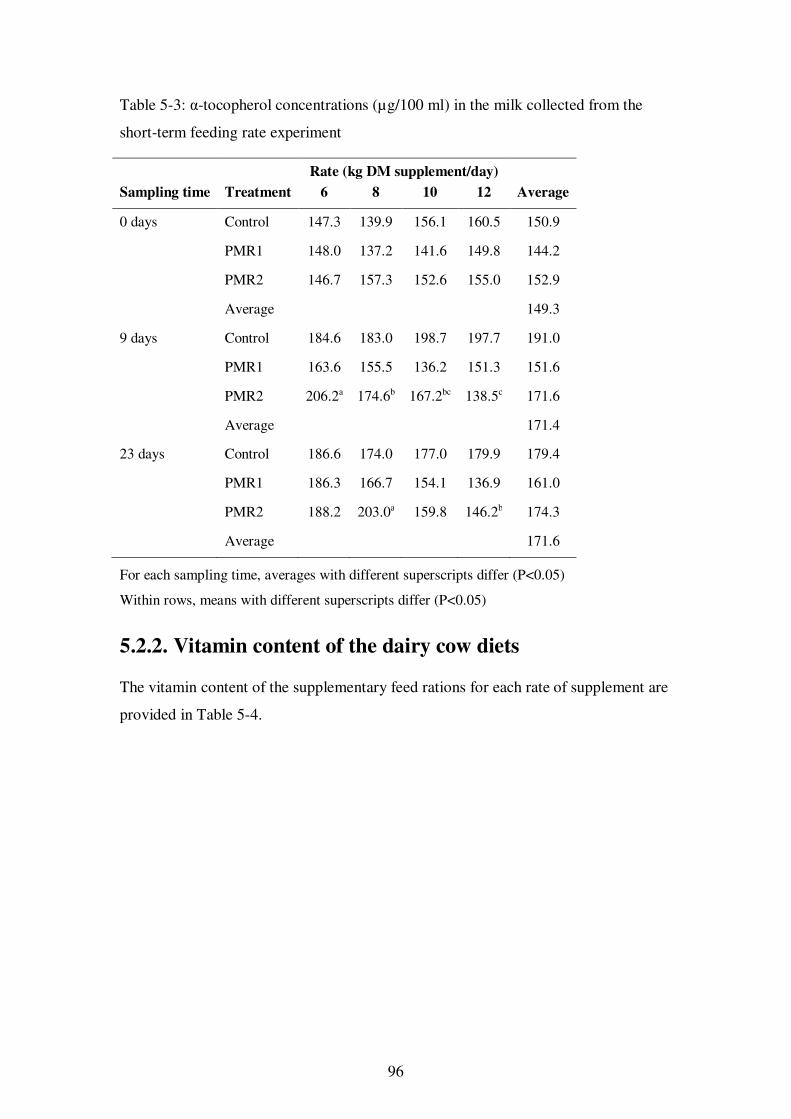
96
Table 5-3: α-tocopherol concentrations (µg/100 ml) in the milk collected from the
short-term feeding rate experiment
Rate (kg DM supplement/day)
Sampling time Treatment 6 8 10 12 Average
0 days Control 147.3 139.9 156.1 160.5 150.9
PMR1 148.0 137.2 141.6 149.8 144.2
PMR2 146.7 157.3 152.6 155.0 152.9
Average 149.3
9 days Control 184.6 183.0 198.7 197.7 191.0
PMR1 163.6 155.5 136.2 151.3 151.6
PMR2 206.2a 174.6b 167.2bc 138.5c 171.6
Average 171.4
23 days Control 186.6 174.0 177.0 179.9 179.4
PMR1 186.3 166.7 154.1 136.9 161.0
PMR2 188.2 203.0a 159.8 146.2b 174.3
Average 171.6
For each sampling time, averages with different superscripts differ (P<0.05)
Within rows, means with different superscripts differ (P<0.05)
5.2.2. Vitamin content of the dairy cow diets
The vitamin content of the supplementary feed rations for each rate of supplement are
provided in Table 5-4.
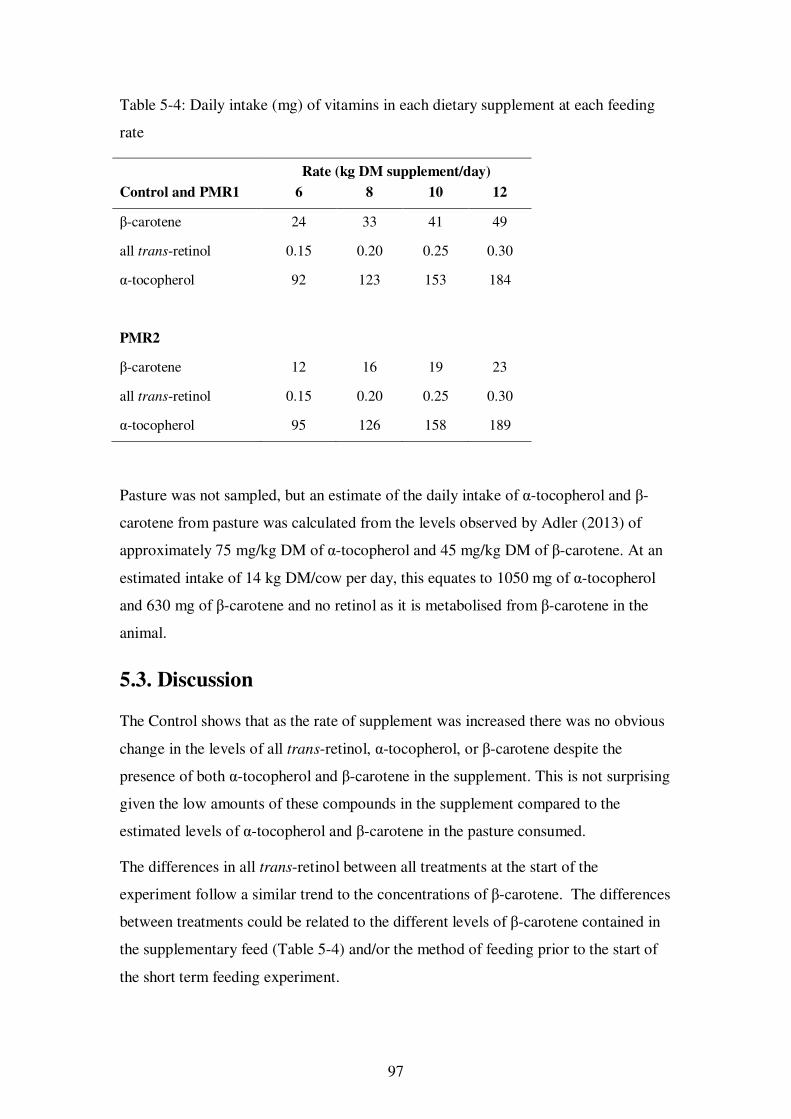
97
Table 5-4: Daily intake (mg) of vitamins in each dietary supplement at each feeding
rate
Rate (kg DM supplement/day)
Control and PMR1 6 8 10 12
β-carotene 24 33 41 49
all trans-retinol 0.15 0.20 0.25 0.30
α-tocopherol 92 123 153 184
PMR2
β-carotene 12 16 19 23
all trans-retinol 0.15 0.20 0.25 0.30
α-tocopherol 95 126 158 189
Pasture was not sampled, but an estimate of the daily intake of α-tocopherol and β-
carotene from pasture was calculated from the levels observed by Adler (2013) of
approximately 75 mg/kg DM of α-tocopherol and 45 mg/kg DM of β-carotene. At an
estimated intake of 14 kg DM/cow per day, this equates to 1050 mg of α-tocopherol
and 630 mg of β-carotene and no retinol as it is metabolised from β-carotene in the
animal.
5.3. Discussion
The Control shows that as the rate of supplement was increased there was no obvious
change in the levels of all trans-retinol, α-tocopherol, or β-carotene despite the
presence of both α-tocopherol and β-carotene in the supplement. This is not surprising
given the low amounts of these compounds in the supplement compared to the
estimated levels of α-tocopherol and β-carotene in the pasture consumed.
The differences in all trans-retinol between all treatments at the start of the
experiment follow a similar trend to the concentrations of β-carotene. The differences
between treatments could be related to the different levels of β-carotene contained in
the supplementary feed (Table 5-4) and/or the method of feeding prior to the start of
the short term feeding experiment.
98
Substantial differences between the average results for all trans-retinol and β-carotene
for samples taken at 9 days and 23 days suggest that the full effect of the dietary
treatments for these two compounds had not been reached at 9 days.
β-carotene concentration was significantly higher in the milk of Control cows than
both PMR treatments. While the Control had access to pasture all day aside from
during milking, the PMR cows only had access to pasture between the evening and
morning milking. It is likely that the lack of access to pasture during the day
contributed to lower β-carotene in the milk, as pasture was the main source of β-
carotene in the diet (section 5.2.2). A similar trend was observed for α-tocopherol
however this was not significant. The PMR was designed to be a superior ration to
the traditional supplementary feed (Control and PMR1) to increase milk quantity by
reducing pH fluctuations in the rumen. This issue of access to pasture was addressed
in a subsequent short-term feeding rate experiment in autumn 2010 and found to
increase milk production (Auldist, et al. 2013).
Feeding large amounts of grain can lead to pasture substitution (Dixon and Stockdale
1999), that is, cows will eat the supplement and not graze as much pasture. It is likely
that this occurred with the higher feeding rates of the PMR. All treatments and
feeding rates were offered 14 kg pasture DM/head per day, however not all the
pasture offered was consumed at the higher feeding rates of PMR (M.J. Auldist, 2014,
pers. comm.). Decreased pasture intake would have the effect of decreasing the intake
of both α-tocopherol and β-carotene, and a significant negative rate effect was
observed for α-tocopherol at 9 days and 23 days. A negative rate effect was also
observed for β-carotene at 23 days, but was not statistically significant. A reduction in
pasture intake could also have occurred due to the reduced time the PMR cows spent
grazing compared to Control cows.
Cows in both PMR 1 and 2, produced lower milk fat concentration at higher feeding
rates (Appendix 2). As these vitamins are within the fat component of the milk, a
decrease in milk fat concentration could also cause the observed decrease in α-
tocopherol levels at higher feeding rates of PMR.
99
5.4. Conclusion
A reduction in the levels of β-carotene in milk were observed when cows were fed a
partial mixed ration instead of the usual practice of feeding grain during milking and
silage in the paddock along with the daily allocation of pasture. This was thought to
be due to a reduced consumption of pasture, which is the major source of β-carotene.
No difference between treatments was shown for α-tocopherol, however there was a
negative correlation between α-tocopherol and feeding rate for the PMR2 treatment.
This was due to substitution of pasture with supplement, compounded by a decrease
in milk fat concentration at higher feeding rates.
There was no significant difference between treatments for all trans-retinol in milk.
100
Chapter 6: General discussion
6.1. Introduction
Vitamins are organic compounds that cannot be synthesised in sufficient amount
within the body, and therefore need to be acquired through the diet. Vitamins D3 and
K2 are the two exceptions to this definition. The body can synthesise its own vitamin
D3 through exposure to ultraviolet B radiation (sunlight), and vitamin K2 is produced
by bacteria in the large intestine. Vitamins are broadly classified as either water-
soluble: B1 (thiamine), B2 (riboflavin), B3 (niacin), B5 (pantothenic acid), B6
(pyridoxine, pyridoxal, pyridoxamine), B12 (cobalamins), folate, biotin and C
(ascorbic acid) or fat- soluble: A (retinol), D2 (ergocalciferol) and D3 (cholcalciferol),
E (tocopherol), and K (phylloquinone, menaquinone).
Fat-soluble vitamin analysis is difficult due to the complexity of the compounds, their
low levels in foods, and their physical and chemical similarity to other compounds
present in foods. Traditional HPLC based methods using either UV/Vis (vitamins A,
D, K and carotenes) or fluorescence (vitamins A, E, K) detection are time consuming
and the vitamins are usually assayed individually due to their chemical diversity and
varying levels within samples.
Rapid advances in HPLC-MS have seen it emerge as a major breakthrough in
analytical science. This technique combines the separating power of liquid
chromatography with the extra sensitivity, selectivity and powerful structure
elucidation ability of mass spectrometry. The selectivity of mass spectrometry is an
advantage over conventional HPLC detectors, particularly when analysing complex
sample matrices. The use of collision-induced dissociation (CID) can give further
selectivity and specificity to the analysis by fragmenting ions of interest and detecting
the resulting product ions. Electrospray ionisation (ESI) and atmospheric pressure
chemical ionisation (APCI) are the widely used ionisation techniques for HPLC-MS.
These two ionisation sources allow coverage of a wide range of analytes, from polar
(ESI) to non-polar (APCI).
There are several different types of mass analysers that are typically used for HPLC-
MS: single quadrupole (MS), triple quadrupole/tandem (MS/MS), ion trap (MSn), and
accurate mass instruments, such as time of flight (TOF), ion cyclotron resonance
101
(ICR) and Orbitrap. HPLC-MSn and HPLC-MS/MS instruments were used for this
work.
A good separation of the sample components by HPLC prior to MS analysis, in the
majority of instances, is still necessary because of the effects of the sample matrix on
the targeted ion(s), either by causing spectral, chemical or physical interferences. The
separation of the analyte by HPLC prior to mass spectral analysis also gives retention
time data, improving the confidence of the analyte identification in targeted analysis.
The aim of this work was to develop a validated method for the determination of a
number of fat-soluble vitamins in cow milk by HPLC-MSn. The method was then
used to determine if there are significant differences in the fat-soluble vitamin
concentrations of milk sourced from cows fed different feeding regimes.
The specific objectives of this work are:
• Develop and validate a HPLC-MSn method for the determination of vitamin
D3 in cow milk.
• Develop and validate a HPLC-MSn method for the simultaneous determination
of vitamins A (all trans-retinol), E (α-tocopherol), and β-carotene in cow milk.
• Compare these results with those obtained using HPLC with Fluorescence (Fl)
and/or Photodiode array (PDA) detection (vitamins A, E and β-carotene) and
HPLC-MS/MS (vitamin D3).
• Determine the levels of these vitamins and β-carotene in milk samples sourced
from a dairy cow feeding systems experiment conducted at the Department of
Primary Industries (DPI), Ellinbank, Victoria.
• Assess whether there is any significant difference in fat-soluble vitamin and β-
carotene concentrations in the milk resulting from the different feeding
regimes.
102
6.2. Summary of major findings.
6.2.1. Vitamin D3
A straight forward, robust HPLC-MSn method for determining the levels of vitamin
D3 in fresh cow’s milk, commercially available fortified and non-fortified cow’s milk
and infant formula has been developed. A HPLC-MS/MS method was developed
simultaneously and found to produce comparable results. The LOQ were 0.01 µg/100
ml and 0.02 µg/100 ml for HPLC-MSn and HPLC-MS/MS respectively. Recoveries
of vitamin D3 added to the samples prior to saponification were satisfactory (60-90%).
25-hydroxyvitamin D3 could also be determined in fresh milk samples using this
procedure, although the extraction conditions were not fully optimized for this
compound and so it gave lower recoveries. Isotopically labelled internal standards
were used to correct for any quantitative variations caused by ion suppression or ion
enhancement in the ion source.
Despite using compound-specific precursor and fragment ions, the analysis of milk
samples still produced numerous interfering endogenous peaks, thus the choice of
HPLC conditions, such as the choice of HPLC column, mobile phase and flow rate
was important to achieve chromatographic separation of the analytes from any
potential interferences. A Varian Polaris C18-A column gave the best separation of
the analytes from major endogenous interferences, with the optimum elution
conditions being an isocratic mobile phase consisting of 92% methanol and 8% water
(and 5mM ammonium formate for HPLC-MS/MS).
Initial work using fortified and spiked unfortified milk samples showed that no
additional clean-up was required after the initial saponification and extraction when
the level of vitamin D3 in the milk was > 0.1 ug/100 ml. Non-fortified milk samples,
which had vitamin D3 levels below 0.1 ug/100 ml, required a solid-phase extraction
step to concentrate the extract and remove compounds which co-eluted with vitamin
D3.
For both HPLC-MS instruments, a number of injections of sample extract were
required to achieve a stable signal, particularly after cleaning the API interface. This
effect has been observed previously with nearly all HPLC-MS assays performed in
103
this laboratory, and it is assumed this phenomenon is due to an equilibration of the
API interface as it becomes coated in compounds from the sample matrix.
25-hydroxyvitamin D3 could also be measured in the samples using these methods.
The lower recoveries (30-40%) of 25-hydroxyvitamin D3 in comparison to vitamin D3
were largely due to the more polar nature of the metabolite. Improved recoveries of
the metabolite could have been achieved by extracting the samples with a more polar
solvent, however this was not pursued as the main focus of this work was vitamin D3.
6.2.2. Vitamins A, E and β-carotene
A straight forward, robust HPLC-MSn method for determining the levels of all trans-
retinol, α-tocopherol and β-carotene in cow milk was developed. The method was
validated using repeatability studies, duplicate analyses, recovery experiments,
proficiency study data and comparison with previously validated HPLC-UV/Vis and
HPLC-Fl procedures used in our laboratory. In contrast to the HPLC-MS methods for
vitamin D3, an internal standard was not used for this work as the expected levels of
all trans-retinol, α–tocopherol and all trans-β-carotene in milk (40 μg/ml, 200 μg/ml
and 30 μg/ml respectively) were sufficiently high enough to compensate for any
irregularities in the mass spectrometric detection.
The HPLC-MSn method was faster than using the two separate HPLC methods
(UV/Vis and Fl) and could also be used to provide mass data on other compounds
present in the extract, which could be useful for retrospective analysis of samples for
a new compound of interest or metabolomics studies. The method can also be used in
conjunction with the method for determining vitamin D3 in cow milk by HPLC-MSn.
Two other compounds were tentatively identified in the milk extracts. The compound
eluting at 24.5 min was assigned as 13 cis-β-carotene based on the mass spectral data
([M+H]+ m/z 537) and comparison of the UV/Vis spectra with literature spectra. The
concentration of this compound was estimated to be approximately 20% of the
concentration of all trans-β-carotene in the milk samples, based on HPLC-UV/Vis
data. The large unknown peak eluting at 14.27 min in the ion chromatogram had a
MS1 m/z of 369.35, corresponding to cholesterol, which forms the ion [M+H-H2O]+
when ionised by APCI in the positive ionisation mode. Cholesterol is a fat-soluble
compound which would be expected to be extracted using the conditions described in
104
this work. It is present in milk at approximately 14 mg/100 g, which is substantially
higher than the vitamins assayed in this work.
6.2.3. Feeding systems experiment
Milk samples were collected from a dairy cow feeding systems experiment conducted
at DPI Ellinbank. The milk samples analysed in this study were obtained from a short-
term feeding rate experiment designed to examine milk production response curves
for dairy cows fed different supplement regimes in addition to the traditional pasture-
based diet. The experiment was designed to mimic conditions of low pasture
availability and high supplement intake. These samples were analysed for all trans-
retinol, α-tocopherol and β-carotene using the HPLC-MSn method detailed in Chapter
4.
A reduction in the levels of β-carotene in milk were observed when cows were fed a
partial mixed ration instead of the usual practice of feeding grain during milking and
silage in the paddock along with the daily allocation of pasture. This was thought to
be due to a reduced consumption of pasture, which is the major source of β-carotene.
No difference between treatments was shown for α-tocopherol, however there was a
negative correlation between α-tocopherol and feeding rate for the PMR2 treatment.
This was due to substitution of pasture with supplement, compounded by a decrease
in milk fat concentration at higher feeding rates.
There was no significant difference between treatments for all trans-retinol in milk.
6.3. Application and implication of these results
The work presented in this thesis outlines an approach which could be used for the
analysis of a range of fat-soluble vitamins in milk using HPLC-MSn, the advantage of
this approach over the traditional approach of using HPLC-UV/Vis or Fl being the
ability to analyse a wider range of vitamins with a single sample preparation and
analysis, rather than needing to use separate HPLC methods for each vitamin. This
has the potential to simplify the process of fat-soluble vitamins analysis in milk,
reduce the number of instruments required and save significant amounts of time when
analysing the levels of multiple fat-soluble vitamins in milk.
105
Potentially the most significant time savings come from the analysis of vitamin D3 in
fortified milks, which is a very time-consuming analysis when using HPLC-UV/Vis
due to the need for multiple sample clean-up steps to remove chromatographic
interferences. In contrast, the use of HPLC-MSn allows a relatively simple sample
preparation as the mass spectrometer is able to detect vitamin D much more
selectively, thus avoiding any significant chromatographic interference for this
analysis.
Another benefit of using HPLC-MSn is the potential to identify other biologically
important compounds in the extract, such as other fat-soluble vitamers or lipophilic
substances such as phytosterols, by examining the appropriate m/z values from the full
scan MS1 data, or by setting up MS2 fragmentation protocols for the extra compounds
of interest before analysing samples.
When weighing up the cost/benefit of using the mass spectrometer for this analysis,
the significant time savings for the analyst could see a substantial reduction in the cost
of analysis, however a laboratory would need to factor in the much higher purchase
price of the mass spectrometer (approx. $400,000) compared to conventional HPLC
detectors (approx. $20,000) as well as the much higher running costs of the mass
spectrometer, which uses approximately 600 l/hr of high purity nitrogen (approx.
$5/1000 l), and also has greater servicing requirements.
The extraction method used in this thesis showed good extraction efficiency for a
range of fat-soluble vitamins and alteration of the extraction method was beyond the
scope of this project. However, in addition to the time efficiencies gained by the use
of the mass spectrometer as a HPLC detector for this analysis, it was possible that
further time efficiencies could be gained in the sample extraction step by adjustment
of the extraction protocol. For example the recent work of Gill, Zhu and Indyk (2016)
utilises a single extraction for the analysis of vitamin D3 and 25-hydroxyvitamin D3 in
cow milk and obtained good recoveries, although this work used stable isotopically
labelled standards added at the beginning of the sample preparation process, which
would correct for any losses during extraction so the absolute recoveries of these
vitamins from the milk is unclear.
106
6.4. Conclusions
In summary, the findings of this thesis are as follows:
A straight forward, robust HPLC-MSn method for determining the levels of vitamin
D3 in fresh cow’s milk, commercially available fortified and non-fortified cow’s milk
and infant formula has been developed. The method was validated using a
reproducibility study, recovery experiments, participation in a proficiency study and
comparison with an HPLC-MS/MS instrument.
A straight forward, robust method for determining the levels of all trans-retinol, α-
tocopherol and β-carotene in cow’s milk using HPLC-MSn has been developed. The
method was validated using repeatability studies, duplicate analyses, recovery
experiments, proficiency study data and comparison with previously validated HPLC-
UV/Vis and HPLC-Fl procedures.
The HPLC-MSn instrument repeatability for all trans-retinol, α-tocopherol and β-
carotene was similar to those for the traditional HPLC-UV/Vis (all trans-retinol and
β-carotene) and HPLC-Fl (α-tocopherol) instruments. Excellent correlation was
achieved between the levels of the analytes in milk determined by HPLC-MSn and the
levels determined by validated HPLC-UV/Vis and HPLC-Fl methods.
The levels of all trans-retinol, α-tocopherol and β-carotene were determined in milk
samples sourced from a dairy cow feeding systems experiment conducted at the
Department of Primary Industries, Ellinbank, Victoria. At the conclusion of the
feeding systems experiment, results showed no significant difference in all trans-
retinol or α-tocopherol levels between treatments, however α-tocopherol levels
decreased as the feeding rate of PMR2 increased. A reduction in the levels of β-
carotene in milk were observed when cows were fed a partial mixed ration instead of
the usual practice of feeding grain during milking and silage in the paddock along
with the daily allocation of pasture.
107
References
Abernethy, G. A. (2012). A rapid analytical method for cholecalciferol (vitamin D3) in fortified infant formula, milk and milk powder using Diels–Alder derivatisation and liquid chromatography–tandem mass spectrometric detection. Analytical and Bioanalytical Chemistry, 403, 1433-1440.
Adler, S. A., Dahl, A. V., Jensen, S. K., Thuen, E., Gustavsson, A. M., & Steinshamn, H. (2013). Fatty acid composition, fat-soluble vitamin concentrations and oxidative stability in bovine milk produced on two pastures with different botanical composition. Livestock Science, 154(1-3), 93-102.
Andrés, V., Villanueva, M. J., & Tenorio, M. D. (2014). Simultaneous determination of tocopherols, retinol, ester derivatives and β-carotene in milk- and soy-juice based beverages by HPLC with diode-array detection. LWT - Food Science
and Technology, 58, 557-562.
Aronov, P. A., Hall, L. M., Dettmer, K., Stephensen, C. B., & Hammock, B. D. (2008). Metabolic profiling of major vitamin D metabolites using Diels-Alder derivatization and ultra-performance liquid chromatography-tandem mass spectrometry. Analytical and Bioanalytical Chemistry, 391(5), 1917-1930.
Auldist, M. J., Marett, L. C., Greenwood, J. S., Hannah, M., Jacobs, J. L., & Wales, W. J. (2013). Effects of different strategies for feeding supplements on milk production responses in cows grazing a restricted pasture allowance. Journal
of dairy science, 96(2), 1218-1231.
Azevedo-Meleiro, C. H., & Rodriguez-Amaya, D. B. (2004). Original Article: Confirmation of the identity of the carotenoids of tropical fruits by HPLC-DAD and HPLC-MS. Journal of Food Composition and Analysis, 17, 385-396.
Baird, D. B. (1994). The design of experiments with covariates. PhD Thesis, University of Otago, North Dunedin, New Zealand.
Ball, G. F. M. (1998). Fat-soluble vitamin assays in food analysis. A comprehensive review. Essex: Elsevier Science Publishers Ltd.
Belitz, H. D., & Grosch, W. (1999). Food Chemistry (2nd ed.). Berlin: Springer-Verlag.
Bergamo, P., Fedele, E., Iannibelli, L., & Marzillo, G. (2003). Fat-soluble vitamin contents and fatty acid composition in organic and conventional Italian dairy products. Food Chemistry, 82(4), 625-631.
Bilodeau, L., Dufresne, G., Deeks, J., Clément, G., Bertrand, J., Turcotte, S., Robichaud, A., Beraldin, F., & Fouquet, A. (2011). Determination of vitamin D3 and 25-hydroxyvitamin D3 in foodstuffs by HPLC UV-DAD and LC–MS/MS. Journal of Food Composition and Analysis, 24, 441-448.
Blum, M., Dolnikowski, G., Seyoum, E., Harris, S. S., Booth, S. L., Peterson, J., Saltzman, E., & Dawson-Hughes, B. (2008). Vitamin D3 in fat tissue. Endocrine, 33(1), 90-94.
Bunt, M. (2010). Food proficiency testing program round 31-vitamins. Proficiency Testing Australia. In). Silverwater, NSW, Australia.
108
Burild, A., Lauridsen, C., Faqir, N., Sommer, H. M., & Jakobsen, J. (2016). Vitamin D 3 and 25-hydroxyvitamin D 3 in pork and their relationship to vitamin D status in pigs. Journal of nutritional science, 5.
Byrdwell, W. C. (2009). Comparison of analysis of vitamin D3 in foods using ultraviolet and mass spectrometric detection. Journal of Agricultural and
Food Chemistry, 57(6), 2135-2146.
Byrdwell, W. C., DeVries, J., Exler, J., Harnly, J. M., Holden, J. M., Holick, M. F., Hollis, B. W., Horst, R. L., Lada, M., Lemar, L. E., Patterson, K. Y., Philips, K. M., Tarrago-Trani, M. T., & Wolf, W. R. (2008). Analyzing vitamin D in foods and supplements: Methodologic challenges. American Journal of
Clinical Nutrition, 88(2).
Byrdwell, W. C., Harnly, J. M., Horst, R. L., Phillips, K. M., Holden, J. M., Patterson, K. Y., & Exler, J. (2013). Vitamin D levels in fish and shellfish determined by liquid chromatography with ultraviolet detection and mass spectrometry. Journal of Food Composition and Analysis, 30(2), 109-119.
Calderón, F., Chauveau-Duriot, B., Martin, B., Graulet, B., Doreau, M., & Nozière, P. (2007). Variations in carotenoids, vitamins A and E, and color in cow's plasma and milk during late pregnancy and the first three months of lactation. Journal
of dairy science, 90(5), 2335-2346.
Capote, F. P., Jiménez, J. R., Granados, J. M. M., & De Castro, M. D. L. (2007). Identification and determination of fat-soluble vitamins and metabolites in human serum by liquid chromatography/triple quadrupole mass spectrometry with multiple reaction monitoring. Rapid Communications in Mass
Spectrometry, 21(11), 1745-1754.
Chauveau-Duriot, B., Doreau, M., Nozière, P., & Graulet, B. (2010). Simultaneous quantification of carotenoids, retinol, and tocopherols in forages, bovine plasma, and milk: Validation of a novel UPLC method. Analytical and
Bioanalytical Chemistry, 397(2), 777-790.
Coultate, T. P. (2002). Food. The Chemistry of its Components. (4 ed.). Cambridge: The Royal Society of Chemistry.
Dairy Australia. (2016). Australian Dairy Industry In Focus 2015. Southbank, Australia: Dairy Australia Limited.
Dairy Australia. (2017). Industry information: Gippsland dairy region. Southbank, Australia: Dairy Australia Limited. Available at www.dairyaustralia.com.au.
Department of Primary Industries. (2007). Determination of fat soluble vitamins and carotenoids in food, feed and plant by HPLC with fluorescence and/or photodiode array detection. Werribee, Victoria: Department of Primary Industries.
Dimartino, G. (2007). Convenient analysis of vitamin D in cheese and other food matrixes by liquid chromatography/mass spectrometry. Journal of AOAC
International, 90(5), 1340-1345.
Dimartino, G. (2009). Simultaneous determination of cholecalciferol (vitamin D3) and ergocalciferol (vitamin D2) in foods by selected reaction monitoring. Journal of AOAC International, 92(2), 511-517.
109
Dixon, R., & Stockdale, C. (1999). Associative effects between forages and grains: consequences for feed utilization. Australian Journal of Agricultural
Research, 50, 757–773.
Eitenmiller, R. R., & Landen, W. O. (1999). Vitamin Analysis for the Health and Food Sciences. Boca Raton: CRC Press LLC.
Ellis, K. A., Monteiro, A., Innocent, G. T., Grove-White, D., Cripps, P., McLean, W. G., Howard, C. V., & Mihm, M. (2007). Investigation of the vitamins A and E and β-carotene content in milk from UK organic and conventional dairy farms. Journal of dairy research, 74, 484–491.
Fedele, E., & Bergamo, P. (2001). Protein and lipid oxidative stresses during cheese manufacture. Journal of Food Science, 66(7), 932-935.
Food Standards Australia New Zealand. (2014). AUSNUT 2011-2013 - Australian Food Composition Database. Canberra: FSANZ. Available at www.foodstandards.gov.au.
Gentili, A., & Caretti, F. (2011). Evaluation of a method based on liquid chromatography-diode array detector-tandem mass spectrometry for a rapid and comprehensive characterization of the fat-soluble vitamin and carotenoid profile of selected plant foods. Journal of Chromatography A, 1218, 684–697.
Gentili, A., Caretti, F., Bellante, S., Ventura, S., Canepari, S., & Curini, R. (2013). Comprehensive Profiling of Carotenoids and Fat-Soluble Vitamins in Milk from Different Animal Species by LC-DAD-MS/MS Hyphenation. Journal of
Agricultural and Food Chemistry, 61, 1628-1639.
Gill, B. D., Zhu, X., & Indyk, H. E. (2016). The determination of vitamin D3 and 25-hydroxyvitamin D3 in early lactation and seasonal bovine milk. International
Dairy Journal, 63, 29-34.
Gomes, F. P., Shaw, P. N., Whitfield, K., & Hewavitharana, A. K. (2015). Simultaneous quantitative analysis of eight vitamin D analogues in milk using liquid chromatography–tandem mass spectrometry. Analytica Chimica Acta,
891, 211-220.
Hampel, D., York, E. R., & Allen, L. H. (2012). Ultra-performance liquid chromatography tandem mass-spectrometry (UPLC-MS/MS) for the rapid, simultaneous analysis of thiamin, riboflavin, flavin adenine dinucleotide, nicotinamide and pyridoxal in human milk. Journal of Chromatography B:
Analytical Technologies in the Biomedical and Life Sciences, 903, 7-13.
Hart-Smith, G., & Blanksby, S. J. (2012). Mass Analysis. In 'Mass Spectrometry in Polymer Chemistry' 1st ed. (Eds, C. Barner-Kowollik, T. Gruendling, J. Falkenhagen & S. Weidner) (pp. 5-32). Weinheim: Wiley-VCH, Verlag GmbH & Co.
Havemose, M. S., Weisbjerg, M. R., Bredie, W. L. P., & Nielsen, J. H. (2004). Influence of feeding different types of roughage on the oxidative stability of milk. International Dairy Journal, 14, 563-570.
Hernández, F., Sancho, J. V., & Pozo, O. J. (2005). Critical review of the application of liquid chromatography/mass spectrometry to the determination of pesticide residues in biological samples. Analytical & Bioanalytical Chemistry, 382(4), 934-946.
110
Herrero-Barbudo, M. C., Granado-Lorencio, F., Blanco-Navarro, I., & Olmedilla-Alonso, B. (2005). Retinol, [alpha]- and [gamma]-tocopherol and carotenoids in natural and vitamin A- and E-fortified dairy products commercialized in Spain. International Dairy Journal, 15(5), 521-526.
Heudi, O., Trisconi, M. J., & Blake, C. J. (2004). Simultaneous quantification of Vitamins A, D3 and E in fortified infant formulae by liquid chromatography-mass spectrometry. Journal of Chromatography A, 1022(1-2), 115-123.
Higashi, T., Awada, D., & Shimada, K. (2001). Simultaneous determination of 25-hydroxyvitamin D2 and 25-hydroxyvitamin D3 in human plasma by liquid chromatography-tandem mass spectrometry employing derivatization with a Cookson-type reagent. Biological and Pharmaceutical Bulletin, 24(7), 738-743.
Holčapek, M., Jirásko, R., & Lísa, M. (2012). Recent developments in liquid chromatography-mass spectrometry and related techniques. Journal of
Chromatography A, 1259, 3-15.
Huang, M., Cadwallader, A. B., & Heltsley, R. (2014). Mechanism of error caused by isotope-labeled internal standard: accurate method for simultaneous measurement of vitamin D and pre-vitamin D by liquid chromatography/tandem mass spectrometry. Rapid Communications in Mass
Spectrometry, 28, 2101–2110.
Hulshof, P. J. M., van Roekel-Jansen, T., van de Bovenkamp, P., & West, C. E. (2006). Variation in retinol and carotenoid content of milk and milk products in The Netherlands. Journal of Food Composition and Analysis, 19(1), 67-75.
Jakobsen, J., & Saxholt, E. (2009). Vitamin D metabolites in bovine milk and butter. Journal of Food Composition and Analysis, In Press, Accepted Manuscript.
Jensen, R. G., & Robert, G. J. (1995). Fat-Soluble Vitamins in Bovine Milk. In 'Handbook of Milk Composition' (pp. 718-725). San Diego: Academic Press.
Kalman, A., Mujahid, C., Mottier, P., & Heudi, O. (2003). Determination of α-tocopherol in infant foods by liquid chromatography combined with atmospheric pressure chemical ionisation mass spectrometry. Rapid
Communications in Mass Spectrometry, 17(7), 723-727.
Kamao, M., Tsugawa, N., Suhara, Y., & Okano, T. (2007). Determination of fat-soluble vitamins in human plasma, breast milk and food samples: Application in nutrition survey for establishment of "Dietary Reference Intakes for Japanese". Journal of Health Science, 53(3), 257-262.
Kamao, M., Tsugawa, N., Suhara, Y., Wada, A., Mori, T., Murata, K., Nishino, R., Ukita, T., Uenishi, K., Tanaka, K., & Okano, T. (2007). Quantification of fat-soluble vitamins in human breast milk by liquid chromatography-tandem mass spectrometry. Journal of Chromatography B: Analytical Technologies in the
Biomedical and Life Sciences, 859(2), 192-200.
Kardinaal, A. F., van't Veer, P., Kok, F., Ringstad, J., Gómez-Aracena, J., Mazaev, V., Kohlmeier, L., Martin, B., Aro, A., & Huttunen, J. (1993). Antioxidants in adipose tissue and risk of myocardial infarction: the EURAMIC study. The
Lancet, 342(8884), 1379-1384.
111
Kaushik, R., Sachdeva, B., Arora, S., & Wadhwa, B. K. (2014). Development of an analytical protocol for the estimation of vitamin D2 in fortified toned milk. Food Chemistry, 151, 225-230.
Krinsky, N. I., Landrum, J. T., & Bone, R. A. (2003). BIOLOGIC MECHANISMS OF THE PROTECTIVE ROLE OF LUTEIN AND ZEAXANTHIN IN THE EYE. Annual Review of Nutrition, 23(1), 171-201.
Kurmann, A., & Indyk, H. (1994). The endogenous vitamin D content of bovine milk: Influence of season. Food Chemistry, 50(1), 75-81.
Kwak, B. M., Jeong, I. S., Lee, M. S., Ahn, J. H., & Park, J. S. (2014). Analytical Methods: Rapid determination of vitamin D3 in milk-based infant formulas by liquid chromatography-tandem mass spectrometry. Food Chemistry, 165, 569-574.
Lam, V. K. M., Hung, R. C. T., Wong, E. L. M., Fok, J. Y. W., & Wong, Y. C. (2014). Single-laboratory validation of a method for the determination of vitamin D3 in dietary supplements by liquid chromatography with tandem mass spectrometry (LC-MS/MS). Journal of the Association of Official
Analytical Chemists International, 97(2), 403-408.
Lanina, S. A., Toledo, P., Sampels, S., Kamal-Eldin, A., & Jastrebova, J. A. (2007). Comparison of reversed-phase liquid chromatography-mass spectrometry with electrospray and atmospheric pressure chemical ionization for analysis of dietary tocopherols. Journal of Chromatography A, 1157(1-2), 159-170.
Liu, J., Greenfield, H., Strobel, N., & Fraser, D. R. (2013). The influence of latitude on the concentration of vitamin D3 and 25-hydroxy-vitamin D3 in Australian red meat. Food Chemistry, 140(3), 432-435.
Magalhaes, P. J., Carvalho, D. O., Guido, L. F., & Barros, A. A. (2007). Detection and quantification of provitamin D2 and vitamin D 2 in hop (Humulus lupulus L.) by liquid chromatography-diode array detection-electrospray ionization tandem mass spectrometry. Journal of Agricultural and Food Chemistry,
55(20), 7995-8002.
Manisali, I., Chen, D. D. Y., & Schneider, B. B. (2006). Electrospray ionization source geometry for mass spectrometry: Past, present, and future. TrAC -
Trends in Analytical Chemistry, 25(3), 243-256.
Marino, V. M., Schadt, I., Carpino, S., Caccamo, M., La Terra, S., Guardiano, C., & Licitra, G. (2014). Effect of Sicilian pasture feeding management on content of α-tocopherol and β-carotene in cow milk. Journal of dairy science, 97(1), 543-551.
Mattila, P. H., Piironen, V. I., Uusi-Rauva, E. J., & Koivistoinen, P. E. (1995). Contents of cholecalciferol, ergocalciferol, and their 25-hydroxylated metabolites in milk products and raw meat and liver as determined by HPLC. Journal of Agricultural and Food Chemistry, 43(9), 2394-2399.
Mitamura, K., Nambu, Y., Tanaka, M., Kawanishi, A., Kitahori, J., & Shimada, K. (1999). High-performance liquid chromatographic separation of vitamin D3 3-fatty acid esters and their liquid chromatography/mass spectrometry. Journal
of Liquid Chromatography and Related Technologies, 22(3), 367-377.
112
Mottier, P., Gremaud, E., Guy, P. A., & Turesky, R. J. (2002). Comparison of Gas Chromatography–Mass Spectrometry and Liquid Chromatography–Tandem Mass Spectrometry Methods to Quantify α-Tocopherol and α-Tocopherolquinone Levels in Human Plasma. Analytical Biochemistry,
301(1), 128.
National Association of Testing Authorities. (2013). Technical Note 17: Guidelines for the validation and verification of quantitative and qualitative test methods. Australia: National Association of Testing Authorities.
National Health and Medical Research Council. (2004). Australian Code of Practice for the Care and Use of Animals for Scientific Purposes (7th ed.). Canberra, Australia: Australian Government.
National Health and Medical Research Council. (2006). Nutrient Reference Values for Australia and New Zealand. Canberra, Australia: Australian Government.
Nimalaratne, C., Sun, C., Wu, J., Curtis, J. M., & Schieber, A. (2014). Quantification of selected fat soluble vitamins and carotenoids in infant formula and dietary supplements using fast liquid chromatography coupled with tandem mass spectrometry. Food Research International, 66, 69-77.
Nozière, P., Graulet, B., Lucas, A., Martin, B., Grolier, P., & Doreau, M. (2006). Carotenoids for ruminants: From forages to dairy products. Animal Feed
Science and Technology, 131(3-4), 418-450.
Nozière, P., Grolier, P., Durand, D., Ferlay, A., Pradel, P., & Martin, B. (2006). Variations in carotenoids, fat-soluble micronutrients, and color in cows' plasma and milk following changes in forage and feeding level. Journal of
dairy science, 89(7), 2634-2648.
Nyambaka, H., & Ryley, J. (1996). An isocratic reversed-phase HPLC separation of the stereoisomers of the provitamin A carotenoids (α- and β-carotene) in dark green vegetables. Food Chemistry, 55(1), 63-72.
Pellett, J., Lukulay, P., Mao, Y., Bowen, W., Reed, R., Ma, M., Munger, R., Dolan, J., Wrisley, L., Medwid, K., Toltl, N., Chan, C., Skibic, M., Biswas, K., Wells, K., & Snyder, L. (2006). "Orthogonal" separations for reversed-phase liquid chromatography. Journal of Chromatography A, 1101(1-2), 122-135.
Phenomenex Inc 2018. Luna HPLC information. www.phenomenex.com
Plozza, T., Trenerry, V. C., & Caridi, D. (2012). The simultaneous determination of vitamins A, E and β-carotene in bovine milk by high performance liquid chromatography-ion trap mass spectrometry (HPLC-MSn). Food Chemistry,
134(1), 559-563.
Plozza, T., Trenerry, V. C., Zeglinski, P., Nguyen, H., & Johnstone, P. (2011). The confirmation and quantification of selected aminoglycoside residues in animal tissue and bovine milk by liquid chromatography mass spectrometry. International Food Research Journal, 18(3), 59-66.
Quinto Tranchida, P., Dugo, P., Dugo, G., & Mondello, L. (2004). Comprehensive two-dimensional chromatography in food analysis. Journal of
Chromatography A, 1054, 3-16.
113
Raith, K., Brenner, C., Farwanah, H., Müller, G., Eder, K., & Neubert, R. H. H. (2005). A new LC/APCI-MS method for the determination of cholesterol oxidation products in food. Journal of Chromatography A, 1067(1-2), 207-211.
Rezanka, T., Olsovska, J., Sobotka, M., & Sigler, K. (2009). The use of APCI-MS with HPLC and other separation techniques for identification of carotenoids and related compounds. Current Analytical Chemistry, 5(1), 1-25.
Rivera, S. M., & Canela-Garayoa, R. (2012). Analytical tools for the analysis of carotenoids in diverse materials. Journal of Chromatography A, 1224, 1– 10.
Rochfort, S. J., Trenerry, V. C., Imsic, M., Panozzo, J., & Jones, R. (2008). Class targeted metabolomics: ESI ion trap screening methods for glucosinolates based on MSn fragmentation. Phytochemistry, 69(8), 1671-1679.
Sakurai, T., Furukawa, M., Asoh, M., KANNO, T., KOJIMA, T., & YONEKUBO, A. (2005). Fat-soluble and water-soluble vitamin contents of breast milk from Japanese women. Journal of Nutritional Science and Vitaminology, 51(4), 239-247.
Schadt, H. S., Gossl, R., Seibel, N., & Aebischer, C.-P. (2012). Quantification of vitamin D3 in feed, food, and pharmaceuticals using high-performance liquid chromatography/tandem mass spectrometry. Journal of the Association of
Official Analytical Chemists International, 95(5), 1487-1494.
Schurgers, L. J., Teunissen, K. J. F., Hamulyák, K., Knapen, M. H. J., Vik, H., & Vermeer, C. (2007). Vitamin K-containing dietary supplements: Comparison of synthetic vitamin K1 and natto-derived menaquinone-7. Blood, 109(8), 3279-3283.
Shimada, K., & Higashi, T. (2002). High-performance liquid chromatography/mass spectrometry of vitamin D compounds employing derivatization with Cookson-type reagents. Bunseki Kagaku, 51(7), 487-493.
Slots, T., Butler, G., Leifert, C., Kristensen, T., Skibsted, L. H., & Nielsen, J. H. (2009). Potentials to differentiate milk composition by different feeding strategies. Journal of dairy science, 92(5), 2057-2066.
Stahl, W., & Sies, H. (2005). Bioactivity and protective effects of natural carotenoids. Biochimica et Biophysica Acta (BBA)-Molecular Basis of Disease, 1740(2), 101-107.
Stanner, S., Hughes, J., Kelly, C., & Buttriss, J. (2004). A review of the epidemiological evidence for the ‘antioxidant hypothesis’. Public health
nutrition, 7(3), 407-422.
Stokvis, E., Rosing, H., & Beijnen, J. H. (2005). Stable isotopically labeled internal standards in quantitative bioanalysis using liquid chromatography/mass spectrometry: Necessity or not? Rapid Communications in Mass Spectrometry,
19(3), 401-407.
Strobel, N., Buddhadasa, S., Adorno, P., Stockham, K., & Greenfield, H. (2013). Vitamin D and 25-hydroxyvitamin D determination in meats by LC-IT-MS. Food Chemistry, 138(2-3), 1042-1047.
114
Su, Q., Rowley, K. G., & Balazs, N. D. H. (2002). Carotenoids: separation methods applicable to biological samples. Journal of Chromatography B, 781(1-2), 393-418.
Taylor, T. (2015). Choosing the right HPLC stationary phase. In LCGC North
America, vol. 33). Iselin, NJ: UBM Plc.
Thermo Electron Corporation. (2003). Finnigan LTQ Hardware Manual (97055-97013 Revison A). San Jose, California, USA: Technical Publications, Thermo Electron Corporation.
Trenerry, V. C., Plozza, T., Caridi, D., & Murphy, S. (2011). The determination of vitamin D3 in bovine milk by liquid chromatography mass spectrometry. Food
Chemistry, 125(4), 1314-1319.
Vinas, P., Bravo-Bravo, M., Lopez-Garcia, I., & Hernandez-Cordoba, M. (2013). Dispersive liquid-liquid microextraction for the determination of vitamins D and K in foods by liquid chromatography with diode-array and atmospheric pressure chemical ionization-mass spectrometry detection. Talanta, 115, 806–813.
Wales, W. J., & Doyle, P. T. (2003). Effect of grain and straw supplementation on marginal milk-production responses and rumen fermentation of cows grazing highly digestible subterranean clover pasture. Australian Journal of
Experimental Agriculture, 43(5), 467-474.
Wales, W. J., Marett, L. C., Greenwood, J. S., Wright, M. M., Thornhill, J. B., Jacobs, J. L., Ho, C. K. M., & Auldist, M. J. (2013). Use of partial mixed rations in pasture-based dairying in temperate regions of Australia. Animal Production
Science, 53(11), 1167-1178.
Weber, P. (2001). Vitamin K and bone health. Nutrition, 17(10), 880-887.
Willoughby, R., Sheehan, E, Mitrovich, S. (2002). A Global View of LC/MS (2 ed.). Pittsburgh: Global View Publishing.
Wong, V., & Shalliker, R. (2004). Isolation of the active constituents in natural materials by 'heart-cutting' isocratic reversed-phase two-dimensional liquid chromatography. Journal of Chromatography A, 1036, 15-24.
Zhang, P., Rose, G., & Trenerry, V. C. (2009). Advances in pesticide monitoring: The impact of liquid chromatography- tandem mass spectrometry on the Victorian Produce Monitoring Program. Food Australia, 61(4), 137-141.
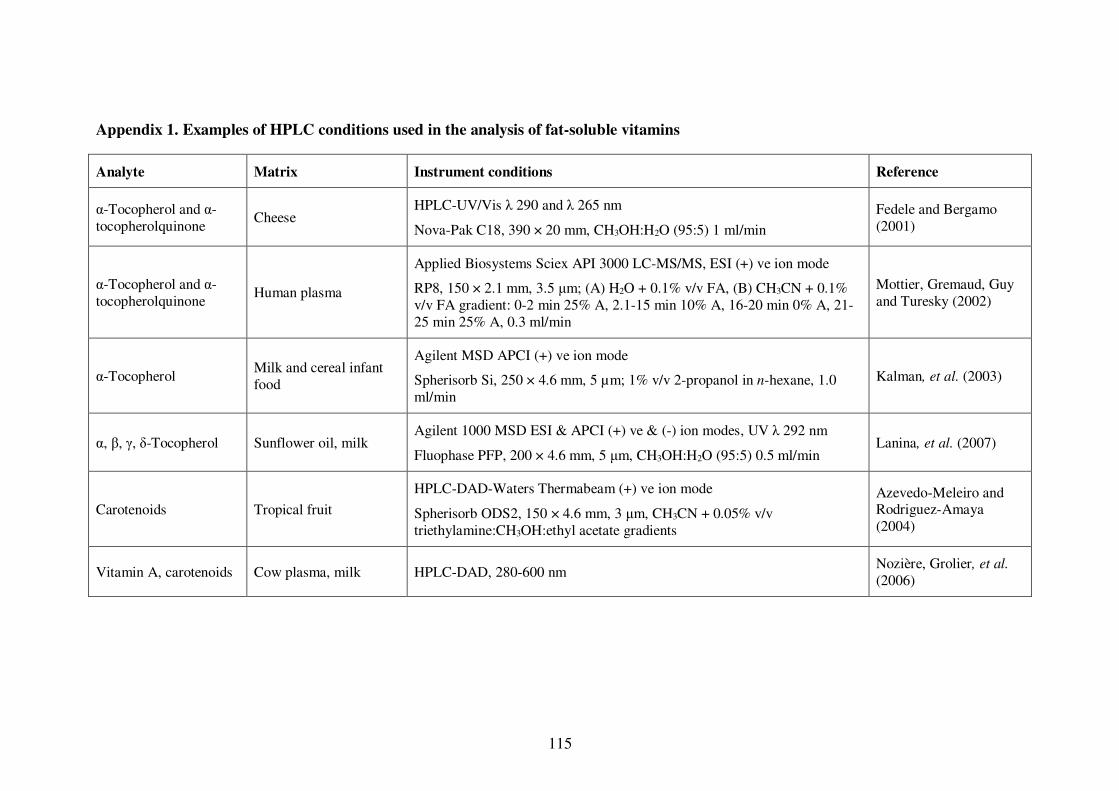
115
Appendix 1. Examples of HPLC conditions used in the analysis of fat-soluble vitamins
Analyte Matrix Instrument conditions Reference
α-Tocopherol and α-tocopherolquinone
Cheese HPLC-UV/Vis λ 290 and λ 265 nm
Nova-Pak C18, 390 × 20 mm, CH3OH:H2O (95:5) 1 ml/min
Fedele and Bergamo (2001)
α-Tocopherol and α-tocopherolquinone
Human plasma
Applied Biosystems Sciex API 3000 LC-MS/MS, ESI (+) ve ion mode
RP8, 150 × 2.1 mm, 3.5 μm; (A) H2O + 0.1% v/v FA, (B) CH3CN + 0.1% v/v FA gradient: 0-2 min 25% A, 2.1-15 min 10% A, 16-20 min 0% A, 21-25 min 25% A, 0.3 ml/min
Mottier, Gremaud, Guy and Turesky (2002)
α-Tocopherol Milk and cereal infant food
Agilent MSD APCI (+) ve ion mode
Spherisorb Si, 250 × 4.6 mm, 5 µm; 1% v/v 2-propanol in n-hexane, 1.0 ml/min
Kalman, et al. (2003)
α, β, γ, δ-Tocopherol Sunflower oil, milk Agilent 1000 MSD ESI & APCI (+) ve & (-) ion modes, UV λ 292 nm
Fluophase PFP, 200 × 4.6 mm, 5 μm, CH3OH:H2O (95:5) 0.5 ml/min Lanina, et al. (2007)
Carotenoids Tropical fruit
HPLC-DAD-Waters Thermabeam (+) ve ion mode
Spherisorb ODS2, 150 × 4.6 mm, 3 μm, CH3CN + 0.05% v/v triethylamine:CH3OH:ethyl acetate gradients
Azevedo-Meleiro and Rodriguez-Amaya (2004)
Vitamin A, carotenoids Cow plasma, milk HPLC-DAD, 280-600 nm Nozière, Grolier, et al. (2006)
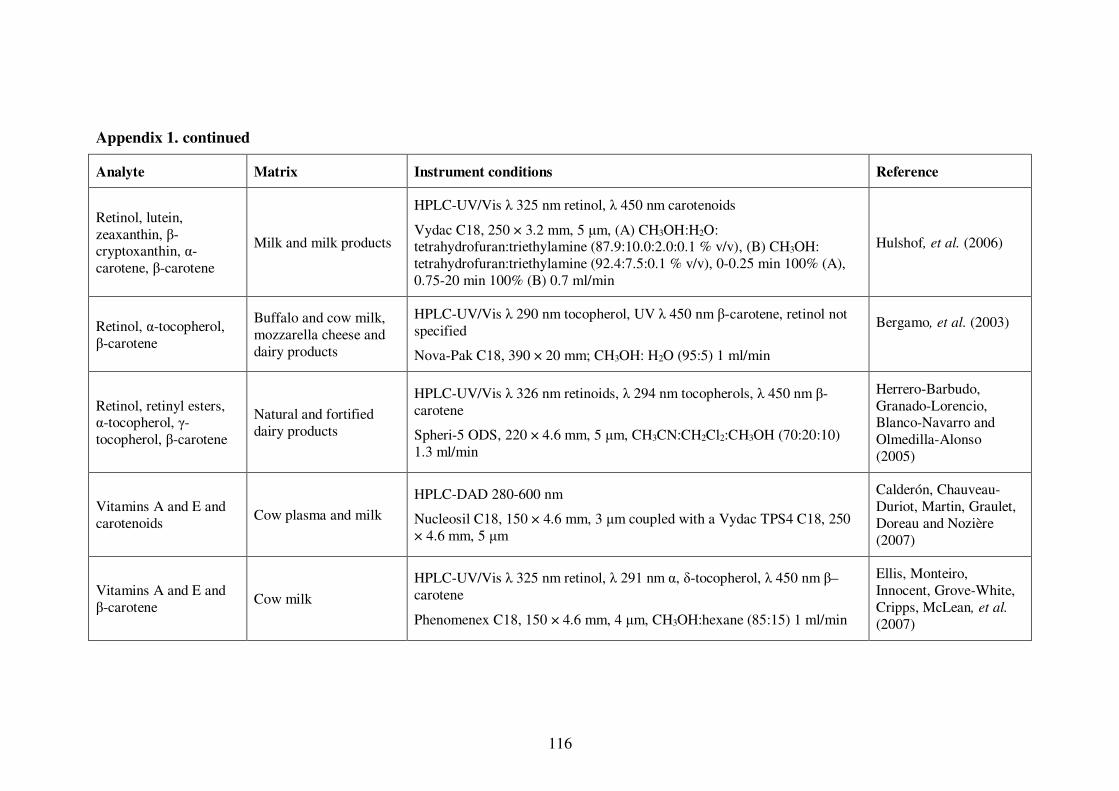
116
Appendix 1. continued
Analyte Matrix Instrument conditions Reference
Retinol, lutein, zeaxanthin, β-cryptoxanthin, α-carotene, β-carotene
Milk and milk products
HPLC-UV/Vis λ 325 nm retinol, λ 450 nm carotenoids
Vydac C18, 250 × 3.2 mm, 5 μm, (A) CH3OH:H2O: tetrahydrofuran:triethylamine (87.9:10.0:2.0:0.1 % v/v), (B) CH3OH: tetrahydrofuran:triethylamine (92.4:7.5:0.1 % v/v), 0-0.25 min 100% (A), 0.75-20 min 100% (B) 0.7 ml/min
Hulshof, et al. (2006)
Retinol, α-tocopherol, β-carotene
Buffalo and cow milk, mozzarella cheese and dairy products
HPLC-UV/Vis λ 290 nm tocopherol, UV λ 450 nm β-carotene, retinol not specified
Nova-Pak C18, 390 × 20 mm; CH3OH: H2O (95:5) 1 ml/min
Bergamo, et al. (2003)
Retinol, retinyl esters, α-tocopherol, γ-tocopherol, β-carotene
Natural and fortified dairy products
HPLC-UV/Vis λ 326 nm retinoids, λ 294 nm tocopherols, λ 450 nm β-carotene
Spheri-5 ODS, 220 × 4.6 mm, 5 μm, CH3CN:CH2Cl2:CH3OH (70:20:10) 1.3 ml/min
Herrero-Barbudo, Granado-Lorencio, Blanco-Navarro and Olmedilla-Alonso (2005)
Vitamins A and E and carotenoids
Cow plasma and milk
HPLC-DAD 280-600 nm
Nucleosil C18, 150 × 4.6 mm, 3 μm coupled with a Vydac TPS4 C18, 250 × 4.6 mm, 5 μm
Calderón, Chauveau-Duriot, Martin, Graulet, Doreau and Nozière (2007)
Vitamins A and E and β-carotene
Cow milk
HPLC-UV/Vis λ 325 nm retinol, λ 291 nm α, δ-tocopherol, λ 450 nm β–carotene
Phenomenex C18, 150 × 4.6 mm, 4 μm, CH3OH:hexane (85:15) 1 ml/min
Ellis, Monteiro, Innocent, Grove-White, Cripps, McLean, et al. (2007)
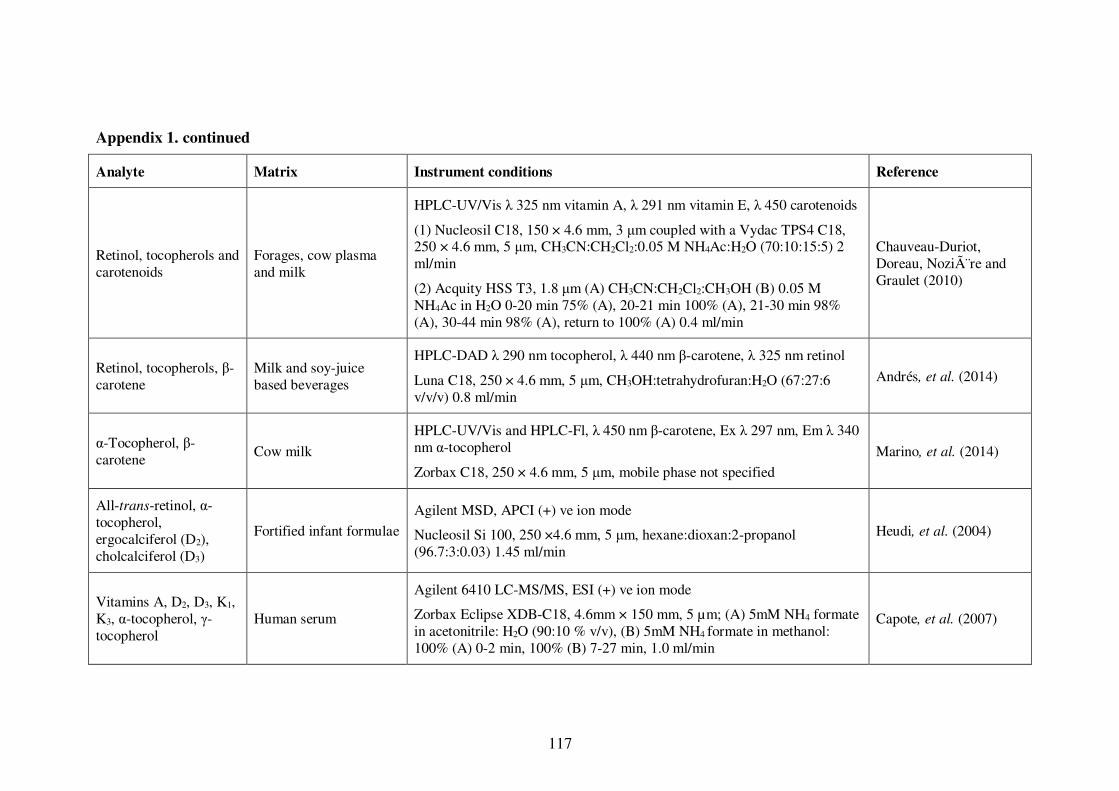
117
Appendix 1. continued
Analyte Matrix Instrument conditions Reference
Retinol, tocopherols and carotenoids
Forages, cow plasma and milk
HPLC-UV/Vis λ 325 nm vitamin A, λ 291 nm vitamin E, λ 450 carotenoids
(1) Nucleosil C18, 150 × 4.6 mm, 3 μm coupled with a Vydac TPS4 C18, 250 × 4.6 mm, 5 μm, CH3CN:CH2Cl2:0.05 M NH4Ac:H2O (70:10:15:5) 2 ml/min
(2) Acquity HSS T3, 1.8 μm (A) CH3CN:CH2Cl2:CH3OH (B) 0.05 M NH4Ac in H2O 0-20 min 75% (A), 20-21 min 100% (A), 21-30 min 98% (A), 30-44 min 98% (A), return to 100% (A) 0.4 ml/min
Chauveau-Duriot, Doreau, Nozière and Graulet (2010)
Retinol, tocopherols, β-carotene
Milk and soy-juice based beverages
HPLC-DAD λ 290 nm tocopherol, λ 440 nm β-carotene, λ 325 nm retinol
Luna C18, 250 × 4.6 mm, 5 μm, CH3OH:tetrahydrofuran:H2O (67:27:6 v/v/v) 0.8 ml/min
Andrés, et al. (2014)
α-Tocopherol, β-carotene
Cow milk
HPLC-UV/Vis and HPLC-Fl, λ 450 nm β-carotene, Ex λ 297 nm, Em λ 340 nm α-tocopherol
Zorbax C18, 250 × 4.6 mm, 5 μm, mobile phase not specified
Marino, et al. (2014)
All-trans-retinol, α-tocopherol, ergocalciferol (D2), cholcalciferol (D3)
Fortified infant formulae
Agilent MSD, APCI (+) ve ion mode
Nucleosil Si 100, 250 ×4.6 mm, 5 μm, hexane:dioxan:2-propanol (96.7:3:0.03) 1.45 ml/min
Heudi, et al. (2004)
Vitamins A, D2, D3, K1, K3, α-tocopherol, γ-tocopherol
Human serum
Agilent 6410 LC-MS/MS, ESI (+) ve ion mode
Zorbax Eclipse XDB-C18, 4.6mm × 150 mm, 5 µm; (A) 5mM NH4 formate in acetonitrile: H2O (90:10 % v/v), (B) 5mM NH4 formate in methanol: 100% (A) 0-2 min, 100% (B) 7-27 min, 1.0 ml/min
Capote, et al. (2007)
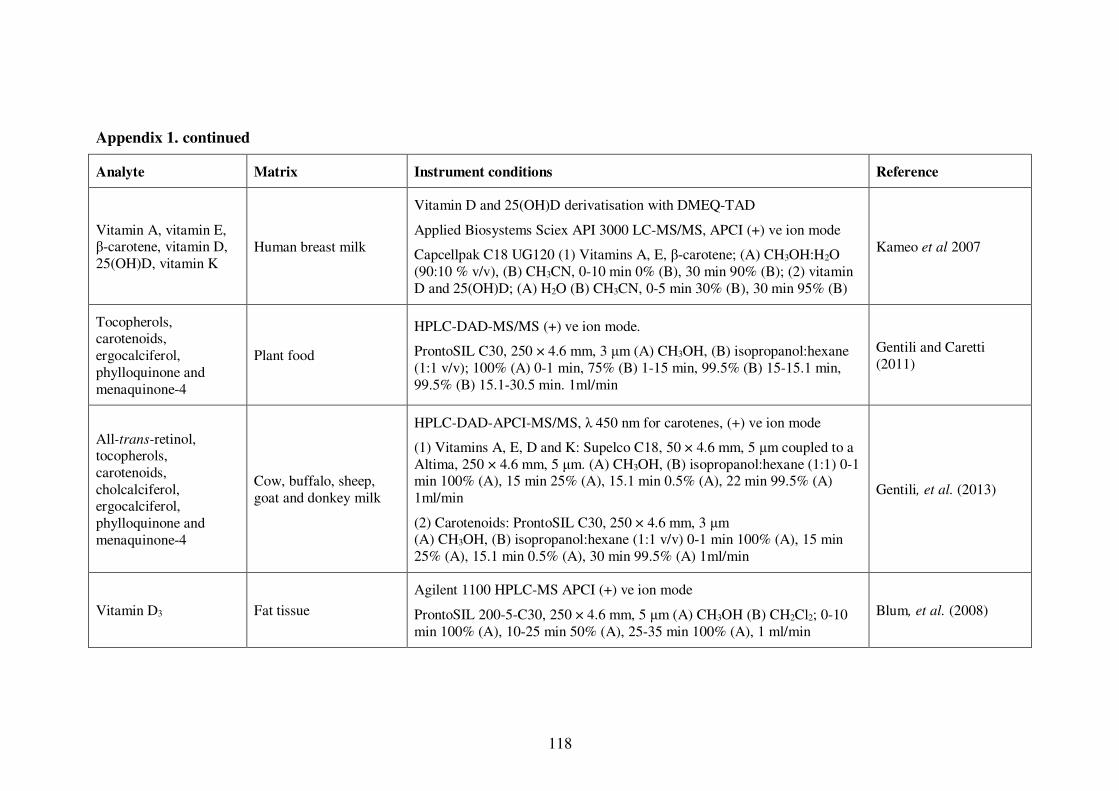
118
Appendix 1. continued
Analyte Matrix Instrument conditions Reference
Vitamin A, vitamin E, β-carotene, vitamin D, 25(OH)D, vitamin K
Human breast milk
Vitamin D and 25(OH)D derivatisation with DMEQ-TAD
Applied Biosystems Sciex API 3000 LC-MS/MS, APCI (+) ve ion mode
Capcellpak C18 UG120 (1) Vitamins A, E, β-carotene; (A) CH3OH:H2O (90:10 % v/v), (B) CH3CN, 0-10 min 0% (B), 30 min 90% (B); (2) vitamin D and 25(OH)D; (A) H2O (B) CH3CN, 0-5 min 30% (B), 30 min 95% (B)
Kameo et al 2007
Tocopherols, carotenoids, ergocalciferol, phylloquinone and menaquinone-4
Plant food
HPLC-DAD-MS/MS (+) ve ion mode.
ProntoSIL C30, 250 × 4.6 mm, 3 μm (A) CH3OH, (B) isopropanol:hexane (1:1 v/v); 100% (A) 0-1 min, 75% (B) 1-15 min, 99.5% (B) 15-15.1 min, 99.5% (B) 15.1-30.5 min. 1ml/min
Gentili and Caretti (2011)
All-trans-retinol, tocopherols, carotenoids, cholcalciferol, ergocalciferol, phylloquinone and menaquinone-4
Cow, buffalo, sheep, goat and donkey milk
HPLC-DAD-APCI-MS/MS, λ 450 nm for carotenes, (+) ve ion mode
(1) Vitamins A, E, D and K: Supelco C18, 50 × 4.6 mm, 5 μm coupled to a Altima, 250 × 4.6 mm, 5 μm. (A) CH3OH, (B) isopropanol:hexane (1:1) 0-1 min 100% (A), 15 min 25% (A), 15.1 min 0.5% (A), 22 min 99.5% (A) 1ml/min
(2) Carotenoids: ProntoSIL C30, 250 × 4.6 mm, 3 μm (A) CH3OH, (B) isopropanol:hexane (1:1 v/v) 0-1 min 100% (A), 15 min 25% (A), 15.1 min 0.5% (A), 30 min 99.5% (A) 1ml/min
Gentili, et al. (2013)
Vitamin D3 Fat tissue
Agilent 1100 HPLC-MS APCI (+) ve ion mode
ProntoSIL 200-5-C30, 250 × 4.6 mm, 5 μm (A) CH3OH (B) CH2Cl2; 0-10 min 100% (A), 10-25 min 50% (A), 25-35 min 100% (A), 1 ml/min
Blum, et al. (2008)
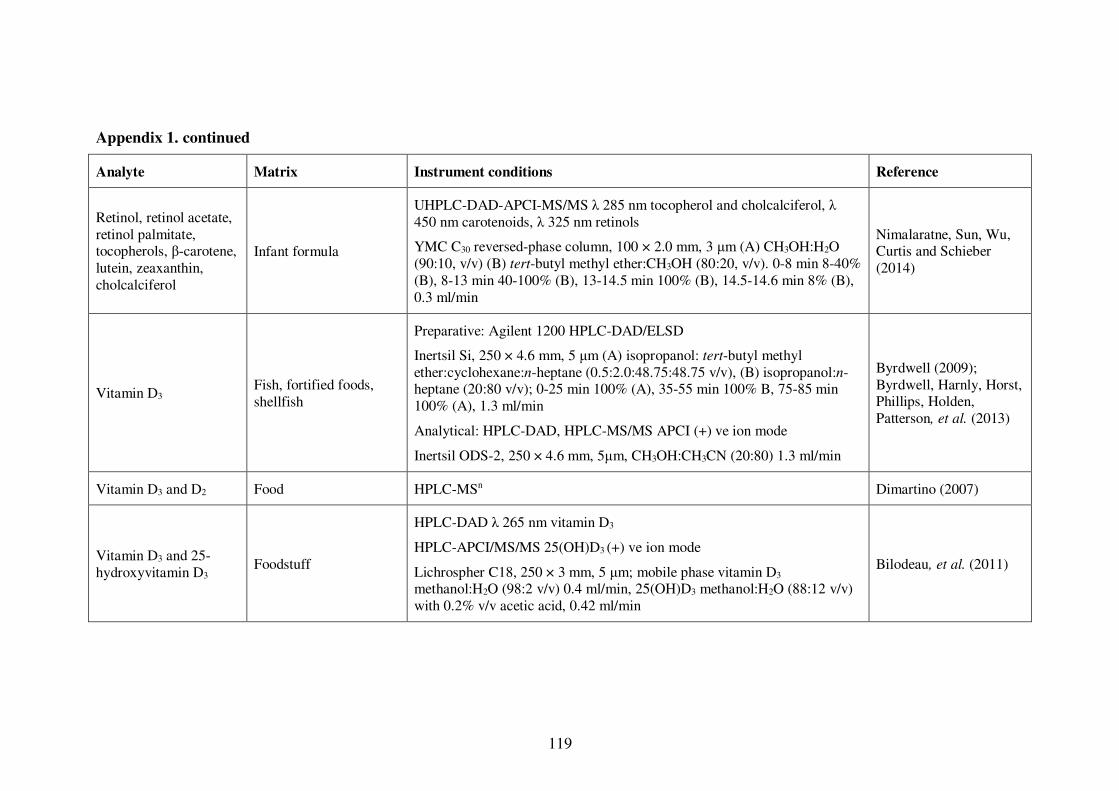
119
Appendix 1. continued
Analyte Matrix Instrument conditions Reference
Retinol, retinol acetate, retinol palmitate, tocopherols, β-carotene, lutein, zeaxanthin, cholcalciferol
Infant formula
UHPLC-DAD-APCI-MS/MS λ 285 nm tocopherol and cholcalciferol, λ 450 nm carotenoids, λ 325 nm retinols
YMC C30 reversed-phase column, 100 × 2.0 mm, 3 μm (A) CH3OH:H2O (90:10, v/v) (B) tert-butyl methyl ether:CH3OH (80:20, v/v). 0-8 min 8-40% (B), 8-13 min 40-100% (B), 13-14.5 min 100% (B), 14.5-14.6 min 8% (B), 0.3 ml/min
Nimalaratne, Sun, Wu, Curtis and Schieber (2014)
Vitamin D3 Fish, fortified foods, shellfish
Preparative: Agilent 1200 HPLC-DAD/ELSD
Inertsil Si, 250 × 4.6 mm, 5 μm (A) isopropanol: tert-butyl methyl ether:cyclohexane:n-heptane (0.5:2.0:48.75:48.75 v/v), (B) isopropanol:n-heptane (20:80 v/v); 0-25 min 100% (A), 35-55 min 100% B, 75-85 min 100% (A), 1.3 ml/min
Analytical: HPLC-DAD, HPLC-MS/MS APCI (+) ve ion mode
Inertsil ODS-2, 250 × 4.6 mm, 5μm, CH3OH:CH3CN (20:80) 1.3 ml/min
Byrdwell (2009); Byrdwell, Harnly, Horst, Phillips, Holden, Patterson, et al. (2013)
Vitamin D3 and D2 Food HPLC-MSn Dimartino (2007)
Vitamin D3 and 25-hydroxyvitamin D3
Foodstuff
HPLC-DAD λ 265 nm vitamin D3
HPLC-APCI/MS/MS 25(OH)D3 (+) ve ion mode
Lichrospher C18, 250 × 3 mm, 5 μm; mobile phase vitamin D3 methanol:H2O (98:2 v/v) 0.4 ml/min, 25(OH)D3 methanol:H2O (88:12 v/v) with 0.2% v/v acetic acid, 0.42 ml/min
Bilodeau, et al. (2011)
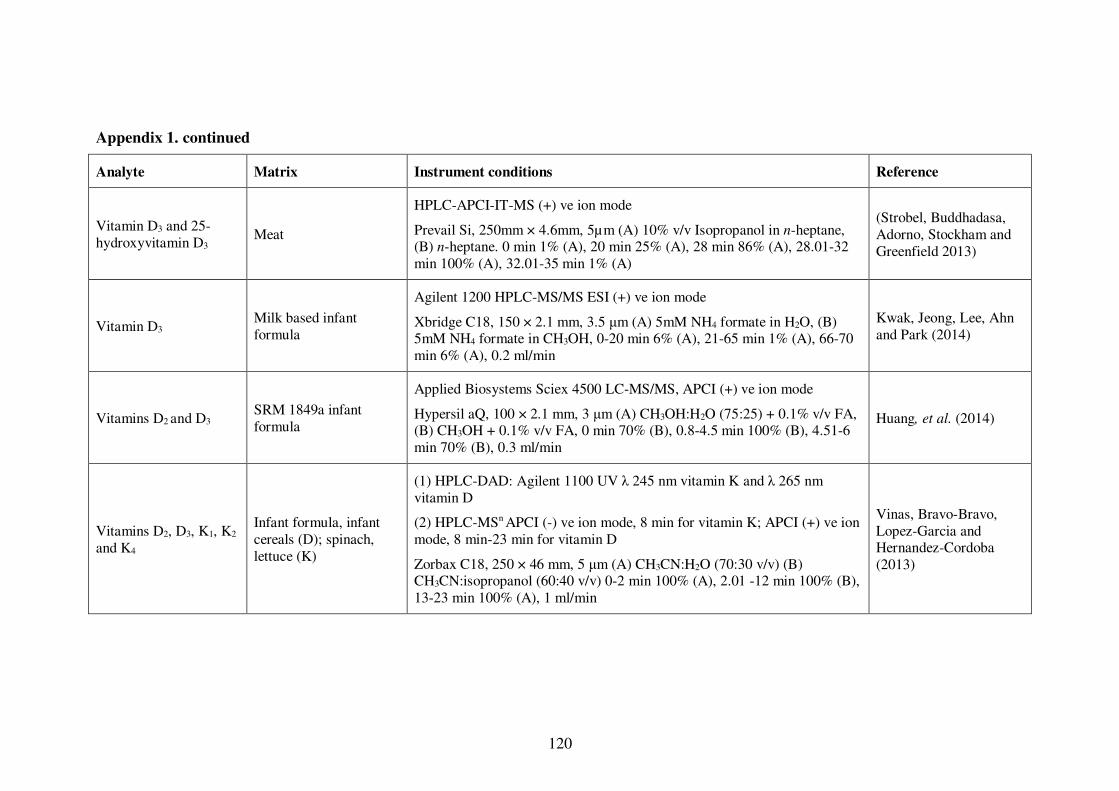
120
Appendix 1. continued
Analyte Matrix Instrument conditions Reference
Vitamin D3 and 25-hydroxyvitamin D3
Meat
HPLC-APCI-IT-MS (+) ve ion mode
Prevail Si, 250mm × 4.6mm, 5µm (A) 10% v/v Isopropanol in n-heptane, (B) n-heptane. 0 min 1% (A), 20 min 25% (A), 28 min 86% (A), 28.01-32 min 100% (A), 32.01-35 min 1% (A)
(Strobel, Buddhadasa, Adorno, Stockham and Greenfield 2013)
Vitamin D3 Milk based infant formula
Agilent 1200 HPLC-MS/MS ESI (+) ve ion mode
Xbridge C18, 150 × 2.1 mm, 3.5 μm (A) 5mM NH4 formate in H2O, (B) 5mM NH4 formate in CH3OH, 0-20 min 6% (A), 21-65 min 1% (A), 66-70 min 6% (A), 0.2 ml/min
Kwak, Jeong, Lee, Ahn and Park (2014)
Vitamins D2 and D3 SRM 1849a infant formula
Applied Biosystems Sciex 4500 LC-MS/MS, APCI (+) ve ion mode
Hypersil aQ, 100 × 2.1 mm, 3 μm (A) CH3OH:H2O (75:25) + 0.1% v/v FA, (B) CH3OH + 0.1% v/v FA, 0 min 70% (B), 0.8-4.5 min 100% (B), 4.51-6 min 70% (B), 0.3 ml/min
Huang, et al. (2014)
Vitamins D2, D3, K1, K2 and K4
Infant formula, infant cereals (D); spinach, lettuce (K)
(1) HPLC-DAD: Agilent 1100 UV λ 245 nm vitamin K and λ 265 nm vitamin D
(2) HPLC-MSn APCI (-) ve ion mode, 8 min for vitamin K; APCI (+) ve ion mode, 8 min-23 min for vitamin D
Zorbax C18, 250 × 46 mm, 5 μm (A) CH3CN:H2O (70:30 v/v) (B) CH3CN:isopropanol (60:40 v/v) 0-2 min 100% (A), 2.01 -12 min 100% (B), 13-23 min 100% (A), 1 ml/min
Vinas, Bravo-Bravo, Lopez-Garcia and Hernandez-Cordoba (2013)
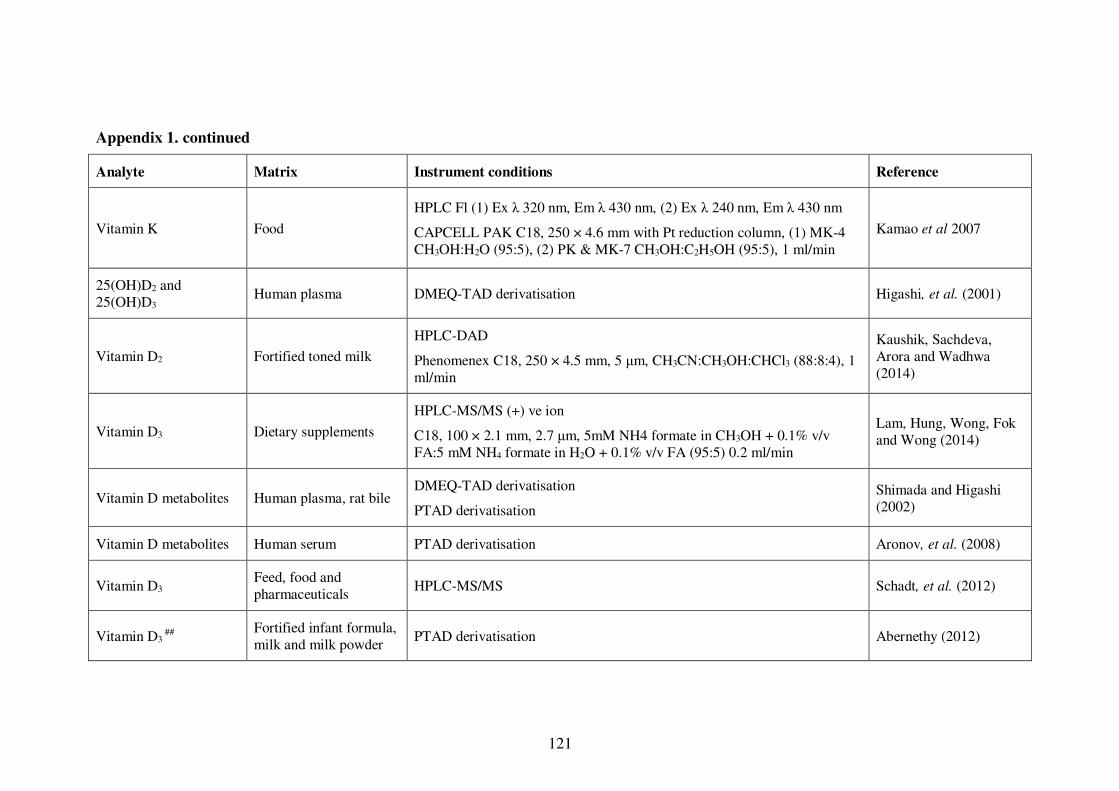
121
Appendix 1. continued
Analyte Matrix Instrument conditions Reference
Vitamin K Food
HPLC Fl (1) Ex λ 320 nm, Em λ 430 nm, (2) Ex λ 240 nm, Em λ 430 nm
CAPCELL PAK C18, 250 × 4.6 mm with Pt reduction column, (1) MK-4 CH3OH:H2O (95:5), (2) PK & MK-7 CH3OH:C2H5OH (95:5), 1 ml/min
Kamao et al 2007
25(OH)D2 and 25(OH)D3
Human plasma DMEQ-TAD derivatisation Higashi, et al. (2001)
Vitamin D2 Fortified toned milk
HPLC-DAD
Phenomenex C18, 250 × 4.5 mm, 5 μm, CH3CN:CH3OH:CHCl3 (88:8:4), 1 ml/min
Kaushik, Sachdeva, Arora and Wadhwa (2014)
Vitamin D3 Dietary supplements
HPLC-MS/MS (+) ve ion
C18, 100 × 2.1 mm, 2.7 μm, 5mM NH4 formate in CH3OH + 0.1% v/v FA:5 mM NH4 formate in H2O + 0.1% v/v FA (95:5) 0.2 ml/min
Lam, Hung, Wong, Fok and Wong (2014)
Vitamin D metabolites Human plasma, rat bile DMEQ-TAD derivatisation
PTAD derivatisation
Shimada and Higashi (2002)
Vitamin D metabolites Human serum PTAD derivatisation Aronov, et al. (2008)
Vitamin D3 Feed, food and pharmaceuticals
HPLC-MS/MS Schadt, et al. (2012)
Vitamin D3 ##
Fortified infant formula, milk and milk powder
PTAD derivatisation Abernethy (2012)
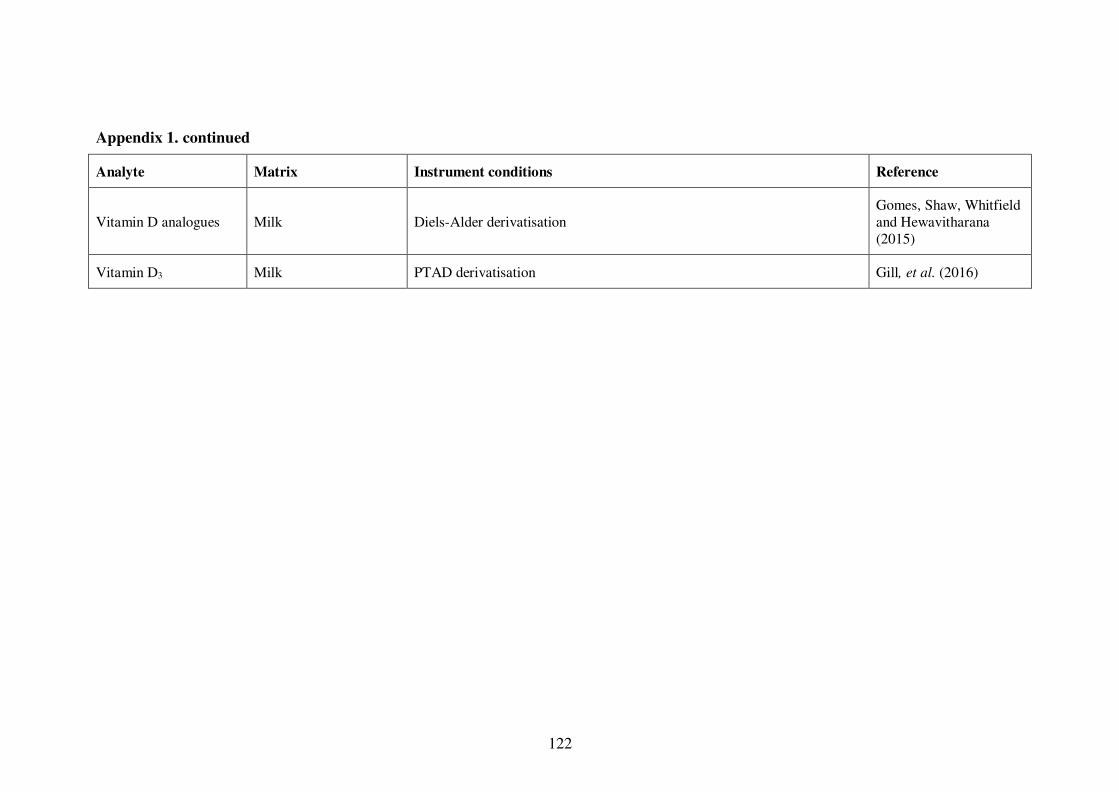
122
Appendix 1. continued
Analyte Matrix Instrument conditions Reference
Vitamin D analogues Milk Diels-Alder derivatisation Gomes, Shaw, Whitfield and Hewavitharana (2015)
Vitamin D3 Milk PTAD derivatisation Gill, et al. (2016)
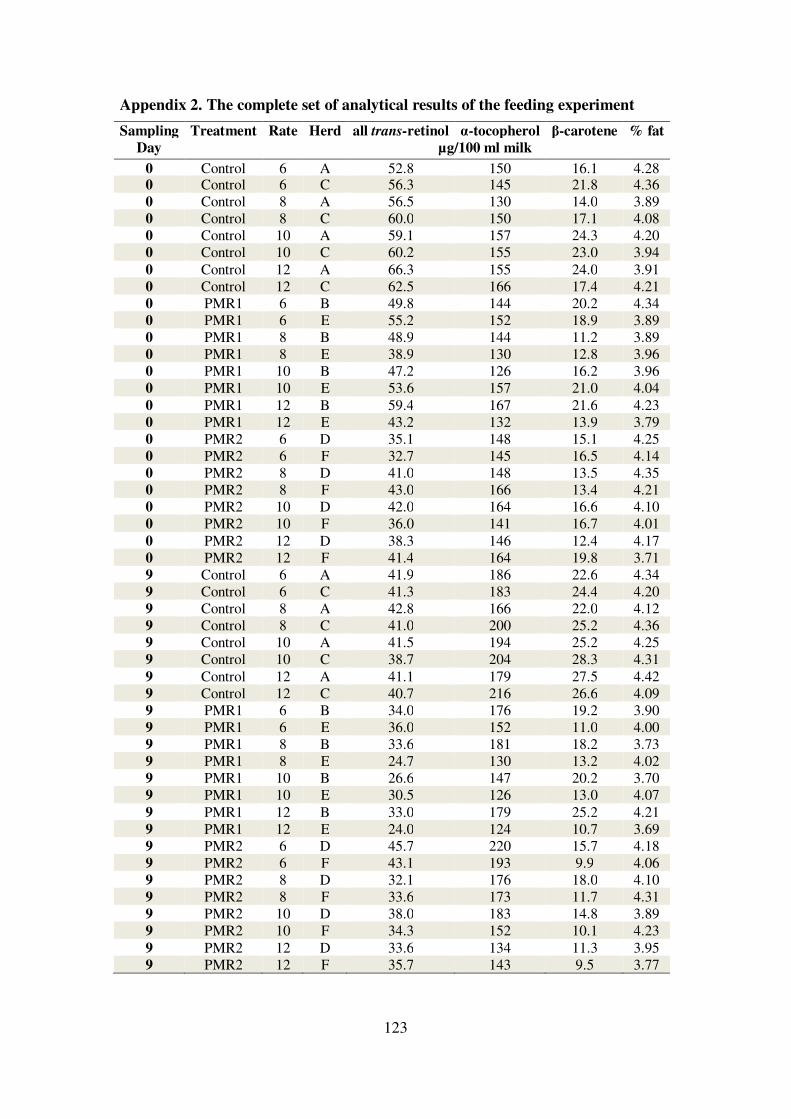
123
Appendix 2. The complete set of analytical results of the feeding experiment
Sampling Treatment Rate Herd all trans-retinol α-tocopherol β-carotene % fat
Day µg/100 ml milk
0 Control 6 A 52.8 150 16.1 4.28 0 Control 6 C 56.3 145 21.8 4.36 0 Control 8 A 56.5 130 14.0 3.89 0 Control 8 C 60.0 150 17.1 4.08 0 Control 10 A 59.1 157 24.3 4.20 0 Control 10 C 60.2 155 23.0 3.94 0 Control 12 A 66.3 155 24.0 3.91 0 Control 12 C 62.5 166 17.4 4.21 0 PMR1 6 B 49.8 144 20.2 4.34 0 PMR1 6 E 55.2 152 18.9 3.89 0 PMR1 8 B 48.9 144 11.2 3.89 0 PMR1 8 E 38.9 130 12.8 3.96 0 PMR1 10 B 47.2 126 16.2 3.96 0 PMR1 10 E 53.6 157 21.0 4.04 0 PMR1 12 B 59.4 167 21.6 4.23 0 PMR1 12 E 43.2 132 13.9 3.79 0 PMR2 6 D 35.1 148 15.1 4.25 0 PMR2 6 F 32.7 145 16.5 4.14 0 PMR2 8 D 41.0 148 13.5 4.35 0 PMR2 8 F 43.0 166 13.4 4.21 0 PMR2 10 D 42.0 164 16.6 4.10 0 PMR2 10 F 36.0 141 16.7 4.01 0 PMR2 12 D 38.3 146 12.4 4.17 0 PMR2 12 F 41.4 164 19.8 3.71 9 Control 6 A 41.9 186 22.6 4.34 9 Control 6 C 41.3 183 24.4 4.20 9 Control 8 A 42.8 166 22.0 4.12 9 Control 8 C 41.0 200 25.2 4.36 9 Control 10 A 41.5 194 25.2 4.25 9 Control 10 C 38.7 204 28.3 4.31 9 Control 12 A 41.1 179 27.5 4.42 9 Control 12 C 40.7 216 26.6 4.09 9 PMR1 6 B 34.0 176 19.2 3.90 9 PMR1 6 E 36.0 152 11.0 4.00 9 PMR1 8 B 33.6 181 18.2 3.73 9 PMR1 8 E 24.7 130 13.2 4.02 9 PMR1 10 B 26.6 147 20.2 3.70 9 PMR1 10 E 30.5 126 13.0 4.07 9 PMR1 12 B 33.0 179 25.2 4.21 9 PMR1 12 E 24.0 124 10.7 3.69 9 PMR2 6 D 45.7 220 15.7 4.18 9 PMR2 6 F 43.1 193 9.9 4.06 9 PMR2 8 D 32.1 176 18.0 4.10 9 PMR2 8 F 33.6 173 11.7 4.31 9 PMR2 10 D 38.0 183 14.8 3.89 9 PMR2 10 F 34.3 152 10.1 4.23 9 PMR2 12 D 33.6 134 11.3 3.95 9 PMR2 12 F 35.7 143 9.5 3.77

124
Appendix 2. continued Sampling Treatment Rate Herd all trans-retinol α-tocopherol β-carotene % fat
Day µg/100 ml milk 23 Control 6 A 42.9 197 16.8 4.21 23 Control 6 C 41.6 177 18.7 4.14 23 Control 8 A 45.4 163 15.2 4.18 23 Control 8 C 40.7 185 9.7 4.16 23 Control 10 A 39.5 177 16.7 4.44 23 Control 10 C 47.2 177 14.9 4.14 23 Control 12 A 40.1 166 17.9 4.37 23 Control 12 C 44.2 194 18.0 4.37 23 PMR1 6 B 38.5 174 13.2 4.41 23 PMR1 6 E 51.3 198 11.6 4.34 23 PMR1 8 B 31.1 130 8.9 4.28 23 PMR1 8 E 40.1 203 12.1 4.62 23 PMR1 10 B 37.6 149 10.6 3.97 23 PMR1 10 E 39.4 159 9.7 4.21 23 PMR1 12 B 43.3 163 17.1 3.59 23 PMR1 12 E 27.9 111 6.7 3.41 23 PMR2 6 D 42.9 181 10.5 4.27 23 PMR2 6 F 49.7 196 10.9 4.24 23 PMR2 8 D 52.6 211 12.0 4.37 23 PMR2 8 F 46.7 195 10.7 4.33 23 PMR2 10 D 33.1 149 8.1 4.14 23 PMR2 10 F 46.3 170 9.3 4.30 23 PMR2 12 D 34.8 137 6.9 4.16 23 PMR2 12 F 40.0 155 8.4 3.98