Determination of protein composition in milk by mid ... · 6 main milk proteins. α. s1-Casein. ......
23
Determination of protein composition in milk by mid-infrared spectrometry M. Ferrand 1 , G. Miranda 2 , H. Larroque 4 , S. Guisnel 1 , O. Leray 5 , F. Lahalle 1,3 , M. Brochard 1 , P. Martin 2 (1) Institut de l’Elevage (2) INRA GABI (3) CNIEL (4) INRA SAGA (5) Actilait
-
Upload
dangkhuong -
Category
Documents
-
view
222 -
download
0
Transcript of Determination of protein composition in milk by mid ... · 6 main milk proteins. α. s1-Casein. ......

Determination of protein composition in milk by mid-infrared spectrometry
M. Ferrand1, G. Miranda2, H. Larroque4, S. Guisnel1,O. Leray5, F. Lahalle1,3,M. Brochard1, P. Martin2
(1) Institut de l’Elevage(2) INRA GABI(3) CNIEL(4) INRA SAGA(5) Actilait

Outline
Context and motivationsMaterials and methodsResultsConclusions and perspectives
ICAR - 28/05/2012 2

3
Context
Milk = complex product with a lot of components
nutritional intereststechnological properties
no cheap and large scale easy to use method to measure all milk components
ICAR - 28/05/2012

4
PhénoFinlait: aims
Develop and control methods to analyze fine milk composition easily
Use the analytical development to - study genetic and feeding management impact on milk composition- build up new tools to manage milk composition (Dairy Herd Improvement (DHI) and genomic)
ICAR - 28/05/2012

Outline
Context and motivationsMaterials and methodsResultsConclusions and perspectives
5

6
Major milk proteins
6 main milk proteinsαs1-Caseinαs2-Caseinβ-Caseinκ-Casein
β-Lactoglobulin (β-LG)α-Lactalbumin (α-LA)
Caseins (ca. 80%)
whey proteins (ca. 20%)
ICAR - 28/05/2012
Reference method (Miranda et al.)
Need to establish a reference method to identify and quantify major milk proteins:
Liquid Chromatography + Mass Spectrometry (LC-MS)
Creation of a database of masses including geneticvariants, splicing variants, post-translationalmodifications and main proteolysis products.
7ICAR - 28/05/2012
Bovine: 3000 referenced masses Ovine: 1700 referenced masses
Présentateur
Commentaires de présentation
.

κ-VarA_2P
α S2‐VarA_
8‐12
P
α‐Lac
α S1-VarT194_8-10P
β‐Lg‐VarB
β‐Lg‐VarAβ-VarA_3-6P
8P9P
10P
11P
8P 9P
10P
11P
Splicing variantαs2‐var A (del 34‐42)Exon 6 ‐ skipping
25620.181812P24546.0377
αs2‐var A
LC-MS milkproteins profiling
UV 214nmEIC 600‐3000 Da
Ovine milk
Bovine milk: 25 molecules identified
5 κ‐Cn isoforms (1 to 3 glycosylation motifs)2 κ‐Cn isoforms (phosphorylation levels)5 αs2‐Cn isoforms (phosphorylation levels)2 αs1 and β‐Cn isoforms (phosphorylation)1 αs1‐Cn splicing variant (Del Q78) 2 β‐Lactoglobulin genetic variants 1 α‐Lactalbumin genetic variant 5 β‐Cn fragments (γ‐Cn and complementaryfragments arising from plasmin proteolysis)
Multicharged ions spectrum
Deconvolution
RP‐HPLC
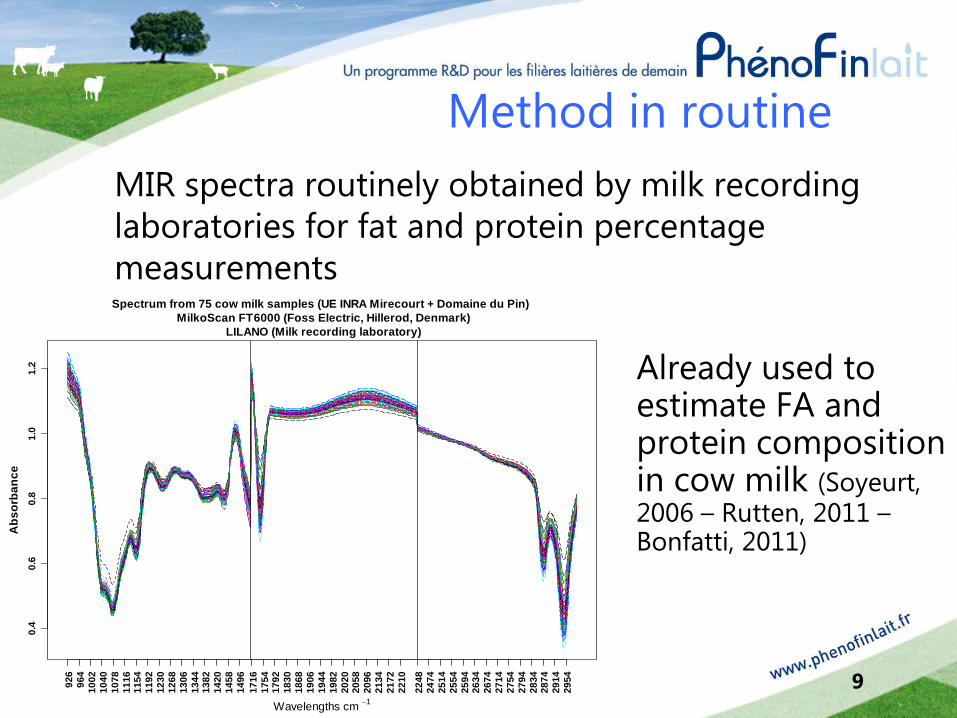
Method in routineMIR spectra routinely obtained by milk recording laboratories for fat and protein percentage measurements
Already used to estimate FA and protein composition in cow milk (Soyeurt, 2006 – Rutten, 2011 –Bonfatti, 2011)
9
0.4
0.6
0.8
1.0
1.2
Spectrum from 75 cow milk samples (UE INRA Mirecourt + Domaine du Pin) MilkoScan FT6000 (Foss Electric, Hillerod, Denmark)
LILANO (Milk recording laboratory)
926
964
1002
1040
1078
1116
1154
1192
1230
1268
1306
1344
1382
1420
1458
1496
1716
1754
1792
1830
1868
1906
1944
1982
2020
2058
2096
2134
2172
2210
2248
2474
2514
2554
2594
2634
2674
2714
2754
2794
2834
2874
2914
2954
Wavelengths cm −1
Abs
orba
nce
10
Development of equations• Traditionally by PLS regression• Pretreatments can be useful to eliminate spectral
variations derivation to eliminate uncontrolled spectral variations (Soyeurt, 2011)
• Several authors have suggested to apply a selection of variables before PLS regression to improve results (Leardi 1998, Hoskuldsson 2001)
• Genetic algorithms already successfully used on IR data (Leardi 1998, Gomez-Carracedo 2007)
Previous study on fatty acids with good results (Ferrand, 2009)
• In genomic selection penalization method like LASSO, Ridge Regression or Elastic Net are used (Croiseau, 2011)
ICAR - 28/05/2012
11
Genetic algorithms method
• Optimization method based on evolutionary biology
• Principle: evolution of a population of solutions (=wavelength selection) using genetic operators like reproduction, mutation and selection
• Objective: obtain a population with the best solutions (=wavelength selection)
ICAR - 28/05/2012

Penalization methodAim: to reduce the variance of estimators to guarantee the stability of the estimations• Ridge Regression (RR): all the predictors are
kept• LASSO: some coefficients are set to zero and
in presence of collinearity, only one predictorof the group is retained
• Elastic Net (EN): combination of RR and LASSO (two penalization parameters) more flexible
12ICAR - 28/05/2012

13
Samples analyzed
• 193 cow milk samples from Holstein, Normandeand Montbéliarde cows analyzed by MIR spectrometry and the reference method
• 153 ewe’s milk samples from Lacaune and Manechtête rousse
• 153 goat milk samples from Saanen and Alpine
ICAR - 28/05/2012
Présentateur
Commentaires de présentation
.

Outline
Context and motivationsMaterials and methodsResultsConclusions and perspectives
14

15
Cow milk: selected wavelengths
• 2272-1944 cm-1 band rarely selected• 2970-2278 cm-1 and 2272-1944 cm-1 selected for
most proteins
ICAR - 28/05/2012
GA LASSO ENNumber of retainedwavelengths 8 to 83 4 to 29 22 to 68

16
Previous study Sy,x /Mean (%)
Cow milk(independantvalidation)
N Mean Sd PLS1 dérivée + PLS1
AG 1 tour + PLS1
AG 2 tours +
PLS1
EN (α=0,5)
EN (α=0,5) + PLS1
LASSO + PLS1
Caseins 58 2.457 0.269 3.93 3.72 3.88 3.85
glycosylatedκ-CN 57 0.11 0.032 26.4 24.12 26.87 25.99 28.47 28.49 26.97
κ-CN 57 0.316 0.052 11.61 10.89 13.42 13.15 14.05 14.56 14.59
αS2-CN 58 0.237 0.041 11.25 10.43 10.29 10.59 11.43 11.76 11.64
αS1-CN 58 0.861 0.099 6.32 6.86 5.47 6.31 6.37 6.97 6.65
β-CN 58 1.041 0.132 7.22 6.04 5.91 6.7 7.09 6.38 6.99
Wheyproteins 58 0.387 0.06 9.96 9.64 13.67 9.35
α-LA 57 0.123 0.018 11.8 10.90 10.90 10.91 12.92 13.6 13.5
β-LG 58 0.263 0.054 15.79 15.86 15.29 15.39 16.63 16.28 15.89
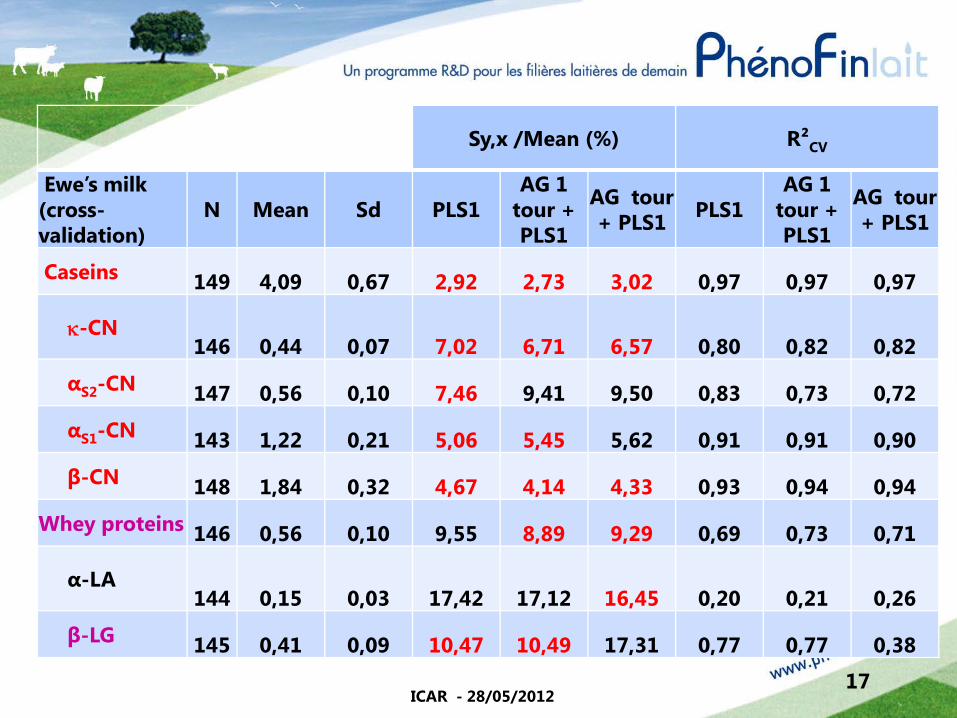
17
Ewe milk
ICAR - 28/05/2012
Sy,x /Mean (%) R²CV
Ewe’s milk(cross-validation)
N Mean Sd PLS1AG 1
tour + PLS1
AG tou+ PLS1
r PLS1AG 1
tour + PLS1
AG tour + PLS1
Caseins 149 4,09 0,67 2,92 2,73 3,02 0,97 0,97 0,97
κ-CN146 0,44 0,07 7,02 6,71 6,57 0,80 0,82 0,82
αS2-CN 147 0,56 0,10 7,46 9,41 9,50 0,83 0,73 0,72
αS1-CN 143 1,22 0,21 5,06 5,45 5,62 0,91 0,91 0,90
β-CN 148 1,84 0,32 4,67 4,14 4,33 0,93 0,94 0,94
Whey proteins 146 0,56 0,10 9,55 8,89 9,29 0,69 0,73 0,71
α-LA144 0,15 0,03 17,42 17,12 16,45 0,20 0,21 0,26
β-LG 145 0,41 0,09 10,47 10,49 17,31 0,77 0,77 0,38

Application of ovine equations on PFL MIR-database
ICAR - 28/05/201218
g/100 ml Mean StdTP 5,456 0,768Caseins 4,399 0,68κ-CN 0,465 0,07αS2-CN 0,592 0,131αS1-CN 1,375 0,217β-CN 1,908 0,307
Whey proteins 0,640 0,089α-LA 0,158 0,017β-LG 0,472 0,085

Outline
Context and motivationsMaterials and methodsResultsConclusions and perspectives
19
20
Conclusions
• In first place, to have robust equations, it seemsfundamental to have a robust sample dataset with variability and accurate measurements by the reference method
• Gain of accuracy by reallocating the proteolysis• To implement these equations at a large scale, it
is also central to establish an harmonization system between laboratories (Leray et al., 2011)
ICAR - 28/05/2012

Many thanks to every partners of the project
Thank you for you attention !

N solutions generated at random
STOP
Each variable has a mutation probability of x% (1 no selected variable become selected and conversely)Objective : avoid having a pool of uniform solutions
Substitution of the 2 worst solutions by new solutions
Combination of 2 solutionsObjective : to obtain 2 better solutionsLimit : variability of solutions decreases
CREATION of a NEW POOL of SOLUTIONS
INITIAL POPULATION : POOL OF SOLUTIONS (30)
POOL of SOLUTIONS EVALUATION of THESE
SOLUTIONS
Possibility of MUTATION
Possibility of
CROSS-OVER
REPRODUCTION Selection of 2 solutionsThe better a solution is, the highest the probability of being chosen is
R2CV
Solution 1Solution 2
Solution N
Var1 Var2… Var446
11
0
10
1
11
0
Variable i takes value of 1 if selected , else 0. R2CV is obtained by PLS regression on selected variables.
……
…
…
…
…
When quality of solutions is constant, algorithm is stopped.
Getting N solutions among the bestsFINAL RESULT
Random selection
Cross-over probability (50%)
Mutation probability (1%)
Random generation
Evaluation
= Random
adapted from Haupt (2004)and Leardi (1998)
22
23
Genetic algorithms use
• Use of the algorithm developed by Leardi• Check the robustness by varying parameters
(previous study)• Fitness function: cross-validated explained variance• Population size: 30 solutions• Mutation probability: 1%• Number of GA runs: 5 (to ensure an optimal
convergence)
ICAR - 28/05/2012