bioinfo1 5 2016 HEMOGLOBIN α-CHAIN Human Horse Cow Kangaroo Newt Carp Human 17 17 26 61 68 Horse...
11
BIOINFORMATICS 1 or why biologists need computers http://www.bioinformatics.uni-muenster.de/teaching/courses-2016/bioinf1/index.hbi Prof. Dr. Wojciech Makałowski Institute of Bioinformatics 1 MOLECULAR EVOLUTION INTRODUCTION TO 2 DUALITY OF “MOLECULAR EVOLUTION” Early stages of evolution - from primordial conditions to the first cell Evolution of the living organisms at the molecular level 3 EVOLUTION BY DESCENT WITH MODIFICATION …I should infer from analogy that probably all the organic beings which have ever lived on this earth have descended from some one primordial form, into which life was first breathed. On the Origin of Species, p. 484 Charles Darwin (1809 - 1882) 4 MATERIAL BASIS OF GENETIC CONTINUITY Germ plasm theory Germline is separated from soma Immortal germline passes genetic information from one generation to the next The germ cells are influenced neither by environmental influences nor by learning or morphological changes that happen during the lifetime of an organism, which information is lost after each generation. August Weismann (1834 - 1914) 5 DNA AS A GENETIC MATERIAL Alfred Hershey (1908-1997) Nobel Prize in Physiology or Medicine in 1969 Hershey–Chase experiment (1952) 6 bioinfo1_5_2016 - November 28, 2016
Transcript of bioinfo1 5 2016 HEMOGLOBIN α-CHAIN Human Horse Cow Kangaroo Newt Carp Human 17 17 26 61 68 Horse...
BIOINFORMATICS 1or why biologists need computers
http://www.bioinformatics.uni-muenster.de/teaching/courses-2016/bioinf1/index.hbi
Prof. Dr. Wojciech Makałowski Institute of Bioinformatics
1
MOLECULAR EVOLUTION
INTRODUCTION TO
2
DUALITY OF “MOLECULAR EVOLUTION”
Early stages of evolution - from primordial conditions to the first cell
Evolution of the living organisms at the molecular level
3
EVOLUTION BY DESCENT WITH MODIFICATION
…I should infer from analogy that probably all the organic beings which have ever lived on this earth have descended from some one primordial form, into which life was first breathed.
On the Origin of Species, p. 484 Charles Darwin (1809 - 1882)
4
MATERIAL BASIS OF GENETIC CONTINUITY
Germ plasm theory
Germline is separated from soma
Immortal germline passes genetic information from one generation to the next
The germ cells are influenced neither by environmental influences nor by learning or morphological changes that happen during the lifetime of an organism, which information is lost after each generation. August Weismann (1834 - 1914)
5
DNA AS A GENETIC MATERIAL
Alfred Hershey (1908-1997)
Nobel Prize in Physiology or Medicine in 1969
Hershey–Chase experiment (1952)
6bioinfo1_5_2016 - November 28, 2016
-Johnny Appleseed
“Type a quote here.”
Hershey–Chase experiment
7
DISCOVERY OF DAN STRUCTURE
8
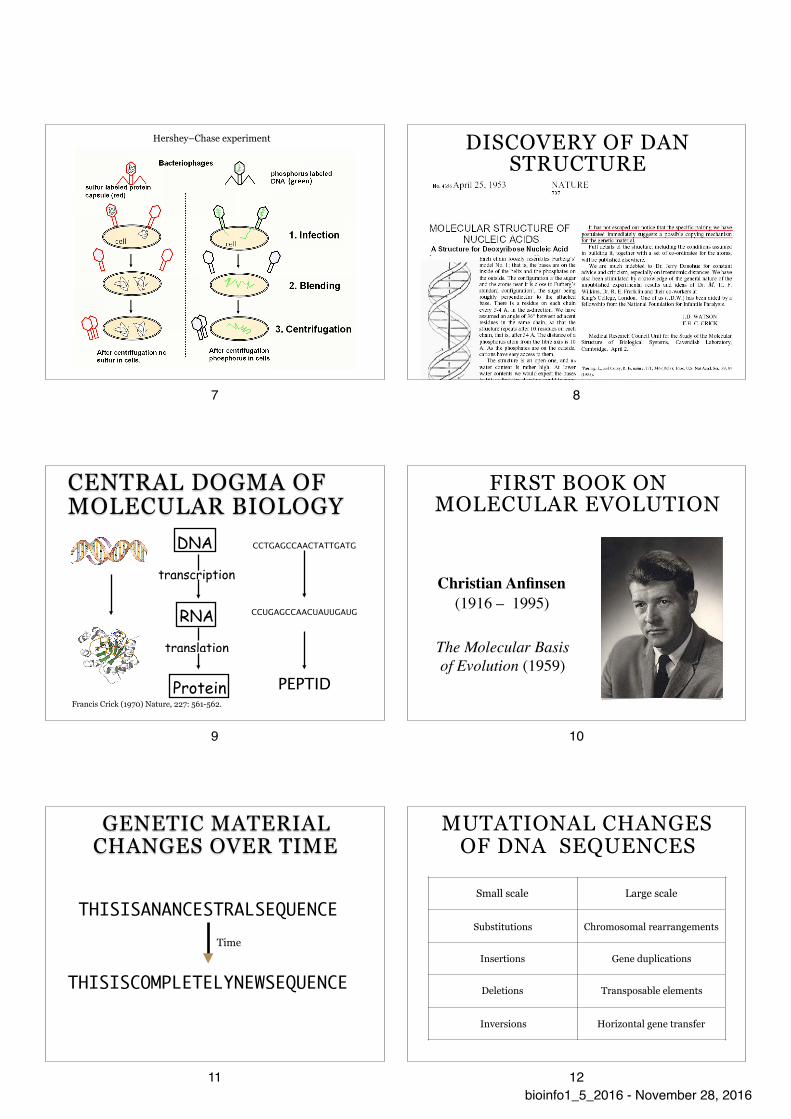
CENTRAL DOGMA OF MOLECULAR BIOLOGY
Protein
RNA
DNA
transcription
translation
CCTGAGCCAACTATTGATG
PEPTID
CCUGAGCCAACUAUUGAUG
Francis Crick (1970) Nature, 227: 561-562.
9
FIRST BOOK ON MOLECULAR EVOLUTION
Christian Anfinsen (1916 – 1995)
The Molecular Basis of Evolution (1959)
10
GENETIC MATERIAL CHANGES OVER TIME
THISISCOMPLETELYNEWSEQUENCE
THISISANANCESTRALSEQUENCETime
11
MUTATIONAL CHANGES OF DNA SEQUENCES
Small scale Large scale
Substitutions Chromosomal rearrangements
Insertions Gene duplications
Deletions Transposable elements
Inversions Horizontal gene transfer
12bioinfo1_5_2016 - November 28, 2016
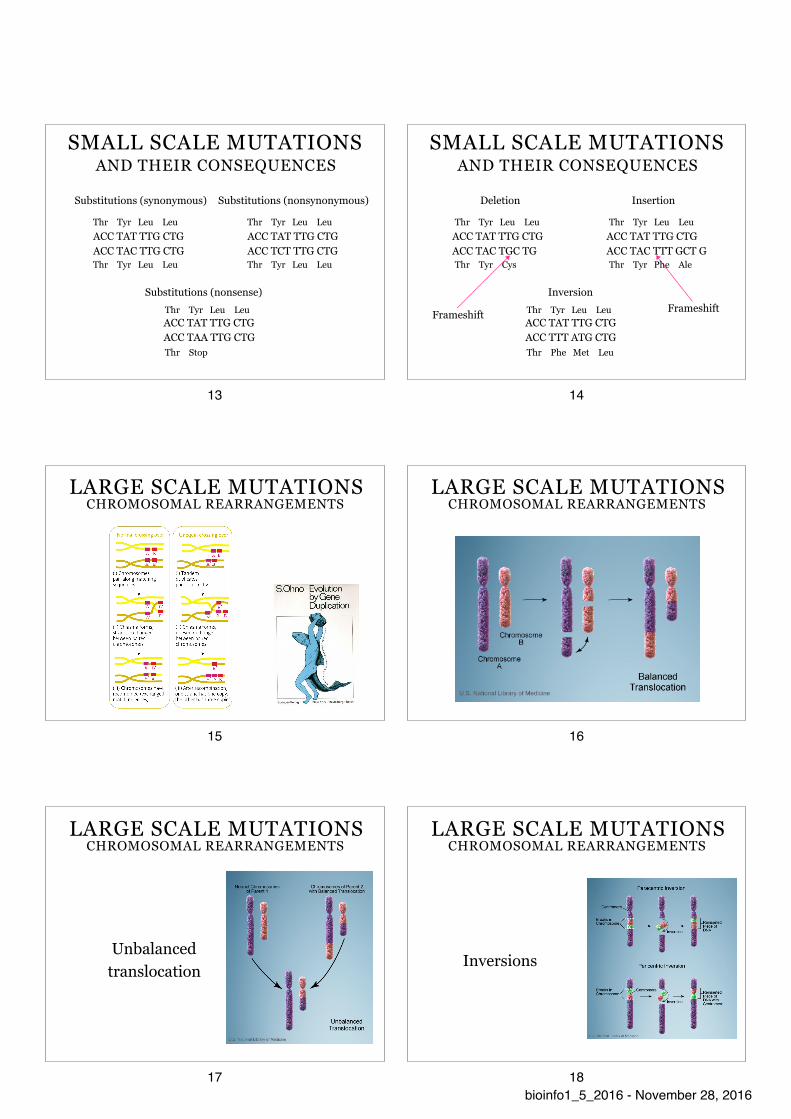
SMALL SCALE MUTATIONS AND THEIR CONSEQUENCES
Substitutions (synonymous)
Thr Tyr Leu Leu ACC TAT TTG CTG ACC TAC TTG CTG
Thr Tyr Leu Leu
Thr Tyr Leu Leu ACC TAT TTG CTG ACC TCT TTG CTG
Thr Tyr Leu Leu
Substitutions (nonsynonymous)
Thr Tyr Leu Leu ACC TAT TTG CTG ACC TAA TTG CTG Thr Stop
Substitutions (nonsense)
13
SMALL SCALE MUTATIONS AND THEIR CONSEQUENCES
Deletion
Thr Tyr Leu Leu ACC TAT TTG CTG ACC TAC TGC TG Thr Tyr Cys
Thr Tyr Leu Leu ACC TAT TTG CTG ACC TAC TTT GCT G Thr Tyr Phe Ale
Insertion
Thr Tyr Leu Leu ACC TAT TTG CTG ACC TTT ATG CTG Thr Phe Met Leu
InversionFrameshift Frameshift
14
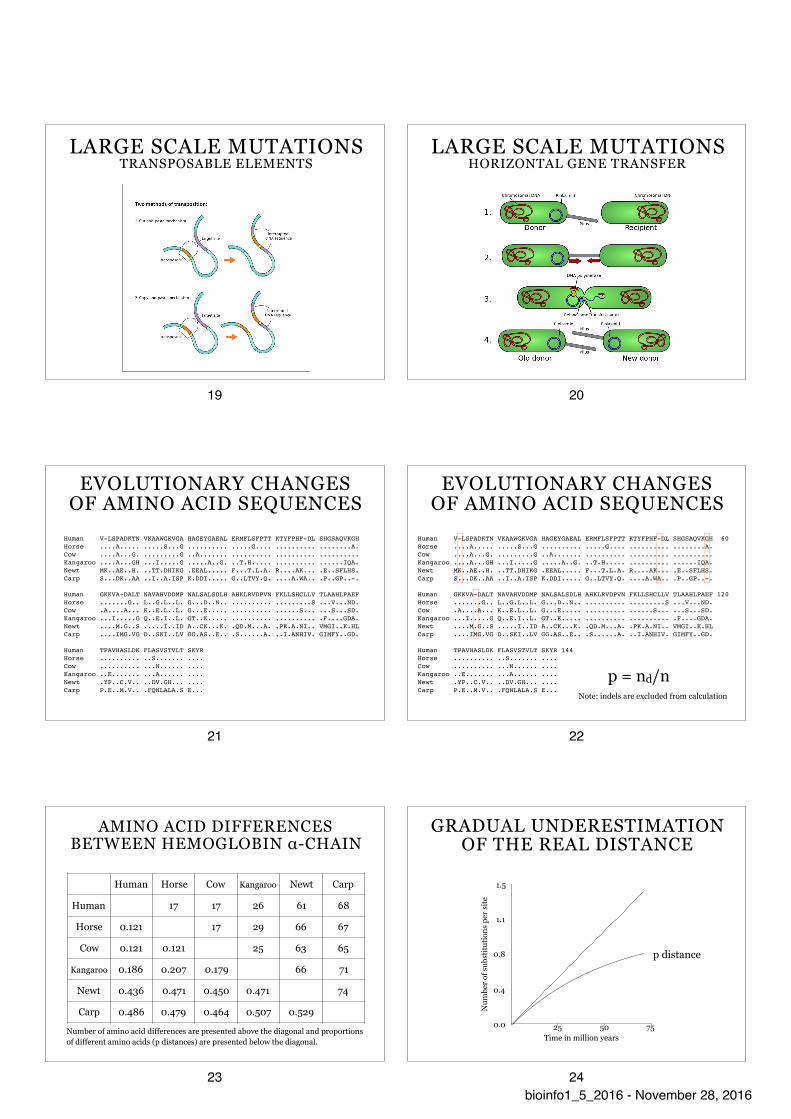
LARGE SCALE MUTATIONS CHROMOSOMAL REARRANGEMENTS
15
LARGE SCALE MUTATIONS CHROMOSOMAL REARRANGEMENTS
Chromosomal translocation
16
LARGE SCALE MUTATIONS CHROMOSOMAL REARRANGEMENTS
Unbalanced translocation
17
LARGE SCALE MUTATIONS CHROMOSOMAL REARRANGEMENTS
Inversions
18bioinfo1_5_2016 - November 28, 2016
LARGE SCALE MUTATIONS TRANSPOSABLE ELEMENTS
19
LARGE SCALE MUTATIONS HORIZONTAL GENE TRANSFER
20
EVOLUTIONARY CHANGES OF AMINO ACID SEQUENCES
Human V-LSPADKTN VKAAWGKVGA HAGEYGAEAL ERMFLSFPTT KTYFPHF-DL SHGSAQVKGHHorse ....A..... .....S...G .......... .....G.... .......... ........A.Cow ....A...G. .........G ..A....... .......... .......... ..........Kangaroo ....A...GH ...I.....G .....A..G. ..T.H..... .......... ......IQA.Newt MK..AE..H. ..TT.DHIKG .EEAL..... F...T.L.A. R....AK... .E..SFLHS.Carp S...DK..AA ..I..A.ISP K.DDI..... G..LTVY.Q. ....A.WA.. .P..GP..-.
Human GKKVA-DALT NAVAHVDDMP NALSALSDLH AHKLRVDPVN FKLLSHCLLV TLAAHLPAEFHorse .......G.. L..G.L..L. G...D..N.. .......... .........S ...V...ND.Cow .A....A... K..E.L..L. G...E..... .......... ......S... ...S...SD.Kangaroo ...I.....G Q..E.I..L. GT..K..... .......... .......... .F....GDA.Newt ....M.G..S .....I..ID A..CK...K. .QD.M...A. .PK.A.NI.. VMGI..K.HLCarp ....IMG.VG D..SKI..LV GG.AS..E.. .S......A. ..I.ANHIV. GIMFY..GD.
Human TPAVHASLDK FLASVSTVLT SKYRHorse .......... ..S....... ....Cow .......... ...N...... ....Kangaroo ..E....... ...A...... ....Newt .YP..C.V.. ..DV.GH... ....Carp P.E..M.V.. .FQNLALA.S E...
21
EVOLUTIONARY CHANGES OF AMINO ACID SEQUENCES
Human V-LSPADKTN VKAAWGKVGA HAGEYGAEAL ERMFLSFPTT KTYFPHF-DL SHGSAQVKGH 60Horse ....A..... .....S...G .......... .....G.... .......... ........A.Cow ....A...G. .........G ..A....... .......... .......... ..........Kangaroo ....A...GH ...I.....G .....A..G. ..T.H..... .......... ......IQA.Newt MK..AE..H. ..TT.DHIKG .EEAL..... F...T.L.A. R....AK... .E..SFLHS.Carp S...DK..AA ..I..A.ISP K.DDI..... G..LTVY.Q. ....A.WA.. .P..GP..-.
Human GKKVA-DALT NAVAHVDDMP NALSALSDLH AHKLRVDPVN FKLLSHCLLV TLAAHLPAEF 120Horse .......G.. L..G.L..L. G...D..N.. .......... .........S ...V...ND.Cow .A....A... K..E.L..L. G...E..... .......... ......S... ...S...SD.Kangaroo ...I.....G Q..E.I..L. GT..K..... .......... .......... .F....GDA.Newt ....M.G..S .....I..ID A..CK...K. .QD.M...A. .PK.A.NI.. VMGI..K.HLCarp ....IMG.VG D..SKI..LV GG.AS..E.. .S......A. ..I.ANHIV. GIMFY..GD.
Human TPAVHASLDK FLASVSTVLT SKYR 144Horse .......... ..S....... ....Cow .......... ...N...... ....Kangaroo ..E....... ...A...... ....Newt .YP..C.V.. ..DV.GH... ....Carp P.E..M.V.. .FQNLALA.S E...
p = nd/nNote: indels are excluded from calculation
22
AMINO ACID DIFFERENCES BETWEEN HEMOGLOBIN α-CHAIN
Human Horse Cow Kangaroo Newt Carp
Human 17 17 26 61 68
Horse 0.121 17 29 66 67
Cow 0.121 0.121 25 63 65
Kangaroo 0.186 0.207 0.179 66 71
Newt 0.436 0.471 0.450 0.471 74
Carp 0.486 0.479 0.464 0.507 0.529
Number of amino acid differences are presented above the diagonal and proportions of different amino acids (p distances) are presented below the diagonal.
23
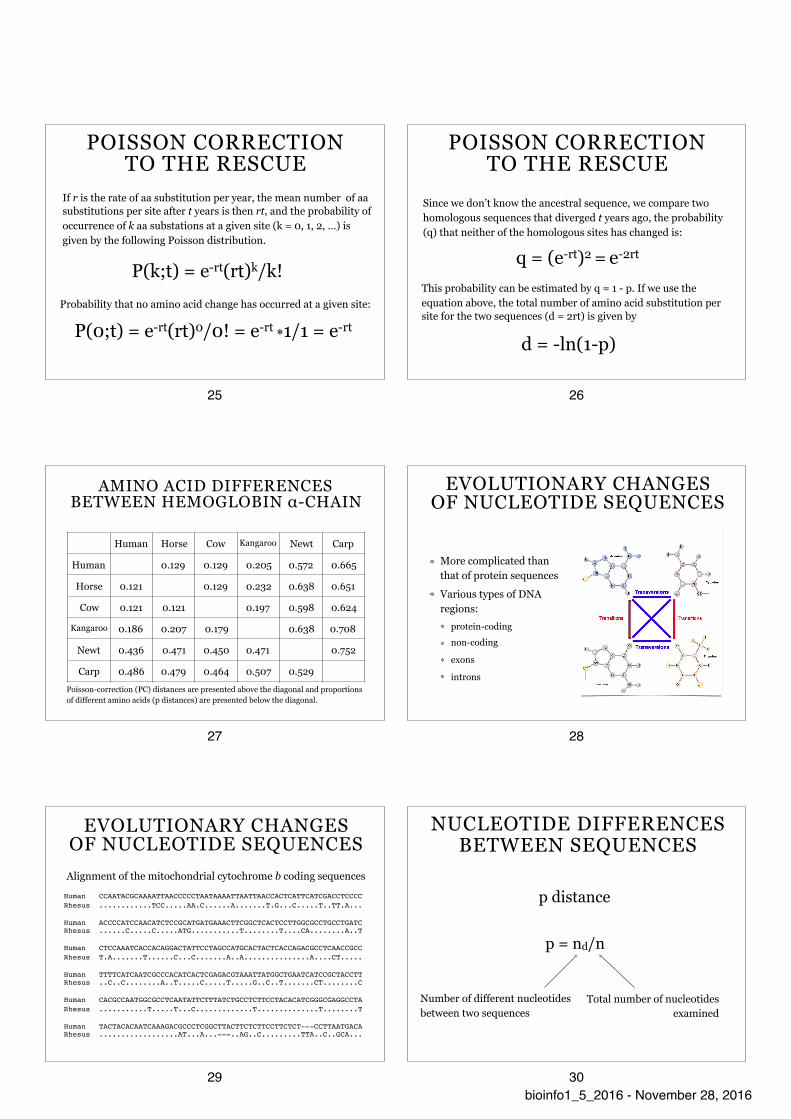
GRADUAL UNDERESTIMATION OF THE REAL DISTANCE
Num
ber o
f sub
stitu
tions
per
site
0.0
0.4
0.8
1.1
1.5
Time in million years
p distance
25 50 75
24bioinfo1_5_2016 - November 28, 2016
POISSON CORRECTION TO THE RESCUE
P(k;t) = e-rt(rt)k/k!
P(0;t) = e-rt(rt)0/0! = e-rt *1/1 = e-rt
Probability that no amino acid change has occurred at a given site:
If r is the rate of aa substitution per year, the mean number of aa substitutions per site after t years is then rt, and the probability of occurrence of k aa substations at a given site (k = 0, 1, 2, …) is given by the following Poisson distribution.
25
POISSON CORRECTION TO THE RESCUE
q = (e-rt)2 = e-2rt
This probability can be estimated by q = 1 - p. If we use the equation above, the total number of amino acid substitution per site for the two sequences (d = 2rt) is given by
d = -ln(1-p)
Since we don’t know the ancestral sequence, we compare two homologous sequences that diverged t years ago, the probability (q) that neither of the homologous sites has changed is:
26
AMINO ACID DIFFERENCES BETWEEN HEMOGLOBIN α-CHAIN
Human Horse Cow Kangaroo Newt Carp
Human 0.129 0.129 0.205 0.572 0.665
Horse 0.121 0.129 0.232 0.638 0.651
Cow 0.121 0.121 0.197 0.598 0.624
Kangaroo 0.186 0.207 0.179 0.638 0.708
Newt 0.436 0.471 0.450 0.471 0.752
Carp 0.486 0.479 0.464 0.507 0.529
Poisson-correction (PC) distances are presented above the diagonal and proportions of different amino acids (p distances) are presented below the diagonal.
27
EVOLUTIONARY CHANGES OF NUCLEOTIDE SEQUENCES
More complicated than that of protein sequences
Various types of DNA regions:
protein-coding non-coding
exons
introns
28
EVOLUTIONARY CHANGES OF NUCLEOTIDE SEQUENCES
Human CCAATACGCAAAATTAACCCCCTAATAAAATTAATTAACCACTCATTCATCGACCTCCCCRhesus ............TCC.....AA.C......A.......T.G...C.....T..TT.A...
Human ACCCCATCCAACATCTCCGCATGATGAAACTTCGGCTCACTCCTTGGCGCCTGCCTGATCRhesus ......C.....C.....ATG...........T........T....CA........A..T
Human CTCCAAATCACCACAGGACTATTCCTAGCCATGCACTACTCACCAGACGCCTCAACCGCCRhesus T.A.......T......C...C.......A..A...............A....CT.....
Human TTTTCATCAATCGCCCACATCACTCGAGACGTAAATTATGGCTGAATCATCCGCTACCTTRhesus ..C..C........A..T.....C.....T.....G..C..T.......CT........C
Human CACGCCAATGGCGCCTCAATATTCTTTATCTGCCTCTTCCTACACATCGGGCGAGGCCTARhesus ...........T.....T...C.............T..............T........T
Human TACTACACAATCAAAGACGCCCTCGGCTTACTTCTCTTCCTTCTCT---CCTTAATGACARhesus ..................AT...A...---..AG..C.........TTA..C..GCA...
Alignment of the mitochondrial cytochrome b coding sequences
29
NUCLEOTIDE DIFFERENCES BETWEEN SEQUENCES
p distance
p = nd/n
Number of different nucleotides between two sequences
Total number of nucleotides examined
30bioinfo1_5_2016 - November 28, 2016
GRADUAL UNDERESTIMATION OF THE REAL DISTANCE
Estim
ated
num
ber o
f sub
stitu
tions
per
site
(d)
0.0
0.4
0.8
1.1
1.5
Expected number of substitutions per site (d)
0.0 0.4 0.8 1.1 1.5
p distance
31
DIFFERENT MODELS OF NUCLEOTIDE SUBSTITUTIONS
Jukes-Cantor model nucleotide substitution occurs at any nt site with equal frequency
d = -(3/4)ln[1-(4/3)p]
Kimura’s two-parameter model assumes different rate of transitions and transversions
d = -(1/2)ln(1-2P - Q) - (1/4)ln(1 - 2Q)
transitions transvertions
32
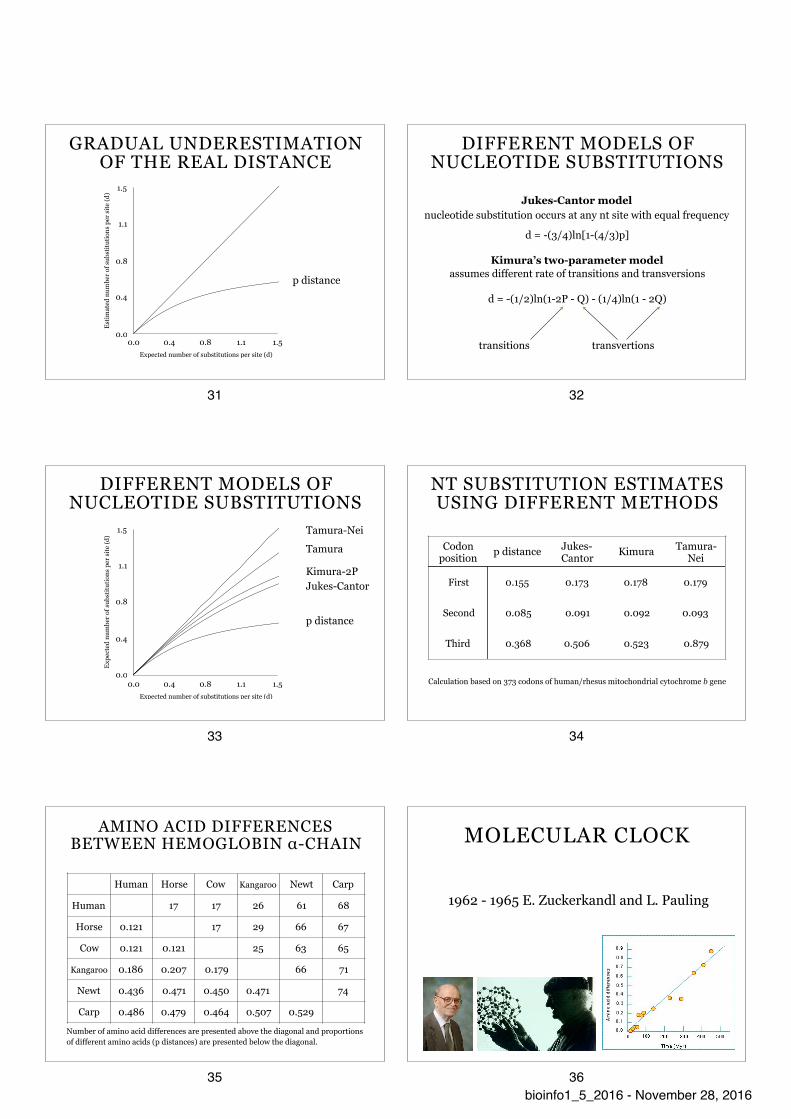
DIFFERENT MODELS OF NUCLEOTIDE SUBSTITUTIONS
Expe
cted
num
ber o
f sub
stitu
tions
per
site
(d)
0.0
0.4
0.8
1.1
1.5
Expected number of substitutions per site (d)
0.0 0.4 0.8 1.1 1.5
Tamura-Nei
Tamura
Kimura-2P
p distance
Jukes-Cantor
33
NT SUBSTITUTION ESTIMATES USING DIFFERENT METHODS
Codon position p distance Jukes-
Cantor Kimura Tamura-Nei
First 0.155 0.173 0.178 0.179
Second 0.085 0.091 0.092 0.093
Third 0.368 0.506 0.523 0.879
Calculation based on 373 codons of human/rhesus mitochondrial cytochrome b gene
34
AMINO ACID DIFFERENCES BETWEEN HEMOGLOBIN α-CHAIN
Human Horse Cow Kangaroo Newt Carp
Human 17 17 26 61 68
Horse 0.121 17 29 66 67
Cow 0.121 0.121 25 63 65
Kangaroo 0.186 0.207 0.179 66 71
Newt 0.436 0.471 0.450 0.471 74
Carp 0.486 0.479 0.464 0.507 0.529
Number of amino acid differences are presented above the diagonal and proportions of different amino acids (p distances) are presented below the diagonal.
35
MOLECULAR CLOCK
1962 - 1965 E. Zuckerkandl and L. Pauling
36bioinfo1_5_2016 - November 28, 2016
37
GLOBAL VS. LOCAL CLOCK
Ohta, T. (1995) J. Mol. Evol. 40: 56-63.
Higher rates in rodents than in other mammals and primate slow down.
38
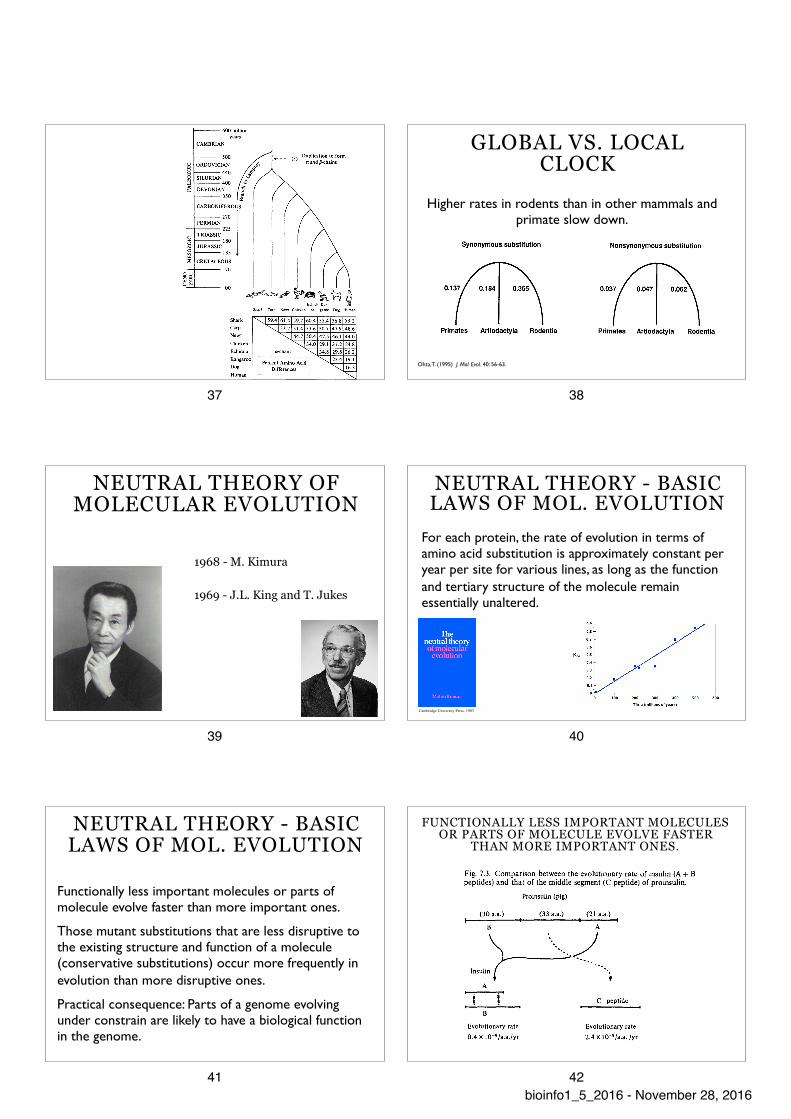
NEUTRAL THEORY OF MOLECULAR EVOLUTION
1968 - M. Kimura
1969 - J.L. King and T. Jukes
39
NEUTRAL THEORY - BASIC LAWS OF MOL. EVOLUTION
For each protein, the rate of evolution in terms of amino acid substitution is approximately constant per year per site for various lines, as long as the function and tertiary structure of the molecule remain essentially unaltered.
Cambridge University Press, 1983
40
NEUTRAL THEORY - BASIC LAWS OF MOL. EVOLUTION
Functionally less important molecules or parts of molecule evolve faster than more important ones.
Those mutant substitutions that are less disruptive to the existing structure and function of a molecule (conservative substitutions) occur more frequently in evolution than more disruptive ones.
Practical consequence: Parts of a genome evolving under constrain are likely to have a biological function in the genome.
41
FUNCTIONALLY LESS IMPORTANT MOLECULES OR PARTS OF MOLECULE EVOLVE FASTER
THAN MORE IMPORTANT ONES.
42bioinfo1_5_2016 - November 28, 2016
GENE DUPLICATION MUST ALWAYS PRECEDE OF THE EMERGENCE OF A GENE HAVING A NEW FUNCTION
43
GENE DUPLICATION MUST ALWAYS PRECEDE OF THE EMERGENCE OF A GENE HAVING A NEW FUNCTION
44
NEUTRAL THEORY - BASIC LAWS OF MOL. EVOLUTION
Selective elimination of definitely deleterious mutants and random fixation of selectively neutral or very
slightly deleterious mutants occur far more frequently in evolution than positive Darwinian selection of
definitely advantageous mutants.
Neutral mutations:
|s| < 1/2N
s - selection coefficient; N - effective population size
45
PROBLEM WITH NEUTRAL MUTATION DEFINITION
If a deleterious mutation with s =-0.001 occurs in a population of N=106, |s| is much greater than 1/(2N) = 5 x 10⁷. Therefore, this mutation will not be called ‘‘neutral.’’ However, the fitness of mutant homozygotes will be lower than that of wild-type homozygotes only by 0.002.
In the case of brother-sister mating N = 2, so that even a semilethal mutation with s = -0.25 will be called neutral. If this mutation is fixed in the population, the mutant homozygote has a fitness of 0.5 compared with the non-mutant homozygote.
46
NEARLY NEUTRAL EVOLUTION
1973 - T. Ohta
47
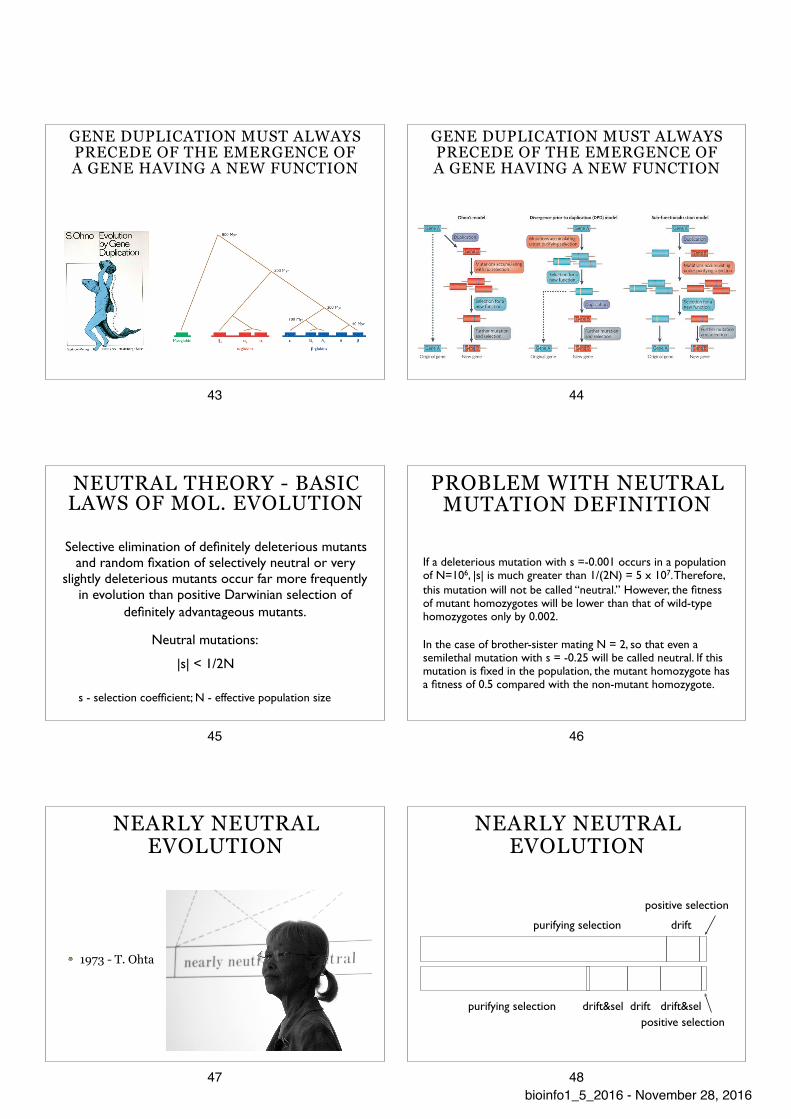
NEARLY NEUTRAL EVOLUTION
purifying selection drift
purifying selection drift&sel drift drift&sel
positive selection
positive selection
48bioinfo1_5_2016 - November 28, 2016
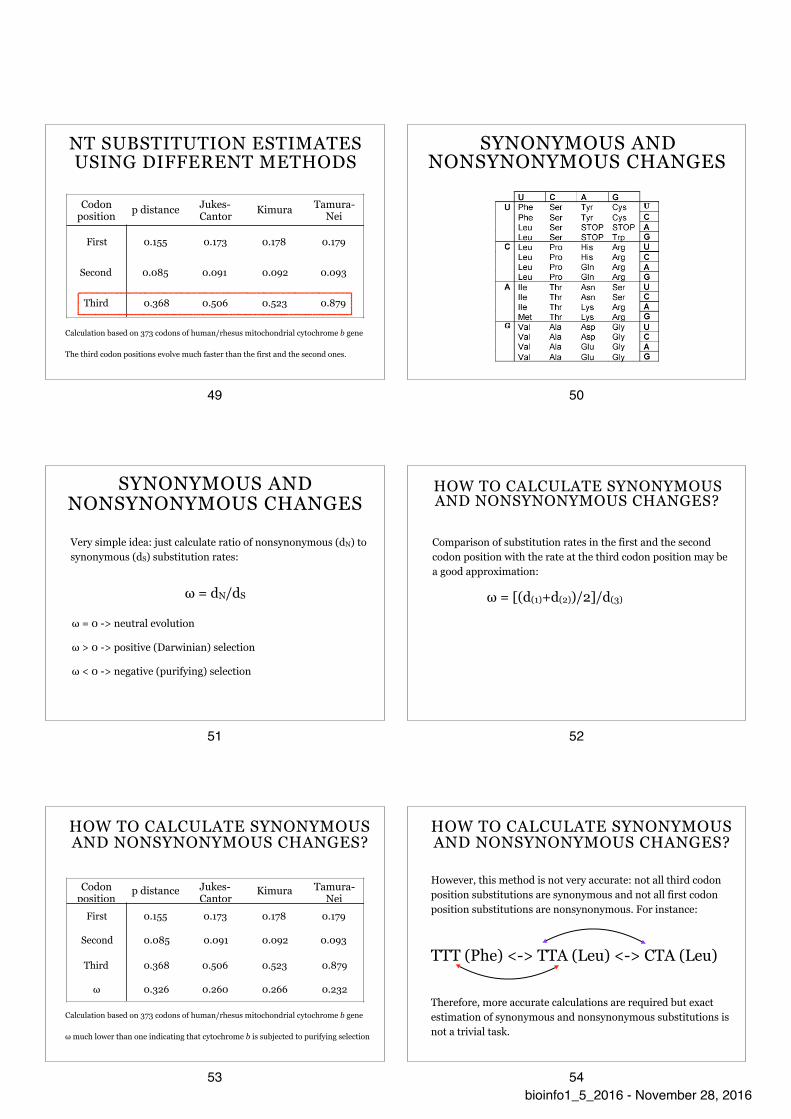
NT SUBSTITUTION ESTIMATES USING DIFFERENT METHODS
Codon position p distance Jukes-
Cantor Kimura Tamura-Nei
First 0.155 0.173 0.178 0.179
Second 0.085 0.091 0.092 0.093
Third 0.368 0.506 0.523 0.879
Calculation based on 373 codons of human/rhesus mitochondrial cytochrome b gene
The third codon positions evolve much faster than the first and the second ones.
49
SYNONYMOUS AND NONSYNONYMOUS CHANGES
50
SYNONYMOUS AND NONSYNONYMOUS CHANGES
Very simple idea: just calculate ratio of nonsynonymous (dN) to synonymous (dS) substitution rates:
ω = dN/dS
ω = 0 -> neutral evolution
ω > 0 -> positive (Darwinian) selection
ω < 0 -> negative (purifying) selection
51
HOW TO CALCULATE SYNONYMOUS AND NONSYNONYMOUS CHANGES?
Comparison of substitution rates in the first and the second codon position with the rate at the third codon position may be a good approximation:
ω = [(d(1)+d(2))/2]/d(3)
52
HOW TO CALCULATE SYNONYMOUS AND NONSYNONYMOUS CHANGES?
Codon position
p distance Jukes-Cantor
Kimura Tamura-Nei
First 0.155 0.173 0.178 0.179
Second 0.085 0.091 0.092 0.093
Third 0.368 0.506 0.523 0.879
ω 0.326 0.260 0.266 0.232
Calculation based on 373 codons of human/rhesus mitochondrial cytochrome b gene
ω much lower than one indicating that cytochrome b is subjected to purifying selection
53
HOW TO CALCULATE SYNONYMOUS AND NONSYNONYMOUS CHANGES?
However, this method is not very accurate: not all third codon position substitutions are synonymous and not all first codon position substitutions are nonsynonymous. For instance:
TTT (Phe) <-> TTA (Leu) <-> CTA (Leu)
Therefore, more accurate calculations are required but exact estimation of synonymous and nonsynonymous substitutions is not a trivial task.
54bioinfo1_5_2016 - November 28, 2016
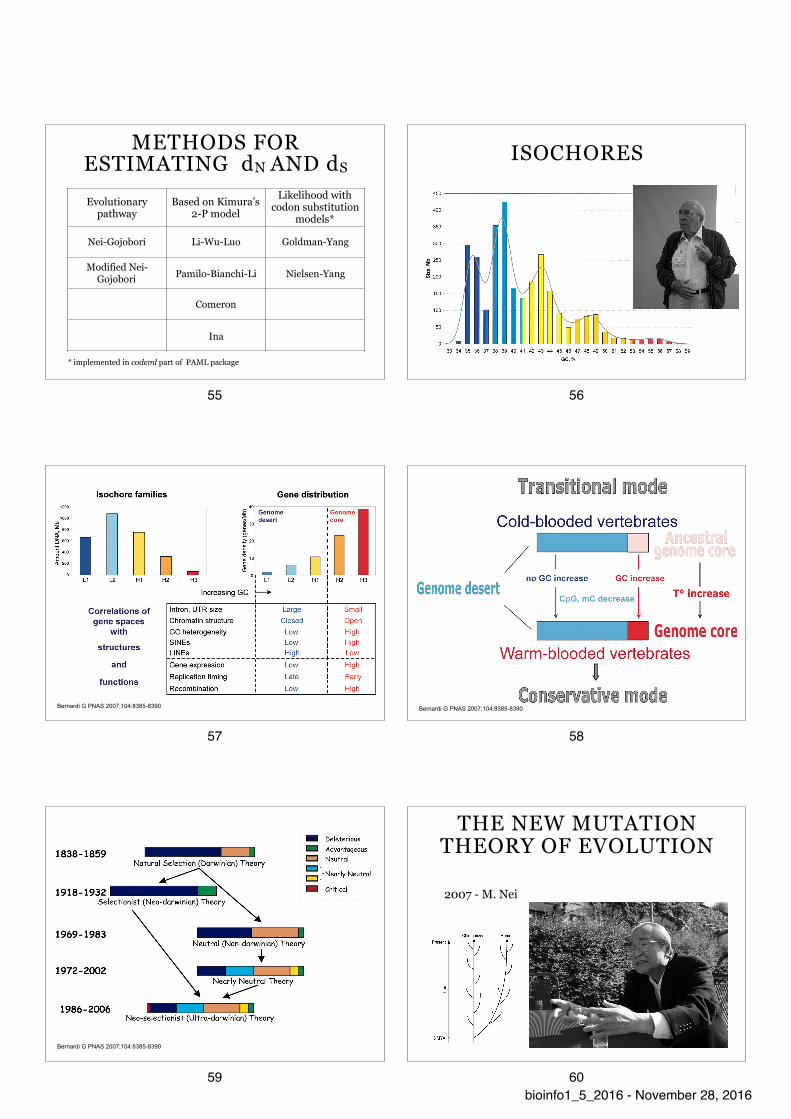
METHODS FOR ESTIMATING dN AND dS
Evolutionary pathway
Based on Kimura’s 2-P model
Likelihood with codon substitution
models*
Nei-Gojobori Li-Wu-Luo Goldman-Yang
Modified Nei-Gojobori Pamilo-Bianchi-Li Nielsen-Yang
Comeron
Ina
* implemented in codeml part of PAML package
55
ISOCHORES
1975 - G. Bernardi
56
Bernardi G PNAS 2007;104:8385-8390
57
Bernardi G PNAS 2007;104:8385-8390
58
Bernardi G PNAS 2007;104:8385-8390
59
THE NEW MUTATION THEORY OF EVOLUTION
2007 - M. Nei
60bioinfo1_5_2016 - November 28, 2016
BIOINFORMATICS CREED
Remember about biology
Do not trust the data
Use comparative approach
Use statistics
Know the limits
Remember about biology!!!
61
bioinfo1_5_2016 - November 28, 2016