Technical Note: Vapor pressure estimation methods applied ... · vapor pressures of most relevant...
12
Atmos. Chem. Phys., 10, 6271–6282, 2010 www.atmos-chem-phys.net/10/6271/2010/ doi:10.5194/acp-10-6271-2010 © Author(s) 2010. CC Attribution 3.0 License. Atmospheric Chemistry and Physics Technical Note: Vapor pressure estimation methods applied to secondary organic aerosol constituents from α -pinene oxidation: an intercomparison study S. Compernolle, K. Ceulemans, and J.-F. M¨ uller Belgian Institute for Space-aeronomy, Ringlaan 3, 1180 Brussels, Belgium Received: 19 March 2010 – Published in Atmos. Chem. Phys. Discuss.: 1 April 2010 Revised: 30 June 2010 – Accepted: 5 July 2010 – Published: 9 July 2010 Abstract. We applied and compared seven vapor pressure estimation methods to the condensable compounds generated in the oxidation of α-pinene, as described by the state-of- the-art mechanism of the BOREAM model (Capouet et al., 2008). Several of these methods had to be extended in order to treat functional groups such as hydroperoxides and peroxy acyl nitrates. Large differences in the estimated vapor pres- sures are reported, which will inevitably lead to large differ- ences in aerosol formation simulations. Cautioning remarks are given for some vapor pressure estimation methods. 1 Introduction Biogenic SOA, originating from the oxidation of organic molecules such as isoprene and terpenes, is estimated to be a major contributor to organic aerosol (Hallquist et al., 2009). Many uncertainties exist regarding the formation and compo- sition of SOA. These include, among others, missing path- ways in the gas-phase oxidation of Volatile Organic Com- pounds (VOC) to semi- and nonvolatile ones, unmeasured vapor pressures of most relevant semi volatile molecules, ill- constrained non-ideality effects due to the fact that SOA is a mixture, unknown heterogeneous and aerosol phase reac- tions, etc. If aerosol formation is primarily due to equilib- rium partitioning, Pankow’s formula (Pankow, 1994) applies (here written in its molar form; Compernolle et al., 2009; Barley et al., 2009) c p,i c g,i = RT γ i p 0 i c om (1) with R the ideal gas constant, T the temperature, p 0 i the vapor pressure, and γ i the activity coefficient, c p,i and c g,i Correspondence to: S. Compernolle ([email protected]) the mole quantity of species i per volume of air in aerosol phase and gas phase respectively, and c om the mole quantity of SOA per volume of air. Both γ i and p 0 i of a molecule de- termine its presence in the aerosol phase, but while γ i varies typically over an order of magnitude for a mixture of simi- lar compounds (e.g. all originating from the oxidation of the same hydrocarbon; Compernolle et al., 2009), p 0 i varies over many orders of magnitude. For the large majority of com- pounds contributing to SOA, no experimental p 0 i is known and hence it has to be estimated. Many methods for vapor pressure estimation have been de- veloped. Some of them use only molecular structure, often in the form of a group contribution method, while others need also molecular properties as input, such as the boiling point. As these properties are unknown for most species, they have themselves to be estimated. Some methods (see e.g. Capouet and M¨ uller, 2006; Pankow and Asher, 2008) assume a linear dependence of ln(p 0 i ) on the number of functional groups, but this approximation fails especially when multiple hydro- gen bonding groups are present. To counter this deficiency, other methods introduce group interaction terms (Nannoolal et al., 2008; Moller et al., 2008), but the number of differ- ent terms becomes very large in these methods and there is in general a lack of data for polyfunctional molecules to constrain them. Also the scaling of the group interac- tion with number of functional groups is not trivial, and this choice is important for highly polyfunctional molecules, as we will show in this work. The following methods are com- pared: the method of Capouet and M ¨ uller (2006) (CM), SIM- POL (Pankow and Asher, 2008), SPARC (Hilal et al., 2003), and three methods needing a boiling point as input (Myrdal and Yalkowsky, 1997; Nannoolal et al., 2008; Moller et al., 2008). The boiling point is estimated either with the old method of Joback and Reid (1987) or the more recent and detailed method of Nannoolal et al. (2004). During the course of this work Barley and McFiggans (2010) made an assessment of different vapor pressure Published by Copernicus Publications on behalf of the European Geosciences Union.
Transcript of Technical Note: Vapor pressure estimation methods applied ... · vapor pressures of most relevant...
Atmos. Chem. Phys., 10, 6271–6282, 2010www.atmos-chem-phys.net/10/6271/2010/doi:10.5194/acp-10-6271-2010© Author(s) 2010. CC Attribution 3.0 License.
AtmosphericChemistry
and Physics
Technical Note: Vapor pressure estimation methods applied tosecondary organic aerosol constituents fromα-pinene oxidation:an intercomparison study
S. Compernolle, K. Ceulemans, and J.-F. Muller
Belgian Institute for Space-aeronomy, Ringlaan 3, 1180 Brussels, Belgium
Received: 19 March 2010 – Published in Atmos. Chem. Phys. Discuss.: 1 April 2010Revised: 30 June 2010 – Accepted: 5 July 2010 – Published: 9 July 2010
Abstract. We applied and compared seven vapor pressureestimation methods to the condensable compounds generatedin the oxidation ofα-pinene, as described by the state-of-the-art mechanism of the BOREAM model (Capouet et al.,2008). Several of these methods had to be extended in orderto treat functional groups such as hydroperoxides and peroxyacyl nitrates. Large differences in the estimated vapor pres-sures are reported, which will inevitably lead to large differ-ences in aerosol formation simulations. Cautioning remarksare given for some vapor pressure estimation methods.
1 Introduction
Biogenic SOA, originating from the oxidation of organicmolecules such as isoprene and terpenes, is estimated to be amajor contributor to organic aerosol (Hallquist et al., 2009).Many uncertainties exist regarding the formation and compo-sition of SOA. These include, among others, missing path-ways in the gas-phase oxidation of Volatile Organic Com-pounds (VOC) to semi- and nonvolatile ones, unmeasuredvapor pressures of most relevant semi volatile molecules, ill-constrained non-ideality effects due to the fact that SOA isa mixture, unknown heterogeneous and aerosol phase reac-tions, etc. If aerosol formation is primarily due to equilib-rium partitioning, Pankow’s formula (Pankow, 1994) applies(here written in its molar form;Compernolle et al., 2009;Barley et al., 2009)
cp,i
cg,i
=RT
γip0i
com (1)
with R the ideal gas constant,T the temperature,p0i the
vapor pressure, andγi the activity coefficient,cp,i andcg,i
Correspondence to:S. Compernolle([email protected])
the mole quantity of speciesi per volume of air in aerosolphase and gas phase respectively, andcom the mole quantityof SOA per volume of air. Bothγi andp0
i of a molecule de-termine its presence in the aerosol phase, but whileγi variestypically over an order of magnitude for a mixture of simi-lar compounds (e.g. all originating from the oxidation of thesame hydrocarbon;Compernolle et al., 2009), p0
i varies overmany orders of magnitude. For the large majority of com-pounds contributing to SOA, no experimentalp0
i is knownand hence it has to be estimated.
Many methods for vapor pressure estimation have been de-veloped. Some of them use only molecular structure, often inthe form of a group contribution method, while others needalso molecular properties as input, such as the boiling point.As these properties are unknown for most species, they havethemselves to be estimated. Some methods (see e.g.Capouetand Muller, 2006; Pankow and Asher, 2008) assume a lineardependence of ln(p0
i ) on the number of functional groups,but this approximation fails especially when multiple hydro-gen bonding groups are present. To counter this deficiency,other methods introduce group interaction terms (Nannoolalet al., 2008; Moller et al., 2008), but the number of differ-ent terms becomes very large in these methods and thereis in general a lack of data for polyfunctional moleculesto constrain them. Also the scaling of the group interac-tion with number of functional groups is not trivial, and thischoice is important for highly polyfunctional molecules, aswe will show in this work. The following methods are com-pared: the method ofCapouet and Muller (2006) (CM), SIM-POL (Pankow and Asher, 2008), SPARC (Hilal et al., 2003),and three methods needing a boiling point as input (Myrdaland Yalkowsky, 1997; Nannoolal et al., 2008; Moller et al.,2008). The boiling point is estimated either with the oldmethod ofJoback and Reid(1987) or the more recent anddetailed method ofNannoolal et al.(2004).
During the course of this workBarley and McFiggans(2010) made an assessment of different vapor pressure
Published by Copernicus Publications on behalf of the European Geosciences Union.
6272 S. Compernolle et al.: Intercomparison of vapor pressure methods
Table 1. Overview of the seven different vapor pressure estimation methods used in this work.
Vapor pressure method Boiling point method abbreviation in text mathematical symbol
Capouet and Muller (2006) N/A CM p0CM
Pankow and Asher(2008) N/A SIMPOL pSIHilal et al. (2003) N/A SPARC p0
SPMyrdal and Yalkowsky(1997) Joback and Reid(1987) MY-JR p0
MY
(Tb,JR
)Myrdal and Yalkowsky(1997) Nannoolal et al.(2004) MY-Nan p0
MY
(Tb,N
)Nannoolal et al.(2008) Nannoolal et al.(2004) Nan-Nan p0
N
(Tb,N
)Moller et al.(2008) Nannoolal et al.(2004) Mol-Nan p0
M
(Tb,N
)
methods in their ability to predict vapor pressures of lower-volatility compounds, including all methods presented hereexcept SPARC. Their study is complementary with the cur-rent work, as they compare the vapor pressure estimationswith experimental values for compounds of relatively highervolatility. In this study, our focus will be on typical aerosolconstituents predicted by the BOREAM model, for whichexperimental vapor pressures are generally not available.The impact of some of these methods in the simulationby BOREAM of SOA yields ofα-pinene dark-ozonolysissmog chamber experiments was very recently investigated byCeulemans et al.(2010).
2 Description of boiling point and vapor pressure esti-mation methods
We tested in total seven different vapor pressure estimationmethods, given in Table1, together with the abbreviationused in this work. Some of them need only molecular struc-ture as input while others are combined with a boiling pointestimation method. The boiling point methods and vaporpressure methods are explained below. Note that the boil-ing point method ofNannoolal et al.(2004), and the vaporpressure methods ofMyrdal and Yalkowsky(1997); Nan-noolal et al.(2008); Moller et al.(2008) are available on-lineat the E-AIM website (Extended Aerosol Inorganics Model,www.aim.env.uea.ac.uk/aim/ddbst/pcalcmain.php).
2.1 Boiling point method of Joback and Reid (1987),and its extension
Here it is assumed that the boiling point can be written as asum over groups:
Tb,JR = 198.2 +
∑k
vk1Tb,k (2)
wherek runs over the groups,vk is the occurrence of thisgroup in the molecule, and1Tb,k a contribution to the boil-ing point due to this group. The linearity assumption hasbeen criticized before (e.g.Stein and Brown, 1994; Barleyand McFiggans, 2010), in giving too high boiling points forlarge compounds. The Joback method should in principle
only be applied to components within a certain boiling pointrange. Outside this range, a correction has to be appliedthat can be derived e.g. from a plot of estimated vs. ex-perimental normal boiling temperature for a sufficient num-ber of components. In the original method, no parametersare present for peroxide (−OO−), hydroperoxide (−OOH),peracid (−C(=O)OOH), nitrate (−ONO2) and peroxy acylnitrate (−C(=O)OONO2) groups, which are all present in theBOREAM model. Decomposition is a problem for the directdetermination of boiling points of hydroperoxides, peracidsand peroxy acyl nitrates (Egerton et al., 1951; Kacmarek,1978). Camredon and Aumont(2006) extended the Jobackmethod for nitrates based on experimental boiling point data,and we take over this group-contribution value.
For peroxy acyl nitrates,Camredon and Aumont(2006)extended the JR method based on the boiling point of peroxyacetyl nitrate reported byBruckmann and Willner(1983).Bruckmann and Willner(1983) do not make explicit how thisboiling point of 379.15 K was determined. As they evaluatedthe vapor pressure curve only up to 291.15 K, the reportedboiling point of peroxy acetyl nitrate is probably obtainedby extrapolation of theirp0(T ) correlation over almost 90 K.Therefore we use instead thep0(T ) correlation provided byKacmarek(1978) to obtain the extrapolated boiling point ofperoxy acetyl nitrate (Table2). With this boiling point, thegroup contribution for peroxy acyl nitrates is determined (Ta-ble3). Kacmarek(1978) providesT ,p0 data up to 330.15 K,although the highest temperature point is probably an outliernot used in their correlation. Discarding this point results ina – still significant – extrapolation range of about 60 K.
As no experimental boiling points are available for hy-droperoxides,Camredon and Aumont(2006) assumed thatthe group−OOH could be subdivided into the existing JRgroups−O− and −OH. Instead, we use thep0(T ) corre-lations provided byEgerton et al.(1951) to obtain the ex-trapolated boiling points of three hydroperoxides and threeperacids. For five out of six of them the extrapolation rangeis less than 20 K and hence the extrapolated boiling pointshould be a good estimate, provided the underlying data is ofgood quality. These boiling points are then used to derive thegroup contribution for the hydroperoxide group and peracid
Atmos. Chem. Phys., 10, 6271–6282, 2010 www.atmos-chem-phys.net/10/6271/2010/
S. Compernolle et al.: Intercomparison of vapor pressure methods 6273
Table 2. Boiling points used for the derivation of new group contri-butions, together with the range of extrapolation1Textr. to obtainthese boiling points, when applicable.
compound Tb/K 1Textr./K
dimethyl peroxidea 287.15 0.5diethyl peroxidea 335.65 N/Adi-t-butyl peroxidea 382.15 N/Aethyl methyl peroxideb 312.15 N/Aisopropyl methyl peroxideb 326.65 N/At-pentyl t-butyl peroxideb 399.15 N/Amethyl hydroperoxidec 358.60 45.5ethyl hydroperoxidec 374.25 11.0t-butyl hydroperoxidec 404.65 11.5acetic peracidc 383.24 ≈ 0d
propanoic peracidc 392.88 ≈ 0d
butanoic peracidc 399.38 6.peroxy acetyl nitratee 377.07 61.1
a FromSanchez and Myers(2000). For dimethyl peroxide, the boil-ing point was slightly below 1 atm, therefore we assumed a 0.5KhigherTb.b FromBalaban et al.(1992).c From thep0(T ) correlations ofEgerton et al.(1951).d The boiling points are at the edge of the reported temperatureinterval. However,Egerton et al.(1951) do not refer to them as di-rectly determined boiling points.e From thep0(T ) correlation ofKacmarek(1978). The highesttemperature data point at 330.15 K is probably an outlier, seem-ingly not used byKacmarek(1978) for the derivation of the vaporpressure function of peroxy acetyl nitrate. Therefore the extrapola-tion range is taken from the second-highest temperature data point315.95 K.
group, by minimizing∑i
(Tb,X,i −Tb,exp,i)2 (3)
with X the method considered (in this case JR) andTb,exp,ia boiling point based on experimental data (possibly extrap-olated) (Table3). The peroxide group contribution finally, isbased on six boiling points fromSanchez and Myers(2000)andBalaban et al.(1992) evaluated at, or very close to, at-mospheric pressure.
Also reported in Table3 are the mean absolute deviationsbetween modelled and experimental (possibly extrapolated)boiling points, given as
σTb= 1/N
N∑i=1
∣∣Tb,X,i −Tb,exp,i∣∣ (4)
2.2 Boiling point method ofNannoolal et al.(2004), andits extension
This is a group contribution method that also takes into ac-count interactions between functional groups.
Tb,N =
∑kvk1Tb,k + GI
n0.6583+ 1.6868+ 84.3395 (5)
GI =1
n
m∑i=1
m∑j=1
Ci−j
m−1, with
n number of non−H atomsm number of interacting groups
The nonlinear behaviour (through the termn0.6583) describesmore closely experimental behaviour as opposed to the JRmethod.1Tb,k includes both first and second order groups.GI describes the interaction between groups. It includes alarge amount of functional groups, is therefore applicableto a wide range of organic molecules, and is based on therenowned Dortmund Data Bank (www.ddbst.com). How-ever no parameters are available for the hydroperoxide, theperacid and peroxy acyl nitrate group. They are obtained inthe same way as for the JR method (Table3). As the boilingpoints upon which are based were estimated, the group con-tribution values are presumably of lower quality. No groupinteraction parametersCi−j can be derived for these groupsbecause of lack of data.
2.3 Vapor pressure method of Capouet and Muller(2006)
This is a simple group contribution method directly fitted toexperimental vapor pressures, given by the formula
log10p0CM = log10p
0hc −
∑k
vkτk (6)
τk = Ak − Bk(T − 298 K)
p0hc is the vapor pressure of the hydrocarbon parent com-
pound of the molecule under consideration, i.e. the moleculewith the same carbon skeleton but with the functional groupsreplaced by the appropriate number of hydrogen atoms, andk runs over the functional groups. This hydrocarbon vaporpressure is provided by experimental data or estimated bysome other method, as there exist several reliable ways to es-timate the vapor pressure of hydrocarbons. For the fitting,the large majority ofp0
hc was provided by experimental val-ues, while for the use in modeling, the method ofMarreroand Gani(2001) was used to provide boiling point, criticaltemperature and critical pressure, which were then convertedto p0
hc by the corresponding states method ofAmbrose andWalton (1989). This last approach was also chosen in thiswork. Note that the method lumps acids and peracids, butdistinguishes between primary, secondary and tertiary alco-hols and nitrates. A shortcoming of the CM method is itslimited range of applicability with respect to molecule types,as it was devised to handle oxidation products of terpenes.Furthermore, it is based on a relatively limited basis set, andit includes only a crude temperature dependence.
www.atmos-chem-phys.net/10/6271/2010/ Atmos. Chem. Phys., 10, 6271–6282, 2010
6274 S. Compernolle et al.: Intercomparison of vapor pressure methods
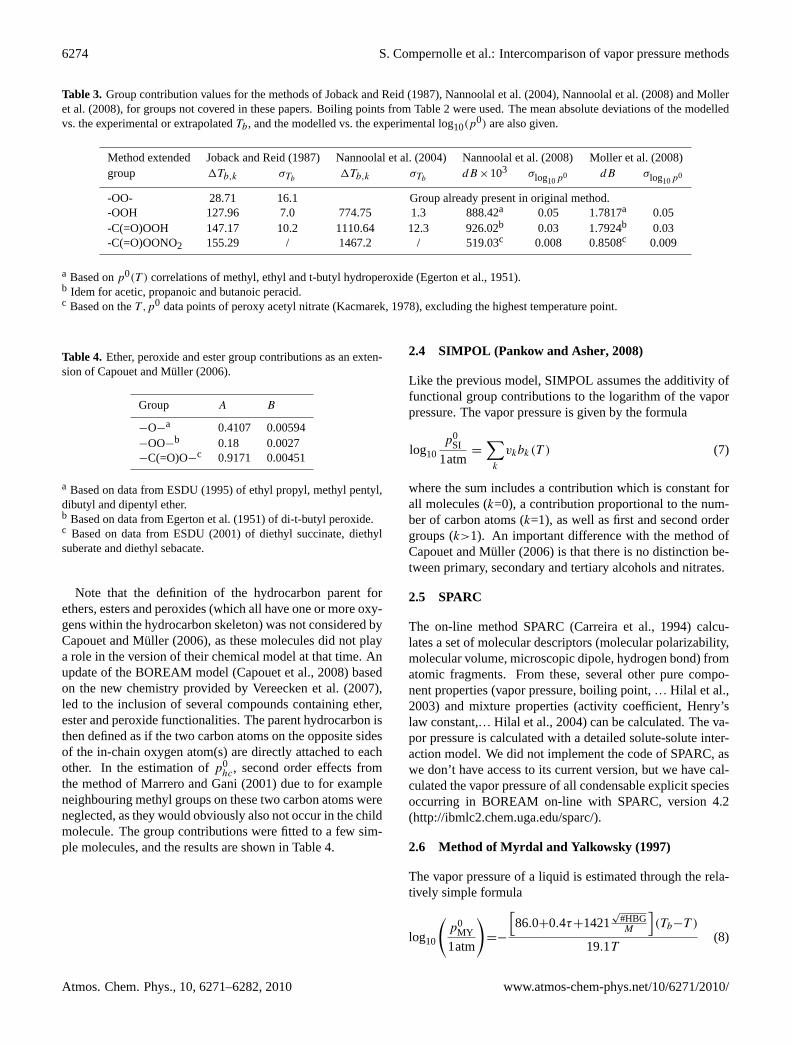
Table 3. Group contribution values for the methods ofJoback and Reid(1987), Nannoolal et al.(2004), Nannoolal et al.(2008) andMolleret al.(2008), for groups not covered in these papers. Boiling points from Table2 were used. The mean absolute deviations of the modelledvs. the experimental or extrapolatedTb, and the modelled vs. the experimental log10(p
0) are also given.
Method extended Joback and Reid(1987) Nannoolal et al.(2004) Nannoolal et al.(2008) Moller et al.(2008)group 1Tb,k σTb
1Tb,k σTbdB ×103 σlog10p0 dB σlog10p0
-OO- 28.71 16.1 Group already present in original method.-OOH 127.96 7.0 774.75 1.3 888.42a 0.05 1.7817a 0.05-C(=O)OOH 147.17 10.2 1110.64 12.3 926.02b 0.03 1.7924b 0.03-C(=O)OONO2 155.29 / 1467.2 / 519.03c 0.008 0.8508c 0.009
a Based onp0(T ) correlations of methyl, ethyl and t-butyl hydroperoxide (Egerton et al., 1951).b Idem for acetic, propanoic and butanoic peracid.c Based on theT ,p0 data points of peroxy acetyl nitrate (Kacmarek, 1978), excluding the highest temperature point.
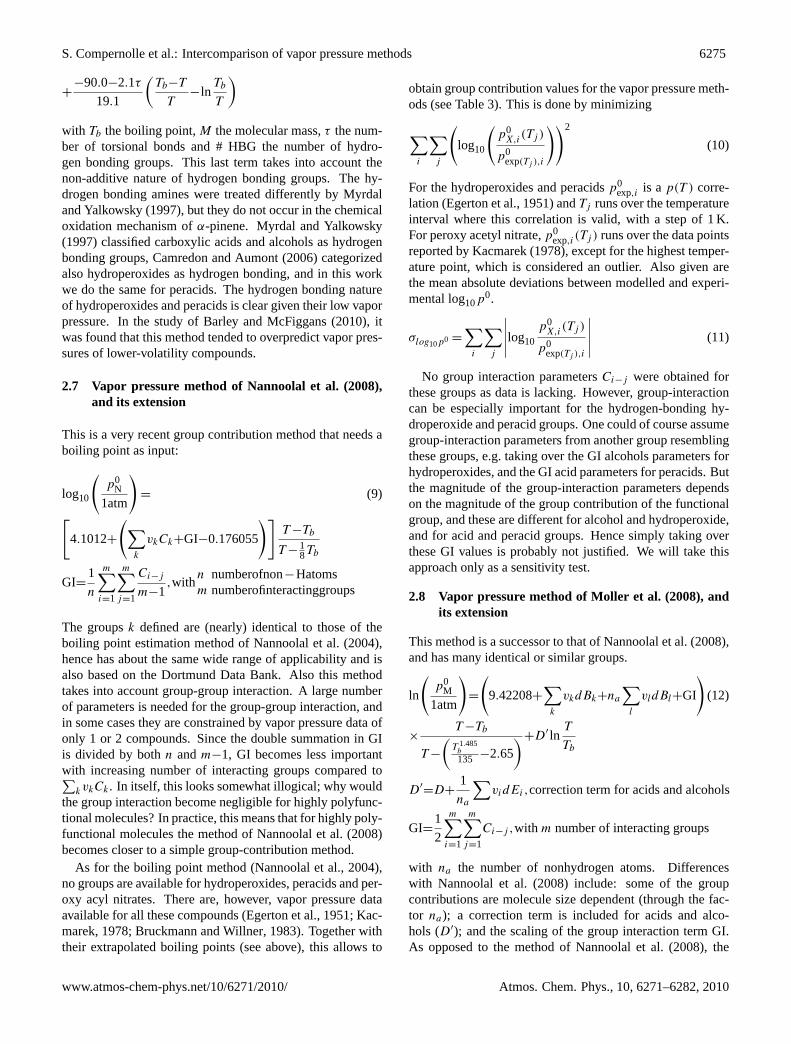
Table 4. Ether, peroxide and ester group contributions as an exten-sion ofCapouet and Muller (2006).
Group A B
−O−a 0.4107 0.00594
−OO−b 0.18 0.0027
−C(=O)O−c 0.9171 0.00451
a Based on data fromESDU(1995) of ethyl propyl, methyl pentyl,dibutyl and dipentyl ether.b Based on data fromEgerton et al.(1951) of di-t-butyl peroxide.c Based on data fromESDU (2001) of diethyl succinate, diethylsuberate and diethyl sebacate.
Note that the definition of the hydrocarbon parent forethers, esters and peroxides (which all have one or more oxy-gens within the hydrocarbon skeleton) was not considered byCapouet and Muller (2006), as these molecules did not playa role in the version of their chemical model at that time. Anupdate of the BOREAM model (Capouet et al., 2008) basedon the new chemistry provided byVereecken et al.(2007),led to the inclusion of several compounds containing ether,ester and peroxide functionalities. The parent hydrocarbon isthen defined as if the two carbon atoms on the opposite sidesof the in-chain oxygen atom(s) are directly attached to eachother. In the estimation ofp0
hc, second order effects fromthe method ofMarrero and Gani(2001) due to for exampleneighbouring methyl groups on these two carbon atoms wereneglected, as they would obviously also not occur in the childmolecule. The group contributions were fitted to a few sim-ple molecules, and the results are shown in Table4.
2.4 SIMPOL (Pankow and Asher, 2008)
Like the previous model, SIMPOL assumes the additivity offunctional group contributions to the logarithm of the vaporpressure. The vapor pressure is given by the formula
log10p0
SI
1atm=
∑k
vkbk (T ) (7)
where the sum includes a contribution which is constant forall molecules (k=0), a contribution proportional to the num-ber of carbon atoms (k=1), as well as first and second ordergroups (k>1). An important difference with the method ofCapouet and Muller (2006) is that there is no distinction be-tween primary, secondary and tertiary alcohols and nitrates.
2.5 SPARC
The on-line method SPARC (Carreira et al., 1994) calcu-lates a set of molecular descriptors (molecular polarizability,molecular volume, microscopic dipole, hydrogen bond) fromatomic fragments. From these, several other pure compo-nent properties (vapor pressure, boiling point,... Hilal et al.,2003) and mixture properties (activity coefficient, Henry’slaw constant,... Hilal et al., 2004) can be calculated. The va-por pressure is calculated with a detailed solute-solute inter-action model. We did not implement the code of SPARC, aswe don’t have access to its current version, but we have cal-culated the vapor pressure of all condensable explicit speciesoccurring in BOREAM on-line with SPARC, version 4.2(http://ibmlc2.chem.uga.edu/sparc/).
2.6 Method ofMyrdal and Yalkowsky (1997)
The vapor pressure of a liquid is estimated through the rela-tively simple formula
log10
(p0
MY
1atm
)=−
[86.0+0.4τ+1421
√#HBGM
](Tb−T )
19.1T(8)
Atmos. Chem. Phys., 10, 6271–6282, 2010 www.atmos-chem-phys.net/10/6271/2010/
S. Compernolle et al.: Intercomparison of vapor pressure methods 6275
+−90.0−2.1τ
19.1
(Tb−T
T−ln
Tb
T
)with Tb the boiling point,M the molecular mass,τ the num-ber of torsional bonds and # HBG the number of hydro-gen bonding groups. This last term takes into account thenon-additive nature of hydrogen bonding groups. The hy-drogen bonding amines were treated differently byMyrdaland Yalkowsky(1997), but they do not occur in the chemicaloxidation mechanism ofα-pinene. Myrdal and Yalkowsky(1997) classified carboxylic acids and alcohols as hydrogenbonding groups,Camredon and Aumont(2006) categorizedalso hydroperoxides as hydrogen bonding, and in this workwe do the same for peracids. The hydrogen bonding natureof hydroperoxides and peracids is clear given their low vaporpressure. In the study ofBarley and McFiggans(2010), itwas found that this method tended to overpredict vapor pres-sures of lower-volatility compounds.
2.7 Vapor pressure method ofNannoolal et al. (2008),and its extension
This is a very recent group contribution method that needs aboiling point as input:
log10
(p0
N
1atm
)= (9)[
4.1012+
(∑k
vkCk+GI−0.176055
)]T −Tb
T −18Tb
GI=1
n
m∑i=1
m∑j=1
Ci−j
m−1,with
n numberofnon−Hatomsm numberofinteractinggroups
The groupsk defined are (nearly) identical to those of theboiling point estimation method ofNannoolal et al.(2004),hence has about the same wide range of applicability and isalso based on the Dortmund Data Bank. Also this methodtakes into account group-group interaction. A large numberof parameters is needed for the group-group interaction, andin some cases they are constrained by vapor pressure data ofonly 1 or 2 compounds. Since the double summation in GIis divided by bothn andm−1, GI becomes less importantwith increasing number of interacting groups compared to∑
kvkCk. In itself, this looks somewhat illogical; why wouldthe group interaction become negligible for highly polyfunc-tional molecules? In practice, this means that for highly poly-functional molecules the method ofNannoolal et al.(2008)becomes closer to a simple group-contribution method.
As for the boiling point method (Nannoolal et al., 2004),no groups are available for hydroperoxides, peracids and per-oxy acyl nitrates. There are, however, vapor pressure dataavailable for all these compounds (Egerton et al., 1951; Kac-marek, 1978; Bruckmann and Willner, 1983). Together withtheir extrapolated boiling points (see above), this allows to
obtain group contribution values for the vapor pressure meth-ods (see Table3). This is done by minimizing
∑i
∑j
(log10
(p0
X,i(Tj )
p0exp(Tj ),i
))2
(10)
For the hydroperoxides and peracidsp0exp,i is ap(T ) corre-
lation (Egerton et al., 1951) andTj runs over the temperatureinterval where this correlation is valid, with a step of 1 K.For peroxy acetyl nitrate,p0
exp,i(Tj ) runs over the data pointsreported byKacmarek(1978), except for the highest temper-ature point, which is considered an outlier. Also given arethe mean absolute deviations between modelled and experi-mental log10p
0.
σlog10p0 =
∑i
∑j
∣∣∣∣∣log10
p0X,i(Tj )
p0exp(Tj ),i
∣∣∣∣∣ (11)
No group interaction parametersCi−j were obtained forthese groups as data is lacking. However, group-interactioncan be especially important for the hydrogen-bonding hy-droperoxide and peracid groups. One could of course assumegroup-interaction parameters from another group resemblingthese groups, e.g. taking over the GI alcohols parameters forhydroperoxides, and the GI acid parameters for peracids. Butthe magnitude of the group-interaction parameters dependson the magnitude of the group contribution of the functionalgroup, and these are different for alcohol and hydroperoxide,and for acid and peracid groups. Hence simply taking overthese GI values is probably not justified. We will take thisapproach only as a sensitivity test.
2.8 Vapor pressure method ofMoller et al. (2008), andits extension
This method is a successor to that ofNannoolal et al.(2008),and has many identical or similar groups.
ln
(p0
M
1atm
)=
(9.42208+
∑k
vkdBk+na
∑l
vldBl+GI
)(12)
×T −Tb
T −
(T 1.485
b
135 −2.65
)+D′ lnT
Tb
D′=D+
1
na
∑vidEi,correction term for acids and alcohols
GI=1
2
m∑i=1
m∑j=1
Ci−j ,with m number of interacting groups
with na the number of nonhydrogen atoms. Differenceswith Nannoolal et al.(2008) include: some of the groupcontributions are molecule size dependent (through the fac-tor na); a correction term is included for acids and alco-hols (D′); and the scaling of the group interaction term GI.As opposed to the method ofNannoolal et al.(2008), the
www.atmos-chem-phys.net/10/6271/2010/ Atmos. Chem. Phys., 10, 6271–6282, 2010
6276 S. Compernolle et al.: Intercomparison of vapor pressure methods
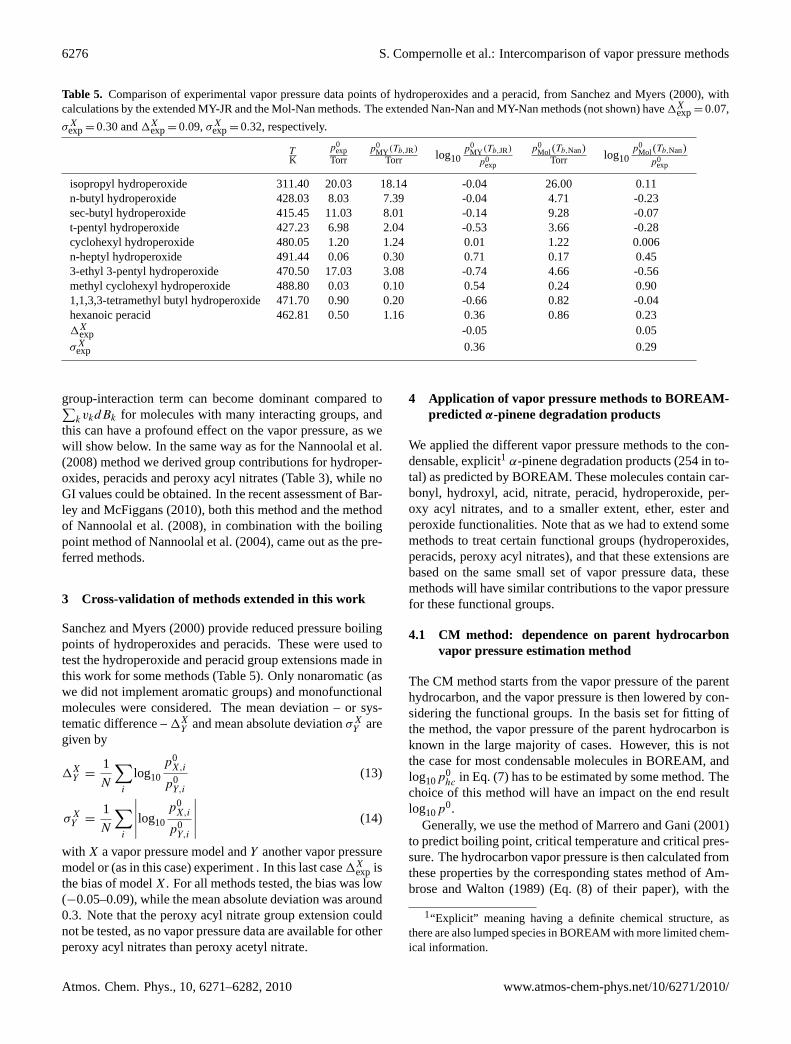
Table 5. Comparison of experimental vapor pressure data points of hydroperoxides and a peracid, fromSanchez and Myers(2000), withcalculations by the extended MY-JR and the Mol-Nan methods. The extended Nan-Nan and MY-Nan methods (not shown) have1X
exp= 0.07,
σXexp= 0.30 and1X
exp= 0.09,σXexp= 0.32, respectively.
TK
p0exp
Torrp0
MY (Tb,JR)
Torr log10p0
MY (Tb,JR)
p0exp
p0Mol(Tb,Nan)
Torr log10p0
Mol(Tb,Nan)p0
exp
isopropyl hydroperoxide 311.40 20.03 18.14 -0.04 26.00 0.11n-butyl hydroperoxide 428.03 8.03 7.39 -0.04 4.71 -0.23sec-butyl hydroperoxide 415.45 11.03 8.01 -0.14 9.28 -0.07t-pentyl hydroperoxide 427.23 6.98 2.04 -0.53 3.66 -0.28cyclohexyl hydroperoxide 480.05 1.20 1.24 0.01 1.22 0.006n-heptyl hydroperoxide 491.44 0.06 0.30 0.71 0.17 0.453-ethyl 3-pentyl hydroperoxide 470.50 17.03 3.08 -0.74 4.66 -0.56methyl cyclohexyl hydroperoxide 488.80 0.03 0.10 0.54 0.24 0.901,1,3,3-tetramethyl butyl hydroperoxide 471.70 0.90 0.20 -0.66 0.82 -0.04hexanoic peracid 462.81 0.50 1.16 0.36 0.86 0.231X
exp -0.05 0.05σX
exp 0.36 0.29
group-interaction term can become dominant compared to∑kvkdBk for molecules with many interacting groups, and
this can have a profound effect on the vapor pressure, as wewill show below. In the same way as for theNannoolal et al.(2008) method we derived group contributions for hydroper-oxides, peracids and peroxy acyl nitrates (Table3), while noGI values could be obtained. In the recent assessment ofBar-ley and McFiggans(2010), both this method and the methodof Nannoolal et al.(2008), in combination with the boilingpoint method ofNannoolal et al.(2004), came out as the pre-ferred methods.
3 Cross-validation of methods extended in this work
Sanchez and Myers(2000) provide reduced pressure boilingpoints of hydroperoxides and peracids. These were used totest the hydroperoxide and peracid group extensions made inthis work for some methods (Table5). Only nonaromatic (aswe did not implement aromatic groups) and monofunctionalmolecules were considered. The mean deviation – or sys-tematic difference –1X
Y and mean absolute deviationσXY are
given by
1XY =
1
N
∑i
log10
p0X,i
p0Y,i
(13)
σXY =
1
N
∑i
∣∣∣∣∣log10
p0X,i
p0Y,i
∣∣∣∣∣ (14)
with X a vapor pressure model andY another vapor pressuremodel or (as in this case) experiment . In this last case1X
exp isthe bias of modelX. For all methods tested, the bias was low(−0.05–0.09), while the mean absolute deviation was around0.3. Note that the peroxy acyl nitrate group extension couldnot be tested, as no vapor pressure data are available for otherperoxy acyl nitrates than peroxy acetyl nitrate.
4 Application of vapor pressure methods to BOREAM-predicted α-pinene degradation products
We applied the different vapor pressure methods to the con-densable, explicit1 α-pinene degradation products (254 in to-tal) as predicted by BOREAM. These molecules contain car-bonyl, hydroxyl, acid, nitrate, peracid, hydroperoxide, per-oxy acyl nitrates, and to a smaller extent, ether, ester andperoxide functionalities. Note that as we had to extend somemethods to treat certain functional groups (hydroperoxides,peracids, peroxy acyl nitrates), and that these extensions arebased on the same small set of vapor pressure data, thesemethods will have similar contributions to the vapor pressurefor these functional groups.
4.1 CM method: dependence on parent hydrocarbonvapor pressure estimation method
The CM method starts from the vapor pressure of the parenthydrocarbon, and the vapor pressure is then lowered by con-sidering the functional groups. In the basis set for fitting ofthe method, the vapor pressure of the parent hydrocarbon isknown in the large majority of cases. However, this is notthe case for most condensable molecules in BOREAM, andlog10p
0hc in Eq. (7) has to be estimated by some method. The
choice of this method will have an impact on the end resultlog10p
0.Generally, we use the method ofMarrero and Gani(2001)
to predict boiling point, critical temperature and critical pres-sure. The hydrocarbon vapor pressure is then calculated fromthese properties by the corresponding states method ofAm-brose and Walton(1989) (Eq. (8) of their paper), with the
1“Explicit” meaning having a definite chemical structure, asthere are also lumped species in BOREAM with more limited chem-ical information.
Atmos. Chem. Phys., 10, 6271–6282, 2010 www.atmos-chem-phys.net/10/6271/2010/
S. Compernolle et al.: Intercomparison of vapor pressure methods 6277
-12
-10
-8
-6
-4
-2
0
2
4
-12 -10 -8 -6 -4 -2 0 2 4
log10(p0)CM
log10(p
0 MY(T
b,J
R))
MY-JR vs. CM
∆MY−JR
CM= −1.83
σMY−JR
CM= 1.84
-12
-10
-8
-6
-4
-2
0
2
4
-12 -10 -8 -6 -4 -2 0 2 4
log10(p0)CM
log10(p
0 MY(T
b,N
an))
MY-Nan vs. CM
∆MY−Nan
CM= 1.01
σMY−Nan
CM= 1.07
-12
-10
-8
-6
-4
-2
0
2
4
-12 -10 -8 -6 -4 -2 0 2 4
log10(p0)CM
log10(p
0 Nan(T
b,N
an))
Nan-Nan vs. CM
∆Nan−Nan
CM= −0.16
σNan−Nan
CM= 0.50
-12
-10
-8
-6
-4
-2
0
2
4
-12 -10 -8 -6 -4 -2 0 2 4
log10(p0)CM
log10(p
0 Mol(T
b,N
an))
Mol-Nan vs. CM
∆Mol−Nan
CM= 0.28
σMol−Nan
CM= 1.14
-12
-10
-8
-6
-4
-2
0
2
4
-12 -10 -8 -6 -4 -2 0 2 4
log10(p0)CM
log10(p
0 SI)
SIMPOL vs. CM
∆SI
CM= −0.79
σSI
CM= 0.93
-12
-10
-8
-6
-4
-2
0
2
4
-12 -10 -8 -6 -4 -2 0 2 4
log10(p0)CM
log10(p
0 SP)
SPARC vs. CM
∆SP
CM= −0.53
σSP
CM= 0.86
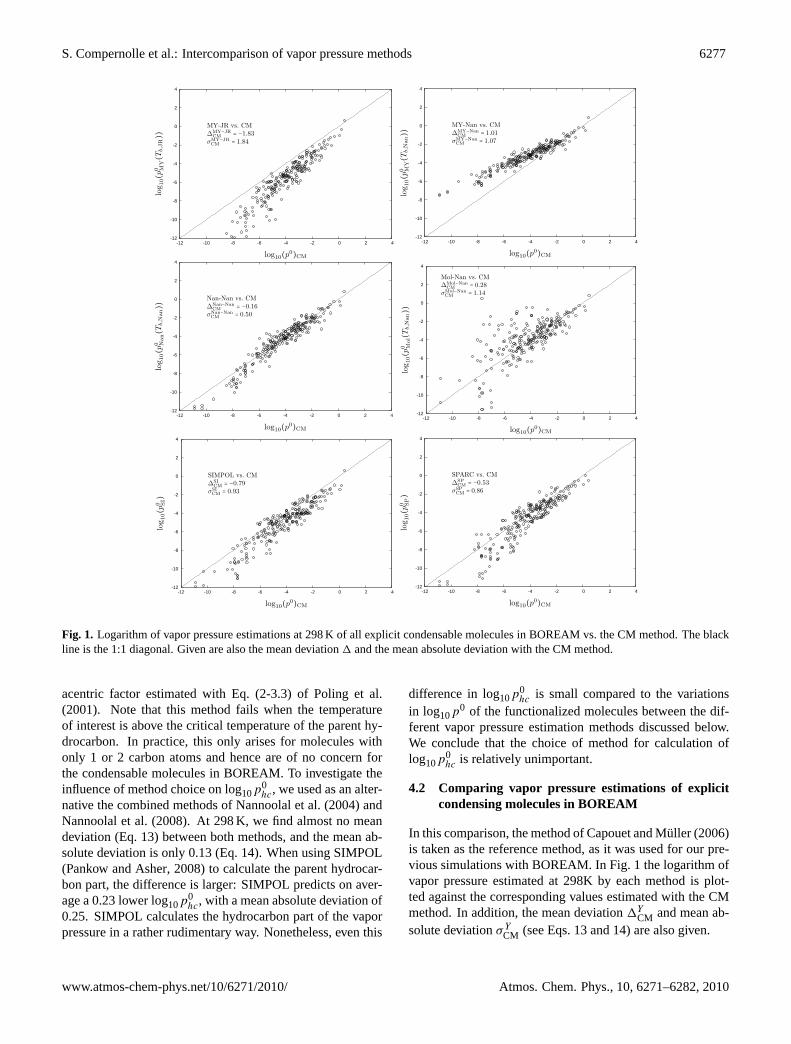
Fig. 1. Logarithm of vapor pressure estimations at 298 K of all explicit condensable moleculesin BOREAM vs. the CM method. The black line is the 1:1 diagonal. Given are also the meandeviation ∆ and the mean absolute deviation with the CM method.
31
Fig. 1. Logarithm of vapor pressure estimations at 298 K of all explicit condensable molecules in BOREAM vs. the CM method. The blackline is the 1:1 diagonal. Given are also the mean deviation1 and the mean absolute deviation with the CM method.
acentric factor estimated with Eq. (2-3.3) ofPoling et al.(2001). Note that this method fails when the temperatureof interest is above the critical temperature of the parent hy-drocarbon. In practice, this only arises for molecules withonly 1 or 2 carbon atoms and hence are of no concern forthe condensable molecules in BOREAM. To investigate theinfluence of method choice on log10p
0hc, we used as an alter-
native the combined methods ofNannoolal et al.(2004) andNannoolal et al.(2008). At 298 K, we find almost no meandeviation (Eq.13) between both methods, and the mean ab-solute deviation is only 0.13 (Eq.14). When using SIMPOL(Pankow and Asher, 2008) to calculate the parent hydrocar-bon part, the difference is larger: SIMPOL predicts on aver-age a 0.23 lower log10p
0hc, with a mean absolute deviation of
0.25. SIMPOL calculates the hydrocarbon part of the vaporpressure in a rather rudimentary way. Nonetheless, even this
difference in log10p0hc is small compared to the variations
in log10p0 of the functionalized molecules between the dif-
ferent vapor pressure estimation methods discussed below.We conclude that the choice of method for calculation oflog10p
0hc is relatively unimportant.
4.2 Comparing vapor pressure estimations of explicitcondensing molecules in BOREAM
In this comparison, the method ofCapouet and Muller (2006)is taken as the reference method, as it was used for our pre-vious simulations with BOREAM. In Fig.1 the logarithm ofvapor pressure estimated at 298K by each method is plot-ted against the corresponding values estimated with the CMmethod. In addition, the mean deviation1Y
CM and mean ab-solute deviationσ Y
CM (see Eqs.13and14) are also given.
www.atmos-chem-phys.net/10/6271/2010/ Atmos. Chem. Phys., 10, 6271–6282, 2010
6278 S. Compernolle et al.: Intercomparison of vapor pressure methods
4.2.1 MY-JR
It can be seen that MY-JR predicts considerably lower va-por pressures as compared with the CM method for practi-cally all explicit condensable molecules in BOREAM (calledBOREAM-molecule hereafter), and this deviation is largerfor the lower vapor pressures. It is a known shortcoming ofthe JR boiling point estimation method to overpredict highboiling points because of the linearity assumption (Eq. (2),see e.g.Stein and Brown, 1994), which leads to a severe un-derprediction of the low vapor pressures, almost irrespectiveof the exact vapor pressure estimation method used (Barleyand McFiggans, 2010). Therefore, we can only advise not touse the JR method for SOA formation applications.
4.2.2 MY-Nan
As opposed to JR, the Nannoolal boiling point method iscarefully calibrated to reproduce the observed evolution ofboiling point with molecule size. The MY-Nan methodagrees with CM for the highest vapor pressures, but starts
to deviate at log10p0
CMTorr =−2, and overpredicts the vapor pres-
sure by about 2 orders of magnitude at log10p0
CMTorr =−9. From
the current study alone it cannot be concluded which methodis closer to the true vapor pressure, but we note that an over-estimation of MY-Nan at lower vapor pressures (as opposedto both experiment and Nan-Nan) was noted byBarley andMcFiggans(2010).
The MY method starts from the Clausius-Clapeyron equa-tion assuming a constant difference of heat capacity:
R lnp0
atm≈−1Sb
(Tb−T
T
)+1Cp
(Tb−T
T−ln
Tb
T
)(15)
It can be anticipated that the assumption of constant1Cp
will break down from a certain differenceTb−T on. Meth-ods based on the Antoine equation (Nannoolal et al., 2008;Moller et al., 2008, see below) have probably a wider rangeof applicability. However, more investigation is needed toclarify which method is closer to the true experimental vaporpressure.
4.2.3 Nan-Nan
When combining both the Nannoolal boiling point and va-por pressure method (Nan-Nan) a remarkably good agree-ment with CM is obtained. This is somewhat surprising asboth pN,Tb,N are very detailed methods and based on thelarge and recommended Dortmund Data Bank, while the CMmethod is a relatively simple method based on a limited setof vapor pressures.
As explained in Sect.2.7, the group-group interactions inthe method ofNannoolal et al.(2008) become unimportantfor highly polyfunctional molecules. We checked this by set-ting GI=0 in the method ofNannoolal et al.(2008) and com-paring with the original method: the systematic difference
in log10(p) is only 0.12, and the mean absolute differenceonly 0.14. This is a relatively small difference, which ar-guably does not justify the large number of parameters, oftenconstrained by only a few measurements, needed to calcu-late GI. We note in this respect thatBarley and McFiggans(2010) devised a simplified version of the method ofNan-noolal et al.(2008), with fewer parameters and without groupinteractions, and found that this method performed almost aswell as the original method when tested against their experi-mental vapor pressures.
4.2.4 Mol-Nan
The Moller method is a close successor to the Nannoolalvapor pressure method. Although a good agreement is ob-tained with both CM and Nan-Nan for a large number ofSOA products (Fig.1) there are also many outliers, with bothlarge under- and overestimations in comparison to CM. Notethat these large outliers disappear when GI is set to zero inEq. (13). Striking examples of vapor pressure overestima-tion include the following cases. The vapor pressure of theBOREAM-molecule CHOH(C(CH3)2OH)CH2COCOCH3,with 7 carbon atoms and four functional groups, is pre-dicted to be 0.33 Torr at 298 K, about the same vapor pres-sure as that of the small molecule 1-heptanol (experimen-tal vapor pressure: 0.22 Torr), with only 1 functional group.HOCH2(CHOH)8CH2OH has a predicted vapor pressureof 2×10⁻³ Torr at 298 K, about 1/3 of the experimental va-por pressure of 1-decanol (7×10⁻³ Torr), while the moleculeHOCH2(COCHOH)4CHO, is calculated to have a nega-tive enthalpy of vaporization, and as a consequence thecalculated vapor pressure becomes unrealistically large at298 K (>1.7×1034 Torr) (these last two examples are notBOREAM-molecules, but are included to show the limitingbehaviour). In the latter case, the overestimation is caused bythe large negative, and badly constrained (only 2 measure-ments) alcohol-keto group interaction term. However, thegeneral cause of the wrong behaviour can be attributed to theway group interactions are counted (see Eq.13) in the Mollermethod, where the GI term dominates the group contributionterms in presence of many functional groups. Currently, themethod has been reworked by Moller and coworkers basedon this analysis, and a correction will be published shortly(B. Moller, personal communication, 2010; see also the dis-cussion phase of this work).
We mention finally that this anomaly is unrelated to theone mentioned byBarley et al.(2009), where a steep in-crease in vapor pressure was observed between the C5 andC6 diacids. Our implemented version following the publi-cation ofMoller et al. (2008) suffers from exactly the sameproblem. This error is also corrected in the reworked ver-sion. As the BOREAM-molecules tested here do not includediacids with less than 10 atoms, it is unimportant for thepresent intercomparison exercise.
Atmos. Chem. Phys., 10, 6271–6282, 2010 www.atmos-chem-phys.net/10/6271/2010/
S. Compernolle et al.: Intercomparison of vapor pressure methods 6279
Table 6. log10(p0
Torr) as estimated by the different vapor pressure methods to some experimentally identifiedα-pinene oxidation products.
CM MY-JR MY-Nan Nan-Nan Mol-Nan SIMPOL SPARC
pinonaldehyde −1.17 −1.73 −0.93 −1.04 −1.04 −1.80 −1.15pinonic acid −3.52 −4.44 −2.78 −3.49 −4.15 −4.0 −4.55pinic acid −5.34 −6.51 −4.08 −5.29 −5.78 −6.14 −7.45MBTCAa
−8.26 −10.2 −6.38 −9.17 −6.73 −9.21 −7.73terpenylic acidb −2.53 −3.54 −3.90 −4.55 −5.69 −3.37 −5.022-hydroxy terpenylic acidb −4.56 −6.10 −5.21 −6.84 −8.76 −5.55 −6.52diaterpenylic acid acetateb
−6.88 −8.92 −4.99 −7.04 −7.28 −7.71 −5.97
a 3-methyl-1,2,3-butane-tricarboxylic acid was characterized bySzmigielski et al.(2007).b These molecules were characterized byClaeys et al.(2009).
In any case, the fact that this method came out as the bestfrom the assessment ofBarley and McFiggans(2010), im-plies that it can be applied to molecules with a limited num-ber of functional groups.
4.2.5 SIMPOL and SPARC
SIMPOL predicts lower vapor pressures compared to the CMmethod for the large majority of compounds. This is for thelargest part due to the higher vapor pressures CM predictsfor tertiary alcohols, while SIMPOL makes no distinction be-tween primary, secondary and tertiairy alcohols. A second,less important, reason is the lower vapor pressure SIMPOLpredicts for the carbon skeleton.
SPARC predicts on average lower vapor pressures com-pared to the CM method, but there is considerable overlapbetween both methods.
4.2.6 Sensitivity test: group interaction parameters forhydroperoxides and peracids in MY-Nan, Nan-Nan and Mol-Nan
As explained above, no group interaction parameters couldbe obtained for hydroperoxides, peracids and peroxy acylnitrates in the methods ofNannoolal et al.(2004, 2008);Moller et al. (2008). However, especially for the hydrogen-bonding hydroperoxides and peracids they could be impor-tant. Therefore, we recalculated the vapor pressures of theBOREAM molecules with the methods MY-Nan, Nan-Nanand Mol-Nan, but where hydroperoxides are counted as al-cohols and peracids as acids in the calculation of the GI termof Nannoolal et al.(2004, 2008); Moller et al.(2008). Theselast calculations are refered to as the analogy test, while theoriginal calculations (with zero group interaction parame-ters for OOH and C(=O)OOH) are the base case. Over thewhole set of molecules, most of which do not contain theOOH or C(=O)OOH group, the mean deviation and meanabsolute deviation of the analogy test compared to the basecase for MY-Nan and Nan-Nan log10p
0 is negligible (0.02or smaller), while for Mol-Nan an on average 0.25 lower
log10p0 is predicted. Hence the basic conclusions of the
comparisons above are not changed. Considering the meandeviation and mean absolute deviation only over the com-pounds with OOH and/or C(=O)OOH groups, log10p
0 fromthe analogy test are still only marginally different from thebase case for MY-Nan and Nan-Nan (less than 0.1), whilefor Mol-Nan, vapor pressures are about an order of magni-tude lower with the analogy test calculations compared to thebase case. Clearly, the agressive scaling of the GI parameterof the method ofMoller et al. (2008) is responsible for thishigh sensitivity.
5 Application of vapor pressure methods toexperimentally found α-pinene oxidation products
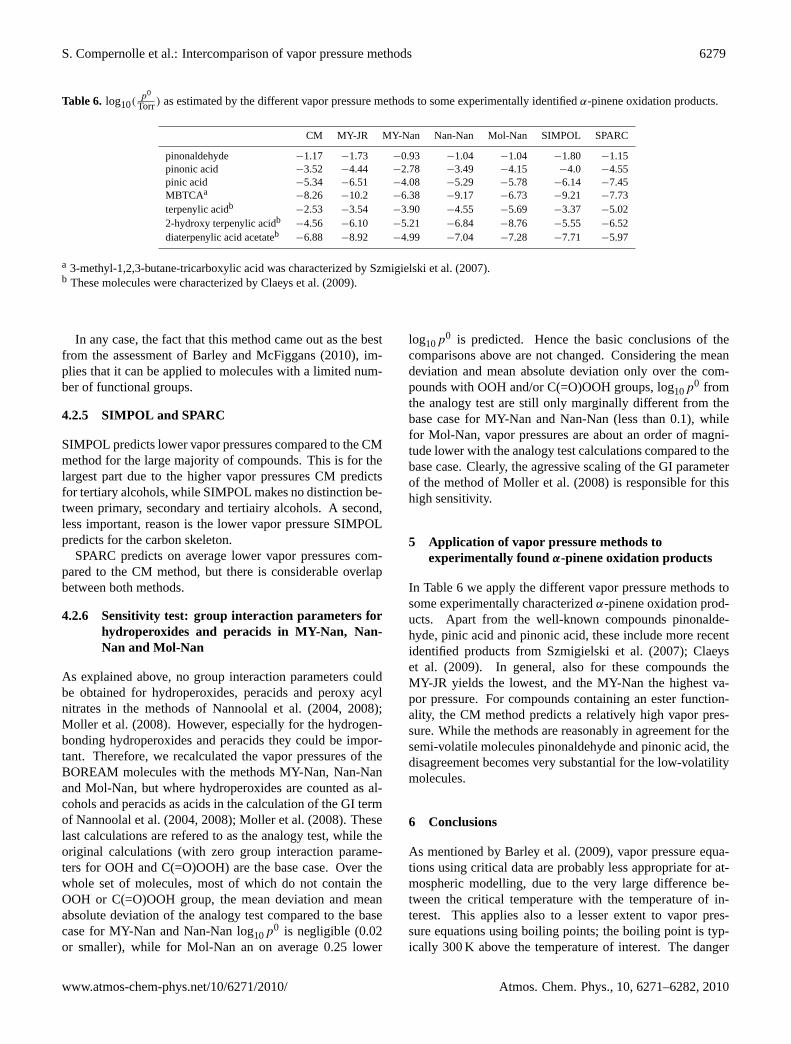
In Table6 we apply the different vapor pressure methods tosome experimentally characterizedα-pinene oxidation prod-ucts. Apart from the well-known compounds pinonalde-hyde, pinic acid and pinonic acid, these include more recentidentified products fromSzmigielski et al.(2007); Claeyset al. (2009). In general, also for these compounds theMY-JR yields the lowest, and the MY-Nan the highest va-por pressure. For compounds containing an ester function-ality, the CM method predicts a relatively high vapor pres-sure. While the methods are reasonably in agreement for thesemi-volatile molecules pinonaldehyde and pinonic acid, thedisagreement becomes very substantial for the low-volatilitymolecules.
6 Conclusions
As mentioned byBarley et al.(2009), vapor pressure equa-tions using critical data are probably less appropriate for at-mospheric modelling, due to the very large difference be-tween the critical temperature with the temperature of in-terest. This applies also to a lesser extent to vapor pres-sure equations using boiling points; the boiling point is typ-ically 300 K above the temperature of interest. The danger
www.atmos-chem-phys.net/10/6271/2010/ Atmos. Chem. Phys., 10, 6271–6282, 2010
6280 S. Compernolle et al.: Intercomparison of vapor pressure methods
of bad extrapolation from this boiling point is exemplifiedby the large differences between the methods ofMyrdal andYalkowsky (1997) and Nannoolal et al.(2008), using thesame boiling point estimation method. Another drawbackis that for some types of compounds (peroxy acyl nitrates,hydroperoxides and peracids) no boiling points are avail-able as they decompose before the boiling point is reached;in this work we had to extend the methods ofJoback andReid (1987); Nannoolal et al.(2004, 2008); Moller et al.(2008) with estimated boiling points. At first sight, itseems unnecessarily complicated to have to estimate a boil-ing point for molecules for which vapor pressure data atroom-temperature are available, while in the end one is onlyinterested to estimate vapor pressures for ambient conditions.This is a drawback that direct estimation methods (Pankowand Asher, 2008; Capouet and Muller, 2006) do not have. Onthe other hand, direct estimation of vapor pressure at a giventemperature is much more difficult than estimation of a boil-ing temperature for a given pressure (see discussion phase ofthis work). Hence the estimation of a normal boiling point isa convenient starting point to estimate a vapor pressure, evenif this boiling point is far above the temperature of interest.
One of the methods (Moller et al., 2008) showed anoma-lous behaviour for certain polyfunctional compounds. Thisis not simply due to some bad parameters but rather due tothe mathematical formulation of the method. Ultimately, thistouches the problem of how the contributions of the func-tional groups to the vapor pressure should scale for highlypolyfunctional molecules. Group interaction terms are, inessence, corrections to the group contributions obtained formonofunctional molecules. In the formulation ofNannoolalet al. (2008) these corrections become negligible for highlypolyfunctional molecules, while for the method ofMolleret al. (2008) they become dominant and scale agressively.The truth is probably in the middle of both extremes, withgroup interactions being significant, but not dominant com-pared to the basic group contributions. Adressing this prob-lem is essential if one wants to predict reliably the vapor pres-sure of highly polyfunctional compounds. Another problemof the group-interaction approach of the methods ofNan-noolal et al.(2008) and ofMoller et al. (2008) is the largenumber of parameters necessary, while data for polyfunc-tional molecules are scant and typically less precise. Hence amore concise approach to the problem of group interactionsseems to be justified.
The method MY-JR (Myrdal and Yalkowsky, 1997;Joback and Reid, 1987) yields generally the lowest vaporpressure of all considered methods. Given the known over-prediction of high boiling points by JR (Stein and Brown,1994), this method is not recommended.
Assuming that partitioning to the aerosol phase followsEq. (1), the precise vapor pressure method will determine toa great extent the amount of aerosol simulated. This was il-lustrated byBarley and McFiggans(2010) and byCeulemanset al.(2010). In this last study, BOREAM was used to sim-
ulate a wide range ofα-pinene dark ozonolysis smog cham-ber experiments, and among other variables, also the vaporpressure method was varied in the simulation of the experi-ments ofPathak et al.(2007). The methods CMCapouet andMuller (2006) and Nan-Nan (Nannoolal et al., 2004, 2008)gave results closest to the experiments. SIMPOL (Pankowand Asher, 2008) overpredicted aerosol amounts, while MY-Nan (Myrdal and Yalkowsky, 1997; Nannoolal et al., 2004)underpredicted aerosol amounts considerably2. Of course,this does not necessarily imply that CM and Nan-Nan arethe “best”, as large uncertainties exist in the chemical mech-anism. For example, in a very recent publicationCamre-don et al.(2010) found the best agreement with experimen-tal aerosol yields ofα-pinene dark ozonolysis experimentsusing the method MY-JR (Myrdal and Yalkowsky, 1997;Joback and Reid, 1987), where MCMv3.1 (Jenkin et al.,1997; Jenkin, 2004) was the chemical mechanism, whileMY-JR would lead to large overpredictions in aerosol yieldwhen applied with BOREAM.
Acknowledgements.This work has been made possible by a grantof the Belgian Science Policy Office in the framework of theSSD program (2006–2010). The assistance of Lionel Carreiraand coworkers in the use of the on-line batch mode of SPARC isgratefully acknowledged.
Edited by: G. McFiggans
References
Ambrose, D. and Walton, J.: Vapour pressures up to their criti-cal temperatures of normal alkanes and 1-alkanols, Pure Appl.Chem., 61, 1395–1403, doi:10.1351/pac198961081395, 1989.
Balaban, A. T., Kier, L. B., and Joshi, N.: Correlations betweenchemical structure and normal boiling points of acyclic ethers,peroxides, acetals, and their sulfur analogs, J. Chem. Inf. Com-put. Sci., 32, 237–244, doi:10.1021/ci00007a011, 1992.
Barley, M., Topping, D. O., Jenkin, M. E., and McFiggans, G.: Sen-sitivities of the absorptive partitioning model of secondary or-ganic aerosol formation to the inclusion of water, Atmos. Chem.Phys., 9, 2919–2932, doi:10.5194/acp-9-2919-2009, 2009.
Barley, M. H. and McFiggans, G.: The critical assessment of vapourpressure estimation methods for use in modelling the formationof atmospheric organic aerosol, Atmos. Chem. Phys., 10, 749–767, doi:10.5194/acp-10-749-2010, 2010.
Bruckmann, P. W. and Willner, H.: Infrared Spectroscopic StudyOf Peroxyacetyl Nitrate (Pan) And Its Decomposition Products,Environ. Sci. Technol., 17, 352–357, 1983.
Camredon, M. and Aumont, B.: Assessment of vapor pressure esti-mation methods for secondary organic aerosol modeling, Atmos.Environ., 40, 2105–2116, doi:10.1016/j.atmosenv.2005.11.051,2006.
2The methods ofJoback and Reid(1987), of Moller et al.(2008)and ofHilal et al.(2003) were not considered in that work, as vaporpressure was not central in that work and because of the problemsencountered with the first two methods.
Atmos. Chem. Phys., 10, 6271–6282, 2010 www.atmos-chem-phys.net/10/6271/2010/
S. Compernolle et al.: Intercomparison of vapor pressure methods 6281
Camredon, M., Hamilton, J. F., Alam, M. S., Wyche, K. P., Carr, T.,White, I. R., Monks, P. S., Rickard, A. R., and Bloss, W. J.: Dis-tribution of gaseous and particulate organic composition duringdarkα-pinene ozonolysis, Atmos. Chem. Phys., 10, 2893–2917,doi:10.5194/acp-10-2893-2010, 2010.
Capouet, M. and Muller, J.-F.: A group contribution method forestimating the vapour pressures ofα-pinene oxidation products,Atmos. Chem. Phys., 6, 1455–1467, doi:10.5194/acp-6-1455-2006, 2006.
Capouet, M., Muller, J.-F., Ceulemans, K., Compernolle, S.,Vereecken, L., and Peeters, J.: Modeling aerosol formation inalpha-pinene photooxidation experiments, J. Geophys. Res., 113,D02308, doi:10.1029/2007JD008995, 2008.
Carreira, L. A., Hilal, S., and Karickhoff, S. W.: Estimation ofchemical reactivity parameters and physical properties of or-ganic molecules using SPARC, in: Theoretical and Computa-tional Chemistry, Quantitative Treatment of Solute/Solvent In-teractions, edited by: Politzer, P. and Murray, J. S., Elsevier Pub-lishers, 1, 291–353, 1994.
Ceulemans, K., Compernolle, S., Peeters, J., and Mller, J.-F.: Evalu-ation of a detailed model of secondary organic aerosol formationfrom [alpha]-pinene against dark ozonolysis experiments, Cor-rected Proof, doi:10.1016/j.atmosenv.2010.05.001, Atmos. Env-iron., in press, 2010.
Claeys, M., Iinuma, Y., Szmigielski, R., Surratt, J. D., Blockhuys,F., Van Alsenoy, C., Boge, O., Sierau, B., Gomez-Gonzalez,Y., Vermeylen, R., Van der Veken, P., Shahgholi, M., Chan, A.W. H., Herrmann, H., Seinfeld, J. H., and Maenhaut, W.: Ter-penylic Acid and Related Compounds from the Oxidation ofα-Pinene: Implications for New Particle Formation and Growthabove Forests, Environ. Sci. Technol., 43, 6976–6982, 2009.
Compernolle, S., Ceulemans, K., and Muller, J.-F.: Influence ofnon-ideality on condensation to aerosol, Atmos. Chem. Phys., 9,1325–1337, 2009,http://www.atmos-chem-phys.net/9/1325/2009/.
Egerton, A. C., Emte, W., and Minkoff, G. J.: Some properties oforganic peroxides, Discuss. Faraday Soc., 10, 278–282, 1951.
Engineering Sciences Data Unit Ltd: Vapour pressures and criticalpoints of liquids. Aliphatic and aromatic ethers, item No 95016,vol. 2d(ii), ESDU International, London, UK, 1995.
Engineering Sciences Data Unit Ltd: Vapour pressures and criticalpoints of liquids. XVIII: Additional esters of aliphatic carboxylicacids, item No 81003, vol. 2d(i), ESDU International, London,UK, 2001.
Hallquist, M., Wenger, J. C., Baltensperger, U., Rudich, Y., Simp-son, D., Claeys, M., Dommen, J., Donahue, N. M., George, C.,Goldstein, A. H., Hamilton, J. F., Herrmann, H., Hoffmann, T.,Iinuma, Y., Jang, M., Jenkin, M. E., Jimenez, J. L., Kiendler-Scharr, A., Maenhaut, W., McFiggans, G., Mentel, T. F., Monod,A., Prevot, A. S. H., Seinfeld, J. H., Surratt, J. D., Szmigiel-ski, R., and Wildt, J.: The formation, properties and impactof secondary organic aerosol: current and emerging issues, At-mos. Chem. Phys., 9, 5155–5236, doi:10.5194/acp-9-5155-2009,2009.
Hilal, S. H., Karickhoff, S. W., and Carreira, L. A.: Prediction of thevapor pressure boiling point, heat of vaporization and diffusioncoefficient of organic compounds, QSAR Comb. Sci., 22, 565–574, doi:10.1002/qsar.200330812, 2003.
Hilal, S. H., Karickhoff, S. W., and Carreira, L. A.: Prediction of
the solubility, activity coefficient and liquid/liquid partition coef-ficient of organic compounds, QSAR Comb. Sci., 23, 709–720,doi:10.1002/qsar.200430866, 2004.
Jenkin, M. E.: Modelling the formation and composition of sec-ondary organic aerosol fromα- andβ-pinene ozonolysis usingMCM v3, Atmos. Chem. Phys., 4, 1741–1757, doi:10.5194/acp-4-1741-2004, 2004.
Jenkin, M. E., Saunders, S. M., and Pilling, M. J.: The tropo-spheric degradation of volatile organic compounds: a protocolfor mechanism development, Atmos. Environ., 31, 81–104, doi:10.1016/S1352-2310(96)00105-7, 1997.
Joback, K. and Reid, R.: Estimation of Pure-Component Propertiesfrom Group-Contributions, Chem. Eng. Commun., 57, 233–243,1987.
Kacmarek, A. J. and Solomon, I. J., and Lustig, M.: Preparation andProperties of Peroxyacetyl Nitrate, J. Inorg. and Nucl. Chem., 40,574–576, 1978.
Marrero, J. and Gani, R.: Group-contribution based estimation ofpure component properties, Fluid Phase Equilibr., 183–184, 183–208, doi:10.1016/S0378-3812(01)00431-9, 2001.
Moller, B., Rarey, J., and Ramjugernath, D.: Estimation of thevapour pressure of non-electrolyte organic compounds via groupcontributions and group interactions, J. Mol. Liq., 143, 52–63,doi:10.1016/j.molliq.2008.04.020, 2008.
Myrdal, P. B. and Yalkowsky, S. H.: Estimating Pure Compo-nent Vapor Pressures of Complex Organic Molecules, Ind. Eng.Chem. Res., 36, 2494–2499, doi:10.1021/ie950242l, 1997.
Nannoolal, Y., Rarey, J., Ramjugernath, D., and Cordes, W.: Esti-mation of pure component properties: Part 1. Estimation of thenormal boiling point of non-electrolyte organic compounds viagroup contributions and group interactions, Fluid Phase Equi-libr., 226, 45–63, doi:10.1016/j.fluid.2004.09.001, 2004.
Nannoolal, Y., Rarey, J., and Ramjugernath, D.: Estimation of purecomponent properties: Part 3. Estimation of the vapor pressure ofnon-electrolyte organic compounds via group contributions andgroup interactions, Fluid Phase Equilibr., 269, 117–133, doi:10.1016/j.fluid.2008.04.020, 2008.
Pankow, J. F.: An absorption model of gas/particle partitioning oforganic compounds in the atmosphere, Atmos. Environ., 28, 185,doi:10.1016/1352-2310(94)90093-0, 1994.
Pankow, J. F. and Asher, W. E.: SIMPOL.1: a simple groupcontribution method for predicting vapor pressures and en-thalpies of vaporization of multifunctional organic compounds,Atmos. Chem. Phys., 8, 2773–2796, doi:10.5194/acp-8-2773-2008, 2008.
Pathak, R. K., Stanier, C. O., Donahue, N. M., and Pandis,S. N.: Ozonolysis of alpha-pinene at atmospherically relevantconcentrations: Temperature dependence of aerosol mass frac-tions (yields), J. Geophys. Res., 112, D03201, doi:10.1029/2006JD007436, 2007.
Poling, B. E., Prausnitz, J. M., and O’Connell, J. P.: The proper-ties of gases and liquids, McGraw-Hill, New York, USA, 5 edn.,2001.
Sanchez, J. and Myers, T. N.: Peroxides and Peroxide Compounds,Organic Peroxides, vol. 18 ofKirk-Othmer Encyclopedia ofChemical Technology, Wiley, 4 edn., doi:10.1002/0471238961.1518070119011403.a01, 2000.
Stein, S. E. and Brown, R. L.: Estimation of normal boiling pointsfrom group contributions, J. Chem. Inf. Comp. Sci., 34, 581–587,
www.atmos-chem-phys.net/10/6271/2010/ Atmos. Chem. Phys., 10, 6271–6282, 2010
6282 S. Compernolle et al.: Intercomparison of vapor pressure methods
doi:10.1021/ci00019a016, 1994.Szmigielski, R., Surratt, J. D., Gomez-Gonzalez, Y., Van der Veken,
P., Kourtchev, I., Vermeylen, R., Blockhuys, F., Jaoui, M., Klein-dienst, T. E., Lewandowski, M., Offenberg, J. H., Edney, E. O.,Seinfeld, J. H., Maenhaut, W., and Claeys, M.: 3-methyl-1,2,3-butanetricarboxylic acid: An atmospheric tracer for terpene sec-ondary organic aerosol, Geophys. Res. Lett., 34, L24811, doi:10.1029/2007GL031338, 2007.
Vereecken, L., Muller, J.-F., and Peeters, J.: Low-volatilitypoly-oxygenates in the OH-initiated atmospheric oxidation ofα-pinene: impact of non-traditional peroxyl radical chem-istry, Phys. Chem. Chem. Phys., 9, 5241–5248, doi:10.1039/b708023a, 2007.
Atmos. Chem. Phys., 10, 6271–6282, 2010 www.atmos-chem-phys.net/10/6271/2010/
![Solid-phase extraction and GC-MS analysis of potentially ...the volatile CP species were not addressed, and their quantification is missing [31]. Selected volatile target CPs have](https://static.fdocument.org/doc/165x107/5e717b2b3573cb243915450b/solid-phase-extraction-and-gc-ms-analysis-of-potentially-the-volatile-cp-species.jpg)