Surface Density-Induced Pleating of a Lipid Monolayer ... · Lipid Monolayer Drives Nascent...
12
Structure, Volume 23 Supplemental Information Surface Density-Induced Pleating of a Lipid Monolayer Drives Nascent High-Density Lipoprotein Assembly Jere P. Segrest, Martin K. Jones, Andrea Catte, Medha Manchekar, Geeta Datta, Lei Zhang, Robin Zhang, Ling Li, James C. Patterson, Mayakonda N. Palgunachari, Jack F. Oram, and Gang Ren
Transcript of Surface Density-Induced Pleating of a Lipid Monolayer ... · Lipid Monolayer Drives Nascent...
Structure, Volume 23
Supplemental Information
Surface Density-Induced Pleating of a
Lipid Monolayer Drives Nascent
High-Density Lipoprotein Assembly
Jere P. Segrest, Martin K. Jones, Andrea Catte, Medha Manchekar, Geeta Datta, LeiZhang, Robin Zhang, Ling Li, James C. Patterson, Mayakonda N. Palgunachari, Jack F.Oram, and Gang Ren
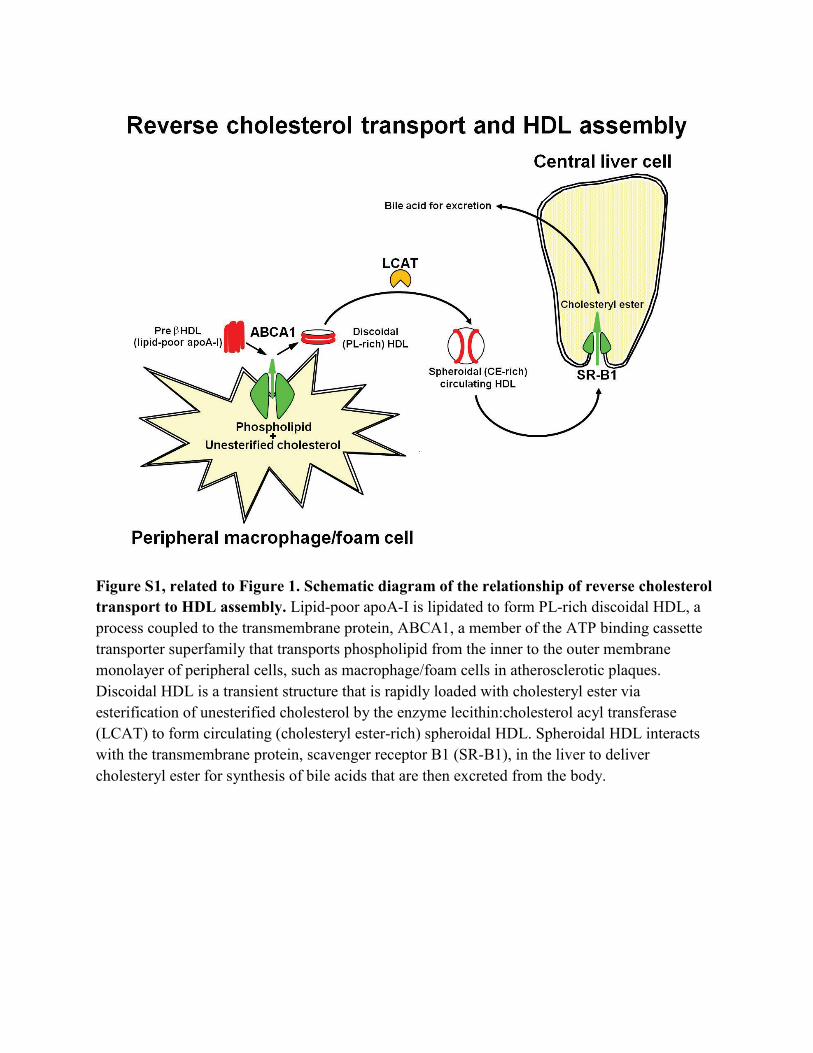
Figure S1, related to Figure 1. Schematic diagram of the relationship of reverse cholesterol transport to HDL assembly. Lipid-poor apoA-I is lipidated to form PL-rich discoidal HDL, a process coupled to the transmembrane protein, ABCA1, a member of the ATP binding cassette transporter superfamily that transports phospholipid from the inner to the outer membrane monolayer of peripheral cells, such as macrophage/foam cells in atherosclerotic plaques. Discoidal HDL is a transient structure that is rapidly loaded with cholesteryl ester via esterification of unesterified cholesterol by the enzyme lecithin:cholesterol acyl transferase (LCAT) to form circulating (cholesteryl ester-rich) spheroidal HDL. Spheroidal HDL interacts with the transmembrane protein, scavenger receptor B1 (SR-B1), in the liver to deliver cholesteryl ester for synthesis of bile acids that are then excreted from the body.
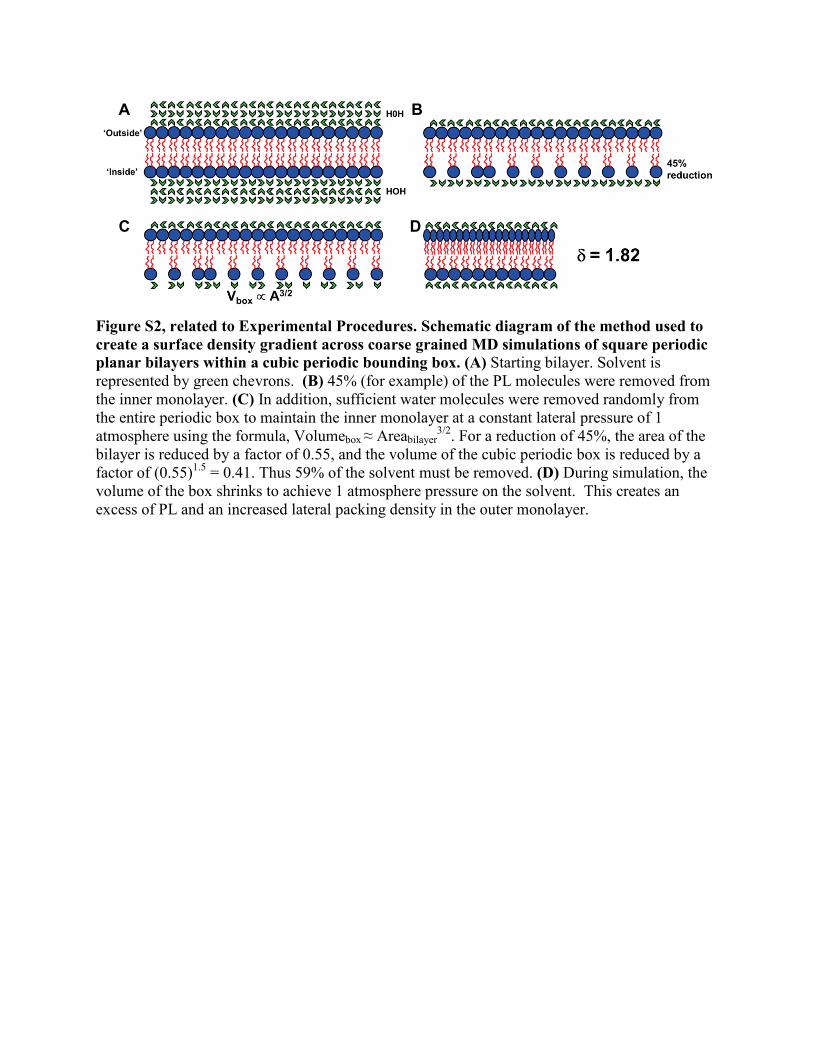
Figure S2, related to Experimental Procedures. Schematic diagram of the method used to create a surface density gradient across coarse grained MD simulations of square periodic planar bilayers within a cubic periodic bounding box. (A) Starting bilayer. Solvent is represented by green chevrons. (B) 45% (for example) of the PL molecules were removed from the inner monolayer. (C) In addition, sufficient water molecules were removed randomly from the entire periodic box to maintain the inner monolayer at a constant lateral pressure of 1 atmosphere using the formula, Volumebox ≈ Areabilayer
3/2. For a reduction of 45%, the area of the bilayer is reduced by a factor of 0.55, and the volume of the cubic periodic box is reduced by a factor of (0.55)1.5 = 0.41. Thus 59% of the solvent must be removed. (D) During simulation, the volume of the box shrinks to achieve 1 atmosphere pressure on the solvent. This creates an excess of PL and an increased lateral packing density in the outer monolayer.
A B
C D
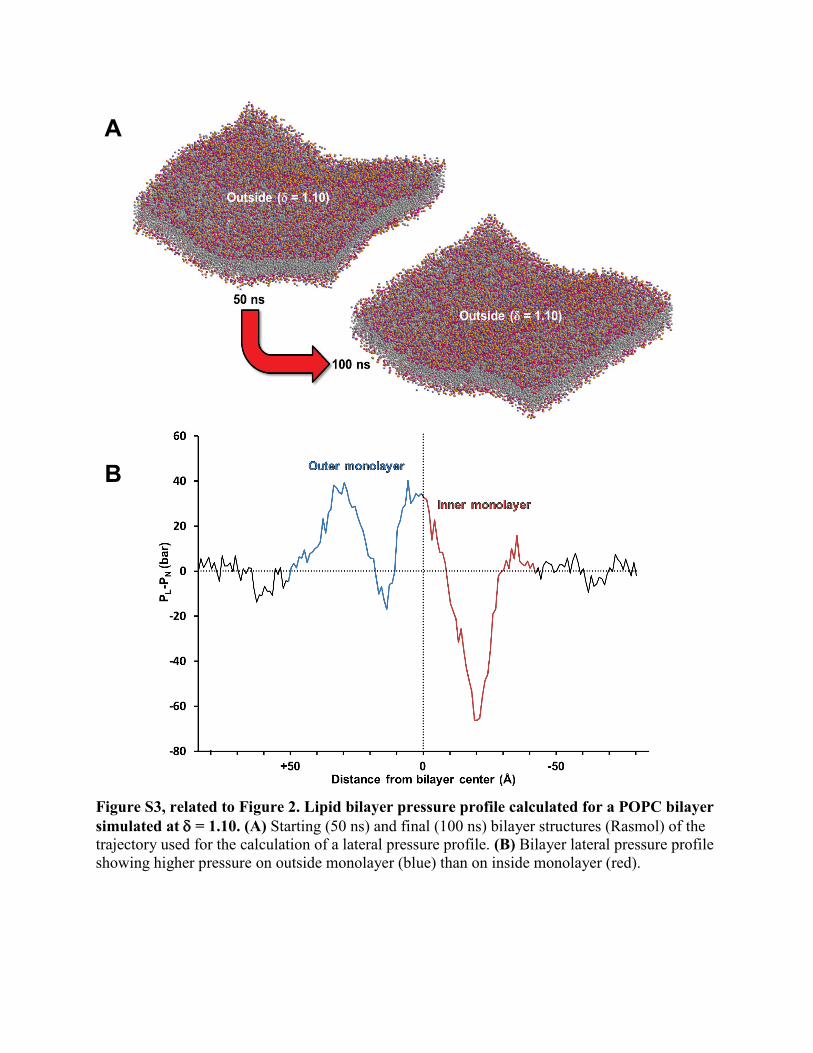
Figure S3, related to Figure 2. Lipid bilayer pressure profile calculated for a POPC bilayer simulated at δ = 1.10. (A) Starting (50 ns) and final (100 ns) bilayer structures (Rasmol) of the trajectory used for the calculation of a lateral pressure profile. (B) Bilayer lateral pressure profile showing higher pressure on outside monolayer (blue) than on inside monolayer (red).
A
B
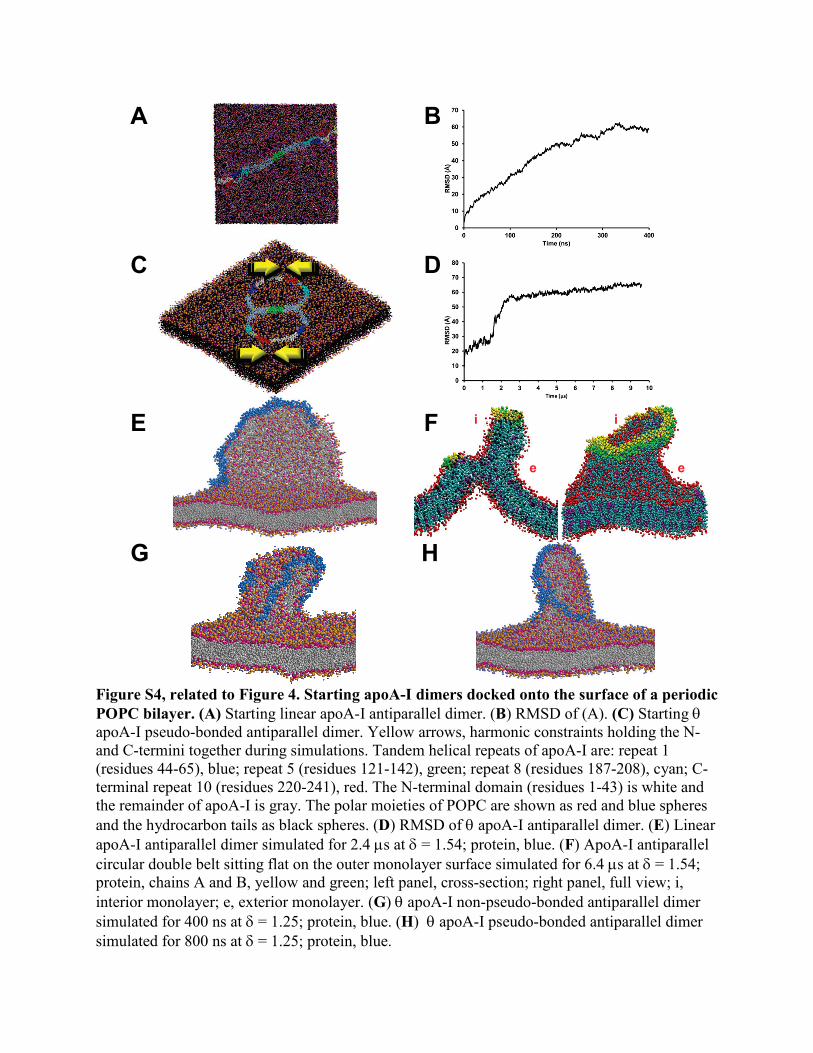
Figure S4, related to Figure 4. Starting apoA-I dimers docked onto the surface of a periodic POPC bilayer. (A) Starting linear apoA-I antiparallel dimer. (B) RMSD of (A). (C) Starting θ apoA-I pseudo-bonded antiparallel dimer. Yellow arrows, harmonic constraints holding the N- and C-termini together during simulations. Tandem helical repeats of apoA-I are: repeat 1 (residues 44-65), blue; repeat 5 (residues 121-142), green; repeat 8 (residues 187-208), cyan; C-terminal repeat 10 (residues 220-241), red. The N-terminal domain (residues 1-43) is white and the remainder of apoA-I is gray. The polar moieties of POPC are shown as red and blue spheres and the hydrocarbon tails as black spheres. (D) RMSD of θ apoA-I antiparallel dimer. (E) Linear apoA-I antiparallel dimer simulated for 2.4 µs at δ = 1.54; protein, blue. (F) ApoA-I antiparallel circular double belt sitting flat on the outer monolayer surface simulated for 6.4 µs at δ = 1.54; protein, chains A and B, yellow and green; left panel, cross-section; right panel, full view; i, interior monolayer; e, exterior monolayer. (G) θ apoA-I non-pseudo-bonded antiparallel dimer simulated for 400 ns at δ = 1.25; protein, blue. (H) θ apoA-I pseudo-bonded antiparallel dimer simulated for 800 ns at δ = 1.25; protein, blue.
A
C
B
D
E F
G H
i i
e e
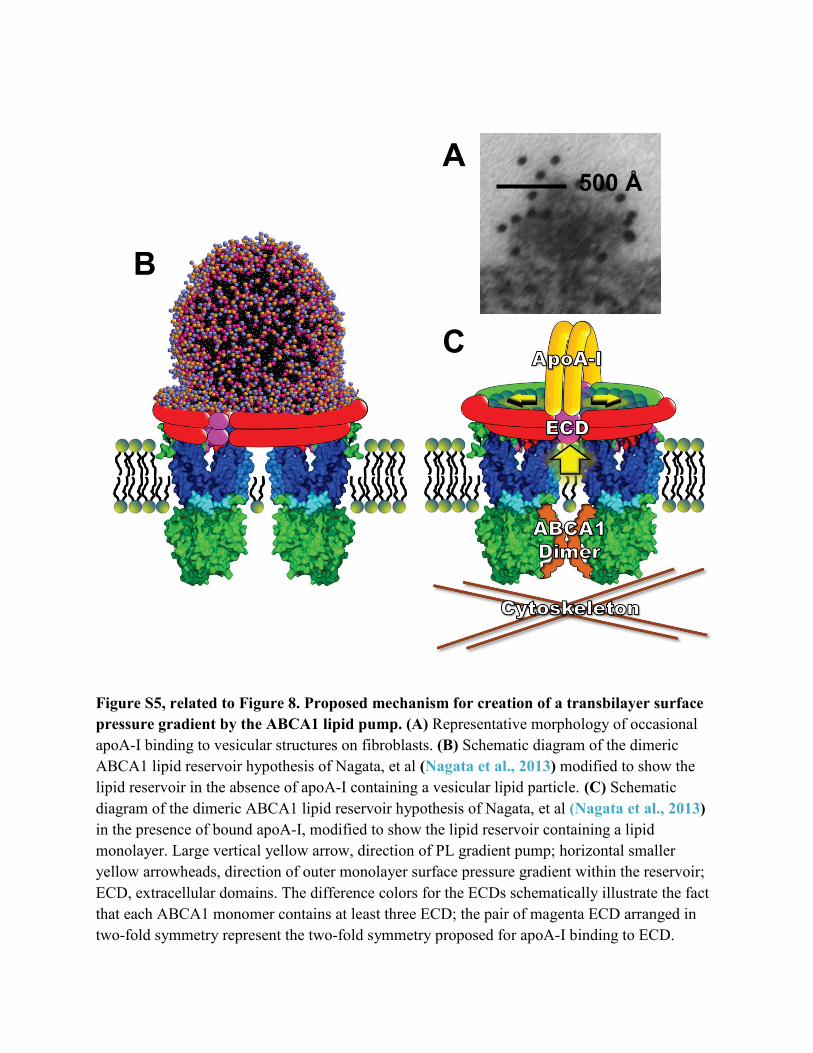
Figure S5, related to Figure 8. Proposed mechanism for creation of a transbilayer surface pressure gradient by the ABCA1 lipid pump. (A) Representative morphology of occasional apoA-I binding to vesicular structures on fibroblasts. (B) Schematic diagram of the dimeric ABCA1 lipid reservoir hypothesis of Nagata, et al (Nagata et al., 2013) modified to show the lipid reservoir in the absence of apoA-I containing a vesicular lipid particle. (C) Schematic diagram of the dimeric ABCA1 lipid reservoir hypothesis of Nagata, et al (Nagata et al., 2013) in the presence of bound apoA-I, modified to show the lipid reservoir containing a lipid monolayer. Large vertical yellow arrow, direction of PL gradient pump; horizontal smaller yellow arrowheads, direction of outer monolayer surface pressure gradient within the reservoir; ECD, extracellular domains. The difference colors for the ECDs schematically illustrate the fact that each ABCA1 monomer contains at least three ECD; the pair of magenta ECD arranged in two-fold symmetry represent the two-fold symmetry proposed for apoA-I binding to ECD.
A
C
B
500 Å
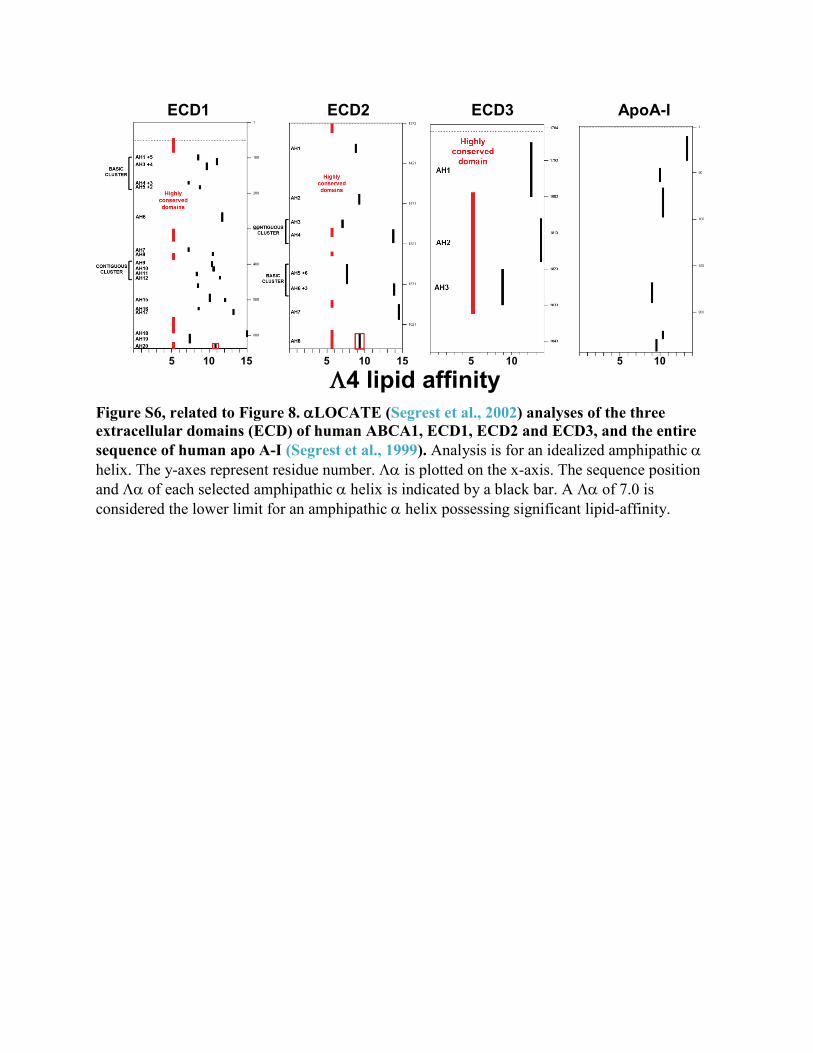
Figure S6, related to Figure 8. αLOCATE (Segrest et al., 2002) analyses of the three extracellular domains (ECD) of human ABCA1, ECD1, ECD2 and ECD3, and the entire sequence of human apo A-I (Segrest et al., 1999). Analysis is for an idealized amphipathic α helix. The y-axes represent residue number. Λα is plotted on the x-axis. The sequence position and Λα of each selected amphipathic α helix is indicated by a black bar. A Λα of 7.0 is considered the lower limit for an amphipathic α helix possessing significant lipid-affinity.
ECD1 ECD2 ECD3 ApoA-I
5 10 5 10 5 10 5 10 15 15
Λ4 lipid affinity
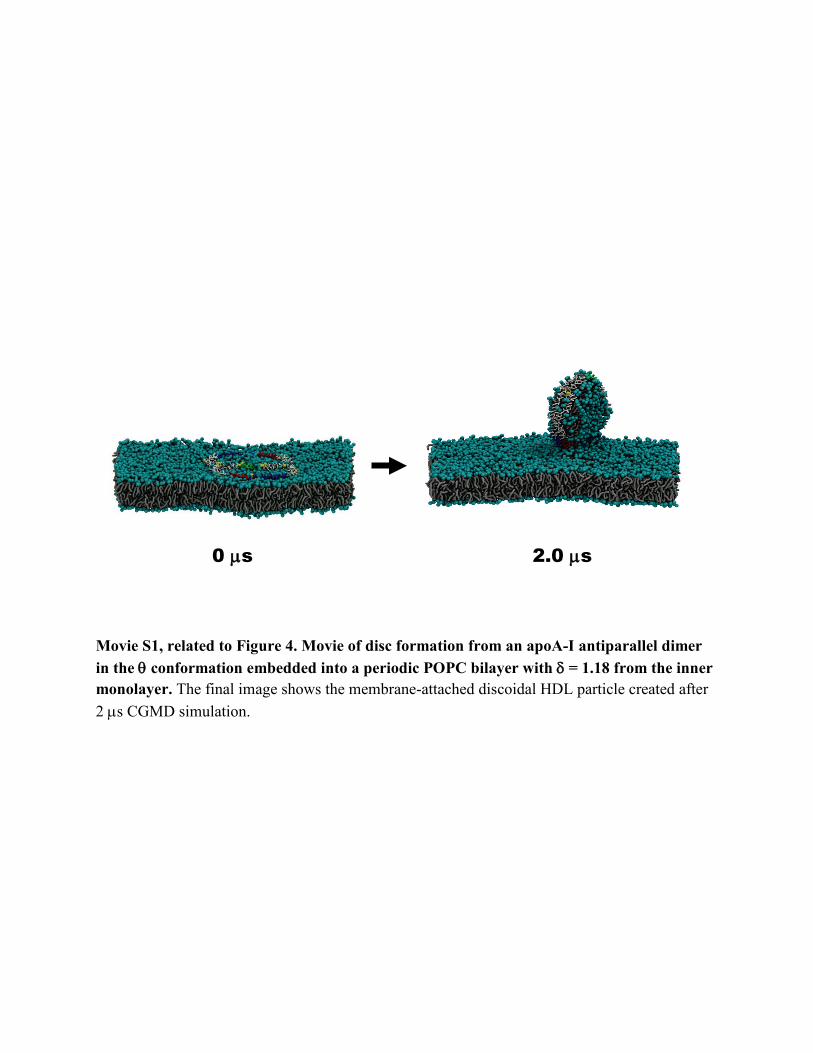
Movie S1, related to Figure 4. Movie of disc formation from an apoA-I antiparallel dimer in the θ conformation embedded into a periodic POPC bilayer with δ = 1.18 from the inner monolayer. The final image shows the membrane-attached discoidal HDL particle created after 2 µs CGMD simulation.
2.0 µs 0 µs
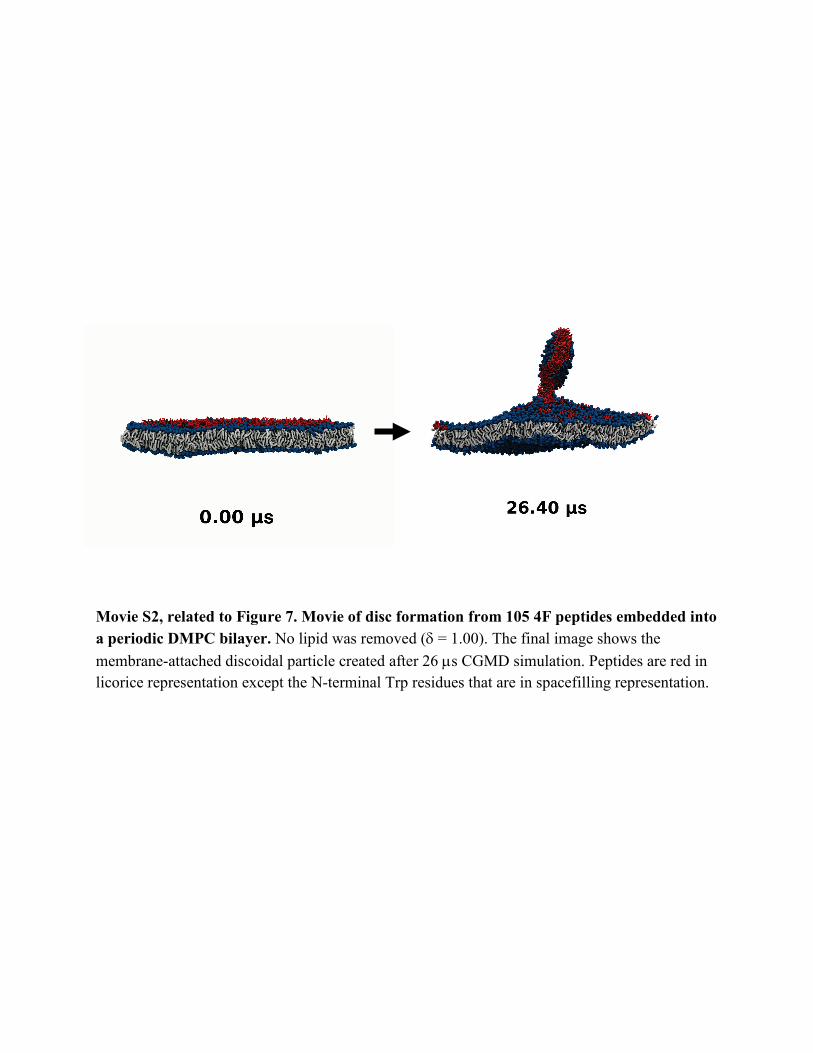
Movie S2, related to Figure 7. Movie of disc formation from 105 4F peptides embedded into a periodic DMPC bilayer. No lipid was removed (δ = 1.00). The final image shows the membrane-attached discoidal particle created after 26 µs CGMD simulation. Peptides are red in licorice representation except the N-terminal Trp residues that are in spacefilling representation.
SUPPLEMENTAL EXPERIMENTAL PROCEDURES Lateral Pressure Profile. To calculate the lateral pressure profile for a CG POPC bilayer that was simulated for 100 ns with δ = 1.10, a special version of Gromacs 4.0.2 that can calculate local pressure fields (Ollila et al., 2009) was downloaded and compiled from http://md.chem.rug.nl/cgmartini/index.php/tools2/other-tools (now also available from https://github.com/ohsOllila/pressure-tools) as was the accompanying pressure tools programs that can calculate the profile from the localpressure.dat file. Because the bilayer had undulations, the profile was calculated by rerunning the trajectory between 50 ns and 100 ns. The grid size was set to 1.0 Å by setting the “userreal1” parameter to 0.1 in the mdp file before the grompp program was run to create the tpr file.
ApoA-I Circular Double Belt Simulation with Increased δ. The first 32 residues of the N-terminus of apoA-I were rotated as in the lipid-mimetic solution NMR structure of apoA-I in order to have their hydrophobic face oriented towards the hydrophobic surface of the lipids. The initial system containing 2510 lipid molecules was generated by enlarging a CG version of the AA model lipid raft membrane simulated by Niemelä et al. in 2007 (Niemela et al., 2007). The lipid molar ratio was also adjusted to reproduce a “close-to-real” macrophage cell composition as reported by Gaus et al. in 2005 (Gaus et al., 2005). The final lipid raft composition was 1124 POPC, 408 POPE, 82 SM (SM: sphingomyelin, the CG name of the molecule is PPCS) and 896 CHOL molecules, giving a final [PL]/[CHOL] molar ratio of 1.8. This starting lipid membrane was subjected to the docking of an apoA-I dimer and to 2000 steps of energy minimization to remove steric clashes. We used Periodic Boundary Conditions and a solvation with about 30 CG water molecules/lipid (corresponding to about 120 real water molecules/lipid) using the genbox command of Gromacs (Hess et al., 2008). This high hydration level was required to prevent the interaction between the periodic images of the protein and of the lower leaflet of the lipid membrane in the z-coordinate. The solvated lipid raft membrane-protein was also subjected to the addition of 18 Na+ ions to neutralize the system and to further 2000 steps of energy minimization to reduce steric contacts. The total number of beads in this energy minimized starting system, including proteins, lipids, water and ions reached a maximum of approximately 106,000 beads , corresponding to about 594,000 atoms.
CG MD simulations were performed using Gromacs version 4.0 (Hess et al., 2008) on 32 processors of a 256-processor Beowulf cluster. The MARTINI CG force field for lipids (Marrink et al., 2004; Marrink et al., 2007) and proteins (Monticelli et al., 2008) version 2.1 were used. Non-bonded van der Waals and electrostatics interactions were truncated using a cutoff distance of 12 Å. The PME treatment of long range electrostatic interactions was employed. Temperature and pressure for all simulated particles were stabilized at 310 K and 1 atm, respectively, using Berendsen’s (Berendsen et al., 1984) temperature and pressure baths. Coordinate trajectories were updated every 10 ps for all coarse grained MD simulations. The majority of protein residues had an α-helical conformation and the remaining residues were in a
β-turn conformation (the prolines punctuating the helixes of apoA-I and the residues of the Gly-Gly-Ala region of apoA-I (amino acid residues 185-187), the first and last two residues of apoA-I were in random coil conformation (Jones et al., 2010). The analysis was performed with the software VMD (Humphrey et al., 1996), and images of the simulated structures were generated with the same software.
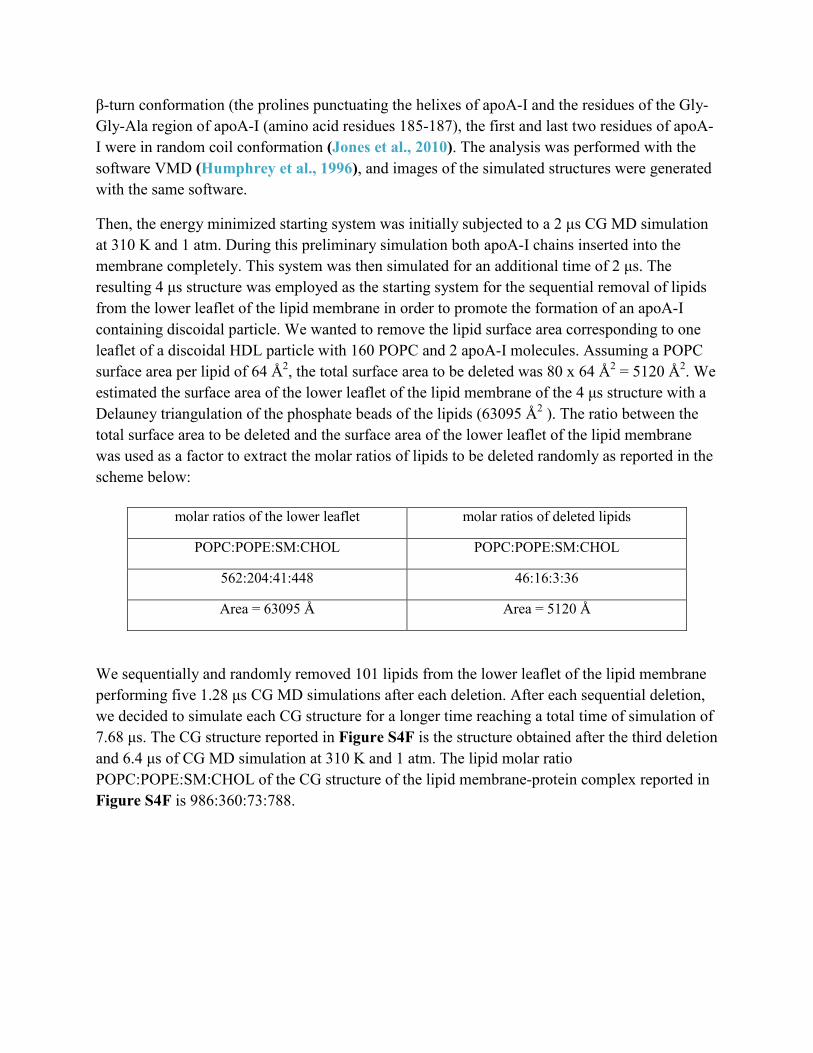
Then, the energy minimized starting system was initially subjected to a 2 μs CG MD simulation at 310 K and 1 atm. During this preliminary simulation both apoA-I chains inserted into the membrane completely. This system was then simulated for an additional time of 2 μs. The resulting 4 μs structure was employed as the starting system for the sequential removal of lipids from the lower leaflet of the lipid membrane in order to promote the formation of an apoA-I containing discoidal particle. We wanted to remove the lipid surface area corresponding to one leaflet of a discoidal HDL particle with 160 POPC and 2 apoA-I molecules. Assuming a POPC surface area per lipid of 64 Å2, the total surface area to be deleted was 80 x 64 Å2 = 5120 Å2. We estimated the surface area of the lower leaflet of the lipid membrane of the 4 μs structure with a Delauney triangulation of the phosphate beads of the lipids (63095 Å2 ). The ratio between the total surface area to be deleted and the surface area of the lower leaflet of the lipid membrane was used as a factor to extract the molar ratios of lipids to be deleted randomly as reported in the scheme below:
We sequentially and randomly removed 101 lipids from the lower leaflet of the lipid membrane performing five 1.28 μs CG MD simulations after each deletion. After each sequential deletion, we decided to simulate each CG structure for a longer time reaching a total time of simulation of 7.68 μs. The CG structure reported in Figure S4F is the structure obtained after the third deletion and 6.4 μs of CG MD simulation at 310 K and 1 atm. The lipid molar ratio POPC:POPE:SM:CHOL of the CG structure of the lipid membrane-protein complex reported in Figure S4F is 986:360:73:788.
molar ratios of the lower leaflet molar ratios of deleted lipids
POPC:POPE:SM:CHOL POPC:POPE:SM:CHOL
562:204:41:448 46:16:3:36
Area = 63095 Å Area = 5120 Å
REFERENCES Gaus, K., Rodriguez, M., Ruberu, K.R., Gelissen, I., Sloane, T.M., Kritharides, L., and Jessup, W. (2005). Domain-specific lipid distribution in macrophage plasma membranes. J Lipid Res 46, 1526-1538. Nagata, K.O., Nakada, C., Kasai, R.S., Kusumi, A., and Ueda, K. (2013). ABCA1 dimer-monomer interconversion during HDL generation revealed by single-molecule imaging. Proc Natl Acad Sci U S A 110, 5034-5039. Niemela, P.S., Ollila, S., Hyvonen, M.T., Karttunen, M., and Vattulainen, I. (2007). Assessing the nature of lipid raft membranes. PLoS Comput Biol 3, e34. Ollila, O.H.S., Risselada, H.J., Louhivuori, M., Lindahl, E., Vattulainen, I., and Marrink, S.J. (2009). 3D Pressure Field in Lipid Membranes and Membrane-Protein Complexes. Physical Review Letters 102, 078101. Segrest, J.P., Jones, M.K., Klon, A.E., Sheldahl, C.J., Hellinger, M., De Loof, H., and Harvey, S.C. (1999). A detailed molecular belt model for apolipoprotein A-I in discoidal high density lipoprotein. J Biol Chem 274, 31755-31758. Segrest, J.P., Jones, M.K., Mishra, V.K., and Anantharamaiah, G.M. (2002). Experimental and computational studies of the interactions of amphipathic peptides with lipid surfaces. Current Topics in Membranes 52, 391-429.