Kinetic evolution of DOPC lipid bilayers exposed to α ...
11
5800 | Soft Matter, 2018, 14, 5800--5810 This journal is © The Royal Society of Chemistry 2018 Cite this: Soft Matter, 2018, 14, 5800 Kinetic evolution of DOPC lipid bilayers exposed to a-cyclodextrins† Monika Kluzek, * Marc Schmutz, Carlos M. Marques and Fabrice Thalmann * Cyclodextrins are cyclic oligosaccharides capable of forming inclusion complexes with a variety of molecules, and as such have been recognized as a pharmaceutical and biotechnological asset. Cyclodextrins are known to interact with the components of cell membranes, and this correlates with a significant degree of cytotoxicity. In this work, we report on the mechanism of degradation of a model dioleoyl-phosphatidylcholine (DOPC) bilayer exposed to a solution with increasing concentrations of a-cyclodextrins. By combining optical fluorescence microscopy and quartz-crystal microbalance experiments, we study the evolution of supported lipid bilayers (SLBs) and giant unilamellar vesicles (GUVs). The rate of lipid removal is found to display a strong nonlinear dependence on the cyclodextrin concentration. A mechanism involving lipid aggregates is proposed. 1 Introduction Cyclodextrins (CDs) are cyclic oligosaccharides formed by bacterial degradation of starch, and typically contain six ( a-CD), seven ( b-CD), or eight ( g-CD) glucose units linked by (1 - 4) glycosidic bonds. 1 CDs feature a relatively hydrophobic cavity which offers a suitable environment for a vast number of lipophilic molecules of di fferent sizes (see Fig. S1, ESI†). Therefore, CDs have attracted wide interest as potential agents for drug delivery 2–4 and cholesterol sequestration, 5,6 among other applications. 3,7 Several studies were undertaken to shed light on the possibility for cyclodextrins to extract cell membrane components, with pre- sumably formation of molecular complexes. In particular, their action on biological membranes has been linked to hemolytic and cytotoxic effects. 8–10 Some studies attributed this hemolytic activity to the segregation and depletion of cholesterol by b-CDs. It is commonly accepted that the extraction process depends primarily on the inner diameter of the cyclodextrin cavity. Whilst the b-CD cavity composed of 7 glucose units can easily complex a cholesterol molecule, the smaller a-CD cavity size can accommodate the fatty acyl chains of lipids. 11–13 If the cholesterol extraction activity has been studied in detail in both model membrane systems 8,14–19 and living cells, 20,21 only few studies attempted to characterize the ability of CDs to uptake lipids from cell membranes. In 2000, Nishijo et al. 22 demonstrated that the CD–lipid interactions are strongly dependent on the lipid chain length, the CD cavity and the nature of the external CD side groups. The importance of different parameters, such as the size of the liposomes and the lipid composition, was also studied by Hatazi et al. 23 Their results showed that the curvature and rigidity of the lipid membrane had a significant influence on the CD–lipid inter- actions. The injurious effect of CDs on lipid membranes was further explored by Giocondi et al., 24 who visualized the formation of microdomains in dioleoyl-phosphatidylcholine (DOPC)/ sphingomyelin (SM) lipid bilayers upon incubation with methyl- b-CD. Several authors have attributed the membrane disruptive properties of CDs to the formation of CD–lipid complexes of well defined stoichiometry. Anderson et al. 25 proposed the formation of CD–lipid complexes in which 4 methyl-b-CD molecules are threaded around the POPC lipid chains. Moreover, it was suggested that g-CDs could form complexes with both phos- pholipid acyl chains sharing the same cavity, due to the wider secondary rim, as for instance in the case of the pyrene derivative PyrPC. 26 In the present day, it is widely accepted that cyclodextrins form complexes with the hydrocarbon chains of the phospholipid molecules. It was demonstrated by Ohvo and Slotte 6 that the amount of lipid extraction was a function of the cyclodextrin concentration. Their results are in line with the work of Szejtli et al. 27 who reported that CDs at low concentrations protect erythrocytes against osmotic and heat-induced hemolysis, while larger con- centrations induce cell membrane damage. Moreover, Ohtani et al. 8 showed that at sub-hemolytic concentrations, CDs induce changes in the erythrocyte shape. Despite such a body of experimental work, the detailed mechanism by which cyclodextrins remove lipids from mem- branes remains unclear. In the present study, we investigate the Universite ´ de Strasbourg, CNRS, Institut Charles Sadron, UPR022, 23 rue du Loess, 67034 Strasbourg Cedex, France. E-mail: [email protected], [email protected] † Electronic supplementary information (ESI) available. See DOI: 10.1039/ c8sm01013g Received 17th May 2018, Accepted 15th June 2018 DOI: 10.1039/c8sm01013g rsc.li/soft-matter-journal Soft Matter PAPER
Transcript of Kinetic evolution of DOPC lipid bilayers exposed to α ...
5800 | Soft Matter, 2018, 14, 5800--5810 This journal is©The Royal Society of Chemistry 2018
Cite this: SoftMatter, 2018,14, 5800
Kinetic evolution of DOPC lipid bilayers exposedto a-cyclodextrins†
Monika Kluzek, * Marc Schmutz, Carlos M. Marques andFabrice Thalmann *
Cyclodextrins are cyclic oligosaccharides capable of forming inclusion complexes with a variety of molecules,
and as such have been recognized as a pharmaceutical and biotechnological asset. Cyclodextrins are known to
interact with the components of cell membranes, and this correlates with a significant degree of cytotoxicity. In
this work, we report on the mechanism of degradation of a model dioleoyl-phosphatidylcholine (DOPC) bilayer
exposed to a solution with increasing concentrations of a-cyclodextrins. By combining optical fluorescence
microscopy and quartz-crystal microbalance experiments, we study the evolution of supported lipid bilayers
(SLBs) and giant unilamellar vesicles (GUVs). The rate of lipid removal is found to display a strong nonlinear
dependence on the cyclodextrin concentration. A mechanism involving lipid aggregates is proposed.
1 IntroductionCyclodextrins (CDs) are cyclic oligosaccharides formed by bacterialdegradation of starch, and typically contain six (a-CD), seven (b-CD),or eight (g-CD) glucose units linked by (1 - 4) glycosidic bonds.1
CDs feature a relatively hydrophobic cavity which offers a suitableenvironment for a vast number of lipophilic molecules of differentsizes (see Fig. S1, ESI†). Therefore, CDs have attracted wideinterest as potential agents for drug delivery2–4 and cholesterolsequestration,5,6 among other applications.3,7
Several studies were undertaken to shed light on the possibilityfor cyclodextrins to extract cell membrane components, with pre-sumably formation of molecular complexes. In particular, theiraction on biological membranes has been linked to hemolytic andcytotoxic effects.8–10 Some studies attributed this hemolytic activityto the segregation and depletion of cholesterol by b-CDs. It iscommonly accepted that the extraction process depends primarilyon the inner diameter of the cyclodextrin cavity. Whilst the b-CDcavity composed of 7 glucose units can easily complex a cholesterolmolecule, the smaller a-CD cavity size can accommodate the fattyacyl chains of lipids.11–13
If the cholesterol extraction activity has been studied indetail in both model membrane systems8,14–19 and livingcells,20,21 only few studies attempted to characterize the abilityof CDs to uptake lipids from cell membranes. In 2000, Nishijoet al.22 demonstrated that the CD–lipid interactions are strongly
dependent on the lipid chain length, the CD cavity and thenature of the external CD side groups. The importance ofdifferent parameters, such as the size of the liposomes andthe lipid composition, was also studied by Hatazi et al.23 Theirresults showed that the curvature and rigidity of the lipidmembrane had a significant influence on the CD–lipid inter-actions. The injurious effect of CDs on lipid membranes wasfurther explored by Giocondi et al.,24 who visualized the formationof microdomains in dioleoyl-phosphatidylcholine (DOPC)/sphingomyelin (SM) lipid bilayers upon incubation with methyl-b-CD. Several authors have attributed the membrane disruptiveproperties of CDs to the formation of CD–lipid complexes of welldefined stoichiometry. Anderson et al.25 proposed the formationof CD–lipid complexes in which 4 methyl-b-CD molecules arethreaded around the POPC lipid chains. Moreover, it wassuggested that g-CDs could form complexes with both phos-pholipid acyl chains sharing the same cavity, due to the widersecondary rim, as for instance in the case of the pyrenederivative PyrPC.26 In the present day, it is widely accepted thatcyclodextrins form complexes with the hydrocarbon chains ofthe phospholipid molecules.
It was demonstrated by Ohvo and Slotte6 that the amount oflipid extraction was a function of the cyclodextrin concentration.Their results are in line with the work of Szejtli et al.27 whoreported that CDs at low concentrations protect erythrocytesagainst osmotic and heat-induced hemolysis, while larger con-centrations induce cell membrane damage. Moreover, Ohtaniet al.8 showed that at sub-hemolytic concentrations, CDs inducechanges in the erythrocyte shape.
Despite such a body of experimental work, the detailedmechanism by which cyclodextrins remove lipids from mem-branes remains unclear. In the present study, we investigate the
Universite de Strasbourg, CNRS, Institut Charles Sadron, UPR022, 23 rue du Loess,67034 Strasbourg Cedex, France. E-mail: [email protected],[email protected]† Electronic supplementary information (ESI) available. See DOI: 10.1039/c8sm01013g
Received 17th May 2018,Accepted 15th June 2018
DOI: 10.1039/c8sm01013g
rsc.li/soft-matter-journal
Soft Matter
PAPER
This journal is©The Royal Society of Chemistry 2018 Soft Matter, 2018, 14, 5800--5810 | 5801
alteration of DOPC bilayers exposed to increasing concentra-tions of a-cyclodextrins, by performing experiments on supportedlipid bilayers (SLBs) and giant unilamellar vesicles (GUVs).Combining laser scanning confocal microscopy (LSCM) withquartz crystal microbalance measurements (QCM-D), we observethe morphological changes of these model lipid membranes andstudy quantitatively the kinetics of lipid extraction. Altogether,our results provide a novel macroscopic description of a-CDmediated membrane degradation.
2 ExperimentalMaterials
A chloroform solution of DOPC (1,2-dioleoyl-sn-glycero-3-phosphocholine, C44H84NO8P, Mw 786.11) was purchased fromAvanti Polar Lipid (Birmingham, AL). DiI Stain (1,10-dioctadecyl-3,3,30,30-tetramethylindocarbocyanine perchlorate C59H97ClN2O4,Mw 933.88) and HPTS dye (8-hydroxypyrene-1,3,6-trisulfonic acid,trisodium salt, C16H7Na3O10S3, Mw 524.37) were provided byThermoFisher Scientific (Waltham, MA, USA). a-Cyclodextrin(C36H60O30 Mw 972.84), sucrose (C12H22O11 Mw 342.3), glucose(C6H12O6 Mw 180.16) and phosphate buffered saline (PBS) werepurchased from Sigma-Aldrich (Saint-Quentin, France). Allchemicals had high purity and were used without furtherpurification.
a-Cyclodextrin solution for fluorescent SLBs and GUVs
The appropriate amount of a-cyclodextrin powder was dissolvedinto glucose (90 mM) solution and vortexed at least for 30 min priorto use. For all experiments, fresh solutions of a-cyclodextrin wereprepared.
Giant unilamellar vesicles (GUVs)
Giant unilamellar vesicles (GUVs) of DOPC were prepared usingthe polyvinyl alcohol (PVA) gel assisted formation method asdescribed by Weinberger et al.28 Briefly, 200 mL of 5% (w/w) PVAsolution was spread on a glass slide and dried for 30 min at80 1C. Once the PVA-coated substrate was prepared, 5 mL oflipid in chloroform (1 mg mL!1) was spread and placed undervacuum for 30 min to evaporate the organic solvent. Using arubber gasket as a temporary chamber, the lipid film washydrated with a sucrose solution (100 mOsm kg!1) and leftincubating for 60 min. After the incubation period, the GUVswere collected and transferred into Eppendorf tubes anddiluted with a glucose solution (90 mOsm kg!1) containingthe HPTS fluorescent dye (0.4 mM). The osmolarities of thesucrose and glucose solutions were checked with a cryoscopyosmometer Osmomat 030 (Gonotec, Berlin, Germany).
Formation of supported lipid bilayers (SLBs) for measurementsby laser scanning confocal microscopy
Small unilamellar vesicles (SUVs) were prepared from DOPClipids and DiI fluorescent probes, with a 99 : 1 ratio. A mixtureof lipid and dye in chloroform was dried in a small vial under aN2 stream, and left overnight under vacuum. Sucrose solution
(100 mOsm kg!1) was used to re-suspend the lipids to a finalconcentration of 2 mg mL!1. The resulting multilamellar largevesicle (MLV) suspension was sonicated using a tip sonifier(Bioblock VibraCell 72412) at the lowest power for 12 min. TheSUVs thus obtained were then filtrated on a 0.22 mm membraneto remove debris from the tip, and diluted with glucosesolution (90 mOsm kg!1) to reach a 1 mg mL!1 concentration.After the injection of SUVs on the prepared glass (see nextparagraph), the vesicles adsorbed at the surface undergo ruptureand fusion to form an extended planar bilayer. Each supportedlipid bilayer was rinsed at least 5 times with the glucose solution.Note that glucose itself is not necessary to form SUVs or SLBs.It was introduced here to facilitate the comparison betweenfluorescent SLB and GUV experiments.
Glass preparation for fluorescent SLBs
Before each LSCM experiment, the glass coverslip was UV/ozonetreated (Novascan Ames, USA) for 15 min and rinsed withethanol and Milli-Q (18.2 MO cm). Then, a second UV/ozonetreatment was applied for 15 min, making the glass surfacehighly hydrophilic.
Laser scanning confocal microscopy measurements (LSCM)
The visualization of the lipid GUVs, the fluorescent SLBs (DiI)and the detection of fluorophores in solution (HPTS) wereperformed using a laser scanning confocal microscope (LSCM)Nikon Eclipse TE2000-E equipped with a Nikon d-eclipse C1confocal unit (Nikon, Amsterdam, Netherlands). The objectivewas a Nikon 60" water immersion, NA 1.2 (Nikon). Excitationof DiI in supported lipid bilayers was performed at 543 nm(HeNe laser), guided to the sample by a dichromatic mirror(Nikon). The detection of the fluorescence signal was per-formed using a 615 nm bandpass filter and a photomultiplier(PMT). The excitation of HPTS was performed with a laser diodeat 408 nm (Nikon), and the detection was performed using a454 nm bandpass filter and a photomultiplier.
a-Cyclodextrin solution for QCM-D
The appropriate amount of a-cyclodextrin powder was dissolvedinto PBS buffer (0.5 mM) and vortexed at least for 30 min prior touse. For all experiments, fresh solutions of a-cyclodextrin wereprepared. Blank experiments and rinsing steps were performedwith the same PBS concentration.
Quartz crystal microbalance with dissipation measurements(QCM-D)
The Q-SENSE E4 system (Biolin Scientific, Stockholm, Sweden)was used to monitor the formation of SLBs on quartz surfacescoated with silicon oxide, and to follow changes in membraneproperties upon exposure to a-cyclodextrin in real time. Thequartz sensor crystals were placed into the QCM-D chambersand exposed to buffer, lipid and cyclodextrin solutions.
The QCM-D technique measures the resonant frequency ofthe overtones of the fundamental vibration of a quartz crystal,and their dephasing associated with mechanical dissipation atthe surface. The resonant frequency shift is translated into an
Paper Soft Matter
5802 | Soft Matter, 2018, 14, 5800--5810 This journal is©The Royal Society of Chemistry 2018
adsorbed mass by means of the Sauerbrey equation (see ESI†and ref. 29–31 for details).
QCM-D sensor preparation
Silica-coated sensor crystals were placed into QCM-D flowchambers and cleaned by flowing ultra pure MilliQ water,sodium hydroxide solution (0.1 M) and hydrochloric acid(0.1 M). The sensors and chambers were dried under a N2
stream. A UV-ozone cleaner (Novascan Ames, USA) was used for45 min to treat the sensor surfaces before each experiment.
Bilayer formation and exposure to cyclodextrins
Buffer was flowed over the crystal sensors at 0.6 mL min!1 forca. 15 min until the frequency and dissipation responsesbecame stable. The DOPC-SUV solution was flowed over thecrystals at 0.3 mL min!1 to form a stable supported lipidbilayer. The bilayer was rinsed with buffer in order to removeany unattached lipids. Once the baseline was stable, a 0.6 mLsolution of a-cyclodextrin was added at 0.3 mL min!1. The QCM-Dcrystals were exposed to the cyclodextrin solution during 60–90 min,
after which the bilayer was rinsed again at 0.3 mL min!1 with abuffer solution, until the frequency stabilized. Each experiment wasrepeated at least three times for each concentration of a-CD.
3 Results & discussiona-CD induced hole formation on aqueous supported lipidbilayers
To gain insight into the mechanism of a-CD–lipid bilayerinteractions, we imaged the SLBs in real time. The confocalmicroscope was focused on the glass surface of the measuringchamber, while DOPC SUVs marked with DiI (1 mol%) weregently injected. The vesicle rupture method, used for theformation of SLBs, results in homogeneous bilayers on glasssurfaces as reported elsewhere.32,33 In order to remove vesiclesin excess, the chamber was washed at least 5 times with glucosesolution, and the fluorescence intensity profile and the depthprofile (z-slices) were collected to control the quality of theSLB. Before the injection of a-CD solution into the chamber, ablank injection of glucose solution alone on the SLB was
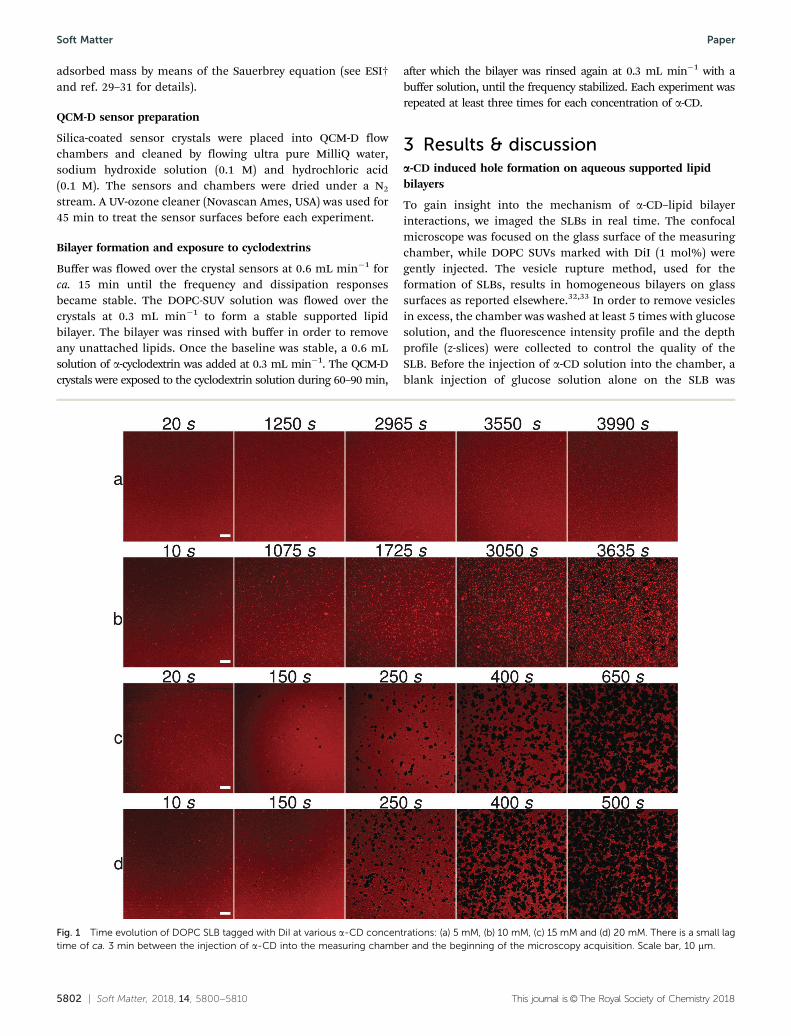
Fig. 1 Time evolution of DOPC SLB tagged with DiI at various a-CD concentrations: (a) 5 mM, (b) 10 mM, (c) 15 mM and (d) 20 mM. There is a small lagtime of ca. 3 min between the injection of a-CD into the measuring chamber and the beginning of the microscopy acquisition. Scale bar, 10 mm.
Soft Matter Paper
This journal is©The Royal Society of Chemistry 2018 Soft Matter, 2018, 14, 5800--5810 | 5803
imaged for 60 min. This step was done to ensure that thebilayer was stable, with no preexisting alterations and thatthe injection itself was not responsible for the formation ofthe defects. Fig. 1 (and Fig. S2, ESI†) shows snapshots of SLBsafter the addition of a-CD at various concentrations. The LSCMimaging in the presence of a 5 mM a-CD solution revealed thatthe lipid membrane was only mildly affected. After 60 minacquisition, only a few small fluorescent spots were visible atthe membrane surface. After the addition of the 10 mM a-CDsolution, we observed the formation of many bright spots at themembrane surface. The number and the size of the spotsincreased continuously with the incubation time (Fig. 1b). After60 min incubation, the first dark holes were formed. Intensityprofiles showed essentially no fluorescence at the center of the
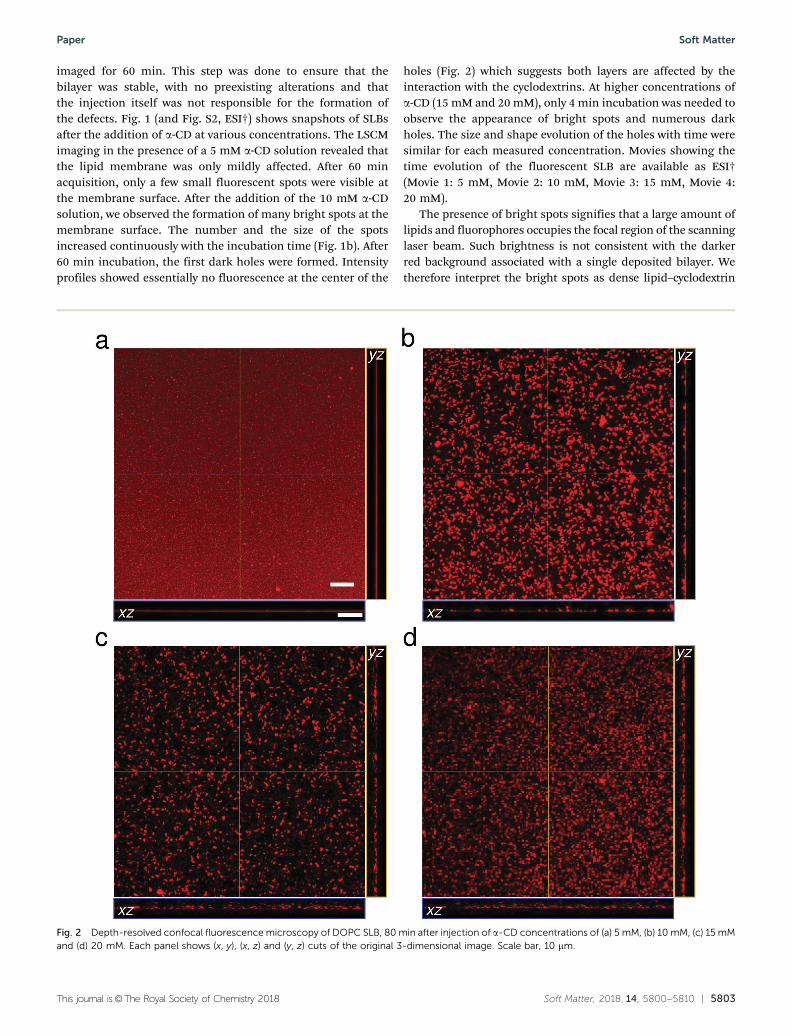
holes (Fig. 2) which suggests both layers are affected by theinteraction with the cyclodextrins. At higher concentrations ofa-CD (15 mM and 20 mM), only 4 min incubation was needed toobserve the appearance of bright spots and numerous darkholes. The size and shape evolution of the holes with time weresimilar for each measured concentration. Movies showing thetime evolution of the fluorescent SLB are available as ESI†(Movie 1: 5 mM, Movie 2: 10 mM, Movie 3: 15 mM, Movie 4:20 mM).
The presence of bright spots signifies that a large amount oflipids and fluorophores occupies the focal region of the scanninglaser beam. Such brightness is not consistent with the darkerred background associated with a single deposited bilayer. Wetherefore interpret the bright spots as dense lipid–cyclodextrin
Fig. 2 Depth-resolved confocal fluorescence microscopy of DOPC SLB, 80 min after injection of a-CD concentrations of (a) 5 mM, (b) 10 mM, (c) 15 mMand (d) 20 mM. Each panel shows (x, y), (x, z) and (y, z) cuts of the original 3-dimensional image. Scale bar, 10 mm.
Paper Soft Matter
5804 | Soft Matter, 2018, 14, 5800--5810 This journal is©The Royal Society of Chemistry 2018
(and fluorophore) aggregates with a significant rearrangementof the bilayer structure. While the presence of cyclodextrinmolecules within the aggregates cannot be ascertained, it seemslikely that this is indeed the case, cyclodextrins being a necessaryingredient for the formation of these bright spots.
We investigated the depth profile (z-slices) of samples beforeand after injection of a-CD (Fig. 2). The images revealedremarkable 3-dimensional fluorescent disordered patternsabove the surface. Patches of fluorescent materials could beseen floating microns above the silica surface, while still beingconnected to it. The size and shape of the floating patterns werevariable, and no distinctive pattern characteristic of a givenconcentration could be found. At 10 mM CD, bright spots andfloating fragments both covered densely the field of view. Forthe two largest concentrations, numerous floating fragmentswere present, with fewer bright spots visible.
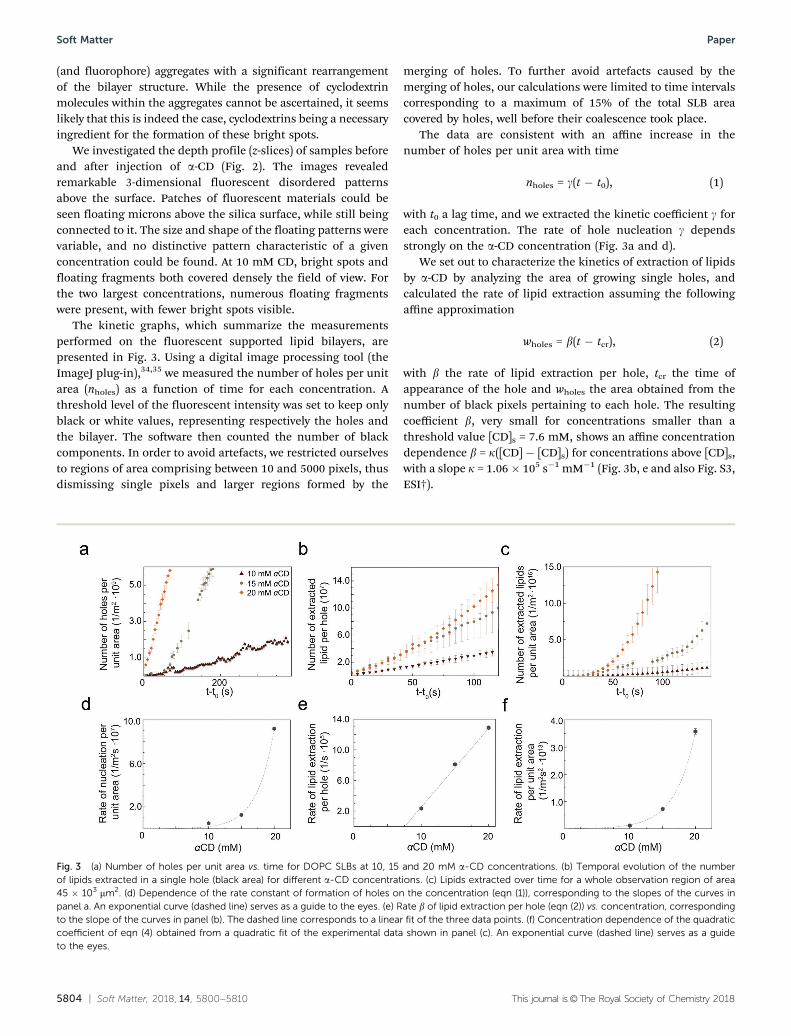
The kinetic graphs, which summarize the measurementsperformed on the fluorescent supported lipid bilayers, arepresented in Fig. 3. Using a digital image processing tool (theImageJ plug-in),34,35 we measured the number of holes per unitarea (nholes) as a function of time for each concentration. Athreshold level of the fluorescent intensity was set to keep onlyblack or white values, representing respectively the holes andthe bilayer. The software then counted the number of blackcomponents. In order to avoid artefacts, we restricted ourselvesto regions of area comprising between 10 and 5000 pixels, thusdismissing single pixels and larger regions formed by the
merging of holes. To further avoid artefacts caused by themerging of holes, our calculations were limited to time intervalscorresponding to a maximum of 15% of the total SLB areacovered by holes, well before their coalescence took place.
The data are consistent with an affine increase in thenumber of holes per unit area with time
nholes = g(t ! t0), (1)
with t0 a lag time, and we extracted the kinetic coefficient g foreach concentration. The rate of hole nucleation g dependsstrongly on the a-CD concentration (Fig. 3a and d).
We set out to characterize the kinetics of extraction of lipidsby a-CD by analyzing the area of growing single holes, andcalculated the rate of lipid extraction assuming the followingaffine approximation
wholes = b(t ! tcr), (2)
with b the rate of lipid extraction per hole, tcr the time ofappearance of the hole and wholes the area obtained from thenumber of black pixels pertaining to each hole. The resultingcoefficient b, very small for concentrations smaller than athreshold value [CD]s = 7.6 mM, shows an affine concentrationdependence b = k([CD] ! [CD]s) for concentrations above [CD]s,with a slope k = 1.06 " 105 s!1 mM!1 (Fig. 3b, e and also Fig. S3,ESI†).
Fig. 3 (a) Number of holes per unit area vs. time for DOPC SLBs at 10, 15 and 20 mM a-CD concentrations. (b) Temporal evolution of the numberof lipids extracted in a single hole (black area) for different a-CD concentrations. (c) Lipids extracted over time for a whole observation region of area45 " 103 mm2. (d) Dependence of the rate constant of formation of holes on the concentration (eqn (1)), corresponding to the slopes of the curves inpanel a. An exponential curve (dashed line) serves as a guide to the eyes. (e) Rate b of lipid extraction per hole (eqn (2)) vs. concentration, correspondingto the slope of the curves in panel (b). The dashed line corresponds to a linear fit of the three data points. (f) Concentration dependence of the quadraticcoefficient of eqn (4) obtained from a quadratic fit of the experimental data shown in panel (c). An exponential curve (dashed line) serves as a guideto the eyes.
Soft Matter Paper
This journal is©The Royal Society of Chemistry 2018 Soft Matter, 2018, 14, 5800--5810 | 5805
According to eqn (1) and (2), the growth kinetics of the totalarea Aholes of the holes seen on a whole SLB image shouldfactorize into the product of the number of holes created andthe growth rate of each hole. We therefore expect that
dAholes
dt¼ bnholes;
dnholesdt
¼ g; (3)
leading to
Aholes ¼bg2ðt! t0Þ2: (4)
This quadratic model shows good agreement with experi-mental data (Fig. 3c and f). We report in Table 2 the average rateof lipid extraction as inferred from the growth of the darkregions in the supported lipid bilayers. This average rate kSLB =m15%/(t15%Aobs) is defined here as the inverse of the time t15%
needed to remove 15% of the initial SLB mass, multiplied by
the corresponding mass removed (m15%) and divided by thearea of the observation region (Aobs).
QCM-D analysis of the resonant frequencies of SLB interactingwith a-CD
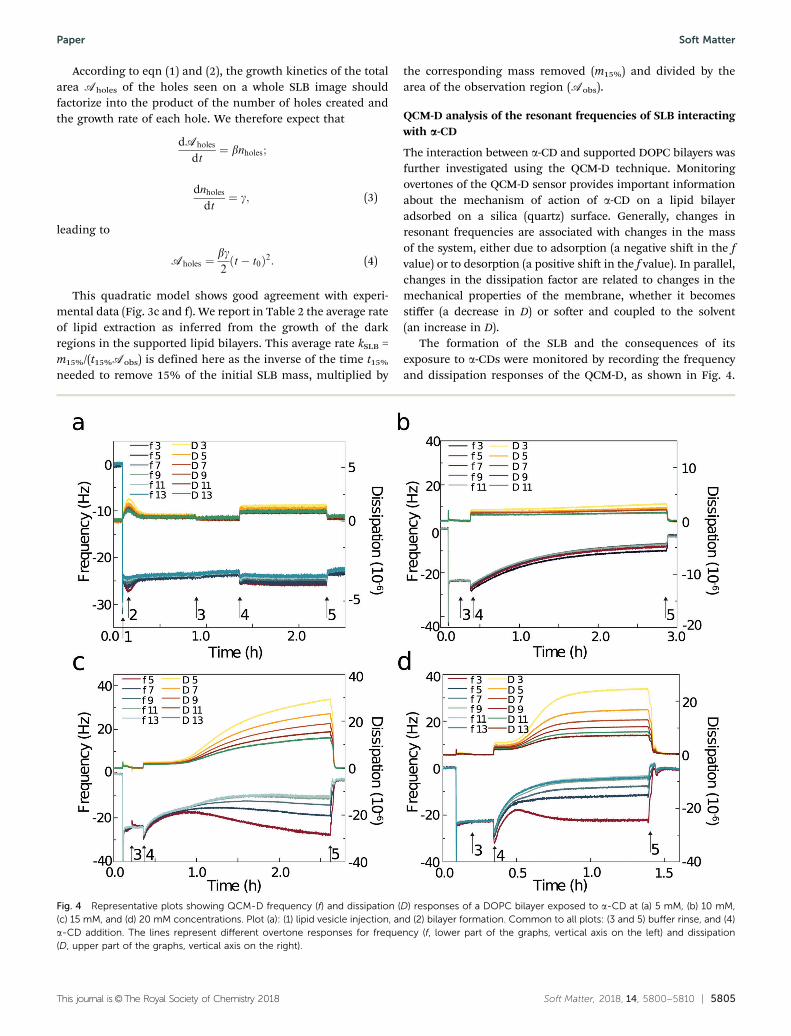
The interaction between a-CD and supported DOPC bilayers wasfurther investigated using the QCM-D technique. Monitoringovertones of the QCM-D sensor provides important informationabout the mechanism of action of a-CD on a lipid bilayeradsorbed on a silica (quartz) surface. Generally, changes inresonant frequencies are associated with changes in the massof the system, either due to adsorption (a negative shift in the fvalue) or to desorption (a positive shift in the f value). In parallel,changes in the dissipation factor are related to changes in themechanical properties of the membrane, whether it becomesstiffer (a decrease in D) or softer and coupled to the solvent(an increase in D).
The formation of the SLB and the consequences of itsexposure to a-CDs were monitored by recording the frequencyand dissipation responses of the QCM-D, as shown in Fig. 4.
Fig. 4 Representative plots showing QCM-D frequency (f) and dissipation (D) responses of a DOPC bilayer exposed to a-CD at (a) 5 mM, (b) 10 mM,(c) 15 mM, and (d) 20 mM concentrations. Plot (a): (1) lipid vesicle injection, and (2) bilayer formation. Common to all plots: (3 and 5) buffer rinse, and (4)a-CD addition. The lines represent different overtone responses for frequency (f, lower part of the graphs, vertical axis on the left) and dissipation(D, upper part of the graphs, vertical axis on the right).
Paper Soft Matter
5806 | Soft Matter, 2018, 14, 5800--5810 This journal is©The Royal Society of Chemistry 2018
The QCM-D response upon adsorbing DOPC SUVs (in thepresence of ions36) on silica shows a two-step process. The firststep reflects the attachment of a vesicular layer to the QCM-Dsensor surface, until a minimum in frequency (Dfmin) and amaximum in dissipation (DDmax) are reached (Fig. 4a(1)). Thesecond step corresponds to the vesicle rupture-fusion processwith the formation of a continuous SLB at the sensor surface.The membrane was then stabilized during the buffer rinse step(Fig. 4a(3)) which removed all intact vesicles and floating lipidfragments. The observed values of the frequency Df C 24 Hzand the dissipation DD C 6 " 10!6 were consistent with theformation of a stable hydrated SLB of DOPC (Table 1).33,37,38
A buffer solution of a-CD was then added (Fig. 4a(4)) to theQCM-D chamber and was allowed to stay in contact with thebilayer for ca. 100 min, followed by a final buffer rinse step(Fig. 4a(5)). This final rinse allowed for comparison of thesystem before and after injection of a-CD.
The typical frequency response shows an initial decrease invalue in all studied systems, suggesting a mass increase on thesensor surface as a-CD adsorbs on the exposed bilayer. For thelowest concentration of a-CD (5 mM), only a small decrease inDf (o2 Hz in magnitude) was observed for each overtone, anduniform positive values of DD (C1.5 " 10!6) were recorded.However, both parameters recovered their initial values afterthe final buffer rinse (Fig. 4a(4)), which indicates a reversibleadsorption of a-CDs on the lipid bilayer, with minor changes inthe mass and viscoelasticity of the membrane. By contrast,upon addition of more concentrated a-CD solutions (15 mMand 20 mM, Fig. 4c and d), we first observed a deposition of thea-CDs at the SLB surface, followed by sharp positive shifts infrequency and dissipation with splitting of the overtones. Thecombined values of Df and DD indicate a rapid loss of lipidmass with significant disruption and disorganization withinthe membrane. The magnitude decreases as the order of theovertones increases, suggesting that the transverse vibrationsinduced by the sensors were strongly damped on distancescomparable to the membrane thickness, and that the vibrationperiod was shorter than the bilayer internal rearrangements.The important dispersion of the dissipation parameters withfrequency (overtones) is consistent with large portions of themembranes floating above the surface, dragging the outersolvent solution during their oscillatory motion, while still beingconnected to the surface. These results are thus compatible withan adsorption of a-CD at the surface of a membrane, followed bygradual mass removal, presumably in the form of a-CD–lipidaggregates semi-detached from the surface. Results for the
15 mM and 20 mM concentrations follow a qualitatively similartrend, indicating a similar dynamical destabilization mechanism.However, as can be seen from Fig. 4 (and Fig. S3, ESI†), it seemsthat the system with 20 mM a-CD reached saturation faster than the15 mM one. Finally, exposure of DOPC-SLB to 10 mM a-CDconcentration, showed an intermediate situation as comparedto the 5 mM and 15 mM cases. After a short deposition of a-CDsat the membrane surface (Df = !3.0 Hz), Fig. 4b shows positivechanges in frequency for all the measured overtones. Therelatively uniform increase in Df for each overtone indicatesthat the lipids that remained attached to the surface oscillatedhomogeneously. The changes in dissipation parameter aresmall for all overtones, suggesting the absence of a viscoelasticmechanical response of the membrane.
The measured values of dissipation and frequency for 10, 15and 20 mM a-CD concentrations after the final buffer rinse,show only small amounts of material remaining at the sensorsurface (Table 1), which indicates that most of the lipids wereremoved by the a-CD molecules.
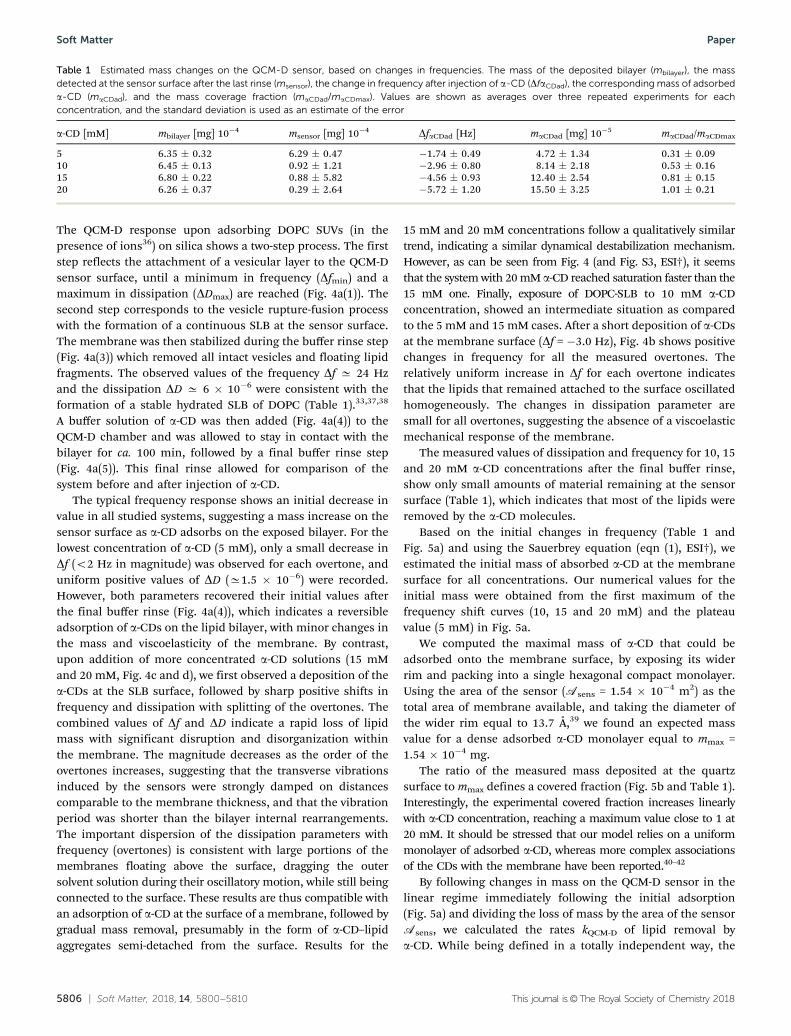
Based on the initial changes in frequency (Table 1 andFig. 5a) and using the Sauerbrey equation (eqn (1), ESI†), weestimated the initial mass of absorbed a-CD at the membranesurface for all concentrations. Our numerical values for theinitial mass were obtained from the first maximum of thefrequency shift curves (10, 15 and 20 mM) and the plateauvalue (5 mM) in Fig. 5a.
We computed the maximal mass of a-CD that could beadsorbed onto the membrane surface, by exposing its widerrim and packing into a single hexagonal compact monolayer.Using the area of the sensor (Asens = 1.54 " 10!4 m2) as thetotal area of membrane available, and taking the diameter ofthe wider rim equal to 13.7 Å,39 we found an expected massvalue for a dense adsorbed a-CD monolayer equal to mmax =1.54 " 10!4 mg.
The ratio of the measured mass deposited at the quartzsurface to mmax defines a covered fraction (Fig. 5b and Table 1).Interestingly, the experimental covered fraction increases linearlywith a-CD concentration, reaching a maximum value close to 1 at20 mM. It should be stressed that our model relies on a uniformmonolayer of adsorbed a-CD, whereas more complex associationsof the CDs with the membrane have been reported.40–42
By following changes in mass on the QCM-D sensor in thelinear regime immediately following the initial adsorption(Fig. 5a) and dividing the loss of mass by the area of the sensorAsens, we calculated the rates kQCM-D of lipid removal bya-CD. While being defined in a totally independent way, the
Table 1 Estimated mass changes on the QCM-D sensor, based on changes in frequencies. The mass of the deposited bilayer (mbilayer), the massdetected at the sensor surface after the last rinse (msensor), the change in frequency after injection of a-CD (DfaCDad), the corresponding mass of adsorbeda-CD (maCDad), and the mass coverage fraction (maCDad/maCDmax). Values are shown as averages over three repeated experiments for eachconcentration, and the standard deviation is used as an estimate of the error
a-CD [mM] mbilayer [mg] 10!4 msensor [mg] 10!4 DfaCDad [Hz] maCDad [mg] 10!5 maCDad/maCDmax
5 6.35 & 0.32 6.29 & 0.47 !1.74 & 0.49 4.72 & 1.34 0.31 & 0.0910 6.45 & 0.13 0.92 & 1.21 !2.96 & 0.80 8.14 & 2.18 0.53 & 0.1615 6.80 & 0.22 0.88 & 5.82 !4.56 & 0.93 12.40 & 2.54 0.81 & 0.1520 6.26 & 0.37 0.29 & 2.64 !5.72 & 1.20 15.50 & 3.25 1.01 & 0.21
Soft Matter Paper
This journal is©The Royal Society of Chemistry 2018 Soft Matter, 2018, 14, 5800--5810 | 5807
fluorescent SLB kSLB and QCM-D kQCM-D rates correlate well(Table 2).
Dynamics of GUV degradation by a-CD
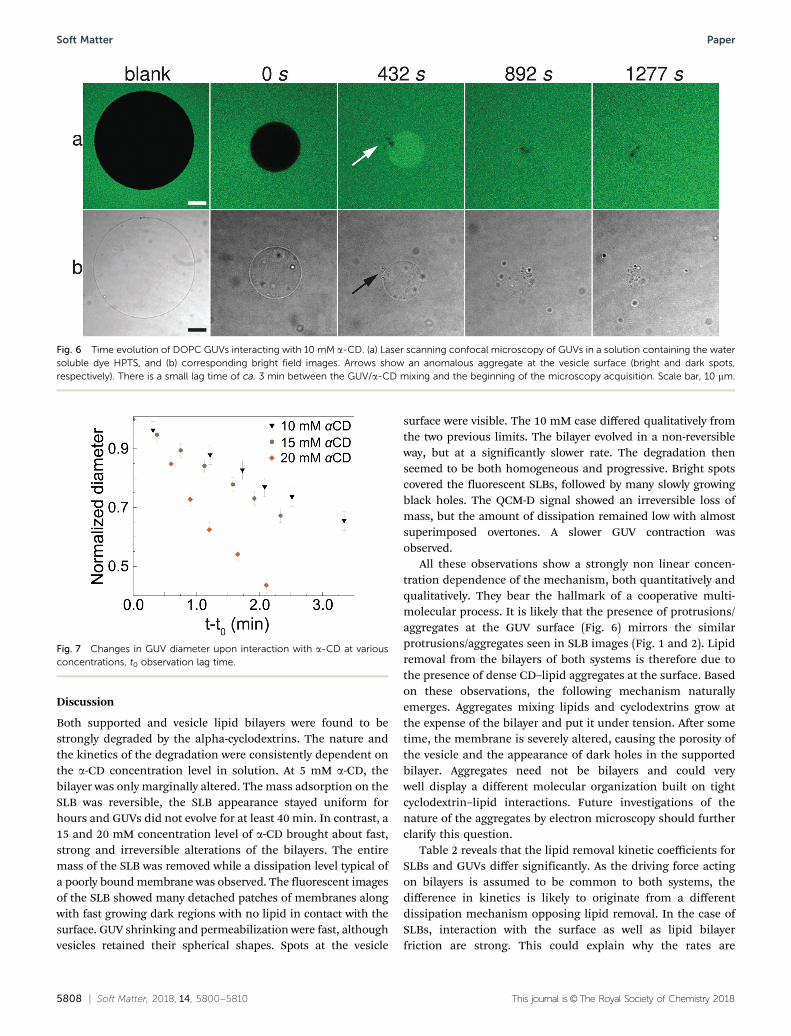
To gain more insight into the membrane-disruptive mechanismof a-CD, we observed isolated giant unilamellar vesicles. Fig. 6shows the typical temporal evolution of GUVs following exposureto 10 mM a-CD. After the a-CD aqueous solution was injectedinto the observation chamber, defects began to develop from theGUV surface (Fig. 6, white and black arrows). The movie showsan anomalous aggregate, or protrusion, at the vesicle surface.Beside protrusions being visible at the surface, the GUV shrankgradually, while keeping its spherical shape until the finalstages. At the beginning of the shrinking stage and duringa short period, the vesicle decreased in size but its interiorshowed no fluorescence. Then, the vesicle compartment steadilyincreased its fluorescence intensity, indicating a loss of integrityof the membrane and exchange of larger molecules between thevesicle interior and the external solution (Fig. 6 and Movie M5,ESI†). The fact that the HPTS fluorophore used in this measure-ment has a sizable molecular weight (Mw = 524.37 Da) suggests thatmembrane permeabilization occurred though pore formation. Theentire process took place within 10 min following cyclodextrininjection. This indicates that poration and membrane protrusion
occurred in parallel, and are two facets of the same underlyingmembrane degradation mechanism. Concentrations of a-CD largerthan 5 mM were required to make the degradation of GUVseffective.
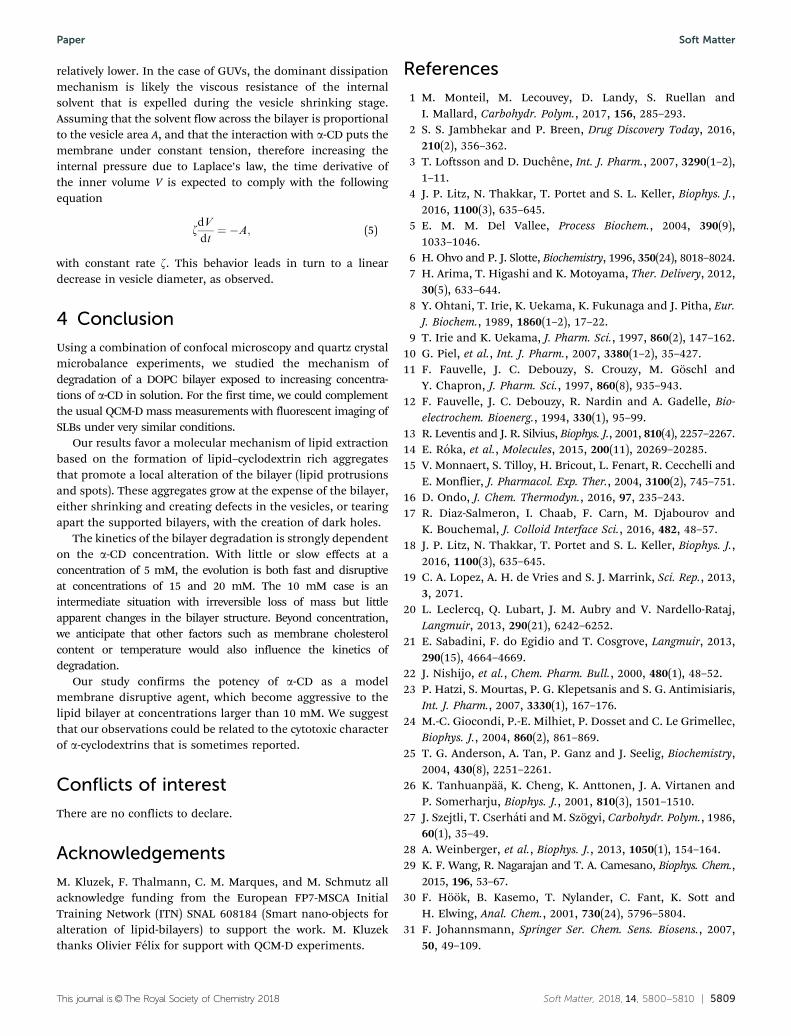
The apparent diameter of a few selected vesicles was measuredand represented as a function of time (Fig. 7 and Fig. S4, ESI†).Interestingly, the apparent diameter, and not the area, decreaseslinearly with time. This shrinking dynamics suggests thatlosses in the membrane surface are compensated for by corres-ponding losses of intravesicular water. Since vesicles remainspherical at all times but the very end, we suggest that lipidextraction from GUVs is a continuous process lasting untilthe reservoir of available lipids is exhausted. The persistentspherical shape suggests also that under our working condi-tions, osmotic imbalance is not a significant driving force forthe shrinking mechanism.
As for SLB measurements, we noticed a faster than linearevolution of the lipid extraction kinetics with the concentrationof a-CD in the observation cell. At a low concentration of 5 mM,vesicles remained unaltered during at least 40 min of acquisition(data not shown). Conversely, under larger a-CD concentrations,a morphological response was detected after only a few minutesof observation.
To better quantify the mechanism of the observed a-CD–lipidbilayer shrinking phenomenon, we converted the observedinitial decrease in area into a loss of lipid mass per area of thevesicle, based on a commonly accepted value of the area per lipidfor a DOPC bilayer (70 Å2).43 This resulted in an average rate oflipid extraction kGUVs (Table 2). It is worth noting that the GUVsdo not contain a-CDs in their interior compartment until theyare mixed with the a-CD solution. During the initial stage ofvesicle shrinking, the intact bilayer acts as a barrier againstHPTS penetration, and presumably against a-CD penetration aswell. Therefore, one can compare the GUV and the SLB situa-tions, as in both cases the alteration results from the action ofagents present only on one side of the bilayer.
Table 2 Rate of lipid extraction by a-CD calculated from supported lipidbilayer (SLB) and giant unilamellar vesicle (GUV) measurements usingQCM-D and LSCM techniques. Values are shown as averages of at leasttwo measurements for each concentration, and the standard deviation isused as an estimate of the error
a-CD[mM]
SLB LSCM SLB QCM-D GUVs LSCM
kSLB[mg m!2 s!1 10!4]
kQCM-D[mg m!2 s!1 10!4]
kGUVs[mg m!2 s!1 10!4]
10 2.98 & 0.08 9.61 & 0.02 103 & 5615 5.64 & 0.23 18.40 & 0.05 139 & 10320 18.70 & 0.52 58.60 & 0.04 399 & 234
Fig. 5 (a) Changes in mass on the sensor after the injection of a-CD at various concentrations (data for the 7th overtone). (b) Cover fraction equivalent toone monolayer of a-CD on the membrane surface. The dashed line represents the best linear fit.
Paper Soft Matter
5808 | Soft Matter, 2018, 14, 5800--5810 This journal is©The Royal Society of Chemistry 2018
Discussion
Both supported and vesicle lipid bilayers were found to bestrongly degraded by the alpha-cyclodextrins. The nature andthe kinetics of the degradation were consistently dependent onthe a-CD concentration level in solution. At 5 mM a-CD, thebilayer was only marginally altered. The mass adsorption on theSLB was reversible, the SLB appearance stayed uniform forhours and GUVs did not evolve for at least 40 min. In contrast, a15 and 20 mM concentration level of a-CD brought about fast,strong and irreversible alterations of the bilayers. The entiremass of the SLB was removed while a dissipation level typical ofa poorly bound membrane was observed. The fluorescent imagesof the SLB showed many detached patches of membranes alongwith fast growing dark regions with no lipid in contact with thesurface. GUV shrinking and permeabilization were fast, althoughvesicles retained their spherical shapes. Spots at the vesicle
surface were visible. The 10 mM case differed qualitatively fromthe two previous limits. The bilayer evolved in a non-reversibleway, but at a significantly slower rate. The degradation thenseemed to be both homogeneous and progressive. Bright spotscovered the fluorescent SLBs, followed by many slowly growingblack holes. The QCM-D signal showed an irreversible loss ofmass, but the amount of dissipation remained low with almostsuperimposed overtones. A slower GUV contraction wasobserved.
All these observations show a strongly non linear concen-tration dependence of the mechanism, both quantitatively andqualitatively. They bear the hallmark of a cooperative multi-molecular process. It is likely that the presence of protrusions/aggregates at the GUV surface (Fig. 6) mirrors the similarprotrusions/aggregates seen in SLB images (Fig. 1 and 2). Lipidremoval from the bilayers of both systems is therefore due tothe presence of dense CD–lipid aggregates at the surface. Basedon these observations, the following mechanism naturallyemerges. Aggregates mixing lipids and cyclodextrins grow atthe expense of the bilayer and put it under tension. After sometime, the membrane is severely altered, causing the porosity ofthe vesicle and the appearance of dark holes in the supportedbilayer. Aggregates need not be bilayers and could verywell display a different molecular organization built on tightcyclodextrin–lipid interactions. Future investigations of thenature of the aggregates by electron microscopy should furtherclarify this question.
Table 2 reveals that the lipid removal kinetic coefficients forSLBs and GUVs differ significantly. As the driving force actingon bilayers is assumed to be common to both systems, thedifference in kinetics is likely to originate from a differentdissipation mechanism opposing lipid removal. In the case ofSLBs, interaction with the surface as well as lipid bilayerfriction are strong. This could explain why the rates are
Fig. 6 Time evolution of DOPC GUVs interacting with 10 mM a-CD. (a) Laser scanning confocal microscopy of GUVs in a solution containing the watersoluble dye HPTS, and (b) corresponding bright field images. Arrows show an anomalous aggregate at the vesicle surface (bright and dark spots,respectively). There is a small lag time of ca. 3 min between the GUV/a-CD mixing and the beginning of the microscopy acquisition. Scale bar, 10 mm.
Fig. 7 Changes in GUV diameter upon interaction with a-CD at variousconcentrations, t0 observation lag time.
Soft Matter Paper
This journal is©The Royal Society of Chemistry 2018 Soft Matter, 2018, 14, 5800--5810 | 5809
relatively lower. In the case of GUVs, the dominant dissipationmechanism is likely the viscous resistance of the internalsolvent that is expelled during the vesicle shrinking stage.Assuming that the solvent flow across the bilayer is proportionalto the vesicle area A, and that the interaction with a-CD puts themembrane under constant tension, therefore increasing theinternal pressure due to Laplace’s law, the time derivative ofthe inner volume V is expected to comply with the followingequation
zdV
dt¼ !A; (5)
with constant rate z. This behavior leads in turn to a lineardecrease in vesicle diameter, as observed.
4 ConclusionUsing a combination of confocal microscopy and quartz crystalmicrobalance experiments, we studied the mechanism ofdegradation of a DOPC bilayer exposed to increasing concentra-tions of a-CD in solution. For the first time, we could complementthe usual QCM-D mass measurements with fluorescent imaging ofSLBs under very similar conditions.
Our results favor a molecular mechanism of lipid extractionbased on the formation of lipid–cyclodextrin rich aggregatesthat promote a local alteration of the bilayer (lipid protrusionsand spots). These aggregates grow at the expense of the bilayer,either shrinking and creating defects in the vesicles, or tearingapart the supported bilayers, with the creation of dark holes.
The kinetics of the bilayer degradation is strongly dependenton the a-CD concentration. With little or slow effects at aconcentration of 5 mM, the evolution is both fast and disruptiveat concentrations of 15 and 20 mM. The 10 mM case is anintermediate situation with irreversible loss of mass but littleapparent changes in the bilayer structure. Beyond concentration,we anticipate that other factors such as membrane cholesterolcontent or temperature would also influence the kinetics ofdegradation.
Our study confirms the potency of a-CD as a modelmembrane disruptive agent, which become aggressive to thelipid bilayer at concentrations larger than 10 mM. We suggestthat our observations could be related to the cytotoxic characterof a-cyclodextrins that is sometimes reported.
Conflicts of interestThere are no conflicts to declare.
AcknowledgementsM. Kluzek, F. Thalmann, C. M. Marques, and M. Schmutz allacknowledge funding from the European FP7-MSCA InitialTraining Network (ITN) SNAL 608184 (Smart nano-objects foralteration of lipid-bilayers) to support the work. M. Kluzekthanks Olivier Felix for support with QCM-D experiments.
References1 M. Monteil, M. Lecouvey, D. Landy, S. Ruellan and
I. Mallard, Carbohydr. Polym., 2017, 156, 285–293.2 S. S. Jambhekar and P. Breen, Drug Discovery Today, 2016,
210(2), 356–362.3 T. Loftsson and D. Duchene, Int. J. Pharm., 2007, 3290(1–2),
1–11.4 J. P. Litz, N. Thakkar, T. Portet and S. L. Keller, Biophys. J.,
2016, 1100(3), 635–645.5 E. M. M. Del Vallee, Process Biochem., 2004, 390(9),
1033–1046.6 H. Ohvo and P. J. Slotte, Biochemistry, 1996, 350(24), 8018–8024.7 H. Arima, T. Higashi and K. Motoyama, Ther. Delivery, 2012,
30(5), 633–644.8 Y. Ohtani, T. Irie, K. Uekama, K. Fukunaga and J. Pitha, Eur.
J. Biochem., 1989, 1860(1–2), 17–22.9 T. Irie and K. Uekama, J. Pharm. Sci., 1997, 860(2), 147–162.
10 G. Piel, et al., Int. J. Pharm., 2007, 3380(1–2), 35–427.11 F. Fauvelle, J. C. Debouzy, S. Crouzy, M. Goschl and
Y. Chapron, J. Pharm. Sci., 1997, 860(8), 935–943.12 F. Fauvelle, J. C. Debouzy, R. Nardin and A. Gadelle, Bio-
electrochem. Bioenerg., 1994, 330(1), 95–99.13 R. Leventis and J. R. Silvius, Biophys. J., 2001, 810(4), 2257–2267.14 E. Roka, et al., Molecules, 2015, 200(11), 20269–20285.15 V. Monnaert, S. Tilloy, H. Bricout, L. Fenart, R. Cecchelli and
E. Monflier, J. Pharmacol. Exp. Ther., 2004, 3100(2), 745–751.16 D. Ondo, J. Chem. Thermodyn., 2016, 97, 235–243.17 R. Diaz-Salmeron, I. Chaab, F. Carn, M. Djabourov and
K. Bouchemal, J. Colloid Interface Sci., 2016, 482, 48–57.18 J. P. Litz, N. Thakkar, T. Portet and S. L. Keller, Biophys. J.,
2016, 1100(3), 635–645.19 C. A. Lopez, A. H. de Vries and S. J. Marrink, Sci. Rep., 2013,
3, 2071.20 L. Leclercq, Q. Lubart, J. M. Aubry and V. Nardello-Rataj,
Langmuir, 2013, 290(21), 6242–6252.21 E. Sabadini, F. do Egidio and T. Cosgrove, Langmuir, 2013,
290(15), 4664–4669.22 J. Nishijo, et al., Chem. Pharm. Bull., 2000, 480(1), 48–52.23 P. Hatzi, S. Mourtas, P. G. Klepetsanis and S. G. Antimisiaris,
Int. J. Pharm., 2007, 3330(1), 167–176.24 M.-C. Giocondi, P.-E. Milhiet, P. Dosset and C. Le Grimellec,
Biophys. J., 2004, 860(2), 861–869.25 T. G. Anderson, A. Tan, P. Ganz and J. Seelig, Biochemistry,
2004, 430(8), 2251–2261.26 K. Tanhuanpaa, K. Cheng, K. Anttonen, J. A. Virtanen and
P. Somerharju, Biophys. J., 2001, 810(3), 1501–1510.27 J. Szejtli, T. Cserhati and M. Szogyi, Carbohydr. Polym., 1986,
60(1), 35–49.28 A. Weinberger, et al., Biophys. J., 2013, 1050(1), 154–164.29 K. F. Wang, R. Nagarajan and T. A. Camesano, Biophys. Chem.,
2015, 196, 53–67.30 F. Hook, B. Kasemo, T. Nylander, C. Fant, K. Sott and
H. Elwing, Anal. Chem., 2001, 730(24), 5796–5804.31 F. Johannsmann, Springer Ser. Chem. Sens. Biosens., 2007,
50, 49–109.
Paper Soft Matter
5810 | Soft Matter, 2018, 14, 5800--5810 This journal is©The Royal Society of Chemistry 2018
32 C. A. Keller, K. Glasmastar, V. P. Zhdanov and B. Kasemo,Phys. Rev. Lett., 2000, 84, 5443–5446.
33 J. A. Jackman, M. Kim, V. P. Zhdanov and N.-J. Cho, Phys.Chem. Chem. Phys., 2015, 180(4), 3065–3072.
34 C. A. Schneider, W. S. Rasband and K. W. Eliceiri, Nat.Methods, 2002, 90(7), 671–675.
35 ImageJ. Particle Analysis, 2017, URL https://imagej.net/Particle_Analysis.
36 B. Seantier and B. Kasemo, Langmuir, 2009, 250(10), 5767–5772.37 R. P. Richter, R. Berat and A. R. Brisson, Langmuir, 2006,
220(8), 3497–3505.
38 K. F. Wang, R. Nagarajan, C. M. Mello and T. A. Camesano,J. Phys. Chem. B, 2011, 1150(51), 15228–15235.
39 J. Szejtli, Chem. Rev., 1998, 980(5), 1743–1754.40 C. A. Lopez, A. H. de Vries and S. J. Marrink, PLoS Comput.
Biol., 2011, 70(3), e1002020.41 C. A. Lopez, A. H. de Vries and S. J. Marrink, Sci. Rep., 2013,
3, 2071.42 E. Mixcoha, J. Campos-Teran and A. Pineiro, J. Phys. Chem.
B, 2014, 1180(25), 6999–7011.43 J. F. Nagle and S. Tristram-Nagle, Biochim. Biophys. Acta,
Rev. Biomembr., 2000, 14690(3), 159–195.
Soft Matter Paper


![Metabolisme Lipid [Recovered]](https://static.fdocument.org/doc/165x107/55cf98ee550346d0339a8594/metabolisme-lipid-recovered.jpg)