
Supporting Information fileSupporting Information ... taining 5 mM KCl at a concentration of 0.2...
9
Supporting Information Tabuchi et al. 10.1073/pnas.1313707110 SI Materials and Methods Silkmoth Strain. The w1-pnd strain (nondiapausing line, colorless eggs and eyes) was used. Larvae were reared on an artificial diet (Silk Mate 2S; Nosan Corporation Bio Department) at 26 °C and 60% relative humidity under a 16/8-h (light/dark) light cycle. Construction of the pBacUAS-Channelrhodopsin-2 Vector. The DNA fragment encoding mammalian codon-optimized channelrho- dopsin-2 (ChR2) fused with mCherry was amplified by PCR with the primers 5′-CTCCTAGGATGGACTATGGCGGCGCTTT- G-3′ and 5′-CTCCTAGGTTACTTGTACAGCTCGTCCATG- 3′ using pLenti-CaMKIIa-hChR2-mCherry-WPRE (1) as a tem- plate. The recognition sequence for BlnI was added to the 5′ ends of both primers. PCR was implemented with PrimeSTAR HS DNA polymerase (R010A; Takara Bio) under the following thermal program: 98 °C for 2 min, 30 cycles of 98 °C for 10 s, 64 °C for 15 s, and 72 °C for 2 min, followed by 1 cycle at 72 °C 5 min. The amplified DNA was digested with BlnI and inserted into the BlnI site of the pBacMCS[UAS-A3-KMO] vector (2). The re- sultant vector was named pBacUAS-ChR2. The DNA sequence of pBacUAS-ChR2 was verified by using an ABI 310 genetic analyzer with the BigDye terminator cycle sequencing FS ready reaction kit (4337454; Applied Biosystems). Generation of Transgenic Moths. The pBacUAS-ChR2 vector was purified by using a HiSpeed Midi Plasmid Purification Kit (Qiagen), dissolved in 0.5 mM phosphate buffer (pH 7.0) con- taining 5 mM KCl at a concentration of 0.2 mg/mL, and mixed with equal volume of 0.2 mg/mL helper DNA that encodes piggyBac transposase. They were microinjected into eggs of the w1-pnd strains that were collected 3–6 h after oviposition as described (3). The injected eggs were reared to adults and crossed to obtain G1 progeny. Screening of positive clones was performed immediately after the hatch by detecting the body pigmentation induced by Bombyx kynurenine 3-monooxygenase (KMO) expression under the control of the cytoplasmic actin gene (A3) promoter as described in ref. 2. G1 adults were crossed with a BmOR1-GAL4 line (4), and G2 adults were used as a GAL4/UAS strain. RT-PCR. Total RNA from the antennae of male adult silkmoths 2–8d after eclosion was extracted by using the RNeasy Plus Mini Kit (74134; Qiagen). cDNA was synthesized from the total RNA by oligo-dT adaptor primer and avian myeloblastosis virus reverse transcriptase supplied with an RNA PCR kit (Version 3.0; RR019A; Takara, Japan) at 42 °C 30 min. The cDNA was am- plified by using Ex Taq DNA polymerase (RR006A; Takara) under the following thermal program: 94 °C for 2 min, 30 cycles of 98 °C for 10 s, 55 °C for 30 s, and 72 °C 30 s, followed by 1 cycle at 72 °C for 5 min. Amplification of ChR2 or Bombyx mori cytoplasmic actin1 (5) was carried out with the following primer pairs: for ChR2, 5′-GGAGGATAACATGGCCATCA-3′ and 5′- ACTGTTCCACGATGGTGTAG-3′; for actin1, 5′-ATG- TGCAAGGCCGGTTTCGC-3′ and 5′-CGACACGCAGCT- CATTGTAG-3′. Equal amounts of PCR products were separated by electrophoresis on a 1.5% (wt/vol) agarose gel. The identity of the PCR products were verified by DNA sequence analysis on an ABI 310 genetic analyzer by using the BigDye terminator cycle sequencing FS ready reaction kit. Confocal Imaging of mCherry Fluorescence. Brains of adult male silkmoths within 2–8 d after eclosion were dissected out from the head and mounted on a Petri dish filled with silkmoth physio- logical saline solution (140 mM NaCl, 5 mM KCl, 7 mM CaCl 2 , 1 mM MgCl 2 , 4 mM NaHCO 3 , 5 mM trehalose, 5 mM N-Tris [hydroxymethyl]methyl-2-aminoethanesulfonic acid, and 50 mM sucrose, pH 7.0). Isolated brains were fixed in PBS containing 4% (wt/vol) paraformaldehyde overnight (12–16 h) at 4 °C, de- hydrated with an ethanol series, cleared in methyl salicylate, and imaged by using a confocal imaging system (LSM-510; Carl Zeiss) with 543-nm excitation and a long-pass filter (>585 nm). Whole-Mount in Situ Hybridization. Fluorescein-labeled BmOR1 and Digoxigenin (DIG)-labeled ChR2 antisense RNA probes were synthesized from linearized recombinant pGEM-T Easy vectors by using an SP6/T7 transcription kit (Roche) according to the manufacturer’s instructions. BmOR1-GAL4/UAS-ChR2 male antennae after 3 d of eclosion were dissected from the animal, cut into pieces, fixed with 4% (wt/vol) paraformaldehyde/PBS overnight at 4 °C, treated with 50 μg/mL proteinase K/PBS for 1 h at 37 °C, and then fixed for an additional 5 min in 4% (wt/vol) para- formaldehyde/PBS. Samples were washed three times for 5 min each time in 0.1% Tween 20/PBS (PBST) at room temperature, followed by an incubation for 5 min in 1:1 PBST/hybridization buffer [50% (vol/vol) formamide, 5× SSC, 50 μg/mL heparin, 0.1% Tween 20, and 100 μg/mL herring sperm DNA]. Hybrid- ization reactions were carried out for 48 h at 60 °C by using hybridization buffer containing 500 ng/mL concentrations of both DIG-labeled ChR2 and fluorescein-labeled BmOR1 anti- sense RNA probes. Hybridized antennae were washed for 10 min at 60 °C in hybridization buffer and 10 min in 1:1 PBST/hy- bridization buffer, followed by three washes in PBST for 10 min each. The sections were washed three times for 5 min each in PBST at 60 °C. The hybridization signal was amplified by using the TSA Plus Fluorescence System (Perkin-Elmer), according to the manufacturer’s instructions. The DIG-labeled probes were visualized by using anti–DIG-POD (Roche; 1:20) with Cy3 tyr- amides as the substrate, and the fluorescein-labeled probes were visualized by using anti–fluorescein-POD (Perkin-Elmer; 1:20) with fluorescein tyramides as the substrate. Negative controls used sense probes, and no signals were detected. Injection of Exogenous All-Trans Retinal. Because insects do not intrinsically possess all-trans retinal (ATR), we injected exoge- nous ATR into the abdomen of silkmoths. We used moths 2–5h after ATR injection because this time window was identified to coincide with high ATR concentration in the moth antennae as confirmed by HPLC (Fig. S2). ATR (R240000; Toronto Re- search Chemicals) was dissolved in peanut oil (P2144; Sigma- Aldrich) at a concentration of 50 mM, and a 10-μL ATR solution was injected into the abdomens of silkmoths by using a micro- syringe needle. Then, the silkmoths were incubated for 2 h at room temperature and used for behavioral and electrophysio- logical analysis, based on the result of HPLC analysis. Detection of ATR by Normal-Phase HPLC. Antennae were collected from six male silkmoths (w1-pnd) at a series of times after in- jection of ATR (from 0.5 to 20 h), homogenized, and dissolved in n-hexane. For analysis of ATR, a 6× 150-mm column of silica gel (SL12S03-1506WT; YMC) combined with a 5× 10-mm guard cartridge column (SL12S03-0105WFG; YMC) was used at a flow rate of 1 mL/min. The mobile-phase solvent was 16% (vol/vol) dioxane in n-hexane. The detection wavelength was 350 nm. For quantification of ATR content, a standard curve was obtained by Tabuchi et al. www.pnas.org/cgi/content/short/1313707110 1 of 9
-
Upload
nguyenkien -
Category
Documents
-
view
214 -
download
0
Transcript of Supporting Information fileSupporting Information ... taining 5 mM KCl at a concentration of 0.2...

Supporting InformationTabuchi et al. 10.1073/pnas.1313707110SI Materials and MethodsSilkmoth Strain. The w1-pnd strain (nondiapausing line, colorlesseggs and eyes) was used. Larvae were reared on an artificial diet(Silk Mate 2S; Nosan Corporation Bio Department) at 26 °C and60% relative humidity under a 16/8-h (light/dark) light cycle.
Construction of the pBacUAS-Channelrhodopsin-2 Vector. The DNAfragment encoding mammalian codon-optimized channelrho-dopsin-2 (ChR2) fused with mCherry was amplified by PCR withthe primers 5′-CTCCTAGGATGGACTATGGCGGCGCTTT-G-3′ and 5′-CTCCTAGGTTACTTGTACAGCTCGTCCATG-3′ using pLenti-CaMKIIa-hChR2-mCherry-WPRE (1) as a tem-plate. The recognition sequence for BlnI was added to the 5′ends of both primers. PCR was implemented with PrimeSTARHS DNA polymerase (R010A; Takara Bio) under the followingthermal program: 98 °C for 2 min, 30 cycles of 98 °C for 10 s, 64 °Cfor 15 s, and 72 °C for 2 min, followed by 1 cycle at 72 °C 5 min.The amplified DNA was digested with BlnI and inserted into theBlnI site of the pBacMCS[UAS-A3-KMO] vector (2). The re-sultant vector was named pBacUAS-ChR2. The DNA sequenceof pBacUAS-ChR2 was verified by using an ABI 310 geneticanalyzer with the BigDye terminator cycle sequencing FS readyreaction kit (4337454; Applied Biosystems).
Generation of Transgenic Moths. The pBacUAS-ChR2 vector waspurified by using a HiSpeed Midi Plasmid Purification Kit(Qiagen), dissolved in 0.5 mM phosphate buffer (pH 7.0) con-taining 5 mM KCl at a concentration of 0.2 mg/mL, and mixedwith equal volume of 0.2 mg/mL helper DNA that encodespiggyBac transposase. They were microinjected into eggs of thew1-pnd strains that were collected 3–6 h after oviposition asdescribed (3). The injected eggs were reared to adults andcrossed to obtain G1 progeny. Screening of positive clones wasperformed immediately after the hatch by detecting the bodypigmentation induced by Bombyx kynurenine 3-monooxygenase(KMO) expression under the control of the cytoplasmic actingene (A3) promoter as described in ref. 2. G1 adults werecrossed with a BmOR1-GAL4 line (4), and G2 adults were usedas a GAL4/UAS strain.
RT-PCR.Total RNA from the antennae ofmale adult silkmoths 2–8 dafter eclosion was extracted by using the RNeasy Plus Mini Kit(74134; Qiagen). cDNA was synthesized from the total RNA byoligo-dT adaptor primer and avian myeloblastosis virus reversetranscriptase supplied with an RNA PCR kit (Version 3.0;RR019A; Takara, Japan) at 42 °C 30 min. The cDNA was am-plified by using Ex Taq DNA polymerase (RR006A; Takara)under the following thermal program: 94 °C for 2 min, 30 cyclesof 98 °C for 10 s, 55 °C for 30 s, and 72 °C 30 s, followed by1 cycle at 72 °C for 5 min. Amplification of ChR2 or Bombyx moricytoplasmic actin1 (5) was carried out with the following primerpairs: for ChR2, 5′-GGAGGATAACATGGCCATCA-3′ and 5′-ACTGTTCCACGATGGTGTAG-3′; for actin1, 5′-ATG-TGCAAGGCCGGTTTCGC-3′ and 5′-CGACACGCAGCT-CATTGTAG-3′. Equal amounts of PCR products were separatedby electrophoresis on a 1.5% (wt/vol) agarose gel. The identity ofthe PCR products were verified by DNA sequence analysis on anABI 310 genetic analyzer by using the BigDye terminator cyclesequencing FS ready reaction kit.
Confocal Imaging of mCherry Fluorescence. Brains of adult malesilkmoths within 2–8 d after eclosion were dissected out from the
head and mounted on a Petri dish filled with silkmoth physio-logical saline solution (140 mM NaCl, 5 mM KCl, 7 mM CaCl2,1 mM MgCl2, 4 mM NaHCO3, 5 mM trehalose, 5 mM N-Tris[hydroxymethyl]methyl-2-aminoethanesulfonic acid, and 50 mMsucrose, pH 7.0). Isolated brains were fixed in PBS containing4% (wt/vol) paraformaldehyde overnight (12–16 h) at 4 °C, de-hydrated with an ethanol series, cleared in methyl salicylate, andimaged by using a confocal imaging system (LSM-510; CarlZeiss) with 543-nm excitation and a long-pass filter (>585 nm).
Whole-Mount in Situ Hybridization. Fluorescein-labeled BmOR1and Digoxigenin (DIG)-labeled ChR2 antisense RNA probeswere synthesized from linearized recombinant pGEM-T Easyvectors by using an SP6/T7 transcription kit (Roche) according tothe manufacturer’s instructions. BmOR1-GAL4/UAS-ChR2 maleantennae after 3 d of eclosion were dissected from the animal, cutinto pieces, fixed with 4% (wt/vol) paraformaldehyde/PBS overnightat 4 °C, treated with 50 μg/mL proteinase K/PBS for 1 h at 37 °C,and then fixed for an additional 5 min in 4% (wt/vol) para-formaldehyde/PBS. Samples were washed three times for 5 mineach time in 0.1% Tween 20/PBS (PBST) at room temperature,followed by an incubation for 5 min in 1:1 PBST/hybridizationbuffer [50% (vol/vol) formamide, 5× SSC, 50 μg/mL heparin,0.1% Tween 20, and 100 μg/mL herring sperm DNA]. Hybrid-ization reactions were carried out for 48 h at 60 °C by usinghybridization buffer containing 500 ng/mL concentrations ofboth DIG-labeled ChR2 and fluorescein-labeled BmOR1 anti-sense RNA probes. Hybridized antennae were washed for 10 minat 60 °C in hybridization buffer and 10 min in 1:1 PBST/hy-bridization buffer, followed by three washes in PBST for 10 mineach. The sections were washed three times for 5 min each inPBST at 60 °C. The hybridization signal was amplified by usingthe TSA Plus Fluorescence System (Perkin-Elmer), accordingto the manufacturer’s instructions. The DIG-labeled probes werevisualized by using anti–DIG-POD (Roche; 1:20) with Cy3 tyr-amides as the substrate, and the fluorescein-labeled probes werevisualized by using anti–fluorescein-POD (Perkin-Elmer; 1:20)with fluorescein tyramides as the substrate. Negative controlsused sense probes, and no signals were detected.
Injection of Exogenous All-Trans Retinal. Because insects do notintrinsically possess all-trans retinal (ATR), we injected exoge-nous ATR into the abdomen of silkmoths. We used moths 2–5 hafter ATR injection because this time window was identified tocoincide with high ATR concentration in the moth antennae asconfirmed by HPLC (Fig. S2). ATR (R240000; Toronto Re-search Chemicals) was dissolved in peanut oil (P2144; Sigma-Aldrich) at a concentration of 50 mM, and a 10-μL ATR solutionwas injected into the abdomens of silkmoths by using a micro-syringe needle. Then, the silkmoths were incubated for 2 h atroom temperature and used for behavioral and electrophysio-logical analysis, based on the result of HPLC analysis.
Detection of ATR by Normal-Phase HPLC. Antennae were collectedfrom six male silkmoths (w1-pnd) at a series of times after in-jection of ATR (from 0.5 to 20 h), homogenized, and dissolved inn-hexane. For analysis of ATR, a 6× 150-mm column of silica gel(SL12S03-1506WT; YMC) combined with a 5× 10-mm guardcartridge column (SL12S03-0105WFG; YMC) was used at a flowrate of 1 mL/min. The mobile-phase solvent was 16% (vol/vol)dioxane in n-hexane. The detection wavelength was 350 nm. Forquantification of ATR content, a standard curve was obtained by
Tabuchi et al. www.pnas.org/cgi/content/short/1313707110 1 of 9

analyzing an ATR load series (from 0.0025 to 1 pmol), and theamount of ATR content in the sample was determined by cal-culating the peak areas.
Light Stimulation.Ahigh-power blue LEDwith peak wavelength of465 nm (LBW5AP-JYKY-35-Z; OSRAM Opto Semiconductors)was used to generate photostimulation in all experiments. AnotherLED with peak wavelength of 597 nm was used for yellow-lightstimulation for control experiments (LXHL-LL3C; LumiledsLighting). An objective lens and a collimator lens were attached tothe LED to converge the light. A series of light intensities wasmeasured by using a power meter (1Z01803 Orion PD; OphirOptronics). To control the duration of photostimulation, a com-mercial microcontroller (Microchip PIC16F88; Microchip Tech-nology) or an electric stimulator (SEN-8203; Nihon Kohden) wereused. We verified that photostimulation illuminated the wholesurface of an antenna within the illumination spot. Olfactorystimuli (bombykol) were administered as described in ref. 6.
Behavioral Experiments. Two hours after injection of ATR, mothswere placed in a black-colored cage such that the light level waskept constant during the experiments (∼20 lx). Duration andintensity of photostimulation are described in the correspondingfigure legends (Figs. 1–3). Throughout the experiments, the in-terstimulus interval (ISI) was set at 1 min, and floor paper sheetswere changed after each series of experiments. Wing flappinglasting >10 s following photostimulation was counted as re-sponse. Behavioral responses were recorded on video (NV-GS150; Panasonic) and used for analysis.
Locomotion Analysis. The moth was tethered via a bar attached tothe dorsal part of its thorax and allowed to grip and rotate an air-cushioned Styrofoam sphere by its leg movements. Sphere ro-tation, reflecting the intended walking path of the moth, wasdetected by two optical sensors and recorded by a computer usingcustom software under Linux. A carthesian coordinate system wasused; therefore, left turns of the animal have a positive sign.Walking patterns were evaluated with Scilab using cumulativeangles of the body orientation with respect to the start of theexperiment and path lengths. Photostimulation (1.69 mW/mm2)with 100-ms duration and bombykol (100 ng) stimulation with200-ms duration were applied unilaterally as single pulses.
Olfactory Receptor Neuron Recordings. The moth was immobilizedon a plastic plate, and the antenna was stabilized by dental wax.Recordings of spikes were conducted by inserting an electrolyt-ically sharpened tungsten wire electrode into the base of a sen-sillum trichodeum. As a reference electrode, a platinum plate wasinserted in the neck of the moth. Photostimulation was generatedby the blue LED system described above. Bombykol or bombykal(3 μg) were tested as odor stimuli in accordance with the pro-tocol described in ref. 4. The response was amplified by anelectrode amplifier (MEZ-8300; Nihon Kohden). Acquiredelectrical signals were bandpass-filtered at 0.5–3 kHz and digi-tized at 10 kHz by using an analog-to-digital (A/D) converter(Digidata 1322; Molecular Devices).
Projection Neuron Recordings. Two methods were used to recordprojection neuron (PN) responses: intracellular recordings andcell-attached recordings. The long-term stability in cell-attachedrecordings allowed us to apply paired-pulse photostimulationwith various ISIs and pharmacological experiments. Intracellularrecordings were carried out essentially as described (7). In brief,after anesthesia by cooling moths at 4 °C for 30 min, the brainwas exposed by opening the head capsule, and the antennal lobe(AL) was surgically desheathed to allow insertion of the micro-electrode. A sharp electrode (resistance 70–150 MΩ) was in-serted into the toroid region of the AL. Electrodes were filled
with 5% Lucifer yellow dilithium salt (Sigma) dissolved in dis-tilled water. During the recordings, Lucifer yellow and lithiumions functioned as electrolytes as well as for fluorescence label-ing. The electrode signal was amplified by an electrode amplifier(MEZ-8300) and recorded on a digital audiotape recorder (RD-125T; TEAC) at 24 kHz. The acquired signals were stored ona computer by using an A/D converter (Quick Vu 2; TEAC).In the cell-attached recordings, the AL was isolated from the
brain to allow better visualization of the cell bodies and of thepatch pipette filled with saline (resistance 3–7 MΩ). Normalphysiological saline of the silkmoth—140 mM NaCl, 5 mM KCl,7 mM CaCl2, 1 mM MgCl2, 4 mM NaHCO3, 5 mM Trehalose,5 mM N-Tris[hydroxymethyl]methyl-2-aminoethanesulfonic acid,and 50 mM sucrose—was used in the patch pipette. The antennaremains intact and attached to the AL in this preparation (8).The preparation was briefly treated with enzymes (collagenase,0.5 mg/mL; dispase, 2 mg/mL) for 5 min at 25 °C, and cell bodieswere cleaned with a small stream of saline pressure-ejected froma large-diameter pipette. In addition, the cell surface was furthercleaned by positive pressure from the recording electrode, whichwas continuously applied by using a 1-mL syringe connected tothe electrode holder before recording. The preparation wasimmobilized on the bottom of a 35 × 10-mm chamber (351008easy-grip dish; BD) by using a plastic anchor and wax. Thechamber was placed on the stage of an inverted microscope(Diaphot 300; Nikon) and viewed with phase-contrast optics(40× air objective lens). During the experiments, the preparationwas continuously perfused with saline by means of a gravity-driven system. The saline was bubbled with 95% (vol/vol) O2 and5% (vol/vol) CO2 before use. In the paired-pulse photo-stimulation paradigm, two different durations (3 and 10 ms) withconstant intensity (1.69 mW/mm2) were used. The two durationsof paired-pulse photostimulation were tested in separate ex-periments. One PN was recorded per silkmoth. Each experi-mental session consisted of a response for each ISI (20, 40, 60,80, 100, 120, 140, 160, and 180 ms). The order of the sessions wasrandomized, and each session was spaced at least 1 min apart. Toanalyze PN responses in paired-pulse photostimulation, meanspontaneous PN firing rate in a 3-s time window before the firststimulation was subtracted from the rate of firing activity in thecounting windows. Spikes were detected by monitoring capaci-tive currents, under loose seals (resistance 20–100 MΩ) in volt-age-clamp mode at zero-current potential. Recordings weremade by using a patch-clamp amplifier (Axopatch 1D; AxonInstruments), bandpass-filtered at 100–400 Hz, and digitized at10 kHz through an A/D converter (Digidata 1200A; Axon In-struments) controlled by pCLAMP8 software running on thehost PC. Spikes were registered when signal amplitude exceededa threshold line set at three times SD from the mean of a 6-srunning average. In some cases, stimulus artifacts were regis-tered as spikes by this criterion, but they were removed manually.
Neck Motor Neuron Recordings. After removing the abdomen andlegs, the moth was mounted ventral side up on a wax chamber.The ventral part of the neck was exposed, and two glass suctionelectrodes filled with the saline solution described above wereapplied to the second cervical nerves to record the activity of neckmotor neurons. The electrode signals were amplified by anelectrode amplifier (Nihon Kohden AB-651J with preamplifierJB-101J). Electrophysiological data were captured on a PC viaLabVIEW (National Instruments).
Pharmacology. GABA receptor blockers were prepared as con-centrated stock solutions. These were diluted in saline to providethe final concentration of the blocker before experiments. Picro-toxin (168-17961; Wako) was prepared as a 250 mM stock inDMSO, and used at a final concentration of 250 μM. Then, 3-N-[1-(3,4-dichlorophenyl)ethylamino]-2-hydroxypropyl cyclohexylmethyl
Tabuchi et al. www.pnas.org/cgi/content/short/1313707110 2 of 9
phosphinic acid (CGP54626; 1088; Tocris) was prepared as a 50mM stock in DMSO and used at a final concentration of 50 μM.Our choice of these final concentrations was based on publisheddata (9). PN responses were measured after 10 min of bath ap-plication of these drugs at their final concentrations.
Estimation of Conduction Time in the Antennal Nerve. A pair ofmetal electrodes was used (Ag/AgCl wires; 200-μm diameter).Recording was achieved by placing one electrode on the base ofthe antennal nerve for recording a population spike of olfactoryreceptor neurons (ORNs). The recording electrode was con-nected to the leads of a DC amplifier, and the ground electrodewas placed on the neck of the moth. Signals were digitizedthrough an A/D converter (Digidata 1200A) attached to PCrunning pCLAMP8 software. To localize the photostimulation tothe distal tip of the antenna, a 473-nm laser diode (SDL-473-010T; Shanghai Dream Lasers) controlled by an electric stimu-lator (SEN-8203) was used. The actual conduction time in theantennal nerve was calculated by subtracting the latency of the
first spike evoked in ORN recordings from the latency time inexperimental data of the extracellular population spike recordingat the base of the AL.
Data Analysis. All analyses, statistical evaluations, and graphingwere performed in Igor software (WaveMetrics), MATLAB(MathWorks), Scilab, or R. All mean values are reported as mean ±SEM averaged across experiments. The raw electrophysiologicaldata were transformed to spike raster plots by using a customprogram written in MATLAB, and the Wilcoxon signed rank testwas used for statistical evaluation. In the behavioral experiments,analysis of variance tests were used to examine difference be-tween the different experimental groups followed by a contrastcomparison, using Fisher’s exact test. We also used the generallinear model, followed by Bonferroni adjustment for multiplecomparisons among groups and Kruskal–Wallis test, followed byMann–Whitney U test for multiple comparisons of nonnormallydistributed data. A statistical significance level of 0.05 was ac-cepted for all testing.
1. Zhang F, et al. (2007) Multimodal fast optical interrogation of neural circuitry. Nature446(7136):633–639.
2. Quan G, et al. (2007) Rescue of white egg 1 mutant by introduction of the wild-typeBombyx kynurenine 3–monooxygenase gene. Insect Sci 14(2):85–92.
3. Tamura T, et al. (2000) Germline transformation of the silkworm Bombyx mori L. usinga piggyBac transposon-derived vector. Nat Biotechnol 18(1):81–84.
4. Sakurai T, et al. (2011) A single sex pheromone receptor determines chemical responsespecificity of sexual behavior in the silkmoth Bombyx mori. PLoS Genet 7(6):e1002115.
5. Mounier N, Gaillard J, Prudhomme JC (1987) Nucleotide sequence of the coding regionof two actin genes in Bombyx mori. Nucleic Acids Res 15(6):2781.
6. Gatellier L, Nagao T, Kanzaki R (2004) Serotonin modifies the sensitivity of the malesilkmoth to pheromone. J Exp Biol 207(14):2487–2496.
7. Namiki S, Iwabuchi S, Kanzaki R (2008) Representation of a mixture of pheromone andhost plant odor by antennal lobe projection neurons of the silkmoth Bombyx mori. JComp Physiol A Neuroethol Sens Neural Behav Physiol 194(5):501–515.
8. Kloppenburg P, Ferns D, Mercer AR (1999) Serotonin enhances central olfactoryneuron responses to female sex pheromone in the male sphinx moth manduca sexta. JNeurosci 19(19):8172–8181.
9. Wilson RI, Laurent G (2005) Role of GABAergic inhibition in shaping odor-evokedspatiotemporal patterns in the Drosophila antennal lobe. J Neurosci 25(40):9069–9079.
ITR ITRSV40 SV40ChR2mCherryUASKMO
A3promoter
<pBac UAS-ChR2>
ChR2BmOR1 Merged
A
B
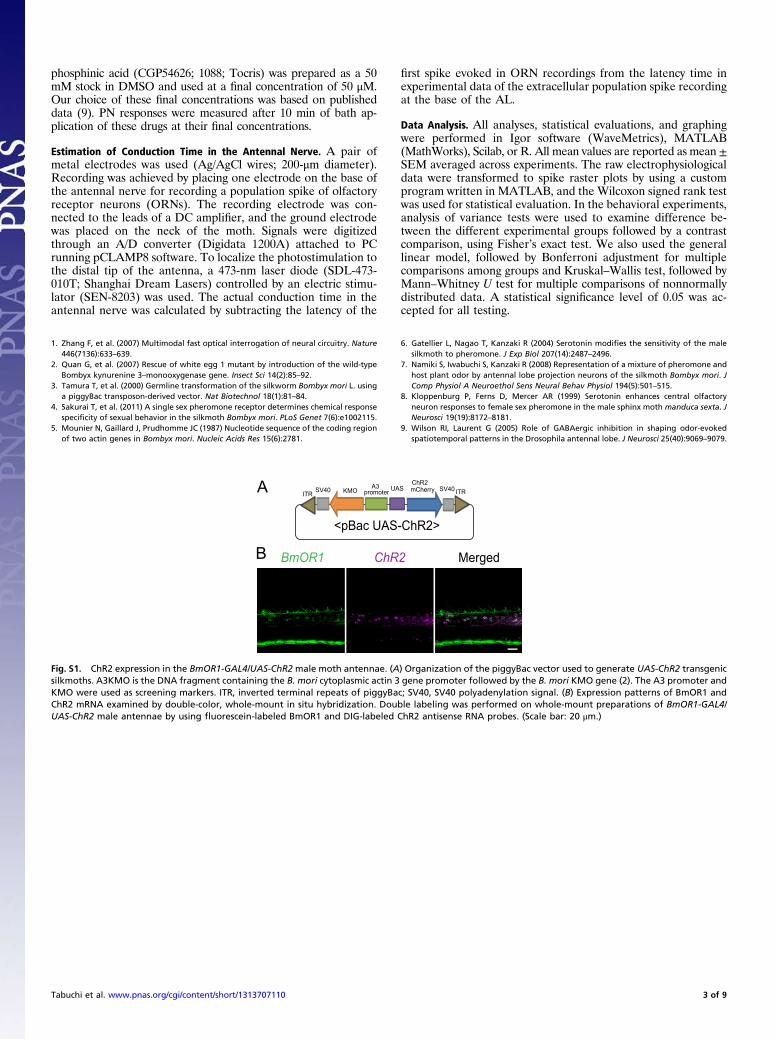
Fig. S1. ChR2 expression in the BmOR1-GAL4/UAS-ChR2 male moth antennae. (A) Organization of the piggyBac vector used to generate UAS-ChR2 transgenicsilkmoths. A3KMO is the DNA fragment containing the B. mori cytoplasmic actin 3 gene promoter followed by the B. mori KMO gene (2). The A3 promoter andKMO were used as screening markers. ITR, inverted terminal repeats of piggyBac; SV40, SV40 polyadenylation signal. (B) Expression patterns of BmOR1 andChR2 mRNA examined by double-color, whole-mount in situ hybridization. Double labeling was performed on whole-mount preparations of BmOR1-GAL4/UAS-ChR2 male antennae by using fluorescein-labeled BmOR1 and DIG-labeled ChR2 antisense RNA probes. (Scale bar: 20 μm.)
Tabuchi et al. www.pnas.org/cgi/content/short/1313707110 3 of 9
ATR
Con
tent
(pm
ol/m
oth)
Time course after injection (h)0 155 10 20
0
0.1
0.2
0.3
0.4
0.5
0.6
0.7
0.8
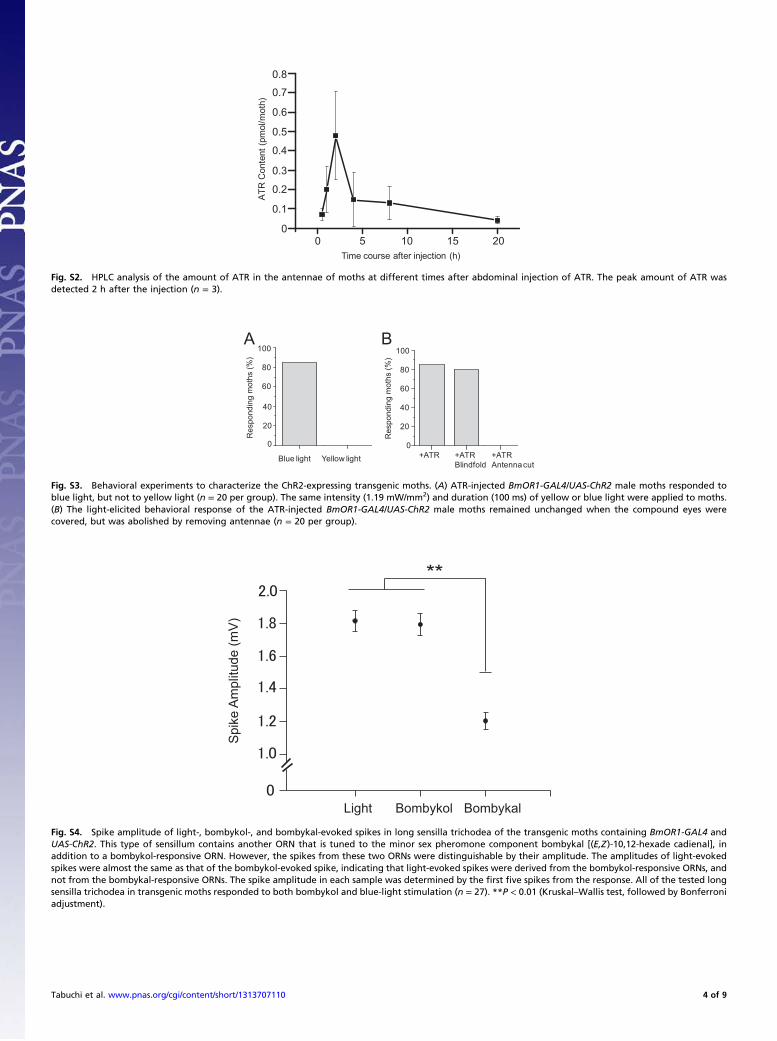
Fig. S2. HPLC analysis of the amount of ATR in the antennae of moths at different times after abdominal injection of ATR. The peak amount of ATR wasdetected 2 h after the injection (n = 3).
A B
20
40
60
80
100
0
Blue light Yellow light
)%(
shtom
gni dnopseR
20
40
60
80
100
0+ATR +ATR
Blindfold+ATRAntenna cut
)%(
shtom
gni dnopseR
Fig. S3. Behavioral experiments to characterize the ChR2-expressing transgenic moths. (A) ATR-injected BmOR1-GAL4/UAS-ChR2 male moths responded toblue light, but not to yellow light (n = 20 per group). The same intensity (1.19 mW/mm2) and duration (100 ms) of yellow or blue light were applied to moths.(B) The light-elicited behavioral response of the ATR-injected BmOR1-GAL4/UAS-ChR2 male moths remained unchanged when the compound eyes werecovered, but was abolished by removing antennae (n = 20 per group).
Light Bombykol Bombykal
)V
m(edutil p
mA
eki pS
**
Fig. S4. Spike amplitude of light-, bombykol-, and bombykal-evoked spikes in long sensilla trichodea of the transgenic moths containing BmOR1-GAL4 andUAS-ChR2. This type of sensillum contains another ORN that is tuned to the minor sex pheromone component bombykal [(E,Z)-10,12-hexade cadienal], inaddition to a bombykol-responsive ORN. However, the spikes from these two ORNs were distinguishable by their amplitude. The amplitudes of light-evokedspikes were almost the same as that of the bombykol-evoked spike, indicating that light-evoked spikes were derived from the bombykol-responsive ORNs, andnot from the bombykal-responsive ORNs. The spike amplitude in each sample was determined by the first five spikes from the response. All of the tested longsensilla trichodea in transgenic moths responded to both bombykol and blue-light stimulation (n = 27). **P < 0.01 (Kruskal–Wallis test, followed by Bonferroniadjustment).
Tabuchi et al. www.pnas.org/cgi/content/short/1313707110 4 of 9
5 mV
4 Hz500 ms
Bombykol 10 ng
5 mV
4 Hz500 ms
Blue light 1.69 mW/mm2A
B
D
M
Contralateral light
Ipsilateral light 200 V5 s
T
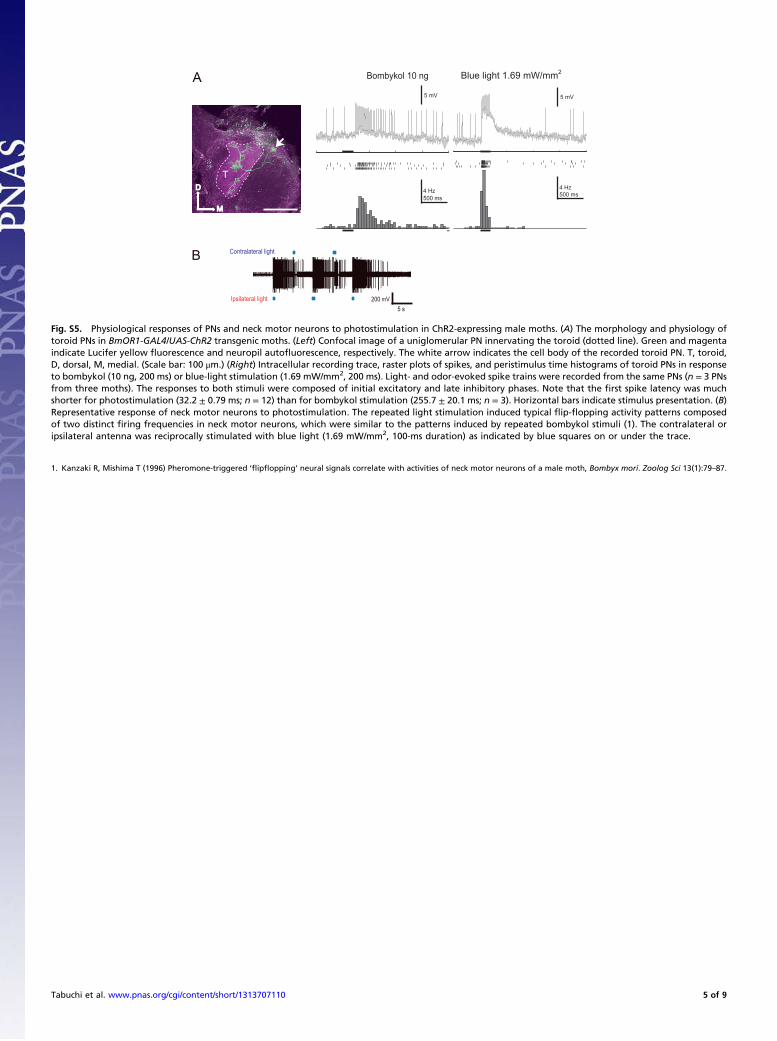
Fig. S5. Physiological responses of PNs and neck motor neurons to photostimulation in ChR2-expressing male moths. (A) The morphology and physiology oftoroid PNs in BmOR1-GAL4/UAS-ChR2 transgenic moths. (Left) Confocal image of a uniglomerular PN innervating the toroid (dotted line). Green and magentaindicate Lucifer yellow fluorescence and neuropil autofluorescence, respectively. The white arrow indicates the cell body of the recorded toroid PN. T, toroid,D, dorsal, M, medial. (Scale bar: 100 μm.) (Right) Intracellular recording trace, raster plots of spikes, and peristimulus time histograms of toroid PNs in responseto bombykol (10 ng, 200 ms) or blue-light stimulation (1.69 mW/mm2, 200 ms). Light- and odor-evoked spike trains were recorded from the same PNs (n = 3 PNsfrom three moths). The responses to both stimuli were composed of initial excitatory and late inhibitory phases. Note that the first spike latency was muchshorter for photostimulation (32.2 ± 0.79 ms; n = 12) than for bombykol stimulation (255.7 ± 20.1 ms; n = 3). Horizontal bars indicate stimulus presentation. (B)Representative response of neck motor neurons to photostimulation. The repeated light stimulation induced typical flip-flopping activity patterns composedof two distinct firing frequencies in neck motor neurons, which were similar to the patterns induced by repeated bombykol stimuli (1). The contralateral oripsilateral antenna was reciprocally stimulated with blue light (1.69 mW/mm2, 100-ms duration) as indicated by blue squares on or under the trace.
1. Kanzaki R, Mishima T (1996) Pheromone-triggered ‘flipflopping’ neural signals correlate with activities of neck motor neurons of a male moth, Bombyx mori. Zoolog Sci 13(1):79–87.
Tabuchi et al. www.pnas.org/cgi/content/short/1313707110 5 of 9
Weak stimulus (3 ms duration)
Strong stimulus (10 ms duration)
20 40 60 80 100 120 140 160 180
Num
ber o
f Spi
kes
ISI (ms)
0
5
10
1st-evoked weak stimulus (3 ms duration) 2nd-evoked weak stimulus (3 ms duration) 1st-evoked strong stimulus (10 ms duration) 2nd-evoked strong stimulus (10 ms duration)
20 40 60 80 100 120 140 160 180
ISI (ms)
Num
ber o
f Spi
kes
0
2
4
A
B
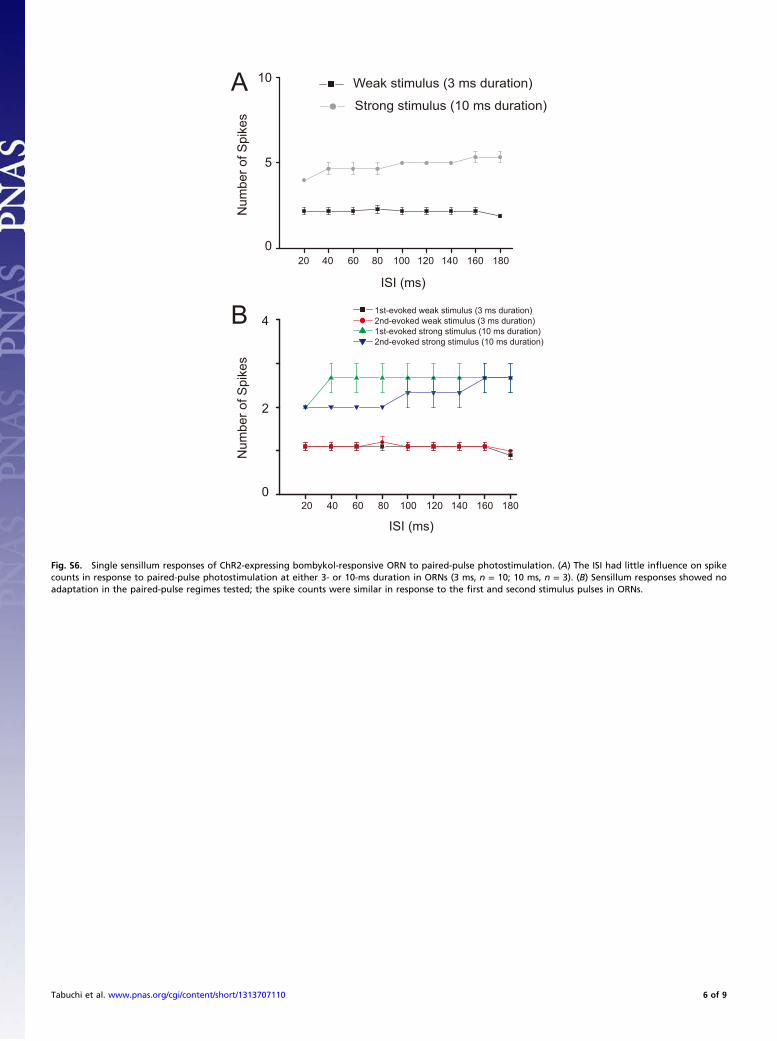
Fig. S6. Single sensillum responses of ChR2-expressing bombykol-responsive ORN to paired-pulse photostimulation. (A) The ISI had little influence on spikecounts in response to paired-pulse photostimulation at either 3- or 10-ms duration in ORNs (3 ms, n = 10; 10 ms, n = 3). (B) Sensillum responses showed noadaptation in the paired-pulse regimes tested; the spike counts were similar in response to the first and second stimulus pulses in ORNs.
Tabuchi et al. www.pnas.org/cgi/content/short/1313707110 6 of 9
50 V
100 ms
A B
C
Num
ber o
f Tria
ls
0
2
4
6
5 7 9 1118 22 26 300
12
8
4
Latency (ms) Latency (ms)
Num
ber o
f Tria
ls
D
1 mV
100 ms
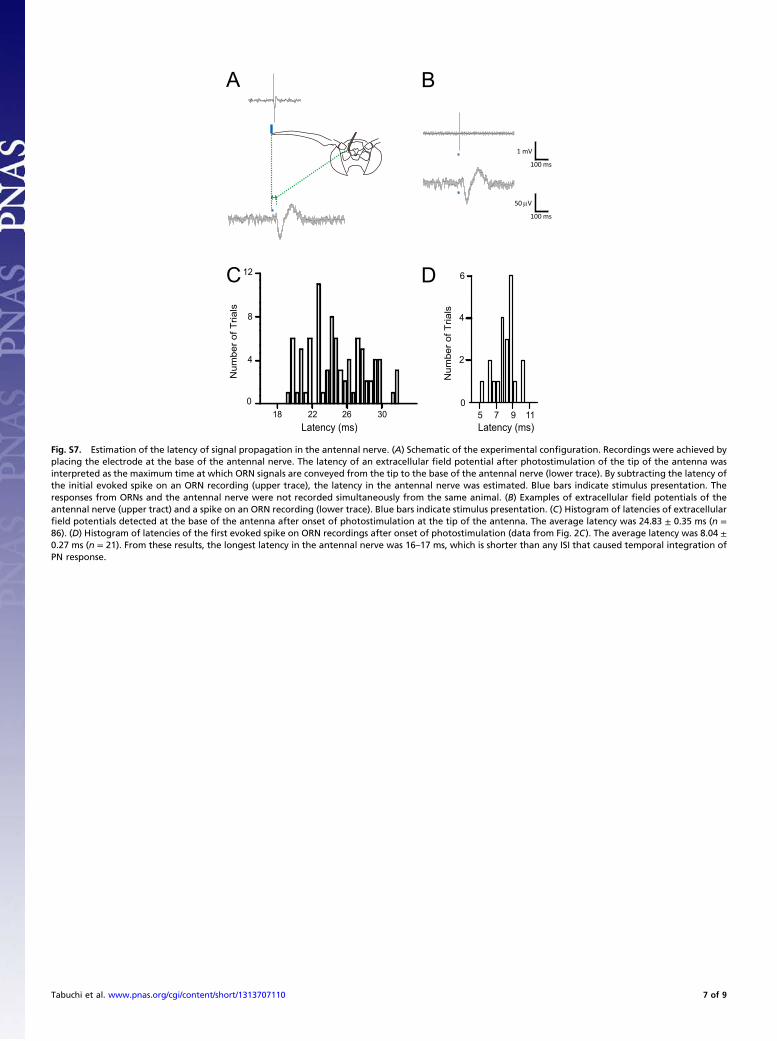
Fig. S7. Estimation of the latency of signal propagation in the antennal nerve. (A) Schematic of the experimental configuration. Recordings were achieved byplacing the electrode at the base of the antennal nerve. The latency of an extracellular field potential after photostimulation of the tip of the antenna wasinterpreted as the maximum time at which ORN signals are conveyed from the tip to the base of the antennal nerve (lower trace). By subtracting the latency ofthe initial evoked spike on an ORN recording (upper trace), the latency in the antennal nerve was estimated. Blue bars indicate stimulus presentation. Theresponses from ORNs and the antennal nerve were not recorded simultaneously from the same animal. (B) Examples of extracellular field potentials of theantennal nerve (upper tract) and a spike on an ORN recording (lower trace). Blue bars indicate stimulus presentation. (C) Histogram of latencies of extracellularfield potentials detected at the base of the antenna after onset of photostimulation at the tip of the antenna. The average latency was 24.83 ± 0.35 ms (n =86). (D) Histogram of latencies of the first evoked spike on ORN recordings after onset of photostimulation (data from Fig. 2C). The average latency was 8.04 ±0.27 ms (n = 21). From these results, the longest latency in the antennal nerve was 16–17 ms, which is shorter than any ISI that caused temporal integration ofPN response.
Tabuchi et al. www.pnas.org/cgi/content/short/1313707110 7 of 9
Control PTX CGP54626 PTX&CGP54626
0
10
20
30
40
Num
ber o
f Spi
kes
Light-evoked Light-evoked minus spontaneous
Control PTX0
100
200
300P
eak
ISF
(Hz)
Control
PTX
CGP54626
PTX&CGP54626
A
B1 s
CGP54626 PTX&CGP54626
***
Control PTX0
10
20
Med
ian
IQR
(ms)
CGP54626 PTX&CGP54626
**
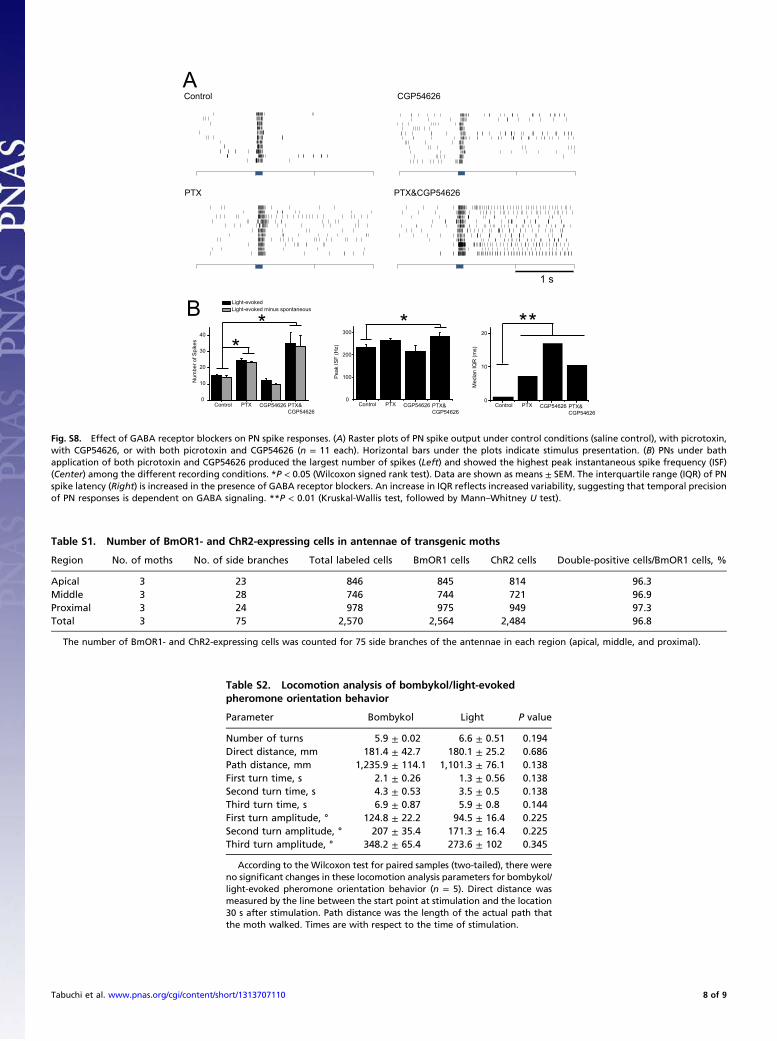
Fig. S8. Effect of GABA receptor blockers on PN spike responses. (A) Raster plots of PN spike output under control conditions (saline control), with picrotoxin,with CGP54626, or with both picrotoxin and CGP54626 (n = 11 each). Horizontal bars under the plots indicate stimulus presentation. (B) PNs under bathapplication of both picrotoxin and CGP54626 produced the largest number of spikes (Left) and showed the highest peak instantaneous spike frequency (ISF)(Center) among the different recording conditions. *P < 0.05 (Wilcoxon signed rank test). Data are shown as means ± SEM. The interquartile range (IQR) of PNspike latency (Right) is increased in the presence of GABA receptor blockers. An increase in IQR reflects increased variability, suggesting that temporal precisionof PN responses is dependent on GABA signaling. **P < 0.01 (Kruskal-Wallis test, followed by Mann–Whitney U test).
Table S1. Number of BmOR1- and ChR2-expressing cells in antennae of transgenic moths
Region No. of moths No. of side branches Total labeled cells BmOR1 cells ChR2 cells Double-positive cells/BmOR1 cells, %
Apical 3 23 846 845 814 96.3Middle 3 28 746 744 721 96.9Proximal 3 24 978 975 949 97.3Total 3 75 2,570 2,564 2,484 96.8
The number of BmOR1- and ChR2-expressing cells was counted for 75 side branches of the antennae in each region (apical, middle, and proximal).
Table S2. Locomotion analysis of bombykol/light-evokedpheromone orientation behavior
Parameter Bombykol Light P value
Number of turns 5.9 ± 0.02 6.6 ± 0.51 0.194Direct distance, mm 181.4 ± 42.7 180.1 ± 25.2 0.686Path distance, mm 1,235.9 ± 114.1 1,101.3 ± 76.1 0.138First turn time, s 2.1 ± 0.26 1.3 ± 0.56 0.138Second turn time, s 4.3 ± 0.53 3.5 ± 0.5 0.138Third turn time, s 6.9 ± 0.87 5.9 ± 0.8 0.144First turn amplitude, ° 124.8 ± 22.2 94.5 ± 16.4 0.225Second turn amplitude, ° 207 ± 35.4 171.3 ± 16.4 0.225Third turn amplitude, ° 348.2 ± 65.4 273.6 ± 102 0.345
According to the Wilcoxon test for paired samples (two-tailed), there wereno significant changes in these locomotion analysis parameters for bombykol/light-evoked pheromone orientation behavior (n = 5). Direct distance wasmeasured by the line between the start point at stimulation and the location30 s after stimulation. Path distance was the length of the actual path thatthe moth walked. Times are with respect to the time of stimulation.
Tabuchi et al. www.pnas.org/cgi/content/short/1313707110 8 of 9
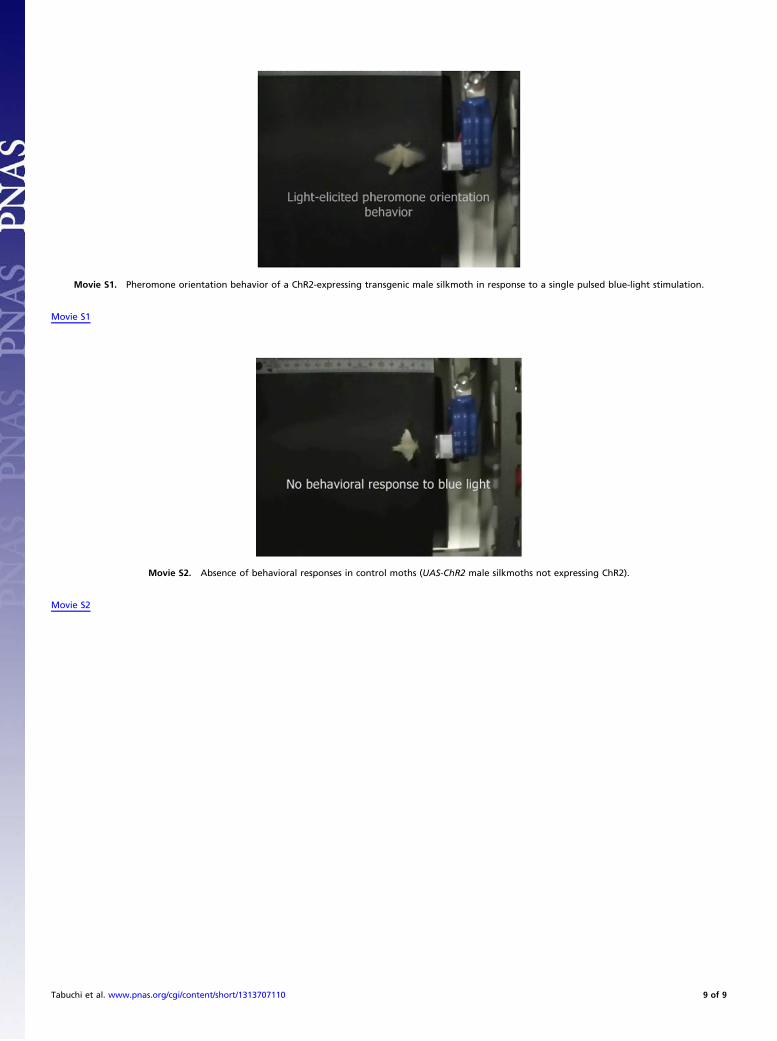
Movie S1. Pheromone orientation behavior of a ChR2-expressing transgenic male silkmoth in response to a single pulsed blue-light stimulation.
Movie S1
Movie S2. Absence of behavioral responses in control moths (UAS-ChR2 male silkmoths not expressing ChR2).
Movie S2
Tabuchi et al. www.pnas.org/cgi/content/short/1313707110 9 of 9


![Supporting Information - Wiley-VCHPreparation of (4S)-Tridec-7-yn-4-ol (6a) Following a Classical Route. To a solution of epoxide 3[1] (1.0 g, 8.6 mmol) in dry THF (43 mL) was slowly](https://static.fdocument.org/doc/165x107/604b5295f84bbe16a4112e20/supporting-information-wiley-preparation-of-4s-tridec-7-yn-4-ol-6a-following.jpg)