Supporting · PDF fileplates (10 g/L tryptone, 5 g/l NaCl, 2.5 g/L agar) ......
8
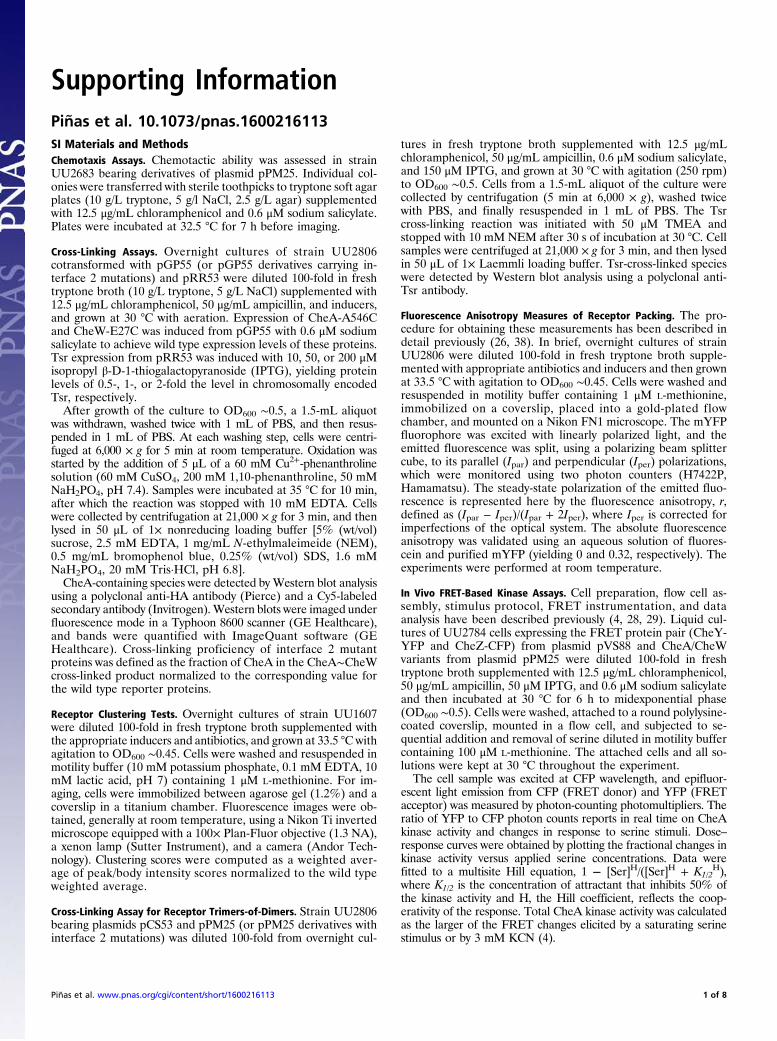
Supporting Information Piñas et al. 10.1073/pnas.1600216113 SI Materials and Methods Chemotaxis Assays. Chemotactic ability was assessed in strain UU2683 bearing derivatives of plasmid pPM25. Individual col- onies were transferred with sterile toothpicks to tryptone soft agar plates (10 g/L tryptone, 5 g/l NaCl, 2.5 g/L agar) supplemented with 12.5 μg/mL chloramphenicol and 0.6 μM sodium salicylate. Plates were incubated at 32.5 °C for 7 h before imaging. Cross-Linking Assays. Overnight cultures of strain UU2806 cotransformed with pGP55 (or pGP55 derivatives carrying in- terface 2 mutations) and pRR53 were diluted 100-fold in fresh tryptone broth (10 g/L tryptone, 5 g/L NaCl) supplemented with 12.5 μg/mL chloramphenicol, 50 μg/mL ampicillin, and inducers, and grown at 30 °C with aeration. Expression of CheA-A546C and CheW-E27C was induced from pGP55 with 0.6 μM sodium salicylate to achieve wild type expression levels of these proteins. Tsr expression from pRR53 was induced with 10, 50, or 200 μM isopropyl β-D-1-thiogalactopyranoside (IPTG), yielding protein levels of 0.5-, 1-, or 2-fold the level in chromosomally encoded Tsr, respectively. After growth of the culture to OD 600 ∼0.5, a 1.5-mL aliquot was withdrawn, washed twice with 1 mL of PBS, and then resus- pended in 1 mL of PBS. At each washing step, cells were centri- fuged at 6,000 × g for 5 min at room temperature. Oxidation was started by the addition of 5 μL of a 60 mM Cu 2+ -phenanthroline solution (60 mM CuSO 4 , 200 mM 1,10-phenanthroline, 50 mM NaH 2 PO 4 , pH 7.4). Samples were incubated at 35 °C for 10 min, after which the reaction was stopped with 10 mM EDTA. Cells were collected by centrifugation at 21,000 × g for 3 min, and then lysed in 50 μL of 1× nonreducing loading buffer [5% (wt/vol) sucrose, 2.5 mM EDTA, 1 mg/mL N-ethylmaleimeide (NEM), 0.5 mg/mL bromophenol blue, 0.25% (wt/vol) SDS, 1.6 mM NaH 2 PO 4 , 20 mM Tris·HCl, pH 6.8]. CheA-containing species were detected by Western blot analysis using a polyclonal anti-HA antibody (Pierce) and a Cy5-labeled secondary antibody (Invitrogen). Western blots were imaged under fluorescence mode in a Typhoon 8600 scanner (GE Healthcare), and bands were quantified with ImageQuant software (GE Healthcare). Cross-linking proficiency of interface 2 mutant proteins was defined as the fraction of CheA in the CheA∼CheW cross-linked product normalized to the corresponding value for the wild type reporter proteins. Receptor Clustering Tests. Overnight cultures of strain UU1607 were diluted 100-fold in fresh tryptone broth supplemented with the appropriate inducers and antibiotics, and grown at 33.5 °C with agitation to OD 600 ∼0.45. Cells were washed and resuspended in motility buffer (10 mM potassium phosphate, 0.1 mM EDTA, 10 mM lactic acid, pH 7) containing 1 μM L-methionine. For im- aging, cells were immobilized between agarose gel (1.2%) and a coverslip in a titanium chamber. Fluorescence images were ob- tained, generally at room temperature, using a Nikon Ti inverted microscope equipped with a 100× Plan-Fluor objective (1.3 NA), a xenon lamp (Sutter Instrument), and a camera (Andor Tech- nology). Clustering scores were computed as a weighted aver- age of peak/body intensity scores normalized to the wild type weighted average. Cross-Linking Assay for Receptor Trimers-of-Dimers. Strain UU2806 bearing plasmids pCS53 and pPM25 (or pPM25 derivatives with interface 2 mutations) was diluted 100-fold from overnight cul- tures in fresh tryptone broth supplemented with 12.5 μg/mL chloramphenicol, 50 μg/mL ampicillin, 0.6 μM sodium salicylate, and 150 μM IPTG, and grown at 30 °C with agitation (250 rpm) to OD 600 ∼0.5. Cells from a 1.5-mL aliquot of the culture were collected by centrifugation (5 min at 6,000 × g), washed twice with PBS, and finally resuspended in 1 mL of PBS. The Tsr cross-linking reaction was initiated with 50 μM TMEA and stopped with 10 mM NEM after 30 s of incubation at 30 °C. Cell samples were centrifuged at 21,000 × g for 3 min, and then lysed in 50 μL of 1× Laemmli loading buffer. Tsr-cross-linked species were detected by Western blot analysis using a polyclonal anti- Tsr antibody. Fluorescence Anisotropy Measures of Receptor Packing. The pro- cedure for obtaining these measurements has been described in detail previously (26, 38). In brief, overnight cultures of strain UU2806 were diluted 100-fold in fresh tryptone broth supple- mented with appropriate antibiotics and inducers and then grown at 33.5 °C with agitation to OD 600 ∼0.45. Cells were washed and resuspended in motility buffer containing 1 μM L-methionine, immobilized on a coverslip, placed into a gold-plated flow chamber, and mounted on a Nikon FN1 microscope. The mYFP fluorophore was excited with linearly polarized light, and the emitted fluorescence was split, using a polarizing beam splitter cube, to its parallel (I par ) and perpendicular (I per ) polarizations, which were monitored using two photon counters (H7422P, Hamamatsu). The steady-state polarization of the emitted fluo- rescence is represented here by the fluorescence anisotropy, r, defined as (I par − I per )/(I par + 2I per ), where I per is corrected for imperfections of the optical system. The absolute fluorescence anisotropy was validated using an aqueous solution of fluores- cein and purified mYFP (yielding 0 and 0.32, respectively). The experiments were performed at room temperature. In Vivo FRET-Based Kinase Assays. Cell preparation, flow cell as- sembly, stimulus protocol, FRET instrumentation, and data analysis have been described previously (4, 28, 29). Liquid cul- tures of UU2784 cells expressing the FRET protein pair (CheY- YFP and CheZ-CFP) from plasmid pVS88 and CheA/CheW variants from plasmid pPM25 were diluted 100-fold in fresh tryptone broth supplemented with 12.5 μg/mL chloramphenicol, 50 μg/mL ampicillin, 50 μM IPTG, and 0.6 μM sodium salicylate and then incubated at 30 °C for 6 h to midexponential phase (OD 600 ∼0.5). Cells were washed, attached to a round polylysine- coated coverslip, mounted in a flow cell, and subjected to se- quential addition and removal of serine diluted in motility buffer containing 100 μM L-methionine. The attached cells and all so- lutions were kept at 30 °C throughout the experiment. The cell sample was excited at CFP wavelength, and epifluor- escent light emission from CFP (FRET donor) and YFP (FRET acceptor) was measured by photon-counting photomultipliers. The ratio of YFP to CFP photon counts reports in real time on CheA kinase activity and changes in response to serine stimuli. Dose– response curves were obtained by plotting the fractional changes in kinase activity versus applied serine concentrations. Data were fitted to a multisite Hill equation, 1 - [Ser] H /([Ser] H + K 1/2 H ), where K 1/2 is the concentration of attractant that inhibits 50% of the kinase activity and H, the Hill coefficient, reflects the coop- erativity of the response. Total CheA kinase activity was calculated as the larger of the FRET changes elicited by a saturating serine stimulus or by 3 mM KCN (4). Piñas et al. www.pnas.org/cgi/content/short/1600216113 1 of 8
Transcript of Supporting · PDF fileplates (10 g/L tryptone, 5 g/l NaCl, 2.5 g/L agar) ......
Supporting InformationPiñas et al. 10.1073/pnas.1600216113SI Materials and MethodsChemotaxis Assays. Chemotactic ability was assessed in strainUU2683 bearing derivatives of plasmid pPM25. Individual col-onies were transferred with sterile toothpicks to tryptone soft agarplates (10 g/L tryptone, 5 g/l NaCl, 2.5 g/L agar) supplementedwith 12.5 μg/mL chloramphenicol and 0.6 μM sodium salicylate.Plates were incubated at 32.5 °C for 7 h before imaging.
Cross-Linking Assays. Overnight cultures of strain UU2806cotransformed with pGP55 (or pGP55 derivatives carrying in-terface 2 mutations) and pRR53 were diluted 100-fold in freshtryptone broth (10 g/L tryptone, 5 g/L NaCl) supplemented with12.5 μg/mL chloramphenicol, 50 μg/mL ampicillin, and inducers,and grown at 30 °C with aeration. Expression of CheA-A546Cand CheW-E27C was induced from pGP55 with 0.6 μM sodiumsalicylate to achieve wild type expression levels of these proteins.Tsr expression from pRR53 was induced with 10, 50, or 200 μMisopropyl β-D-1-thiogalactopyranoside (IPTG), yielding proteinlevels of 0.5-, 1-, or 2-fold the level in chromosomally encodedTsr, respectively.After growth of the culture to OD600 ∼0.5, a 1.5-mL aliquot
was withdrawn, washed twice with 1 mL of PBS, and then resus-pended in 1 mL of PBS. At each washing step, cells were centri-fuged at 6,000 × g for 5 min at room temperature. Oxidation wasstarted by the addition of 5 μL of a 60 mM Cu2+-phenanthrolinesolution (60 mM CuSO4, 200 mM 1,10-phenanthroline, 50 mMNaH2PO4, pH 7.4). Samples were incubated at 35 °C for 10 min,after which the reaction was stopped with 10 mM EDTA. Cellswere collected by centrifugation at 21,000 × g for 3 min, and thenlysed in 50 μL of 1× nonreducing loading buffer [5% (wt/vol)sucrose, 2.5 mM EDTA, 1 mg/mL N-ethylmaleimeide (NEM),0.5 mg/mL bromophenol blue, 0.25% (wt/vol) SDS, 1.6 mMNaH2PO4, 20 mM Tris·HCl, pH 6.8].CheA-containing species were detected by Western blot analysis
using a polyclonal anti-HA antibody (Pierce) and a Cy5-labeledsecondary antibody (Invitrogen). Western blots were imaged underfluorescence mode in a Typhoon 8600 scanner (GE Healthcare),and bands were quantified with ImageQuant software (GEHealthcare). Cross-linking proficiency of interface 2 mutantproteins was defined as the fraction of CheA in the CheA∼CheWcross-linked product normalized to the corresponding value forthe wild type reporter proteins.
Receptor Clustering Tests. Overnight cultures of strain UU1607were diluted 100-fold in fresh tryptone broth supplemented withthe appropriate inducers and antibiotics, and grown at 33.5 °C withagitation to OD600 ∼0.45. Cells were washed and resuspended inmotility buffer (10 mM potassium phosphate, 0.1 mM EDTA, 10mM lactic acid, pH 7) containing 1 μM L-methionine. For im-aging, cells were immobilized between agarose gel (1.2%) and acoverslip in a titanium chamber. Fluorescence images were ob-tained, generally at room temperature, using a Nikon Ti invertedmicroscope equipped with a 100× Plan-Fluor objective (1.3 NA),a xenon lamp (Sutter Instrument), and a camera (Andor Tech-nology). Clustering scores were computed as a weighted aver-age of peak/body intensity scores normalized to the wild typeweighted average.
Cross-Linking Assay for Receptor Trimers-of-Dimers. Strain UU2806bearing plasmids pCS53 and pPM25 (or pPM25 derivatives withinterface 2 mutations) was diluted 100-fold from overnight cul-
tures in fresh tryptone broth supplemented with 12.5 μg/mLchloramphenicol, 50 μg/mL ampicillin, 0.6 μM sodium salicylate,and 150 μM IPTG, and grown at 30 °C with agitation (250 rpm)to OD600 ∼0.5. Cells from a 1.5-mL aliquot of the culture werecollected by centrifugation (5 min at 6,000 × g), washed twicewith PBS, and finally resuspended in 1 mL of PBS. The Tsrcross-linking reaction was initiated with 50 μM TMEA andstopped with 10 mM NEM after 30 s of incubation at 30 °C. Cellsamples were centrifuged at 21,000 × g for 3 min, and then lysedin 50 μL of 1× Laemmli loading buffer. Tsr-cross-linked specieswere detected by Western blot analysis using a polyclonal anti-Tsr antibody.
Fluorescence Anisotropy Measures of Receptor Packing. The pro-cedure for obtaining these measurements has been described indetail previously (26, 38). In brief, overnight cultures of strainUU2806 were diluted 100-fold in fresh tryptone broth supple-mented with appropriate antibiotics and inducers and then grownat 33.5 °C with agitation to OD600 ∼0.45. Cells were washed andresuspended in motility buffer containing 1 μM L-methionine,immobilized on a coverslip, placed into a gold-plated flowchamber, and mounted on a Nikon FN1 microscope. The mYFPfluorophore was excited with linearly polarized light, and theemitted fluorescence was split, using a polarizing beam splittercube, to its parallel (Ipar) and perpendicular (Iper) polarizations,which were monitored using two photon counters (H7422P,Hamamatsu). The steady-state polarization of the emitted fluo-rescence is represented here by the fluorescence anisotropy, r,defined as (Ipar − Iper)/(Ipar + 2Iper), where Iper is corrected forimperfections of the optical system. The absolute fluorescenceanisotropy was validated using an aqueous solution of fluores-cein and purified mYFP (yielding 0 and 0.32, respectively). Theexperiments were performed at room temperature.
In Vivo FRET-Based Kinase Assays. Cell preparation, flow cell as-sembly, stimulus protocol, FRET instrumentation, and dataanalysis have been described previously (4, 28, 29). Liquid cul-tures of UU2784 cells expressing the FRET protein pair (CheY-YFP and CheZ-CFP) from plasmid pVS88 and CheA/CheWvariants from plasmid pPM25 were diluted 100-fold in freshtryptone broth supplemented with 12.5 μg/mL chloramphenicol,50 μg/mL ampicillin, 50 μM IPTG, and 0.6 μM sodium salicylateand then incubated at 30 °C for 6 h to midexponential phase(OD600 ∼0.5). Cells were washed, attached to a round polylysine-coated coverslip, mounted in a flow cell, and subjected to se-quential addition and removal of serine diluted in motility buffercontaining 100 μM L-methionine. The attached cells and all so-lutions were kept at 30 °C throughout the experiment.The cell sample was excited at CFP wavelength, and epifluor-
escent light emission from CFP (FRET donor) and YFP (FRETacceptor) was measured by photon-counting photomultipliers. Theratio of YFP to CFP photon counts reports in real time on CheAkinase activity and changes in response to serine stimuli. Dose–response curves were obtained by plotting the fractional changes inkinase activity versus applied serine concentrations. Data werefitted to a multisite Hill equation, 1 − [Ser]H/([Ser]H + K1/2
H),where K1/2 is the concentration of attractant that inhibits 50% ofthe kinase activity and H, the Hill coefficient, reflects the coop-erativity of the response. Total CheA kinase activity was calculatedas the larger of the FRET changes elicited by a saturating serinestimulus or by 3 mM KCN (4).
Piñas et al. www.pnas.org/cgi/content/short/1600216113 1 of 8
wild type
vector
CheA-L545S
CheA-Y558G
CheA-V551A
CheW-X3
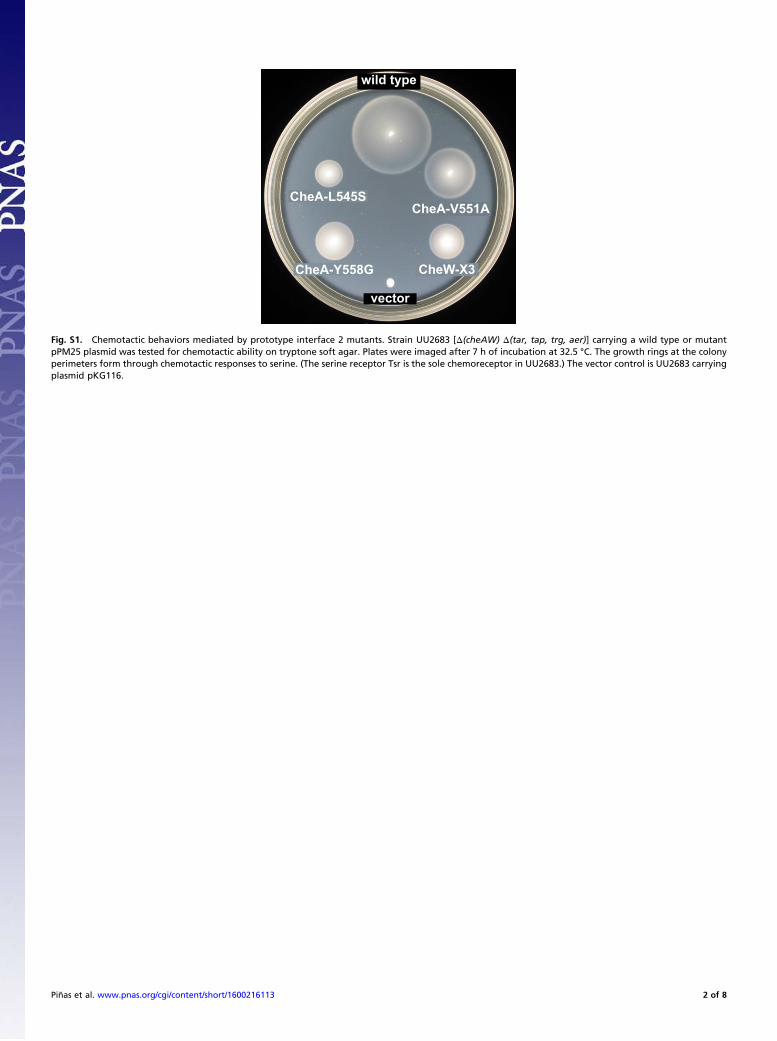
Fig. S1. Chemotactic behaviors mediated by prototype interface 2 mutants. Strain UU2683 [Δ(cheAW) Δ(tar, tap, trg, aer)] carrying a wild type or mutantpPM25 plasmid was tested for chemotactic ability on tryptone soft agar. Plates were imaged after 7 h of incubation at 32.5 °C. The growth rings at the colonyperimeters form through chemotactic responses to serine. (The serine receptor Tsr is the sole chemoreceptor in UU2683.) The vector control is UU2683 carryingplasmid pKG116.
Piñas et al. www.pnas.org/cgi/content/short/1600216113 2 of 8
A
D
C
B
020406080
100
inte
rface
2 c
ross
links
(%
wild
type
)
L545 V551 Y558Q KG D EN R
CheA
Q KNAwildtype
PRS G DA R P NES
CheW
X3
A546C A546CA546C
Tsr: + + no MCPsE27Cwild-typeE27CCheW:
CheA:
CheA~CheWCheA
CheA~CheW
CheA
CheA-w
ild ty
pe
CheA-V
551D
CheA-V
551E
CheA-Y
558N
CheA-Y
558D
CheW-X
3
020406080
100
inte
rface
2 c
ross
links
(%
wild
type
)
L545 V551 Y558Q KG D EN R
CheA
Q KNAwildtype
PRS G DA R P NES
CheW
X3
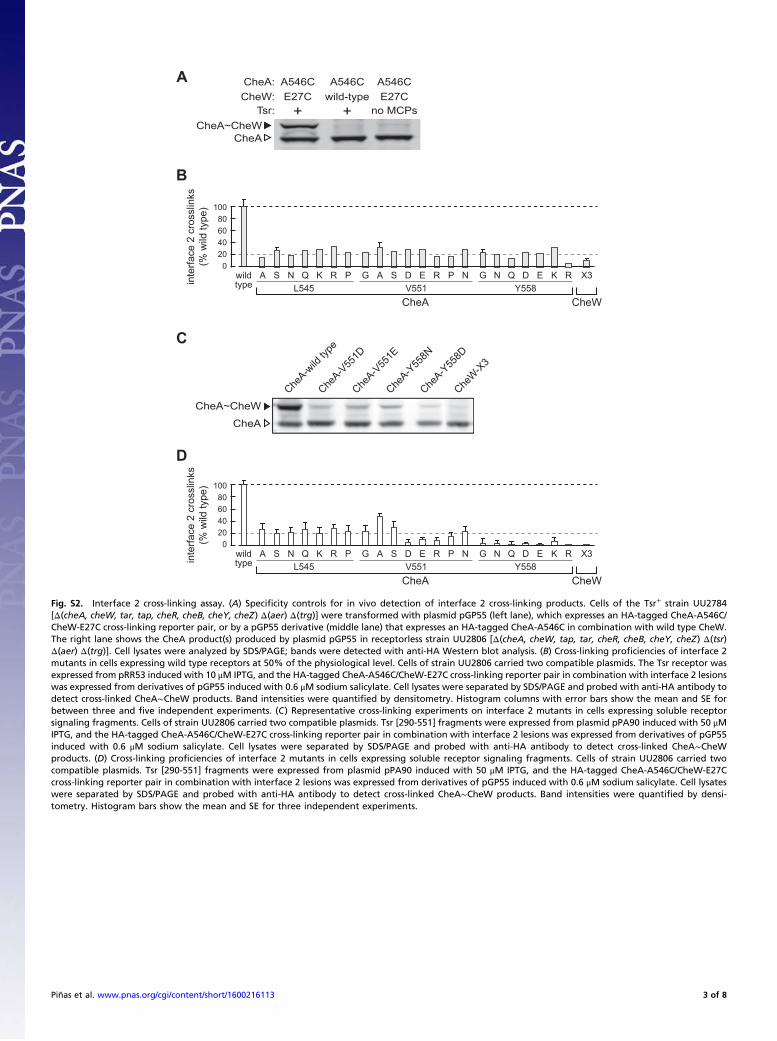
Fig. S2. Interface 2 cross-linking assay. (A) Specificity controls for in vivo detection of interface 2 cross-linking products. Cells of the Tsr+ strain UU2784[Δ(cheA, cheW, tar, tap, cheR, cheB, cheY, cheZ) Δ(aer) Δ(trg)] were transformed with plasmid pGP55 (left lane), which expresses an HA-tagged CheA-A546C/CheW-E27C cross-linking reporter pair, or by a pGP55 derivative (middle lane) that expresses an HA-tagged CheA-A546C in combination with wild type CheW.The right lane shows the CheA product(s) produced by plasmid pGP55 in receptorless strain UU2806 [Δ(cheA, cheW, tap, tar, cheR, cheB, cheY, cheZ) Δ(tsr)Δ(aer) Δ(trg)]. Cell lysates were analyzed by SDS/PAGE; bands were detected with anti-HA Western blot analysis. (B) Cross-linking proficiencies of interface 2mutants in cells expressing wild type receptors at 50% of the physiological level. Cells of strain UU2806 carried two compatible plasmids. The Tsr receptor wasexpressed from pRR53 induced with 10 μM IPTG, and the HA-tagged CheA-A546C/CheW-E27C cross-linking reporter pair in combination with interface 2 lesionswas expressed from derivatives of pGP55 induced with 0.6 μM sodium salicylate. Cell lysates were separated by SDS/PAGE and probed with anti-HA antibody todetect cross-linked CheA∼CheW products. Band intensities were quantified by densitometry. Histogram columns with error bars show the mean and SE forbetween three and five independent experiments. (C) Representative cross-linking experiments on interface 2 mutants in cells expressing soluble receptorsignaling fragments. Cells of strain UU2806 carried two compatible plasmids. Tsr [290-551] fragments were expressed from plasmid pPA90 induced with 50 μMIPTG, and the HA-tagged CheA-A546C/CheW-E27C cross-linking reporter pair in combination with interface 2 lesions was expressed from derivatives of pGP55induced with 0.6 μM sodium salicylate. Cell lysates were separated by SDS/PAGE and probed with anti-HA antibody to detect cross-linked CheA∼CheWproducts. (D) Cross-linking proficiencies of interface 2 mutants in cells expressing soluble receptor signaling fragments. Cells of strain UU2806 carried twocompatible plasmids. Tsr [290-551] fragments were expressed from plasmid pPA90 induced with 50 μM IPTG, and the HA-tagged CheA-A546C/CheW-E27Ccross-linking reporter pair in combination with interface 2 lesions was expressed from derivatives of pGP55 induced with 0.6 μM sodium salicylate. Cell lysateswere separated by SDS/PAGE and probed with anti-HA antibody to detect cross-linked CheA∼CheW products. Band intensities were quantified by densi-tometry. Histogram bars show the mean and SE for three independent experiments.
Piñas et al. www.pnas.org/cgi/content/short/1600216113 3 of 8
A B
C
0
40
prec
enta
ge o
f cel
ls
wild type
0
100
CheA-V551A
CheA-L545S
0
100
0 5 10 15 200
100
CheW-X3
wild type L545S V551A X30
1cl
uste
ring
scor
e(n
orm
aliz
ed)
CheA CheW peak/body intensity
CheW-X3wild type
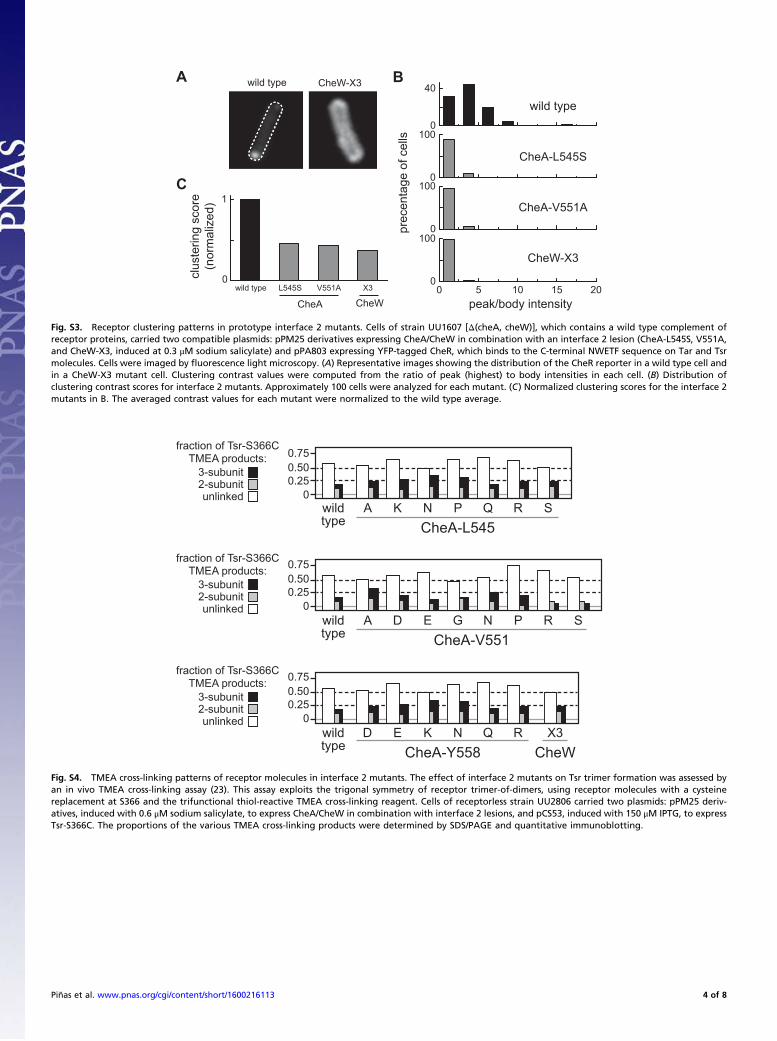
Fig. S3. Receptor clustering patterns in prototype interface 2 mutants. Cells of strain UU1607 [Δ(cheA, cheW)], which contains a wild type complement ofreceptor proteins, carried two compatible plasmids: pPM25 derivatives expressing CheA/CheW in combination with an interface 2 lesion (CheA-L545S, V551A,and CheW-X3, induced at 0.3 μM sodium salicylate) and pPA803 expressing YFP-tagged CheR, which binds to the C-terminal NWETF sequence on Tar and Tsrmolecules. Cells were imaged by fluorescence light microscopy. (A) Representative images showing the distribution of the CheR reporter in a wild type cell andin a CheW-X3 mutant cell. Clustering contrast values were computed from the ratio of peak (highest) to body intensities in each cell. (B) Distribution ofclustering contrast scores for interface 2 mutants. Approximately 100 cells were analyzed for each mutant. (C) Normalized clustering scores for the interface 2mutants in B. The averaged contrast values for each mutant were normalized to the wild type average.
fraction of Tsr-S366C TMEA products:
3-subunit2-subunitunlinked
fraction of Tsr-S366C TMEA products:
3-subunit2-subunitunlinked
fraction of Tsr-S366C TMEA products:
3-subunit2-subunitunlinked
00.250.500.75
wildtype
A K N P Q R SCheA-L545
wildtype
D E K N Q R X3CheA-Y558 CheW
wildtype
A D E G N P R SCheA-V551
00.250.500.75
00.250.500.75
Fig. S4. TMEA cross-linking patterns of receptor molecules in interface 2 mutants. The effect of interface 2 mutants on Tsr trimer formation was assessed byan in vivo TMEA cross-linking assay (23). This assay exploits the trigonal symmetry of receptor trimer-of-dimers, using receptor molecules with a cysteinereplacement at S366 and the trifunctional thiol-reactive TMEA cross-linking reagent. Cells of receptorless strain UU2806 carried two plasmids: pPM25 deriv-atives, induced with 0.6 μM sodium salicylate, to express CheA/CheW in combination with interface 2 lesions, and pCS53, induced with 150 μM IPTG, to expressTsr-S366C. The proportions of the various TMEA cross-linking products were determined by SDS/PAGE and quantitative immunoblotting.
Piñas et al. www.pnas.org/cgi/content/short/1600216113 4 of 8
B0.03
0.02
0.01
0.00
∆r
CheA CheWwild type
(AW)- Y558GL545S V551A X3
0.20
0.22
0.24
0.26
r
CheA CheWwild type
(AW)- Y558GL545S V551A X3
A
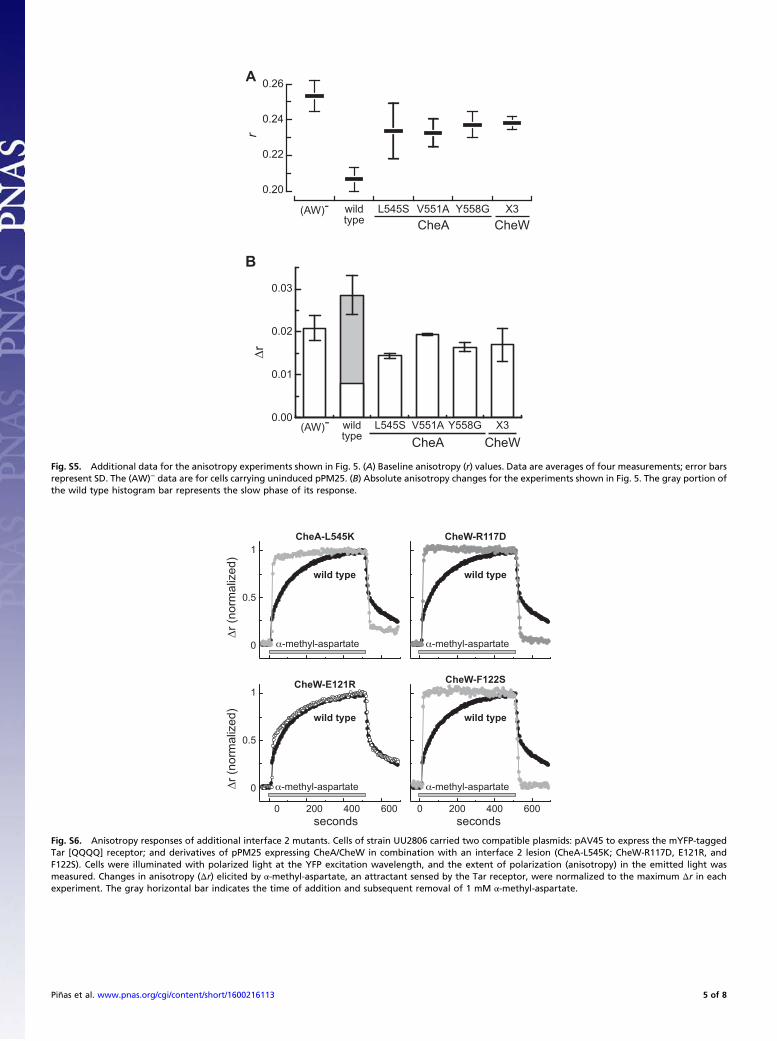
Fig. S5. Additional data for the anisotropy experiments shown in Fig. 5. (A) Baseline anisotropy (r) values. Data are averages of four measurements; error barsrepresent SD. The (AW)− data are for cells carrying uninduced pPM25. (B) Absolute anisotropy changes for the experiments shown in Fig. 5. The gray portion ofthe wild type histogram bar represents the slow phase of its response.
1
0.5
0
1
0.5
0
wild type
CheA-L545K
wild type
CheW-R117D
wild type
CheW-E121R
0 200 400 600
wild type
CheW-F122S
0 200 400 600
Fig. S6. Anisotropy responses of additional interface 2 mutants. Cells of strain UU2806 carried two compatible plasmids: pAV45 to express the mYFP-taggedTar [QQQQ] receptor; and derivatives of pPM25 expressing CheA/CheW in combination with an interface 2 lesion (CheA-L545K; CheW-R117D, E121R, andF122S). Cells were illuminated with polarized light at the YFP excitation wavelength, and the extent of polarization (anisotropy) in the emitted light wasmeasured. Changes in anisotropy (Δr) elicited by α-methyl-aspartate, an attractant sensed by the Tar receptor, were normalized to the maximum Δr in eachexperiment. The gray horizontal bar indicates the time of addition and subsequent removal of 1 mM α-methyl-aspartate.
Piñas et al. www.pnas.org/cgi/content/short/1600216113 5 of 8
K1/2
(μM
SE
R)
0
5
10
15
20
25
0
5
10
15
20
25
Hill
coe
ffici
ent
wild type L Q DGR117 E121
A RF122
X3Y S RK
CheW
K1/2
(μM
SE
R)
0
5
10
15
20
25
R K PL545
A S Q NV551
L A N P RS E D GY558
E R Q GD K N
CheA
0
5
10
15
20
25
Hill
coe
ffici
ent
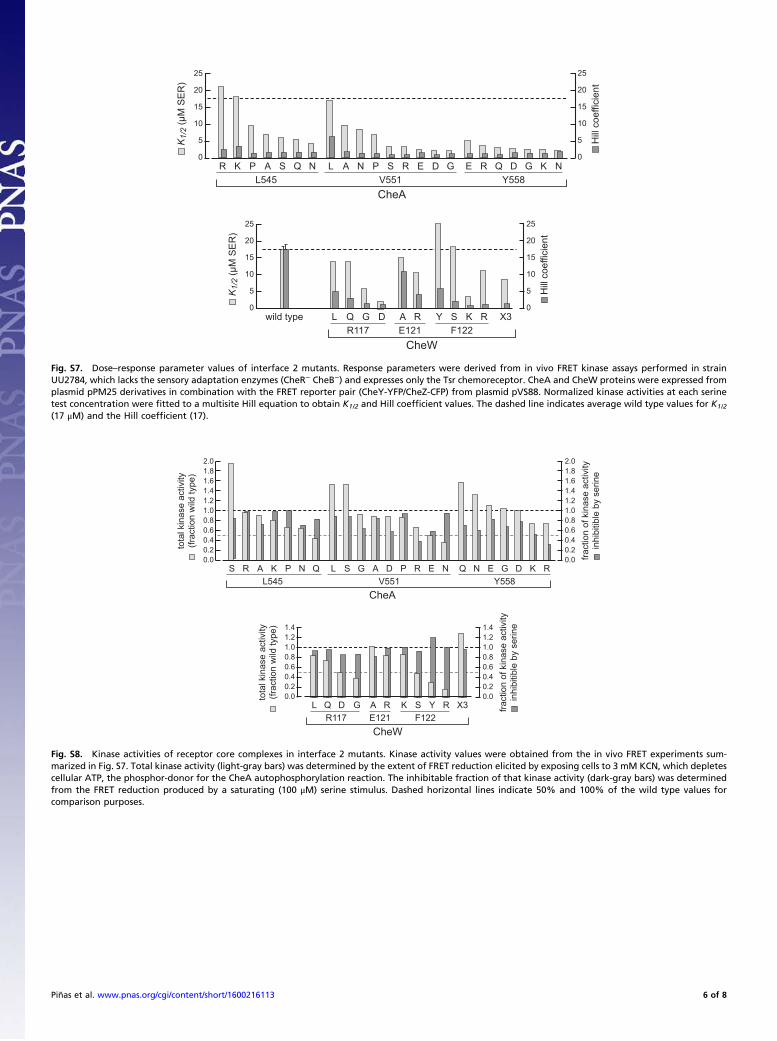
Fig. S7. Dose–response parameter values of interface 2 mutants. Response parameters were derived from in vivo FRET kinase assays performed in strainUU2784, which lacks the sensory adaptation enzymes (CheR− CheB−) and expresses only the Tsr chemoreceptor. CheA and CheW proteins were expressed fromplasmid pPM25 derivatives in combination with the FRET reporter pair (CheY-YFP/CheZ-CFP) from plasmid pVS88. Normalized kinase activities at each serinetest concentration were fitted to a multisite Hill equation to obtain K1/2 and Hill coefficient values. The dashed line indicates average wild type values for K1/2
(17 μM) and the Hill coefficient (17).
tota
l kin
ase
activ
ity(fr
actio
n w
ild ty
pe)
0.00.20.40.60.81.01.21.41.61.82.0
0.00.20.40.60.81.01.21.41.61.82.0
L545 V551 Y558E KQ G DN R
CheA
K PAS QNR L A NS P R EDG
fract
ion
of k
inas
e ac
tivity
inhi
bitib
le b
y se
rine
R117 E121A R
F122RK S Y
CheW
Q DL G X3
tota
l kin
ase
activ
ity(fr
actio
n w
ild ty
pe)
0.00.20.40.60.81.01.21.4
0.00.20.40.60.81.01.21.4
fract
ion
of k
inas
e ac
tivity
inhi
bitib
le b
y se
rine
Fig. S8. Kinase activities of receptor core complexes in interface 2 mutants. Kinase activity values were obtained from the in vivo FRET experiments sum-marized in Fig. S7. Total kinase activity (light-gray bars) was determined by the extent of FRET reduction elicited by exposing cells to 3 mM KCN, which depletescellular ATP, the phosphor-donor for the CheA autophosphorylation reaction. The inhibitable fraction of that kinase activity (dark-gray bars) was determinedfrom the FRET reduction produced by a saturating (100 μM) serine stimulus. Dashed horizontal lines indicate 50% and 100% of the wild type values forcomparison purposes.
Piñas et al. www.pnas.org/cgi/content/short/1600216113 6 of 8
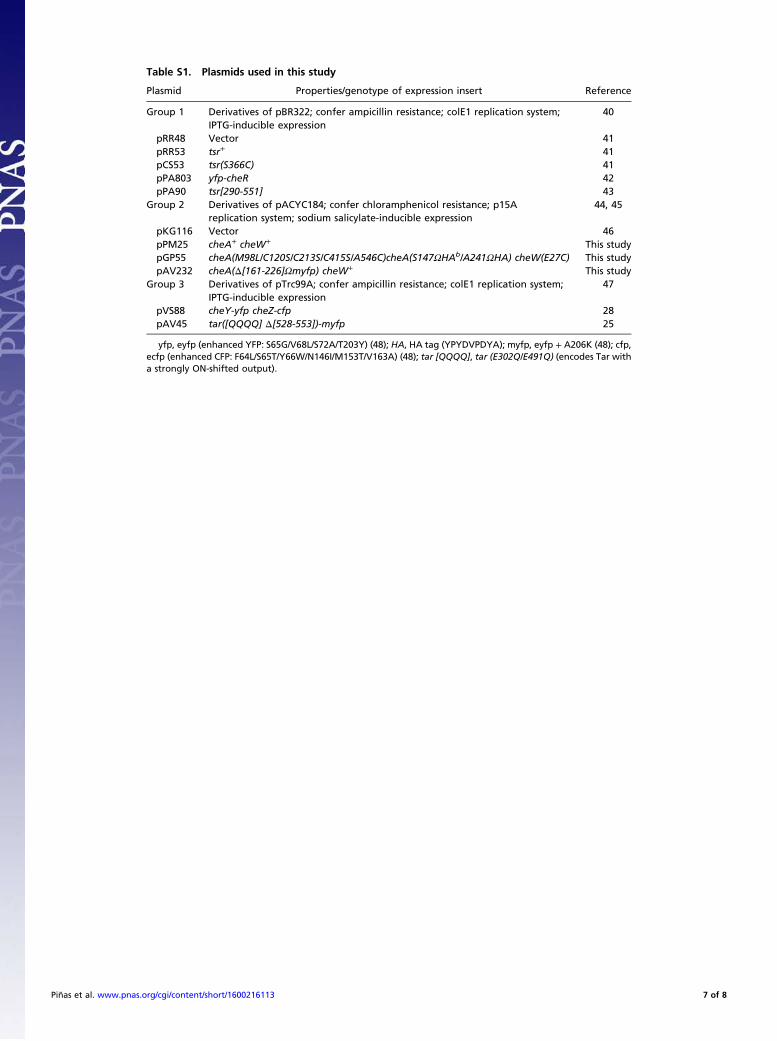
Table S1. Plasmids used in this study
Plasmid Properties/genotype of expression insert Reference
Group 1 Derivatives of pBR322; confer ampicillin resistance; colE1 replication system;IPTG-inducible expression
40
pRR48 Vector 41pRR53 tsr+ 41pCS53 tsr(S366C) 41pPA803 yfp-cheR 42pPA90 tsr[290-551] 43
Group 2 Derivatives of pACYC184; confer chloramphenicol resistance; p15Areplication system; sodium salicylate-inducible expression
44, 45
pKG116 Vector 46pPM25 cheA+ cheW+ This studypGP55 cheA(M98L/C120S/C213S/C415S/A546C)cheA(S147ΩHAb/A241ΩHA) cheW(E27C) This studypAV232 cheA(Δ[161-226]Ωmyfp) cheW+ This study
Group 3 Derivatives of pTrc99A; confer ampicillin resistance; colE1 replication system;IPTG-inducible expression
47
pVS88 cheY-yfp cheZ-cfp 28pAV45 tar([QQQQ] Δ[528-553])-myfp 25
yfp, eyfp (enhanced YFP: S65G/V68L/S72A/T203Y) (48); HA, HA tag (YPYDVPDYA); myfp, eyfp + A206K (48); cfp,ecfp (enhanced CFP: F64L/S65T/Y66W/N146I/M153T/V163A) (48); tar [QQQQ], tar (E302Q/E491Q) (encodes Tar witha strongly ON-shifted output).
Piñas et al. www.pnas.org/cgi/content/short/1600216113 7 of 8
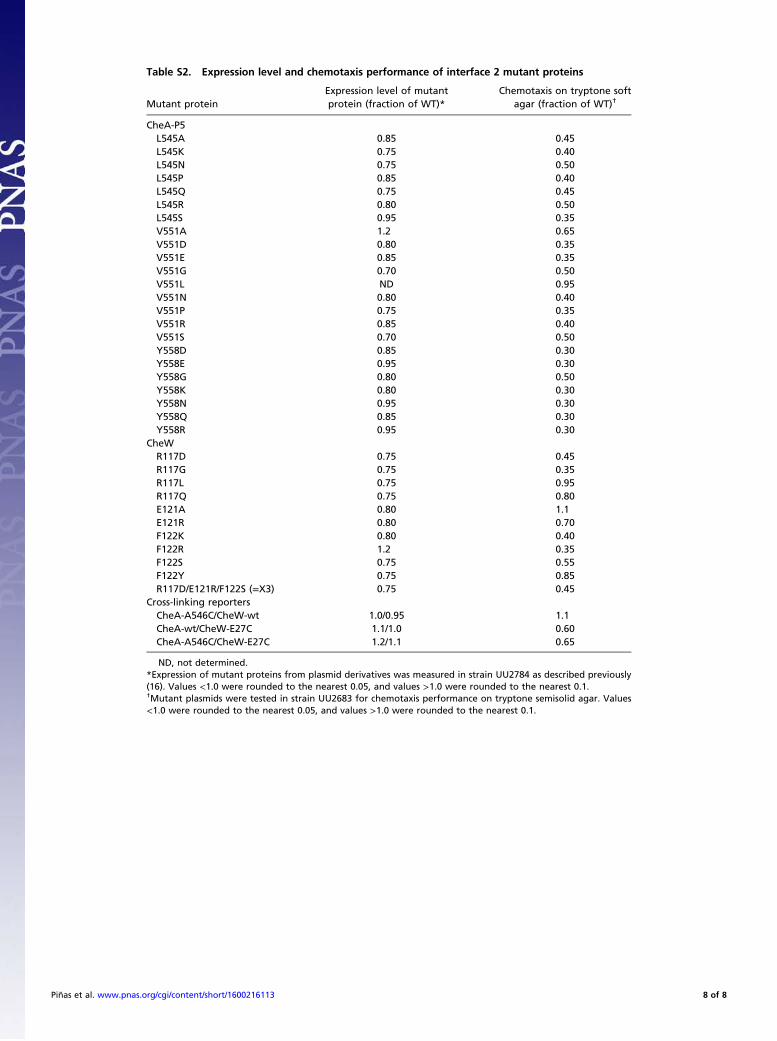
Table S2. Expression level and chemotaxis performance of interface 2 mutant proteins
Mutant proteinExpression level of mutantprotein (fraction of WT)*
Chemotaxis on tryptone softagar (fraction of WT)†
CheA-P5L545A 0.85 0.45L545K 0.75 0.40L545N 0.75 0.50L545P 0.85 0.40L545Q 0.75 0.45L545R 0.80 0.50L545S 0.95 0.35V551A 1.2 0.65V551D 0.80 0.35V551E 0.85 0.35V551G 0.70 0.50V551L ND 0.95V551N 0.80 0.40V551P 0.75 0.35V551R 0.85 0.40V551S 0.70 0.50Y558D 0.85 0.30Y558E 0.95 0.30Y558G 0.80 0.50Y558K 0.80 0.30Y558N 0.95 0.30Y558Q 0.85 0.30Y558R 0.95 0.30
CheWR117D 0.75 0.45R117G 0.75 0.35R117L 0.75 0.95R117Q 0.75 0.80E121A 0.80 1.1E121R 0.80 0.70F122K 0.80 0.40F122R 1.2 0.35F122S 0.75 0.55F122Y 0.75 0.85R117D/E121R/F122S (=X3) 0.75 0.45
Cross-linking reportersCheA-A546C/CheW-wt 1.0/0.95 1.1CheA-wt/CheW-E27C 1.1/1.0 0.60CheA-A546C/CheW-E27C 1.2/1.1 0.65
ND, not determined.*Expression of mutant proteins from plasmid derivatives was measured in strain UU2784 as described previously(16). Values <1.0 were rounded to the nearest 0.05, and values >1.0 were rounded to the nearest 0.1.†Mutant plasmids were tested in strain UU2683 for chemotaxis performance on tryptone semisolid agar. Values<1.0 were rounded to the nearest 0.05, and values >1.0 were rounded to the nearest 0.1.
Piñas et al. www.pnas.org/cgi/content/short/1600216113 8 of 8

![10 il genere Streptococcus.ppt [modalità compatibilità] genere Streptococcus.pdf · 31/08/2009 scaricato da 4 βemolisi su agar sangue γemolisi su agar sangue](https://static.fdocument.org/doc/165x107/5c73948109d3f2b57a8ba9dc/10-il-genere-modalita-compatibilita-genere-streptococcuspdf-31082009.jpg)
![,%4#-6-.,*3,/ *52&, &*%*5-4!47&.5 ......S h n o ]h ak ` e Y Vfg q f g a & c Y a ED Y < < 8 k lY m ]j g h g ag X f lao c q j VY j p]o Y h W [ ]ao m Tlg q f lao h j g l]j Y aW l` l]o](https://static.fdocument.org/doc/165x107/60c2536b1bc19b3ca51feae1/4-6-3-52-5-4475-s-h-n-o-h-ak-e-y-vfg-q.jpg)

![The Chomsky-Schutzenb erger Theorem for Quantitative Context … · 2020. 12. 18. · Theorem[Chomsky, Schutzenb erger 63] Let L . If L = L(G) for some CF grammar G, then there are](https://static.fdocument.org/doc/165x107/60cb9d5a551b4b601704c7d4/the-chomsky-schutzenb-erger-theorem-for-quantitative-context-2020-12-18-theoremchomsky.jpg)