Supplementary figure 1. Comparison of unbound oGM-CSF … · Thr10 Ala220 Glu108 Tyr110 Trp13...
11
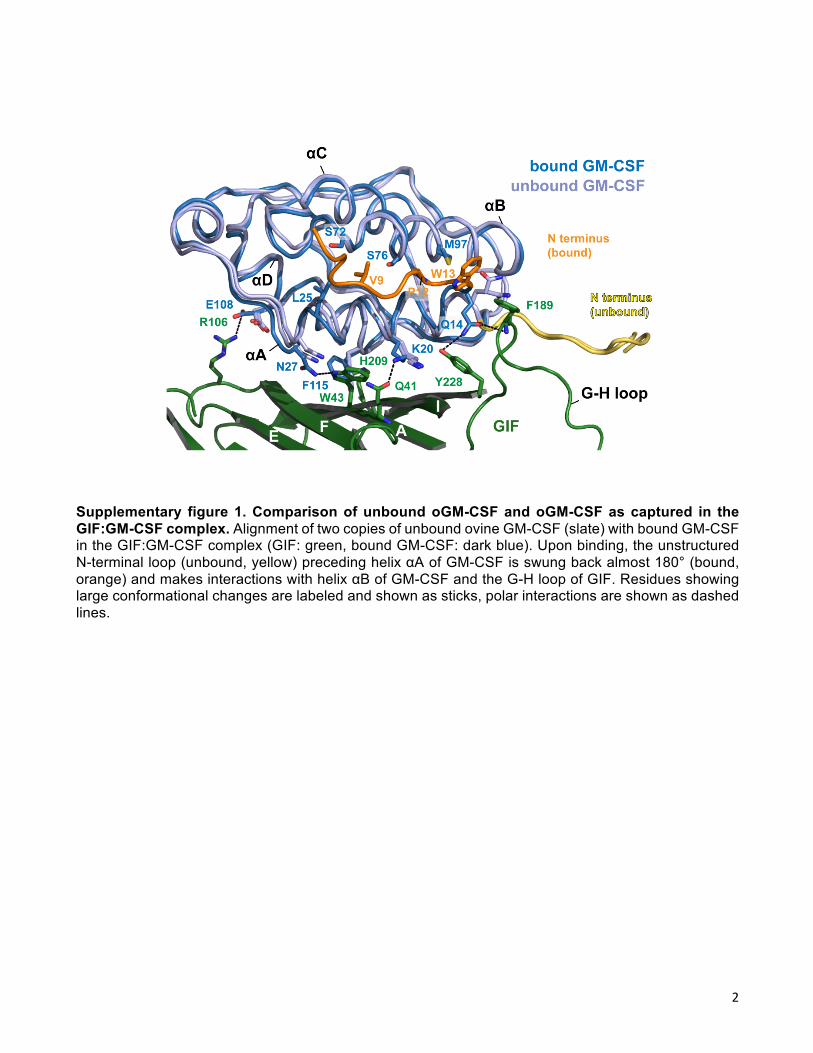
2 Supplementary figure 1. Comparison of unbound oGM-CSF and oGM-CSF as captured in the GIF:GM-CSF complex. Alignment of two copies of unbound ovine GM-CSF (slate) with bound GM-CSF in the GIF:GM-CSF complex (GIF: green, bound GM-CSF: dark blue). Upon binding, the unstructured N-terminal loop (unbound, yellow) preceding helix αA of GM-CSF is swung back almost 180° (bound, orange) and makes interactions with helix αB of GM-CSF and the G-H loop of GIF. Residues showing large conformational changes are labeled and shown as sticks, polar interactions are shown as dashed lines.
Transcript of Supplementary figure 1. Comparison of unbound oGM-CSF … · Thr10 Ala220 Glu108 Tyr110 Trp13...
2
Supplementary figure 1. Comparison of unbound oGM-CSF and oGM-CSF as captured in the GIF:GM-CSF complex. Alignment of two copies of unbound ovine GM-CSF (slate) with bound GM-CSF in the GIF:GM-CSF complex (GIF: green, bound GM-CSF: dark blue). Upon binding, the unstructured N-terminal loop (unbound, yellow) preceding helix αA of GM-CSF is swung back almost 180° (bound, orange) and makes interactions with helix αB of GM-CSF and the G-H loop of GIF. Residues showing large conformational changes are labeled and shown as sticks, polar interactions are shown as dashed lines.
3
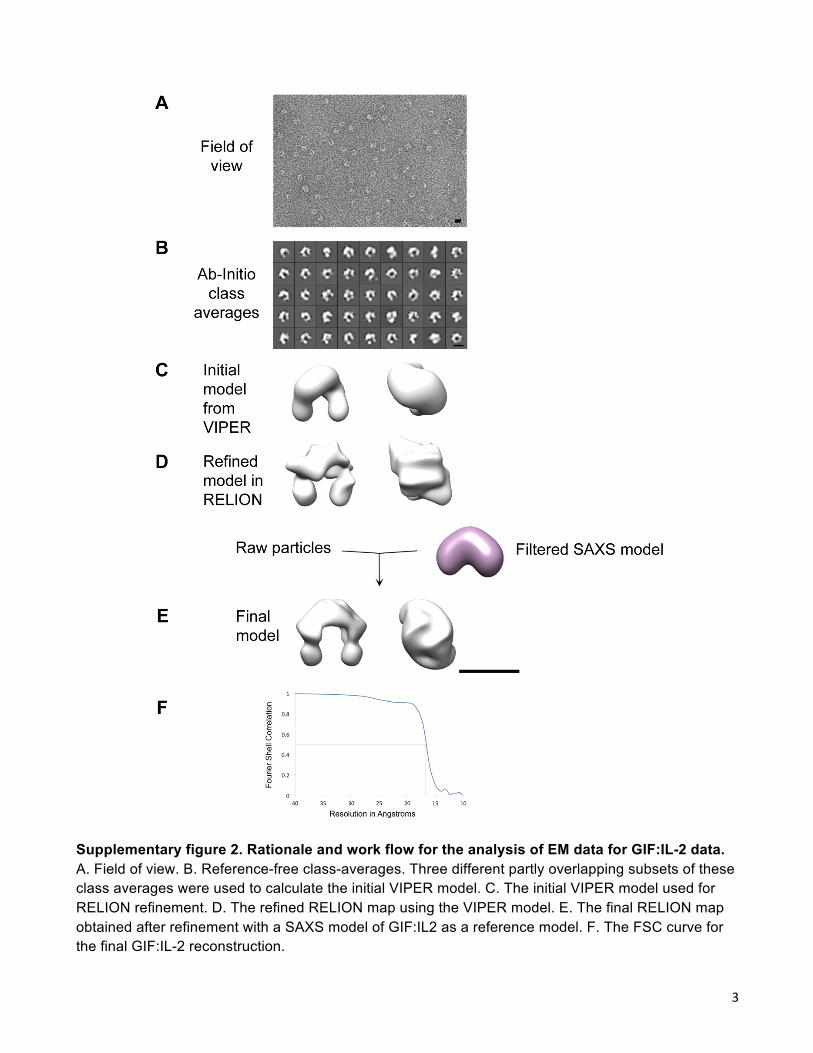
Supplementary figure 2. Rationale and work flow for the analysis of EM data for GIF:IL-2 data. A. Field of view. B. Reference-free class-averages. Three different partly overlapping subsets of these class averages were used to calculate the initial VIPER model. C. The initial VIPER model used for RELION refinement. D. The refined RELION map using the VIPER model. E. The final RELION map obtained after refinement with a SAXS model of GIF:IL2 as a reference model. F. The FSC curve for the final GIF:IL-2 reconstruction.
4
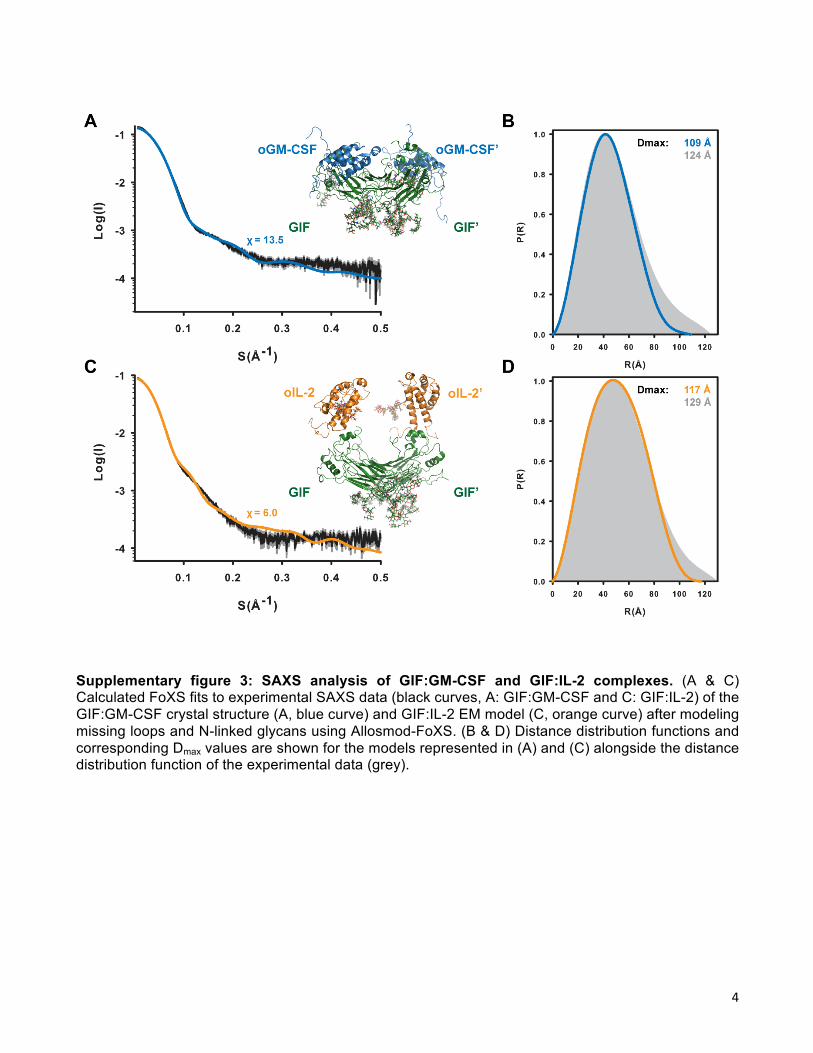
Supplementary figure 3: SAXS analysis of GIF:GM-CSF and GIF:IL-2 complexes. (A & C) Calculated FoXS fits to experimental SAXS data (black curves, A: GIF:GM-CSF and C: GIF:IL-2) of the GIF:GM-CSF crystal structure (A, blue curve) and GIF:IL-2 EM model (C, orange curve) after modeling missing loops and N-linked glycans using Allosmod-FoXS. (B & D) Distance distribution functions and corresponding Dmax values are shown for the models represented in (A) and (C) alongside the distance distribution function of the experimental data (grey).
5
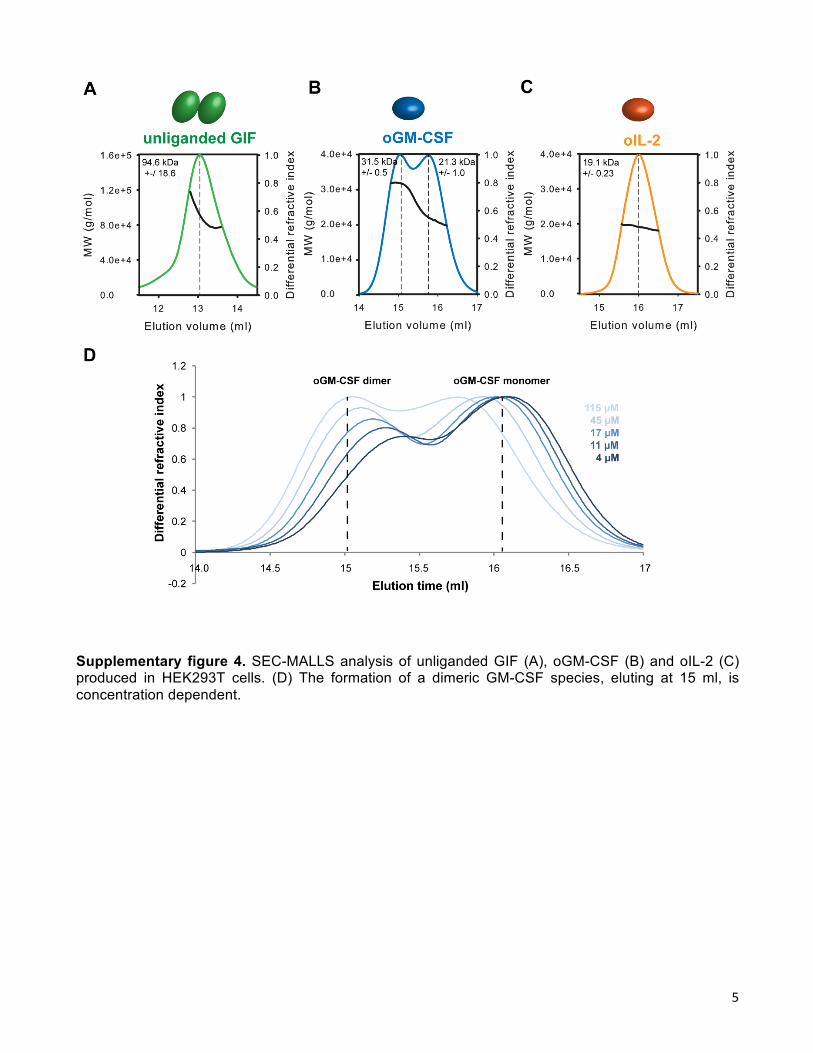
Supplementary figure 4. SEC-MALLS analysis of unliganded GIF (A), oGM-CSF (B) and oIL-2 (C) produced in HEK293T cells. (D) The formation of a dimeric GM-CSF species, eluting at 15 ml, is concentration dependent.
6
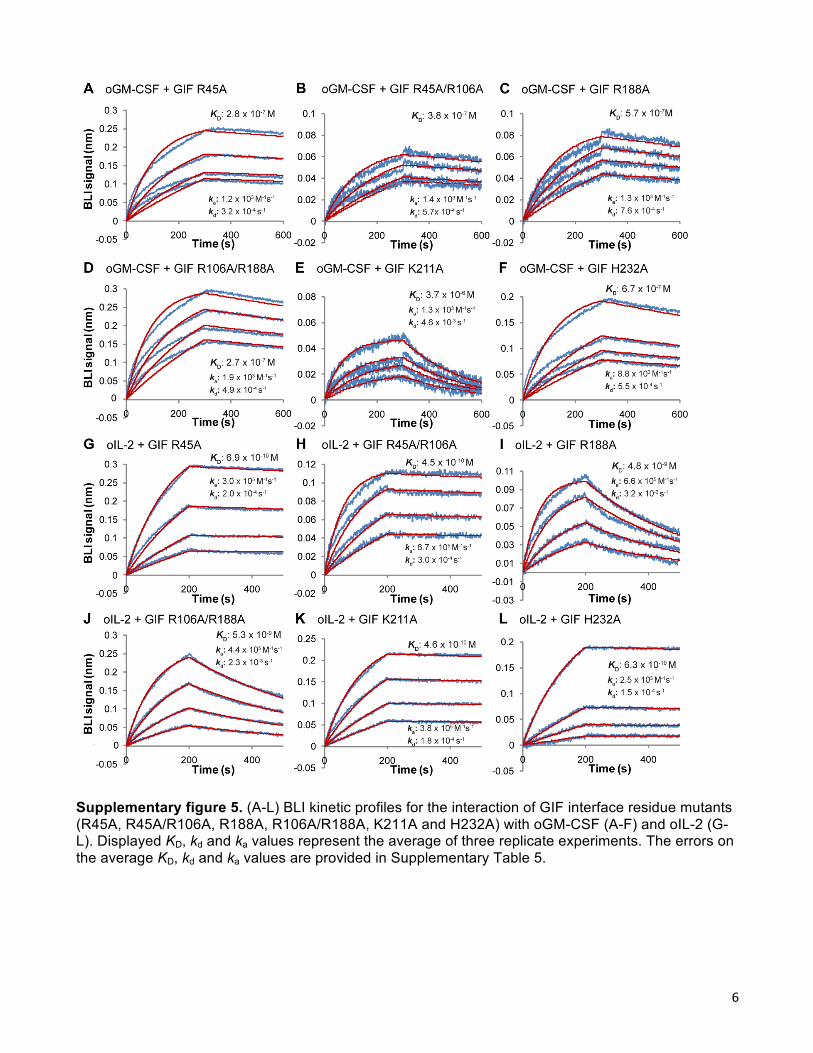
Supplementary figure 5. (A-L) BLI kinetic profiles for the interaction of GIF interface residue mutants (R45A, R45A/R106A, R188A, R106A/R188A, K211A and H232A) with oGM-CSF (A-F) and oIL-2 (G-L). Displayed KD, kd and ka values represent the average of three replicate experiments. The errors on the average KD, kd and ka values are provided in Supplementary Table 5.
7
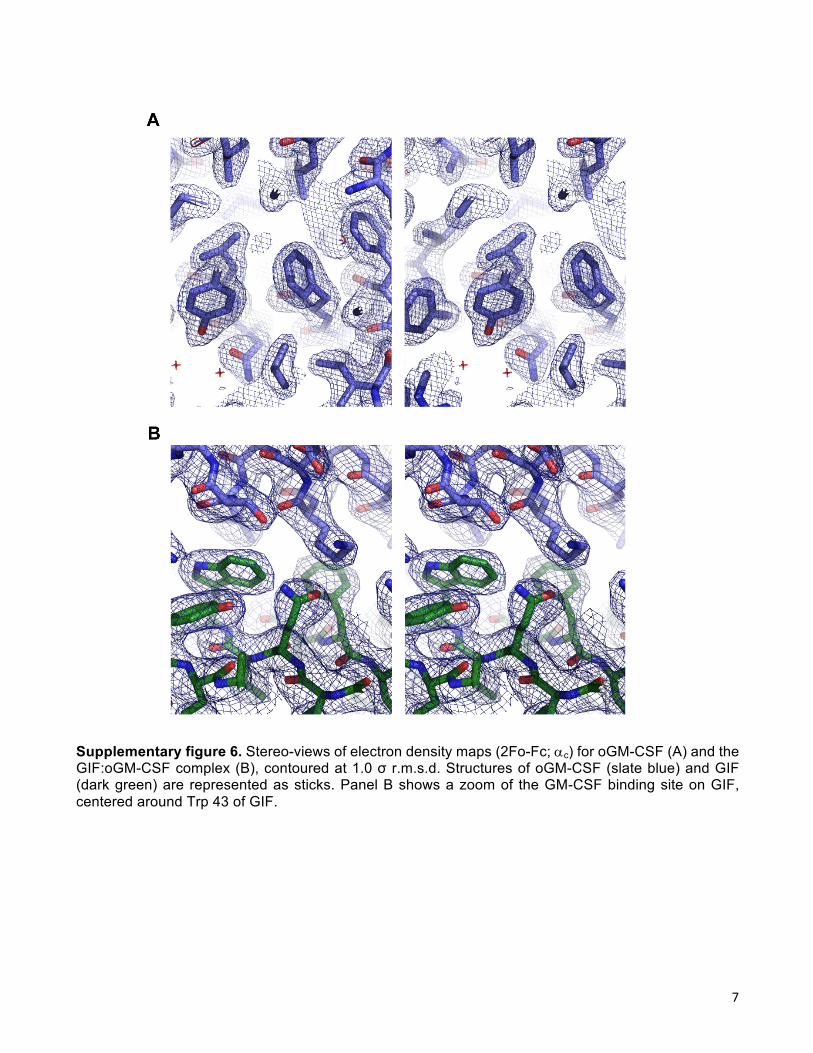
Supplementary figure 6. Stereo-views of electron density maps (2Fo-Fc; ac) for oGM-CSF (A) and the GIF:oGM-CSF complex (B), contoured at 1.0 σ r.m.s.d. Structures of oGM-CSF (slate blue) and GIF (dark green) are represented as sticks. Panel B shows a zoom of the GM-CSF binding site on GIF, centered around Trp 43 of GIF.
8
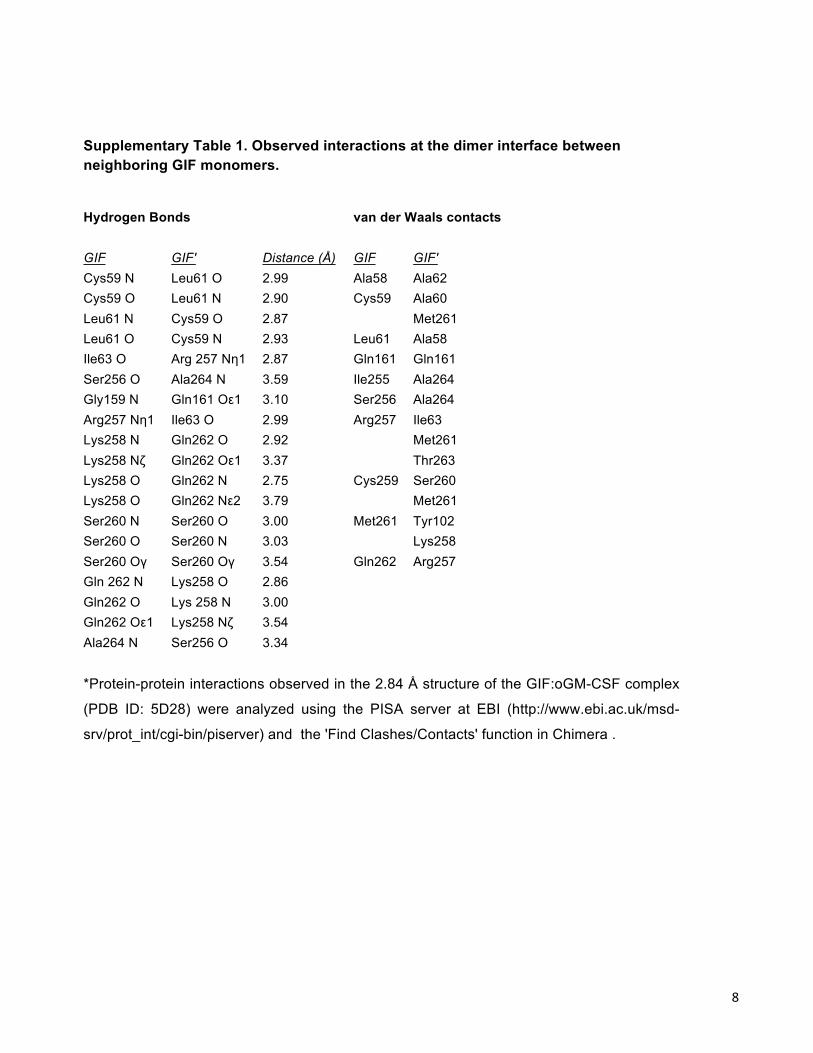
Supplementary Table 1. Observed interactions at the dimer interface between neighboring GIF monomers.
Hydrogen Bonds
van der Waals contacts
GIF GIF' Distance (Å) GIF GIF' Cys59 N Leu61 O 2.99 Ala58 Ala62 Cys59 O Leu61 N 2.90 Cys59 Ala60 Leu61 N Cys59 O 2.87 Met261 Leu61 O Cys59 N 2.93 Leu61 Ala58 Ile63 O Arg 257 Nη1 2.87 Gln161 Gln161 Ser256 O Ala264 N 3.59 Ile255 Ala264 Gly159 N Gln161 Oε1 3.10 Ser256 Ala264 Arg257 Nη1 Ile63 O 2.99 Arg257 Ile63 Lys258 N Gln262 O 2.92 Met261 Lys258 Nζ Gln262 Oε1 3.37 Thr263 Lys258 O Gln262 N 2.75 Cys259 Ser260 Lys258 O Gln262 Nε2 3.79 Met261 Ser260 N Ser260 O 3.00 Met261 Tyr102 Ser260 O Ser260 N 3.03 Lys258 Ser260 Oγ Ser260 Oγ 3.54 Gln262 Arg257 Gln 262 N Lys258 O 2.86 Gln262 O Lys 258 N 3.00 Gln262 Oε1 Lys258 Nζ 3.54 Ala264 N Ser256 O 3.34 *Protein-protein interactions observed in the 2.84 Å structure of the GIF:oGM-CSF complex
(PDB ID: 5D28) were analyzed using the PISA server at EBI (http://www.ebi.ac.uk/msd-
srv/prot_int/cgi-bin/piserver) and the 'Find Clashes/Contacts' function in Chimera .
9
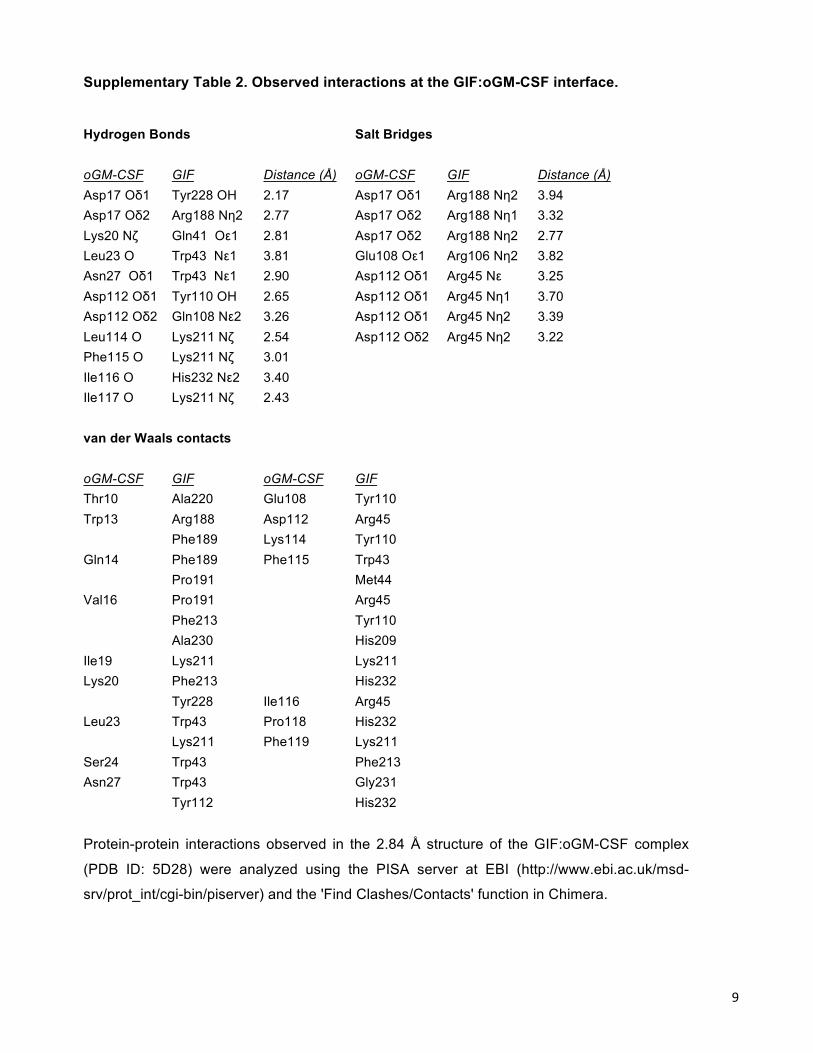
Supplementary Table 2. Observed interactions at the GIF:oGM-CSF interface.
Hydrogen Bonds
Salt Bridges
oGM-CSF GIF Distance (Å) oGM-CSF GIF Distance (Å) Asp17 Oδ1 Tyr228 OH 2.17 Asp17 Oδ1 Arg188 Nη2 3.94 Asp17 Oδ2 Arg188 Nη2 2.77 Asp17 Oδ2 Arg188 Nη1 3.32 Lys20 Nζ Gln41 Oε1 2.81 Asp17 Oδ2 Arg188 Nη2 2.77 Leu23 O Trp43 Nε1 3.81 Glu108 Oε1 Arg106 Nη2 3.82 Asn27 Oδ1 Trp43 Nε1 2.90 Asp112 Oδ1 Arg45 Nε 3.25 Asp112 Oδ1 Tyr110 OH 2.65 Asp112 Oδ1 Arg45 Nη1 3.70 Asp112 Oδ2 Gln108 Nε2 3.26 Asp112 Oδ1 Arg45 Nη2 3.39 Leu114 O Lys211 Nζ 2.54 Asp112 Oδ2 Arg45 Nη2 3.22 Phe115 O Lys211 Nζ 3.01 Ile116 O His232 Nε2 3.40 Ile117 O Lys211 Nζ 2.43 van der Waals contacts
oGM-CSF GIF oGM-CSF GIF Thr10 Ala220 Glu108 Tyr110 Trp13 Arg188 Asp112 Arg45 Phe189 Lys114 Tyr110 Gln14 Phe189 Phe115 Trp43 Pro191 Met44 Val16 Pro191 Arg45 Phe213 Tyr110 Ala230 His209 Ile19 Lys211 Lys211 Lys20 Phe213 His232 Tyr228 Ile116 Arg45 Leu23 Trp43 Pro118 His232 Lys211 Phe119 Lys211 Ser24 Trp43 Phe213 Asn27 Trp43 Gly231 Tyr112 His232 Protein-protein interactions observed in the 2.84 Å structure of the GIF:oGM-CSF complex
(PDB ID: 5D28) were analyzed using the PISA server at EBI (http://www.ebi.ac.uk/msd-
srv/prot_int/cgi-bin/piserver) and the 'Find Clashes/Contacts' function in Chimera.
10
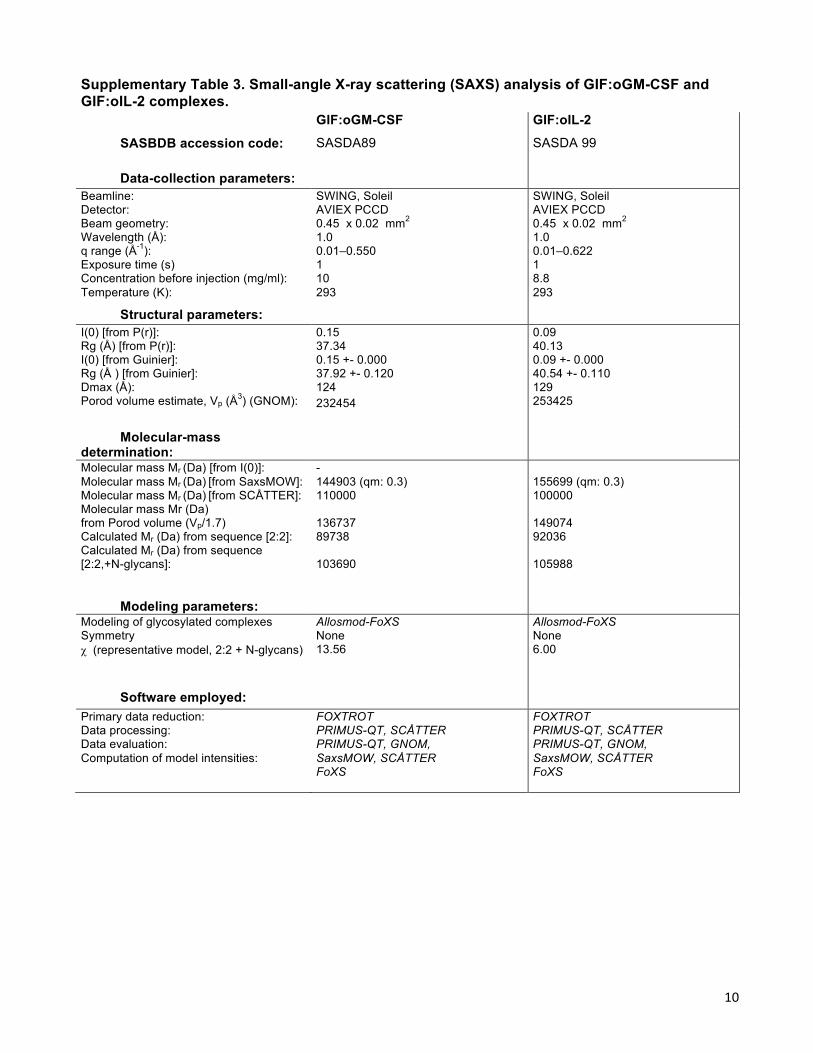
Supplementary Table 3. Small-angle X-ray scattering (SAXS) analysis of GIF:oGM-CSF and GIF:oIL-2 complexes.
GIF:oGM-CSF GIF:oIL-2 SASBDB accession code: Data-collection parameters:
SASDA89 SASDA 99
Beamline: Detector: Beam geometry: Wavelength (Å): q range (Å-1): Exposure time (s) Concentration before injection (mg/ml): Temperature (K):
SWING, Soleil AVIEX PCCD 0.45 x 0.02 mm2
1.0 0.01–0.550 1 10 293
SWING, Soleil AVIEX PCCD 0.45 x 0.02 mm2
1.0 0.01–0.622 1 8.8 293
Structural parameters: I(0) [from P(r)]: Rg (Å) [from P(r)]: I(0) [from Guinier]: Rg (Å ) [from Guinier]: Dmax (Å): Porod volume estimate, Vp (Å3) (GNOM):
0.15 37.34 0.15 +- 0.000 37.92 +- 0.120 124 232454
0.09 40.13 0.09 +- 0.000 40.54 +- 0.110 129 253425
Molecular-mass determination:
Molecular mass Mr (Da) [from I(0)]: Molecular mass Mr (Da) [from SaxsMOW]: Molecular mass Mr (Da) [from SCÅTTER]: Molecular mass Mr (Da) from Porod volume (Vp/1.7) Calculated Mr (Da) from sequence [2:2]: Calculated Mr (Da) from sequence [2:2,+N-glycans]:
- 144903 (qm: 0.3) 110000 136737 89738 103690
155699 (qm: 0.3) 100000 149074 92036 105988
Modeling parameters: Modeling of glycosylated complexes Symmetry c (representative model, 2:2 + N-glycans)
Allosmod-FoXS None 13.56
Allosmod-FoXS None 6.00
Software employed:
Primary data reduction: Data processing: Data evaluation: Computation of model intensities:
FOXTROT PRIMUS-QT, SCÅTTER PRIMUS-QT, GNOM, SaxsMOW, SCÅTTER FoXS
FOXTROT PRIMUS-QT, SCÅTTER PRIMUS-QT, GNOM, SaxsMOW, SCÅTTER FoXS
11
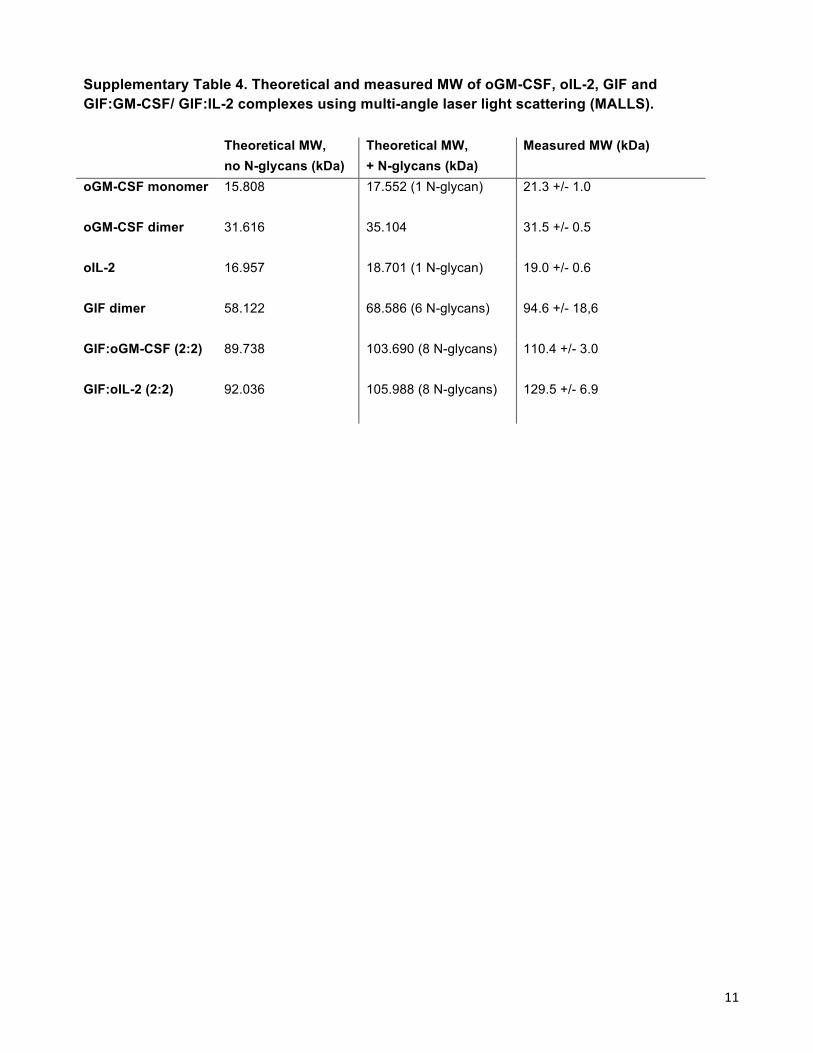
Supplementary Table 4. Theoretical and measured MW of oGM-CSF, oIL-2, GIF and GIF:GM-CSF/ GIF:IL-2 complexes using multi-angle laser light scattering (MALLS). Theoretical MW,
no N-glycans (kDa) Theoretical MW, + N-glycans (kDa)
Measured MW (kDa)
oGM-CSF monomer
15.808 17.552 (1 N-glycan) 21.3 +/- 1.0
oGM-CSF dimer
31.616 35.104 31.5 +/- 0.5
oIL-2
16.957 18.701 (1 N-glycan) 19.0 +/- 0.6
GIF dimer
58.122 68.586 (6 N-glycans) 94.6 +/- 18,6
GIF:oGM-CSF (2:2)
89.738 103.690 (8 N-glycans) 110.4 +/- 3.0
GIF:oIL-2 (2:2)
92.036 105.988 (8 N-glycans) 129.5 +/- 6.9
12
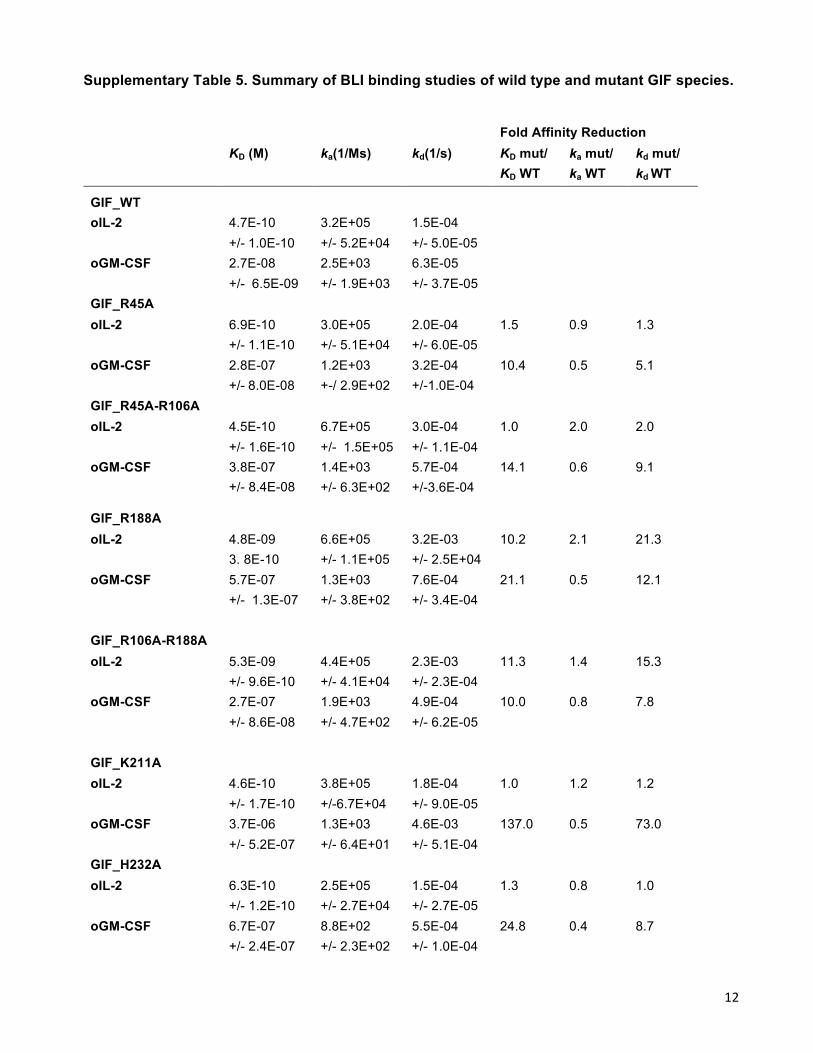
Supplementary Table 5. Summary of BLI binding studies of wild type and mutant GIF species.
Fold Affinity Reduction KD (M) ka(1/Ms) kd(1/s) KD mut/
KD WT ka mut/ ka WT
kd mut/ kd WT
GIF_WT
oIL-2 4.7E-10 +/-1.0E-10
3.2E+05 +/- 5.2E+04
1.5E-04 +/-5.0E-05
oGM-CSF 2.7E-08 +/- 6.5E-09
2.5E+03 +/- 1.9E+03
6.3E-05 +/- 3.7E-05
GIF_R45A oIL-2 6.9E-10
+/-1.1E-10 3.0E+05 +/- 5.1E+04
2.0E-04 +/-6.0E-05
1.5 0.9 1.3
oGM-CSF 2.8E-07 +/-8.0E-08
1.2E+03 +-/ 2.9E+02
3.2E-04 +/-1.0E-04
10.4 0.5 5.1
GIF_R45A-R106A oIL-2 4.5E-10
+/- 1.6E-10 6.7E+05 +/- 1.5E+05
3.0E-04 +/- 1.1E-04
1.0 2.0
2.0
oGM-CSF 3.8E-07 +/- 8.4E-08
1.4E+03 +/- 6.3E+02
5.7E-04 +/-3.6E-04
14.1 0.6 9.1
GIF_R188A oIL-2 4.8E-09
3. 8E-10 6.6E+05 +/-1.1E+05
3.2E-03 +/- 2.5E+04
10.2 2.1
21.3
oGM-CSF 5.7E-07 +/- 1.3E-07
1.3E+03 +/- 3.8E+02
7.6E-04 +/- 3.4E-04
21.1 0.5 12.1
GIF_R106A-R188A oIL-2 5.3E-09
+/- 9.6E-10 4.4E+05 +/- 4.1E+04
2.3E-03 +/- 2.3E-04
11.3 1.4
15.3
oGM-CSF 2.7E-07 +/- 8.6E-08
1.9E+03 +/- 4.7E+02
4.9E-04 +/- 6.2E-05
10.0 0.8 7.8
GIF_K211A oIL-2 4.6E-10
+/- 1.7E-10 3.8E+05 +/-6.7E+04
1.8E-04 +/- 9.0E-05
1.0 1.2
1.2
oGM-CSF 3.7E-06 +/- 5.2E-07
1.3E+03 +/- 6.4E+01
4.6E-03 +/- 5.1E-04
137.0 0.5 73.0
GIF_H232A oIL-2 6.3E-10
+/- 1.2E-10 2.5E+05 +/- 2.7E+04
1.5E-04 +/- 2.7E-05
1.3 0.8
1.0
oGM-CSF 6.7E-07 +/- 2.4E-07
8.8E+02 +/- 2.3E+02
5.5E-04 +/- 1.0E-04
24.8 0.4 8.7