CCEM KEY COMPARISON CCEM.RF-K18.CL (GT-RF/00-1) · CCEM KEY COMPARISON CCEM.RF-K18.CL (GT-RF/00-1)...
38
Page 1 of 38 CCEM KEY COMPARISON CCEM.RF-K18.CL (GT-RF/00-1) Noise in 50 Ω coaxial line at frequencies up to 1 GHz Final Report C. Eiø, D. Adamson, J. Randa, D. Allal and R. Uzdin Christopher Eiø National Physical Laboratory Teddington Middlesex TW11 0LW UNITED KINGDOM March 2005
Transcript of CCEM KEY COMPARISON CCEM.RF-K18.CL (GT-RF/00-1) · CCEM KEY COMPARISON CCEM.RF-K18.CL (GT-RF/00-1)...
Page 1 of 38
CCEM KEY COMPARISON CCEM.RF-K18.CL (GT-RF/00-1)
Noise in 50 ΩΩΩΩ coaxial line at frequencies up to 1 GHz
Final Report
C. Eiø, D. Adamson, J. Randa, D. Allal and R. Uzdin
Christopher Eiø
National Physical Laboratory
Teddington
Middlesex
TW11 0LW
UNITED KINGDOM
March 2005
Page 2 of 38
CCEM KEY COMPARISON CCEM.RF-K18.CL (GT-RF/00-1)
Noise in 50 ΩΩΩΩ coaxial line at frequencies up to 1 GHz
ABSTRACT
A measurement comparison of noise temperature has been carried out between four National
Metrology Laboratories in coaxial line at 30 MHz, 60 MHz and 1 GHz. The identification of
this intercomparison is CCEM.RF-K18.CL. Two noise sources have been measured. The
following four national laboratories participated in this intercomparison: NPL (United
Kingdom), NIST (United States of America), BNM-LNE (France) and VNIIFTRI (Russia).
The National Physical Laboratory (United Kingdom) acted as the pilot laboratory for the
comparison. It can be seen that, there is generally good agreement between the laboratories.
PARTICIPANTS
David Adamson
National Physical Laboratory (NPL)
Teddington
TW11 0LW
UNITED KINGDOM
James Randa
National Institute of Standards and
Technology (NIST)
Boulder
Colorado 80305-3328
UNITED STATES OF AMERICA
Djamel Allal
Bureau National de Métrologie – Laboratoire
National d’Essais (BNM-LNE)
F-92260 Fontenay aux Roses
FRANCE
Rinadij Uzdin
All-Russian Scientific Research Institute for
Physical-Technical and Radiotechnical
Measurements (VNIIFTRI)
Mendeleevo
Moscow region 141570
RUSSIA
Page 3 of 38
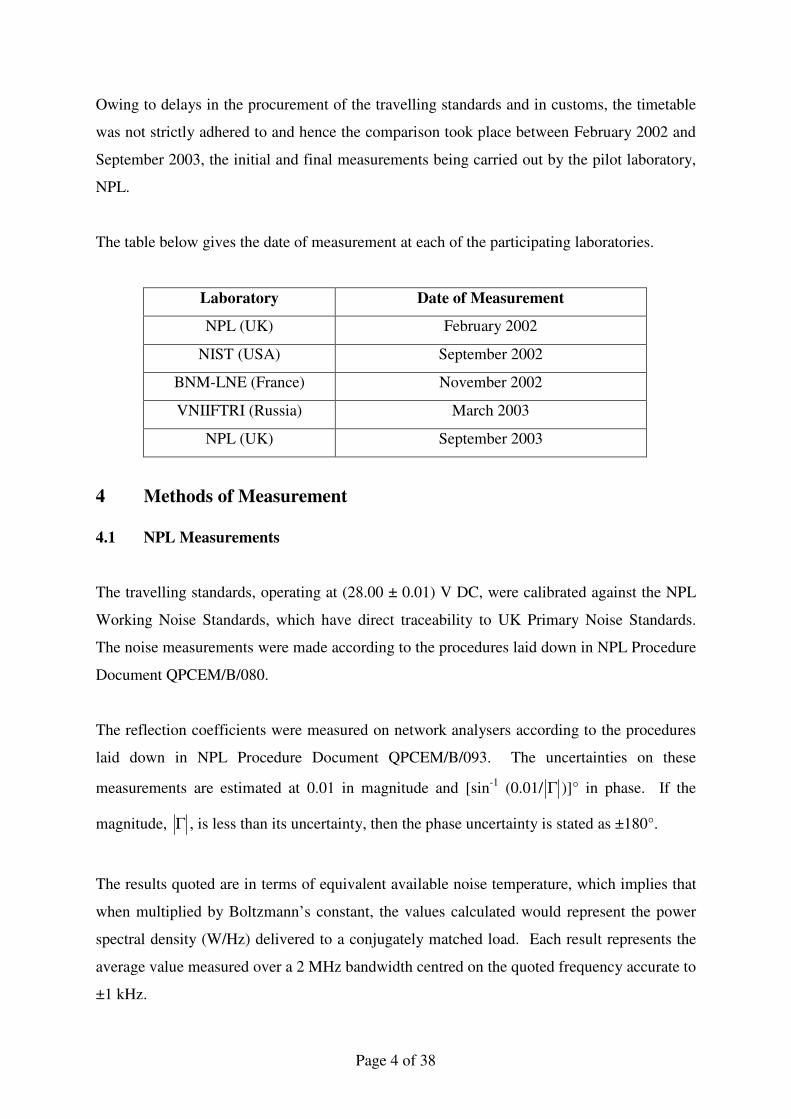
1 Introduction In January 2000, NPL submitted to GT-RF members a proposal to undertake an
intercomparison of noise temperature in coaxial lines at frequencies 30 MHz, 60 MHz and
1 GHz. This proposal was formally accepted at the BIPM meeting in 2000 and assigned the
designation GT-RF/00-1, which was subsequently re-labelled as CCEM.RF-K18.CL. The
protocol, designated GT-RF/01-12, was agreed at the following meeting in 2001 and the
participants announced: NPL (pilot laboratory), NIST, BNM-LNE and VNIIFTRI.
The participants reported results for noise temperature measurements of the two travelling
standards at all frequencies, as well as reporting the voltage reflection coefficient of the
travelling standards. All reported results are included in this report.
2 Travelling Standards The travelling standards provided by the pilot laboratory were two solid-state noise sources
with GPC-7 connectors: an HP346A Opt 002, with a nominal ENR of 5 dB (serial no.
4124A06260), and an HP346B Opt 002, with a nominal ENR of 15 dB (serial no.
4124A16660). Both standards were powered by 28 V DC. This voltage was monitored and
maintained as close to 28 V as is practicable.
The devices are 21 mm by 140 mm by 30 mm (0.8 in by 5.5 in by 1.2 in) and weigh 108
grams (3.5 oz). The DC power is supplied via a BNC connector.
The participants were asked to provide a measurement of the noise temperature for each of
the travelling standards and, if possible, to measure the voltage reflection coefficient and
provide this in full complex value or, if this was not possible, magnitude only.
3 Comparison Protocol and Schedule The travelling standards were circulated to the participants, who were asked to provide a
measurement of the noise temperature of the travelling standards at frequencies of 30 MHz,
60 MHz and 1 GHz. The participants were also asked to provide a measurement of the
voltage reflection coefficient (VRC) of both standards at each frequency.
Page 4 of 38
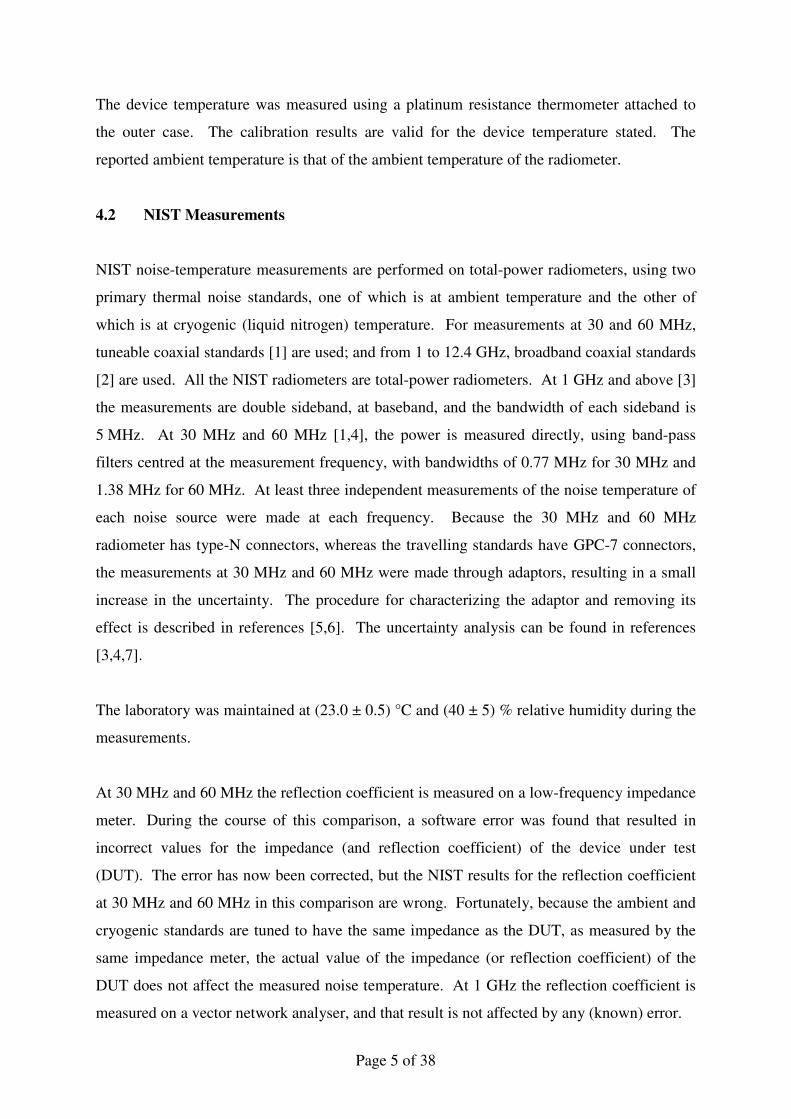
Owing to delays in the procurement of the travelling standards and in customs, the timetable
was not strictly adhered to and hence the comparison took place between February 2002 and
September 2003, the initial and final measurements being carried out by the pilot laboratory,
NPL.
The table below gives the date of measurement at each of the participating laboratories.
Laboratory Date of Measurement
NPL (UK) February 2002
NIST (USA) September 2002
BNM-LNE (France) November 2002
VNIIFTRI (Russia) March 2003
NPL (UK) September 2003
4 Methods of Measurement 4.1 NPL Measurements
The travelling standards, operating at (28.00 ± 0.01) V DC, were calibrated against the NPL
Working Noise Standards, which have direct traceability to UK Primary Noise Standards.
The noise measurements were made according to the procedures laid down in NPL Procedure
Document QPCEM/B/080.
The reflection coefficients were measured on network analysers according to the procedures
laid down in NPL Procedure Document QPCEM/B/093. The uncertainties on these
measurements are estimated at 0.01 in magnitude and [sin-1 (0.01/ Γ )]° in phase. If the
magnitude, Γ , is less than its uncertainty, then the phase uncertainty is stated as ±180°.
The results quoted are in terms of equivalent available noise temperature, which implies that
when multiplied by Boltzmann’s constant, the values calculated would represent the power
spectral density (W/Hz) delivered to a conjugately matched load. Each result represents the
average value measured over a 2 MHz bandwidth centred on the quoted frequency accurate to
±1 kHz.
Page 5 of 38
The device temperature was measured using a platinum resistance thermometer attached to
the outer case. The calibration results are valid for the device temperature stated. The
reported ambient temperature is that of the ambient temperature of the radiometer.
4.2 NIST Measurements
NIST noise-temperature measurements are performed on total-power radiometers, using two
primary thermal noise standards, one of which is at ambient temperature and the other of
which is at cryogenic (liquid nitrogen) temperature. For measurements at 30 and 60 MHz,
tuneable coaxial standards [1] are used; and from 1 to 12.4 GHz, broadband coaxial standards
[2] are used. All the NIST radiometers are total-power radiometers. At 1 GHz and above [3]
the measurements are double sideband, at baseband, and the bandwidth of each sideband is
5 MHz. At 30 MHz and 60 MHz [1,4], the power is measured directly, using band-pass
filters centred at the measurement frequency, with bandwidths of 0.77 MHz for 30 MHz and
1.38 MHz for 60 MHz. At least three independent measurements of the noise temperature of
each noise source were made at each frequency. Because the 30 MHz and 60 MHz
radiometer has type-N connectors, whereas the travelling standards have GPC-7 connectors,
the measurements at 30 MHz and 60 MHz were made through adaptors, resulting in a small
increase in the uncertainty. The procedure for characterizing the adaptor and removing its
effect is described in references [5,6]. The uncertainty analysis can be found in references
[3,4,7].
The laboratory was maintained at (23.0 ± 0.5) °C and (40 ± 5) % relative humidity during the
measurements.
At 30 MHz and 60 MHz the reflection coefficient is measured on a low-frequency impedance
meter. During the course of this comparison, a software error was found that resulted in
incorrect values for the impedance (and reflection coefficient) of the device under test
(DUT). The error has now been corrected, but the NIST results for the reflection coefficient
at 30 MHz and 60 MHz in this comparison are wrong. Fortunately, because the ambient and
cryogenic standards are tuned to have the same impedance as the DUT, as measured by the
same impedance meter, the actual value of the impedance (or reflection coefficient) of the
DUT does not affect the measured noise temperature. At 1 GHz the reflection coefficient is
measured on a vector network analyser, and that result is not affected by any (known) error.
Page 6 of 38
It is for this reason that NIST have withdrawn their reflection coefficient measurement results
at 30 MHz and 60 MHz.
4.3 BNM-LNE Measurements
The travelling standards were compared against BNM’s working noise standard (Ailtech
Noise Generator, Type 7616) with PC-7 connector, which has traceability to the UK Primary
Noise Standard.
The noise measurements were made on the BNM-LNE Dicke-type radiometer at a room
temperature of (23 ± 1.5) °C using a supply voltage of (28.00 ± 0.17) V.
The measurements are double sideband at 1000 MHz, and single sideband at 30 MHz and
60 MHz, with noise filter bandwidths of 30 MHz and 60 MHz respectively.
4.4 VNIIFTRI Measurements
The travelling standards HP346A and HP346B were compared against the VNIIFTRI
cryogenic noise standard [8]. The comparison frequency points, fc, the values of intermediate
frequencies, IF1 and IF2, and IF2 bandwidth are given as:
Comparison frequency fc,
MHz
IF1, MHz IF2, MHz IF2 bandwidth,
MHz
30, 60 150 10 0.3
1000 2050 30 3
Each radiometer contains on its input: a matching tuner, a directional coupler (used as a
reflectometer with an auxiliary sinusoidal signal source), a second matching tuner and a low-
noise amplifier.
Adjustment of the first tuner decreases the reflected signal by 25 dB, ensuring a residual
difference of voltage reflection coefficient, |∆Γ|, no greater than 0.018.
Page 7 of 38
Digital signal processing at the square-law detector output of the radiometer reduces the
equation for the unknown noise temperature to Tu = (Ts – Ta)·Y + Ta, where Ts is the
cryogenic standard noise temperature. The equation and its remaining designations are
identical to the expression for a Dicke radiometer [9].
The cryogenic noise standard and the inputs of the comparators have Type N connectors, so
the losses in the additional adapters were taken into account according to reference [10].
To correct for the non-linearities in the radiometer, the measured noise levels of each device
were stored and these levels were reproduced as closely as possible, with an accuracy not
worse than 1%, using an auxiliary noise source and a step attenuator.
Voltage reflection coefficient magnitudes of the comparison devices were measured on an
analogue measuring set (type R4-11) with an absolute uncertainty of approximately 0.02.
The noise measurements were made according to the procedures laid down in VNIIFTRI
Procedure Document [11].
5 Discussion of the Results
The results were presented to the pilot laboratory in the form of a noise temperature
measurement and the magnitude of the reflection coefficient. Participants were asked to
provide separately the uncertainties obtained from Type A and Type B evaluations and the
expanded uncertainty (at 95% confidence level) for the noise temperature. The measurement
results and associated expanded uncertainties together with the reference values and
associated expanded uncertainties are shown in Figures 1 – 3 for the HP346A device and
Figures 4 – 6 for the HP346B device.
The complete set of measurements for each participant can be found in Appendix A, along
with associated expanded uncertainties and degrees of equivalence with respect to the key
comparison reference value and between participants.
Page 8 of 38
Along with the measurement results, participants were asked to provide details of the various
contributions towards the measurement uncertainty for the noise temperature only. These
uncertainty budgets may be found in Appendix B.
The expanded uncertainties quoted in the results are derived by multiplying the combined
standard uncertainties by a coverage factor of 2.0, which is sufficient to provide a level of
confidence for this expanded uncertainty of approximately 95 % for all participants.1
The KCRV for the noise temperature at each frequency was determined by the unweighted
mean of the reported results, excluding any outliers. This method was chosen, as it was
believed that all four participants would provide similar results and uncertainties.
In the period of time between February 2002 and September 2003, when NPL’s
measurements were carried out, components were replaced in NPL’s noise temperature
measurement system, which required it to be re-calibrated. Because of this, it was decided to
use only NPL’s second measurement in the calculation of the KCRV, as it is more
representative of NPL’s current measurement capabilities.
BNM-LNE’s noise temperature standard is traceable to UK National Standards via NPL;
therefore there is correlation associated with these measurements. However, due to the re-
calibration of NPL’s noise measurement system between the measurement of BNM-LNE’s
standard at NPL and NPL’s second measurement of the travelling standards, the correlation
associated with these measurements will be significantly reduced (it will not be eradicated
entirely).
It is believed that this correlation is low enough to be insignificant. In fact, a comparison of
the KCRVs obtained with and without BNM-LNE’s measurements shows insignificant
changes and for this reason it was decided to include BNM-LNE’s measurement results in the
calculation of the KCRV.
1 A coverage factor, k, of 2.0 is sufficient assuming all Type B uncertainty contributions have infinite degrees of freedom. NIST states finite degrees of freedom but provides uncertainties for both the finite and infinite cases (see Appendix B). For consistency, the NIST results for k = 2.0 were used in this report.
Page 9 of 38
The method used to determine outliers was that described in [13], see Appendix A. If a result
was considered an outlier, it was not used in the calculation of the KCRV. Results not used
in the computation of the KCRV are identified in Appendix A using bold, italic typeface.
Comparison of possible variants of the KCRV and degree of equivalence estimations showed
that the inclusion or exclusion of certain participants (even outliers) in the calculation
changes the results by a small amount, less than the uncertainty in the KCRV or degree of
equivalence. In conclusion, considering the small number of participants in this comparison,
there was general satisfactory agreement among the results.
The reflection coefficients were measured as secondary quantities and do not form part of the
object of this comparison; hence there is no KCRV for this measurand. The reported
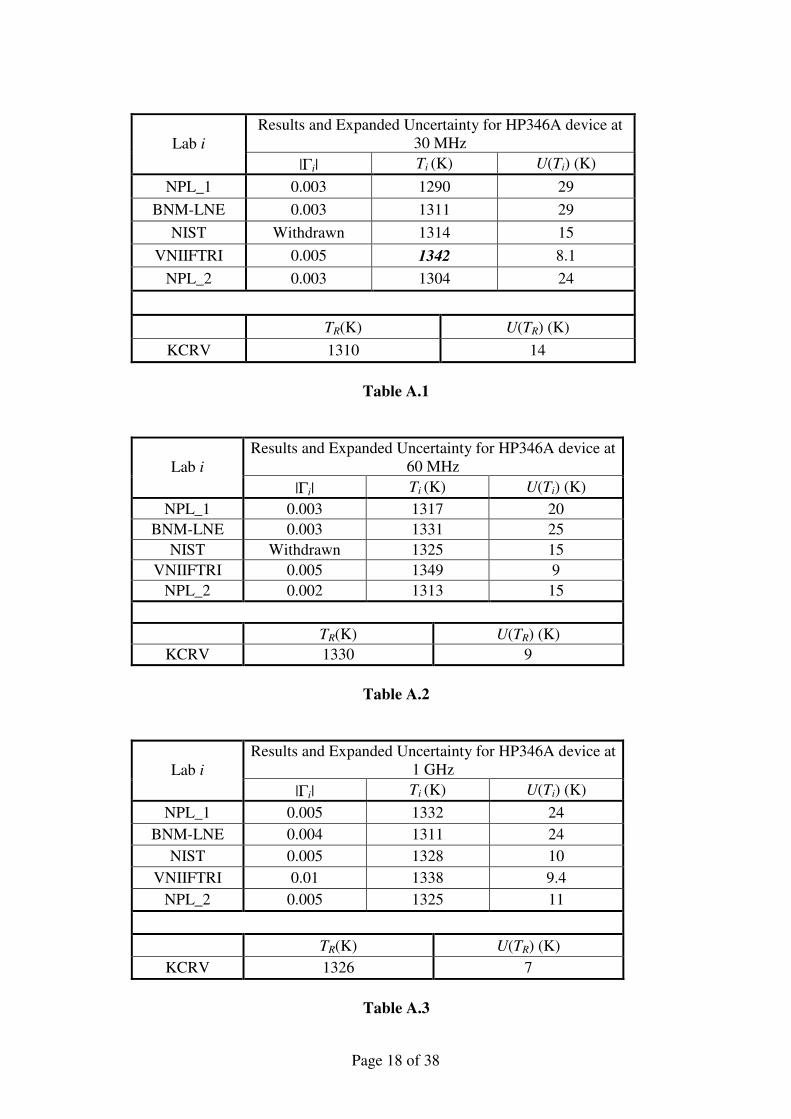
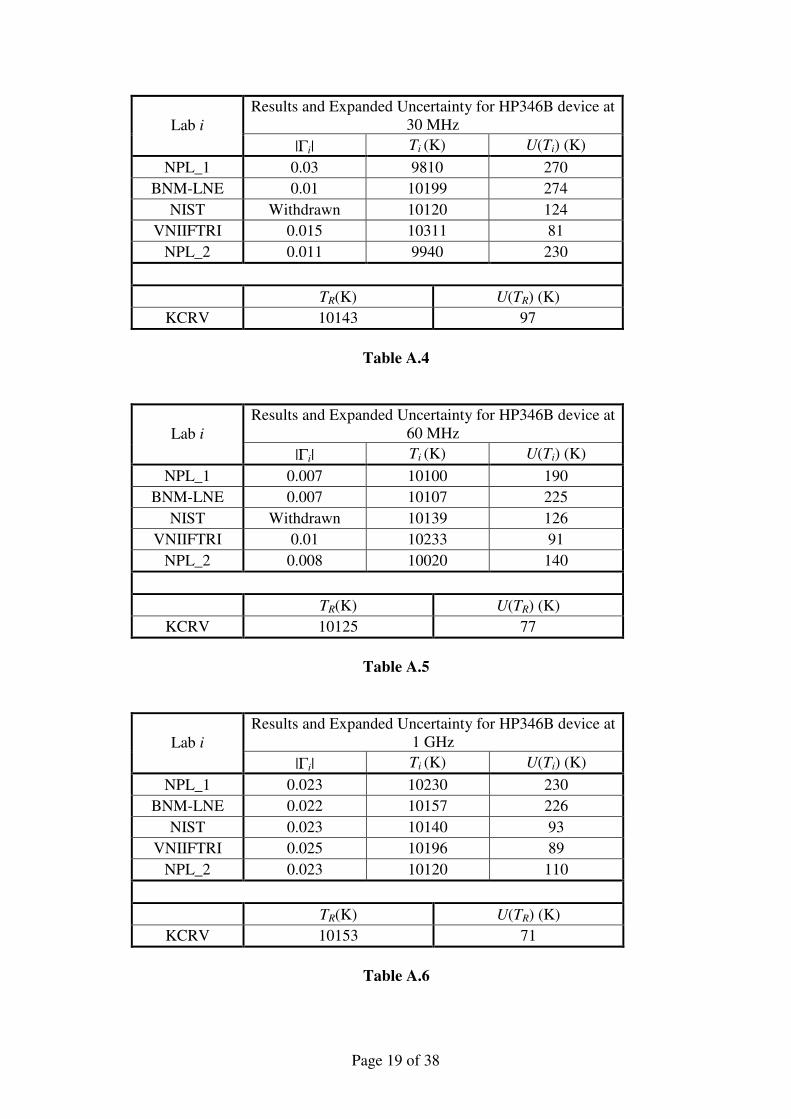
reflection coefficients can be seen in Tables A.1 through A.6 in Appendix A.
Page 10 of 38
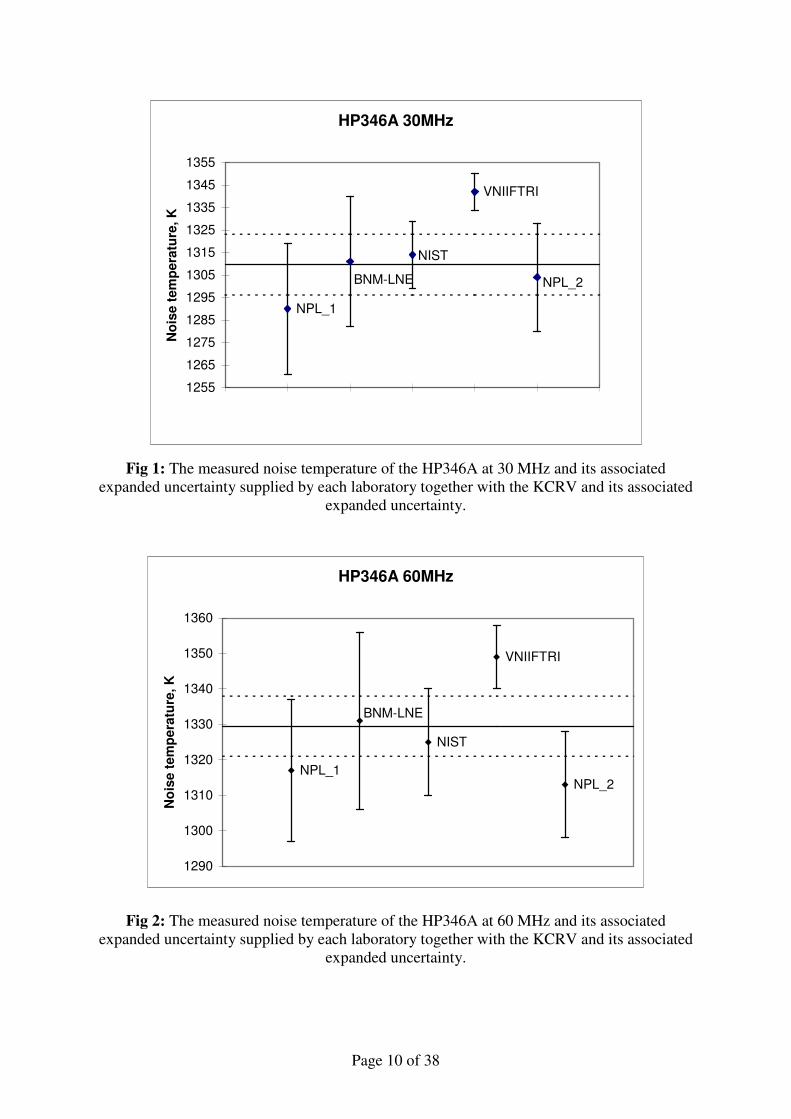
HP346A 30MHz
NPL_1
VNIIFTRI
NIST
NPL_2BNM-LNE
1255
1265
1275
1285
1295
1305
1315
1325
1335
1345
1355
NPL_1 BNM-LNE
NIST VNIIFTRI NPL_2
Noi
se te
mpe
ratu
re, K
Fig 1: The measured noise temperature of the HP346A at 30 MHz and its associated
expanded uncertainty supplied by each laboratory together with the KCRV and its associated expanded uncertainty.
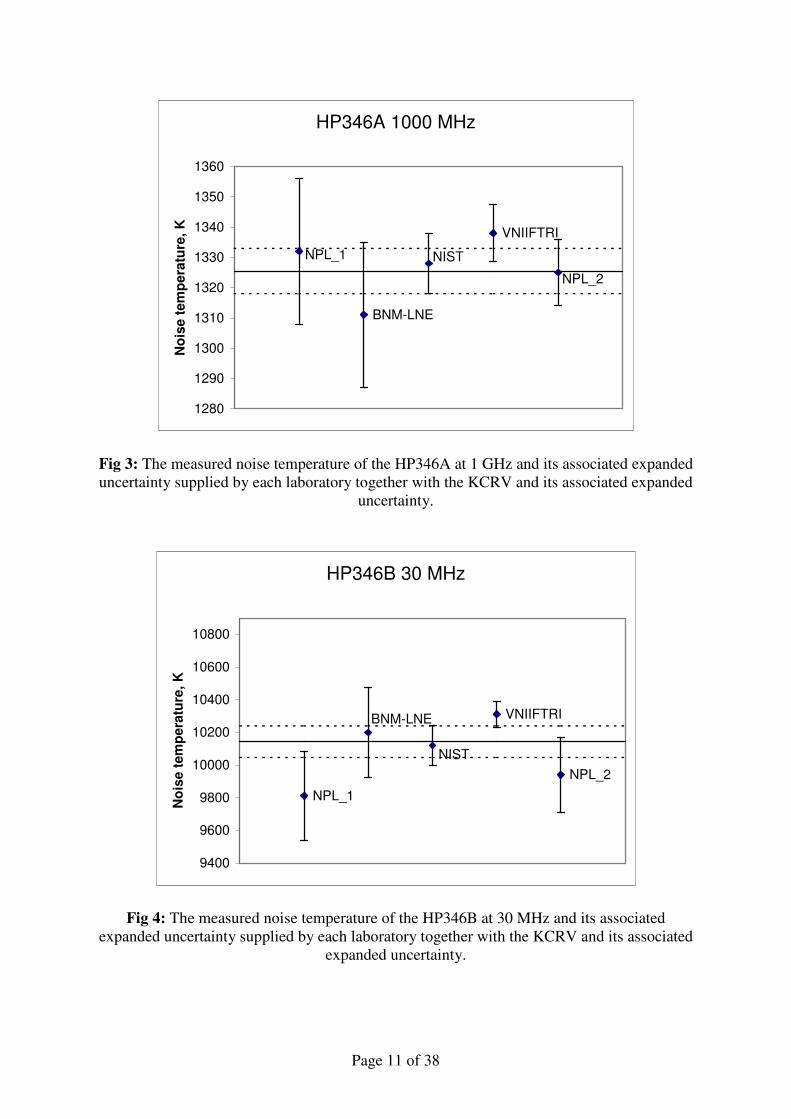
HP346A 60MHz
NPL_1
NIST
VNIIFTRI
NPL_2
BNM-LNE
1290
1300
1310
1320
1330
1340
1350
1360
Noi
se te
mpe
ratu
re, K
Fig 2: The measured noise temperature of the HP346A at 60 MHz and its associated expanded uncertainty supplied by each laboratory together with the KCRV and its associated
expanded uncertainty.
Page 11 of 38
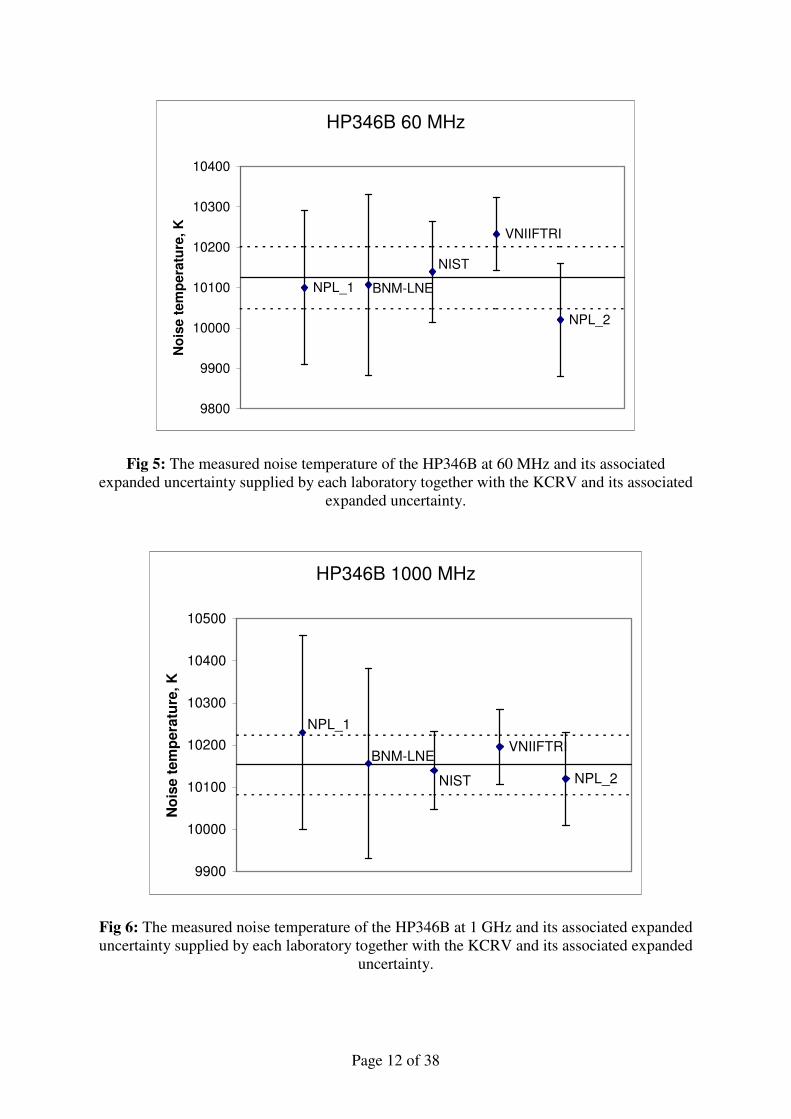
HP346A 1000 MHz
BNM-LNE
VNIIFTRI
NISTNPL_1
NPL_2
1280
1290
1300
1310
1320
1330
1340
1350
1360N
oise
tem
pera
ture
, K
Fig 3: The measured noise temperature of the HP346A at 1 GHz and its associated expanded uncertainty supplied by each laboratory together with the KCRV and its associated expanded
uncertainty.
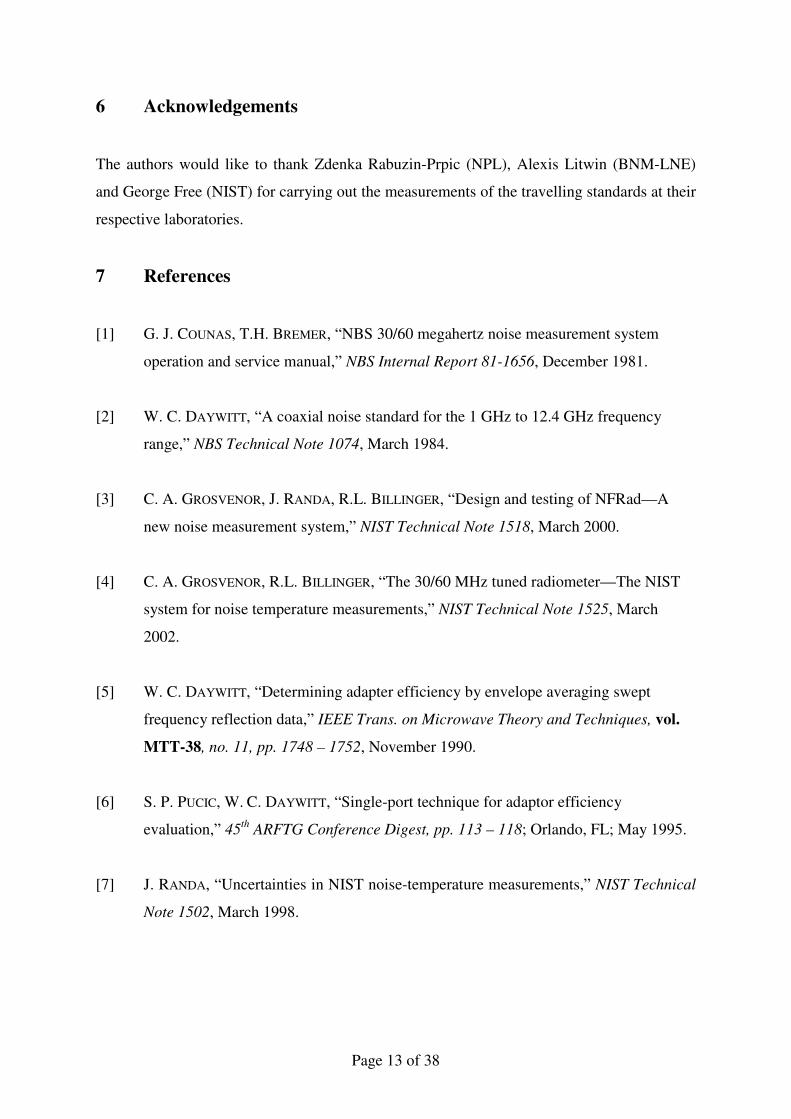
HP346B 30 MHz
NPL_1
VNIIFTRI
NPL_2NIST
BNM-LNE
9400
9600
9800
10000
10200
10400
10600
10800
Noi
se te
mpe
ratu
re, K
Fig 4: The measured noise temperature of the HP346B at 30 MHz and its associated expanded uncertainty supplied by each laboratory together with the KCRV and its associated
expanded uncertainty.
Page 12 of 38
HP346B 60 MHz
NPL_1
VNIIFTRI
NPL_2
NIST
BNM-LNE
9800
9900
10000
10100
10200
10300
10400N
oise
tem
pera
ture
, K
Fig 5: The measured noise temperature of the HP346B at 60 MHz and its associated expanded uncertainty supplied by each laboratory together with the KCRV and its associated
expanded uncertainty.
HP346B 1000 MHz
VNIIFTRI
NPL_2
NPL_1
BNM-LNE
NIST
9900
10000
10100
10200
10300
10400
10500
Noi
se te
mpe
ratu
re, K
Fig 6: The measured noise temperature of the HP346B at 1 GHz and its associated expanded uncertainty supplied by each laboratory together with the KCRV and its associated expanded
uncertainty.
Page 13 of 38
6 Acknowledgements
The authors would like to thank Zdenka Rabuzin-Prpic (NPL), Alexis Litwin (BNM-LNE)
and George Free (NIST) for carrying out the measurements of the travelling standards at their
respective laboratories.
7 References
[1] G. J. COUNAS, T.H. BREMER, “NBS 30/60 megahertz noise measurement system
operation and service manual,” NBS Internal Report 81-1656, December 1981.
[2] W. C. DAYWITT, “A coaxial noise standard for the 1 GHz to 12.4 GHz frequency
range,” NBS Technical Note 1074, March 1984.
[3] C. A. GROSVENOR, J. RANDA, R.L. BILLINGER, “Design and testing of NFRad—A
new noise measurement system,” NIST Technical Note 1518, March 2000.
[4] C. A. GROSVENOR, R.L. BILLINGER, “The 30/60 MHz tuned radiometer—The NIST
system for noise temperature measurements,” NIST Technical Note 1525, March
2002.
[5] W. C. DAYWITT, “Determining adapter efficiency by envelope averaging swept
frequency reflection data,” IEEE Trans. on Microwave Theory and Techniques, vol.
MTT-38, no. 11, pp. 1748 – 1752, November 1990.
[6] S. P. PUCIC, W. C. DAYWITT, “Single-port technique for adaptor efficiency
evaluation,” 45th ARFTG Conference Digest, pp. 113 – 118; Orlando, FL; May 1995.
[7] J. RANDA, “Uncertainties in NIST noise-temperature measurements,” NIST Technical
Note 1502, March 1998.
Page 14 of 38
[8] . . , " ",
!"# " $
", !"# - %., 1980, .14-19.
[9] CCEM.RF-K9 KEY COMPARISON: International comparison of thermal noise
standards between 12.4 GHz and 18 GHz, (GT-RF/99-1), Draft A, December 2001.
[10] G. F. ENGEN, IEEE Trans. on MTT, vol. MTT-16, pp. 636-639, Sep. 1968.
[11] “State Primary Standard for Noise Power Spectral Density Unit at the frequency Band
0.002-178.3 GHz. Conservation and Application Guide”, VNIIFTRI Procedure
Document, 1991.
[12] E. W. STRID, IEEE Trans.Microwave Th. and Tech., vol. MTT-29, #3, March 1981.
[13] J. RANDA, “Proposal for KCRV & Degree of Equivalence for GT-RF Key
Comparisons”, GT-RF/2000-12, August 2000
[14] T. J. WITT, “Some statistical formulas used in the analysis of key comparisons”, GT-
RF/2001-25, BIPM, July 2001
Page 15 of 38
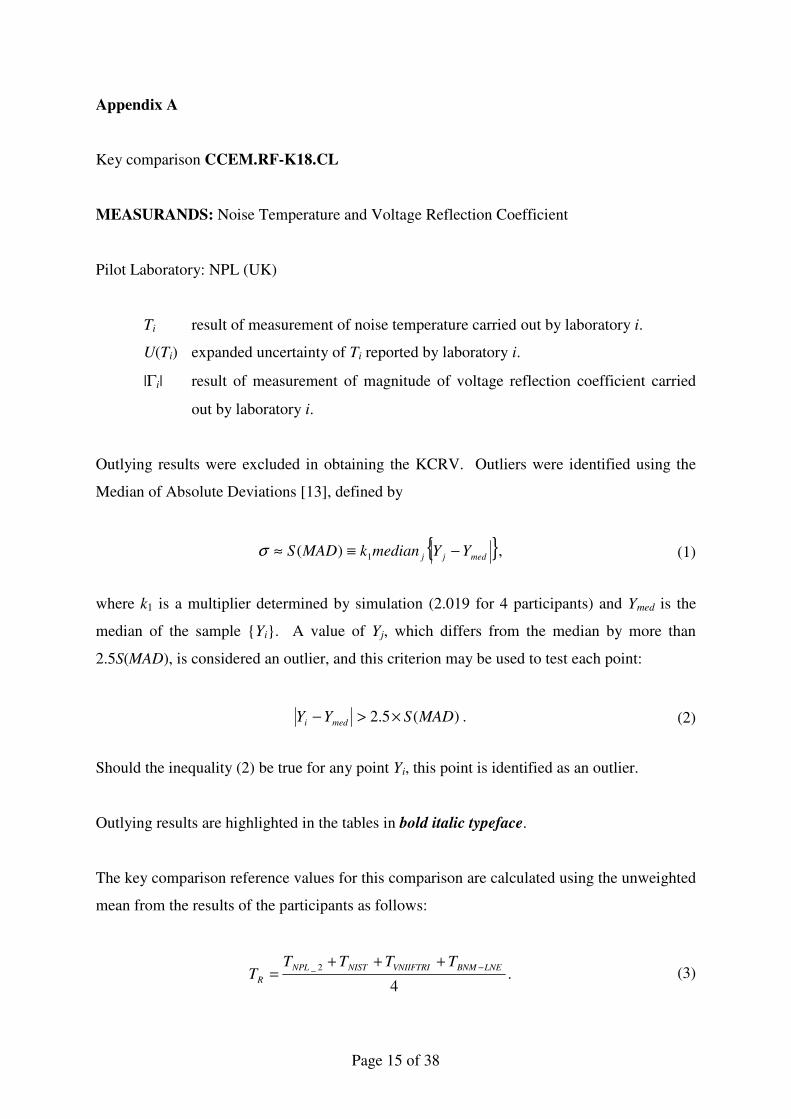
Appendix A
Key comparison CCEM.RF-K18.CL
MEASURANDS: Noise Temperature and Voltage Reflection Coefficient
Pilot Laboratory: NPL (UK)
Ti result of measurement of noise temperature carried out by laboratory i.
U(Ti) expanded uncertainty of Ti reported by laboratory i.
|Γi| result of measurement of magnitude of voltage reflection coefficient carried
out by laboratory i.
Outlying results were excluded in obtaining the KCRV. Outliers were identified using the
Median of Absolute Deviations [13], defined by
medjj YYmediankMADS −≡≈ 1)(σ , (1)
where k1 is a multiplier determined by simulation (2.019 for 4 participants) and Ymed is the
median of the sample Yi. A value of Yj, which differs from the median by more than
2.5S(MAD), is considered an outlier, and this criterion may be used to test each point:
)(5.2 MADSYY medi ×>− . (2)
Should the inequality (2) be true for any point Yi, this point is identified as an outlier.
Outlying results are highlighted in the tables in bold italic typeface.
The key comparison reference values for this comparison are calculated using the unweighted
mean from the results of the participants as follows:
42_ LNEBNMVNIIFTRINISTNPL
R
TTTTT −+++
= . (3)
Page 16 of 38
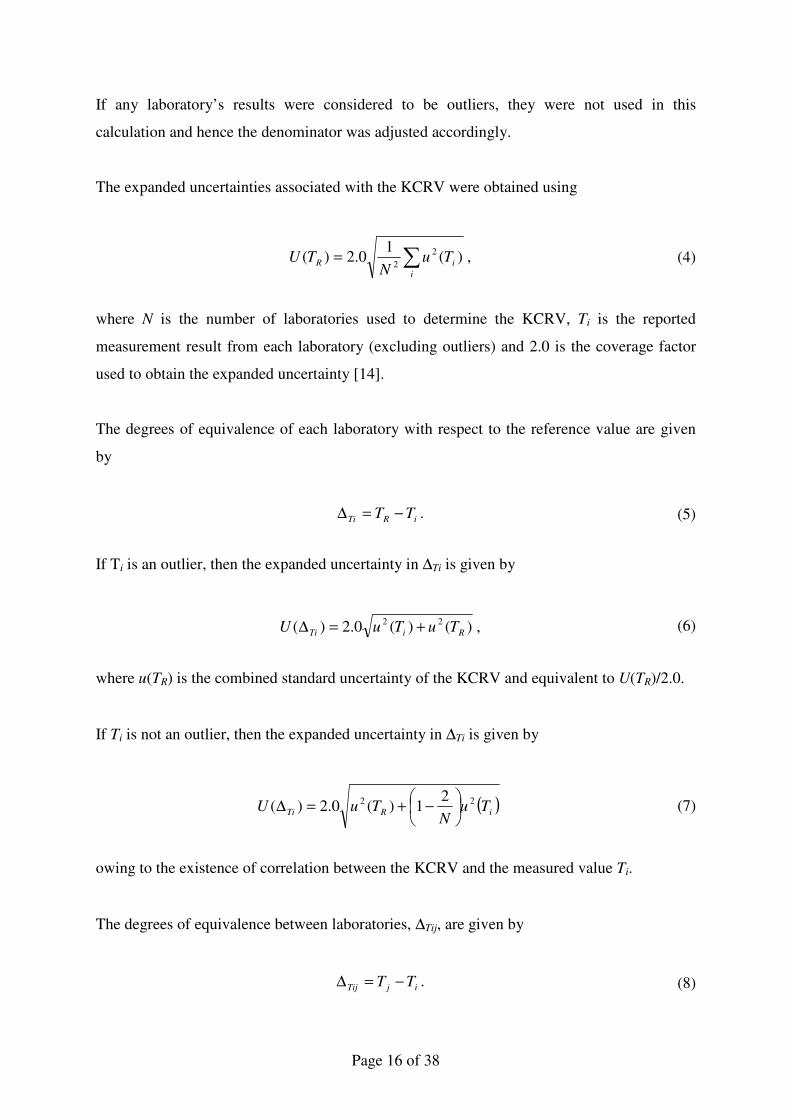
If any laboratory’s results were considered to be outliers, they were not used in this
calculation and hence the denominator was adjusted accordingly.
The expanded uncertainties associated with the KCRV were obtained using
=i
iR TuN
TU )(1
0.2)( 22 , (4)
where N is the number of laboratories used to determine the KCRV, Ti is the reported
measurement result from each laboratory (excluding outliers) and 2.0 is the coverage factor
used to obtain the expanded uncertainty [14].
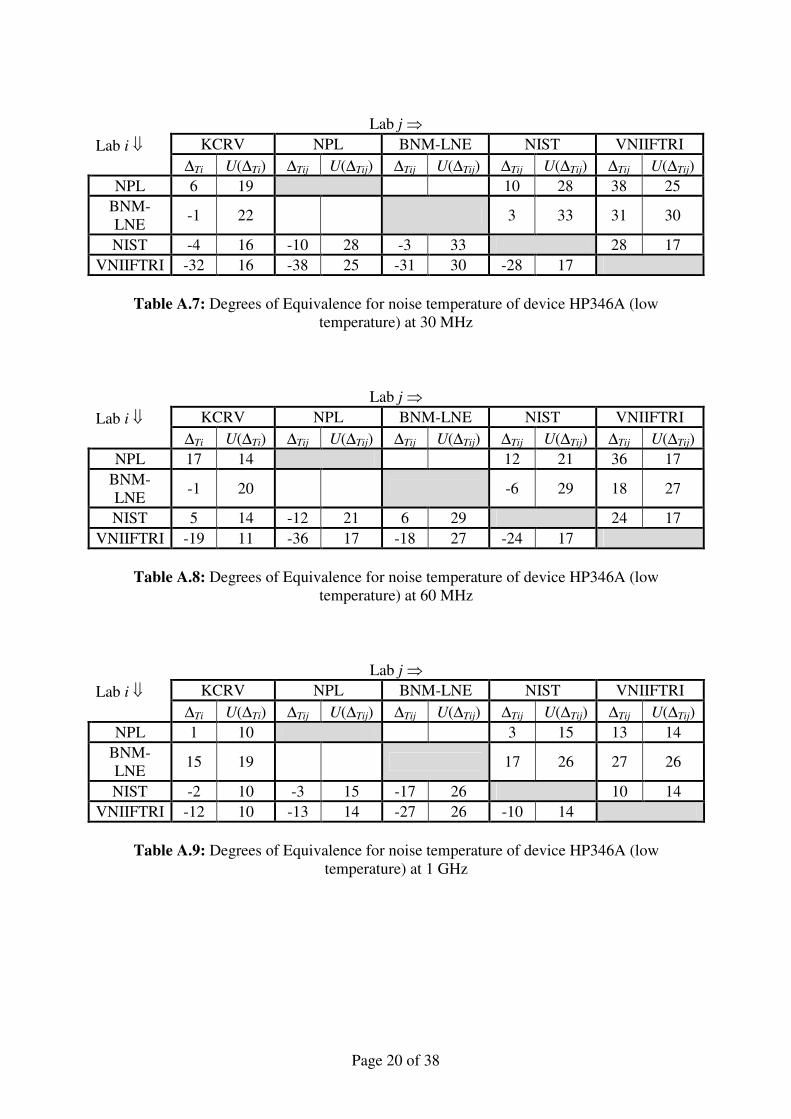
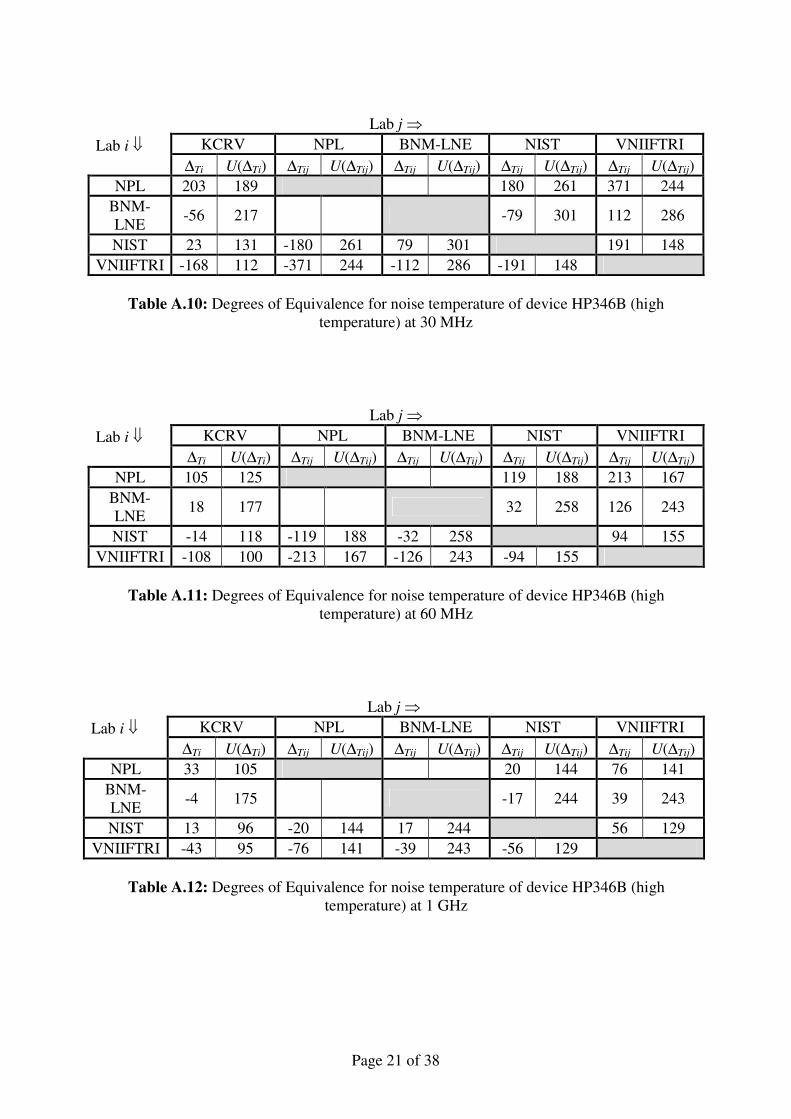
The degrees of equivalence of each laboratory with respect to the reference value are given
by
iRTi TT −=∆ . (5)
If Ti is an outlier, then the expanded uncertainty in ∆Ti is given by
)()(0.2)( 22RiTi TuTuU +=∆ , (6)
where u(TR) is the combined standard uncertainty of the KCRV and equivalent to U(TR)/2.0.
If Ti is not an outlier, then the expanded uncertainty in ∆Ti is given by
( )iRTi TuN
TuU 22 21)(0.2)(
−+=∆ (7)
owing to the existence of correlation between the KCRV and the measured value Ti.
The degrees of equivalence between laboratories, ∆Tij, are given by
ijTij TT −=∆ . (8)
Page 17 of 38
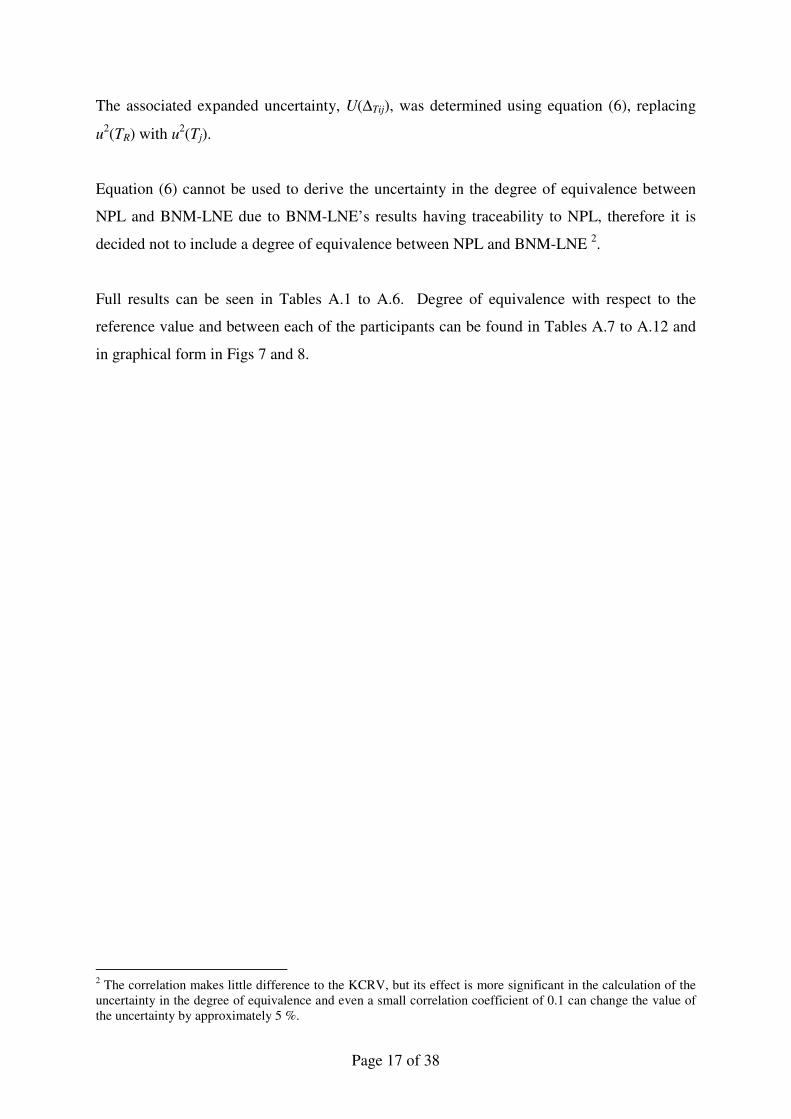
The associated expanded uncertainty, U(∆Tij), was determined using equation (6), replacing
u2(TR) with u2(Tj).
Equation (6) cannot be used to derive the uncertainty in the degree of equivalence between
NPL and BNM-LNE due to BNM-LNE’s results having traceability to NPL, therefore it is
decided not to include a degree of equivalence between NPL and BNM-LNE 2.
Full results can be seen in Tables A.1 to A.6. Degree of equivalence with respect to the
reference value and between each of the participants can be found in Tables A.7 to A.12 and
in graphical form in Figs 7 and 8.
2 The correlation makes little difference to the KCRV, but its effect is more significant in the calculation of the uncertainty in the degree of equivalence and even a small correlation coefficient of 0.1 can change the value of the uncertainty by approximately 5 %.
Page 18 of 38
Results and Expanded Uncertainty for HP346A device at
30 MHz Lab i |Γi| Ti (K) U(Ti) (K)
NPL_1 0.003 1290 29 BNM-LNE 0.003 1311 29
NIST Withdrawn 1314 15 VNIIFTRI 0.005 1342 8.1
NPL_2 0.003 1304 24
TR(K) U(TR) (K) KCRV 1310 14
Table A.1
Results and Expanded Uncertainty for HP346A device at 60 MHz Lab i
|Γi| Ti (K) U(Ti) (K) NPL_1 0.003 1317 20
BNM-LNE 0.003 1331 25 NIST Withdrawn 1325 15
VNIIFTRI 0.005 1349 9 NPL_2 0.002 1313 15
TR(K) U(TR) (K)
KCRV 1330 9
Table A.2
Results and Expanded Uncertainty for HP346A device at 1 GHz Lab i
|Γi| Ti (K) U(Ti) (K) NPL_1 0.005 1332 24
BNM-LNE 0.004 1311 24 NIST 0.005 1328 10
VNIIFTRI 0.01 1338 9.4 NPL_2 0.005 1325 11
TR(K) U(TR) (K)
KCRV 1326 7
Table A.3
Page 19 of 38
Results and Expanded Uncertainty for HP346B device at 30 MHz Lab i
|Γi| Ti (K) U(Ti) (K) NPL_1 0.03 9810 270
BNM-LNE 0.01 10199 274 NIST Withdrawn 10120 124
VNIIFTRI 0.015 10311 81 NPL_2 0.011 9940 230
TR(K) U(TR) (K)
KCRV 10143 97
Table A.4
Results and Expanded Uncertainty for HP346B device at 60 MHz Lab i
|Γi| Ti (K) U(Ti) (K) NPL_1 0.007 10100 190
BNM-LNE 0.007 10107 225 NIST Withdrawn 10139 126
VNIIFTRI 0.01 10233 91 NPL_2 0.008 10020 140
TR(K) U(TR) (K)
KCRV 10125 77
Table A.5
Results and Expanded Uncertainty for HP346B device at 1 GHz Lab i
|Γi| Ti (K) U(Ti) (K) NPL_1 0.023 10230 230
BNM-LNE 0.022 10157 226 NIST 0.023 10140 93
VNIIFTRI 0.025 10196 89 NPL_2 0.023 10120 110
TR(K) U(TR) (K)
KCRV 10153 71
Table A.6
Page 20 of 38
Lab j
KCRV NPL BNM-LNE NIST VNIIFTRI Lab i ∆Ti U(∆Ti) ∆Tij U(∆Tij) ∆Tij U(∆Tij) ∆Tij U(∆Tij) ∆Tij U(∆Tij)
NPL 6 19 10 28 38 25 BNM-LNE -1 22 3 33 31 30
NIST -4 16 -10 28 -3 33 28 17 VNIIFTRI -32 16 -38 25 -31 30 -28 17
Table A.7: Degrees of Equivalence for noise temperature of device HP346A (low
temperature) at 30 MHz
Lab j
KCRV NPL BNM-LNE NIST VNIIFTRI Lab i ∆Ti U(∆Ti) ∆Tij U(∆Tij) ∆Tij U(∆Tij) ∆Tij U(∆Tij) ∆Tij U(∆Tij)
NPL 17 14 12 21 36 17 BNM-LNE -1 20 -6 29 18 27
NIST 5 14 -12 21 6 29 24 17 VNIIFTRI -19 11 -36 17 -18 27 -24 17
Table A.8: Degrees of Equivalence for noise temperature of device HP346A (low
temperature) at 60 MHz
Lab j
KCRV NPL BNM-LNE NIST VNIIFTRI Lab i ∆Ti U(∆Ti) ∆Tij U(∆Tij) ∆Tij U(∆Tij) ∆Tij U(∆Tij) ∆Tij U(∆Tij)
NPL 1 10 3 15 13 14 BNM-LNE 15 19 17 26 27 26
NIST -2 10 -3 15 -17 26 10 14 VNIIFTRI -12 10 -13 14 -27 26 -10 14
Table A.9: Degrees of Equivalence for noise temperature of device HP346A (low
temperature) at 1 GHz
Page 21 of 38
Lab j
KCRV NPL BNM-LNE NIST VNIIFTRI Lab i ∆Ti U(∆Ti) ∆Tij U(∆Tij) ∆Tij U(∆Tij) ∆Tij U(∆Tij) ∆Tij U(∆Tij)
NPL 203 189 180 261 371 244 BNM-LNE -56 217 -79 301 112 286
NIST 23 131 -180 261 79 301 191 148 VNIIFTRI -168 112 -371 244 -112 286 -191 148
Table A.10: Degrees of Equivalence for noise temperature of device HP346B (high
temperature) at 30 MHz
Lab j KCRV NPL BNM-LNE NIST VNIIFTRI Lab i
∆Ti U(∆Ti) ∆Tij U(∆Tij) ∆Tij U(∆Tij) ∆Tij U(∆Tij) ∆Tij U(∆Tij) NPL 105 125 119 188 213 167
BNM-LNE 18 177 32 258 126 243
NIST -14 118 -119 188 -32 258 94 155 VNIIFTRI -108 100 -213 167 -126 243 -94 155
Table A.11: Degrees of Equivalence for noise temperature of device HP346B (high
temperature) at 60 MHz
Lab j KCRV NPL BNM-LNE NIST VNIIFTRI Lab i
∆Ti U(∆Ti) ∆Tij U(∆Tij) ∆Tij U(∆Tij) ∆Tij U(∆Tij) ∆Tij U(∆Tij) NPL 33 105 20 144 76 141
BNM-LNE -4 175 -17 244 39 243
NIST 13 96 -20 144 17 244 56 129 VNIIFTRI -43 95 -76 141 -39 243 -56 129
Table A.12: Degrees of Equivalence for noise temperature of device HP346B (high
temperature) at 1 GHz
Page 22 of 38
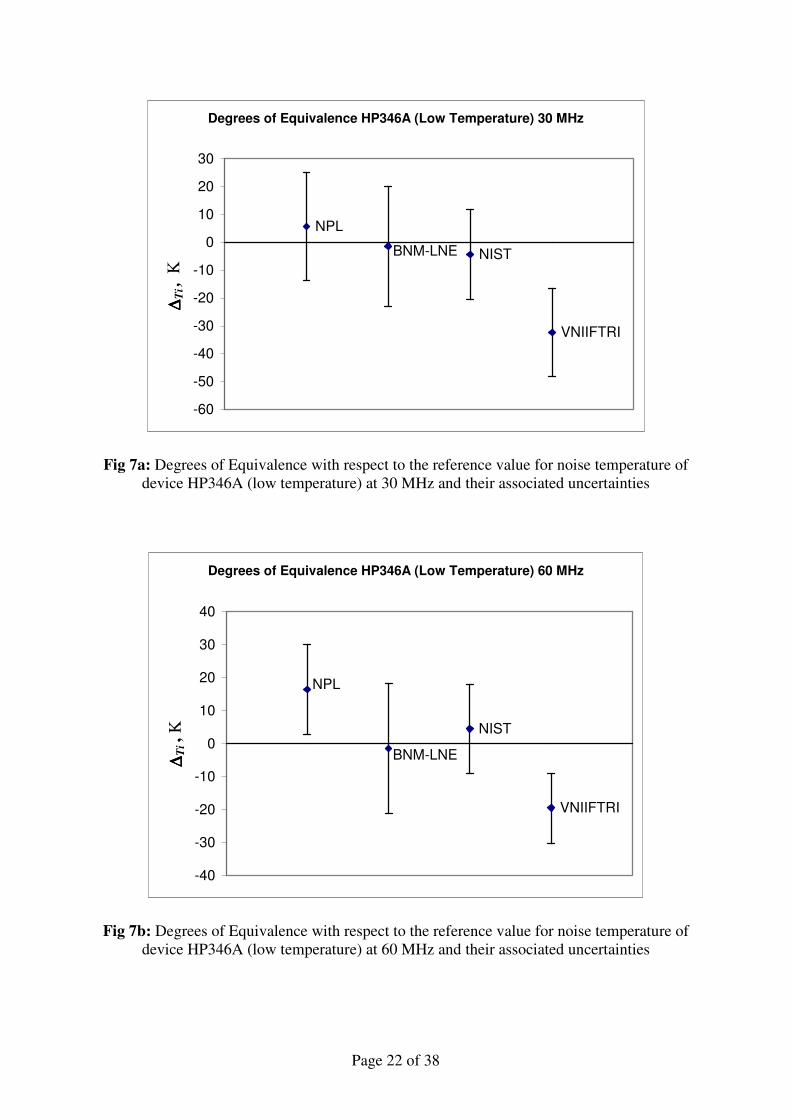
Degrees of Equivalence HP346A (Low Temperature) 30 MHz
NPL
NIST
VNIIFTRI
BNM-LNE
-60
-50
-40
-30
-20
-10
0
10
20
30∆∆ ∆∆ T
i , K
Fig 7a: Degrees of Equivalence with respect to the reference value for noise temperature of device HP346A (low temperature) at 30 MHz and their associated uncertainties
Degrees of Equivalence HP346A (Low Temperature) 60 MHz
NIST
VNIIFTRI
NPL
BNM-LNE
-40
-30
-20
-10
0
10
20
30
40
∆∆ ∆∆ Ti,
K
Fig 7b: Degrees of Equivalence with respect to the reference value for noise temperature of device HP346A (low temperature) at 60 MHz and their associated uncertainties
Page 23 of 38
Degrees of Equivalence HP346A (Low Temperature) 1 GHz
BNM-LNE
NIST
VNIIFTRI
NPL
-30
-20
-10
0
10
20
30
40
∆∆ ∆∆ Ti ,
K
Fig 7c: Degrees of Equivalence with respect to the reference value for noise temperature of device HP346A (low temperature) at 1 GHz and their associated uncertainties
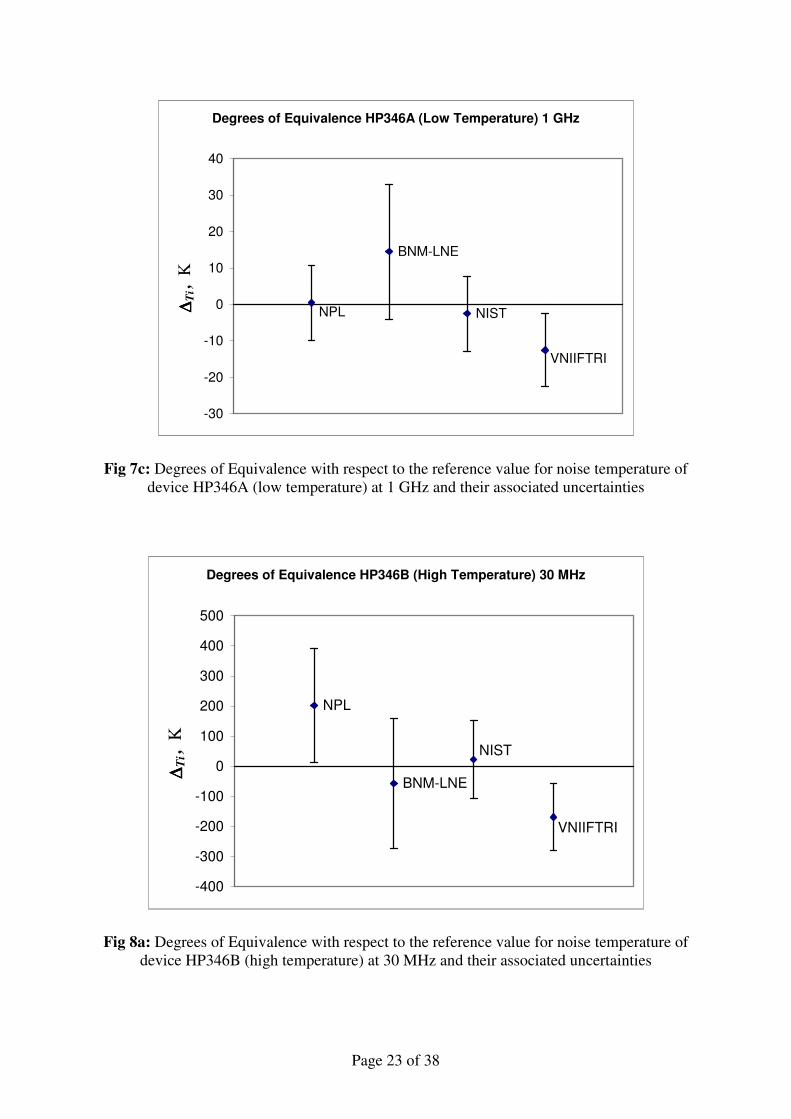
Degrees of Equivalence HP346B (High Temperature) 30 MHz
NPL
BNM-LNE
VNIIFTRI
NIST
-400
-300
-200
-100
0
100
200
300
400
500
∆∆ ∆∆ Ti ,
K
Fig 8a: Degrees of Equivalence with respect to the reference value for noise temperature of device HP346B (high temperature) at 30 MHz and their associated uncertainties
Page 24 of 38
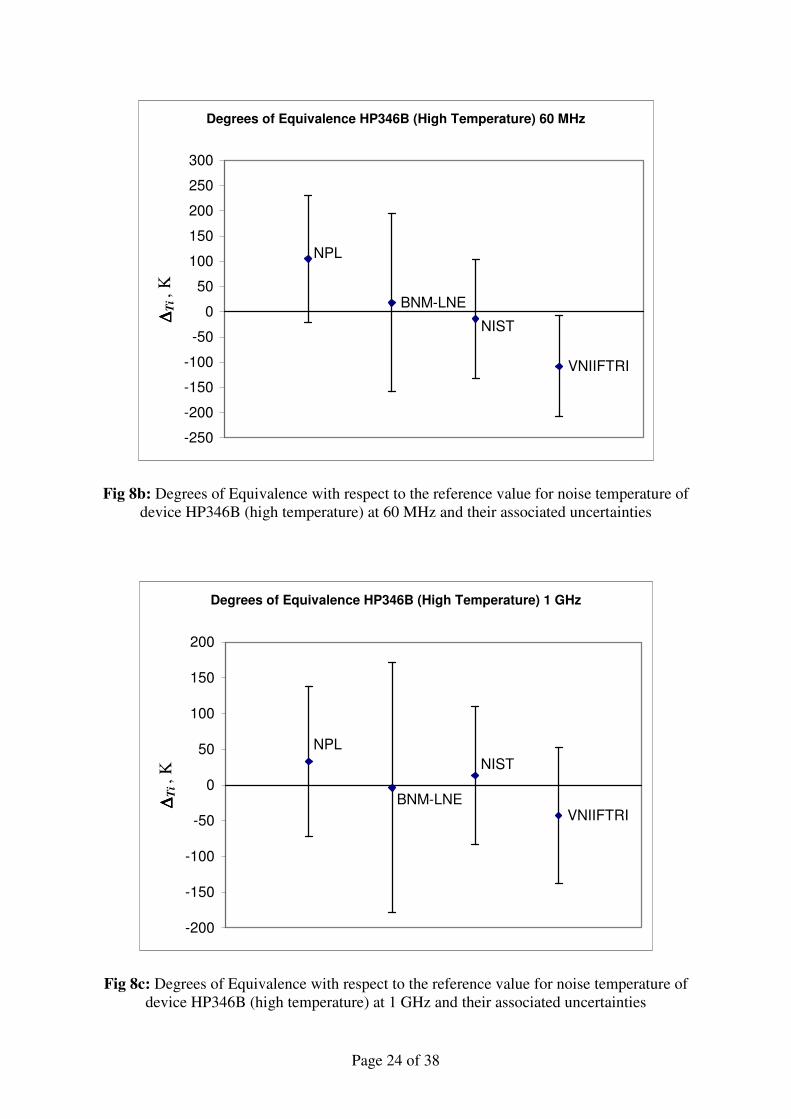
Degrees of Equivalence HP346B (High Temperature) 60 MHz
BNM-LNE
VNIIFTRI
NIST
NPL
-250
-200
-150
-100
-50
0
50
100
150
200
250
300∆∆ ∆∆ T
i, K
Fig 8b: Degrees of Equivalence with respect to the reference value for noise temperature of device HP346B (high temperature) at 60 MHz and their associated uncertainties
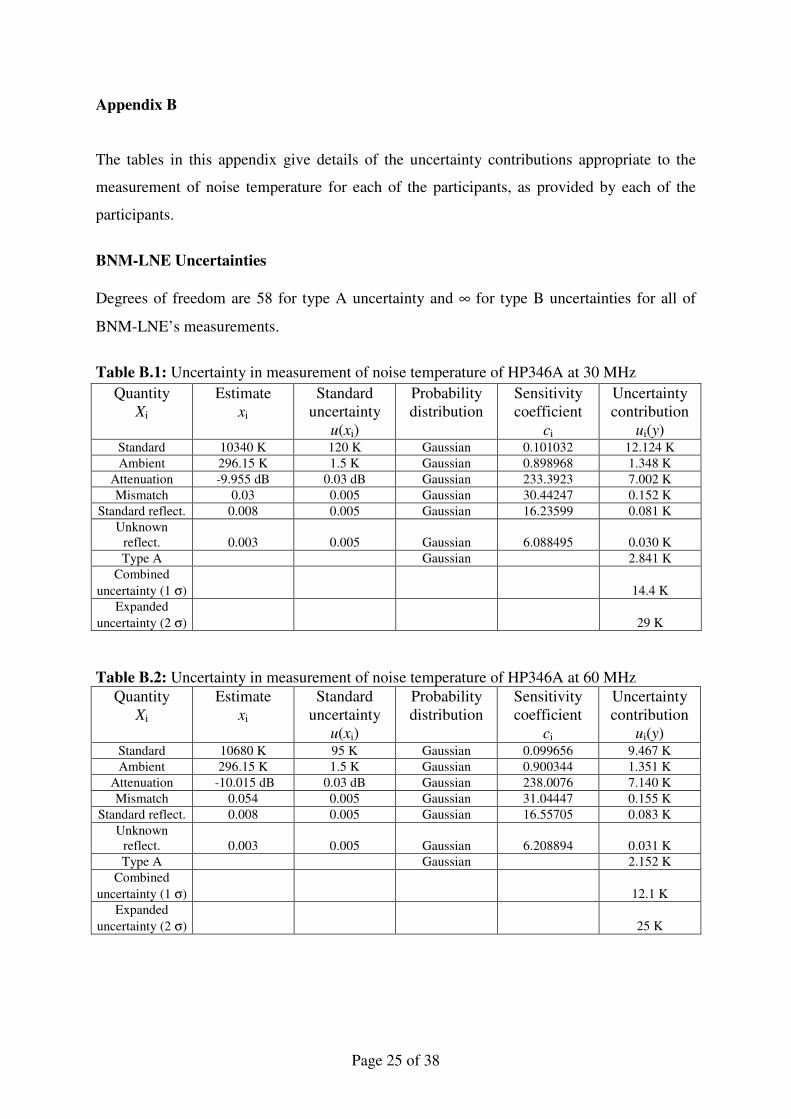
Degrees of Equivalence HP346B (High Temperature) 1 GHz
VNIIFTRI
NIST
BNM-LNE
NPL
-200
-150
-100
-50
0
50
100
150
200
∆∆ ∆∆ Ti,
K
Fig 8c: Degrees of Equivalence with respect to the reference value for noise temperature of device HP346B (high temperature) at 1 GHz and their associated uncertainties
Page 25 of 38
Appendix B
The tables in this appendix give details of the uncertainty contributions appropriate to the
measurement of noise temperature for each of the participants, as provided by each of the
participants.
BNM-LNE Uncertainties Degrees of freedom are 58 for type A uncertainty and ∞ for type B uncertainties for all of
BNM-LNE’s measurements.
Table B.1: Uncertainty in measurement of noise temperature of HP346A at 30 MHz
Table B.2: Uncertainty in measurement of noise temperature of HP346A at 60 MHz
Quantity Xi
Estimate xi
Standard uncertainty
u(xi)
Probability distribution
Sensitivity coefficient
ci
Uncertainty contribution
ui(y) Standard 10680 K 95 K Gaussian 0.099656 9.467 K Ambient 296.15 K 1.5 K Gaussian 0.900344 1.351 K
Attenuation -10.015 dB 0.03 dB Gaussian 238.0076 7.140 K Mismatch 0.054 0.005 Gaussian 31.04447 0.155 K
Standard reflect. 0.008 0.005 Gaussian 16.55705 0.083 K Unknown
reflect. 0.003 0.005 Gaussian 6.208894 0.031 K Type A Gaussian 2.152 K
Combined uncertainty (1 σ) 12.1 K
Expanded uncertainty (2 σ) 25 K
Quantity Xi
Estimate xi
Standard uncertainty
u(xi)
Probability distribution
Sensitivity coefficient
ci
Uncertainty contribution
ui(y) Standard 10340 K 120 K Gaussian 0.101032 12.124 K Ambient 296.15 K 1.5 K Gaussian 0.898968 1.348 K
Attenuation -9.955 dB 0.03 dB Gaussian 233.3923 7.002 K Mismatch 0.03 0.005 Gaussian 30.44247 0.152 K
Standard reflect. 0.008 0.005 Gaussian 16.23599 0.081 K Unknown
reflect. 0.003 0.005 Gaussian 6.088495 0.030 K Type A Gaussian 2.841 K
Combined uncertainty (1 σ) 14.4 K
Expanded uncertainty (2 σ) 29 K
Page 26 of 38
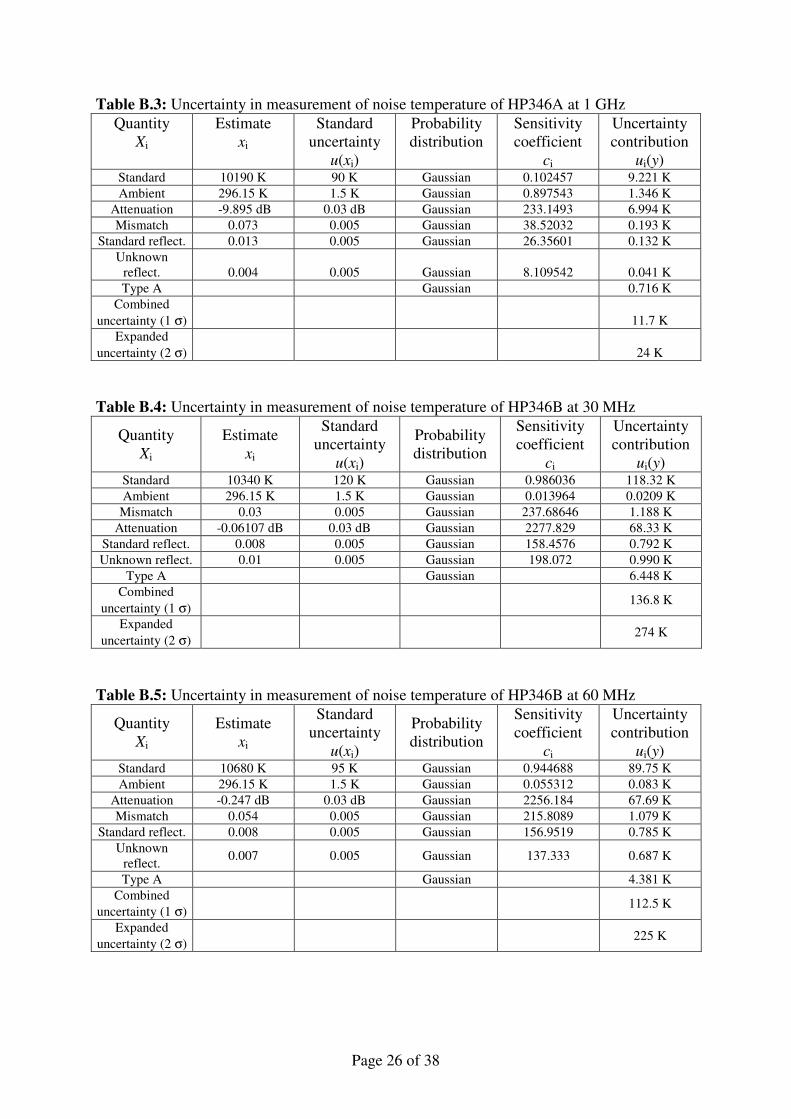
Table B.3: Uncertainty in measurement of noise temperature of HP346A at 1 GHz Quantity
Xi Estimate
xi Standard
uncertainty u(xi)
Probability distribution
Sensitivity coefficient
ci
Uncertainty contribution
ui(y) Standard 10190 K 90 K Gaussian 0.102457 9.221 K Ambient 296.15 K 1.5 K Gaussian 0.897543 1.346 K
Attenuation -9.895 dB 0.03 dB Gaussian 233.1493 6.994 K Mismatch 0.073 0.005 Gaussian 38.52032 0.193 K
Standard reflect. 0.013 0.005 Gaussian 26.35601 0.132 K Unknown
reflect. 0.004 0.005 Gaussian 8.109542 0.041 K Type A Gaussian 0.716 K
Combined uncertainty (1 σ) 11.7 K
Expanded uncertainty (2 σ) 24 K Table B.4: Uncertainty in measurement of noise temperature of HP346B at 30 MHz
Table B.5: Uncertainty in measurement of noise temperature of HP346B at 60 MHz
Quantity Xi
Estimate xi
Standard uncertainty
u(xi)
Probability distribution
Sensitivity coefficient
ci
Uncertainty contribution
ui(y) Standard 10680 K 95 K Gaussian 0.944688 89.75 K Ambient 296.15 K 1.5 K Gaussian 0.055312 0.083 K
Attenuation -0.247 dB 0.03 dB Gaussian 2256.184 67.69 K Mismatch 0.054 0.005 Gaussian 215.8089 1.079 K
Standard reflect. 0.008 0.005 Gaussian 156.9519 0.785 K Unknown
reflect. 0.007 0.005 Gaussian 137.333 0.687 K
Type A Gaussian 4.381 K Combined
uncertainty (1 σ) 112.5 K
Expanded uncertainty (2 σ)
225 K
Quantity Xi
Estimate xi
Standard uncertainty
u(xi)
Probability distribution
Sensitivity coefficient
ci
Uncertainty contribution
ui(y) Standard 10340 K 120 K Gaussian 0.986036 118.32 K Ambient 296.15 K 1.5 K Gaussian 0.013964 0.0209 K
Mismatch 0.03 0.005 Gaussian 237.68646 1.188 K Attenuation -0.06107 dB 0.03 dB Gaussian 2277.829 68.33 K
Standard reflect. 0.008 0.005 Gaussian 158.4576 0.792 K Unknown reflect. 0.01 0.005 Gaussian 198.072 0.990 K
Type A Gaussian 6.448 K Combined
uncertainty (1 σ) 136.8 K
Expanded uncertainty (2 σ)
274 K
Page 27 of 38
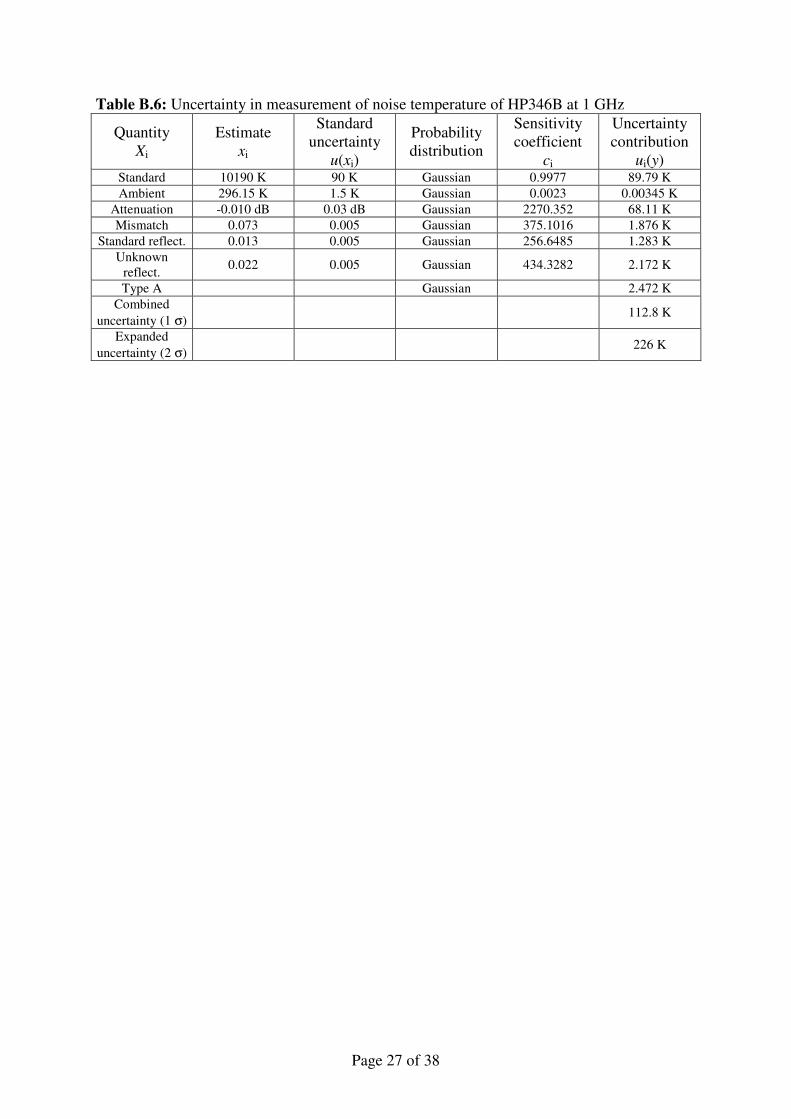
Table B.6: Uncertainty in measurement of noise temperature of HP346B at 1 GHz
Quantity Xi
Estimate xi
Standard uncertainty
u(xi)
Probability distribution
Sensitivity coefficient
ci
Uncertainty contribution
ui(y) Standard 10190 K 90 K Gaussian 0.9977 89.79 K Ambient 296.15 K 1.5 K Gaussian 0.0023 0.00345 K
Attenuation -0.010 dB 0.03 dB Gaussian 2270.352 68.11 K Mismatch 0.073 0.005 Gaussian 375.1016 1.876 K
Standard reflect. 0.013 0.005 Gaussian 256.6485 1.283 K Unknown
reflect. 0.022 0.005 Gaussian 434.3282 2.172 K
Type A Gaussian 2.472 K Combined
uncertainty (1 σ) 112.8 K
Expanded uncertainty (2 σ)
226 K
Page 28 of 38
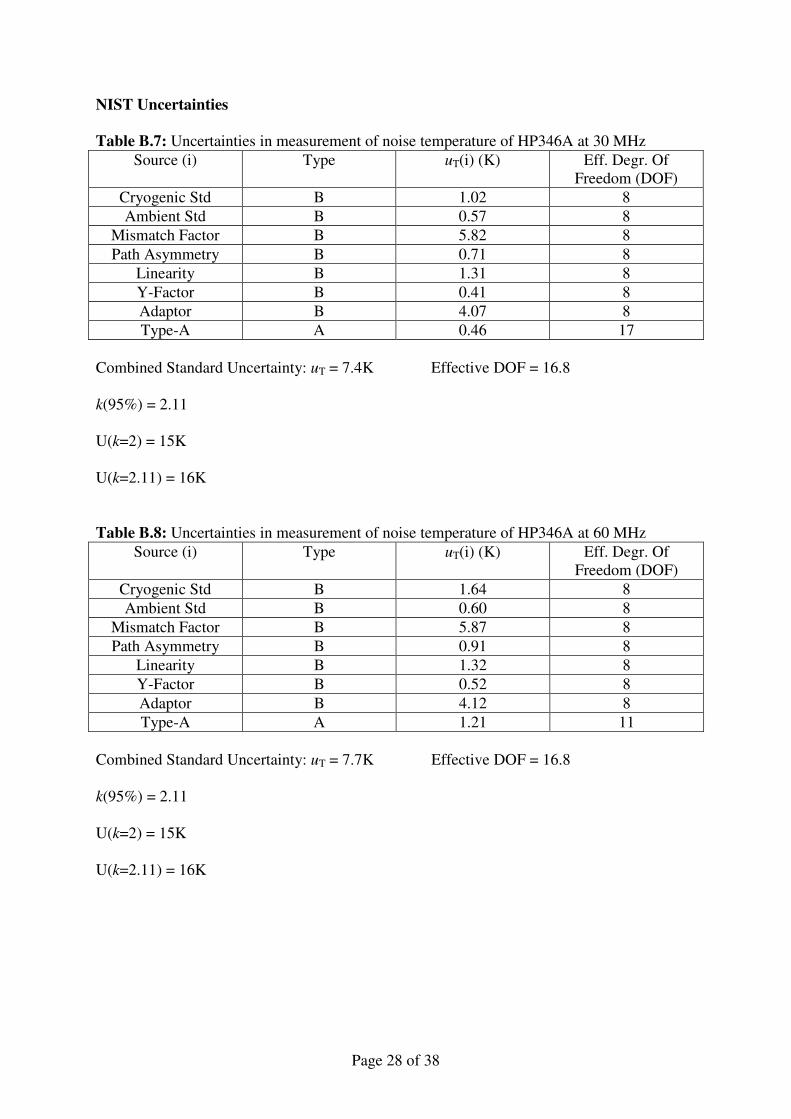
NIST Uncertainties Table B.7: Uncertainties in measurement of noise temperature of HP346A at 30 MHz
Source (i) Type uT(i) (K) Eff. Degr. Of Freedom (DOF)
Cryogenic Std B 1.02 8 Ambient Std B 0.57 8
Mismatch Factor B 5.82 8 Path Asymmetry B 0.71 8
Linearity B 1.31 8 Y-Factor B 0.41 8 Adaptor B 4.07 8 Type-A A 0.46 17
Combined Standard Uncertainty: uT = 7.4K Effective DOF = 16.8 k(95%) = 2.11 U(k=2) = 15K U(k=2.11) = 16K Table B.8: Uncertainties in measurement of noise temperature of HP346A at 60 MHz
Source (i) Type uT(i) (K) Eff. Degr. Of Freedom (DOF)
Cryogenic Std B 1.64 8 Ambient Std B 0.60 8
Mismatch Factor B 5.87 8 Path Asymmetry B 0.91 8
Linearity B 1.32 8 Y-Factor B 0.52 8 Adaptor B 4.12 8 Type-A A 1.21 11
Combined Standard Uncertainty: uT = 7.7K Effective DOF = 16.8 k(95%) = 2.11 U(k=2) = 15K U(k=2.11) = 16K
Page 29 of 38
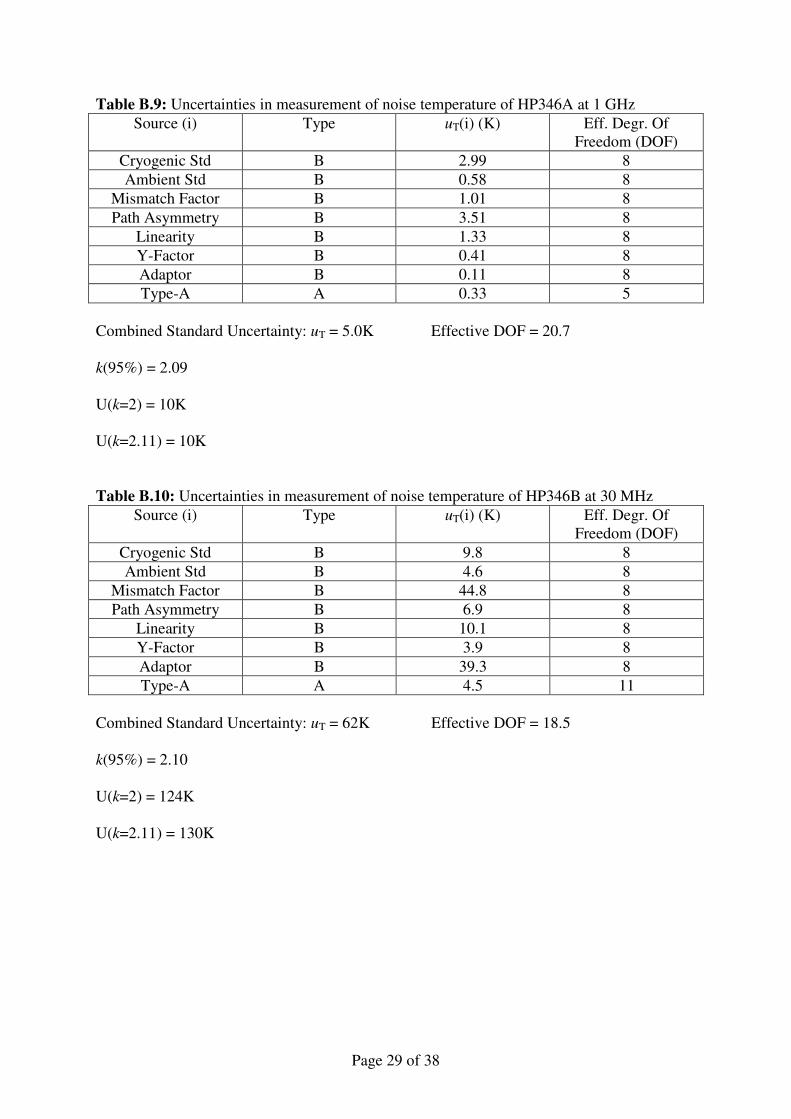
Table B.9: Uncertainties in measurement of noise temperature of HP346A at 1 GHz Source (i) Type uT(i) (K) Eff. Degr. Of
Freedom (DOF) Cryogenic Std B 2.99 8 Ambient Std B 0.58 8
Mismatch Factor B 1.01 8 Path Asymmetry B 3.51 8
Linearity B 1.33 8 Y-Factor B 0.41 8 Adaptor B 0.11 8 Type-A A 0.33 5
Combined Standard Uncertainty: uT = 5.0K Effective DOF = 20.7 k(95%) = 2.09 U(k=2) = 10K U(k=2.11) = 10K Table B.10: Uncertainties in measurement of noise temperature of HP346B at 30 MHz
Source (i) Type uT(i) (K) Eff. Degr. Of Freedom (DOF)
Cryogenic Std B 9.8 8 Ambient Std B 4.6 8
Mismatch Factor B 44.8 8 Path Asymmetry B 6.9 8
Linearity B 10.1 8 Y-Factor B 3.9 8 Adaptor B 39.3 8 Type-A A 4.5 11
Combined Standard Uncertainty: uT = 62K Effective DOF = 18.5 k(95%) = 2.10 U(k=2) = 124K U(k=2.11) = 130K
Page 30 of 38
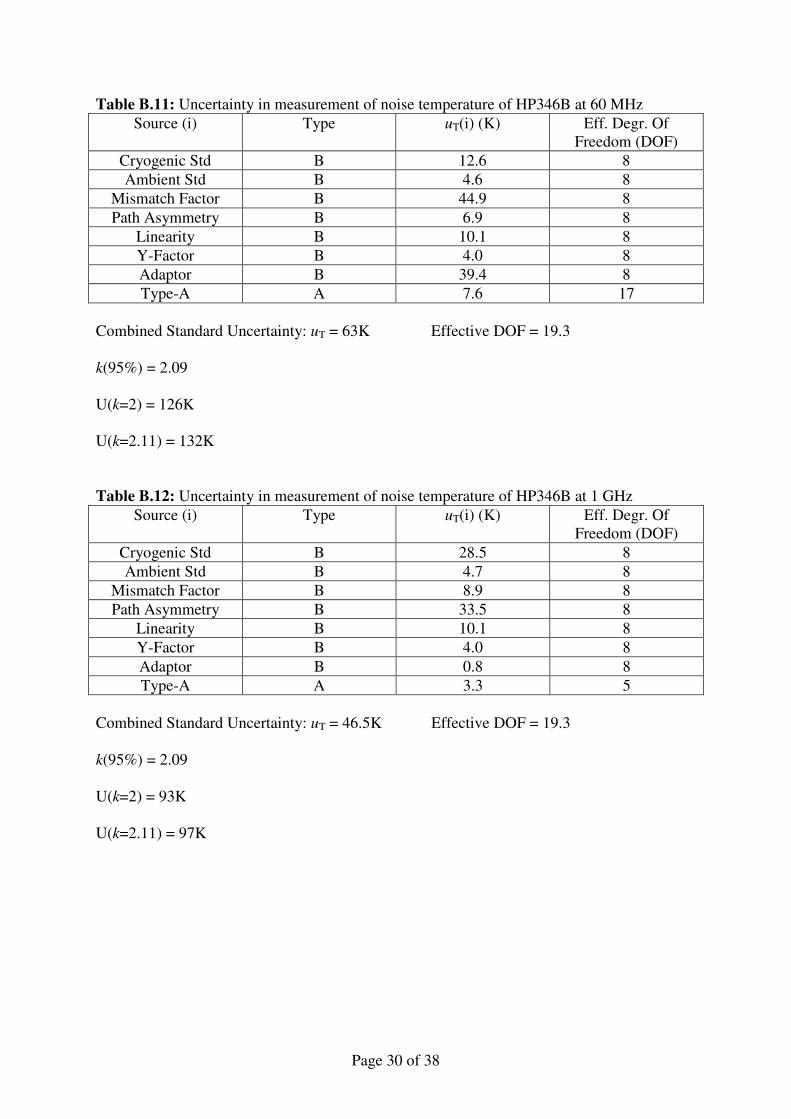
Table B.11: Uncertainty in measurement of noise temperature of HP346B at 60 MHz Source (i) Type uT(i) (K) Eff. Degr. Of
Freedom (DOF) Cryogenic Std B 12.6 8 Ambient Std B 4.6 8
Mismatch Factor B 44.9 8 Path Asymmetry B 6.9 8
Linearity B 10.1 8 Y-Factor B 4.0 8 Adaptor B 39.4 8 Type-A A 7.6 17
Combined Standard Uncertainty: uT = 63K Effective DOF = 19.3 k(95%) = 2.09 U(k=2) = 126K U(k=2.11) = 132K Table B.12: Uncertainty in measurement of noise temperature of HP346B at 1 GHz
Source (i) Type uT(i) (K) Eff. Degr. Of Freedom (DOF)
Cryogenic Std B 28.5 8 Ambient Std B 4.7 8
Mismatch Factor B 8.9 8 Path Asymmetry B 33.5 8
Linearity B 10.1 8 Y-Factor B 4.0 8 Adaptor B 0.8 8 Type-A A 3.3 5
Combined Standard Uncertainty: uT = 46.5K Effective DOF = 19.3 k(95%) = 2.09 U(k=2) = 93K U(k=2.11) = 97K
Page 31 of 38
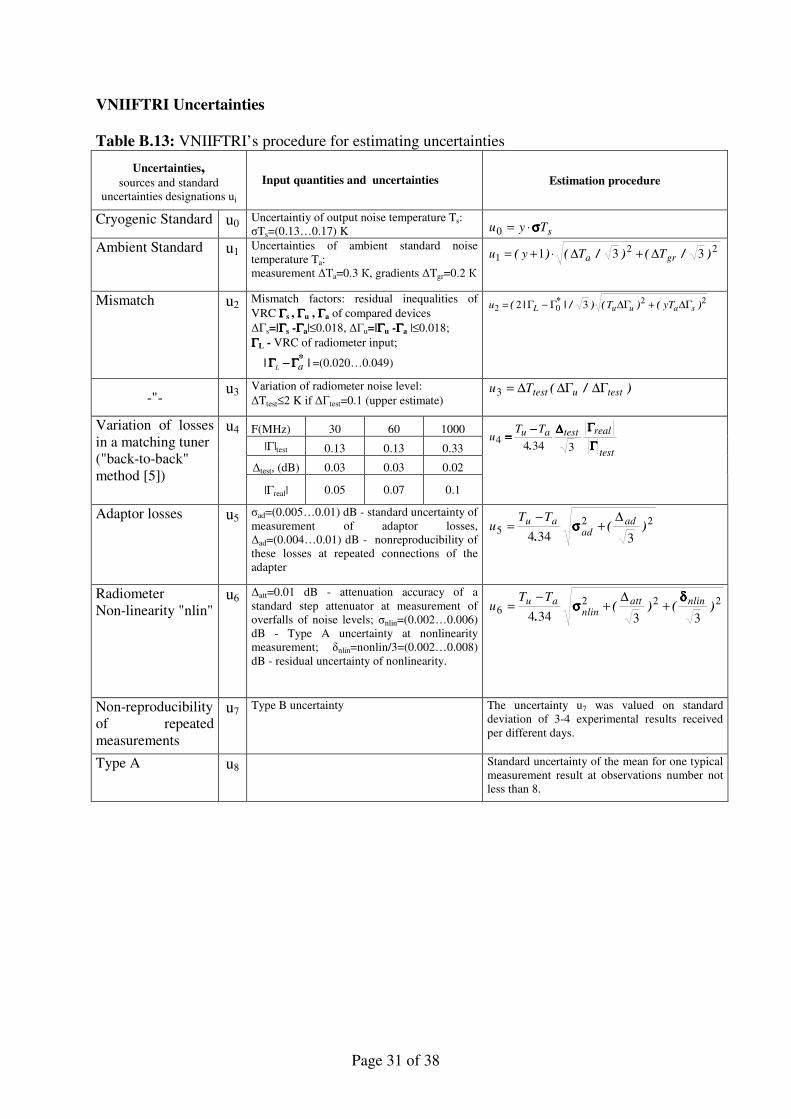
VNIIFTRI Uncertainties Table B.13: VNIIFTRI’s procedure for estimating uncertainties
Uncertainties, sources and standard
uncertainties designations ui
Input quantities and uncertainties Estimation procedure
Cryogenic Standard u0 Uncertaintiy of output noise temperature Ts: &Ts=(0.13…0.17) K sTyu σσσσ⋅=0
Ambient Standard u1 Uncertainties of ambient standard noise temperature Ta: measurement 'Ta=0.3 , gradients 'Tgr=0.2
221 331 )/()/()( gra TTyu ∆+∆⋅+=
Mismatch u2 Mismatch factors: residual inequalities of VRC ΓΓΓΓs , ΓΓΓΓu , ΓΓΓΓa of compared devices 'Γs=|ΓΓΓΓs -ΓΓΓΓa|≤0.018, '(u=|ΓΓΓΓu -ΓΓΓΓa |≤0.018; ΓΓΓΓL - VRC of radiometer input;
|| *aL ΓΓΓΓ−−−−ΓΓΓΓ =(0.020…0.049)
2202 32 )()()/||( *
sauuL yTTu ∆Γ+∆ΓΓ−Γ=
-"- u3 Variation of radiometer noise level:
'Ttest≤2 K if '(test=0.1 (upper estimate)
)/( testutestTu ∆Γ∆Γ∆=3
F(MHz) 30 60 1000 |Γ|test 0.13 0.13 0.33
'test, (dB) 0.03 0.03 0.02
Variation of losses in a matching tuner ("back-to-back" method [5])
u4
|Γreal| 0.05 0.07 0.1
test
realtestau TTu
ΓΓΓΓΓΓΓΓ∆∆∆∆−−−−====
33444 .
Adaptor losses u5 &ad=(0.005…0.01) dB - standard uncertainty of measurement of adaptor losses, 'ad=(0.004…0.01) dB - nonreproducibility of these losses at repeated connections of the adapter
225
3344)(
.ad
adau TT
u∆
+−
= σσσσ
Radiometer Non-linearity "nlin"
u6 'att=0.01 dB - attenuation accuracy of a standard step attenuator at measurement of overfalls of noise levels; &nlin=(0.002…0.006) dB - Type A uncertainty at nonlinearity measurement; )nlin=nonlin/3=(0.002…0.008) dB - residual uncertainty of nonlinearity.
2226
33344)()(
.nlinatt
nlinau TT
uδδδδ
σσσσ +∆
+−
=
Non-reproducibility of repeated measurements
u7 Type B uncertainty The uncertainty u7 was valued on standard deviation of 3-4 experimental results received per different days.
Type A u8
Standard uncertainty of the mean for one typical measurement result at observations number not less than 8.
Page 32 of 38
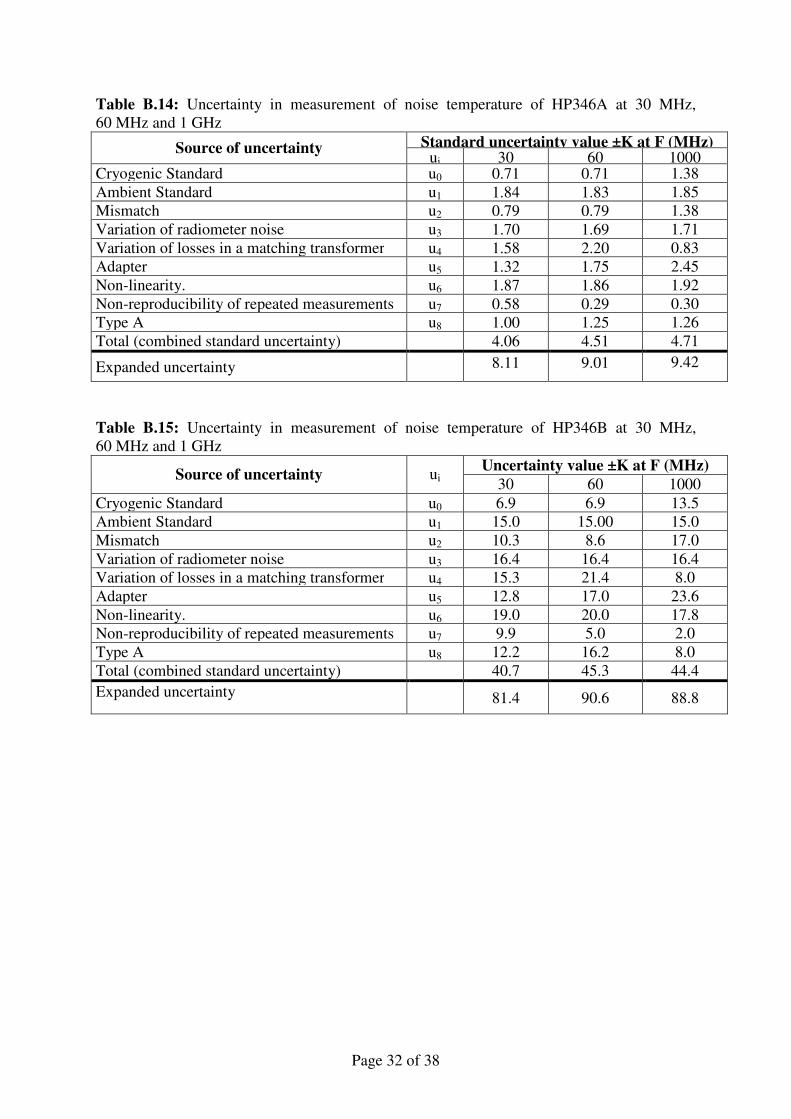
Table B.14: Uncertainty in measurement of noise temperature of HP346A at 30 MHz, 60 MHz and 1 GHz
Standard uncertainty value ±K at F (MHz) Source of uncertainty ui 30 60 1000 Cryogenic Standard u0 0.71 0.71 1.38 Ambient Standard u1 1.84 1.83 1.85 Mismatch u2 0.79 0.79 1.38 Variation of radiometer noise u3 1.70 1.69 1.71 Variation of losses in a matching transformer u4 1.58 2.20 0.83 Adapter u5 1.32 1.75 2.45 Non-linearity. u6 1.87 1.86 1.92 Non-reproducibility of repeated measurements u7 0.58 0.29 0.30 Type A u8 1.00 1.25 1.26 Total (combined standard uncertainty) 4.06 4.51 4.71
Expanded uncertainty 8.11 9.01 9.42
Table B.15: Uncertainty in measurement of noise temperature of HP346B at 30 MHz, 60 MHz and 1 GHz
Uncertainty value ±K at F (MHz) Source of uncertainty ui 30 60 1000 Cryogenic Standard u0 6.9 6.9 13.5 Ambient Standard u1 15.0 15.00 15.0 Mismatch u2 10.3 8.6 17.0 Variation of radiometer noise u3 16.4 16.4 16.4 Variation of losses in a matching transformer u4 15.3 21.4 8.0 Adapter u5 12.8 17.0 23.6 Non-linearity. u6 19.0 20.0 17.8 Non-reproducibility of repeated measurements u7 9.9 5.0 2.0 Type A u8 12.2 16.2 8.0 Total (combined standard uncertainty) 40.7 45.3 44.4 Expanded uncertainty 81.4 90.6 88.8
Page 33 of 38
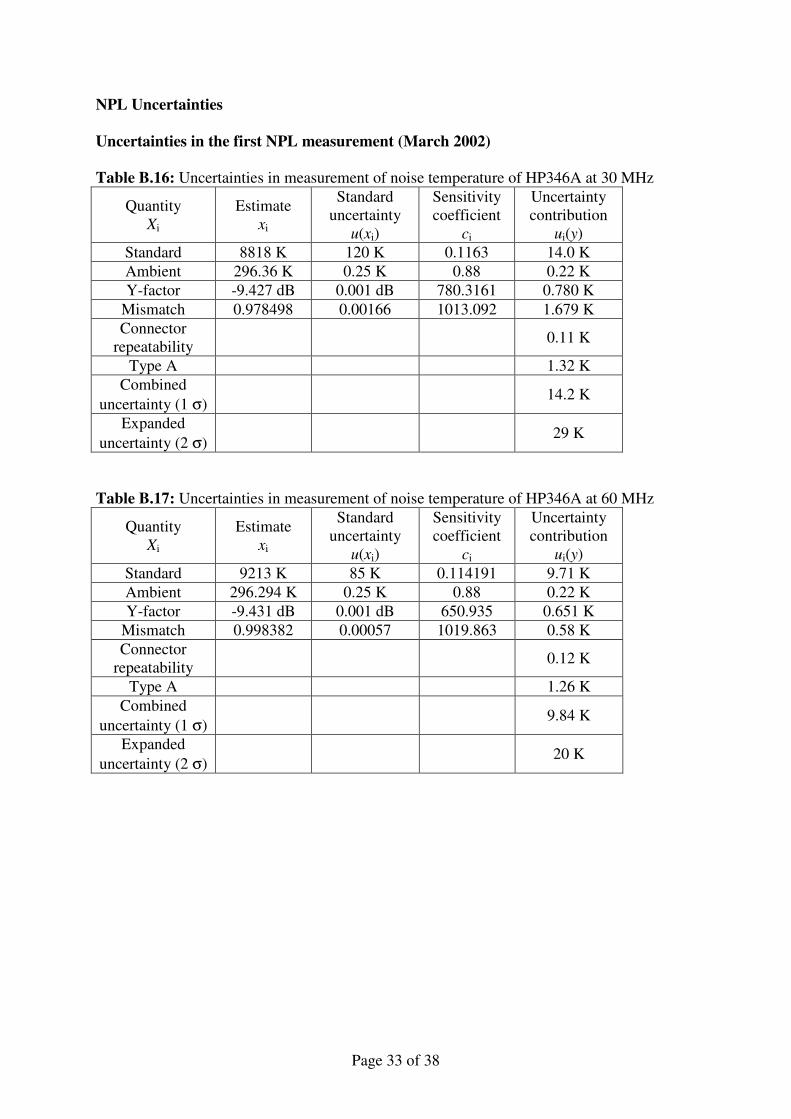
NPL Uncertainties Uncertainties in the first NPL measurement (March 2002)
Table B.16: Uncertainties in measurement of noise temperature of HP346A at 30 MHz
Quantity Xi
Estimate xi
Standard uncertainty
u(xi)
Sensitivity coefficient
ci
Uncertainty contribution
ui(y) Standard 8818 K 120 K 0.1163 14.0 K Ambient 296.36 K 0.25 K 0.88 0.22 K Y-factor -9.427 dB 0.001 dB 780.3161 0.780 K
Mismatch 0.978498 0.00166 1013.092 1.679 K Connector
repeatability 0.11 K
Type A 1.32 K Combined
uncertainty (1 σ) 14.2 K
Expanded uncertainty (2 σ)
29 K
Table B.17: Uncertainties in measurement of noise temperature of HP346A at 60 MHz
Quantity Xi
Estimate xi
Standard uncertainty
u(xi)
Sensitivity coefficient
ci
Uncertainty contribution
ui(y) Standard 9213 K 85 K 0.114191 9.71 K Ambient 296.294 K 0.25 K 0.88 0.22 K Y-factor -9.431 dB 0.001 dB 650.935 0.651 K
Mismatch 0.998382 0.00057 1019.863 0.58 K Connector
repeatability 0.12 K
Type A 1.26 K Combined
uncertainty (1 σ) 9.84 K
Expanded uncertainty (2 σ)
20 K
Page 34 of 38
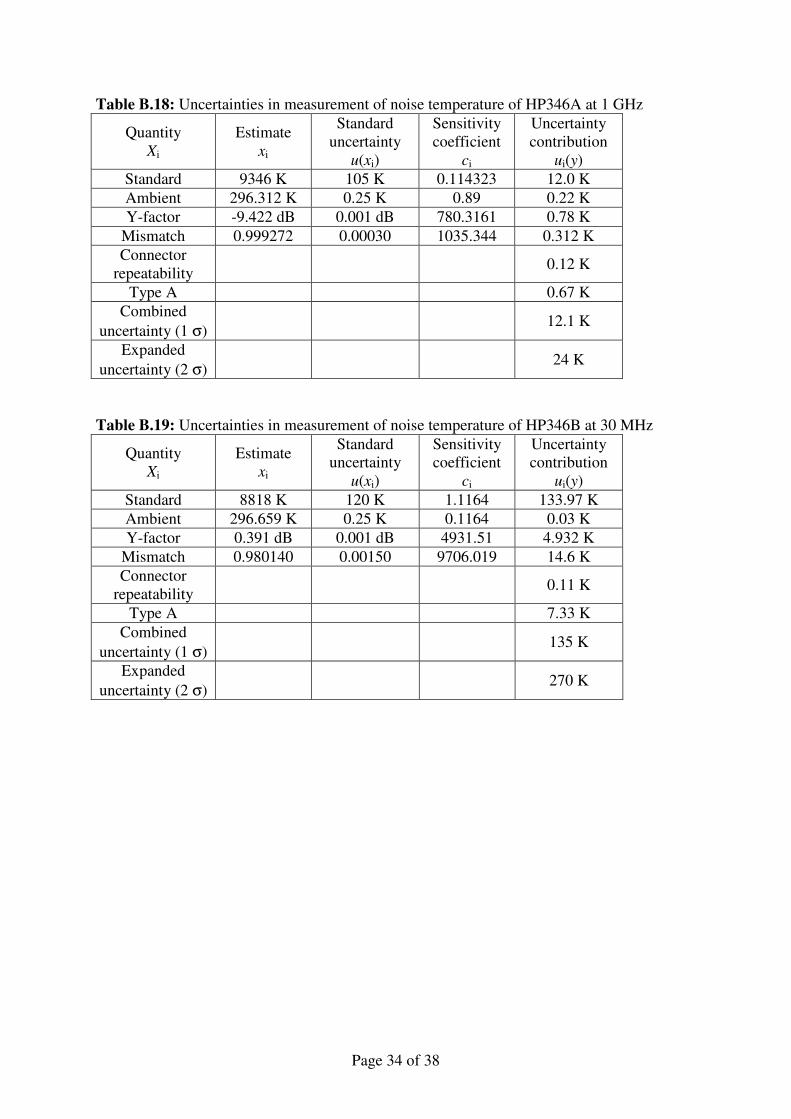
Table B.18: Uncertainties in measurement of noise temperature of HP346A at 1 GHz
Quantity Xi
Estimate xi
Standard uncertainty
u(xi)
Sensitivity coefficient
ci
Uncertainty contribution
ui(y) Standard 9346 K 105 K 0.114323 12.0 K Ambient 296.312 K 0.25 K 0.89 0.22 K Y-factor -9.422 dB 0.001 dB 780.3161 0.78 K
Mismatch 0.999272 0.00030 1035.344 0.312 K Connector
repeatability 0.12 K
Type A 0.67 K Combined
uncertainty (1 σ) 12.1 K
Expanded uncertainty (2 σ)
24 K
Table B.19: Uncertainties in measurement of noise temperature of HP346B at 30 MHz
Quantity Xi
Estimate xi
Standard uncertainty
u(xi)
Sensitivity coefficient
ci
Uncertainty contribution
ui(y) Standard 8818 K 120 K 1.1164 133.97 K Ambient 296.659 K 0.25 K 0.1164 0.03 K Y-factor 0.391 dB 0.001 dB 4931.51 4.932 K
Mismatch 0.980140 0.00150 9706.019 14.6 K Connector
repeatability 0.11 K
Type A 7.33 K Combined
uncertainty (1 σ) 135 K
Expanded uncertainty (2 σ)
270 K
Page 35 of 38
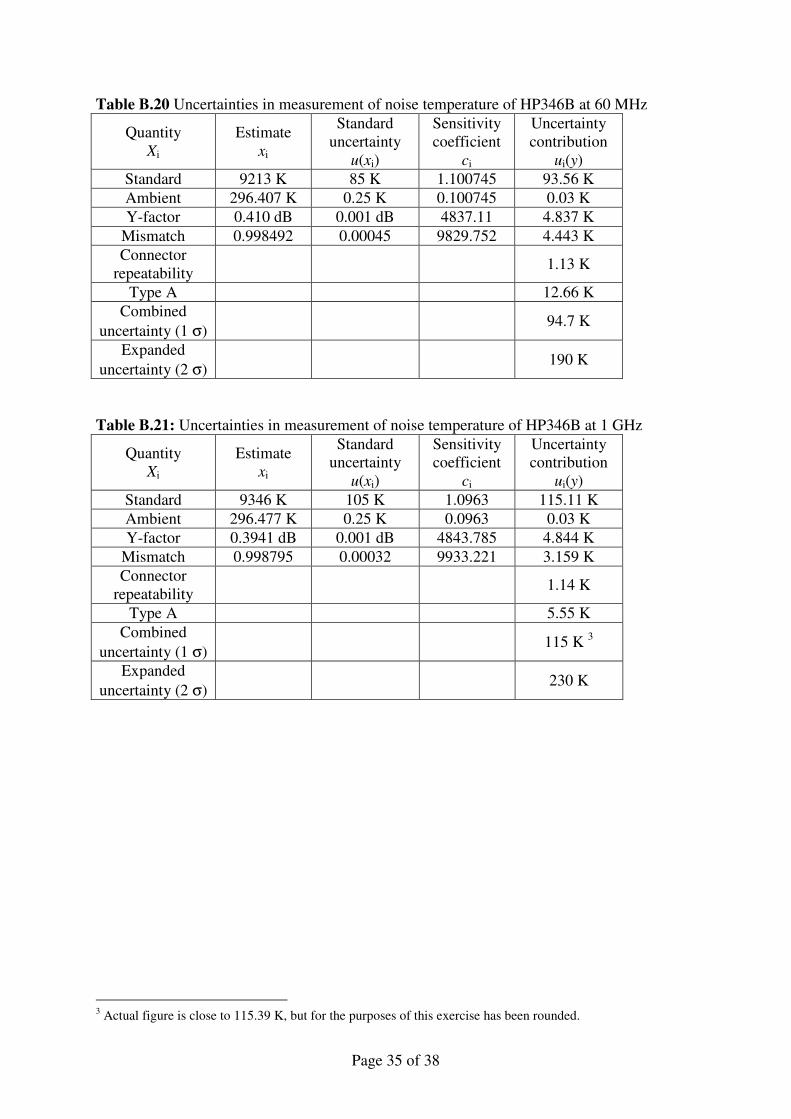
Table B.20 Uncertainties in measurement of noise temperature of HP346B at 60 MHz
Quantity Xi
Estimate xi
Standard uncertainty
u(xi)
Sensitivity coefficient
ci
Uncertainty contribution
ui(y) Standard 9213 K 85 K 1.100745 93.56 K Ambient 296.407 K 0.25 K 0.100745 0.03 K Y-factor 0.410 dB 0.001 dB 4837.11 4.837 K
Mismatch 0.998492 0.00045 9829.752 4.443 K Connector
repeatability 1.13 K
Type A 12.66 K Combined
uncertainty (1 σ) 94.7 K
Expanded uncertainty (2 σ)
190 K
Table B.21: Uncertainties in measurement of noise temperature of HP346B at 1 GHz
Quantity Xi
Estimate xi
Standard uncertainty
u(xi)
Sensitivity coefficient
ci
Uncertainty contribution
ui(y) Standard 9346 K 105 K 1.0963 115.11 K Ambient 296.477 K 0.25 K 0.0963 0.03 K Y-factor 0.3941 dB 0.001 dB 4843.785 4.844 K
Mismatch 0.998795 0.00032 9933.221 3.159 K Connector
repeatability 1.14 K
Type A 5.55 K Combined
uncertainty (1 σ) 115 K 3
Expanded uncertainty (2 σ)
230 K
3 Actual figure is close to 115.39 K, but for the purposes of this exercise has been rounded.
Page 36 of 38
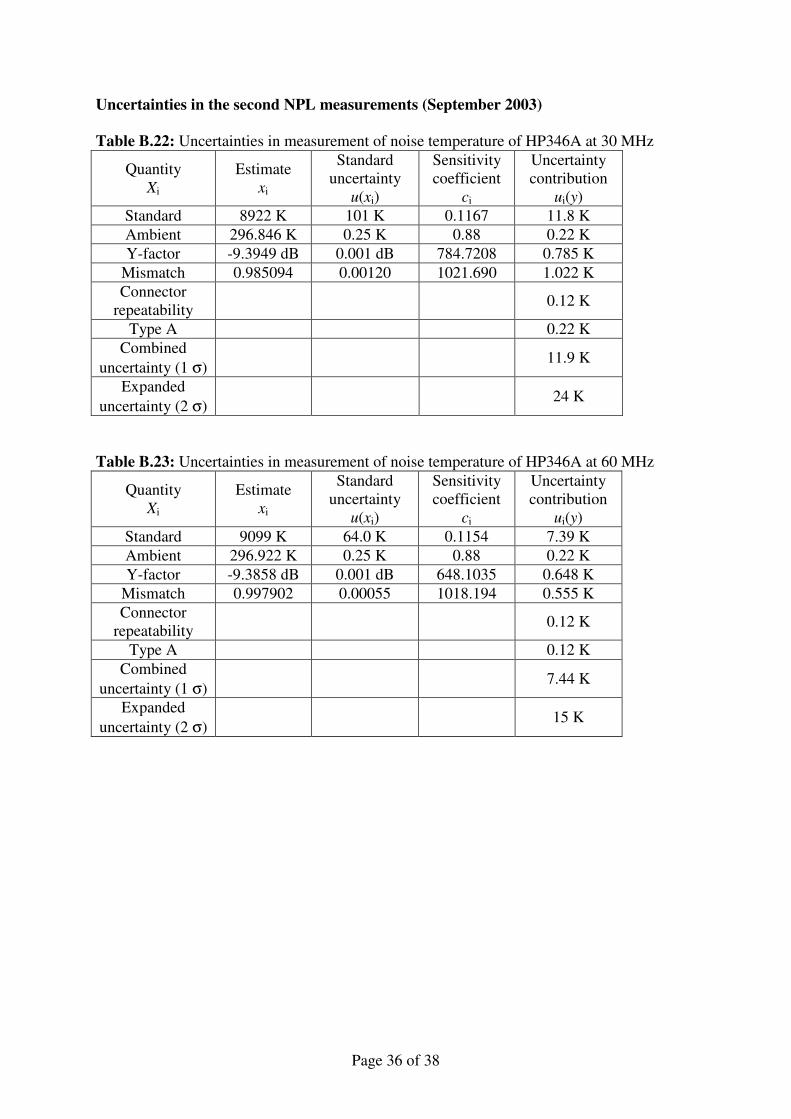
Uncertainties in the second NPL measurements (September 2003) Table B.22: Uncertainties in measurement of noise temperature of HP346A at 30 MHz
Quantity Xi
Estimate xi
Standard uncertainty
u(xi)
Sensitivity coefficient
ci
Uncertainty contribution
ui(y) Standard 8922 K 101 K 0.1167 11.8 K Ambient 296.846 K 0.25 K 0.88 0.22 K Y-factor -9.3949 dB 0.001 dB 784.7208 0.785 K
Mismatch 0.985094 0.00120 1021.690 1.022 K Connector
repeatability 0.12 K
Type A 0.22 K Combined
uncertainty (1 σ) 11.9 K
Expanded uncertainty (2 σ)
24 K
Table B.23: Uncertainties in measurement of noise temperature of HP346A at 60 MHz
Quantity Xi
Estimate xi
Standard uncertainty
u(xi)
Sensitivity coefficient
ci
Uncertainty contribution
ui(y) Standard 9099 K 64.0 K 0.1154 7.39 K Ambient 296.922 K 0.25 K 0.88 0.22 K Y-factor -9.3858 dB 0.001 dB 648.1035 0.648 K
Mismatch 0.997902 0.00055 1018.194 0.555 K Connector
repeatability 0.12 K
Type A 0.12 K Combined
uncertainty (1 σ) 7.44 K
Expanded uncertainty (2 σ)
15 K

Page 37 of 38
Table B.24: Uncertainties in measurement of noise temperature of HP346A at 1 GHz
Quantity Xi
Estimate xi
Standard uncertainty
u(xi)
Sensitivity coefficient
ci
Uncertainty contribution
ui(y) Standard 9030 K 47.0 K 0.1177 5.53 K Ambient 296.850 K 0.25 K 0.88 0.22 K Y-factor -9.2917 dB 0.001 dB 624.4073 0.624 K
Mismatch 0.999758 0.00012 1028.52 0.126 K Connector
repeatability 0.12 K
Type A 0.07 K Combined
uncertainty (1 σ) 5.58 K
Expanded uncertainty (2 σ)
11 K
Table B.25: Uncertainties in measurement of noise temperature of HP346B at 30 MHz
Quantity Xi
Estimate xi
Standard uncertainty
u(xi)
Sensitivity coefficient
ci
Uncertainty contribution
ui(y) Standard 8922 K 101 K 0.1175 112.87 K Ambient 296.913 K 0.25 K 0.1175 0.03 K Y-factor 0.4258 dB 0.001 dB 4978.771 4.979 K
Mismatch 0.987041 0.00140 9764.814 13.640 K Connector
repeatability 1.11 K
Type A 1.07 K Combined
uncertainty (1 σ) 114 K
Expanded uncertainty (2 σ)
230 K
Page 38 of 38
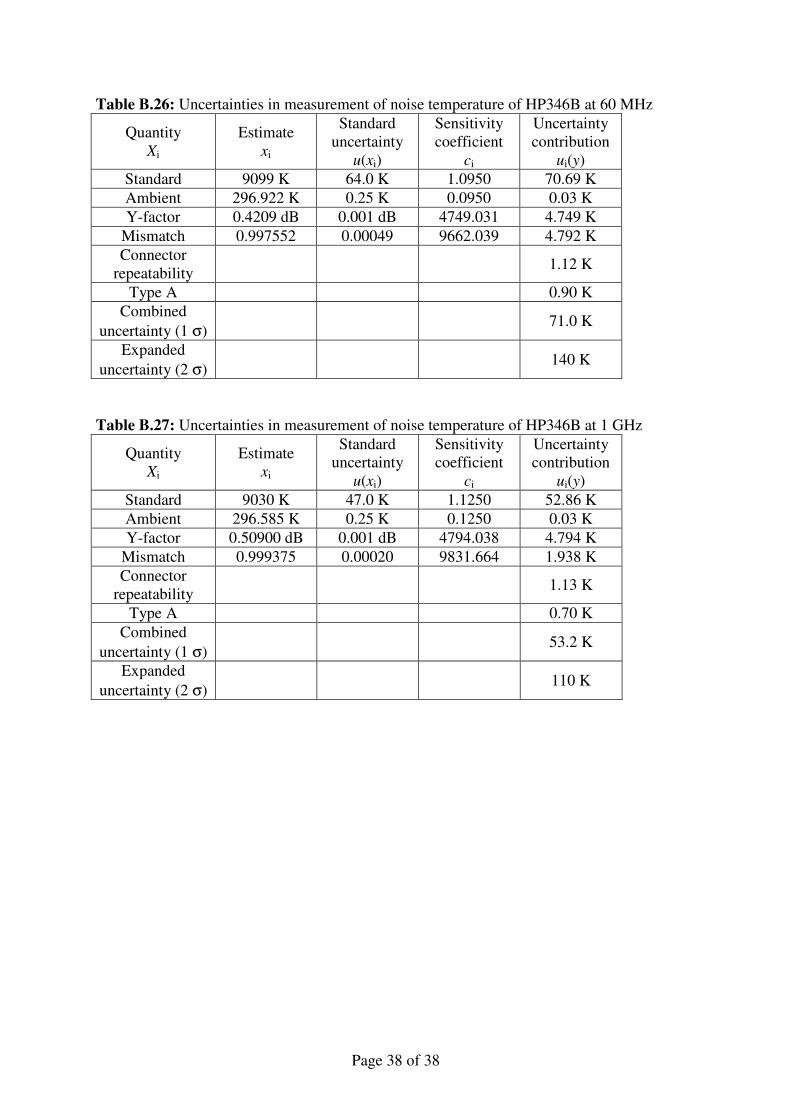
Table B.26: Uncertainties in measurement of noise temperature of HP346B at 60 MHz
Quantity Xi
Estimate xi
Standard uncertainty
u(xi)
Sensitivity coefficient
ci
Uncertainty contribution
ui(y) Standard 9099 K 64.0 K 1.0950 70.69 K Ambient 296.922 K 0.25 K 0.0950 0.03 K Y-factor 0.4209 dB 0.001 dB 4749.031 4.749 K
Mismatch 0.997552 0.00049 9662.039 4.792 K Connector
repeatability 1.12 K
Type A 0.90 K Combined
uncertainty (1 σ) 71.0 K
Expanded uncertainty (2 σ)
140 K
Table B.27: Uncertainties in measurement of noise temperature of HP346B at 1 GHz
Quantity Xi
Estimate xi
Standard uncertainty
u(xi)
Sensitivity coefficient
ci
Uncertainty contribution
ui(y) Standard 9030 K 47.0 K 1.1250 52.86 K Ambient 296.585 K 0.25 K 0.1250 0.03 K Y-factor 0.50900 dB 0.001 dB 4794.038 4.794 K
Mismatch 0.999375 0.00020 9831.664 1.938 K Connector
repeatability 1.13 K
Type A 0.70 K Combined
uncertainty (1 σ) 53.2 K
Expanded uncertainty (2 σ)
110 K