Third interlaboratory comparison exercise for δD … · Third interlaboratory comparison exercise...
49
Third interlaboratory comparison exercise for δD and δ 18 O analysis of water samples (WICO2002-Part I) Report prepared by M. Gröning, S. Graeber, S.K. Bhattacharya, M. van Duren , L. Andreescu Isotope Hydrology Laboratory Physics, Chemistry and Instrumentation Laboratory Agency’s Laboratories Seibersdorf International Atomic Energy Agency Vienna, May 2003
Transcript of Third interlaboratory comparison exercise for δD … · Third interlaboratory comparison exercise...
Third interlaboratory comparison exercise for δD and δ18O analysis of
water samples (WICO2002-Part I) Report prepared by
M. Gröning, S. Graeber, S.K. Bhattacharya, M. van Duren , L. Andreescu
Isotope Hydrology Laboratory
Physics, Chemistry and Instrumentation Laboratory
Agency’s Laboratories Seibersdorf
International Atomic Energy Agency
Vienna, May 2003
ii
FOREWORD
The third interlaboratory comparison for stable isotopes in water samples was performed with the intention to provide means to self-assess the quality of measurements as performed in isotope hydrology laboratories and to further improve the consistency of data as provided by different laboratories. In view of the experience of past exercises, more elaborated schemes were used for data evaluation and assessment, and the high number of laboratories accepting those new rules underlines the importance of such exercises as additional valuable means to check the performance and improve the quality of stable isotope measurements in accordance with international trends.
The long tradition of the IAEA in organizing such interlaboratory comparisons (the first two exercises not counted here were already performed in the Sixties and Seventies of the last century) is also a challenge to further improve the information dissemination to laboratories to stimulate the consistent application of rules for analytical measurements which could finally result in an internationally accepted set of guidelines on “how to perform water stable isotope measurements”.
iii
CONTENTS
TABLE OF FIGURES ............................................................................................................. IV
1. INTRODUCTION ............................................................................................................ 1
2. SAMPLE PREPARATION AND REFERENCE VALUE ASSIGNMENT ................... 1
3. EVALUATION AND PRESENTATION OF THE REPORTED DATA ....................... 4
3.1. First screening..................................................................................................... 4
3.2. Statistical methods.............................................................................................. 5
3.3. Presentation of the results................................................................................... 6
3.4. Performance rating ........................................................................................... 15
4. QUALITY ASSURANCE AND POSSIBLE IMPROVEMENTS ................................ 18
4.1. Basic quality assurance issues .......................................................................... 19
4.2. Important QA parameters for WICO2002........................................................ 19
4.2.1. Routine measurement versus sample calibration.................................. 21
4.2.2. Number of internal laboratory water standards used ............................ 21
4.2.3. Type of mass spectrometer used........................................................... 21
4.2.4. Measurement method for δ2H analysis ................................................. 22
4.2.5. Water-CO2 equilibration time for δ18O analysis................................... 22
4.2.6. Amount of water used for δ18O water-CO2 equilibration ..................... 22
4.3. Recommendations to improve the quality of measurements............................ 22
5. CONCLUSIONS ............................................................................................................ 23
6. REFERENCES ............................................................................................................... 23
APPENDIX I. LISTING OF RESULTS FOR ALL FOUR SAMPLES................................ 25
APPENDIX II. LIST OF PARTICIPANTS ............................................................................ 31
APPENDIX III. WICO2002 ANNOUNCEMENT .................................................................. 40
APPENDIX IV. LABORATORY REPORTING SHEET .............................................. 42
iv
TABLE OF FIGURES
Figure 1: Modified commercial sample distillation apparatus to ensure total recovery of water by distilling from water storage drum to other drum without contact to atmosphere. ......................... 2
Figure 2: Storage drum for water samples. Sample outflow through valve at top driven by slight argon gas overpressure in drum headspace. .............................................................................................. 2
Figure 3: S-shape plot for δ18O values of sample IAEA-OH-5. Values outside the plot range are not shown. Outliers as recognized during the statistical evaluation are marked by open symbols. ...... 8
Figure 4: S-shape plot for δ18O values of sample IAEA-OH-6. Values outside the plot range are not shown. Outliers as recognized during the statistical evaluation are marked by open symbols. ...... 8
Figure 5: S-shape plot for δ18O values of sample IAEA-OH-7. Values outside the plot range are not shown. Outliers as recognized during the statistical evaluation are marked by open symbols. ...... 9
Figure 6: S-shape plot for δ18O values on sample IAEA-OH-8. Values outside the plot range are not shown. Outliers as recognized during the statistical evaluation are marked by open symbols. ...... 9
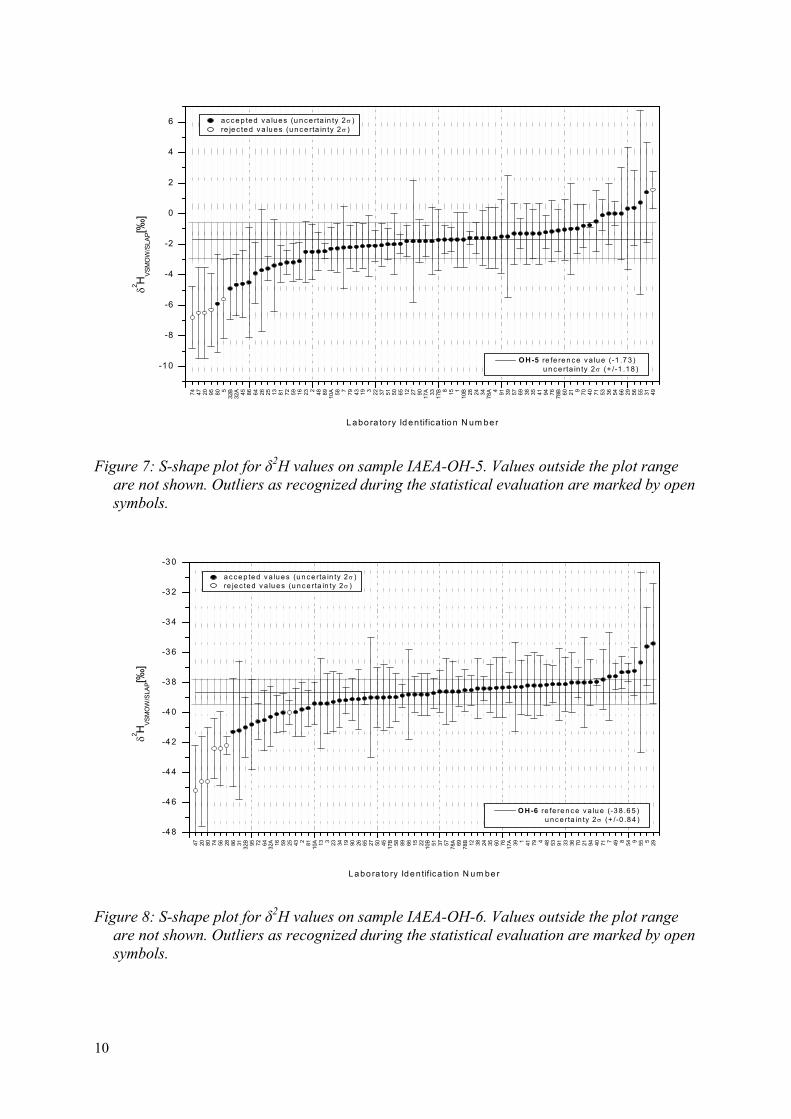
Figure 7: S-shape plot for δ2H values on sample IAEA-OH-5. Values outside the plot range are not shown. Outliers as recognized during the statistical evaluation are marked by open symbols. .... 10
Figure 8: S-shape plot for δ2H values on sample IAEA-OH-6. Values outside the plot range are not shown. Outliers as recognized during the statistical evaluation are marked by open symbols. .... 10
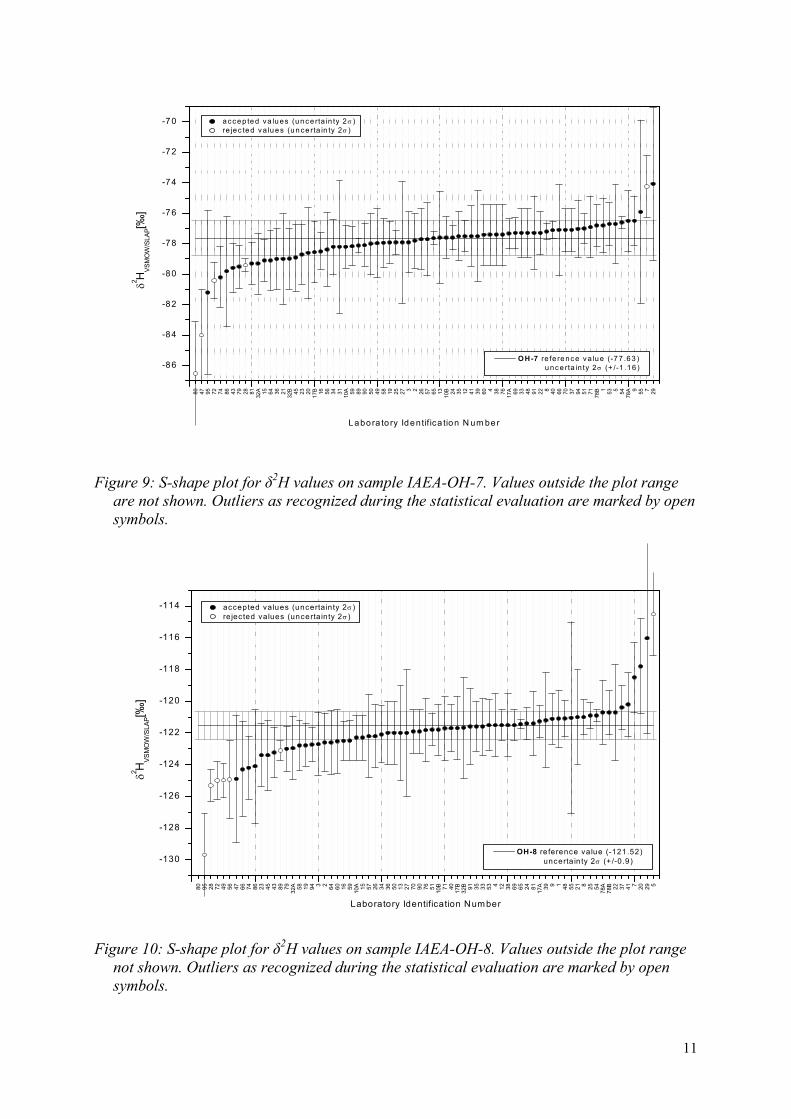
Figure 9: S-shape plot for δ2H values on sample IAEA-OH-7. Values outside the plot range are not shown. Outliers as recognized during the statistical evaluation are marked by open symbols. .... 11
Figure 10: S-shape plot for δ2H values on sample IAEA-OH-8. Values outside the plot range not shown. Outliers as recognized during the statistical evaluation are marked by open symbols. .... 11
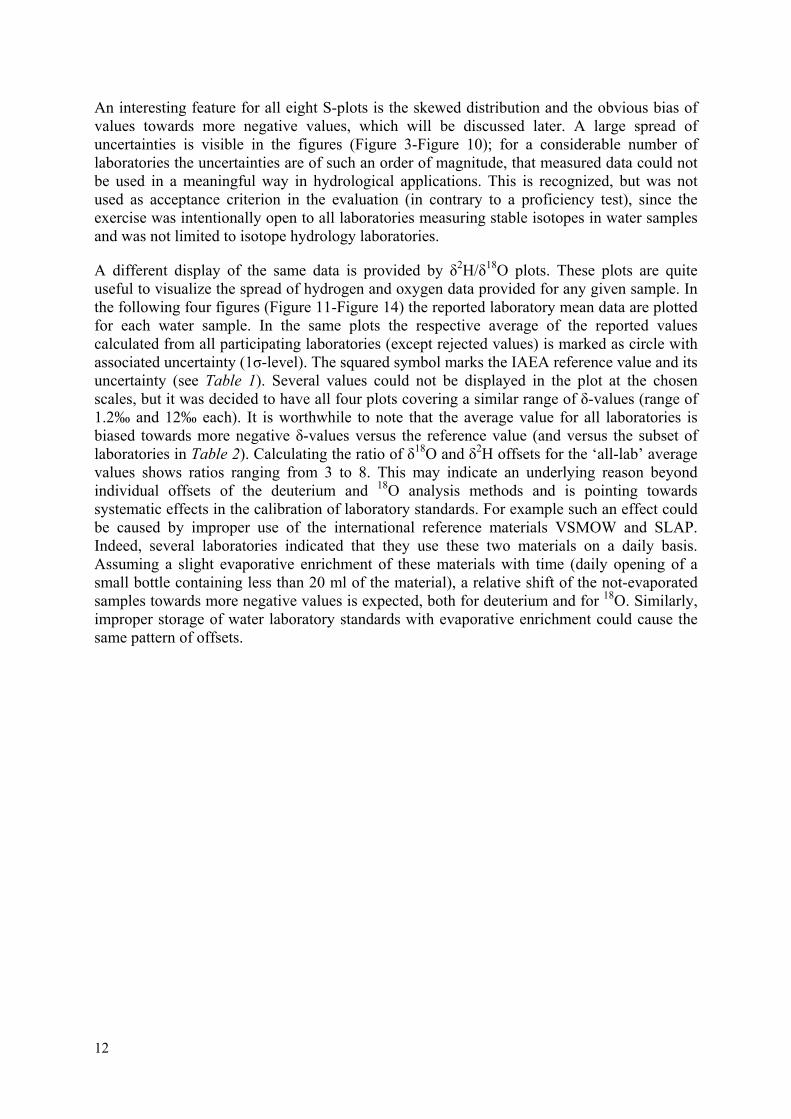
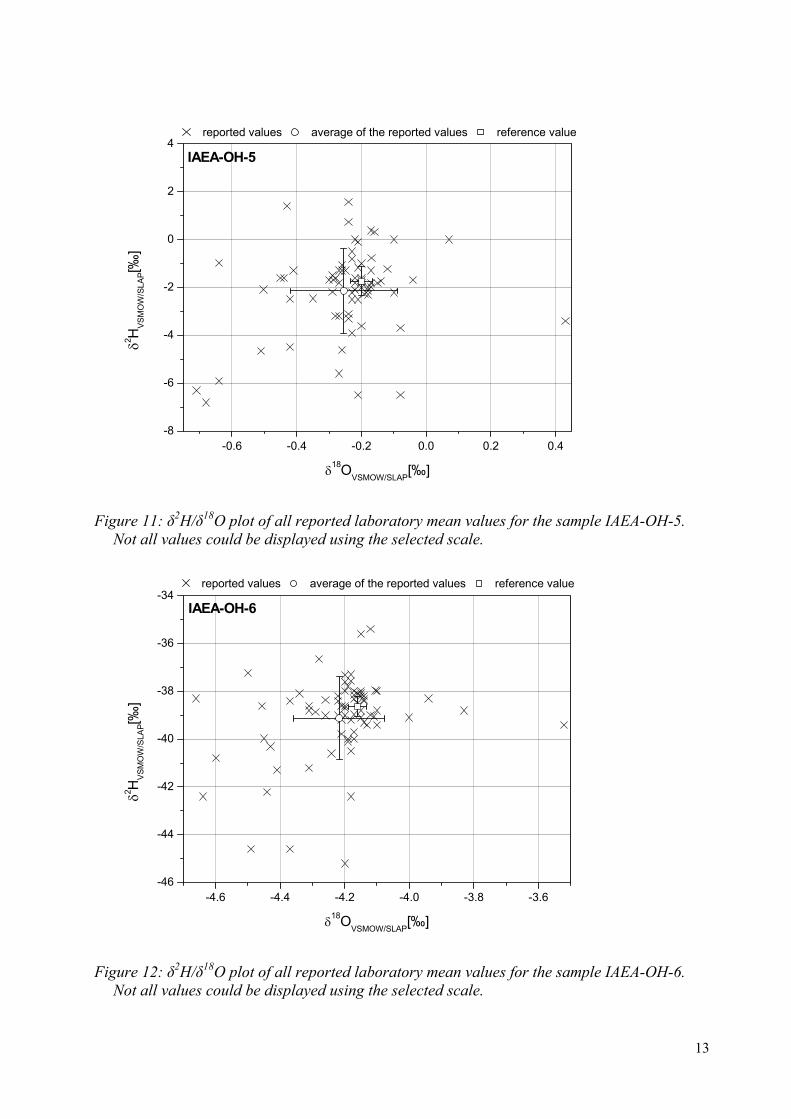
Figure 11: δ2H/δ18O plot of all reported laboratory mean values for the sample IAEA-OH-5. Not all values could be displayed using the selected scale........................................................................ 13
Figure 12: δ2H/δ18O plot of all reported laboratory mean values for the sample IAEA-OH-6. Not all values could be displayed using the selected scale........................................................................ 13
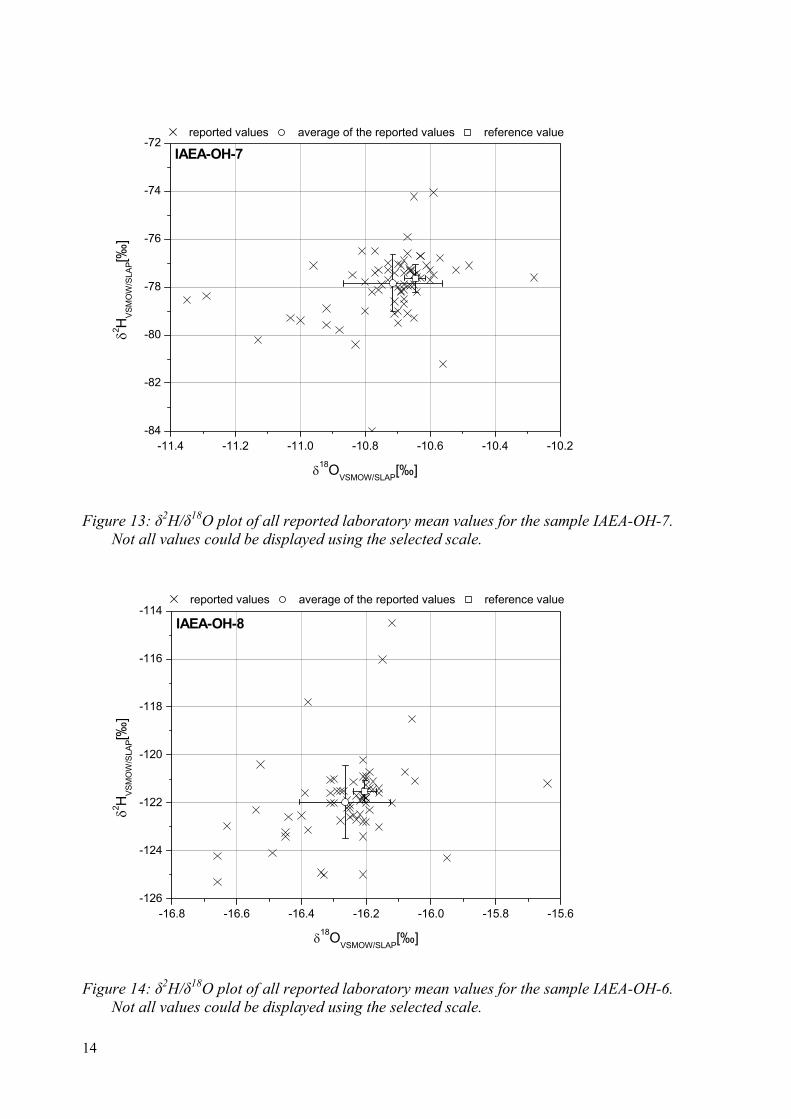
Figure 13: δ2H/δ18O plot of all reported laboratory mean values for the sample IAEA-OH-7. Not all values could be displayed using the selected scale........................................................................ 14
Figure 14: δ2H/δ18O plot of all reported laboratory mean values for the sample IAEA-OH-6. Not all values could be displayed using the selected scale........................................................................ 14
Figure 15: Deviation of δ18O results versus reference values for all four samples analyzed by each laboratory and sorted by increasing deviation............................................................................... 15
Figure 16: Deviation of δ2H results versus reference values for all four samples analyzed by each laboratory and sorted by increasing deviation............................................................................... 16
Figure 17: Comparison between reported δ18O uncertainty (lower part) and deviation from the reference value (upper part) for each laboratory. .......................................................................... 17
Figure 18: Comparison between reported δ2H uncertainty (lower part) and deviation from the reference value (upper part) for each laboratory. .......................................................................... 17
v
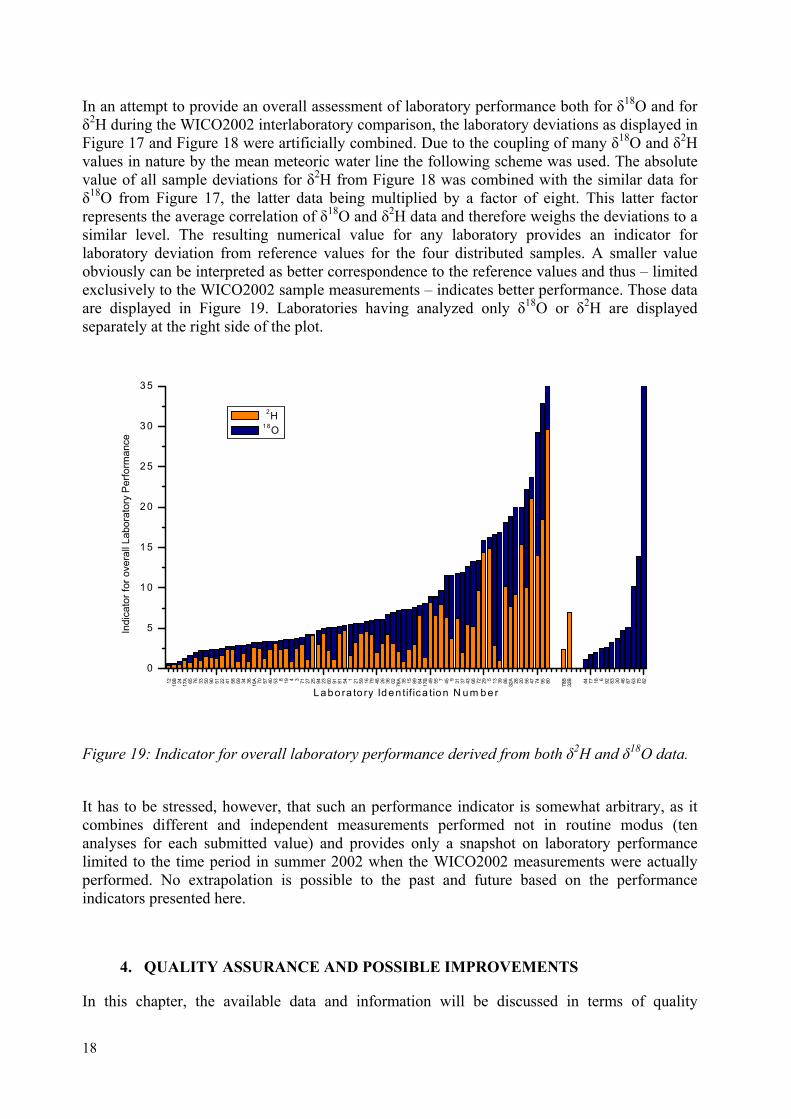
Figure 19: Indicator for overall laboratory performance derived from both δ2H and δ18O data. .......... 18

1
1. INTRODUCTION
This report describes the design and outcome of the third interlaboratory comparison exercise for laboratories engaged in routine analysis of hydrogen and oxygen stable isotope composition of water samples organized by the International Atomic Energy Agency. This Water Interlaboratory COmparison exercise WICO2002 was carried out in the framework of the IAEA Analytical Quality Control Services (AQCS) programme. Two similar exercises were carried out in 1995 [1] and in 1999 [2], the first one having been limited to laboratories participating in analyses for the IAEA Global Network for Isotopes in Precipitation, the second one having been open to all interested isotope hydrology laboratories. However, the tradition of IAEA water stable isotope intercomparison is much older. Two interlaboratory comparison trials for isotope hydrology laboratories were carried out in the sixties and seventies, which revealed problems with the use of NBS-1 international standard; these data were used to calibrate the newly produced primary reference materials VSMOW and SLAP.
The recent WICO2002 exercise was announced in May 2002 on the internet, via the ISOGEOCHEM news group on Isogeochemistry [3] and by emails to all participants of the two former intercomparisons. This exercise was split into two individual parts: Part I as reported here on the isotopic composition of water samples, and Part II on the isotopic composition of soil moisture, for which a separate report will be issued.
In view of the experience with the former exercises it was decided to request all interested laboratories to initially provide some information on their laboratory equipment and on performance relevant details, before being entitled to receive the water samples. Altogether 95 laboratories provided the requested information and received in July 2002 four water samples prepared and calibrated at the IAEA Isotope Hydrology Laboratory. These samples, labeled IAEA-OH-5 to IAEA-OH-8, will be referred to in this report as OH-5 to OH-8. By the end of the reporting deadline (end of September 2002) altogether 82 laboratories from 32 countries submitted 86 datasets back to the IAEA on the oxygen and hydrogen isotopic composition of these water samples.
The four water samples cover the range of δ18O and δ2H values typical for the majority of natural waters. The samples were bottled from 20 liter stainless steel storage barrels into 50ml double capped brown glass bottles, serially numbered at the time of filling. Each laboratory received a set of four samples with a corresponding code. This code (sorted in terms of signing in to the exercise) forms the laboratory Identification (ID) code used throughout the exercise and in the tables and graphs of this report. The ID code is not related to the order of the list of participating laboratories in the annex. The identity of participating laboratories will not be revealed unless the laboratory explicitly agrees to it.
2. SAMPLE PREPARATION AND REFERENCE VALUE ASSIGNMENT
Four barrels of water from different areas were collected prior to the start of the exercise in quantities large enough to be able to extensively test the isotopic composition and still be able to prepare a sufficiently large number of bottles to distribute to the participants.
IAEA-OH-5 (Adriatic Sea Water): The sample stems originally from the Mediterranean Sea. 20 liter of sea water was taken in July 1998 at the island Pag, Adriatic Sea, Croatia. The water was subsequently distilled at Vienna and stored in a stainless steel drum. No further preparation step took place before filling the bottles.
2
IAEA-OH-6 (Lake Neusiedl Water): The sample was taken in May 2002 at Lake Neusiedl, about 40km east of Vienna, a shallow terminal lake. The sample was filtrated and distilled at the Isotope Hydrology Laboratory and stored in a stainless steel drum.
IAEA-OH-7 (Vienna Groundwater): The sample was taken in December 2001 from a shallow well in Vienna at about two meters below groundwater level. The sample was stored untreated in a stainless steel drum.
IAEA-OH-8 (High Alpine Snow): The sample was taken in February 2002 in Grossarltal, Hohe Tauern, Salzburg, Austria, representing a snow sample from 2000m asl. The snow was subsequently melted and transported to Vienna, where the water was filtered and stored in a stainless steel drum.
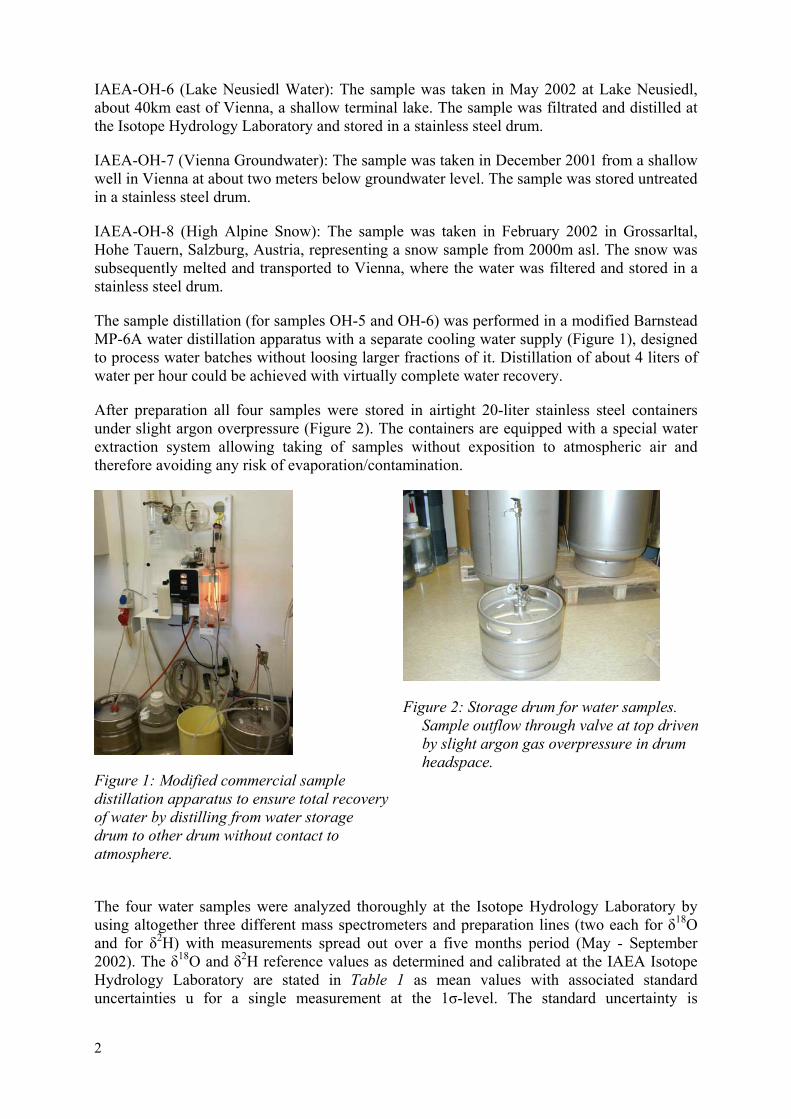
The sample distillation (for samples OH-5 and OH-6) was performed in a modified Barnstead MP-6A water distillation apparatus with a separate cooling water supply (Figure 1), designed to process water batches without loosing larger fractions of it. Distillation of about 4 liters of water per hour could be achieved with virtually complete water recovery.
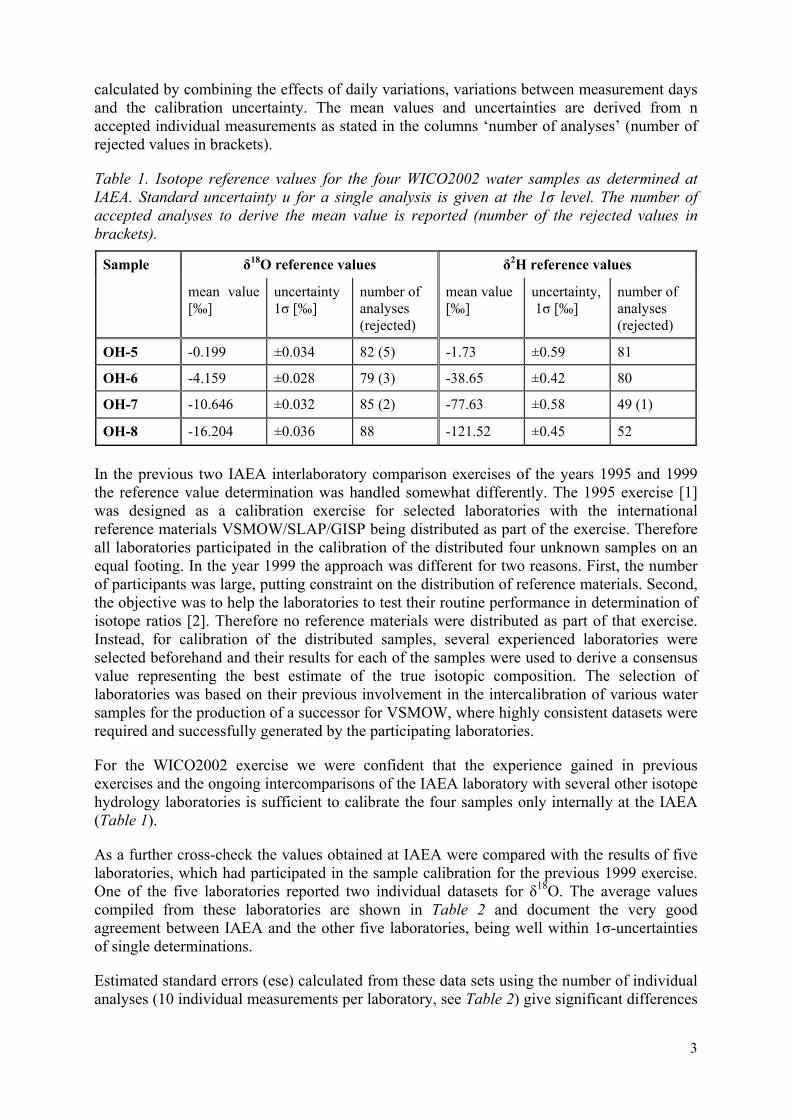
After preparation all four samples were stored in airtight 20-liter stainless steel containers under slight argon overpressure (Figure 2). The containers are equipped with a special water extraction system allowing taking of samples without exposition to atmospheric air and therefore avoiding any risk of evaporation/contamination.
Figure 1: Modified commercial sample distillation apparatus to ensure total recovery of water by distilling from water storage drum to other drum without contact to atmosphere.
Figure 2: Storage drum for water samples. Sample outflow through valve at top driven by slight argon gas overpressure in drum headspace.
The four water samples were analyzed thoroughly at the Isotope Hydrology Laboratory by using altogether three different mass spectrometers and preparation lines (two each for δ18O and for δ2H) with measurements spread out over a five months period (May - September 2002). The δ18O and δ2H reference values as determined and calibrated at the IAEA Isotope Hydrology Laboratory are stated in Table 1 as mean values with associated standard uncertainties u for a single measurement at the 1σ-level. The standard uncertainty is
3
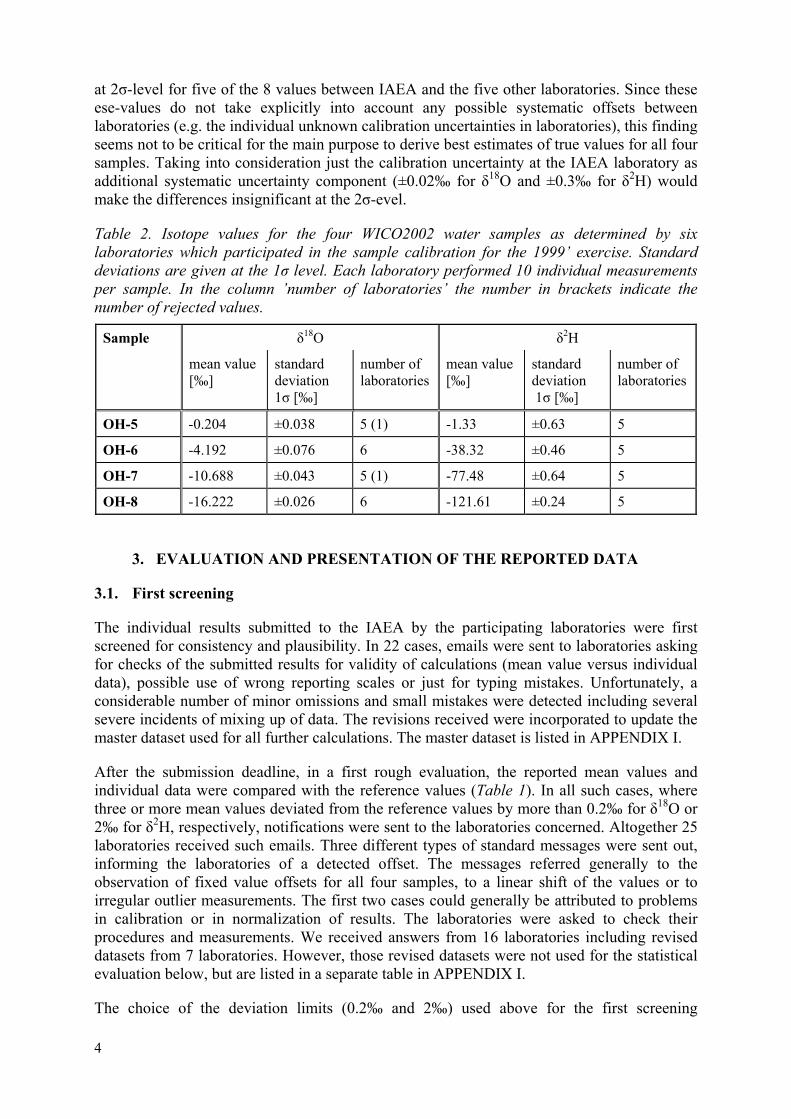
calculated by combining the effects of daily variations, variations between measurement days and the calibration uncertainty. The mean values and uncertainties are derived from n accepted individual measurements as stated in the columns ‘number of analyses’ (number of rejected values in brackets).
Table 1. Isotope reference values for the four WICO2002 water samples as determined at IAEA. Standard uncertainty u for a single analysis is given at the 1σ level. The number of accepted analyses to derive the mean value is reported (number of the rejected values in brackets).
δ18O reference values δ2H reference values Sample
mean value [‰]
uncertainty 1σ [‰]
number of analyses (rejected)
mean value[‰]
uncertainty, 1σ [‰]
number of analyses (rejected)
OH-5 -0.199 ±0.034 82 (5) -1.73 ±0.59 81
OH-6 -4.159 ±0.028 79 (3) -38.65 ±0.42 80
OH-7 -10.646 ±0.032 85 (2) -77.63 ±0.58 49 (1)
OH-8 -16.204 ±0.036 88 -121.52 ±0.45 52
In the previous two IAEA interlaboratory comparison exercises of the years 1995 and 1999 the reference value determination was handled somewhat differently. The 1995 exercise [1] was designed as a calibration exercise for selected laboratories with the international reference materials VSMOW/SLAP/GISP being distributed as part of the exercise. Therefore all laboratories participated in the calibration of the distributed four unknown samples on an equal footing. In the year 1999 the approach was different for two reasons. First, the number of participants was large, putting constraint on the distribution of reference materials. Second, the objective was to help the laboratories to test their routine performance in determination of isotope ratios [2]. Therefore no reference materials were distributed as part of that exercise. Instead, for calibration of the distributed samples, several experienced laboratories were selected beforehand and their results for each of the samples were used to derive a consensus value representing the best estimate of the true isotopic composition. The selection of laboratories was based on their previous involvement in the intercalibration of various water samples for the production of a successor for VSMOW, where highly consistent datasets were required and successfully generated by the participating laboratories.
For the WICO2002 exercise we were confident that the experience gained in previous exercises and the ongoing intercomparisons of the IAEA laboratory with several other isotope hydrology laboratories is sufficient to calibrate the four samples only internally at the IAEA (Table 1).
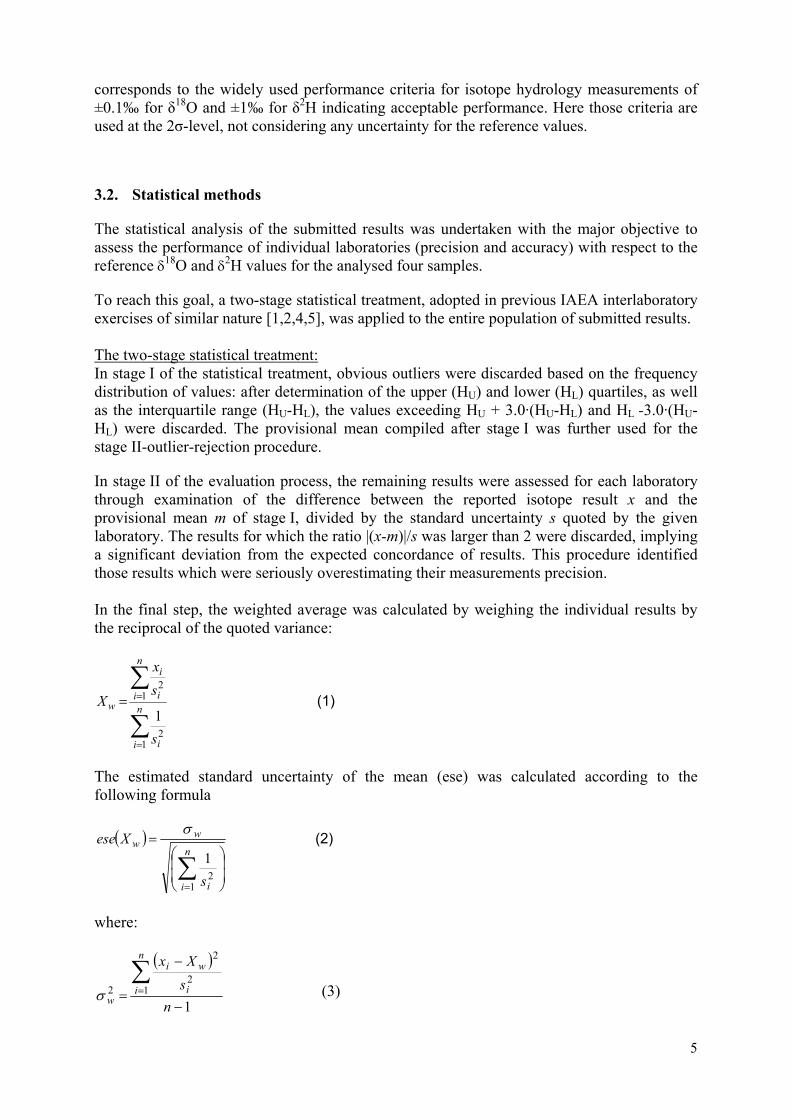
As a further cross-check the values obtained at IAEA were compared with the results of five laboratories, which had participated in the sample calibration for the previous 1999 exercise. One of the five laboratories reported two individual datasets for δ18O. The average values compiled from these laboratories are shown in Table 2 and document the very good agreement between IAEA and the other five laboratories, being well within 1σ-uncertainties of single determinations.
Estimated standard errors (ese) calculated from these data sets using the number of individual analyses (10 individual measurements per laboratory, see Table 2) give significant differences
4
at 2σ-level for five of the 8 values between IAEA and the five other laboratories. Since these ese-values do not take explicitly into account any possible systematic offsets between laboratories (e.g. the individual unknown calibration uncertainties in laboratories), this finding seems not to be critical for the main purpose to derive best estimates of true values for all four samples. Taking into consideration just the calibration uncertainty at the IAEA laboratory as additional systematic uncertainty component (±0.02‰ for δ18O and ±0.3‰ for δ2H) would make the differences insignificant at the 2σ-evel.
Table 2. Isotope values for the four WICO2002 water samples as determined by six laboratories which participated in the sample calibration for the 1999’ exercise. Standard deviations are given at the 1σ level. Each laboratory performed 10 individual measurements per sample. In the column ’number of laboratories’ the number in brackets indicate the number of rejected values.
δ18O δ2H Sample
mean value [‰]
standard deviation 1σ [‰]
number of laboratories
mean value[‰]
standard deviation 1σ [‰]
number of laboratories
OH-5 -0.204 ±0.038 5 (1) -1.33 ±0.63 5
OH-6 -4.192 ±0.076 6 -38.32 ±0.46 5
OH-7 -10.688 ±0.043 5 (1) -77.48 ±0.64 5
OH-8 -16.222 ±0.026 6 -121.61 ±0.24 5
3. EVALUATION AND PRESENTATION OF THE REPORTED DATA
3.1. First screening
The individual results submitted to the IAEA by the participating laboratories were first screened for consistency and plausibility. In 22 cases, emails were sent to laboratories asking for checks of the submitted results for validity of calculations (mean value versus individual data), possible use of wrong reporting scales or just for typing mistakes. Unfortunately, a considerable number of minor omissions and small mistakes were detected including several severe incidents of mixing up of data. The revisions received were incorporated to update the master dataset used for all further calculations. The master dataset is listed in APPENDIX I.
After the submission deadline, in a first rough evaluation, the reported mean values and individual data were compared with the reference values (Table 1). In all such cases, where three or more mean values deviated from the reference values by more than 0.2‰ for δ18O or 2‰ for δ2H, respectively, notifications were sent to the laboratories concerned. Altogether 25 laboratories received such emails. Three different types of standard messages were sent out, informing the laboratories of a detected offset. The messages referred generally to the observation of fixed value offsets for all four samples, to a linear shift of the values or to irregular outlier measurements. The first two cases could generally be attributed to problems in calibration or in normalization of results. The laboratories were asked to check their procedures and measurements. We received answers from 16 laboratories including revised datasets from 7 laboratories. However, those revised datasets were not used for the statistical evaluation below, but are listed in a separate table in APPENDIX I.
The choice of the deviation limits (0.2‰ and 2‰) used above for the first screening
5
corresponds to the widely used performance criteria for isotope hydrology measurements of ±0.1‰ for δ18O and ±1‰ for δ2H indicating acceptable performance. Here those criteria are used at the 2σ-level, not considering any uncertainty for the reference values.
3.2. Statistical methods
The statistical analysis of the submitted results was undertaken with the major objective to assess the performance of individual laboratories (precision and accuracy) with respect to the reference δ18O and δ2H values for the analysed four samples.
To reach this goal, a two-stage statistical treatment, adopted in previous IAEA interlaboratory exercises of similar nature [1,2,4,5], was applied to the entire population of submitted results. The two-stage statistical treatment: In stage I of the statistical treatment, obvious outliers were discarded based on the frequency distribution of values: after determination of the upper (HU) and lower (HL) quartiles, as well as the interquartile range (HU-HL), the values exceeding HU + 3.0·(HU-HL) and HL -3.0·(HU-HL) were discarded. The provisional mean compiled after stage I was further used for the stage II-outlier-rejection procedure.
In stage II of the evaluation process, the remaining results were assessed for each laboratory through examination of the difference between the reported isotope result x and the provisional mean m of stage I, divided by the standard uncertainty s quoted by the given laboratory. The results for which the ratio |(x-m)|/s was larger than 2 were discarded, implying a significant deviation from the expected concordance of results. This procedure identified those results which were seriously overestimating their measurements precision. In the final step, the weighted average was calculated by weighing the individual results by the reciprocal of the quoted variance:
(1)
∑
∑
=
== n
i i
n
i i
i
w
s
sx
X
12
12
1
The estimated standard uncertainty of the mean (ese) was calculated according to the following formula
( ) (2)
=
∑=
n
i i
ww
s
Xese
12
1
σ
where:
( )
11
2
2
2
−
−
=∑
=
nsXxn
i i
wi
wσ
(3)
6
n stands for the final number of results accepted after the second step of the data evaluation procedure.
All data evaluation and especially the outlier determination was performed with the PASCAL-based software ICE (InterComparisonEvaluation, version 4.8), specially developed at IAEA for the purpose of providing a standardized evaluation tool for the interlaboratory comparisons and proficiency tests performed in the field of environmental stable isotope and tritium analysis. The program output results were verified by use of simulated data sets and comparison with the output of the same algorithms used with commercial spreadsheet programs. The main advantages was found to be the easy application of outlier detection procedures, the robustness of ICE calculations for different data sets and the minimization of typing and calculation errors compared to the handling of quite elaborated spreadsheet forms.
3.3. Presentation of the results
In Table 3 the average values for the four samples are given as evaluated from all submitted data of the participating laboratories using the evaluation scheme discussed in the previous section. It provides the average values and associated standard deviations at 1σ-level and the number of accepted laboratory values (in brackets number of rejected laboratory values).
Table 3: Average isotope values as determined by all participating laboratories for the four WICO2002 water samples. Each laboratory performed 10 individual measurements per sample. In the column ‘number of laboratories’ the number of rejected laboratories is stated in addition in brackets.
δ18O δ2H Sample
mean value [‰]
standard deviation 1σ [‰]
number of laboratories (rejected)
mean value[‰]
standard deviation 1σ [‰]
number of laboratories (rejected)
OH-5 -0.26 ±0.17 82 (2) -2.1 ±1.8 74
OH-6 -4.22 ±0.14 81 (3) -39.1 ±1.7 74
OH-7 -10.72 ±0.15 82 (2) -77.8 ±1.2 72 (2)
OH-8 -16.27 ±0.14 78 (5) -122.0 ±1.5 70 (3)
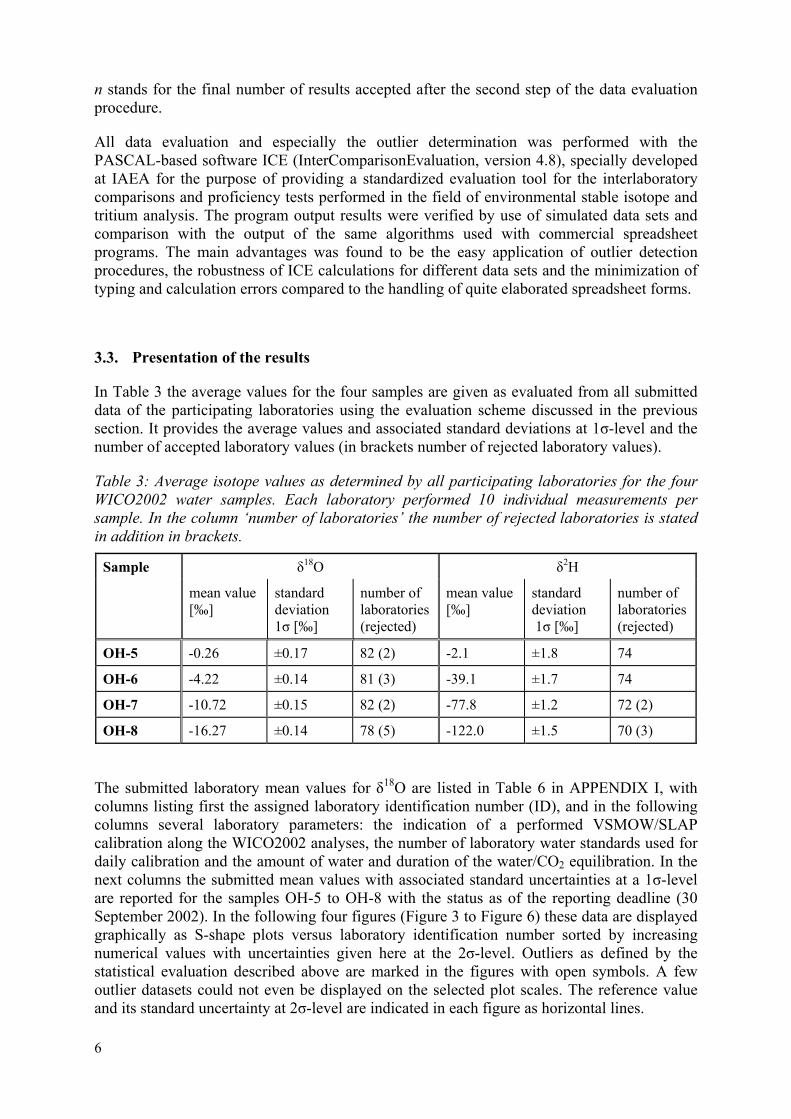
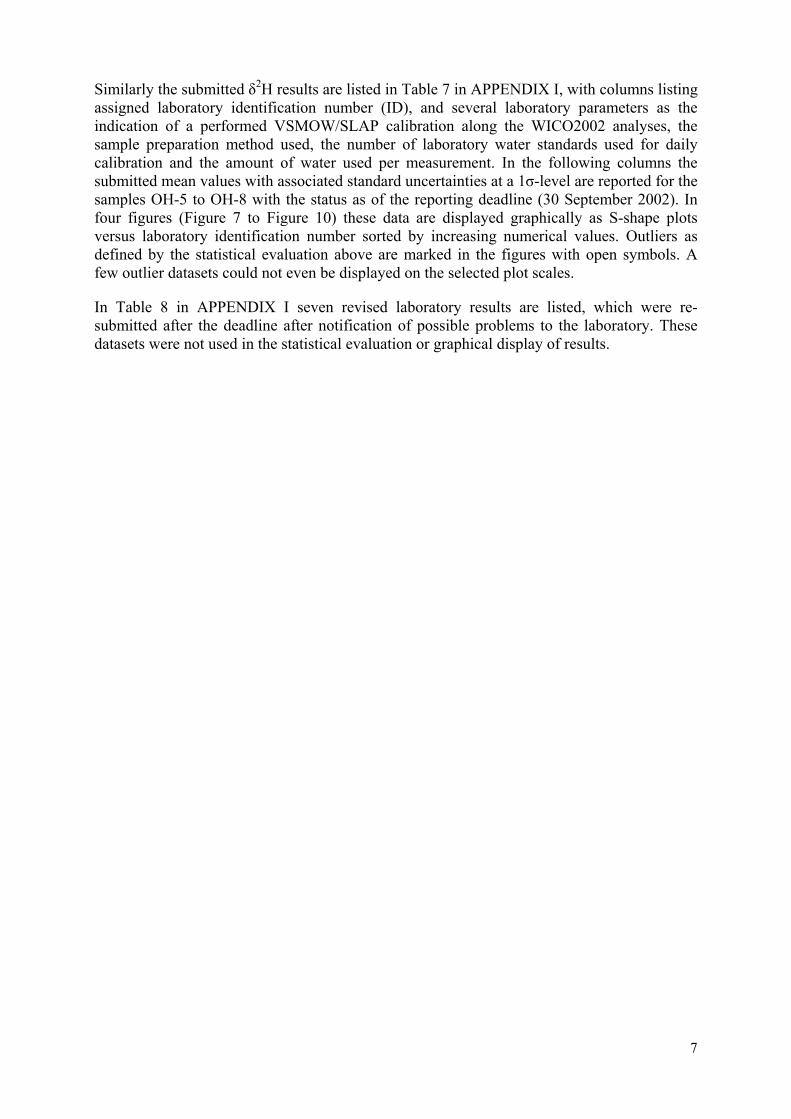
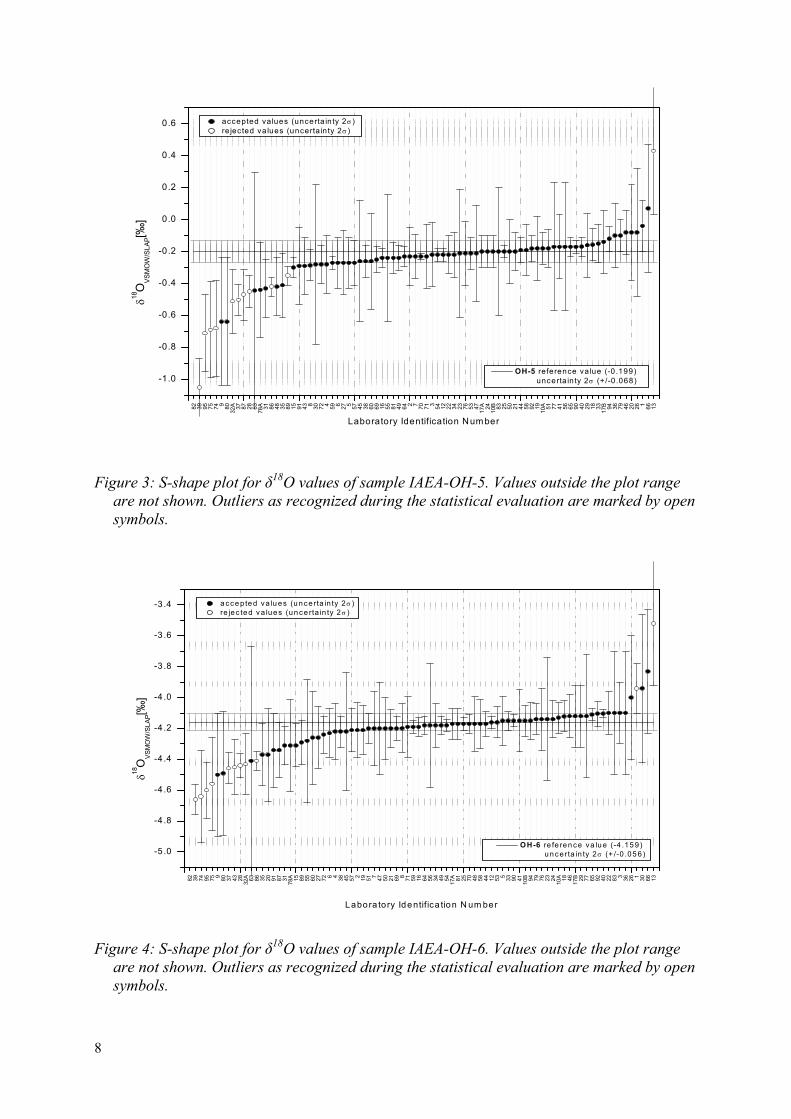
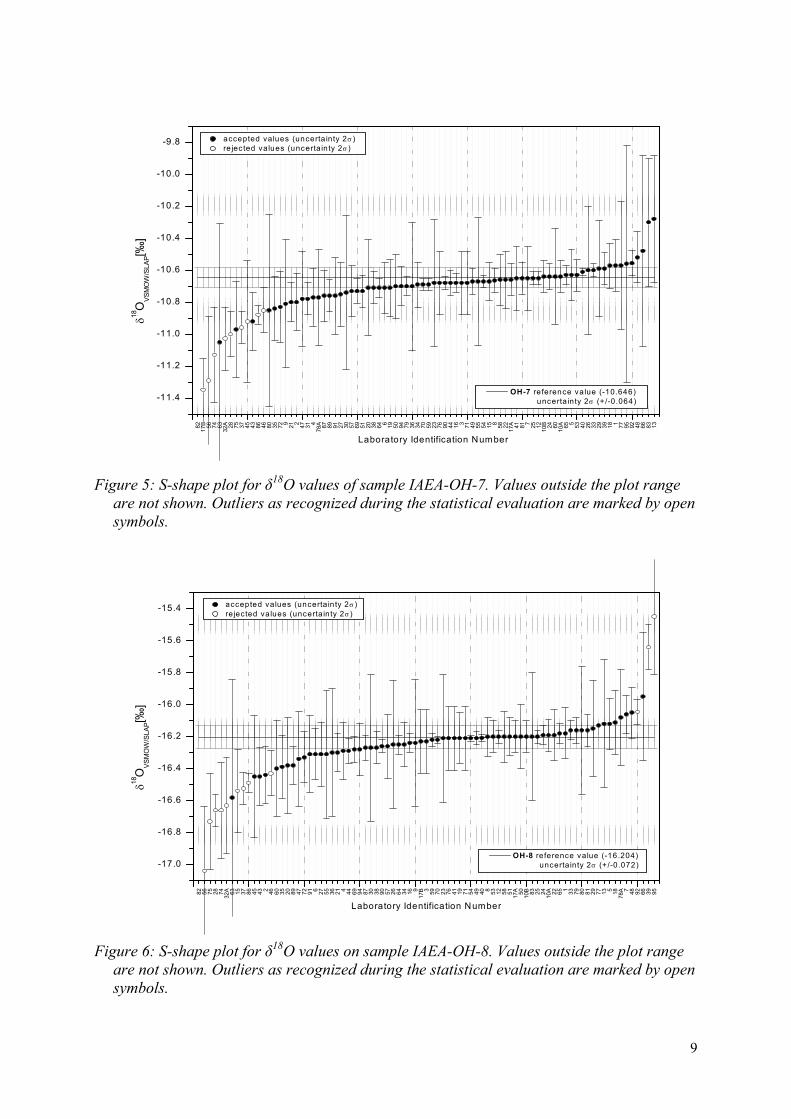
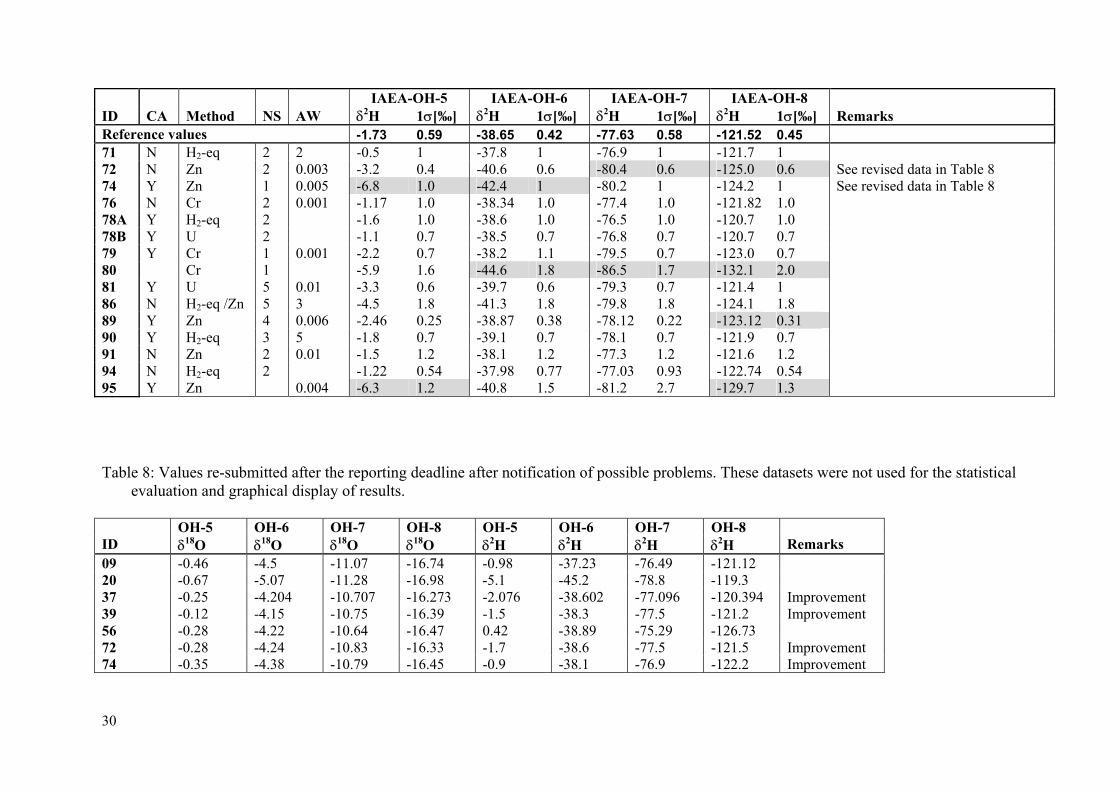
The submitted laboratory mean values for δ18O are listed in Table 6 in APPENDIX I, with columns listing first the assigned laboratory identification number (ID), and in the following columns several laboratory parameters: the indication of a performed VSMOW/SLAP calibration along the WICO2002 analyses, the number of laboratory water standards used for daily calibration and the amount of water and duration of the water/CO2 equilibration. In the next columns the submitted mean values with associated standard uncertainties at a 1σ-level are reported for the samples OH-5 to OH-8 with the status as of the reporting deadline (30 September 2002). In the following four figures (Figure 3 to Figure 6) these data are displayed graphically as S-shape plots versus laboratory identification number sorted by increasing numerical values with uncertainties given here at the 2σ-level. Outliers as defined by the statistical evaluation described above are marked in the figures with open symbols. A few outlier datasets could not even be displayed on the selected plot scales. The reference value and its standard uncertainty at 2σ-level are indicated in each figure as horizontal lines.
7
Similarly the submitted δ2H results are listed in Table 7 in APPENDIX I, with columns listing assigned laboratory identification number (ID), and several laboratory parameters as the indication of a performed VSMOW/SLAP calibration along the WICO2002 analyses, the sample preparation method used, the number of laboratory water standards used for daily calibration and the amount of water used per measurement. In the following columns the submitted mean values with associated standard uncertainties at a 1σ-level are reported for the samples OH-5 to OH-8 with the status as of the reporting deadline (30 September 2002). In four figures (Figure 7 to Figure 10) these data are displayed graphically as S-shape plots versus laboratory identification number sorted by increasing numerical values. Outliers as defined by the statistical evaluation above are marked in the figures with open symbols. A few outlier datasets could not even be displayed on the selected plot scales.
In Table 8 in APPENDIX I seven revised laboratory results are listed, which were re-submitted after the deadline after notification of possible problems to the laboratory. These datasets were not used in the statistical evaluation or graphical display of results.
8
-1.0
-0.8
-0.6
-0.4
-0.2
0.0
0.2
0.4
0.6
82 39 95 75 74 9 80 32A 37 87 28 63 78A 31 86 48 35 89 15 91 43 8 30 72 4 59 6 27 5 57 45 38 60 69 16 55 81 49 64 2 7 70 71 3 54 12 22 34 23 76 53 47 17A 24 10B 83 25 50 21 44 58 92 19 10A 51 77 41 56 65 90 40 29 18 33 17B 94 36 79 46 20 26 1 66 13
OH-5 reference va lue (-0 .199) uncerta in ty 2σ (+/-0 .068)
δ18O
VSM
OW
/SLA
P[‰]
Laboratory Identification Num ber
accepted va lues (uncerta in ty 2σ )re jected va lues (uncerta in ty 2σ )
Figure 3: S-shape plot for δ18O values of sample IAEA-OH-5. Values outside the plot range are not shown. Outliers as recognized during the statistical evaluation are marked by open symbols.
-5 .0
-4 .8
-4 .6
-4 .4
-4 .2
-4 .0
-3 .8
-3 .6
-3 .4
82 39 74 95 75 9 80 37 43 28 32A 63 86 35 20 91 87 31 78A 15 89 55 60 27 72 6 4 38 45 57 2 19 51 7 47 50 21 69 8 71 59 16 64 56 34 49 54 17A 81 25 70 48 58 44 12 53 5 33 90 41 10B 94 79 76 23 24 10A 18 46 17B 29 77 65 92 40 22 83 3 36 26 1 30 66 13
OH-6 re fe ren ce va lu e (-4 .15 9 ) un ce rta in ty 2 σ (+ /-0 .05 6 )
δ18O
VSM
OW
/SLA
P[‰]
L abo ra tory Identif ica tion N um ber
a cce p te d va lu es (u nce rta in ty 2 σ )re jec te d v a lue s (un ce rta in ty 2 σ )
Figure 4: S-shape plot for δ18O values of sample IAEA-OH-6. Values outside the plot range
are not shown. Outliers as recognized during the statistical evaluation are marked by open symbols.
9
-11.4
-11.2
-11.0
-10.8
-10.6
-10.4
-10.2
-10.0
-9.8
82 17B 56 74 63 32A 28 75 37 45 43 86 46 80 35 72 9 21 2 47 31 4
78A 87 89 91 27 30 57 69 51 20 38 64 6 19 50 94 79 36 34 70 59 23 76 90 44 16 3 71 49 55 54 15 8 58 22 17A 41 81 7 25 12 10B 24 60 10A 65 5 53 40 26 33 29 39 18 1 77 95 92 48 66 83 13
OH-7 re ference value (-10.646) uncertainty 2σ (+/-0.064)
δ18O
VSM
OW
/SLA
P[‰]
Laboratory Identification Number
accepted values (uncerta inty 2σ )re jec ted values (uncertainty 2σ )
Figure 5: S-shape plot for δ18O values of sample IAEA-OH-7. Values outside the plot range
are not shown. Outliers as recognized during the statistical evaluation are marked by open symbols.
-17.0
-16.8
-16.6
-16.4
-16.2
-16.0
-15.8
-15.6
-15.4
82 56 75 28 74 32A 63 15 37 86 45 43 2 46 60 35 20 89 47 72 91 6 27 55 36 21 4 44 69 94 87 30 38 90 57 26 64 34 16 9
17B 3 59 70 23 76 41 19 71 54 49 40 8 53 12 58 51 17A 50 10B 83 25 24 10A 22 65 1 33 79 80 81 29 77 13 5 18 78A 7 48 92 66 39 95
OH-8 reference value (-16.204) uncertainty 2σ (+/-0.072)
δ18O
VSM
OW
/SLA
P[‰]
Laboratory Identification Number
accepted values (uncertainty 2σ )re jected values (uncertainty 2σ )
Figure 6: S-shape plot for δ18O values on sample IAEA-OH-8. Values outside the plot range
are not shown. Outliers as recognized during the statistical evaluation are marked by open symbols.
10
-10
-8
-6
-4
-2
0
2
4
6
74 47 20 95 80 532
B32
A 45 86 64 26 25 13 81 72 59 16 23 2 48 89 10A 58 7 79 43 19 3 22 37 51 50 65 12 27 90 17A 33 17B 8 15 1
10B 28 24 34 78A 4 91 39 57 69 38 35 41 94 76 78B 60 21 9 70 40 71 53 36 54 66 29 56 55 31 49
OH -5 re fe re n c e v a lu e (-1 .7 3 ) u n c e rta in ty 2 σ (+ /-1 .1 8 )
δ2 HVS
MO
W/S
LAP[‰
]
L abo ra to ry Identif ica tion N um ber
a c c e p te d v a lu e s (u n c e rta in ty 2 σ )re je c te d v a lu e s (u n c e rta in ty 2 σ )
Figure 7: S-shape plot for δ2H values on sample IAEA-OH-5. Values outside the plot range
are not shown. Outliers as recognized during the statistical evaluation are marked by open symbols.
-4 8
-4 6
-4 4
-4 2
-4 0
-3 8
-3 6
-3 4
-3 2
-3 0
47 20 80 74 56 28 86 31 32B 95 72 64 32A 16 59 25 43 2 81 10A 13 3 23 34 19 90 26 65 27 50 45 17B 58 89 66 15 22 10B 51 37 57 78A 69 78B 12 38 24 35 60 76 17A 39 1 41 79 4 48 53 91 33 36 70 21 94 40 71 7 49 8 54 9 55 5 29
O H -6 re fe re n c e v a lu e (-3 8 .6 5 ) u n c e rta in ty 2 σ (+ /-0 .8 4 )
δ2 HVS
MO
W/S
LAP[‰
]
L a bo ra to ry Id e n tif ica tio n N um be r
a c c e p te d v a lu e s (u n c e rta in ty 2 σ )re je c te d v a lu e s (u n c e rta in ty 2 σ )
Figure 8: S-shape plot for δ2H values on sample IAEA-OH-6. Values outside the plot range
are not shown. Outliers as recognized during the statistical evaluation are marked by open symbols.
11
-86
-84
-82
-80
-78
-76
-74
-72
-70
80 47 95 72 74 86 43 79 28 81 32A 15 64 36 21 32B 45 23 20 17B 16 56 34 31 10A 59 89 90 50 49 58 19 25 27 3 2 26 57 65 13 10B 24 35 12 41 39 60 4 38 76 17A 69 33 48 91 22 8 40 66 70 37 94 51 71 78B 1 53 5 54 78A 9 55 7 29
OH-7 re fe re nc e v a lu e (-7 7 .6 3 ) u nc e rta in ty 2 σ (+ /-1 .1 6 )
δ2 HVS
MO
W/S
LAP[‰
]
L abo ra to ry Identif ica tion N um ber
a cc e p te d va lu es (un c e rta in ty 2 σ )re jec te d v a lu e s (u n ce rta in ty 2 σ )
Figure 9: S-shape plot for δ2H values on sample IAEA-OH-7. Values outside the plot range are not shown. Outliers as recognized during the statistical evaluation are marked by open symbols.
-130
-128
-126
-124
-122
-120
-118
-116
-114
80 95 28 72 49 56 47 66 74 86 23 45 43 89 79 32A 58 19 94 3 2 64 60 16 59 10A 15 57 26 34 36 50 13 27 70 90 76 51 10B 71 40 17B
32B 91 35 33 53 4 12 38 69 65 24 81 17A 39 9 1 48 55 21 8 25 54 78A
78B 22 37 41 7 20 29 5
OH-8 re ference va lue (-121.52) uncerta in ty 2σ (+/-0.9)
δ2 HVS
MO
W/S
LAP[‰
]
Laboratory Identification Number
accepted va lues (uncerta inty 2σ )re jec ted values (uncerta inty 2σ )
Figure 10: S-shape plot for δ2H values on sample IAEA-OH-8. Values outside the plot range
not shown. Outliers as recognized during the statistical evaluation are marked by open symbols.
12
An interesting feature for all eight S-plots is the skewed distribution and the obvious bias of values towards more negative values, which will be discussed later. A large spread of uncertainties is visible in the figures (Figure 3-Figure 10); for a considerable number of laboratories the uncertainties are of such an order of magnitude, that measured data could not be used in a meaningful way in hydrological applications. This is recognized, but was not used as acceptance criterion in the evaluation (in contrary to a proficiency test), since the exercise was intentionally open to all laboratories measuring stable isotopes in water samples and was not limited to isotope hydrology laboratories.
A different display of the same data is provided by δ2H/δ18O plots. These plots are quite useful to visualize the spread of hydrogen and oxygen data provided for any given sample. In the following four figures (Figure 11-Figure 14) the reported laboratory mean data are plotted for each water sample. In the same plots the respective average of the reported values calculated from all participating laboratories (except rejected values) is marked as circle with associated uncertainty (1σ-level). The squared symbol marks the IAEA reference value and its uncertainty (see Table 1). Several values could not be displayed in the plot at the chosen scales, but it was decided to have all four plots covering a similar range of δ-values (range of 1.2‰ and 12‰ each). It is worthwhile to note that the average value for all laboratories is biased towards more negative δ-values versus the reference value (and versus the subset of laboratories in Table 2). Calculating the ratio of δ18O and δ2H offsets for the ‘all-lab’ average values shows ratios ranging from 3 to 8. This may indicate an underlying reason beyond individual offsets of the deuterium and 18O analysis methods and is pointing towards systematic effects in the calibration of laboratory standards. For example such an effect could be caused by improper use of the international reference materials VSMOW and SLAP. Indeed, several laboratories indicated that they use these two materials on a daily basis. Assuming a slight evaporative enrichment of these materials with time (daily opening of a small bottle containing less than 20 ml of the material), a relative shift of the not-evaporated samples towards more negative values is expected, both for deuterium and for 18O. Similarly, improper storage of water laboratory standards with evaporative enrichment could cause the same pattern of offsets.
13
-0.6 -0.4 -0.2 0.0 0.2 0.4-8
-6
-4
-2
0
2
4IAEA-OH-5
reported values average of the reported values reference value
δ2 H
VSM
OW
/SLA
P[‰]
δ18OVSMOW/SLAP[‰]
Figure 11: δ2H/δ18O plot of all reported laboratory mean values for the sample IAEA-OH-5.
Not all values could be displayed using the selected scale.
-4.6 -4.4 -4.2 -4.0 -3.8 -3.6-46
-44
-42
-40
-38
-36
-34IAEA-OH-6
reported values average of the reported values reference value
δ2 HVS
MO
W/S
LAP[‰
]
δ18OVSMOW/SLAP[‰]
Figure 12: δ2H/δ18O plot of all reported laboratory mean values for the sample IAEA-OH-6.
Not all values could be displayed using the selected scale.
14
-11.4 -11.2 -11.0 -10.8 -10.6 -10.4 -10.2-84
-82
-80
-78
-76
-74
-72IAEA-OH-7
reported values average of the reported values reference value
δ2 H
VSM
OW
/SLA
P[‰]
δ18OVSMOW/SLAP[‰]
Figure 13: δ2H/δ18O plot of all reported laboratory mean values for the sample IAEA-OH-7.
Not all values could be displayed using the selected scale.
-16.8 -16.6 -16.4 -16.2 -16.0 -15.8 -15.6-126
-124
-122
-120
-118
-116
-114IAEA-OH-8
reported values average of the reported values reference value
δ2 HVS
MO
W/S
LAP[‰
]
δ18OVSMOW/SLAP[‰]
Figure 14: δ2H/δ18O plot of all reported laboratory mean values for the sample IAEA-OH-6.
Not all values could be displayed using the selected scale.
15
3.4. Performance rating
An interesting question for any laboratory participating in interlaboratory comparison exercises is to obtain information on its relative performance versus the other participants. In the last IAEA exercises [2,6], attempts were made to provide such information graphically.
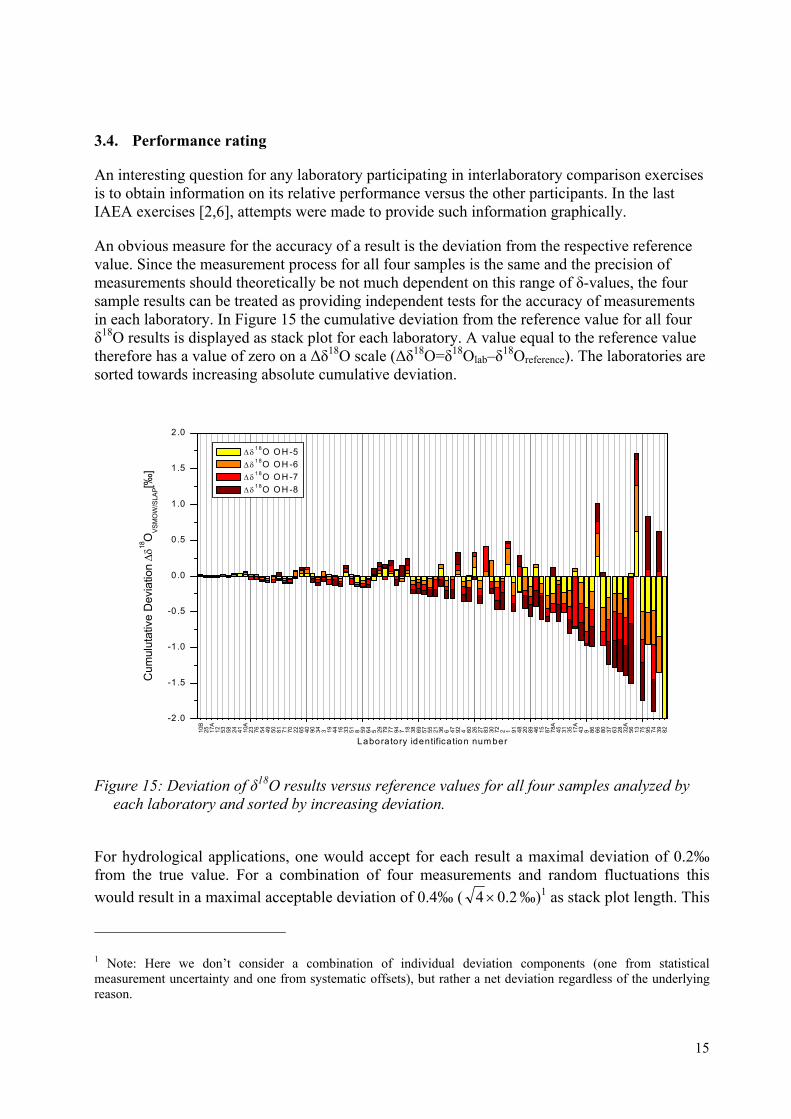
An obvious measure for the accuracy of a result is the deviation from the respective reference value. Since the measurement process for all four samples is the same and the precision of measurements should theoretically be not much dependent on this range of δ-values, the four sample results can be treated as providing independent tests for the accuracy of measurements in each laboratory. In Figure 15 the cumulative deviation from the reference value for all four δ18O results is displayed as stack plot for each laboratory. A value equal to the reference value therefore has a value of zero on a ∆δ18O scale (∆δ18O=δ18Olab–δ18Oreference). The laboratories are sorted towards increasing absolute cumulative deviation.
10B
25 17A
12 53 58 24 41 10A
23 76 54 49 50 81 71 70 22 65 40 90 34 3 19 44 16 33 51 8 59 64 5 29 79 77 94 7 18 38 69 57 55 21 36 6 47 92 4 60 26 27 83 30 72 2 1 91 48 20 89 46 15 87 78A
45 31 35 17A
43 9 86 66 80 37 63 28 32A
56 13 75 95 74 39 82
-2 .0
-1 .5
-1 .0
-0 .5
0.0
0.5
1.0
1.5
2.0
Cum
ulut
ativ
e D
evia
tion
∆δ18
OVS
MO
W/S
LAP[‰
]
Laboratory identifica tion num ber
∆ δ 1 8O O H -5 ∆ δ 1 8O O H -6 ∆ δ 1 8O O H -7 ∆ δ 1 8O O H -8
Figure 15: Deviation of δ18O results versus reference values for all four samples analyzed by
each laboratory and sorted by increasing deviation.
For hydrological applications, one would accept for each result a maximal deviation of 0.2‰ from the true value. For a combination of four measurements and random fluctuations this would result in a maximal acceptable deviation of 0.4‰ ( 2.04 × ‰)1 as stack plot length. This
1 Note: Here we don’t consider a combination of individual deviation components (one from statistical measurement uncertainty and one from systematic offsets), but rather a net deviation regardless of the underlying reason.
16
criterion could be used to check whether a given laboratory performs satisfactorily in regard to analytical requirements for hydrological applications. It can be seen easily that only about 60% of all laboratories would pass this test.
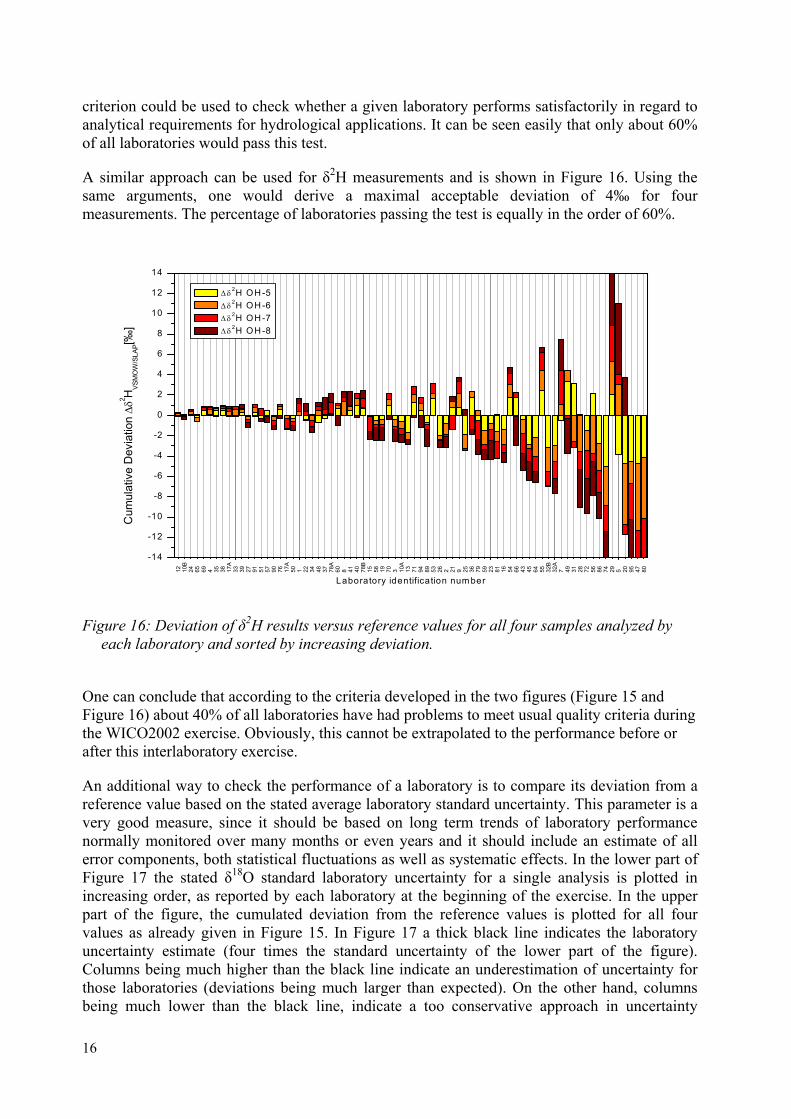
A similar approach can be used for δ2H measurements and is shown in Figure 16. Using the same arguments, one would derive a maximal acceptable deviation of 4‰ for four measurements. The percentage of laboratories passing the test is equally in the order of 60%.
12 10B
24 65 69 4 35 38 17A
33 39 27 91 51 57 90 76 17A
50 1 22 34 48 37 78A
60 8 41 40 78B
15 58 19 70 3 10A
13 71 94 89 53 26 2 21 9 25 36 79 59 23 81 16 54 66 43 45 64 55 32B
32A
7 49 31 28 72 56 86 74 29 5 20 95 47 80
-14
-12
-10
-8
-6
-4
-2
0
2
4
6
8
10
12
14
Cum
ulat
ive
Dev
iatio
n ∆
δ2 HVS
MO
W/S
LAP[‰
]
Laboratory identification num ber
∆ δ2H O H -5 ∆ δ2H O H -6 ∆ δ2H O H -7 ∆ δ2H O H -8
Figure 16: Deviation of δ2H results versus reference values for all four samples analyzed by
each laboratory and sorted by increasing deviation.
One can conclude that according to the criteria developed in the two figures (Figure 15 and Figure 16) about 40% of all laboratories have had problems to meet usual quality criteria during the WICO2002 exercise. Obviously, this cannot be extrapolated to the performance before or after this interlaboratory exercise.
An additional way to check the performance of a laboratory is to compare its deviation from a reference value based on the stated average laboratory standard uncertainty. This parameter is a very good measure, since it should be based on long term trends of laboratory performance normally monitored over many months or even years and it should include an estimate of all error components, both statistical fluctuations as well as systematic effects. In the lower part of Figure 17 the stated δ18O standard laboratory uncertainty for a single analysis is plotted in increasing order, as reported by each laboratory at the beginning of the exercise. In the upper part of the figure, the cumulated deviation from the reference values is plotted for all four values as already given in Figure 15. In Figure 17 a thick black line indicates the laboratory uncertainty estimate (four times the standard uncertainty of the lower part of the figure). Columns being much higher than the black line indicate an underestimation of uncertainty for those laboratories (deviations being much larger than expected). On the other hand, columns being much lower than the black line, indicate a too conservative approach in uncertainty
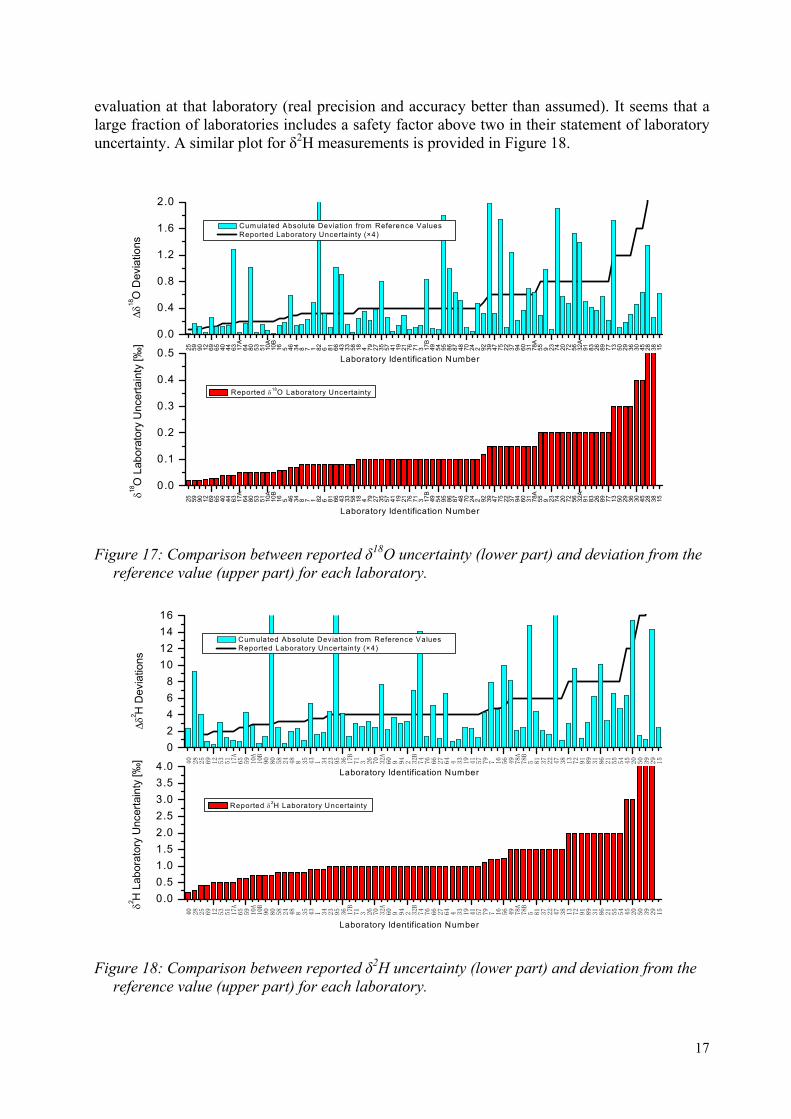
17
evaluation at that laboratory (real precision and accuracy better than assumed). It seems that a large fraction of laboratories includes a safety factor above two in their statement of laboratory uncertainty. A similar plot for δ2H measurements is provided in Figure 18.
25 59 90 12 69 65 40 44 63 17A
64 80 53 51 10A
10B
16 5 46 34 8 7 1 82 6 81 66 43 33 58 18 4 79 27 35 57 41 19 21 76 71 3 17B
49 54 95 86 87 48 70 24 2 92 39 47 75 22 37 94 60 31 78A
55 9 23 74 20 72 56 32A
91 83 26 89 77 13 50 29 36 30 45 28 38 15
25 59 90 12 69 65 40 44 63 17A
64 80 53 51 10A
10B
16 5 46 34 8 7 1 82 6 81 66 43 33 58 18 4 79 27 35 57 41 19 21 76 71 3 17B
49 54 95 86 87 48 70 24 2 92 39 47 75 22 37 94 60 31 78A
55 9 23 74 20 72 56 32A
91 83 26 89 77 13 50 29 36 30 45 28 38 15
0 .0
0.1
0.2
0.3
0.4
0.5
δ18O
Lab
orat
ory
Unc
erta
inty
[‰]
Laboratory Identification Number
Reported δ18O Laboratory Uncertainty
0.0
0.4
0.8
1.2
1.6
2.0
∆δ18
O D
evia
tions
Laboratory Identification Number
Cum ulated Absolute Deviation from Reference Values Reported Laboratory Uncertainty (×4)
Figure 17: Comparison between reported δ18O uncertainty (lower part) and deviation from the
reference value (upper part) for each laboratory.
40
28
25
69
12
53
51
17A
65
59
10A
10B
90
80
58
24
48
8 35
43
1 34
23
95
36
17B
71
3 26
70
32A
60
9 94
2 32B
74
76
66
27
64
4 33
19
41
57
79
7 16
56
49
78A
78B
5 81
37
22
47
38
13
72
91
89
31
86
21
55
54
45
20
50
39
29
15
40
28
25
69
12
53
51
17A
65
59
10A
10B
90
80
58
24
48
8 35
43
1 34
23
95
36
17B
71
3 26
70
32A
60
9 94
2 32B
74
76
66
27
64
4 33
19
41
57
79
7 16
56
49
78A
78B
5 81
37
22
47
38
13
72
91
89
31
86
21
55
54
45
20
50
39
29
15
0.00.51.01.52.02.53.03.54.0
δ2 H L
abor
ator
y U
ncer
tain
ty [‰
]
Laboratory Identification Number
Reported δ2H Laboratory Uncertainty
02468
10121416
∆δ2 H
Dev
iatio
ns
Laboratory Identification Number
Cum ulated Absolute Deviation from Reference Values Reported Laboratory Uncertainty (×4)
Figure 18: Comparison between reported δ2H uncertainty (lower part) and deviation from the
reference value (upper part) for each laboratory.
18
In an attempt to provide an overall assessment of laboratory performance both for δ18O and for δ2H during the WICO2002 interlaboratory comparison, the laboratory deviations as displayed in Figure 17 and Figure 18 were artificially combined. Due to the coupling of many δ18O and δ2H values in nature by the mean meteoric water line the following scheme was used. The absolute value of all sample deviations for δ2H from Figure 18 was combined with the similar data for δ18O from Figure 17, the latter data being multiplied by a factor of eight. This latter factor represents the average correlation of δ18O and δ2H data and therefore weighs the deviations to a similar level. The resulting numerical value for any laboratory provides an indicator for laboratory deviation from reference values for the four distributed samples. A smaller value obviously can be interpreted as better correspondence to the reference values and thus – limited exclusively to the WICO2002 sample measurements – indicates better performance. Those data are displayed in Figure 19. Laboratories having analyzed only δ18O or δ2H are displayed separately at the right side of the plot.
12 10B 24 17A 65 76 33 50 90 51 22 41 58 69 34 38 10A 70 57 40 53 8 19 4 3 71 27 25 94 23 60 91 81 54 1 21 59 16 79 48 26 36 02 78A 35 15 89 64 17B 49 55 7 45 9 31 37 43 66 72 29 5 13 39 86 32A 28 20 56 47 74 95 80 44 77 18 6 92 83 30 46 87 63 75 8278B
32B
0
5
1 0
1 5
2 0
2 5
3 0
3 5
Indi
cato
r for
ove
rall
Labo
rato
ry P
erfo
rman
ce
L a bo ra to ry Id e n tif ica tio n N u m b e r
2H 18O
Figure 19: Indicator for overall laboratory performance derived from both δ2H and δ18O data.
It has to be stressed, however, that such an performance indicator is somewhat arbitrary, as it combines different and independent measurements performed not in routine modus (ten analyses for each submitted value) and provides only a snapshot on laboratory performance limited to the time period in summer 2002 when the WICO2002 measurements were actually performed. No extrapolation is possible to the past and future based on the performance indicators presented here.
4. QUALITY ASSURANCE AND POSSIBLE IMPROVEMENTS
In this chapter, the available data and information will be discussed in terms of quality
19
assurance approaches, highlighting the most relevant operation factors and parameters. Some proposals are formulated, suggesting measures about how to further improve the quality of water stable isotope measurements in routine laboratory work.
4.1. Basic quality assurance issues
So far in Chapter 3 the whole set of submitted results was first discussed as an ensemble. Several conclusions could be drawn from this evaluation:
• 22 out of 86 datasets submitted to IAEA contained obvious errors or inaccuracies, which were visible without any detailed evaluation and could be easily corrected by the laboratory concerned, after the problem had been pointed out to them. Several were of minor importance, but a few were of severe character, invalidating the submission.
• Data from 25 laboratories showed considerable deviations from the reference values for at least three sample values. In several cases the underlying reasons were found by the laboratories after the most probable kind of error was indicated to them.
• A general bias exists towards more negative values for the set of all participating laboratories, which cannot be attributed to random offsets in 2H or 18O measurements alone.
• A large fraction of around 40% of the participating laboratories has considerable problems in achieving such precision and accuracy targets as needed for most hydrological applications. The percentage of nonconforming results is similar both for δ18O and for δ2H.
• Many laboratories are stating standard uncertainties for their measurements, which are too low or too high. Especially the underestimation of uncertainty is critical. Other uncertainties stated are so huge, that the results themselves are becoming very uncertain and are of limited usefulness for most hydrological applications.
4.2. Important QA parameters for WICO2002
While the section on performance rating in the last chapter dealt with individual laboratory performance, no indication was given for possible reasons of performance differences. In this section, the influence of some measurement parameters on the laboratory performance is discussed. Some of the parameters and information requested from the participants can be found in APPENDIX I. While attempt was made to achieve as much information as possible from the participating laboratories, still some gaps exist on individual measurement conditions and parameters.
The approach followed here is to group the laboratories at a time according to one selected parameter being thought to be important for the analytical process and to derive mean values for those sub-groups according to the same statistical procedure and outlier test as indicated earlier in Chapter 3. No multivariate analysis was performed so far on the data set available.
The results of the different parameter tests are shown in Table 4 for δ18O and in Table 5 for δ2H. The discussion of those results is given in the following sub-sections. It should be noted that the tables state the average uncertainty for a single laboratory within a sub-group and not the standard error of the mean for that group. Therefore the relatively small mean value differences
20
in relation to big uncertainties do not invalidate a comparison of those values in terms of laboratory performance. But those data – in the best case – can show trends only, which sometimes may be masked by effects of other parameters.
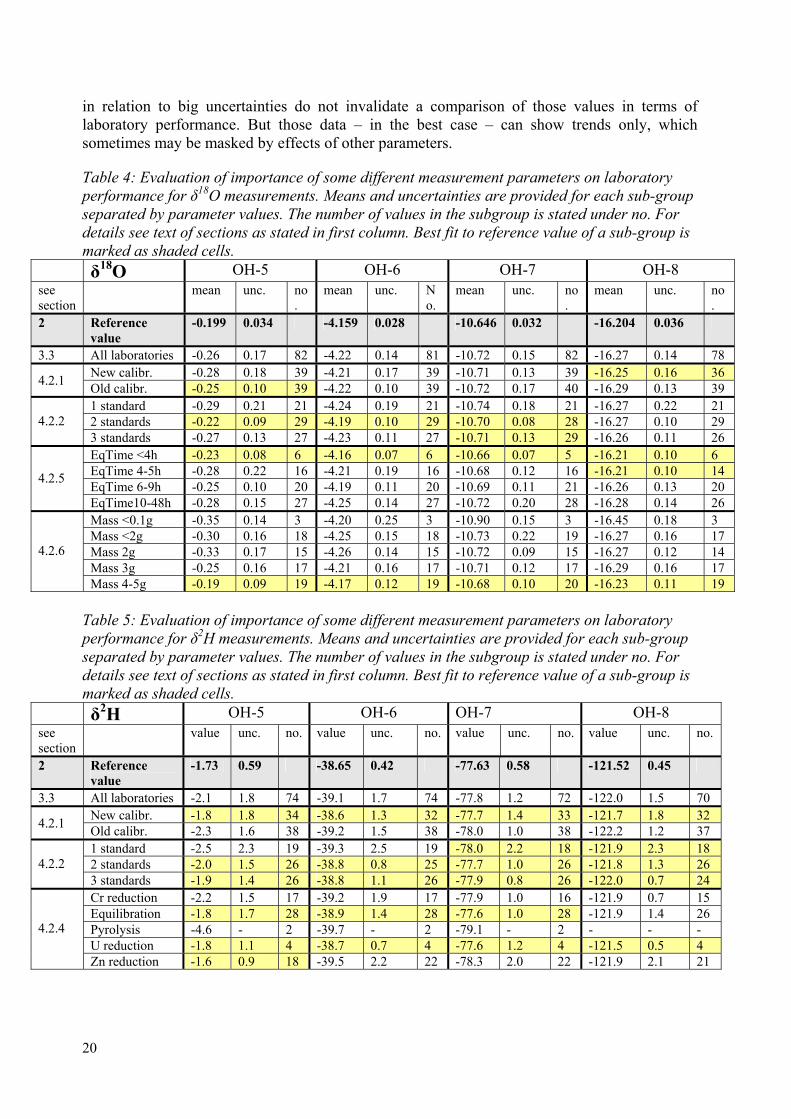
Table 4: Evaluation of importance of some different measurement parameters on laboratory performance for δ18O measurements. Means and uncertainties are provided for each sub-group separated by parameter values. The number of values in the subgroup is stated under no. For details see text of sections as stated in first column. Best fit to reference value of a sub-group is marked as shaded cells.
δ18O OH-5 OH-6 OH-7 OH-8 see section
mean unc. no.
mean unc. No.
mean unc. no.
mean unc. no.
2 Reference value
-0.199 0.034 -4.159 0.028 -10.646 0.032 -16.204 0.036
3.3 All laboratories -0.26 0.17 82 -4.22 0.14 81 -10.72 0.15 82 -16.27 0.14 78 New calibr. -0.28 0.18 39 -4.21 0.17 39 -10.71 0.13 39 -16.25 0.16 36 4.2.1 Old calibr. -0.25 0.10 39 -4.22 0.10 39 -10.72 0.17 40 -16.29 0.13 39 1 standard -0.29 0.21 21 -4.24 0.19 21 -10.74 0.18 21 -16.27 0.22 21 2 standards -0.22 0.09 29 -4.19 0.10 29 -10.70 0.08 28 -16.27 0.10 29
4.2.2
3 standards -0.27 0.13 27 -4.23 0.11 27 -10.71 0.13 29 -16.26 0.11 26 EqTime <4h -0.23 0.08 6 -4.16 0.07 6 -10.66 0.07 5 -16.21 0.10 6 EqTime 4-5h -0.28 0.22 16 -4.21 0.19 16 -10.68 0.12 16 -16.21 0.10 14 EqTime 6-9h -0.25 0.10 20 -4.19 0.11 20 -10.69 0.11 21 -16.26 0.13 20
4.2.5
EqTime10-48h -0.28 0.15 27 -4.25 0.14 27 -10.72 0.20 28 -16.28 0.14 26 Mass <0.1g -0.35 0.14 3 -4.20 0.25 3 -10.90 0.15 3 -16.45 0.18 3 Mass <2g -0.30 0.16 18 -4.25 0.15 18 -10.73 0.22 19 -16.27 0.16 17 Mass 2g -0.33 0.17 15 -4.26 0.14 15 -10.72 0.09 15 -16.27 0.12 14 Mass 3g -0.25 0.16 17 -4.21 0.16 17 -10.71 0.12 17 -16.29 0.16 17
4.2.6
Mass 4-5g -0.19 0.09 19 -4.17 0.12 19 -10.68 0.10 20 -16.23 0.11 19 Table 5: Evaluation of importance of some different measurement parameters on laboratory performance for δ2H measurements. Means and uncertainties are provided for each sub-group separated by parameter values. The number of values in the subgroup is stated under no. For details see text of sections as stated in first column. Best fit to reference value of a sub-group is marked as shaded cells.
δ2H OH-5 OH-6 OH-7 OH-8 see section
value unc. no. value unc. no. value unc. no. value unc. no.
2 Reference value
-1.73 0.59 -38.65 0.42 -77.63 0.58 -121.52 0.45
3.3 All laboratories -2.1 1.8 74 -39.1 1.7 74 -77.8 1.2 72 -122.0 1.5 70 New calibr. -1.8 1.8 34 -38.6 1.3 32 -77.7 1.4 33 -121.7 1.8 32 4.2.1 Old calibr. -2.3 1.6 38 -39.2 1.5 38 -78.0 1.0 38 -122.2 1.2 37 1 standard -2.5 2.3 19 -39.3 2.5 19 -78.0 2.2 18 -121.9 2.3 18 2 standards -2.0 1.5 26 -38.8 0.8 25 -77.7 1.0 26 -121.8 1.3 26
4.2.2
3 standards -1.9 1.4 26 -38.8 1.1 26 -77.9 0.8 26 -122.0 0.7 24 Cr reduction -2.2 1.5 17 -39.2 1.9 17 -77.9 1.0 16 -121.9 0.7 15 Equilibration -1.8 1.7 28 -38.9 1.4 28 -77.6 1.0 28 -121.9 1.4 26 Pyrolysis -4.6 - 2 -39.7 - 2 -79.1 - 2 - - - U reduction -1.8 1.1 4 -38.7 0.7 4 -77.6 1.2 4 -121.5 0.5 4
4.2.4
Zn reduction -1.6 0.9 18 -39.5 2.2 22 -78.3 2.0 22 -121.9 2.1 21
21
4.2.1. Routine measurement versus sample calibration
The task of the participating laboratories was to analyze each of the samples 10 times over a period of several days to obtain a best estimate for their isotopic composition. This was considered after realizing that requests for a “routine analysis” scheme would not be followed by all laboratories and would result in questionable comparison of data. However, even for this scheme of a best-precision determination involving ten replicate measurements a further deviation from the requested analytical scheme is possible. Inconsistencies in precision would arise in case of sample measurements carried out along with aliquots of VSMOW and SLAP (for direct calibration) as against data obtained by using calibrated laboratory water standards (routine measurement). It is expected that laboratories calibrating the samples directly against the international reference materials would obtain values closer to the true values due to the absence of additional uncertainty coming from laboratory water standards. That would mean that the WICO2002 samples are calibrated directly against VSMOW. However, such an action is counterproductive for a laboratory in a long run since (mis-)using the international reference materials for the calibration of the WICO2002 samples reduces the possibility to better calibrate the normally used laboratory water standards. Therefore, this procedure can not be recommended at all. However, it was used by about half of the laboratories, both for δ18O and for δ2H (see Table 4 and Table 5). The reference values were obtained using internal laboratory standards (“old calib”).
As expected, for the δ2H sample mean values calculated from the data set of laboratories that calibrated the WICO2002 samples directly against VSMOW/SLAP (“new calib”) was distinctly better than for those who performed routine measurements (“old calib”), even when the standard error of the mean calculated for both cases generally overlap at the one sigma level.
Interestingly, for δ18O no stringent performance difference was visible when comparing both datasets, which points towards a more robust situation for oxygen stable isotope calibration.
4.2.2. Number of internal laboratory water standards used
It should be obvious, that for stable isotope measurements a daily routine calibration using only one internal laboratory standard cannot be used to correct for any scale normalization effect (see the basic concept underlying the introduction of the VSMOW/SLAP scale). Two internal laboratory standards would allow a scale normalization; further improvements in the performance can be achieved by having standards close to the isotopic composition of measured samples.
Table 4 and Table 5 show a better performance level for laboratories using two or more internal laboratory standards versus those using exclusively one. Surprisingly, however, laboratories with two standards perform in general better than those with more than two standards. Eventually this could be attributed to the limited amount of VSMOW and SLAP available for calibration (20 ml each once in three years), limiting the number of analyses, in case of too many laboratory standards to be calibrated and verified.
4.2.3. Type of mass spectrometer used
Results of this evaluation are not displayed, since no clear pattern could be identified. There is no correlation between the model (age or type) of the mass spectrometers and their performance. Sometimes “oldtimers” sold more than fifteen years ago performed similar or better than the newest machines and sometimes it was the opposite. It looks like that the
22
experience of the operator is much more important than the type of instrument. This is confirmed by the experience at the IAEA Isotope Hydrology Laboratory, where the performance of an originally 30 year old mass spectrometer is just similar to that of a new generation mass spectrometer (now 5 years old), which was verified for the last five years. Only the construction of a new improved water equilibration system finally made a difference and resulted in a visible performance difference.
4.2.4. Measurement method for δ2H analysis
There is a clear indication of performance difference among the various methods of δ2H determination (see Table 5). The uranium water reduction method shows best results, but is performed by a small group of only four laboratories. The water/H2 gas equilibration seems to show a similar, slightly lower performance, while Zinc, Chromium and Pyrolysis show in general larger deviations from the reference values. The spread of uncertainty data (uncertainty of the sub-groups) is comparable, with the uranium method showing best performance.
4.2.5. Water-CO2 equilibration time for δ18O analysis
From theoretical considerations a longer equilibration time should provide some safety buffer against incomplete CO2/H2O equilibration. Surprisingly just the opposite seems to be true for the participating laboratories: equilibration times below 4 hours result in best performance and mean values close to the reference values, while longer equilibration times result in worse performance with worst results from long equilibration times between 10 and 48 hours.
It could be speculated that the temperature stability of the equilibration baths could be responsible for this effect; at the IAEA laboratory spatial and temporal temperature deviations of about ±0.3 ºC occurred in one commercial equilibration bath. The construction of an equilibration bath with a temperature stability better than ±0.03 ºC together with an improved water/gas mixing efficiency resulted in more concordant stable isotope data [8]. A similar improvement was achieved in an air equilibration system by intensified air circulation and resulting improved temperature stability.
4.2.6. Amount of water used for δ18O water-CO2 equilibration
Here the results presented in Table 4 are unambiguous: by far the best performance is delivered from measurements with the largest water amounts of 4-5 grams water, both in terms of deviation from the reference values as well as in the uncertainty (expressing the homogeneity of results in the sub-group). The smaller water amounts used show larger deviations from reference values and large deviations within the group.
4.3. Recommendations to improve the quality of measurements
From the evaluation in section 4.2 some preliminary recommendations can be formulated. In general, the use of (at least) two internal laboratory water standards is recommended. For δ18O measurements with the water equilibration method, special attention should be given to the temperature stability problem, eventually allowing shorter equilibration times to be applied. Caution should be applied for small water amounts in the equilibration method since they seem to cause side-effects and larger uncertainties between laboratories. For δ2H, the performance of the different available methods seems to be slightly different, but finally the scatter among
23
laboratories applying the same method is larger than the offset between methods, pointing to the need of best quality control for each method.
Finally, many laboratories have to be careful in data reporting and should revise their data reporting and checking schemes to avoid small problems (like reporting data with inappropriate number of significant digits) or severe problems (wrong calculations or reporting of raw data instead of calibrated data).
5. CONCLUSIONS
The WICO2002 interlaboratory comparison has confirmed findings of earlier exercises in terms of detecting potential problem areas for laboratories. Some improvements could be detected for δ18O measurements. Requesting laboratories to provide more background data has for the first time provided the chance to look into reasons for large deviations in the results. There is still a considerable fraction of laboratories with basic problems in accuracy, precision, and in statement of justifiable measurement uncertainty. Further efforts are needed to improve this situation.
On the other hand a majority of laboratories has proved themselves capable of providing high quality data which can be used confidently for hydrogeological studies.
It is desirable to provide larger quantities of international standards to laboratories to increase their ability to perform robust and precise calibrations of internal laboratory standards. However, this would be possible only after preparation of successor materials for VSMOW and SLAP. Precise calibration seems to be a possible bottleneck for those laboratories which still are subject to considerable offsets from the reference values. The basic requirement remains to suitably calibrate and store the internal laboratory water standards.
Participation by a large number of laboratories despite newly established rigid rules for participation in the WICO2002 exercise (mandatory data reporting before accepting participation) shows a high interest in this kind of quality check for laboratories. It is hoped that the next exercise to be announced in a few years from now will be even more successful and will show an overall improvement in analytical precision and quality of results.
Detailed guidelines for operation of isotope hydrology laboratories will be published in the near future by the IAEA to stimulate improvements in analytical quality assurance and to foster the application of operation rules according to ISO guidelines.
6. REFERENCES
[1] Araguás-Araguás, L., K. Rozanski (1995): IAEA interlaboratory comparison for deuterium and oxygen-18 analysis of precipitation samples. IAEA Report, Vienna, 33 pp.
[2] Lippmann, J., M. Gröning, K. Rozanski (1999): 2nd interlaboratory comparison for deuterium and oxygen-18 analysis of water samples. IAEA Report, Vienna, 44 pp.
[3] ISOGEOCHEM newsgroup: http://geology.uvm.edu/geowww/isogeochem.html
24
[4] Rozanski, K., W. Stichler, R. Gonfiantini, E.M. Scott, R.P. Beukens, B. Kromer, J. Van der Plicht, (1992): The IAEA 14C intercomparison exercise. Radiocarbon 34 (3), 506-519.
[5] Östlund, G., M. Scott, C.B. Taylor (1995): Fifth IAEA intercomparison of low-level tritium measurements in water. Report, IAEA, Vienna, 1995, 31 pp.
[6] Gröning, M., C.B. Taylor, G. Winckler, R. Auer, H. Tatzber (2001): Sixth IAEA intercomparison of low-level tritium measurements in water (TRIC2000). IAEA Report, October 2001, Vienna, 59 pp.
[7] Coplen, T.B., P. De Bièvre, H.R. Krouse, R.D. Vocke, M. Gröning, K. Rozanski: Ratios for light-element isotopes standardised for better interlaboratory comparison. EOS, July 2, 1996.
[8] Gröning, M, M. van Duren, L. Andreescu, A. Tanweer, M. Jaklitsch, M. Gattin: Quality assurance for stable isotope analysis of water samples by mass spectrometry. Accreditation and Quality Assurance, Springer, Berlin (in press).
25
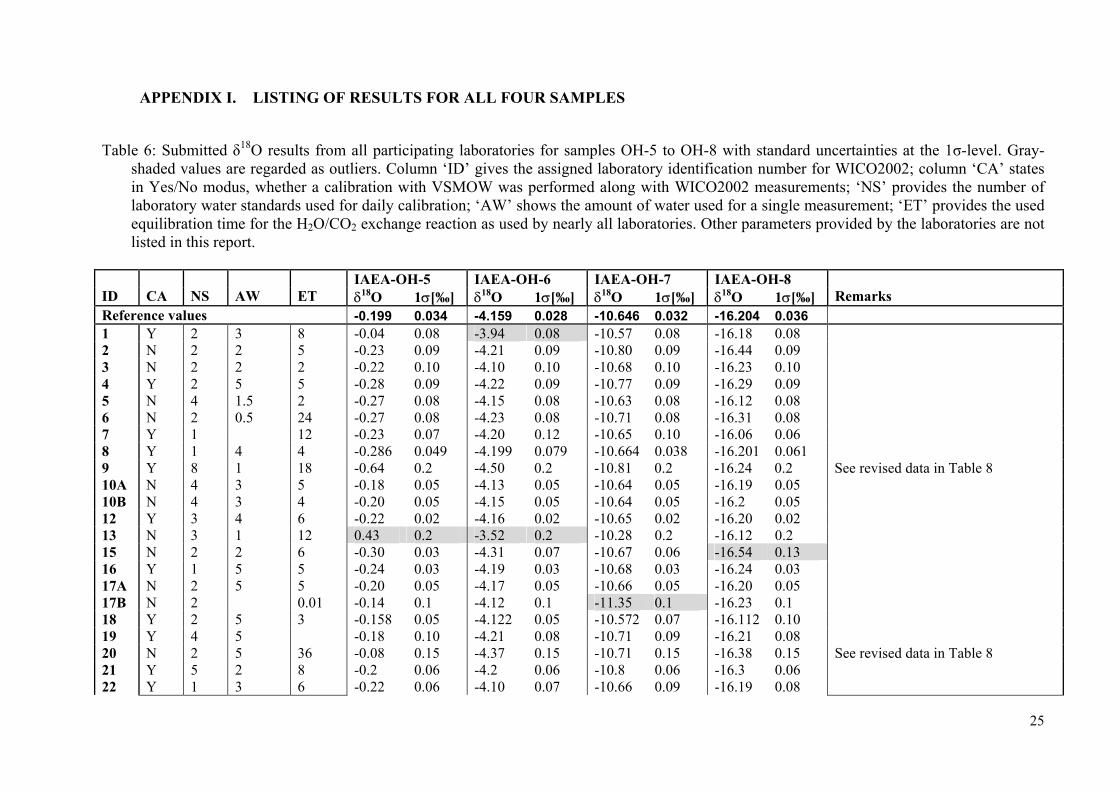
APPENDIX I. LISTING OF RESULTS FOR ALL FOUR SAMPLES
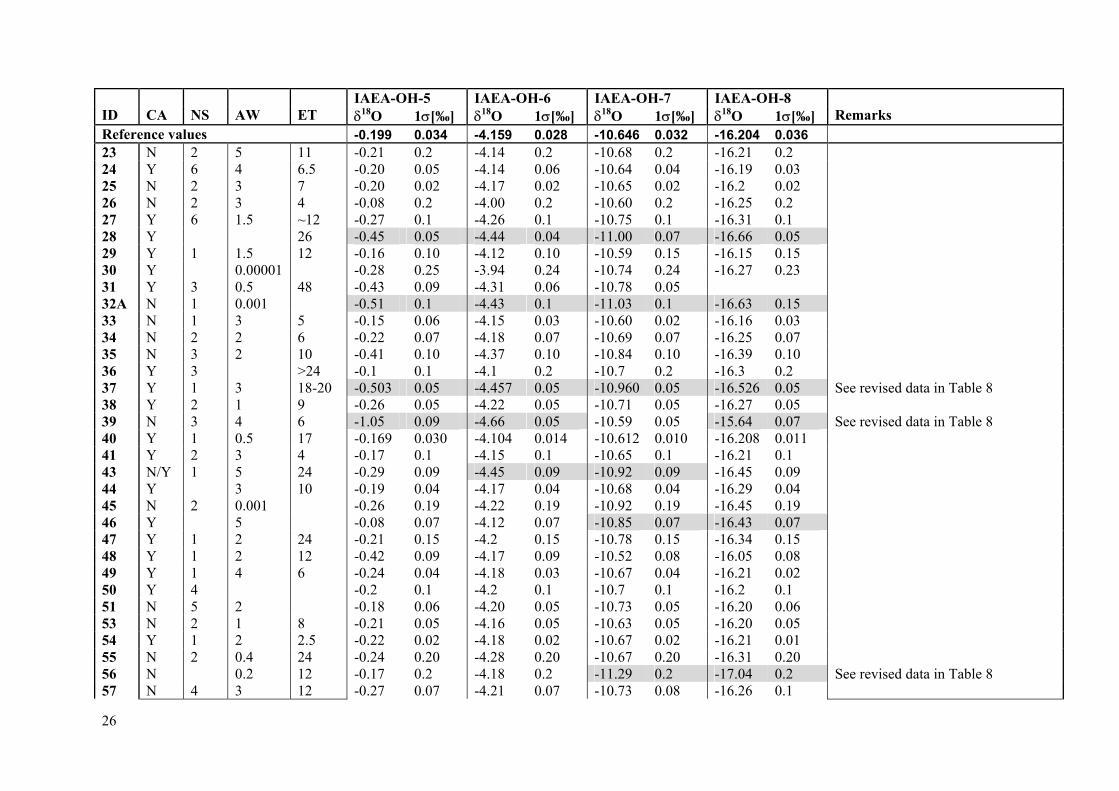
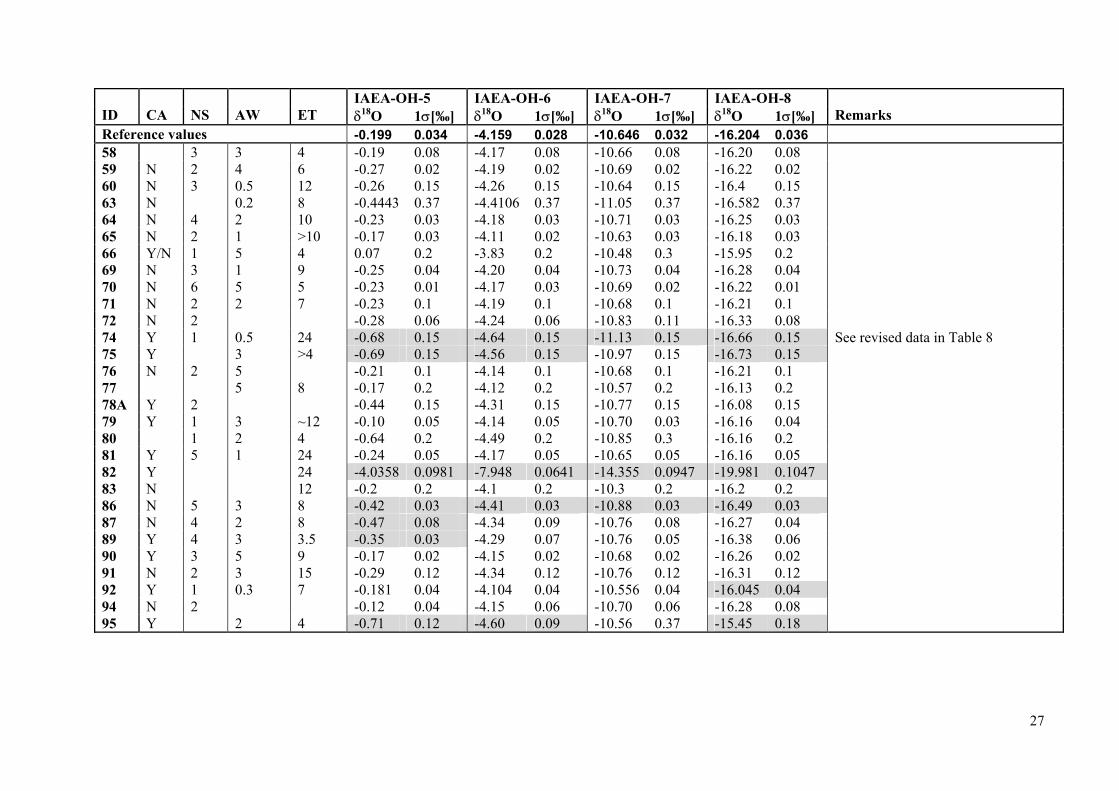
Table 6: Submitted δ18O results from all participating laboratories for samples OH-5 to OH-8 with standard uncertainties at the 1σ-level. Gray-
shaded values are regarded as outliers. Column ‘ID’ gives the assigned laboratory identification number for WICO2002; column ‘CA’ states in Yes/No modus, whether a calibration with VSMOW was performed along with WICO2002 measurements; ‘NS’ provides the number of laboratory water standards used for daily calibration; ‘AW’ shows the amount of water used for a single measurement; ‘ET’ provides the used equilibration time for the H2O/CO2 exchange reaction as used by nearly all laboratories. Other parameters provided by the laboratories are not listed in this report.
IAEA-OH-5 IAEA-OH-6 IAEA-OH-7 IAEA-OH-8 ID CA NS AW ET δ18O 1σ[‰] δ18O 1σ[‰] δ18O 1σ[‰] δ18O 1σ[‰] Remarks Reference values -0.199 0.034 -4.159 0.028 -10.646 0.032 -16.204 0.036 1 Y 2 3 8 -0.04 0.08 -3.94 0.08 -10.57 0.08 -16.18 0.08 2 N 2 2 5 -0.23 0.09 -4.21 0.09 -10.80 0.09 -16.44 0.09 3 N 2 2 2 -0.22 0.10 -4.10 0.10 -10.68 0.10 -16.23 0.10 4 Y 2 5 5 -0.28 0.09 -4.22 0.09 -10.77 0.09 -16.29 0.09 5 N 4 1.5 2 -0.27 0.08 -4.15 0.08 -10.63 0.08 -16.12 0.08 6 N 2 0.5 24 -0.27 0.08 -4.23 0.08 -10.71 0.08 -16.31 0.08 7 Y 1 12 -0.23 0.07 -4.20 0.12 -10.65 0.10 -16.06 0.06 8 Y 1 4 4 -0.286 0.049 -4.199 0.079 -10.664 0.038 -16.201 0.061 9 Y 8 1 18 -0.64 0.2 -4.50 0.2 -10.81 0.2 -16.24 0.2 See revised data in Table 8 10A N 4 3 5 -0.18 0.05 -4.13 0.05 -10.64 0.05 -16.19 0.05 10B N 4 3 4 -0.20 0.05 -4.15 0.05 -10.64 0.05 -16.2 0.05 12 Y 3 4 6 -0.22 0.02 -4.16 0.02 -10.65 0.02 -16.20 0.02 13 N 3 1 12 0.43 0.2 -3.52 0.2 -10.28 0.2 -16.12 0.2 15 N 2 2 6 -0.30 0.03 -4.31 0.07 -10.67 0.06 -16.54 0.13 16 Y 1 5 5 -0.24 0.03 -4.19 0.03 -10.68 0.03 -16.24 0.03 17A N 2 5 5 -0.20 0.05 -4.17 0.05 -10.66 0.05 -16.20 0.05 17B N 2 0.01 -0.14 0.1 -4.12 0.1 -11.35 0.1 -16.23 0.1 18 Y 2 5 3 -0.158 0.05 -4.122 0.05 -10.572 0.07 -16.112 0.10 19 Y 4 5 -0.18 0.10 -4.21 0.08 -10.71 0.09 -16.21 0.08 20 N 2 5 36 -0.08 0.15 -4.37 0.15 -10.71 0.15 -16.38 0.15 See revised data in Table 8 21 Y 5 2 8 -0.2 0.06 -4.2 0.06 -10.8 0.06 -16.3 0.06 22 Y 1 3 6 -0.22 0.06 -4.10 0.07 -10.66 0.09 -16.19 0.08
26
IAEA-OH-5 IAEA-OH-6 IAEA-OH-7 IAEA-OH-8 ID CA NS AW ET δ18O 1σ[‰] δ18O 1σ[‰] δ18O 1σ[‰] δ18O 1σ[‰] Remarks Reference values -0.199 0.034 -4.159 0.028 -10.646 0.032 -16.204 0.036 23 N 2 5 11 -0.21 0.2 -4.14 0.2 -10.68 0.2 -16.21 0.2 24 Y 6 4 6.5 -0.20 0.05 -4.14 0.06 -10.64 0.04 -16.19 0.03 25 N 2 3 7 -0.20 0.02 -4.17 0.02 -10.65 0.02 -16.2 0.02 26 N 2 3 4 -0.08 0.2 -4.00 0.2 -10.60 0.2 -16.25 0.2 27 Y 6 1.5 ~12 -0.27 0.1 -4.26 0.1 -10.75 0.1 -16.31 0.1 28 Y 26 -0.45 0.05 -4.44 0.04 -11.00 0.07 -16.66 0.05 29 Y 1 1.5 12 -0.16 0.10 -4.12 0.10 -10.59 0.15 -16.15 0.15 30 Y 0.00001 -0.28 0.25 -3.94 0.24 -10.74 0.24 -16.27 0.23 31 Y 3 0.5 48 -0.43 0.09 -4.31 0.06 -10.78 0.05 32A N 1 0.001 -0.51 0.1 -4.43 0.1 -11.03 0.1 -16.63 0.15 33 N 1 3 5 -0.15 0.06 -4.15 0.03 -10.60 0.02 -16.16 0.03 34 N 2 2 6 -0.22 0.07 -4.18 0.07 -10.69 0.07 -16.25 0.07 35 N 3 2 10 -0.41 0.10 -4.37 0.10 -10.84 0.10 -16.39 0.10 36 Y 3 >24 -0.1 0.1 -4.1 0.2 -10.7 0.2 -16.3 0.2 37 Y 1 3 18-20 -0.503 0.05 -4.457 0.05 -10.960 0.05 -16.526 0.05 See revised data in Table 8 38 Y 2 1 9 -0.26 0.05 -4.22 0.05 -10.71 0.05 -16.27 0.05 39 N 3 4 6 -1.05 0.09 -4.66 0.05 -10.59 0.05 -15.64 0.07 See revised data in Table 8 40 Y 1 0.5 17 -0.169 0.030 -4.104 0.014 -10.612 0.010 -16.208 0.011 41 Y 2 3 4 -0.17 0.1 -4.15 0.1 -10.65 0.1 -16.21 0.1 43 N/Y 1 5 24 -0.29 0.09 -4.45 0.09 -10.92 0.09 -16.45 0.09 44 Y 3 10 -0.19 0.04 -4.17 0.04 -10.68 0.04 -16.29 0.04 45 N 2 0.001 -0.26 0.19 -4.22 0.19 -10.92 0.19 -16.45 0.19 46 Y 5 -0.08 0.07 -4.12 0.07 -10.85 0.07 -16.43 0.07 47 Y 1 2 24 -0.21 0.15 -4.2 0.15 -10.78 0.15 -16.34 0.15 48 Y 1 2 12 -0.42 0.09 -4.17 0.09 -10.52 0.08 -16.05 0.08 49 Y 1 4 6 -0.24 0.04 -4.18 0.03 -10.67 0.04 -16.21 0.02 50 Y 4 -0.2 0.1 -4.2 0.1 -10.7 0.1 -16.2 0.1 51 N 5 2 -0.18 0.06 -4.20 0.05 -10.73 0.05 -16.20 0.06 53 N 2 1 8 -0.21 0.05 -4.16 0.05 -10.63 0.05 -16.20 0.05 54 Y 1 2 2.5 -0.22 0.02 -4.18 0.02 -10.67 0.02 -16.21 0.01 55 N 2 0.4 24 -0.24 0.20 -4.28 0.20 -10.67 0.20 -16.31 0.20 56 N 0.2 12 -0.17 0.2 -4.18 0.2 -11.29 0.2 -17.04 0.2 See revised data in Table 8 57 N 4 3 12 -0.27 0.07 -4.21 0.07 -10.73 0.08 -16.26 0.1
27
IAEA-OH-5 IAEA-OH-6 IAEA-OH-7 IAEA-OH-8 ID CA NS AW ET δ18O 1σ[‰] δ18O 1σ[‰] δ18O 1σ[‰] δ18O 1σ[‰] Remarks Reference values -0.199 0.034 -4.159 0.028 -10.646 0.032 -16.204 0.036 58 3 3 4 -0.19 0.08 -4.17 0.08 -10.66 0.08 -16.20 0.08 59 N 2 4 6 -0.27 0.02 -4.19 0.02 -10.69 0.02 -16.22 0.02 60 N 3 0.5 12 -0.26 0.15 -4.26 0.15 -10.64 0.15 -16.4 0.15 63 N 0.2 8 -0.4443 0.37 -4.4106 0.37 -11.05 0.37 -16.582 0.37 64 N 4 2 10 -0.23 0.03 -4.18 0.03 -10.71 0.03 -16.25 0.03 65 N 2 1 >10 -0.17 0.03 -4.11 0.02 -10.63 0.03 -16.18 0.03 66 Y/N 1 5 4 0.07 0.2 -3.83 0.2 -10.48 0.3 -15.95 0.2 69 N 3 1 9 -0.25 0.04 -4.20 0.04 -10.73 0.04 -16.28 0.04 70 N 6 5 5 -0.23 0.01 -4.17 0.03 -10.69 0.02 -16.22 0.01 71 N 2 2 7 -0.23 0.1 -4.19 0.1 -10.68 0.1 -16.21 0.1 72 N 2 -0.28 0.06 -4.24 0.06 -10.83 0.11 -16.33 0.08 74 Y 1 0.5 24 -0.68 0.15 -4.64 0.15 -11.13 0.15 -16.66 0.15 See revised data in Table 8 75 Y 3 >4 -0.69 0.15 -4.56 0.15 -10.97 0.15 -16.73 0.15 76 N 2 5 -0.21 0.1 -4.14 0.1 -10.68 0.1 -16.21 0.1 77 5 8 -0.17 0.2 -4.12 0.2 -10.57 0.2 -16.13 0.2 78A Y 2 -0.44 0.15 -4.31 0.15 -10.77 0.15 -16.08 0.15 79 Y 1 3 ~12 -0.10 0.05 -4.14 0.05 -10.70 0.03 -16.16 0.04 80 1 2 4 -0.64 0.2 -4.49 0.2 -10.85 0.3 -16.16 0.2 81 Y 5 1 24 -0.24 0.05 -4.17 0.05 -10.65 0.05 -16.16 0.05 82 Y 24 -4.0358 0.0981 -7.948 0.0641 -14.355 0.0947 -19.981 0.1047 83 N 12 -0.2 0.2 -4.1 0.2 -10.3 0.2 -16.2 0.2 86 N 5 3 8 -0.42 0.03 -4.41 0.03 -10.88 0.03 -16.49 0.03 87 N 4 2 8 -0.47 0.08 -4.34 0.09 -10.76 0.08 -16.27 0.04 89 Y 4 3 3.5 -0.35 0.03 -4.29 0.07 -10.76 0.05 -16.38 0.06 90 Y 3 5 9 -0.17 0.02 -4.15 0.02 -10.68 0.02 -16.26 0.02 91 N 2 3 15 -0.29 0.12 -4.34 0.12 -10.76 0.12 -16.31 0.12 92 Y 1 0.3 7 -0.181 0.04 -4.104 0.04 -10.556 0.04 -16.045 0.04 94 N 2 -0.12 0.04 -4.15 0.06 -10.70 0.06 -16.28 0.08 95 Y 2 4 -0.71 0.12 -4.60 0.09 -10.56 0.37 -15.45 0.18
28
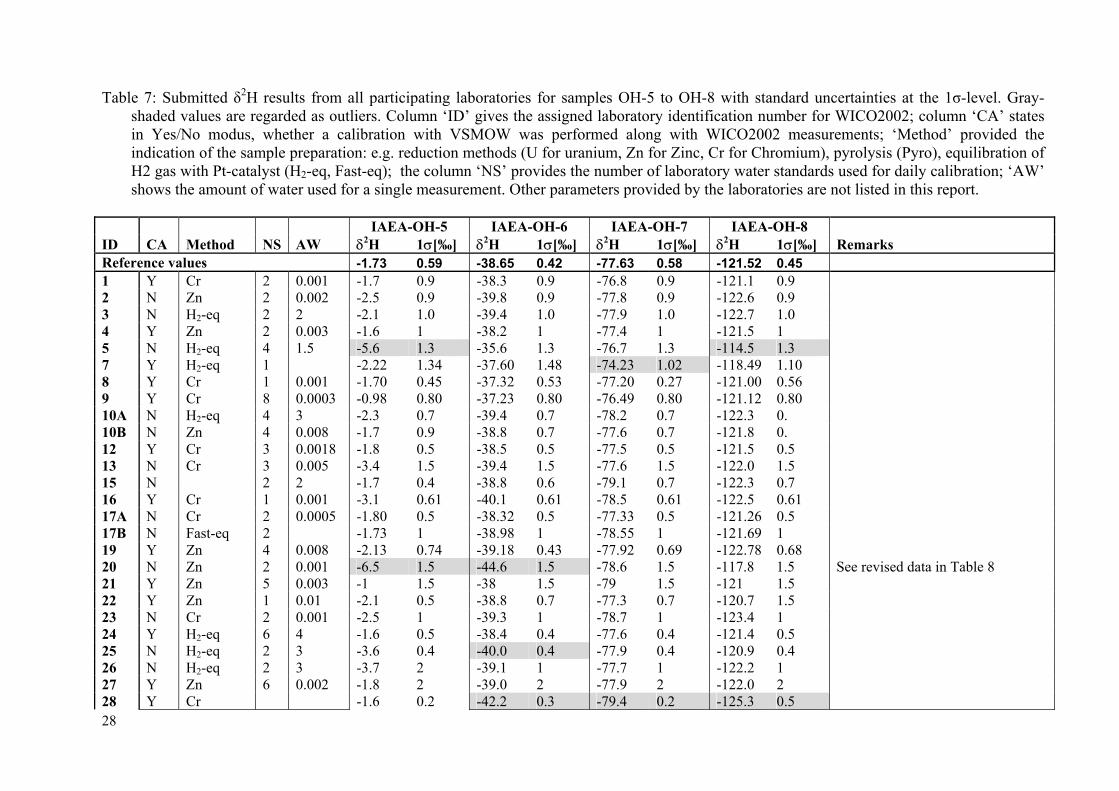
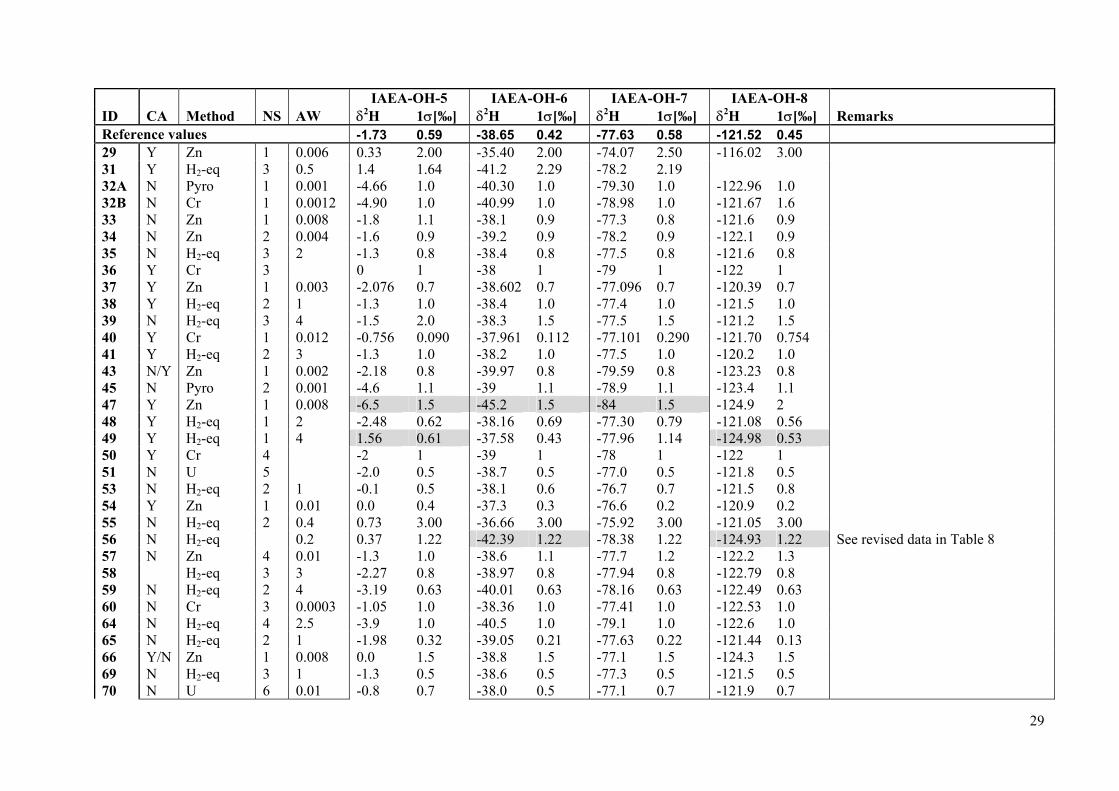
Table 7: Submitted δ2H results from all participating laboratories for samples OH-5 to OH-8 with standard uncertainties at the 1σ-level. Gray-shaded values are regarded as outliers. Column ‘ID’ gives the assigned laboratory identification number for WICO2002; column ‘CA’ states in Yes/No modus, whether a calibration with VSMOW was performed along with WICO2002 measurements; ‘Method’ provided the indication of the sample preparation: e.g. reduction methods (U for uranium, Zn for Zinc, Cr for Chromium), pyrolysis (Pyro), equilibration of H2 gas with Pt-catalyst (H2-eq, Fast-eq); the column ‘NS’ provides the number of laboratory water standards used for daily calibration; ‘AW’ shows the amount of water used for a single measurement. Other parameters provided by the laboratories are not listed in this report.
IAEA-OH-5 IAEA-OH-6 IAEA-OH-7 IAEA-OH-8 ID CA Method NS AW δ2H 1σ[‰] δ2H 1σ[‰] δ2H 1σ[‰] δ2H 1σ[‰] Remarks Reference values -1.73 0.59 -38.65 0.42 -77.63 0.58 -121.52 0.45 1 Y Cr 2 0.001 -1.7 0.9 -38.3 0.9 -76.8 0.9 -121.1 0.9 2 N Zn 2 0.002 -2.5 0.9 -39.8 0.9 -77.8 0.9 -122.6 0.9 3 N H2-eq 2 2 -2.1 1.0 -39.4 1.0 -77.9 1.0 -122.7 1.0 4 Y Zn 2 0.003 -1.6 1 -38.2 1 -77.4 1 -121.5 1 5 N H2-eq 4 1.5 -5.6 1.3 -35.6 1.3 -76.7 1.3 -114.5 1.3 7 Y H2-eq 1 -2.22 1.34 -37.60 1.48 -74.23 1.02 -118.49 1.10 8 Y Cr 1 0.001 -1.70 0.45 -37.32 0.53 -77.20 0.27 -121.00 0.56 9 Y Cr 8 0.0003 -0.98 0.80 -37.23 0.80 -76.49 0.80 -121.12 0.80 10A N H2-eq 4 3 -2.3 0.7 -39.4 0.7 -78.2 0.7 -122.3 0. 10B N Zn 4 0.008 -1.7 0.9 -38.8 0.7 -77.6 0.7 -121.8 0. 12 Y Cr 3 0.0018 -1.8 0.5 -38.5 0.5 -77.5 0.5 -121.5 0.5 13 N Cr 3 0.005 -3.4 1.5 -39.4 1.5 -77.6 1.5 -122.0 1.5 15 N 2 2 -1.7 0.4 -38.8 0.6 -79.1 0.7 -122.3 0.7 16 Y Cr 1 0.001 -3.1 0.61 -40.1 0.61 -78.5 0.61 -122.5 0.61 17A N Cr 2 0.0005 -1.80 0.5 -38.32 0.5 -77.33 0.5 -121.26 0.5 17B N Fast-eq 2 -1.73 1 -38.98 1 -78.55 1 -121.69 1 19 Y Zn 4 0.008 -2.13 0.74 -39.18 0.43 -77.92 0.69 -122.78 0.68 20 N Zn 2 0.001 -6.5 1.5 -44.6 1.5 -78.6 1.5 -117.8 1.5 See revised data in Table 8 21 Y Zn 5 0.003 -1 1.5 -38 1.5 -79 1.5 -121 1.5 22 Y Zn 1 0.01 -2.1 0.5 -38.8 0.7 -77.3 0.7 -120.7 1.5 23 N Cr 2 0.001 -2.5 1 -39.3 1 -78.7 1 -123.4 1 24 Y H2-eq 6 4 -1.6 0.5 -38.4 0.4 -77.6 0.4 -121.4 0.5 25 N H2-eq 2 3 -3.6 0.4 -40.0 0.4 -77.9 0.4 -120.9 0.4 26 N H2-eq 2 3 -3.7 2 -39.1 1 -77.7 1 -122.2 1 27 Y Zn 6 0.002 -1.8 2 -39.0 2 -77.9 2 -122.0 2 28 Y Cr -1.6 0.2 -42.2 0.3 -79.4 0.2 -125.3 0.5
29
IAEA-OH-5 IAEA-OH-6 IAEA-OH-7 IAEA-OH-8 ID CA Method NS AW δ2H 1σ[‰] δ2H 1σ[‰] δ2H 1σ[‰] δ2H 1σ[‰] Remarks Reference values -1.73 0.59 -38.65 0.42 -77.63 0.58 -121.52 0.45 29 Y Zn 1 0.006 0.33 2.00 -35.40 2.00 -74.07 2.50 -116.02 3.00 31 Y H2-eq 3 0.5 1.4 1.64 -41.2 2.29 -78.2 2.19 32A N Pyro 1 0.001 -4.66 1.0 -40.30 1.0 -79.30 1.0 -122.96 1.0 32B N Cr 1 0.0012 -4.90 1.0 -40.99 1.0 -78.98 1.0 -121.67 1.6 33 N Zn 1 0.008 -1.8 1.1 -38.1 0.9 -77.3 0.8 -121.6 0.9 34 N Zn 2 0.004 -1.6 0.9 -39.2 0.9 -78.2 0.9 -122.1 0.9 35 N H2-eq 3 2 -1.3 0.8 -38.4 0.8 -77.5 0.8 -121.6 0.8 36 Y Cr 3 0 1 -38 1 -79 1 -122 1 37 Y Zn 1 0.003 -2.076 0.7 -38.602 0.7 -77.096 0.7 -120.39 0.7 38 Y H2-eq 2 1 -1.3 1.0 -38.4 1.0 -77.4 1.0 -121.5 1.0 39 N H2-eq 3 4 -1.5 2.0 -38.3 1.5 -77.5 1.5 -121.2 1.5 40 Y Cr 1 0.012 -0.756 0.090 -37.961 0.112 -77.101 0.290 -121.70 0.754 41 Y H2-eq 2 3 -1.3 1.0 -38.2 1.0 -77.5 1.0 -120.2 1.0 43 N/Y Zn 1 0.002 -2.18 0.8 -39.97 0.8 -79.59 0.8 -123.23 0.8 45 N Pyro 2 0.001 -4.6 1.1 -39 1.1 -78.9 1.1 -123.4 1.1 47 Y Zn 1 0.008 -6.5 1.5 -45.2 1.5 -84 1.5 -124.9 2 48 Y H2-eq 1 2 -2.48 0.62 -38.16 0.69 -77.30 0.79 -121.08 0.56 49 Y H2-eq 1 4 1.56 0.61 -37.58 0.43 -77.96 1.14 -124.98 0.53 50 Y Cr 4 -2 1 -39 1 -78 1 -122 1 51 N U 5 -2.0 0.5 -38.7 0.5 -77.0 0.5 -121.8 0.5 53 N H2-eq 2 1 -0.1 0.5 -38.1 0.6 -76.7 0.7 -121.5 0.8 54 Y Zn 1 0.01 0.0 0.4 -37.3 0.3 -76.6 0.2 -120.9 0.2 55 N H2-eq 2 0.4 0.73 3.00 -36.66 3.00 -75.92 3.00 -121.05 3.00 56 N H2-eq 0.2 0.37 1.22 -42.39 1.22 -78.38 1.22 -124.93 1.22 See revised data in Table 8 57 N Zn 4 0.01 -1.3 1.0 -38.6 1.1 -77.7 1.2 -122.2 1.3 58 H2-eq 3 3 -2.27 0.8 -38.97 0.8 -77.94 0.8 -122.79 0.8 59 N H2-eq 2 4 -3.19 0.63 -40.01 0.63 -78.16 0.63 -122.49 0.63 60 N Cr 3 0.0003 -1.05 1.0 -38.36 1.0 -77.41 1.0 -122.53 1.0 64 N H2-eq 4 2.5 -3.9 1.0 -40.5 1.0 -79.1 1.0 -122.6 1.0 65 N H2-eq 2 1 -1.98 0.32 -39.05 0.21 -77.63 0.22 -121.44 0.13 66 Y/N Zn 1 0.008 0.0 1.5 -38.8 1.5 -77.1 1.5 -124.3 1.5 69 N H2-eq 3 1 -1.3 0.5 -38.6 0.5 -77.3 0.5 -121.5 0.5 70 N U 6 0.01 -0.8 0.7 -38.0 0.5 -77.1 0.7 -121.9 0.7
30
IAEA-OH-5 IAEA-OH-6 IAEA-OH-7 IAEA-OH-8 ID CA Method NS AW δ2H 1σ[‰] δ2H 1σ[‰] δ2H 1σ[‰] δ2H 1σ[‰] Remarks Reference values -1.73 0.59 -38.65 0.42 -77.63 0.58 -121.52 0.45 71 N H2-eq 2 2 -0.5 1 -37.8 1 -76.9 1 -121.7 1 72 N Zn 2 0.003 -3.2 0.4 -40.6 0.6 -80.4 0.6 -125.0 0.6 See revised data in Table 8 74 Y Zn 1 0.005 -6.8 1.0 -42.4 1 -80.2 1 -124.2 1 See revised data in Table 8 76 N Cr 2 0.001 -1.17 1.0 -38.34 1.0 -77.4 1.0 -121.82 1.0 78A Y H2-eq 2 -1.6 1.0 -38.6 1.0 -76.5 1.0 -120.7 1.0 78B Y U 2 -1.1 0.7 -38.5 0.7 -76.8 0.7 -120.7 0.7 79 Y Cr 1 0.001 -2.2 0.7 -38.2 1.1 -79.5 0.7 -123.0 0.7 80 Cr 1 -5.9 1.6 -44.6 1.8 -86.5 1.7 -132.1 2.0 81 Y U 5 0.01 -3.3 0.6 -39.7 0.6 -79.3 0.7 -121.4 1 86 N H2-eq /Zn 5 3 -4.5 1.8 -41.3 1.8 -79.8 1.8 -124.1 1.8 89 Y Zn 4 0.006 -2.46 0.25 -38.87 0.38 -78.12 0.22 -123.12 0.31 90 Y H2-eq 3 5 -1.8 0.7 -39.1 0.7 -78.1 0.7 -121.9 0.7 91 N Zn 2 0.01 -1.5 1.2 -38.1 1.2 -77.3 1.2 -121.6 1.2 94 N H2-eq 2 -1.22 0.54 -37.98 0.77 -77.03 0.93 -122.74 0.54 95 Y Zn 0.004 -6.3 1.2 -40.8 1.5 -81.2 2.7 -129.7 1.3
Table 8: Values re-submitted after the reporting deadline after notification of possible problems. These datasets were not used for the statistical evaluation and graphical display of results.
OH-5 OH-6 OH-7 OH-8 OH-5 OH-6 OH-7 OH-8 ID δ18O δ18O δ18O δ18O δ2H δ2H δ2H δ2H Remarks 09 -0.46 -4.5 -11.07 -16.74 -0.98 -37.23 -76.49 -121.12 20 -0.67 -5.07 -11.28 -16.98 -5.1 -45.2 -78.8 -119.3 37 -0.25 -4.204 -10.707 -16.273 -2.076 -38.602 -77.096 -120.394 Improvement 39 -0.12 -4.15 -10.75 -16.39 -1.5 -38.3 -77.5 -121.2 Improvement 56 -0.28 -4.22 -10.64 -16.47 0.42 -38.89 -75.29 -126.73 72 -0.28 -4.24 -10.83 -16.33 -1.7 -38.6 -77.5 -121.5 Improvement 74 -0.35 -4.38 -10.79 -16.45 -0.9 -38.1 -76.9 -122.2 Improvement
31
APPENDIX II. LIST OF PARTICIPANTS
Note: This list is sorted alphabetically by country and is not related to the assigned Laboratory ID number used throughout the report.
John Dighton CSIRO Land and Water Waite Rd. Urrbrae South Australia 5064 Australia +61 (-8) -8303 8719 +61 (-8) -8303 8750 (FAX) [email protected] Liliana Andreescu & Michael van Duren Isotope Hydrology Laboratory International Atomic Energy Agency Wagramerstrasse 5, P.O. Box 100 A-1400 Vienna Austria +43 (-1) -2600-21765 +43-1-2600-7 (FAX) [email protected] Albrecht Leis Joanneum Research Forschungsgesellschaft mbH Inst. of Hydrogeology and Geothermics Elisabethstrasse 16/II A-8010 Graz Austria +43 (316) 876-1485 +43 (316) 876-1321 (FAX) [email protected] Wolfgang Papesch ARC Seibersdorf research GmbH Abt. Umweltforschung Faradaygasse 3, Obj. 214 A-1030 Wien Austria +43 (0)50 550 6500 +43 (0)50 550 6587 (FAX) [email protected] Christoph Spötl Institut für Geologie und Paläontologie Universität Innsbruck Innrain 52 6020 Innsbruck Austria +43 (512) 507 5593
+43 512 507 2914 (FAX) [email protected] Dr. Marcelo Moreira Av. CENTENARIO, 303 Piracicaba - SP 13416-000 Brazil10 +55 (19) 3434 9210 (FAX) [email protected] A. Richard Heemskerk Environmental Isotope Laboratory Department of Earth Science University of Waterloo 263 Philip Street Waterloo, Ontario N2L 3G1 Canada +1 (519) -888-4567 ext:5838 +1 (519) -746-0183 (FAX) [email protected] Geoff Koehler [NHRC] Stable Isotope Research Chemist EC Stable Isotope Hydrology and Ecology
Laboratory Environment Canada 11 Innovation Blvd. Saskatoon, SK, S7N 3H5 Canada +1 306 975 5778 +1 306-975-5143 (FAX) [email protected] Tim Prokopiuk Isotope Lab Department of Geological Sciences University of Saskatchewan 114 Science Place Saskatoon, Saskatchewan S7N 5E2 Canada +1 306 966-5712 +1 (306) 966-8593 (FAX) [email protected] Stephen Taylor
32
Isotope Science Laboratory Dept of Physics & Astronomy University of Calgary 2500 University Dr. Calgary, Alberta T2N 1N4 Canada +1 403 220 8268 +1 403 220 7773 (FAX) [email protected] Evelyn Aguirre D. Jefe de Laboratorio de Isotopos Ambientales Comision Chilena de Energía Nuclear Cen La Reina Nueva Bilbao 12501 188 D Santiago, Casilla Chile +56 (-2) –3646113 +56 (-2) – 3646277 (FAX) [email protected] Xiaorong Luo Kay Laboratory of Mineral Resources, Institute of Geology and Geophysics, CAS Datunlu No A 11 Beijing 100101 China (86) 10 6488 9076 (86) 10 6488 9849 (FAX) [email protected] Aly Islam Metwally Aly Central Laboratory for Environmental IsotopeHydrology Egyptian Atomic Energy Authority 3 Ahmed El-Zomor Street El Zohor district, Nasr City Cairo Postal code 11787 Egypt +20 (00202) 2878663 +20 (00202) 2878662 (FAX) [email protected] Wilmer Guevara Laboratorio de Isótopos Geotérmica Salvadoreña S.A. de C.V. Km111/2 Carretera al Puerto La Libertad Colonia Utila Nueva San Salvador La Libertad EL SALVADOR +503 211 6742 (503)211 6743 (FAX)
[email protected] Juha Karhu Geological Survey of Finland Laboratory for isotope geology P.O. BOX 96 (Betonimiehenkuja 4) FIN-02151 Espoo Finland +358 (-20) 550 12 (FAX) [email protected] Olivier Cattani LSCE CEA SACLAY bt 709 orme des merisiers 91191 cedex Gif sur Yvette France +33 33169083412 +33 33169087716 (FAX) [email protected] C. Flehoc BRGM - ANA/ISO 3 avenue C. Guillemin BP 6009 45060 Orléans cedex 2 France +33 (2) 38 64 39 25 (FAX) [email protected] Jean-Luc Michelot FRE CNRS-UPS "OrsayTerre" Universite de Paris-Sud, Bat. 504 91405 Orsay France +33 (1) 6915 6791 +33 (1) 6915 4917 (FAX) [email protected] Yannick Poirier Exploration & Production Geoscience Technologies TotalFinaElf Fluids and Organic Geochemistry L2 1071 CSTJF Avenue Larribau 64018 PAU cedex France +33 (0) 5 59 83 49 04 +33 (0) 5 59 83 46 48 (FAX) [email protected] Guerin Régis EUROFINS
33
Site de la Géraudière Rue Pierre Adolphe Bobierre B.P. 42301 44323 NANTES cedex 3 France +33 (+33) 2-51-83-21-00 +33 (+33) 2-51-83-21-11 (FAX) [email protected] Yves Travi Laboratoire d'Hydrogéologie Faculté des Sciences Université d'Avignon 33 rue Pasteur 84000 Avignon France +33 (33) 4 90144489 (FAX) [email protected] Christel Facklam Institut fuer Umweltphysik Universitaet Heidelberg Im Neuenheimer Feld 229 D-69120 Heidelberg Germany +49-6221-546366 +49-6221-546405 (FAX) [email protected] Hilmar Förstel Forschungszentrum Jülich ICG IV (im Gebäude 05.3, ISR-3) 52425 Jülich Germany +49 (2461) 61 2277 (FAX) [email protected] Matthias Gehre UFZ Umweltforschungszentrum Leipzig-Halle
GmbH Labor für Stabile Isotope Permoserstr.15 04318 Leipzig Germany +49 (0341) 235 2252 +49 (0341) 235 2625 (FAX) [email protected] Paul Koeniger Institute of Hydrology University of Freiburg Fahnenbergplatz 79098 Freiburg i. Br. Germany
+49 (0) 761 203 3519 +49 (0) 761 2033594 (FAX) [email protected] Hanno Meyer Isotope Laboratory of the Alfred Wegener Institute for Polar and Marine Research Research Unit Potsdam Telegrafenberg A 43 14473 Potsdam Germany +49 (-331) -288-2115 +49 (-331) -288-2137 (FAX) [email protected] Manfred Schmitt GCA-Labor-MS Geochemische Analysen GCA Glück-Auf-Strasse 50 D-31319 Sehnde Germany +49 +49513253579 +49 +49513256346 (FAX) [email protected] Willibald Stichler GSF Research Center for Environment and
Health Institute of Hydrology Ingolstädter Landstrasse 1 D-85764 Neuherberg Germany +49 (89) 3187-2566 +49 (89) 3187-3361 (FAX) [email protected] Axel Suckow Institut für Geowissenschaftliche
Gemeinschaftsaufgaben (GGA) Leibniz Institute for Applied Geosciences, Geochronology and Isotope Hydrology (S3) Stilleweg 2 30655 Hannover Germany +49 (511) 6432527 +49 (511) 6433665 (FAX) [email protected] Istvan Fsrizs Laboratory for Geochemical Research Hungarian Academy of Sciences Budaörsi út 45. H-1112 Budapest Hungary
34
+36 (36) -1)-309-2600 / mellék/extension 1151 +36 (36) -1)-319-3137 (FAX) [email protected] S.K. Bhattacharya Planetary and Geosciences Division Physical Research Laboratory Navrangapura Ahmedabad 380 009 India +91 (-079) –6302129 +91 (-079) –6301502 (FAX) [email protected] M.S. Sheshshayee Assistant Professor Department of Crop Physiology National Facility for Stable isotopes University of Agricultural Sciences GKVK Campus BANGALORE 560 065 India +91 (80) 363 6713 [email protected] Miryam Bar-Matthews The Geological Survey of Israel 30 Malchei Israel St Jerusalem 95501 Israel +972 (972) 2 5314297 +972 (972) 2 5380688 (FAX) [email protected] Ruth Yam Department of Environmental Sciences and
Energy Research Weizmann Institute of Science 76100 , Rehovot Israel +972 (-8) –9343431 +972 (-8) –9344124 (FAX) [email protected] Enrico Allais ISO4 s.s c/o Dipartimento di Scienze della Terra Via Valperga Caluso 35 10125 Torino Italy +39 (011) 655027 +39 (011) 655027 (FAX) [email protected]
Stenni Barbara University of Trieste Dipartimento di Scienze Geologiche,
Ambientali e Marine Laboratorio di Geochimica Isotopica Via E. Weiss 2 34127 Trieste Italy +39-040-5582153/4 +39-040-5582152 (FAX) [email protected] Enrico Calvi National Research Council of Italy Institute of Geosciences and Earth Resources Via G. Moruzzi, 1 56124 PISA Italy +39 (050) 315 2312 +39 (050) 315 2322 (FAX) [email protected] Luca D'Amelio Centro Geochimica Isotopica Geokarst Engineering s.r.l. AREA Science Park Padriciano 99 34012 Trieste Italy +39 (040) 375 5662 +39 (040) 375 5562 (FAX) [email protected] Antonio Longinelli University of Parma Department of Earth Sciences Laboratory of Isotope Geochemistry Parco Area delle Scienze 157/A 43100 PARMA Italy +39 (521) 905321 +39 (521) 905305 (FAX) [email protected] Naoki Kabeya Forest Hydrology Laboratory Department of Soil and Water Conservation Forestry and Forest Products Research
Institute(FFPRI) P. O. Box 16 Tsukuba Norin Ibaraki 305-8687 Japan +81 (-298) -74-3720 (FAX)
35
[email protected] Masahiro Koike Institute of Industrial Science University of Tokyo 4-6-1 Komaba Meguro-ku Tokyo 153-8505 Japan +81 (-3) -5452-6381 +81 (-3) -5452-6383 (FAX) [email protected] Atsuko Sugimoto Center for Ecological Research Kyoto University Kamitanakami Hiranocho Otsu 520-2113 Japan +81 (-77) -549-8200 +81 (-77) -549-8201 (FAX) [email protected] Naohiro Yoshida Frontier Collaborative Research Center Department of Environmental Science and
Technology Department of Environmental Chemistry and
Engineering Tokyo Institute of Technology G5-204, 4259 Nagatsuta, Midori-ku Yokohama 226-8502 Japan +81 (-45) -924-5506 +81 (-45) -924-5506 (FAX) [email protected] Susan Kilani Head of Environmental Isotope Section Environmental Isotope Section Laboratories and Water Control Department Industry Street - Biader Wadi Esseer Next to the Civil Defence Department Amman Jordan +962 (6) 58643761 / 2 +962 (6) 5825275 (FAX) [email protected] Abdessalam Elhamdaoui CNESTEN 65 Rue Tansift Agdal Rabat
Morocco 21237711940 (FAX) [email protected] Harro A.J. Meijer Centrum voor IsotopenOnderzoek Nijenborgh 4 9747 AG Groningen Netherlands +31 (-50) –3634760 +31 (-50) –3634738 (FAX) [email protected] Kevin Faure Institute of Geological & Nuclear Sciences Rafter Stable Isotope Laboratory 30 Gracefield Road/PO Box 31-312 Lower Hutt New Zealand +64 (-4) –5704638 +64-4-5704657 (FAX) [email protected] Ingar Johansen dep.Engineer Institutt for Energiteknikk dep. Environmental Technology po box 40 2027 Kjeller Norway +47 (6380) 6000 +47 (6381) 5553 (FAX) [email protected] Mohammad Azam Tasneem Head Mass Spectrometer Laboratory Radiation and Isotope Application Division Pakistan Institute of Nuclear Science &
Technology P. O. Nilore, Islamabad Pakistan +92 (51) 9290261 +92 (51) 9290275 (FAX) [email protected] Rowena Isidro Central Chemistry Laboratory Section Geoscientific Department PNOC Energy Development Corporation PNPC Complex Fort Bonifacio, 1201 Makati City Philippines (632) 893 6001 loc. 1302
36
(632) 840 1580 (FAX) Rowena_A._Isidro/[email protected] Marek Dulinski Faculty of Physics and Nuclear Techniques University of Mining and Metallurgy al. Mickiewicza 30 30-059 Krakow Poland +48 (12) 634-00-10 (FAX) [email protected] Stanislaw Halas Mass Spectrometry Laboratory Institute of Physics Maria Curie-Sklodowska University 20-031 Lublin Poland +48 (81) 537 6275 +48 (81) 537 6191 (FAX) [email protected] Adam Porowski Department of Hydrogeology Institute of Geological Sciences Polish Academy of Sciences ul. Twarda 51/55 00-818 Warsaw Poland +48 (22) 697-87-56 +48 (22) 620-62-23 (FAX) [email protected] Sonja Lojen Department of Environmental Sciences J. Stefan Institute Jamova 39 Ljubljana 1000 Slovenia +386 (1) 5885 393 +386 (1) 5885 346 (FAX) [email protected] Michael Butler Schonland Research Institute University of the Witwatersrand Empire Road East Campus Johannesburg 2050 South Africa +27 (11) 717 6924 +27 (11) 717 6932 (FAX) [email protected]
Siep Talma Room 063, building 4E CSIR campus Meiring Naude road Lynnwood, Pretoria South Africa +27 +2712 841-3402 +27 +2712 349-1170 (FAX) [email protected] Sang-Tae Kim Stable Isotope Laboratory Department of Earth and Environmental
Sciences Korea University 1, 5ka, Anam-dong, Sungbuk-ku, Seoul 136-701 South Korea +82- (0) 19-255-0708 +82 (-2) -927-6180 (FAX) [email protected] Antonio Delgado Huertas Laboratorio de Isotopos Estables Depto. Ciencias de la Tierra y Quimica
Ambiental Estacion Experimental del Zaidin CSIC Prof. Albareda 1 18008 Granada Spain +34 (-958) –121011 +34 (-958) –129600 (FAX) [email protected] Mari Fe Diaz Teijeiro Laboratorio de Hidrologia Isotopica Centro de Estudios de Tecnicas Aplicadas -
CETA Centro de Estudios y Experimentacion -
CEDEX C/ Alfonso XII, 3 y 5 28014 MADRID Spain +34 (91) 335 72 64 +34 (91) 335 72 67 (FAX) [email protected] Ramón Redondo-Ortega Laboratorio de Isótopos Estables. SIdI Facultad de Ciencias, C-IX Universidad Autónoma de Madrid 28049 Madrid Spain
37
+34 (-91) –2073529 (FAX) [email protected] Pilar Teixidor University of Barcelona Serveis Cientificotecnics C/Lluis Sole sabaris, 1-3 08028-Barcelona Spain +34 (93) 4021694 +34 (93) 4021398 (FAX) [email protected] Markus Fette EAWAG/ETH Swiss Federal Institute for Environmental
Science and Technology Limnological Research Center Seestr. 79 6047 Kastanienbaum Switzerland +41 (-41) -349.21 68 +41 (-41) -349.21 68 (FAX) [email protected] Markus C. Leuenberger Climate and Environmental Physics Physics Institute Universität Bern Sidlerstrasse 5 3012 Bern Switzerland +41 (/ 631) 44 70 +41 (0) 31 631 87 42 (FAX) [email protected] Matthias Saurer Paul Scherrer Institute CH-5232 Villigen PSI Switzerland +41 (56) 310 27 49 +41 (56) 310 45 25 (FAX) [email protected] Jorge E. Spangenberg Stable Isotopes Laboratory Institute of Mineralogy and Geochemistry University of Lausanne BFSH 2 CH 1015 Lausanne Switzerland +41 (21) 692 4365 (office) +41 (21) 692 4305 (FAX) [email protected]
Chung-Ho Wang, Stable Isotope Laboratory Institute of Earth Sciences Academia Sinica No.128, Section II Yen-Chiu-Yuan Road Nankang Taipei Taiwan 11529 Taiwan +886 (-2) -2783-9910 ext.513 +886 (-2) -2651-1795 (FAX) [email protected] Carol Arrowsmith NERC Isotope Geosciences Laboratory Keyworth Nottingham NG12 5GG United Kingdom +44 (0) 115 936 3302 (FAX) [email protected] L. Baker PSSRI The Open University Walton Hall Milton Keynes MK7 6AA United Kingdom +44 (1908) 659674 +44 (1908) 858022 (FAX) [email protected] Johannes Barth Scottish Universities Environmental Research
Centre - SUERC Rankine Avenue East Kilbride G75 0QF Scotland United Kingdom +44 (0) 1355 270146 +44 (0) 1355 229898 (FAX) [email protected] Ian Begley Iso-Analytical Limited Unit 2 Zan Industrial Park Sandbach Cheshire CW11 4QD United Kingdom
38
+44 (1270) 766771 +44 (1270) 766709 (FAX) [email protected] W. George Darling British Geological Survey Maclean Building Wallingford Oxon OX10 8BB United Kingdom +44 +1491 692345 (FAX) [email protected] Simon Hird IRMS and NMR section Consumer Protection Food Quality and Safety Central Science Laboratory Sand Hutton York YO41 1LZ United Kingdom +44 (0) 1904 462567 +44 (0) 1904 462111 (FAX) [email protected] Tyler B. Coplen Reston Stable Isotope Laboratory U.S. Geological Survey 431 National Center 12201 Sunrise Valley Drive Reston, VA 20192 USA [email protected] David L. Dettman Dept. of Geosciences Univ. of Arizona Gould-Simpson Bldg. Tucson, AZ 85721 USA +1 (520) 621-4618 +1 (520) 621-2672 (FAX) [email protected] Derek Esposito Natural Resource Ecology Lab Colorado State University Fort Collins Colorado 80523-1499 USA +1 (970) 491-7715 (FAX) [email protected] Zheng-Hua Li
Stable Isotope Lab 306 G&G Building Dept of Geological Sciences University of Tennessee Knoxville TN 37996 USA +1 (-865) -974-9622 +1 (-865) -974-2368 (FAX) [email protected] Madhav Machavaram Mailstop 70A-4418, ESD/CIG E. O. Lawrence Berkeley National Laboratory 1Cyclotron Road Berkeley CA 94720 USA +1 510-486-5026 +1 510-486-5496 (FAX) [email protected] Steven Pelphrey Isotech Laboratories, Inc. 1308 Parkland Court Champaign, IL 61821 USA +1 217-398-3490 +1 217-398-3493 (FAX) [email protected] Libby Stern Department of Geological Sciences 23rd and San Jacinto University of Texas Austin TX 78705-1100 USA +971 512-471-9425 (FAX) [email protected] Peter Swart University of Miami 4600 Rickenbacker Causeway Miami, Fl 33149 USA +1 305 361 4103 +1 305 361 4632 (FAX) [email protected] Bruce H. Vaughn Institute of Arctic and Alpine Research UCB 450 INSTAAR University of Colorado 1560 30th Street Boulder CO 80309

39
USA +1 303-492-7985 +1 303-492-6388 (FAX) [email protected] Dave Winter University of California, Davis One Shields Avenue Physics/Geology Building
Geology Room 282 Davis, California 95616 USA +1 (530) 752-3307 +1 (530) 752-0951 (FAX) [email protected]
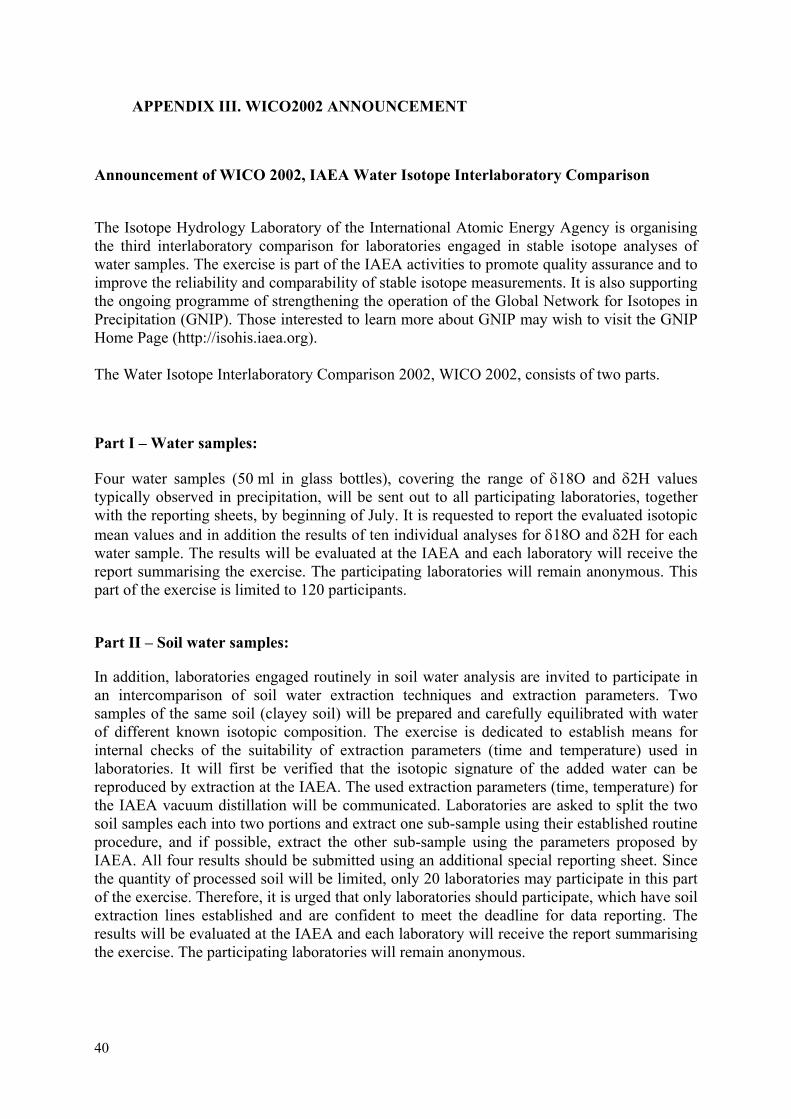
40
APPENDIX III. WICO2002 ANNOUNCEMENT
Announcement of WICO 2002, IAEA Water Isotope Interlaboratory Comparison
The Isotope Hydrology Laboratory of the International Atomic Energy Agency is organising the third interlaboratory comparison for laboratories engaged in stable isotope analyses of water samples. The exercise is part of the IAEA activities to promote quality assurance and to improve the reliability and comparability of stable isotope measurements. It is also supporting the ongoing programme of strengthening the operation of the Global Network for Isotopes in Precipitation (GNIP). Those interested to learn more about GNIP may wish to visit the GNIP Home Page (http://isohis.iaea.org). The Water Isotope Interlaboratory Comparison 2002, WICO 2002, consists of two parts.
Part I – Water samples:
Four water samples (50 ml in glass bottles), covering the range of δ18O and δ2H values typically observed in precipitation, will be sent out to all participating laboratories, together with the reporting sheets, by beginning of July. It is requested to report the evaluated isotopic mean values and in addition the results of ten individual analyses for δ18O and δ2H for each water sample. The results will be evaluated at the IAEA and each laboratory will receive the report summarising the exercise. The participating laboratories will remain anonymous. This part of the exercise is limited to 120 participants.
Part II – Soil water samples:
In addition, laboratories engaged routinely in soil water analysis are invited to participate in an intercomparison of soil water extraction techniques and extraction parameters. Two samples of the same soil (clayey soil) will be prepared and carefully equilibrated with water of different known isotopic composition. The exercise is dedicated to establish means for internal checks of the suitability of extraction parameters (time and temperature) used in laboratories. It will first be verified that the isotopic signature of the added water can be reproduced by extraction at the IAEA. The used extraction parameters (time, temperature) for the IAEA vacuum distillation will be communicated. Laboratories are asked to split the two soil samples each into two portions and extract one sub-sample using their established routine procedure, and if possible, extract the other sub-sample using the parameters proposed by IAEA. All four results should be submitted using an additional special reporting sheet. Since the quantity of processed soil will be limited, only 20 laboratories may participate in this part of the exercise. Therefore, it is urged that only laboratories should participate, which have soil extraction lines established and are confident to meet the deadline for data reporting. The results will be evaluated at the IAEA and each laboratory will receive the report summarising the exercise. The participating laboratories will remain anonymous.
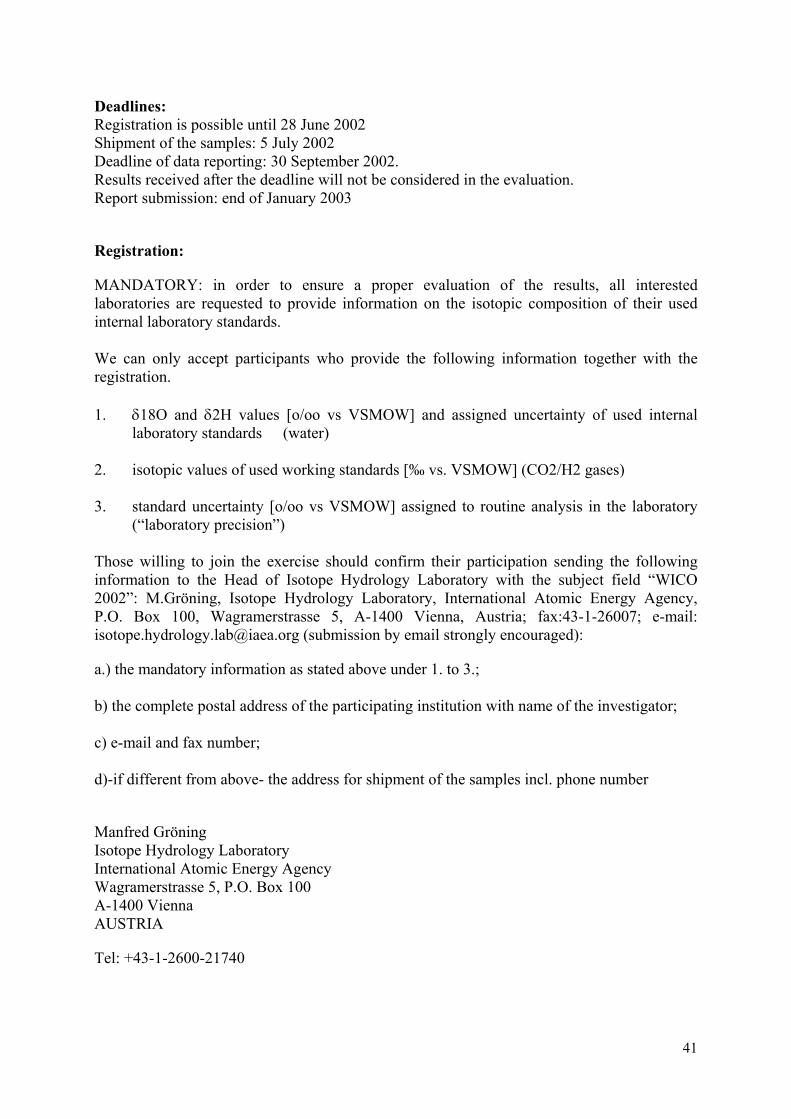
41
Deadlines: Registration is possible until 28 June 2002 Shipment of the samples: 5 July 2002 Deadline of data reporting: 30 September 2002. Results received after the deadline will not be considered in the evaluation. Report submission: end of January 2003
Registration:
MANDATORY: in order to ensure a proper evaluation of the results, all interested laboratories are requested to provide information on the isotopic composition of their used internal laboratory standards. We can only accept participants who provide the following information together with the registration. 1. δ18O and δ2H values [o/oo vs VSMOW] and assigned uncertainty of used internal laboratory standards (water) 2. isotopic values of used working standards [‰ vs. VSMOW] (CO2/H2 gases) 3. standard uncertainty [o/oo vs VSMOW] assigned to routine analysis in the laboratory (“laboratory precision”) Those willing to join the exercise should confirm their participation sending the following information to the Head of Isotope Hydrology Laboratory with the subject field “WICO 2002”: M.Gröning, Isotope Hydrology Laboratory, International Atomic Energy Agency, P.O. Box 100, Wagramerstrasse 5, A-1400 Vienna, Austria; fax:43-1-26007; e-mail: [email protected] (submission by email strongly encouraged):
a.) the mandatory information as stated above under 1. to 3.; b) the complete postal address of the participating institution with name of the investigator; c) e-mail and fax number; d)-if different from above- the address for shipment of the samples incl. phone number
Manfred Gröning Isotope Hydrology Laboratory International Atomic Energy Agency Wagramerstrasse 5, P.O. Box 100 A-1400 Vienna AUSTRIA
Tel: +43-1-2600-21740
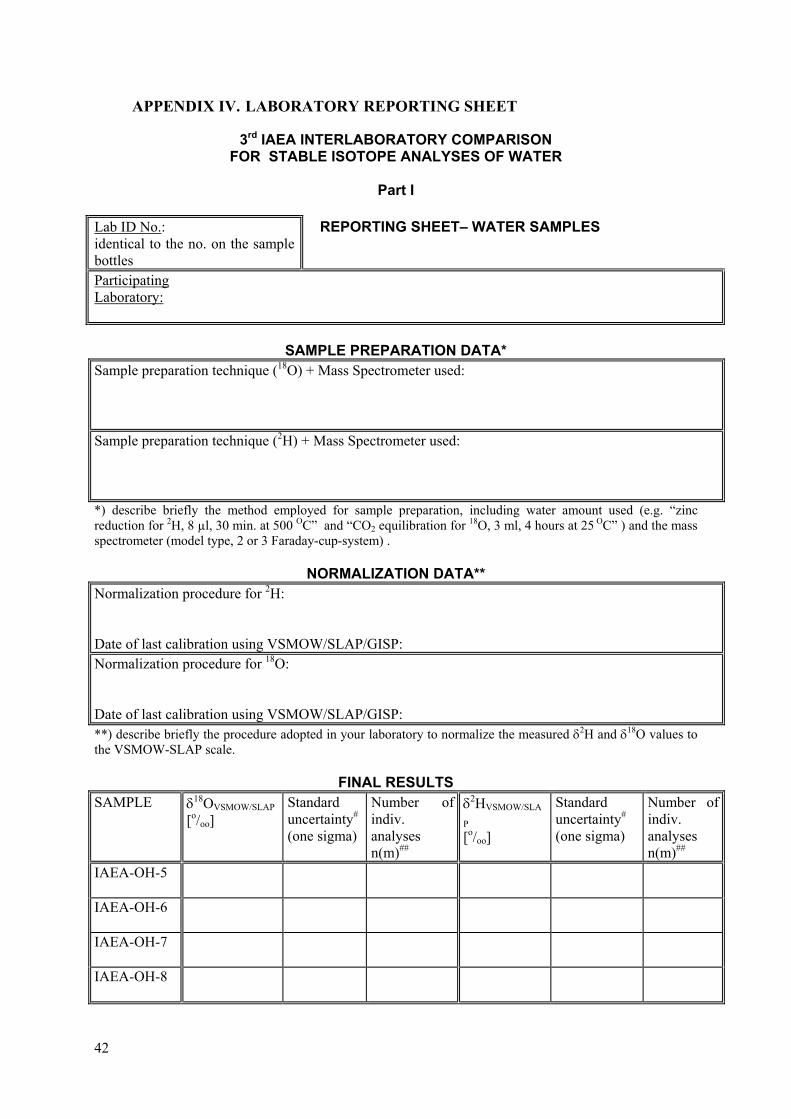
42
APPENDIX IV. LABORATORY REPORTING SHEET
3rd IAEA INTERLABORATORY COMPARISON FOR STABLE ISOTOPE ANALYSES OF WATER
Part I
Lab ID No.: identical to the no. on the sample bottles
REPORTING SHEET– WATER SAMPLES
Participating Laboratory:
SAMPLE PREPARATION DATA* Sample preparation technique (18O) + Mass Spectrometer used: Sample preparation technique (2H) + Mass Spectrometer used: *) describe briefly the method employed for sample preparation, including water amount used (e.g. “zinc reduction for 2H, 8 µl, 30 min. at 500 OC” and “CO2 equilibration for 18O, 3 ml, 4 hours at 25 OC” ) and the mass spectrometer (model type, 2 or 3 Faraday-cup-system) .
NORMALIZATION DATA** Normalization procedure for 2H: Date of last calibration using VSMOW/SLAP/GISP: Normalization procedure for 18O: Date of last calibration using VSMOW/SLAP/GISP: **) describe briefly the procedure adopted in your laboratory to normalize the measured δ2H and δ18O values to the VSMOW-SLAP scale.
FINAL RESULTS SAMPLE δ18OVSMOW/SLAP
[o/oo] Standard uncertainty# (one sigma)
Number of indiv. analyses n(m)##
δ2HVSMOW/SLA
P [o/oo]
Standard uncertainty# (one sigma)
Number of indiv. analyses n(m)##
IAEA-OH-5
IAEA-OH-6
IAEA-OH-7
IAEA-OH-8
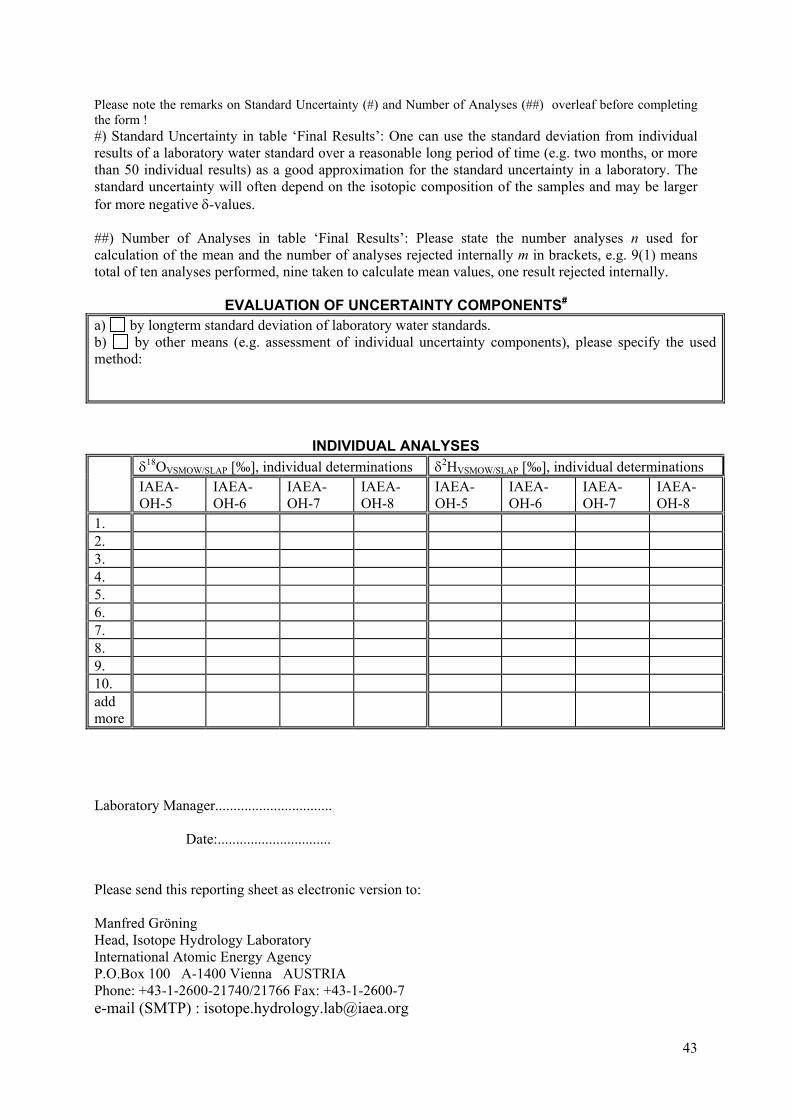
43
Please note the remarks on Standard Uncertainty (#) and Number of Analyses (##) overleaf before completing the form ! #) Standard Uncertainty in table ‘Final Results’: One can use the standard deviation from individual results of a laboratory water standard over a reasonable long period of time (e.g. two months, or more than 50 individual results) as a good approximation for the standard uncertainty in a laboratory. The standard uncertainty will often depend on the isotopic composition of the samples and may be larger for more negative δ-values. ##) Number of Analyses in table ‘Final Results’: Please state the number analyses n used for calculation of the mean and the number of analyses rejected internally m in brackets, e.g. 9(1) means total of ten analyses performed, nine taken to calculate mean values, one result rejected internally.
EVALUATION OF UNCERTAINTY COMPONENTS# a) by longterm standard deviation of laboratory water standards. b) by other means (e.g. assessment of individual uncertainty components), please specify the used method:
INDIVIDUAL ANALYSES δ18OVSMOW/SLAP [‰], individual determinations δ2HVSMOW/SLAP [‰], individual determinations IAEA-
OH-5 IAEA- OH-6
IAEA- OH-7
IAEA- OH-8
IAEA- OH-5
IAEA- OH-6
IAEA- OH-7
IAEA- OH-8
1. 2. 3. 4. 5. 6. 7. 8. 9. 10. add more
Laboratory Manager................................ Date:............................... Please send this reporting sheet as electronic version to: Manfred Gröning Head, Isotope Hydrology Laboratory International Atomic Energy Agency P.O.Box 100 A-1400 Vienna AUSTRIA Phone: +43-1-2600-21740/21766 Fax: +43-1-2600-7 e-mail (SMTP) : [email protected]