Sup Figure1 160707 - media.nature.com · aagatacgattactacggtagtagctactttgactactgg LP IgA ......
10
40 80 120 160 40 80 120 LP BM Spl LP BM Spl CT-specific AFC Serum anti-CT titres IgG IgA 4 3 2 20 40 60 80 100 Weeks after immunization log 10 titer IgA IgG AFC/10 6 cells a b c 1:1 1:2 1:3 2:1 2:2 2:3 3:2 3:1 3:3 P:1 P:2 P:3 P:4 P:5 P:6 BM IgG1 BM IgA LP IgA BM IgG2b Supplementary Fig. 1. Oral immunization with NP-CT generates long-lived plasma cells. (a,b) Wild type C57BL/6 mice were orally immunized with NP-CT as in Fig. 1 and (a) the titres of antibodies against CT (IgG = diamonds and IgA = squares with error bars indicating s.d.) were analyzed for 90 weeks and (b) the number of CT-specific AFC were identified in lamina propria (LP), bone marrow (BM) and spleen (Spl) in mice immunized 1 year before analysis. (c) A Clustal Omega analysis was performed on sequences from three mice to identify sequence similarities. Analysis of three individual mice are shown to the left and to a pool of three distinct mice to the right. Clones that share CDR3 VDJ rearrangements are marked with black lines; the CDR3 region and clonal mutations of these clones are shown in Supplementary Fig. 2.
Transcript of Sup Figure1 160707 - media.nature.com · aagatacgattactacggtagtagctactttgactactgg LP IgA ......

40
80
120
160
40
80
120
LP BM SplLP BM Spl
CT-specific AFCSerum anti-CT titres
IgGIgA
4
3
2
20 40 60 80 100Weeks after immunization
log 10
tite
r
IgA IgG
AFC
/106 c
ells
a b
c1:1
1:2
1:3
2:1
2:2
2:3
3:2
3:1
3:3
P:1
P:2
P:3P:4
P:5
P:6
BM IgG1BM IgALP IgA
BM IgG2b
Supplementary Fig. 1. Oral immunization with NP-CT generates long-lived plasma cells.(a,b) Wild type C57BL/6 mice were orally immunized with NP-CT as in Fig. 1 and (a) the titres of antibodies against CT (IgG = diamonds and IgA = squares with error bars indicating s.d.) were analyzed for 90 weeks and (b) the number of CT-specific AFC were identified in lamina propria (LP), bone marrow (BM) and spleen (Spl) in mice immunized 1 year before analysis. (c) A Clustal Omega analysis was performed on sequences from three mice to identify sequence similarities. Analysis of three individual mice are shown to the left and to a pool of three distinct mice to the right. Clones that share CDR3 VDJ rearrangements are marked with black lines; the CDR3 region and clonal mutations of these clones are shown in Supplementary Fig. 2.
aagatattactacggtctctactttgactactgg BM IgAaagatattactacggtcactactttgactactgg BM IgAaagatattactacggtcactactttgactactgg BM IgG1aagatattactacggtcactactttgactactgg BM IgG1
aagatattactacggtggtctttttgactactgg BM IgAaagatattactacggtggtctttttgactactgg BM IgAaagatattactacggtggtctttttgactactgg BM IgG1aagatattactacggtggtctttttgactactgg BM IgG1
aagatattactacggtcgttactttgactactgg BM IgAaagatattactacggtagttactttgactactgg BM IgAaagatattactacggtcgttactttgactactgg BM IgG1aagatattactacggtcgttactttgactactgg BM IgG1
aagatactactacggccggtacttcgatgtctgg BM IgG1aagatactactacggccggtacttcgatgtctgg BM IgG1aagatactactatggtcggtacttcgatgtctgg BM IgG1aagatattactacggccggtacttcgatgtctgg BM IgA
aagatacgattactacggtagtagctattttgactactgg BM IgG1aagatacgattactacggtagtagctattttgactactgg BM IgG1aagatacgattactacggtagtagctactttgactactgg BM IgAaagatatgattactacggtagtagctactttgactactgg BM IgA
aagatatccgtattactacggtagttcctactttgactactgg BM IgAaagatatccgtattactacggtagttcctactttgactactgg BM IgG1
aagatatgattactacggtagtagctactttgactactgg BM IgAaagatatgattactacggtagtagctactttgactactgg BM IgAaagatacgattactacggtagtagctactttgactactgg LP IgA
aagatattactacggtagttctatggactactgg BM IgAaagatattactacggtcgttctatggactactgg LP IgA
aagatattactacggtcactactttgactactgg BM IgG1aagatattactacggtcactactttgactactgg BM IgAaagatattactacggtcactactttgactactgg BM IgG1aagatattactacggtcactactttgactactgg BM IgG1aagatattactacggtcactactttgactactgg BM IgG1aagatattactacggtcactactttgactactgg BM IgG1
aagatattactacggtgcctactttgactactgg BM IgAaagatattactacggtgcctactttgactactgg BM IgAaagatattactacggtgcctactttgactactgg BM IgG1aagatattactacggtgcctactttgactactgg BM IgG1aagatattactacggtgcctactttgactactgg BM IgG1aaggtattactacggtgcctactttgactactgg BM IgG1aagatattactacggtgcctactttgactactgg BM IgG1
aagatattactacggtacctactttgactactgg BM IgAaagatattactacggtacctactttgactactgg LP IgAaagatattactacggtacctactttgactactgg BM IgA
aagatattactacggtagtgcctttgactactgg BM IgAaagatattactacggtcgtgcctttgactactgg BM IgG1
aagatattactacggtctttactttgactactgg LP IgAaagatattactacggtctttactttgactactgg BM IgA
aagatattactacggtagtagctttgactactgg LP IgAaagatattactacggtagtagctttgactactgg BM IgAaagatattactacggtagtagctttgactactgg BM IgAaagatattactacggtagtagctttgactactgg BM IgAaagatattactacggtaggagctttgactactgg BM IgG2baagatattactacggtcgtagctttgactactgg BM IgG2baagatattactacggtcgtagctttgactactgg BM IgG2b
aagatattactacggtagtagctttgactgctgg LP IgAaagatattactacggtagtagctttgactactgg BM IgA aagatattactacggtcgtagctttgactactgg BM IgAaagatattactacggtcgtagctttgactactgg LP IgA aagatattactacggtcgtagctttgactactgg BM IgA
1.1
1.2
1.3
2.1
2.2
2.3
3.1
3.2
3.3
P.1
P.2
P.3
P.4
P.5
P.6
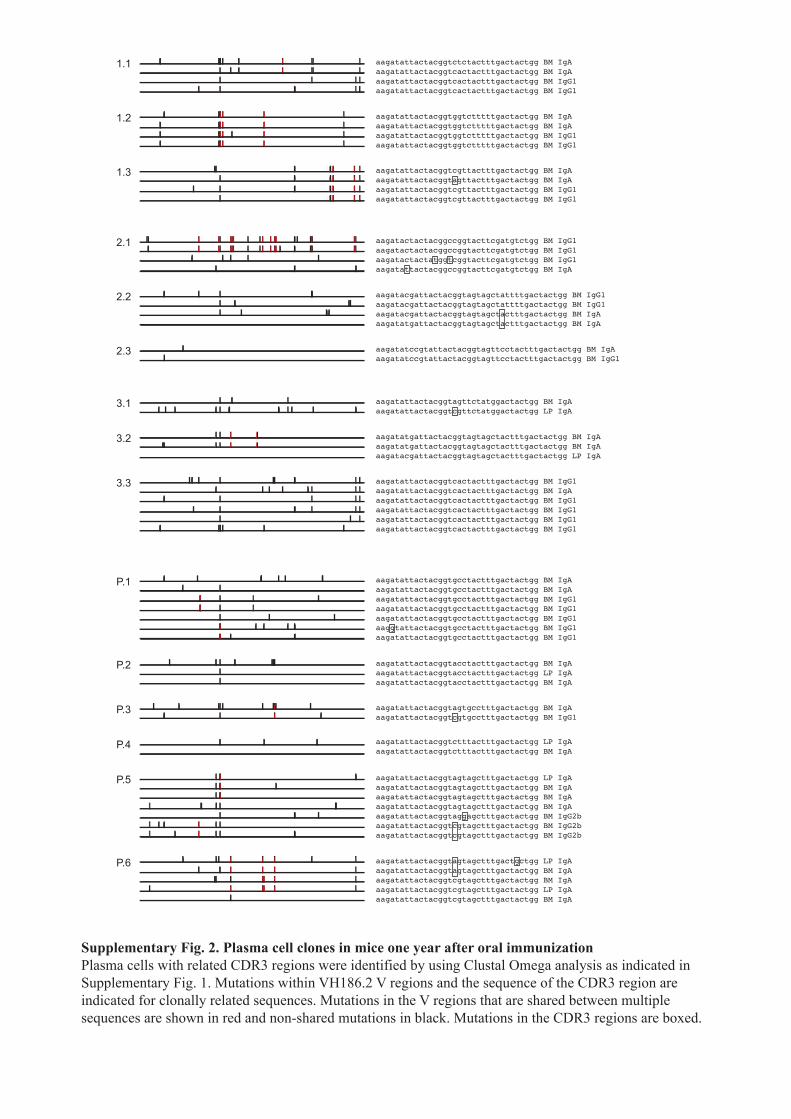
Supplementary Fig. 2. Plasma cell clones in mice one year after oral immunization
Plasma cells with related CDR3 regions were identified by using Clustal Omega analysis as indicated in Supplementary Fig. 1. Mutations within VH186.2 V regions and the sequence of the CDR3 region are indicated for clonally related sequences. Mutations in the V regions that are shared between multiple sequences are shown in red and non-shared mutations in black. Mutations in the CDR3 regions are boxed.
Prime
Challenge
+
+
-
+
+
-
LP IgA
30000
20000
10000A
FC
/10
6 c
ells
+
+
-
+
+
-
100
200
Spleen IgA
+
+
-
+
+
-
BM IgA
100
300
200
+
+
-
+
+
-
Spl IgG
20
60
40
+
+
-
+
+
-
40
120
80
160
BM IgG
Serum IgA Serum IgG
log
10 t
ite
r
Prime
Challenge
+
+
-
+
+
-
+
+
-
+
+
-
2
3
2.5
3.5
2
3
2.5
3.5
ip
-
po
-
ip
po
po
po
po
ip
ip
ip
Prime
Challenge
AF
C/1
06 c
ells
500
2000
1000
2500
1500
NP-specific spleen IgA AFC
100
400
200
300
ip
-
po
-
ip
po
po
po
po
ip
ip
ip
NP-specific BM IgA AFC NP-specific spleen IgG AFC NP-specific BM IgG AFC
800
400
200
600
1000 600
400
200
100
300
500
ip
-
po
-
ip
po
po
po
po
ip
ip
ip
ip
-
po
-
ip
po
po
po
po
ip
ip
ip
a
b
c
Lavage IgA anti-CT titer
log
10 t
ite
r
2
1
2.5
1.5
0.5
po popo ip ip ip
- -po poip ip
Prime
Challenge
d
e
ip
-
po
-
ip
po
po
po
po
ip
ip
ip
1000
3000
2000
ip
-
po
-
ip
po
po
po
po
ip
ip
ip
100
200
300
400
CT-specific spleen IgA AFC CT-specific BM IgA AFC
AF
C/1
06 c
ells
Prime
Challenge
Prime
Challenge
9 19 6 3 3
-
-
ip
-
po
-
ip
po
po
po
po
ip
ip
ip
2
2.5
3
3.5
Serum IgA anti-CT titer
39
-
-
ip
-
po
-
ip
po
po
po
po
ip
ip
ip
2
3
4
5
Serum IgG anti-CT titer
ip
-
po
-
ip
po
po
po
po
ip
ip
ip
20000
40000
60000
80000
CT-specific LP IgA AFC
f
ip
-
po
-
ip
po
po
po
po
ip
ip
ip
ip
-
po
-
ip
po
po
po
po
ip
ip
ip
200
400
600
800
100
200
250
150
50
CT-specific spleen IgG AFC CT-specific BM IgG AFC
Prime
Challenge
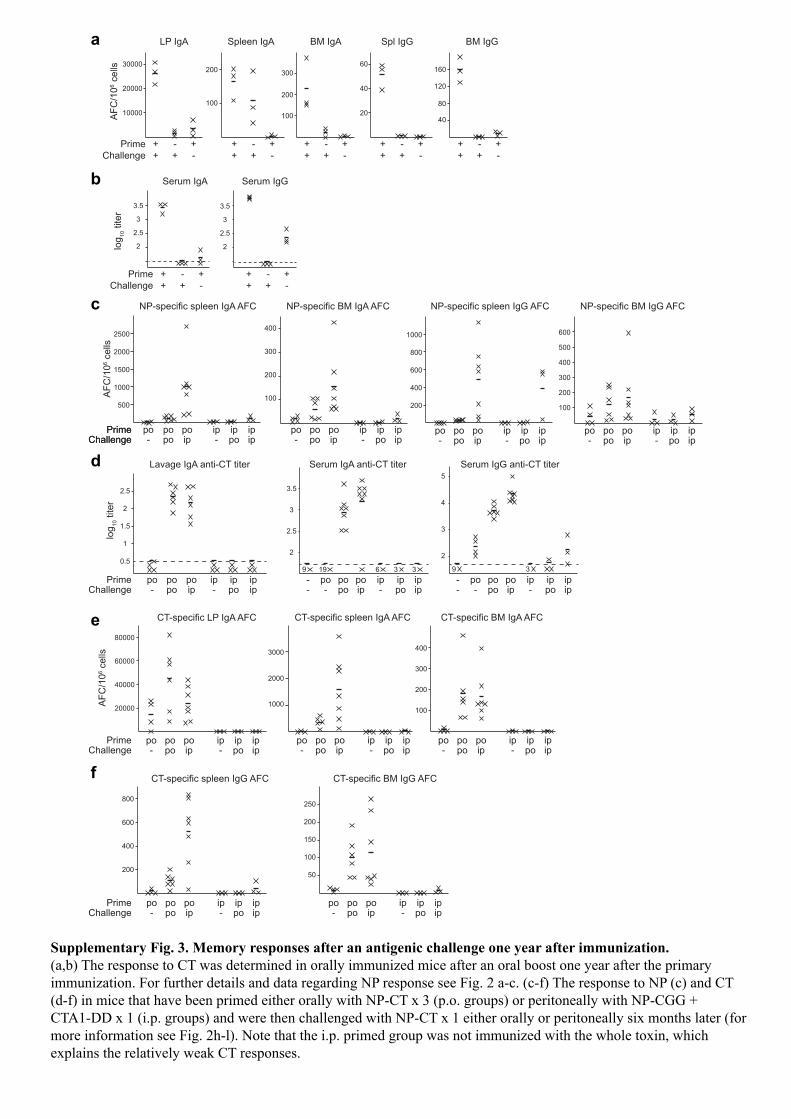
Supplementary Fig. 3. Memory responses after an antigenic challenge one year after immunization.
(a,b) The response to CT was determined in orally immunized mice after an oral boost one year after the primary immunization. For further details and data regarding NP response see Fig. 2 a-c. (c-f) The response to NP (c) and CT (d-f) in mice that have been primed either orally with NP-CT x 3 (p.o. groups) or peritoneally with NP-CGG + CTA1-DD x 1 (i.p. groups) and were then challenged with NP-CT x 1 either orally or peritoneally six months later (for more information see Fig. 2h-l). Note that the i.p. primed group was not immunized with the whole toxin, which explains the relatively weak CT responses.

tgtgcaagatacgattactacggtagtagctactttgactactgg PP IgAtgtgcaagatatgattactacggtagtagctactttgactactgg LM IgA
tgtgcaagatattactatggtcactactttgactactgg Spl IgAtgtgcaagatattactatggtcactactttgactactgg LP IgAtgtgcaagatattactatggtcactactttgactactgg Spl IgA
tgtgcaagatattactacggtttctactttgactactgg LP IgAtgtgcaagatattactacggtttctactttgactactgg LP* IgAtgtgcaagatattactacggtttctactttgactactgg PP IgA
tgtgcaagatattactacggtagtagtatggactactgg LP IgAtgtgcaagatattactacggtagtagtatggactactgg LP IgAtgtgcaagatattactacggtagtagtatggactactgg LP* IgAtgtgcaagatattactacggtagtagtatggactactgg LP IgA tgtgcaagatattactacggtaggagtatggactactgg MLN IgAtgtgcaagatattactacggtaggagtatggactactgg Spl IgAtgtgcaagatattactacggtaggagtatggactactgg BM IgAtgtgcaagatattactacggtaggagtatggactactgg MLN IgAtgtgcaagatattactacggtaggagtatggactactgg Col IgAtgtgcaagatattactacggtaggagtatggactactgg LP IgAtgtgcaagatattactacggtaggagtatggactactgg LP* IgA
tgtgcaagatattactacgggaggtactttgactactgg LP* IgAtgtgcaagatattactacgggaggtactttgactactgg LP IgAtgtgcaagatattactacgggaggtactttgactactgg PP IgAtgtgcaagatattactacgggaggtactttgactactgg PP IgAtgtgcaagatattactacgggaggtactttgactactgg LP* IgAtgtgcaagatattactacgggaggtactttgactactgg BM IgAtgtgcaagatattactacgggaggtactttgactactgg LP IgAtgtgctcgatattactacgggaggtactttgaccactgg PP IgAtgtgctcgatattactacgggaggtactttgaccactgg Spl IgAtgtgctcgatattactacgggaggtactttgaccactgg BM IgAtgtgcacgatattactacgggaggtactttgaccactgg MLN IgAtgtgcacgatattactacgggaggtactttgaccactgg BM IgAtgtgcacgatattactacgggcggtactttgaccactgg PP IgAtgtgcacgatattactacgggaggtactttgaccactgg Col IgAtgtgcacgatattactacgggaggtactttgaccactgg Col IgAtgtgcacgatattactacgggaagtactttgaccactgg LP IgAtgtgcacgatattactacgggaggtactttgaccactgg LP* IgAtgtgcacgatattactacgggaggtactttgaccactgg Col IgAtgtgcacgatattactacgggaggtactttgaccactgg LP* IgAtgtgcacgatattactacgggaggtactttgaccactgg PP IgAtgtgcacgatattactacgggaggtactttgaccactgg Spl IgAtgtgcacgatattactacgggaggtactttgaccactgg Col IgAtgtgcacgatattactacgggaggtactttgaccactgg LPd IgAtgtgcacgatattactacgggaggtactttgaccactgg BM IgAtgtgcacgatattactacgggaggtactttgaccactgg LP* IgAtgtgcacgatattactacgggaggtactttgaccactgg MLN IgAtgtgcacgatattactacgggaggtactttgaccactgg LP IgAtgtgcacgatattactacgggaggtactttgaccactgg MLN IgAtgtgcacgatattactacgggaggtactttgaccactgg Col IgAtgtgcacgatattactacgggaggtactttgaccactgg LP* IgAtgtgcacgatattactacgggaggtactttgaccactgg PP IgAtgtgcacgatattactacggggggtactttgaccactgg PP IgA tgtgcacgatattactacgggaggtactttgaccactgg PP IgAtgtgcacgatattactacgggaggtactttgaccactgg LP* IgAtgtgcaagatattactacgggaggtactttgactactgg PP IgAtgtgcacgatattactacgggaggtactttgaccactgg PP IgAtgtgcacgatattactacgggaggtattttgactactgg PP IgAtgtgcacgatattactacgggaggtactttgaccactgg MLN IgAtgtgcacgatattactacgggaggtactttgaccactgg PP IgAtgtgcacgatattactacgggaggtactttgaccactgg BM IgA
tgtgcaagaggttactacggtagtcactttgactactgg LP* IgAtgtgcaagaggttactacggtagtcactttgactactgg LP* IgAtgtgcaagaggttactacggtagtcactttgacttctgg LP* IgAtgtgcaagaggttactacggtagtcactttgactactgg LP* IgA tgtgcaagaggttactacggtagtcactttgactactgg MLN IgAtgtgcaagaggttactacggtagtcactttgactactgg MLN IgAtgtgcaagaggttactacggtagtcactttgactactgg LPd IgAtgtgcaagaggttactacggtagtcactttgactactgg PP IgAtgtgcaagaggttactacggtagtcactttgactactgg BM IgAtgtgcaagaggttactacggtagtcactttgactactgg MLN IgA
tgtgcaagatattactacggtacttactttgactactgg LP IgAtgtgcaagatattactacggtacttactttgactactgg PP IgA
Mouse 1
Mouse 2
tgtgcaagatattactacggcctgtacttcgatgtctgg LP* IgAtgtgcaagatattactacggcctgtacttcgatgtctgg LP* IgAtgtgcaagatattactacggcctgtacttcgatgtctgg PP IgAtgtgcaagatattactacggcctgtacttcgatgtctgg LP IgAtgtgcaagatattactacggcctgtacttcgatgtctgg Spl IgA
tgtgcagtctattactacgtttatagctactttgactactgg BM IgAtgtgcagcctattactacgtttatagctactttgactactgg MLN IgAtgtgcagcctattactacgtttatagctactttgactactgg BM IgAtgtgcagcctattactacgtttatagctactttgactactgg Spl IgAtgtgcagcctattactacgtttatagctactttgactactgg MLN IgAtgtgcagcctattactacgtttatagctactttgactactgg MLN IgG2b
tgtgcaagatattactacggtagtagccactttgactactgg Col IgAtgtgcaagatattactacggtagtagccactttgactactgg BM IgA
tgtgcaagatacgattactacggtcgtagctactttgactcctgg MLN IgAtgtgcaagatacgattactacggtcgtagctactttgactcctgg PP IgA
Mouse 3
Mouse 5
Supplementary Fig. 4. Clonally related sequences detected in mice after an oral challenge.
Clonally related sequences were grouped from mice that had been challenged one year after the primary immuni-zation. Sequences that were not related to any other sequences are not shown. All sequences were used for the analysis shown in Fig. 2e,f.
5.03.814
Spleen MLN PP
CD
80
CD21/35
725957
GFP+
GFP-
a
c
IgM
IgD
IgA
CD
38
GL7 CD73
PP B220+CD19+
SS
C
FSC
CD
138
GFP CD19
B22
0
Spleen
PP
d e
Spleen memory cell PP memory cell Small intestine plasma cell
GFP/CD138/IgA
GFP CD138 IgA GFP CD138 IgA GFP CD138 IgA
GFP/CD138/IgAGFP/CD138/IgA
f
B cells
GFP+
B cells
Spl CD19+
LPAM (α4β7) IgD
CD38 expression on IgA+ B cells in PP
20
40
60
80
100
% C
D38
+ B c
ells
GFP+ IgA+
GFP- IgA+ GL7-
GFP- IgA+ GL7+
**** ********
GFP-
GL7-IgA+
GL7+IgA+
GFP+
IgA+
CD38
b
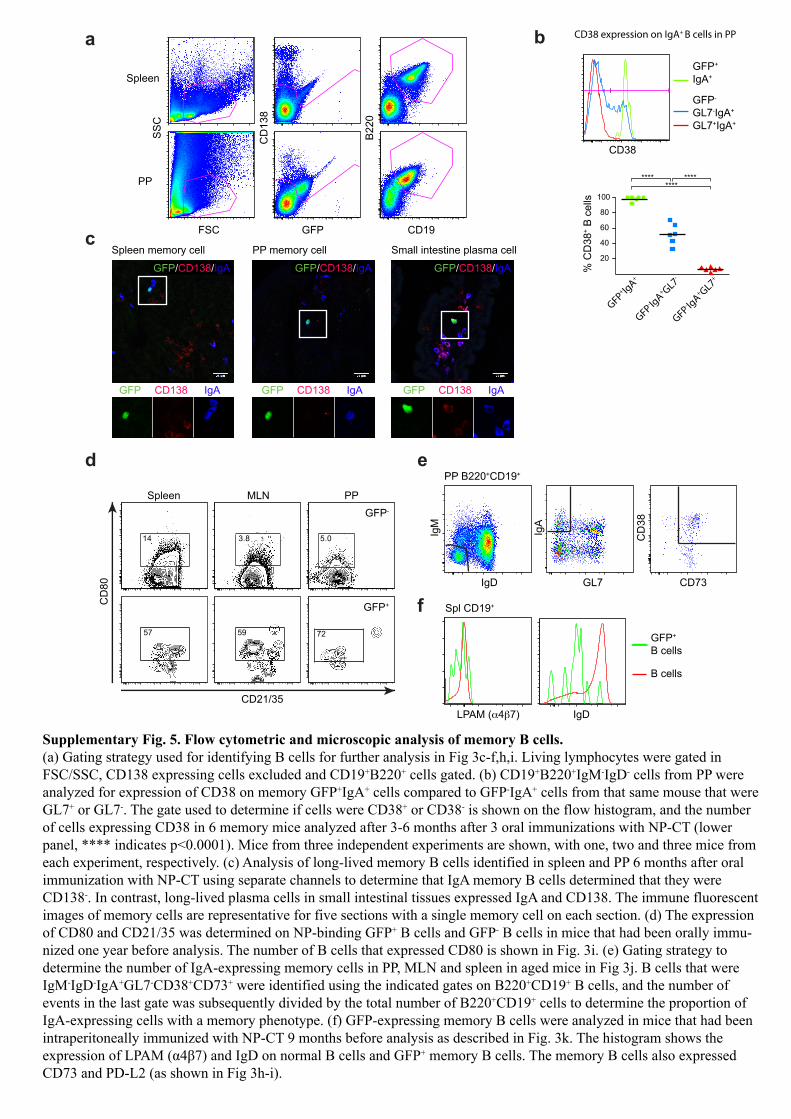
Supplementary Fig. 5. Flow cytometric and microscopic analysis of memory B cells.(a) Gating strategy used for identifying B cells for further analysis in Fig 3c-f,h,i. Living lymphocytes were gated in FSC/SSC, CD138 expressing cells excluded and CD19+B220+ cells gated. (b) CD19+B220+IgM-IgD- cells from PP were analyzed for expression of CD38 on memory GFP+IgA+ cells compared to GFP-IgA+ cells from that same mouse that were GL7+ or GL7-. The gate used to determine if cells were CD38+ or CD38- is shown on the flow histogram, and the number of cells expressing CD38 in 6 memory mice analyzed after 3-6 months after 3 oral immunizations with NP-CT (lower panel, **** indicates p<0.0001). Mice from three independent experiments are shown, with one, two and three mice from each experiment, respectively. (c) Analysis of long-lived memory B cells identified in spleen and PP 6 months after oral immunization with NP-CT using separate channels to determine that IgA memory B cells determined that they were CD138-. In contrast, long-lived plasma cells in small intestinal tissues expressed IgA and CD138. The immune fluorescent images of memory cells are representative for five sections with a single memory cell on each section. (d) The expression of CD80 and CD21/35 was determined on NP-binding GFP+ B cells and GFP- B cells in mice that had been orally immu-nized one year before analysis. The number of B cells that expressed CD80 is shown in Fig. 3i. (e) Gating strategy to determine the number of IgA-expressing memory cells in PP, MLN and spleen in aged mice in Fig 3j. B cells that were IgM-IgD-IgA+GL7-CD38+CD73+ were identified using the indicated gates on B220+CD19+ B cells, and the number of events in the last gate was subsequently divided by the total number of B220+CD19+ cells to determine the proportion of IgA-expressing cells with a memory phenotype. (f) GFP-expressing memory B cells were analyzed in mice that had been intraperitoneally immunized with NP-CT 9 months before analysis as described in Fig. 3k. The histogram shows the expression of LPAM (α4β7) and IgD on normal B cells and GFP+ memory B cells. The memory B cells also expressed CD73 and PD-L2 (as shown in Fig 3h-i).
PO
-PO
PO-IP
IP-P
O
IP-IP
50
100
150 ns
ns
****
****
***
****
GFP+ plasma cells in gut tissue
GF
P+ c
ells p
er
field
a
2
4
6
8
10
Lamina propria
2
4
6
8
10
5
10
15
5
10
15
Oral IPOral IPOral IP
Spleen
% t
ha
t e
xp
ress G
FP
% t
ha
t e
xp
ress G
FP
ns (p=0.1893)
ns (p=0.4522) ** (p=0.0033)
B220-CD138+ plasma cells
Ora
l vs IP
prim
ing
Ora
l vs IP
challenge
** (p=0.0033)
Oral IP Oral IP
Oral IP Oral IP
b
c
0.2
0.4
0.6
0.8
PP
0.2
0.4
0.6
0.8
0.5
1.0
1.5
Spleen
0.5
1.0
1.5
B220+ B cells
% t
ha
t e
xp
ress G
FP
% t
ha
t e
xp
ress G
FP
Ora
l vs IP
prim
ing
Ora
l vs IP
challenge
** (p=0.0099) ns (p=0.0658)
ns (p=0.1316) ** (p=0.0094)
Oral IP Oral IP
Oral IP Oral IP
e
LP Oral LP IP
α4β7 block
5
10
15
- + - +
% G
FP
+ c
ells
- + - +
PP Oral PP IP
d
CD138+ plasma
cells
0.2
0.4
0.6
0.8
% G
FP
+ c
ells
B220+ B cells
2
4
6
8
PO
-PO
PO-IP
IP-P
O
IP-IP
% N
P-s
pecific
IgA
AF
C
NP specific plasma cells in LP
*****
Oral priming vs
IP priming
Oral challenge vs
IP challenge
**** (p<0.0001) ns (p=0.1286)
2
4
6
8
LP Oral LP IP
α4β7 block - + - +
% N
P-s
pecific
IgA
AF
C
NP specific plasma cells in LPf
p=0.1349 p=0.5466
Challenge with vs without
block p=0.0918
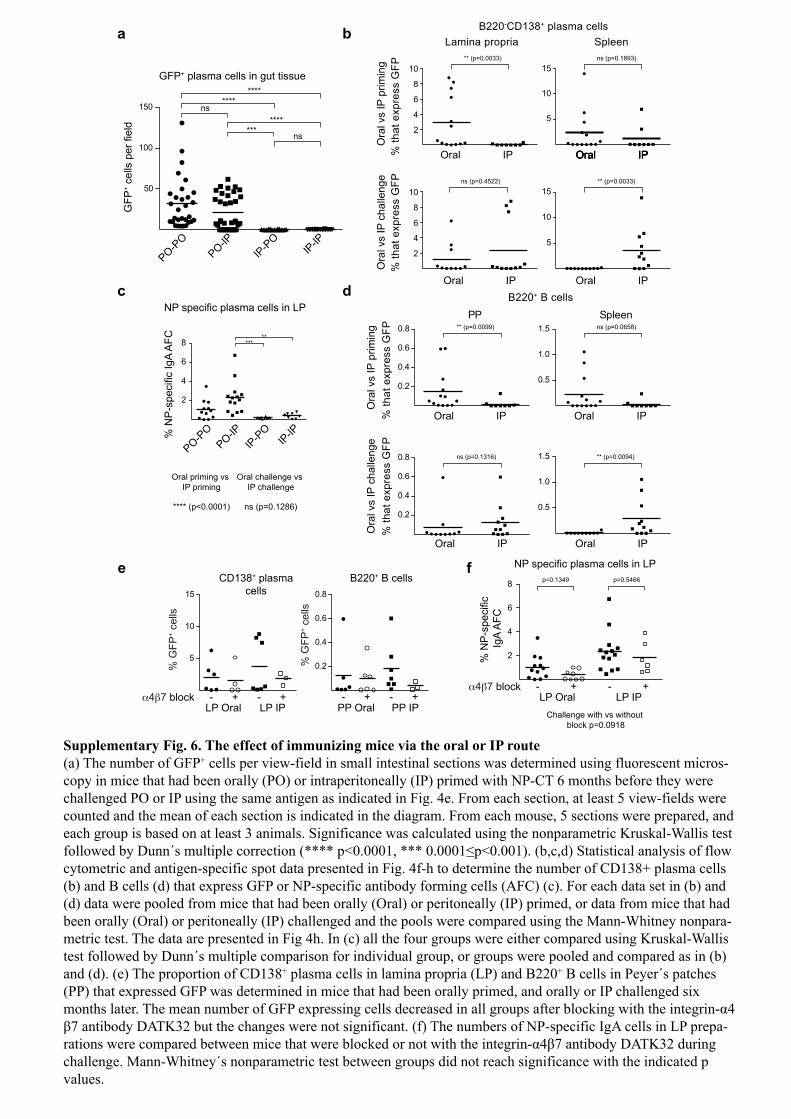
Supplementary Fig. 6. The effect of immunizing mice via the oral or IP route
(a) The number of GFP+ cells per view-field in small intestinal sections was determined using fluorescent micros-copy in mice that had been orally (PO) or intraperitoneally (IP) primed with NP-CT 6 months before they were challenged PO or IP using the same antigen as indicated in Fig. 4e. From each section, at least 5 view-fields were counted and the mean of each section is indicated in the diagram. From each mouse, 5 sections were prepared, and each group is based on at least 3 animals. Significance was calculated using the nonparametric Kruskal-Wallis test ollo ed D nn s m l le correc on ( ) ( c d) a s cal anal s s o lo
cytometric and antigen-specific spot data presented in Fig. 4f-h to determine the number of CD138+ plasma cells (b) and B cells (d) that express GFP or NP-specific antibody forming cells (AFC) (c). For each data set in (b) and (d) data were pooled from mice that had been orally (Oral) or peritoneally (IP) primed, or data from mice that had been orally (Oral) or peritoneally (IP) challenged and the pools were compared using the Mann-Whitney nonpara-metric test. The data are presented in Fig 4h. In (c) all the four groups were either compared using Kruskal-Wallis test followed by Dunn´s multiple comparison for individual group, or groups were pooled and compared as in (b) and (d). (e) The proportion of CD138+ plasma cells in lamina propria (LP) and B220+ B cells in Peyer´s patches (PP) that expressed GFP was determined in mice that had been orally primed, and orally or IP challenged six mon s la er e mean n m er o GFP e ress ng cells decreased n all gro s a er loc ng e n egr n α4β7 an od D e c anges ere no s gn can ( ) e n m ers o P s ec c Ig cells n P re a-ra ons ere com ared e een m ce a ere loc ed or no e n egr n α4β7 an od D d r ng challenge. Mann-Whitney´s nonparametric test between groups did not reach significance with the indicated p values.

CD
138
GFP
B220
CD19
B220
CD19
IgD
GL7
CD
73
PDL2
PP living cells
a
GL7
B220
CD
138
GFP CD19
Spleen
LP
e
Plasmablasts
Plasma cells
Responding
memory
B220
GFP
GL7
GFP
PP living cellsf
b
c
d
α4β7 blockNo block
IgD
PP B cells
3.65 4.760.57
CD40 block
50
100
150
GF
P+ c
ells/fie
ld
Gut plasma cells
- + - +
LP Oral LP IP
CD40 block
** (p=0.0073) ns (p=0.7405)
2
4
6
8
% N
P-s
pecific
IgA
AF
C
- + - +
LP Oral LP IP
CD40 block
NP specific LP plasma cells
* (p=0.0401) * (p=0.0167)
Supplementary Fig. 7. Analysis of responding memory cells in PP and spleen
(a) Gating strategy to identify responding memory cells after booster immunization in Fig. 5a-c,f,g. Lympho-cytes were gated as in Supplementary Fig. 5a and from these CD138-GFP+ and CD138-GFP- cells were gated. A gate for CD19+B220+ B cells was set based on CD138-GFP- cells and subsequently used for GFP+ cells. The cells were analyzed as indicated in the different panels in Fig. 5. (b) Mice that had been orally primed with three doses of NP-CT were challenged with the same antigen orally (Oral) or intraperiteoneally (IP). The number of GFP expressing plasma cells were then counted in gut lamina propria (LP) sections after CD40 signal blocking using the CD40L blocking antibody MR-1 as described in Supplementary Fig. 6a. The nonparametric Mann-Whitney test was used to analyze the differences between the groups. (c) The proportions of NP-specific IgA cells were compared using ELISPOT between mice that had been CD40L blocked or not. The nonparamet-ric Mann-Whitney test was used to analyze the differences between the groups. (d) Flow cytometric analysis of B220+CD19+ B cells demonstrated that CD40 blocking using anti-CD40L MR-1 disrupted germinal center reac ons n PP ereas e n egr n α4β7 loc ng an od D d d no (e) P s ec c GFP+ plasma cells/plasmablasts can be distinguished based on B220 and GFP expression levels. Two expanded GFP+ popula-tions, comprised of B220-GFPhigh and B220+GFPint cells, were evident in spleen after i.p. immunization whereas B220-GFPhigh cells dominated in extracts from small intestinal lamina propria. B220+GFPint cells were exclusive-ly CD138-CD19+ expanding memory cells and B220-GFPhigh were CD138+CD19-/low plasma cells/plasmablasts. (f) Gating of B220 and GFP as indicated in (e) allowed us to separately analyze the expression of IgA, CCR9,
and α4β7 on res ond ng memor cells and lasma cells lasma las s n F g
Mutation load
3 x Oral NP-CT
6-12 months
Sequence from sorted CD80+ B cells from
PP, MLN and spleen
WT mouse High affinity mutation
% o
f seq
uenc
es
100
50
75
25
PP MLN Spl PP MLN
V re
gion
mut
atio
ns
PP MLN Spl PP MLN
10
20
ns p=0.0495
% o
f seq
uenc
es
p<0.0001High affinity
100
50
75
25
MLNPP MLNPPα-NP not α−NP
V re
gion
mut
atio
ns
Mutation loadns
10
20
30
40
MLNPP MLNPPα-NP not α−NP
a
Sequence from respondingB cells from PP and MLN
3 x Oral NP-CT
6-12 months
WT mouse
1 x Oral NP-CT
b
cns
10
40
V re
gion
mut
atio
ns
20
30
Non-NP mutation load
LongPC
LongMem
RespMem
BoostPC
dGL
4
6 6
2
22
GL
5 6 6
7
3
11
GL68
2
GL
2104
GL3
GL
2 12
19
4GL
2
3
GL
27
4
GL
22
2GL
4
2 3
GLGL
3
2
23 2
2 4
5
3
10
5
Deducted node
Small Intest LP
MLNPP
SpleenBone Marrow
Colon LP
4
10GL
5
4
GL
63
4GL
GL2
GL
33
2
GL7
4
8
29
GL2
8
2
10
GL2
9
5
5
4
GL
6 6
2 3
5
2
8
GL
GL
7
2
Deducted nodeSmall Intest LP
CD80+ MLNCD80+ PPCD80+ Spl
Bone Marrow
e
10
20
10
PL m
in
Trun
k
g
Before AfterBoost Boost
Before AfterBoost Boost
OD
avg
1.0
1.1
1.2
1.3
1.4
Trun
k
10
20
30
PL m
in
10
20
30
After BeforeBoost Boost
Pool Pool Pool
After BeforeBoost Boost
After BeforeBoost Boost
f Non-NP bindingNP binding
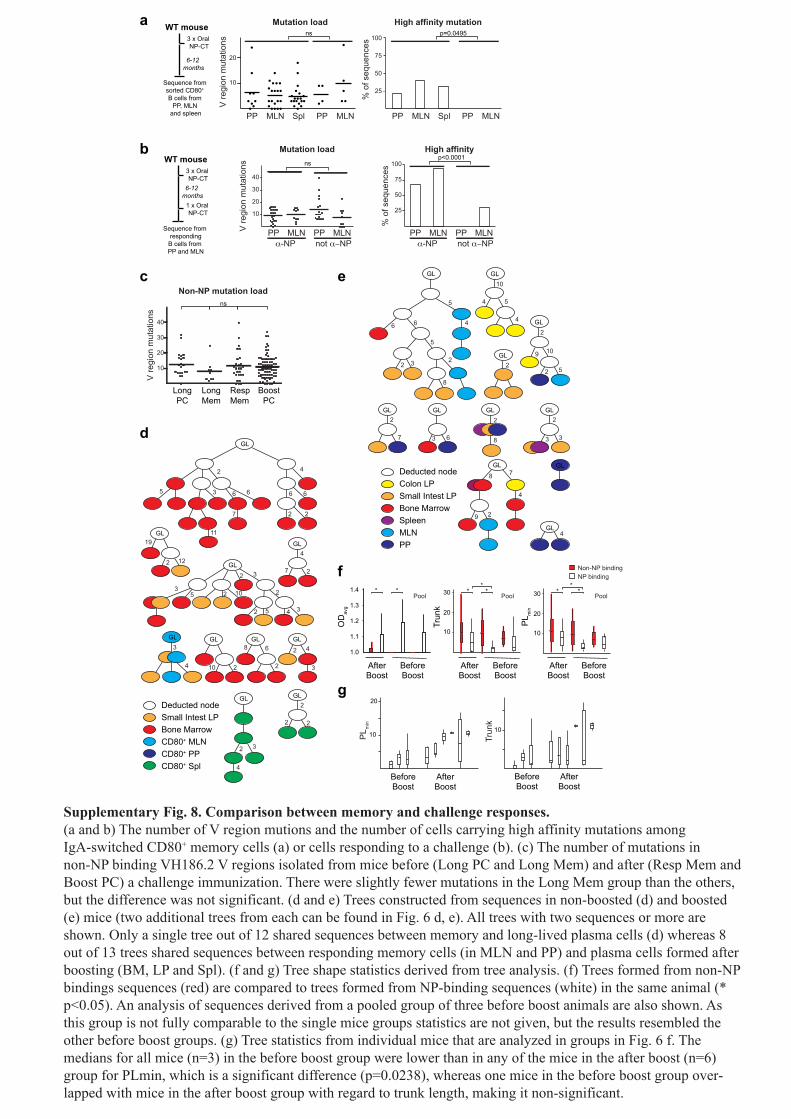
Supplementary Fig. 8. Comparison between memory and challenge responses.(a and b) The number of V region mutions and the number of cells carrying high affinity mutations among IgA-switched CD80+ memory cells (a) or cells responding to a challenge (b). (c) The number of mutations in non-NP binding VH186.2 V regions isolated from mice before (Long PC and Long Mem) and after (Resp Mem and Boost PC) a challenge immunization. There were slightly fewer mutations in the Long Mem group than the others, but the difference was not significant. (d and e) Trees constructed from sequences in non-boosted (d) and boosted (e) mice (two additional trees from each can be found in Fig. 6 d, e). All trees with two sequences or more are shown. Only a single tree out of 12 shared sequences between memory and long-lived plasma cells (d) whereas 8 out of 13 trees shared sequences between responding memory cells (in MLN and PP) and plasma cells formed after boosting (BM, LP and Spl). (f and g) Tree shape statistics derived from tree analysis. (f) Trees formed from non-NP bindings sequences (red) are compared to trees formed from NP-binding sequences (white) in the same animal (* p<0.05). An analysis of sequences derived from a pooled group of three before boost animals are also shown. As this group is not fully comparable to the single mice groups statistics are not given, but the results resembled the other before boost groups. (g) Tree statistics from individual mice that are analyzed in groups in Fig. 6 f. The medians for all mice (n=3) in the before boost group were lower than in any of the mice in the after boost (n=6) group for PLmin, which is a significant difference (p=0.0238), whereas one mice in the before boost group over-lapped with mice in the after boost group with regard to trunk length, making it non-significant.
* * **
* **
*
Lamina propria
Bone Marrow
Spleen
Messenteric lymph nodes (MLN)
Peyer´s patches (PP)
RNA
Make cDNA with IgA specific primer
Two seperate PCR reactions from
each cDNA sample
Pool
Nested up and down PCR
reactions from each sample with
barcodes
Ion Torrent sequencing
8 samples on each 314 chip
Import BAM files to CLC
Biomedical Workbench
Remove primer sequences
and less than 250 bp long
sequences
Export sequences as fasta files
Analysis using IMGT HighV-Quest
Filter IMGT sequences NP binding CDR3
Pool up- and downstream
sequences from same
samples
Keep sequences that
occur as duplicates or more
(identical CDR3 and mutations)
Remove sequence to get single
sequence of each genotype
Pool sequences from
different organs
Define CDR3 clones
and check number
of sequences
in each clone
Divide into sample type
based on barcodes and
export as BAM files
SequencesSample preparation and
sequencing
Sequence analyis
980952
86459
3434
66
2113422
980986
Clonal distribution NGS (number of clones)
Mouse
1 2 3
a b
20
40
60
80
% o
f sequences
Mouse 1 2 3
Lamina propria
CD80+ memory
Bone Marrow
Relative presence in shared clones if
randomly assigned
c d
221 93 12 135 179 19 138 38 672Unique clones
Total clones 500 412 2507
Total clones 500 412 2507
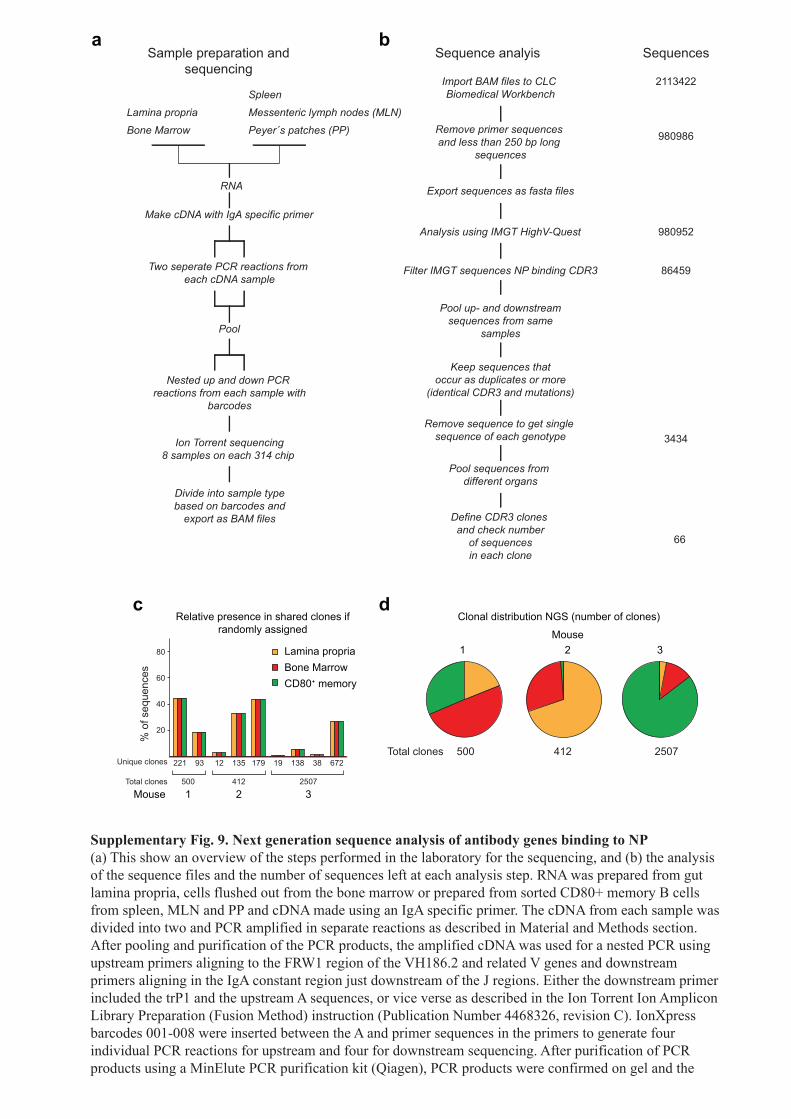
Supplementary Fig. 9. Next generation sequence analysis of antibody genes binding to NP
(a) This show an overview of the steps performed in the laboratory for the sequencing, and (b) the analysis of the sequence files and the number of sequences left at each analysis step. RNA was prepared from gut lamina propria, cells flushed out from the bone marrow or prepared from sorted CD80+ memory B cells from spleen, MLN and PP and cDNA made using an IgA specific primer. The cDNA from each sample was divided into two and PCR amplified in separate reactions as described in Material and Methods section. After pooling and purification of the PCR products, the amplified cDNA was used for a nested PCR using upstream primers aligning to the FRW1 region of the VH186.2 and related V genes and downstream primers aligning in the IgA constant region just downstream of the J regions. Either the downstream primer included the trP1 and the upstream A sequences, or vice verse as described in the Ion Torrent Ion Amplicon Library Preparation (Fusion Method) instruction (Publication Number 4468326, revision C). IonXpress barcodes 001-008 were inserted between the A and primer sequences in the primers to generate four individual PCR reactions for upstream and four for downstream sequencing. After purification of PCR products using a MinElute PCR purification kit (Qiagen), PCR products were confirmed on gel and the
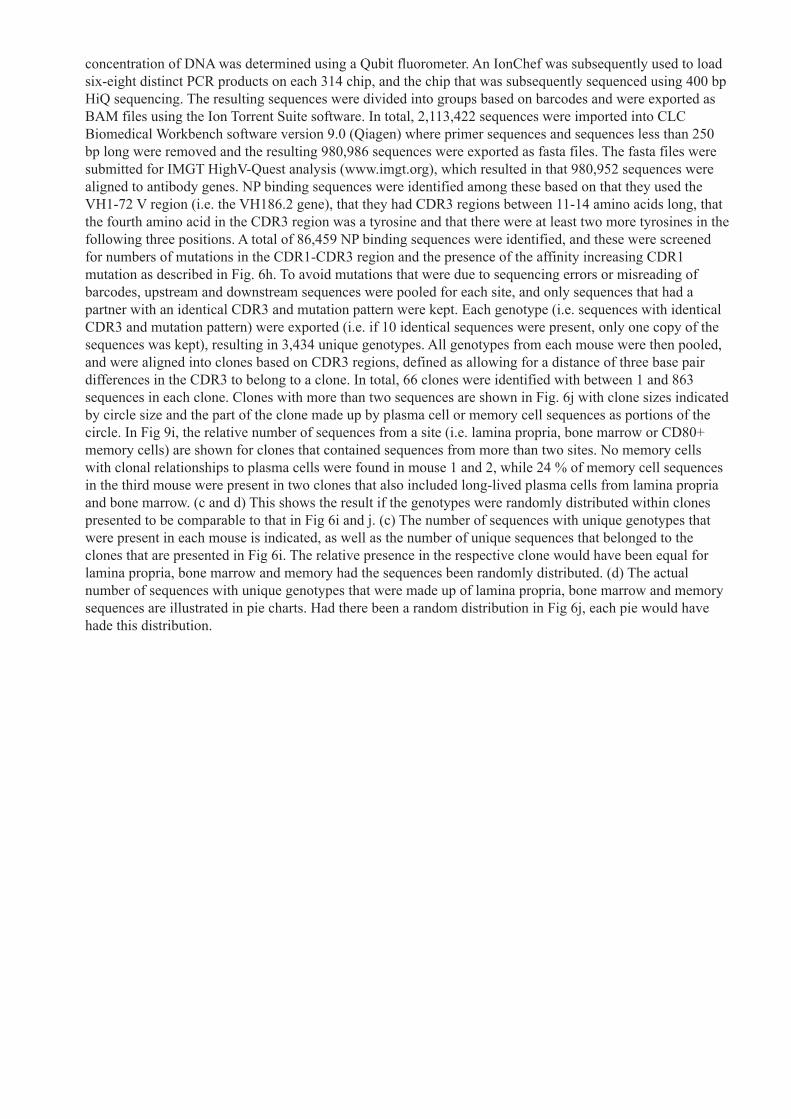
concentration of DNA was determined using a Qubit fluorometer. An IonChef was subsequently used to load six-eight distinct PCR products on each 314 chip, and the chip that was subsequently sequenced using 400 bp HiQ sequencing. The resulting sequences were divided into groups based on barcodes and were exported as BAM files using the Ion Torrent Suite software. In total, 2,113,422 sequences were imported into CLC Biomedical Workbench software version 9.0 (Qiagen) where primer sequences and sequences less than 250 bp long were removed and the resulting 980,986 sequences were exported as fasta files. The fasta files were submitted for IMGT HighV-Quest analysis (www.imgt.org), which resulted in that 980,952 sequences were aligned to antibody genes. NP binding sequences were identified among these based on that they used the VH1-72 V region (i.e. the VH186.2 gene), that they had CDR3 regions between 11-14 amino acids long, that the fourth amino acid in the CDR3 region was a tyrosine and that there were at least two more tyrosines in the following three positions. A total of 86,459 NP binding sequences were identified, and these were screened for numbers of mutations in the CDR1-CDR3 region and the presence of the affinity increasing CDR1 mutation as described in Fig. 6h. To avoid mutations that were due to sequencing errors or misreading of barcodes, upstream and downstream sequences were pooled for each site, and only sequences that had a partner with an identical CDR3 and mutation pattern were kept. Each genotype (i.e. sequences with identical CDR3 and mutation pattern) were exported (i.e. if 10 identical sequences were present, only one copy of the sequences was kept), resulting in 3,434 unique genotypes. All genotypes from each mouse were then pooled, and were aligned into clones based on CDR3 regions, defined as allowing for a distance of three base pair differences in the CDR3 to belong to a clone. In total, 66 clones were identified with between 1 and 863 sequences in each clone. Clones with more than two sequences are shown in Fig. 6j with clone sizes indicated by circle size and the part of the clone made up by plasma cell or memory cell sequences as portions of the circle. In Fig 9i, the relative number of sequences from a site (i.e. lamina propria, bone marrow or CD80+ memory cells) are shown for clones that contained sequences from more than two sites. No memory cells with clonal relationships to plasma cells were found in mouse 1 and 2, while 24 % of memory cell sequences in the third mouse were present in two clones that also included long-lived plasma cells from lamina propria and bone marrow. (c and d) This shows the result if the genotypes were randomly distributed within clones presented to be comparable to that in Fig 6i and j. (c) The number of sequences with unique genotypes that were present in each mouse is indicated, as well as the number of unique sequences that belonged to the clones that are presented in Fig 6i. The relative presence in the respective clone would have been equal for lamina propria, bone marrow and memory had the sequences been randomly distributed. (d) The actual number of sequences with unique genotypes that were made up of lamina propria, bone marrow and memory sequences are illustrated in pie charts. Had there been a random distribution in Fig 6j, each pie would have hade this distribution.