Structure of boehmite-derived γ-alumina and its ...
13
research papers 772 https://doi.org/10.1107/S2052520621008027 Acta Cryst. (2021). B77, 772–784 Received 4 May 2021 Accepted 4 August 2021 Edited by J. Hadermann, University of Antwerp, Belgium Keywords: alumina; boehmite; crystal structure; electron diffraction; quantitative microscopy; transformation mechanism. CCDC reference: 2101470 Supporting information: this article has supporting information at journals.iucr.org/b Structure of boehmite-derived c-alumina and its transformation mechanism revealed by electron crystallography Zhiping Luo* Department of Chemistry, Physics and Materials Science, Fayetteville State University, Fayetteville, North Carolina 28301, USA. *Correspondence e-mail: [email protected] -Alumina is a widely used material, while its precise crystal structure and transformation mechanism derived from boehmite have remained unclear in the literature for decades. In this work, quantitative electron microscopy has been applied to study the crystalline structure of -alumina and its transformation mechanism from boehmite. Based on Rietveld refinement of electron diffraction patterns, a new tetragonal structure model, with a space group of I4 1 /amd (No. 141), was proposed for the -alumina phase, with Al cations on 4a,8c,8d and 16g sites and O anions on the 16h site, which could provide better fits than current models. During the boehmite to -alumina transformation induced by e- beam irradiation, when the boehmite layers were oriented along the edge-on direction, a shrinkage caused by dehydration was directly observed. Two kinds of boehmite to -alumina transformation mechanisms, namely collapse and reaction mechanisms, were elucidated crystallographically in detail with new insights through an intermediate structure, and the reaction mechanism was demonstrated to produce much reduced changes in dimensions and volume, compared with the collapse mechanism. The experimental observations supported the reaction mechanism, which occurred through partial occupation of the dehydrated space by diffusion in the initial stage of the transformation, without the formation of voids that only appeared after the initial stage. Filling tetrahedral interstices of the intermediate structure with Al cations in different ways yields tetragonal or cubic -alumina structures, and the tetragonal structure is energetically favorable because of smaller lattice distortions required, compared with the cubic structure. The crystallographic orientation relationships of -alumina with the parent boehmite phase deduced from the proposed mechanisms are consistent with the experimental observations. 1. Introduction Alumina, or aluminium oxide (Al 2 O 3 ), is an important ceramic material because of its distinct physical properties, such as low density, high porosity and high specific surface area, high modulus, high melting point, and low thermal conductivity (Poco et al. , 2001). Among its polymorphs, -Al 2 O 3 (corundum) is a thermodynamically stable phase, which is formed from aluminium oxyhydroxide AlOOH (boehmite) in a thermal transformation sequence as follows (Ingram-Jones et al. , 1996; Boumaza, Favaro, Ledion et al., 2009): AlOOH ðboehmiteÞ! -Al 2 O 3 ! -Al 2 O 3 ! -Al 2 O 3 ! -Al 2 O 3 : ð1Þ Here, -, - and -Al 2 O 3 are metastable transitional alumina forms. Among these polymorphs, -Al 2 O 3 is the most widely studied alumina because of its wide applications for sorbents, support for catalysts, and materials used in refining and ISSN 2052-5206
Transcript of Structure of boehmite-derived γ-alumina and its ...
research papers
772 https://doi.org/10.1107/S2052520621008027 Acta Cryst. (2021). B77, 772–784
Received 4 May 2021
Accepted 4 August 2021
Edited by J. Hadermann, University of Antwerp,
Belgium
Keywords: alumina; boehmite; crystal structure;
electron diffraction; quantitative microscopy;
transformation mechanism.
CCDC reference: 2101470
Supporting information: this article has
supporting information at journals.iucr.org/b
Structure of boehmite-derived c-alumina and itstransformation mechanism revealed by electroncrystallography
Zhiping Luo*
Department of Chemistry, Physics and Materials Science, Fayetteville State University, Fayetteville, North Carolina 28301,
USA. *Correspondence e-mail: [email protected]
�-Alumina is a widely used material, while its precise crystal structure and
transformation mechanism derived from boehmite have remained unclear in the
literature for decades. In this work, quantitative electron microscopy has been
applied to study the crystalline structure of �-alumina and its transformation
mechanism from boehmite. Based on Rietveld refinement of electron diffraction
patterns, a new tetragonal structure model, with a space group of I41/amd (No.
141), was proposed for the �-alumina phase, with Al cations on 4a, 8c, 8d and
16g sites and O anions on the 16h site, which could provide better fits than
current models. During the boehmite to �-alumina transformation induced by e-
beam irradiation, when the boehmite layers were oriented along the edge-on
direction, a shrinkage caused by dehydration was directly observed. Two kinds
of boehmite to �-alumina transformation mechanisms, namely collapse and
reaction mechanisms, were elucidated crystallographically in detail with new
insights through an intermediate structure, and the reaction mechanism was
demonstrated to produce much reduced changes in dimensions and volume,
compared with the collapse mechanism. The experimental observations
supported the reaction mechanism, which occurred through partial occupation
of the dehydrated space by diffusion in the initial stage of the transformation,
without the formation of voids that only appeared after the initial stage. Filling
tetrahedral interstices of the intermediate structure with Al cations in different
ways yields tetragonal or cubic �-alumina structures, and the tetragonal
structure is energetically favorable because of smaller lattice distortions
required, compared with the cubic structure. The crystallographic orientation
relationships of �-alumina with the parent boehmite phase deduced from the
proposed mechanisms are consistent with the experimental observations.
1. Introduction
Alumina, or aluminium oxide (Al2O3), is an important
ceramic material because of its distinct physical properties,
such as low density, high porosity and high specific surface
area, high modulus, high melting point, and low thermal
conductivity (Poco et al., 2001). Among its polymorphs,
�-Al2O3 (corundum) is a thermodynamically stable phase,
which is formed from aluminium oxyhydroxide AlOOH
(boehmite) in a thermal transformation sequence as follows
(Ingram-Jones et al., 1996; Boumaza, Favaro, Ledion et al.,
2009):
AlOOH ðboehmiteÞ ! �-Al2O3 ! �-Al2O3 ! �-Al2O3
! �-Al2O3: ð1Þ
Here, �-, �- and �-Al2O3 are metastable transitional alumina
forms. Among these polymorphs, �-Al2O3 is the most widely
studied alumina because of its wide applications for sorbents,
support for catalysts, and materials used in refining and
ISSN 2052-5206
petrochemical industries (Trueba & Trasatti, 2005; Cai & Yu,
2007; Mandic et al., 2020; Batista et al., 2020).
However, the precise crystalline structure of the �-Al2O3
phase is still the subject of scientific debate (Prins, 2020; van
Gog, 2021). As recently pointed out by Prins (2020), the main
reason is that it has not proved possible to prepare macro-
crystalline �-Al2O3, and only nanocrystalline �-Al2O3 has
been prepared, limiting the structure determination by X-ray
(XRD) or neutron diffraction (ND) techniques because of
peak broadening. The following structural models have been
proposed.
(a) Cubic structure. The �-Al2O3 phase was conventionally
described as an MgAl2O4-type spinel structure (Verwey, 1935;
Lippens & de Boer, 1964; Wilson, 1979; Gutierrez et al., 2002).
The MgAl2O4 spinel structure has the space group Fd�33m, with
atoms of Mg at 8a, Al at 16d, and O at 32e sites. Zhou &
Snyder (1991) refined its structure using XRD and ND by
adding a 32e site to the spinel structure, i.e. Al at 8a and 16d
(spinel sites) and 32e (nonspinel site). The O atom is at 32e
with occupation of 1.0, while the cationic positions are
partially occupied to maintain the Al2O3 stoichiometry. In
addition, Paglia et al. (2003) proposed and tested a cubic 16c
structure, with the addition of 16c to the spinel structure. On
the other hand, Smrcok et al. (2006) synthesized whiskers of �-
alumina single crystals in a nonstandard route using a mixture
of �-sialon powder and 20 wt% of steel sawdust that were
homogenized in a planetary ball mill, followed with heating to
a very high temperature of 1973 K for solid-state reactions to
form iron silicides and whiskers of �-alumina. The single-
crystal X-ray diffraction refinement revealed Al at 8a, 16c
(nonspinel), 16d and 48f (nonspinel) sites.
(b) Tetragonal structure. The tetragonal distortion from a
perfect cubic structure has been indeed noticed for a quite
long time (Lippens & de Boer, 1964; Wilson, 1979), and the c/a
ratio was found to be less than 1 in the range of 0.981–0.993
(Wilson, 1979). Paglia et al. (2003, 2004, 2005) conducted ND
and transmission electron microscopy (TEM) of �-alumina.
They compared the pure spinel model, Zhou–Snyder model
and cubic 16c model with a tetragonal model, and found a
better fit could be obtained using the tetragonal structure
model with space group I41/amd, which is composed of Al at
4a, 8c and 8d, and O at 16h (Paglia et al., 2003).
(c) Monoclinic structure. Based on density functional
theory (DFT) computation, Pinto et al. (2004) theoretically
predicted the �-Al2O3 structure as monoclinic with space
group C2/m, which is composed of purely spinel positions.
Digne et al. (2004) described a different monoclinic structure
model with a space group of P21/m, obtained from previous
DFT calculations by the same group (Krokidis et al., 2001),
which contains a significant fraction of nonspinel positions.
In addition to the discrepancies in the crystal structure
determination of �-Al2O3, its transformation mechanism from
boehmite through dehydration is also not clear. Basically, the
following transformation mechanisms have been proposed.
(a) Collapse mechanism. Since the boehmite contains Al—
O—OH layers with hydrogen between these layers (Chris-
tensen et al., 1982; Bokhimi et al., 2001), it is intuitive to
consider a collapse of layers after dehydration by removing
H2O molecules (Lippens & de Boer, 1964; Krokidis et al.,
2001) or H2 gas under high-energy irradiation (Westbrook et
al., 2015; Kaddissy et al., 2017, 2019; LaVerne & Huestis, 2019).
In an early pioneer work, Lippens & de Boer (1964) studied
the transformation of boehmite to �-alumina and others by
selected-area electron diffraction (SAED). The transforma-
tion orientation relationship (OR) was observed as
aB k�110
��; bB k
�001
��; cB k
�1�110
��; ð2Þ
where the subscripts B and � represent boehmite and the �phase, respectively, and the � phase is described as a cubic
spinel structure. The predicted shrinkage is 31%, which is very
large after the dehydration. This collapse mechanism was also
proposed for other similar structures, such as FeOOH
(Desiraju & Rao, 1982), CoOOH (Figlarz et al., 1976) and
CdOOH (Niepce et al., 1977).
Based on DFT calculations, Krokidis et al. (2001) reported a
theoretical study of the dehydration process from boehmite to
�-alumina. The transformation process involves multiple steps
as follows: (i) dehydration by hydrogen transfer and H2O
extraction; (ii) structural collapse accompanied with structural
shearing to form a monoclinic structure; and (iii) Al migration
from octahedral to tetrahedral sites to form the �-alumina
structure. This mechanism involves both collapse and diffusion
processes. Nguefack et al. (2003) further discussed the
mechanisms by considering full dehydration and partial
dehydration, and obtained two different quadratic cells. Very
recently, van Gog (2021) conducted a DFT study of the
dehydration interface between boehmite and �-Al2O3, and
identified interface defects during relaxation. To date, no
direct experimental observations were reported to support
this collapse mechanism.
(b) Reaction mechanism. Another pioneering work on the
boehmite to �-Al2O3 transformation was made by Wilson
(1979) using X-ray and SAED. In situ transformation by
e-beam irradiation from boehmite to �-Al2O3 was observed,
with the formation of lamellar pores and {111}� lattice fringes.
As no shrinkage was observed, the transformation mechanism
was proposed based on a diffusion process, involving
countermigration of protons and Al3+ cations, with a
constraint that the direction of diffusion is governed by the
hydrogen bond chain in boehmite. This process results in the
formation of voids or pores, without the need for layers to
collapse. This mechanism was also proposed for other struc-
tures, such as Mg(OH)2 (Ball & Taylor, 1961). To date, no
experimental results are reported to support this reaction
mechanism.
So far, the research on alumina is predominately conducted
experimentally using XRD or ND, or theoretically. Recently,
Ayoola, House et al. (2020) conducted a comparison of these
current structure models using single-crystal SAED. It was
found that the SAED spot pattern symmetry suggested that
both the cubic Smrcok spinel model and the tetragonal Paglia
model are better than the monoclinic models; further, the
research papers
Acta Cryst. (2021). B77, 772–784 Zhiping Luo � Boehmite-derived �-alumina and its transformation mechanism 773
former traditional cubic spinel model is more accurate than
the latter tetragonal model.
As the alumina materials are in the nano form, the electron
microscopy method may have some advantages over the
traditional X-ray or neutron methods, because of the strong
interaction of electrons with the material, so only minute
crystals are needed to avoid any impurity phases, and in situ
transformation by e-beam irradiation enables a direct obser-
vation through imaging. Whereas the electron multiple scat-
tering effect could be ignored in the quantification of
nanocrystals if they are well dispersed without aggregation
along the electron beam direction (Weirich et al., 1996;
Weirich, Winterer et al., 2000; Weirich, Zou et al., 2000;
Weirich et al., 2002; Li, 2012; 2018). In this work, we attempted
to conduct quantitative refinements of the electron diffraction
patterns, for the first time, to reveal the crystal structure of
�-alumina in a different approach over the traditional
methods. Through in situ observation by e-beam irradiation of
the boehmite! �-alumina transformation, a crystallographic
relationship was established and dimensional changes were
recorded. Based on the experimental results, we discuss the
boehmite! �-alumina transformation mechanism, providing
a clear crystallographic picture to illustrate how these two
types of transformation mechanisms occur, involving the
formation of different �-alumina structure models.
2. Experimental methods
The experimental materials were commercial nanoparticles
provided by Sasol, namely CATAPAL 200 boehmite and
�-alumina nanoparticles. The sample synthesis is described in
the literature (Baxter, 2005; Sasol, 2021) and the �-alumina
was synthesized by calcinating boehmite at 500�800 �C.
Nanoparticles were deposited on carbon film supported grids.
TEM work was conducted at room temperature using a JEOL
2010 TEM instrument at 200 kV, which was equipped with a
Gatan SC1000 ORIUS CCD camera (4008 � 2672 pixels). In
order to record electron diffraction patterns accurately, the
camera length in diffraction mode was kept constant, to avoid
any error due to the presence of magnetic hysteresis in the
microscope. At first, a commercial standard of Al foil was used
to take polycrystalline electron diffraction ring patterns for
correcting any system distortions and calibrating the camera
constant. In the next step, the sample was loaded into the
microscope, while any necessary focusing was made by moving
the specimen Z-height mechanically, without using the elec-
trical focus knob that interferes with the optical focal length.
The SAED pattern intensity profiles were produced using the
ELD program (Zou et al., 1993a,b) in the CRISP package
(Hovmoller, 1992). Some of the patterns were processed using
DiffTools which enables calibration and finding zero point
(Mitchell, 2008). However, even with careful calibration, slight
errors in the scale (camera length) or zero point could still
exist, which is one of the two major weaknesses of the electron
diffraction method, compared with X-ray or neutron diffrac-
tion (another weakness is the high background which will be
discussed in the following section). Therefore, the patterns
were further calibrated using the diffraction peaks from the
known boehmite phase as an internal standard through a
linear relationship
2�ð Þcorr ¼ k0 þ k 2�ð Þ; ð3Þ
where k0 is the zero-point correction, and k is the scale
correction. After the calibration, the Reflex module in Mate-
rials Studio by BIOVIA was used to conduct Rietveld
refinement and pattern processing, as described previously
(Luo et al., 2011). In the Rietveld refinement algorithm,
according to the Reflex manual, the profile residual factor Rp,
weighted profile residual Rwp and background-corrected
weighted profile residual Rwpb are defined as
Rp ¼X
i
h��Iobs
�2�i
�� Ical
�2�i
�� Iback
�2�i
����Xi
Iobs
�2�i
�i� 100%; ð4Þ
Rwp ¼
"Xi
wi
��Iobs
�2�i
�� Ical
�2�i
�� Iback
�2�i
���2#1=2
�
(Xi
wi
hIobs
�2�i
�i2
)�1=2
� 100%; ð5Þ
Rwpb ¼
"Xi
wi
��Iobs
�2�i
�� Ical
�2�i
�� Iback
�2�i
���2#1=2
�
(Xi
wi
hIobs
�2�i
�� Iback
�2�i
�i2
)�1=2
� 100%; ð6Þ
where Iback is the background intensity and wi is a weighting
function.
To get accurate size measurement, imaging magnifications
were calibrated using SiC lattice fringes at different nominal
magnifications (Luo, 2006). Simulation of single diffraction
patterns were made using the Tempas program. Stereo
projections were plotted using PTCLab (Gu et al., 2016), and
crystal structures are illustrated using the VESTA program
(Momma & Izumi, 2011).
3. Results and discussion
3.1. Structure of synthetic c-alumina
In order to analyze the electron diffraction patterns of
�-alumina, we first simulate the electron diffraction patterns
of cubic Smrcok, tetragonal Paglia, monoclinic Digne and
Pinto models, as shown in Fig. S1(a)–S1(d), respectively.
Overall, most of their peak positions are consistent, especially
the patterns from the Smrcok and Paglia models are similar;
while the two monoclinic models are characterized with many
peaks due to their lower symmetries, and the Digne model
produces a strong peak (100) at a lower angle. As the peak
intensities may vary upon the atomic occupancy and coordi-
nation deviation from the model, structural refinement is
needed to fit the intensity.
research papers
774 Zhiping Luo � Boehmite-derived �-alumina and its transformation mechanism Acta Cryst. (2021). B77, 772–784
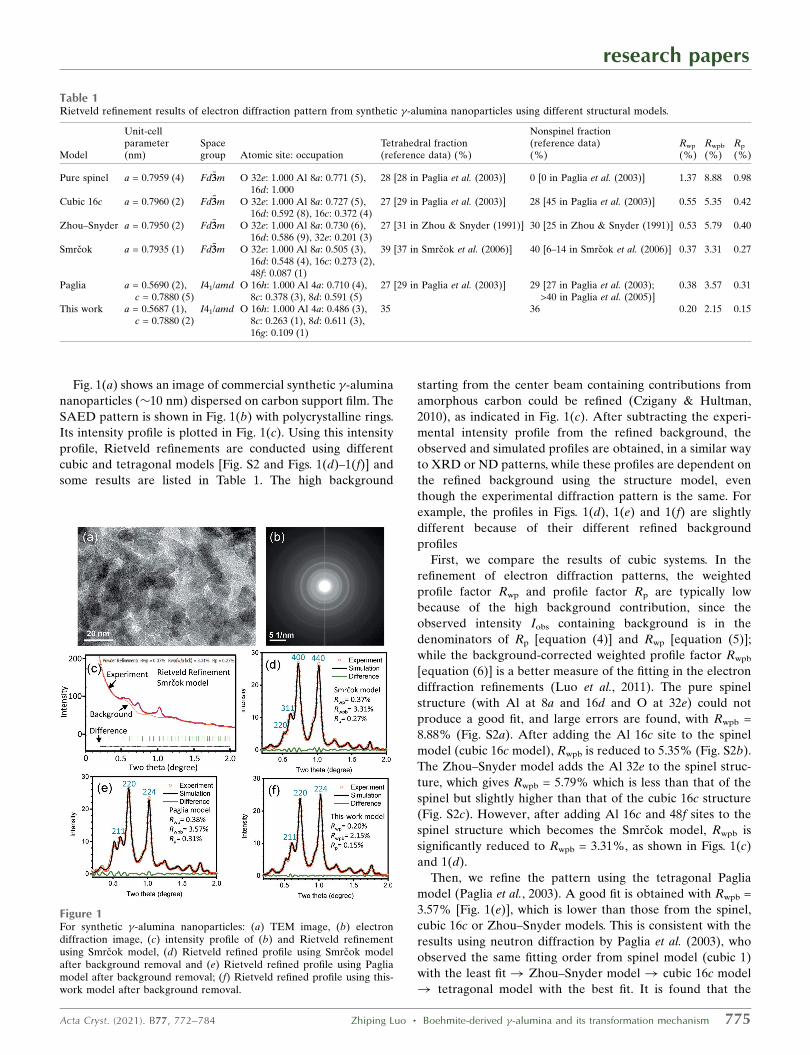
Fig. 1(a) shows an image of commercial synthetic �-alumina
nanoparticles (�10 nm) dispersed on carbon support film. The
SAED pattern is shown in Fig. 1(b) with polycrystalline rings.
Its intensity profile is plotted in Fig. 1(c). Using this intensity
profile, Rietveld refinements are conducted using different
cubic and tetragonal models [Fig. S2 and Figs. 1(d)–1(f)] and
some results are listed in Table 1. The high background
starting from the center beam containing contributions from
amorphous carbon could be refined (Czigany & Hultman,
2010), as indicated in Fig. 1(c). After subtracting the experi-
mental intensity profile from the refined background, the
observed and simulated profiles are obtained, in a similar way
to XRD or ND patterns, while these profiles are dependent on
the refined background using the structure model, even
though the experimental diffraction pattern is the same. For
example, the profiles in Figs. 1(d), 1(e) and 1(f) are slightly
different because of their different refined background
profiles
First, we compare the results of cubic systems. In the
refinement of electron diffraction patterns, the weighted
profile factor Rwp and profile factor Rp are typically low
because of the high background contribution, since the
observed intensity Iobs containing background is in the
denominators of Rp [equation (4)] and Rwp [equation (5)];
while the background-corrected weighted profile factor Rwpb
[equation (6)] is a better measure of the fitting in the electron
diffraction refinements (Luo et al., 2011). The pure spinel
structure (with Al at 8a and 16d and O at 32e) could not
produce a good fit, and large errors are found, with Rwpb =
8.88% (Fig. S2a). After adding the Al 16c site to the spinel
model (cubic 16c model), Rwpb is reduced to 5.35% (Fig. S2b).
The Zhou–Snyder model adds the Al 32e to the spinel struc-
ture, which gives Rwpb = 5.79% which is less than that of the
spinel but slightly higher than that of the cubic 16c structure
(Fig. S2c). However, after adding Al 16c and 48f sites to the
spinel structure which becomes the Smrcok model, Rwpb is
significantly reduced to Rwpb = 3.31%, as shown in Figs. 1(c)
and 1(d).
Then, we refine the pattern using the tetragonal Paglia
model (Paglia et al., 2003). A good fit is obtained with Rwpb =
3.57% [Fig. 1(e)], which is lower than those from the spinel,
cubic 16c or Zhou–Snyder models. This is consistent with the
results using neutron diffraction by Paglia et al. (2003), who
observed the same fitting order from spinel model (cubic 1)
with the least fit! Zhou–Snyder model! cubic 16c model
! tetragonal model with the best fit. It is found that the
research papers
Acta Cryst. (2021). B77, 772–784 Zhiping Luo � Boehmite-derived �-alumina and its transformation mechanism 775
Table 1Rietveld refinement results of electron diffraction pattern from synthetic �-alumina nanoparticles using different structural models.
Model
Unit-cellparameter(nm)
Spacegroup Atomic site: occupation
Tetrahedral fraction(reference data) (%)
Nonspinel fraction(reference data)(%)
Rwp
(%)Rwpb
(%)Rp
(%)
Pure spinel a = 0.7959 (4) Fd�33m O 32e: 1.000 Al 8a: 0.771 (5),16d: 1.000
28 [28 in Paglia et al. (2003)] 0 [0 in Paglia et al. (2003)] 1.37 8.88 0.98
Cubic 16c a = 0.7960 (2) Fd�33m O 32e: 1.000 Al 8a: 0.727 (5),16d: 0.592 (8), 16c: 0.372 (4)
27 [29 in Paglia et al. (2003)] 28 [45 in Paglia et al. (2003)] 0.55 5.35 0.42
Zhou–Snyder a = 0.7950 (2) Fd�33m O 32e: 1.000 Al 8a: 0.730 (6),16d: 0.586 (9), 32e: 0.201 (3)
27 [31 in Zhou & Snyder (1991)] 30 [25 in Zhou & Snyder (1991)] 0.53 5.79 0.40
Smrcok a = 0.7935 (1) Fd�33m O 32e: 1.000 Al 8a: 0.505 (3),16d: 0.548 (4), 16c: 0.273 (2),48f: 0.087 (1)
39 [37 in Smrcok et al. (2006)] 40 [6–14 in Smrcok et al. (2006)] 0.37 3.31 0.27
Paglia a = 0.5690 (2),c = 0.7880 (5)
I41/amd O 16h: 1.000 Al 4a: 0.710 (4),8c: 0.378 (3), 8d: 0.591 (5)
27 [29 in Paglia et al. (2003)] 29 [27 in Paglia et al. (2003);>40 in Paglia et al. (2005)]
0.38 3.57 0.31
This work a = 0.5687 (1),c = 0.7880 (2)
I41/amd O 16h: 1.000 Al 4a: 0.486 (3),8c: 0.263 (1), 8d: 0.611 (3),16g: 0.109 (1)
35 36 0.20 2.15 0.15
Figure 1For synthetic �-alumina nanoparticles: (a) TEM image, (b) electrondiffraction image, (c) intensity profile of (b) and Rietveld refinementusing Smrcok model, (d) Rietveld refined profile using Smrcok modelafter background removal and (e) Rietveld refined profile using Pagliamodel after background removal; (f) Rietveld refined profile using this-work model after background removal.
Smrcok model yields a slightly better fit, supporting the results
from single-crystal electron diffraction by Ayoola, House et al.
(2020). In fact, the Smrcok and Paglia models are closely
related, see insets in Figs. S1a and S1b. The Paglia model is
selected with a and b along two perpendicular 12h110i direc-
tions of the cubic structure and c remains the same direction.
Since a and c values are nonequal in the tetragonal structure, it
offers more flexibilities so better fit could be obtained over the
cubic 16c or Zhou–Snyder models. However, the Smrcok
model contains more Al on the nonspinel tetrahedral 48f sites;
and during the refinement process, it was found that after
adding the 48f site, even at very low occupation, the R factors
could be significantly reduced. Therefore, it gives a clue to
modify the tetragonal Paglia model. It is found that after
adding the 16g (14,
12,
78) tetrahedral site, surprisingly the R factor
was significantly reduced, as shown in Fig. 1(f), with Rwpb =
2.15% which is better that of the Paglia model. As a test, we
also added other sites such as tetrahedral 4b or 8e, and it was
found that their refined occupations were almost 0.0, with
almost the same R factors, so 4b and 8e are not included in the
structure model. The structure of the �-alumina is refined and
the refined parameters are listed in Table 2.
Considering the Al3+ cation fraction at tetrahedral and
octahedral positions, as listed in Table 1, the Smrcok model
yields 39% fraction of tetrahedral sites, which is close to the
reported value of 37% using the X-ray method (Smrcok et al.,
2006). The refinement using the Paglia model yields 27%
tetrahedral sites. By adding 16g to the Paglia model, the Al
fraction on tetrahedral sites is increased to 35%. From the
previous published work, the tetrahedral site fraction was
reported as 29% by Paglia et al. (2003), or in the 31–34% range
depending on processing temperature in another reference
(Paglia et al., 2004). Rudolph et al. (2017) found 45% Al
fraction occupying tetrahedral sites. In fact, the Al3+ cation
location can be experimentally determined directly using 27Al
nuclear magnetic resonance (NMR) spectroscopy (Prins,
2020). Samain et al. (2014) reported the tetrahedral site Al3+
fraction as 30%, followed with a report of the fraction in the
35–37% range by Lee et al. (2015), 30–35% range by
Khivantsev et al. (2020), 33.7–35.2% range by Huestis et al.
(2020), and 39.6% by Xu et al. (2021) recently. The result of
35% fraction of tetrahedral sites by our model is close to those
those values reported by the NMR studies.
Considering the Al3+ cation fraction on the nonspinel
positions (Table 1), Smrcok et al. (2006) reported that in the
�-alumina single crystals, the Al fraction of nonspinel sites is
only 6% according to their supplied online CIF file data; or
using the occupation data on the printed page, the fraction is
calculated as 14%, because of the very low Al occupation on
16c and 48f sites. Such a low fraction from single crystals is
inconsistent with other results from the boehmite-derived �-
alumina, as questioned by Prins (2020) recently, since a much
higher fraction of nonspinel positions is needed to fit the XRD
patterns (Zhou & Snyder, 1991; Paglia et al., 2003). However,
our refinement yields higher occupations of 16c and 48f sites
than the Smrcok model, giving a higher fraction of 40%. In the
literature, the nonspinel position fraction was reported as 25%
by Zhou & Snyder (1991), and 27% by Paglia et al. (2003)
experimentally, who further investigated theoretically and
predicted over 40% occupation on nonspinel positions (Paglia
et al., 2005). Using atomic pair distribution function analysis of
synchrotron powder diffraction data, Samain et al. (2014)
found that the nonspinel position fraction is 43–52%. From the
refinement results, the nonspinel position fraction is increased
from 29% by the Paglia model to 36% by our model (Table 1),
which is consistent with these reports.
3.2. Boehmite to c-alumina in situ transformation
During the observation of boehmite nanoparticles, it was
noticed that the sample was extremely sensitive to the electron
beam, so precautions were made to avoid long exposure to
reduce the beam damage. In the experiment, when an area was
selected, an electron diffraction pattern was immediately
taken [Fig. 2(a)]. The screen current density was 1.0 �
10�10 A cm�2, and the total time for the sample exposed to the
electron beam is estimated as 10 s, so the received dose is
estimated as 143.8 � 103 e nm�2 (the number of electrons
received over 1 nm2 area during this period), according to the
research papers
776 Zhiping Luo � Boehmite-derived �-alumina and its transformation mechanism Acta Cryst. (2021). B77, 772–784
Table 2Refined structure of �-alumina.
Space group: I41/amd (#141, origin choice 2); unit-cell parameters: a =0.5687 (1) nm, c = 0.7880 (2) nm; R factors: Rwp = 0.20%, Rwpb = 2.15%, Rp =0.15%
Atom
Wyckoff
site x y z
Biso
(A2) Occupation
O 16h 0 0.0113 (4) 0.2646 (4) 1.0 1.000Al 4a 0 0.75 0.125 0.3 0.486 (3)Al 8c 0 0 0 0.3 0.263 (1)Al 8d 0 0 0.5 0.3 0.611 (3)Al 16g 0.25 0.5 0.875 0.3 0.109 (1)
Figure 2(a) Electron diffraction pattern of boehmite; (b) image of boehmitecrystallites; (c) intensity profile of (a) and background removal usingBruckner algorithm; (d) intensity profile after the background removal;(e) simulated electron diffraction pattern of boehmite. Arrows in (d)indicate the formation of �-alumina even though the pattern in (a) istaken in the beginning of the experiment. Inserted in (e) is a structuralmodel of boehmite, where Al is shown in green, O in red, and H in peach(the smallest in size).
manufacturer’s specification of the instrument. Afterward, the
image was taken [Fig. 2(b)].
Here, we firstly analyze the diffraction pattern in Fig. 2(a).
Its intensity profile is shown in Fig. 2(c). We process the
background using a simple algorithm proposed by Bruckner
(2000), which can provide a quick removal of the high back-
ground without the need to refine or simulate the background
(Luo, 2016). The processed background is shown in Fig. 2(c),
and an enlargement is shown in the inset. After subtracting the
background, the diffraction peaks are obtained, as shown in
the enlargement in Fig. 2(d). An electron diffraction pattern of
the boehmite structure (Christensen et al., 1982; Bokhimi et al.,
2001) is simulated in Fig. 2(e) for comparison. It is found that
most of the experimental peaks in Fig. 2(d) are consistent with
boehmite, while a few small peaks, as indicated by arrows, are
from �-alumina, indicating that although this was the first
photo taken in the experiment, the structure was already
partially transformed. The lower peak of (020)B in Fig. 2(d), as
compared with the simulation, is caused by this background
removal method which partially cuts off the peak intensity, as
well as the fact that the sample is already partially trans-
formed.
The time taking the image in Fig. 2(b) is estimated as 10 s,
and then this specimen area was illuminated for 1 min at the
same screen current density of 1.0 � 10�10 A cm�2, and the
second diffraction pattern was taken, as shown in Fig. 3(b)
[Fig. 3(a) is the same as Fig. 2(a), which is placed here as a
sequence for comparison], where the total dose received is
estimated as 1.4� 106 e nm�2. The third [Figs. 3(c)] and fourth
[Fig. 3(d)] patterns were also taken in a one minute interval of
illumination under the same screen current density of 1.0 �
10�10 A cm�2, while the fifth [Fig. 3(e)] pattern was taken after
four minutes of illumination at the same screen current density
of 1.0 � 10�10 A cm�2. The sixth [Fig. 3(f)] pattern was taken
after illuminating at a higher screen current density of 5.0 �
10�10 A cm�2 for 4 min, and the last one seventh was taken
after illuminating for 10 min [Fig. 3(g)] at this high screen
current density. The final total dose was estimated as 68.9 �
106 e nm�2. As shown in the image in Fig. 3(h), this area is
totally damaged, and small pores with 1�2 nm size appear in
the crystallites.
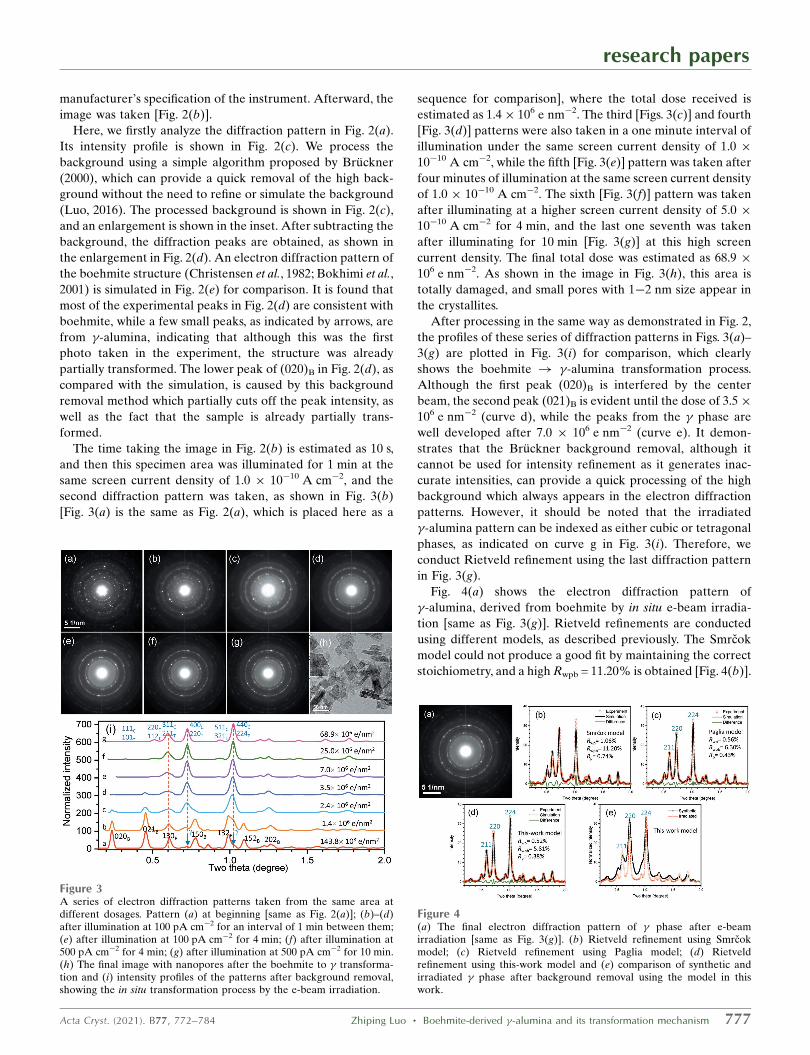
After processing in the same way as demonstrated in Fig. 2,
the profiles of these series of diffraction patterns in Figs. 3(a)–
3(g) are plotted in Fig. 3(i) for comparison, which clearly
shows the boehmite ! �-alumina transformation process.
Although the first peak (020)B is interfered by the center
beam, the second peak (021)B is evident until the dose of 3.5�
106 e nm�2 (curve d), while the peaks from the � phase are
well developed after 7.0 � 106 e nm�2 (curve e). It demon-
strates that the Bruckner background removal, although it
cannot be used for intensity refinement as it generates inac-
curate intensities, can provide a quick processing of the high
background which always appears in the electron diffraction
patterns. However, it should be noted that the irradiated
�-alumina pattern can be indexed as either cubic or tetragonal
phases, as indicated on curve g in Fig. 3(i). Therefore, we
conduct Rietveld refinement using the last diffraction pattern
in Fig. 3(g).
Fig. 4(a) shows the electron diffraction pattern of
�-alumina, derived from boehmite by in situ e-beam irradia-
tion [same as Fig. 3(g)]. Rietveld refinements are conducted
using different models, as described previously. The Smrcok
model could not produce a good fit by maintaining the correct
stoichiometry, and a high Rwpb = 11.20% is obtained [Fig. 4(b)].
research papers
Acta Cryst. (2021). B77, 772–784 Zhiping Luo � Boehmite-derived �-alumina and its transformation mechanism 777
Figure 3A series of electron diffraction patterns taken from the same area atdifferent dosages. Pattern (a) at beginning [same as Fig. 2(a)]; (b)–(d)after illumination at 100 pA cm�2 for an interval of 1 min between them;(e) after illumination at 100 pA cm�2 for 4 min; (f) after illumination at500 pA cm�2 for 4 min; (g) after illumination at 500 pA cm�2 for 10 min.(h) The final image with nanopores after the boehmite to � transforma-tion and (i) intensity profiles of the patterns after background removal,showing the in situ transformation process by the e-beam irradiation.
Figure 4(a) The final electron diffraction pattern of � phase after e-beamirradiation [same as Fig. 3(g)]. (b) Rietveld refinement using Smrcokmodel; (c) Rietveld refinement using Paglia model; (d) Rietveldrefinement using this-work model and (e) comparison of synthetic andirradiated � phase after background removal using the model in thiswork.
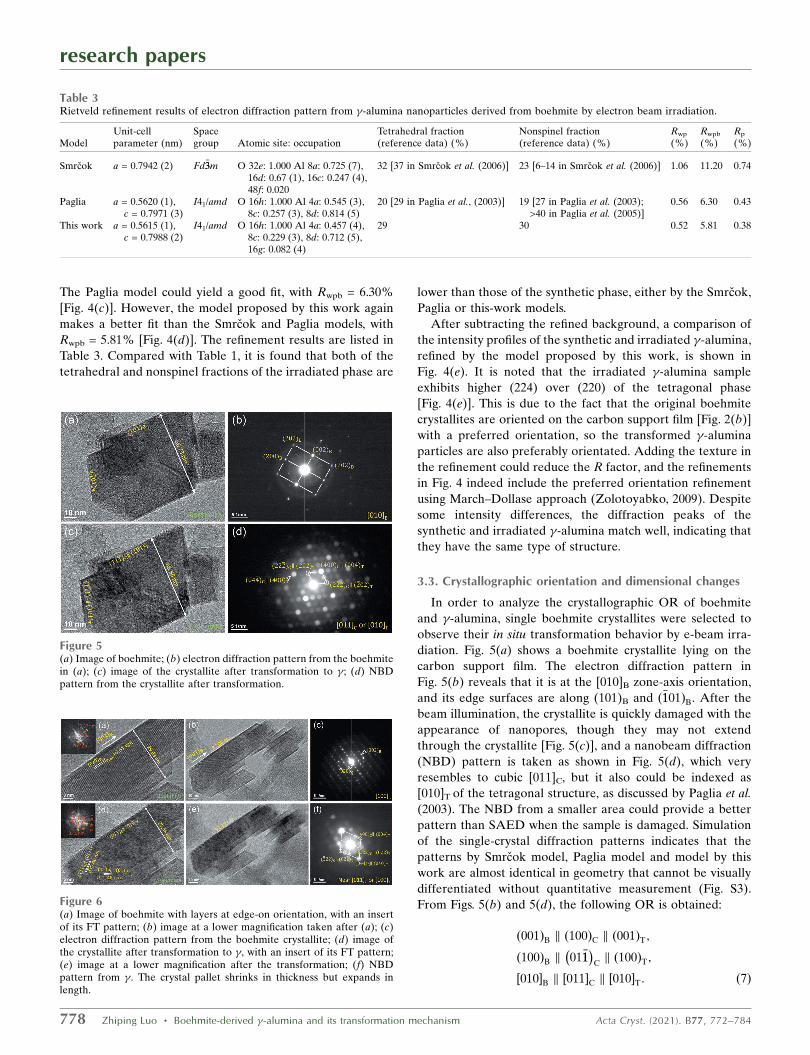
The Paglia model could yield a good fit, with Rwpb = 6.30%
[Fig. 4(c)]. However, the model proposed by this work again
makes a better fit than the Smrcok and Paglia models, with
Rwpb = 5.81% [Fig. 4(d)]. The refinement results are listed in
Table 3. Compared with Table 1, it is found that both of the
tetrahedral and nonspinel fractions of the irradiated phase are
lower than those of the synthetic phase, either by the Smrcok,
Paglia or this-work models.
After subtracting the refined background, a comparison of
the intensity profiles of the synthetic and irradiated �-alumina,
refined by the model proposed by this work, is shown in
Fig. 4(e). It is noted that the irradiated �-alumina sample
exhibits higher (224) over (220) of the tetragonal phase
[Fig. 4(e)]. This is due to the fact that the original boehmite
crystallites are oriented on the carbon support film [Fig. 2(b)]
with a preferred orientation, so the transformed �-alumina
particles are also preferably orientated. Adding the texture in
the refinement could reduce the R factor, and the refinements
in Fig. 4 indeed include the preferred orientation refinement
using March–Dollase approach (Zolotoyabko, 2009). Despite
some intensity differences, the diffraction peaks of the
synthetic and irradiated �-alumina match well, indicating that
they have the same type of structure.
3.3. Crystallographic orientation and dimensional changes
In order to analyze the crystallographic OR of boehmite
and �-alumina, single boehmite crystallites were selected to
observe their in situ transformation behavior by e-beam irra-
diation. Fig. 5(a) shows a boehmite crystallite lying on the
carbon support film. The electron diffraction pattern in
Fig. 5(b) reveals that it is at the [010]B zone-axis orientation,
and its edge surfaces are along (101)B and ð�1101ÞB. After the
beam illumination, the crystallite is quickly damaged with the
appearance of nanopores, though they may not extend
through the crystallite [Fig. 5(c)], and a nanobeam diffraction
(NBD) pattern is taken as shown in Fig. 5(d), which very
resembles to cubic [011]C, but it also could be indexed as
[010]T of the tetragonal structure, as discussed by Paglia et al.
(2003). The NBD from a smaller area could provide a better
pattern than SAED when the sample is damaged. Simulation
of the single-crystal diffraction patterns indicates that the
patterns by Smrcok model, Paglia model and model by this
work are almost identical in geometry that cannot be visually
differentiated without quantitative measurement (Fig. S3).
From Figs. 5(b) and 5(d), the following OR is obtained:
001ð ÞB k 100ð ÞC k 001ð ÞT;
100ð ÞB k 01�11� �
Ck 100ð ÞT;
010½ �B k 011½ �C k 010½ �T: ð7Þ
research papers
778 Zhiping Luo � Boehmite-derived �-alumina and its transformation mechanism Acta Cryst. (2021). B77, 772–784
Figure 5(a) Image of boehmite; (b) electron diffraction pattern from the boehmitein (a); (c) image of the crystallite after transformation to �; (d) NBDpattern from the crystallite after transformation.
Table 3Rietveld refinement results of electron diffraction pattern from �-alumina nanoparticles derived from boehmite by electron beam irradiation.
ModelUnit-cellparameter (nm)
Spacegroup Atomic site: occupation
Tetrahedral fraction(reference data) (%)
Nonspinel fraction(reference data) (%)
Rwp
(%)Rwpb
(%)Rp
(%)
Smrcok a = 0.7942 (2) Fd�33m O 32e: 1.000 Al 8a: 0.725 (7),16d: 0.67 (1), 16c: 0.247 (4),48f: 0.020
32 [37 in Smrcok et al. (2006)] 23 [6–14 in Smrcok et al. (2006)] 1.06 11.20 0.74
Paglia a = 0.5620 (1),c = 0.7971 (3)
I41/amd O 16h: 1.000 Al 4a: 0.545 (3),8c: 0.257 (3), 8d: 0.814 (5)
20 [29 in Paglia et al., (2003)] 19 [27 in Paglia et al. (2003);>40 in Paglia et al. (2005)]
0.56 6.30 0.43
This work a = 0.5615 (1),c = 0.7988 (2)
I41/amd O 16h: 1.000 Al 4a: 0.457 (4),8c: 0.229 (3), 8d: 0.712 (5),16g: 0.082 (4)
29 30 0.52 5.81 0.38
Figure 6(a) Image of boehmite with layers at edge-on orientation, with an insertof its FT pattern; (b) image at a lower magnification taken after (a); (c)electron diffraction pattern from the boehmite crystallite; (d) image ofthe crystallite after transformation to �, with an insert of its FT pattern;(e) image at a lower magnification after the transformation; (f) NBDpattern from �. The crystal pallet shrinks in thickness but expands inlength.
This OR is consistent with the pseudomorphosis relationship
between boehmite and cubic structures reported in the
literature (Lippens & de Boer, 1964; Wilson, 1979; Rudolph et
al., 2019). The width of the crystallite is measured as 66.73 nm
before transformation [Fig. 5(a)], and 66.56 nm after the
transformation [Fig. 5(c)], and the crystallite shrinks slightly
for 0.3%. However, the presence of nanopores interferes with
the accurate measurement of the dimensional changes, as the
nanopores can accommodate these changes.
Fig. 6(a) is an image of the boehmite crystallite with layers
oriented at the edge-on position. Its (020)B layer lattices are
clearly visible, with a spacing of 0.61 nm. A Fourier transfor-
mation (FT) pattern is inserted. Afterward, an image at a
lower magnification is then taken, as shown in Fig. 6(b), where
it can be seen from the disappearance of some lattice fringes
that the particle is partially damaged. The electron diffraction
pattern in Fig. 6(c) confirms the boehmite structure along its
[100]B zone axis, with its geometry consistent with the FT
pattern in Fig. 6(a). After the beam illumination, the boehmite
layers almost completely disappear, replaced with finer lattice
fringes with spacing of 0.46 nm, as indicated in Fig. 6(d), while
no evident pores are formed yet. If one measures the width,
the crystallite shrinks evidently from 29.63 nm to 27.46 nm,
with a shrinkage of 7.3%. However, the platelet along its
length [001]B direction expands from 87.06 nm [Fig. 6(b)] to
91.15 nm [Fig. 6(e)], with a length change of 4.7%. As the
crystal in Fig. 6(b) is already partially transformed, the real
expansion from a pure boehmite may be higher than this
measurement. After the transformation, the crystallite orien-
tation slightly changes, while the zone axis can be still recog-
nized as ½01�11�C or [100]T from the inserted FT pattern in
Fig. 6(d) and NBD pattern in Fig. 6(f). The observed OR is
thus
ð010ÞB k ð011ÞC k ð010ÞT;
ð001ÞB k ð100ÞC k ð001ÞT;
½100�B k ½01�11�C k ½100�T: ð8Þ
It is noted that although the shrinkage is a simple obser-
vation in TEM, to the best of our knowledge, it was not
reported in the literature. By ex situ measurements, it is hard
to find the size changes (Deng et al., 2010; Peng et al., 2012;
Huestis et al., 2020). Wilson (1979) pointed out that no
shrinkage was observed along the [010]B orientation, while the
layer edge-on orientation was not examined. The dimensional
changes will provide evidence regarding the transformation
mechanism, which will be discussed in the next section.
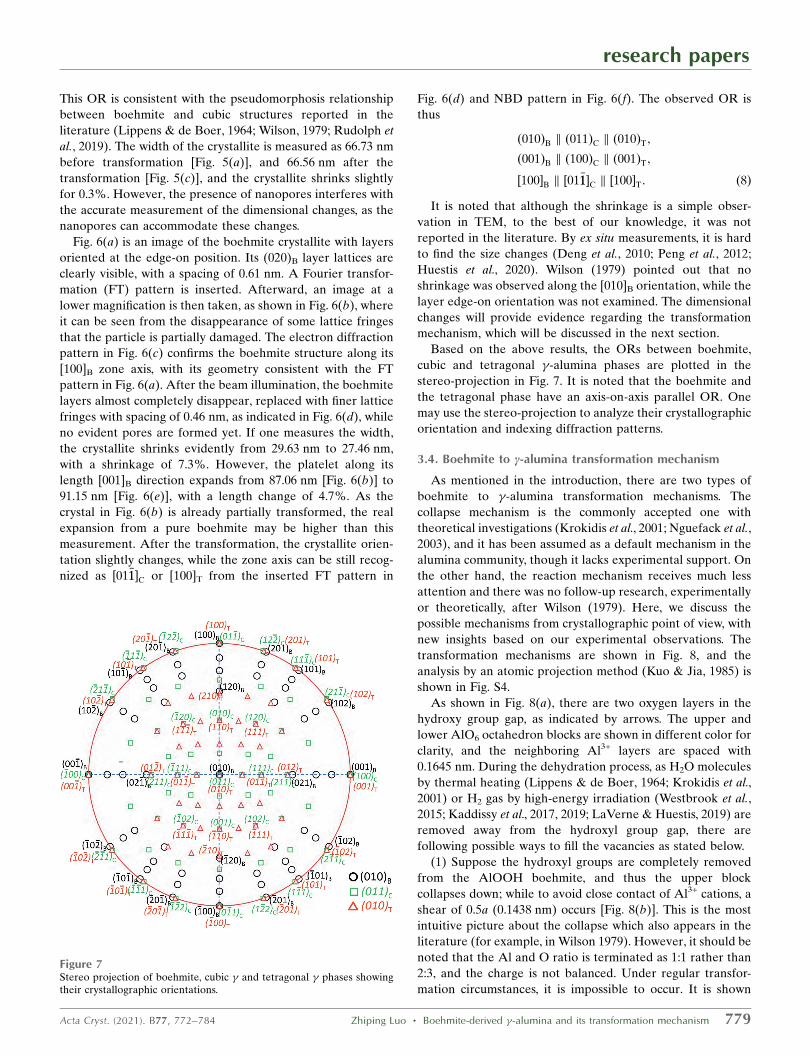
Based on the above results, the ORs between boehmite,
cubic and tetragonal �-alumina phases are plotted in the
stereo-projection in Fig. 7. It is noted that the boehmite and
the tetragonal phase have an axis-on-axis parallel OR. One
may use the stereo-projection to analyze their crystallographic
orientation and indexing diffraction patterns.
3.4. Boehmite to c-alumina transformation mechanism
As mentioned in the introduction, there are two types of
boehmite to �-alumina transformation mechanisms. The
collapse mechanism is the commonly accepted one with
theoretical investigations (Krokidis et al., 2001; Nguefack et al.,
2003), and it has been assumed as a default mechanism in the
alumina community, though it lacks experimental support. On
the other hand, the reaction mechanism receives much less
attention and there was no follow-up research, experimentally
or theoretically, after Wilson (1979). Here, we discuss the
possible mechanisms from crystallographic point of view, with
new insights based on our experimental observations. The
transformation mechanisms are shown in Fig. 8, and the
analysis by an atomic projection method (Kuo & Jia, 1985) is
shown in Fig. S4.
As shown in Fig. 8(a), there are two oxygen layers in the
hydroxy group gap, as indicated by arrows. The upper and
lower AlO6 octahedron blocks are shown in different color for
clarity, and the neighboring Al3+ layers are spaced with
0.1645 nm. During the dehydration process, as H2O molecules
by thermal heating (Lippens & de Boer, 1964; Krokidis et al.,
2001) or H2 gas by high-energy irradiation (Westbrook et al.,
2015; Kaddissy et al., 2017, 2019; LaVerne & Huestis, 2019) are
removed away from the hydroxyl group gap, there are
following possible ways to fill the vacancies as stated below.
(1) Suppose the hydroxyl groups are completely removed
from the AlOOH boehmite, and thus the upper block
collapses down; while to avoid close contact of Al3+ cations, a
shear of 0.5a (0.1438 nm) occurs [Fig. 8(b)]. This is the most
intuitive picture about the collapse which also appears in the
literature (for example, in Wilson 1979). However, it should be
noted that the Al and O ratio is terminated as 1:1 rather than
2:3, and the charge is not balanced. Under regular transfor-
mation circumstances, it is impossible to occur. It is shown
research papers
Acta Cryst. (2021). B77, 772–784 Zhiping Luo � Boehmite-derived �-alumina and its transformation mechanism 779
Figure 7Stereo projection of boehmite, cubic � and tetragonal � phases showingtheir crystallographic orientations.
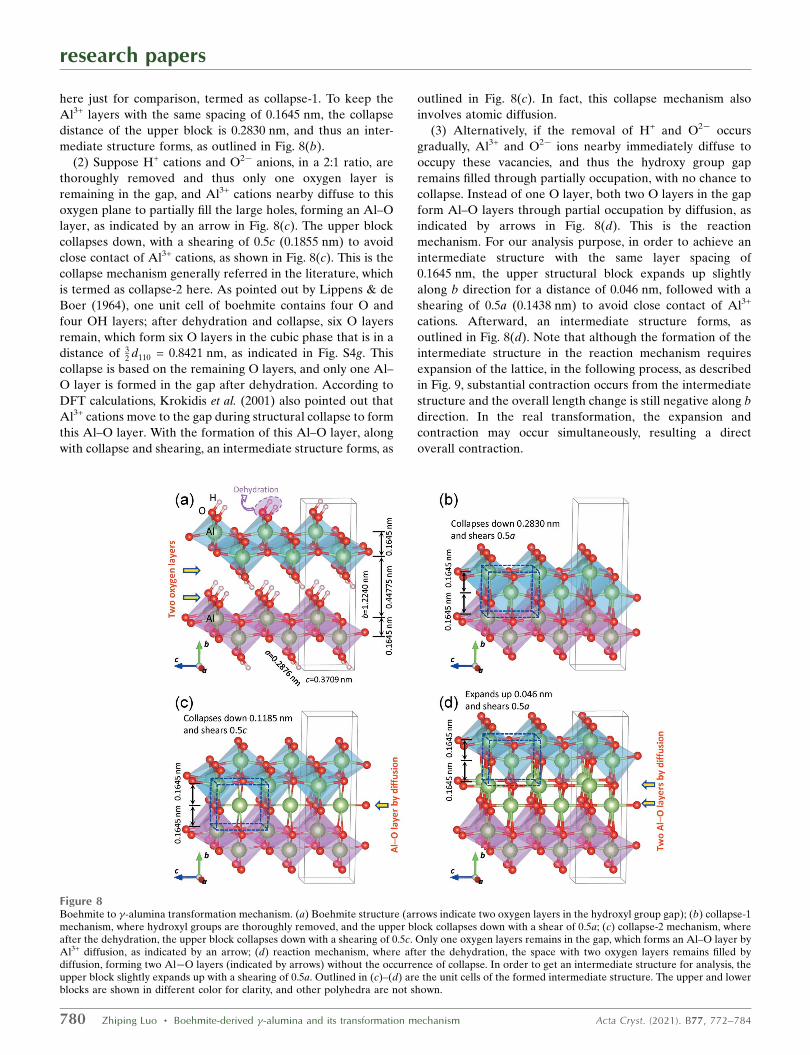
here just for comparison, termed as collapse-1. To keep the
Al3+ layers with the same spacing of 0.1645 nm, the collapse
distance of the upper block is 0.2830 nm, and thus an inter-
mediate structure forms, as outlined in Fig. 8(b).
(2) Suppose H+ cations and O2� anions, in a 2:1 ratio, are
thoroughly removed and thus only one oxygen layer is
remaining in the gap, and Al3+ cations nearby diffuse to this
oxygen plane to partially fill the large holes, forming an Al–O
layer, as indicated by an arrow in Fig. 8(c). The upper block
collapses down, with a shearing of 0.5c (0.1855 nm) to avoid
close contact of Al3+ cations, as shown in Fig. 8(c). This is the
collapse mechanism generally referred in the literature, which
is termed as collapse-2 here. As pointed out by Lippens & de
Boer (1964), one unit cell of boehmite contains four O and
four OH layers; after dehydration and collapse, six O layers
remain, which form six O layers in the cubic phase that is in a
distance of 32 d110 = 0.8421 nm, as indicated in Fig. S4g. This
collapse is based on the remaining O layers, and only one Al–
O layer is formed in the gap after dehydration. According to
DFT calculations, Krokidis et al. (2001) also pointed out that
Al3+ cations move to the gap during structural collapse to form
this Al–O layer. With the formation of this Al–O layer, along
with collapse and shearing, an intermediate structure forms, as
outlined in Fig. 8(c). In fact, this collapse mechanism also
involves atomic diffusion.
(3) Alternatively, if the removal of H+ and O2� occurs
gradually, Al3+ and O2� ions nearby immediately diffuse to
occupy these vacancies, and thus the hydroxy group gap
remains filled through partially occupation, with no chance to
collapse. Instead of one O layer, both two O layers in the gap
form Al–O layers through partial occupation by diffusion, as
indicated by arrows in Fig. 8(d). This is the reaction
mechanism. For our analysis purpose, in order to achieve an
intermediate structure with the same layer spacing of
0.1645 nm, the upper structural block expands up slightly
along b direction for a distance of 0.046 nm, followed with a
shearing of 0.5a (0.1438 nm) to avoid close contact of Al3+
cations. Afterward, an intermediate structure forms, as
outlined in Fig. 8(d). Note that although the formation of the
intermediate structure in the reaction mechanism requires
expansion of the lattice, in the following process, as described
in Fig. 9, substantial contraction occurs from the intermediate
structure and the overall length change is still negative along b
direction. In the real transformation, the expansion and
contraction may occur simultaneously, resulting a direct
overall contraction.
research papers
780 Zhiping Luo � Boehmite-derived �-alumina and its transformation mechanism Acta Cryst. (2021). B77, 772–784
Figure 8Boehmite to �-alumina transformation mechanism. (a) Boehmite structure (arrows indicate two oxygen layers in the hydroxyl group gap); (b) collapse-1mechanism, where hydroxyl groups are thoroughly removed, and the upper block collapses down with a shear of 0.5a; (c) collapse-2 mechanism, whereafter the dehydration, the upper block collapses down with a shearing of 0.5c. Only one oxygen layers remains in the gap, which forms an Al–O layer byAl3+ diffusion, as indicated by an arrow; (d) reaction mechanism, where after the dehydration, the space with two oxygen layers remains filled bydiffusion, forming two Al�O layers (indicated by arrows) without the occurrence of collapse. In order to get an intermediate structure for analysis, theupper block slightly expands up with a shearing of 0.5a. Outlined in (c)–(d) are the unit cells of the formed intermediate structure. The upper and lowerblocks are shown in different color for clarity, and other polyhedra are not shown.
It is noticed that the intermediate structure formed by the
above mechanisms are the same, if only Al3+ positions are
considered, as shown in Fig. 8(b)�8(d). The partial occupation
of Al3+ in Figs. 8(c) and 8(d) results in the partial occupation
of Al3+ in the final � phase, while the mechanism in Fig. 8(b)
does not produce the partial occupation. Further, in the
reaction mechanism in Fig. 8(d), after the dehydration the
oxygen layers still remain the same, with eight layers per unit
cell, suggesting the partial occupation of oxygen in these layers
in the initial stage, while eventually as the transformation
completes, the oxygen turns to full occupation in the � phase
through the formation of voids, as described by Wilson (1979).
In the case of the tetragonal � structure, the pseudomor-
phosis relationships of the collapse and reaction mechanisms
are expressed as
collapse-1 mechanism : aB !1
2aT; bB ! bT; cB !
1
2cT; ð9Þ
collapse-2 mechanism : aB !1
2aT; bB !
3
2bT; cB !
1
2cT;
ð10Þ
reaction mechanism : aB !1
2aT; bB ! 2bT; cB !
1
2cT: ð11Þ
In the case of cubic � structure, these pseudomorphosis
relationships are expressed as
collapse-1 mechanism : aB !1
2d01�11C
; bB ! d011C; cB !
1
2cC;
ð12Þ
collapse-2 mechanism : aB !1
2d01�11C
; bB !3
2d011C
; cB !1
2cC;
ð13Þ
reaction mechanism : aB !1
2d01�11C
; bB ! 2d011C; cB !
1
2cC:
ð14Þ
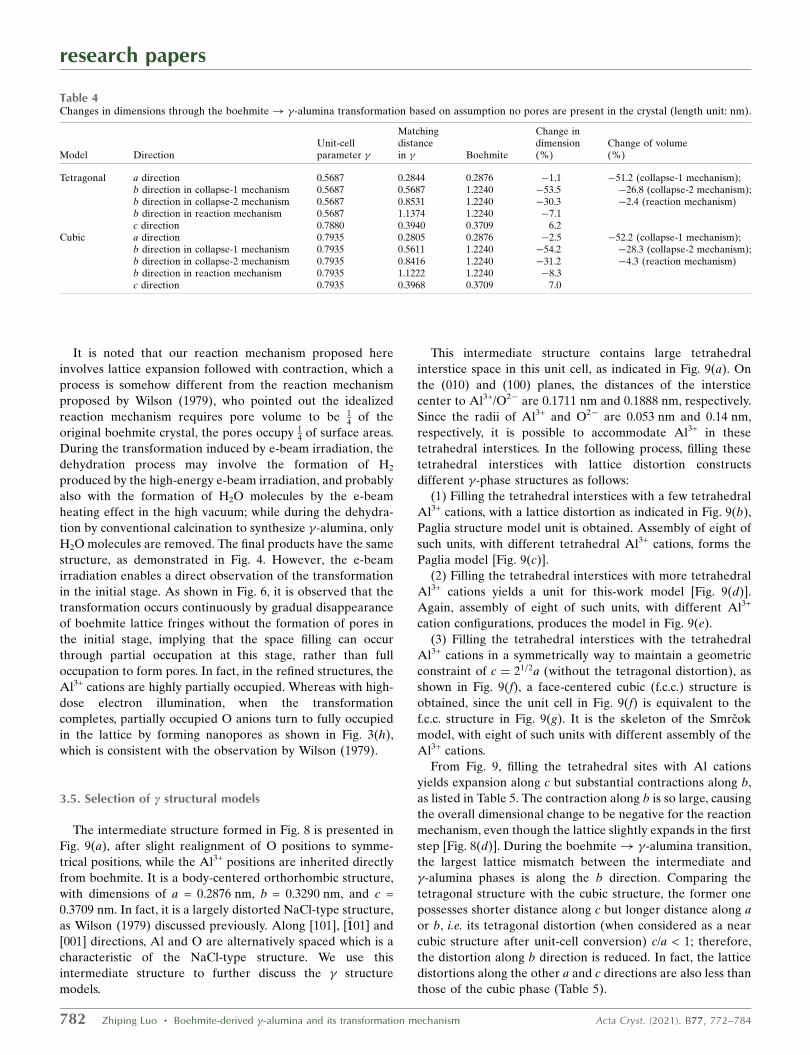
The pseudomorphosis relationships (13) and (14) of the
cubic structure are well reported in the literature by Lippens
& de Boer (1964) and Wilson (1979), respectively. According
to these geometric relationships, the dimensional changes of
tetragonal and cubic models are listed in Table 4, based on the
assumption that no pores are formed in the crystal. The
dimensional changes in a and c directions are not related to
the mechanism. However, the mechanism leads to large
differences in the dimension along b and also volume. In the
tetragonal structure, the collapse-1 and collapse-2 mechanisms
produce dimensional changes along b as�53.5% and�30.3%,
respectively; while the reaction mechanism, only �7.1%. The
experimental observation of �7.3% width change in Fig. 6
supports the reaction mechanism. In addition, the volume
change is predicted as high as �51.2% and �26.8% by the
collapse-1 and collapse-2, respectively; while by the reaction
mechanism, it is only �2.4% without a large change that is
consistence with the observation in Fig. 6. From Table 4, it is
noted that the tetragonal model yields smaller changes in
dimensions and volume, compared with the cubic phase.
Therefore, the tetragonal structure is more energetically
favorable than the cubic phase.
research papers
Acta Cryst. (2021). B77, 772–784 Zhiping Luo � Boehmite-derived �-alumina and its transformation mechanism 781
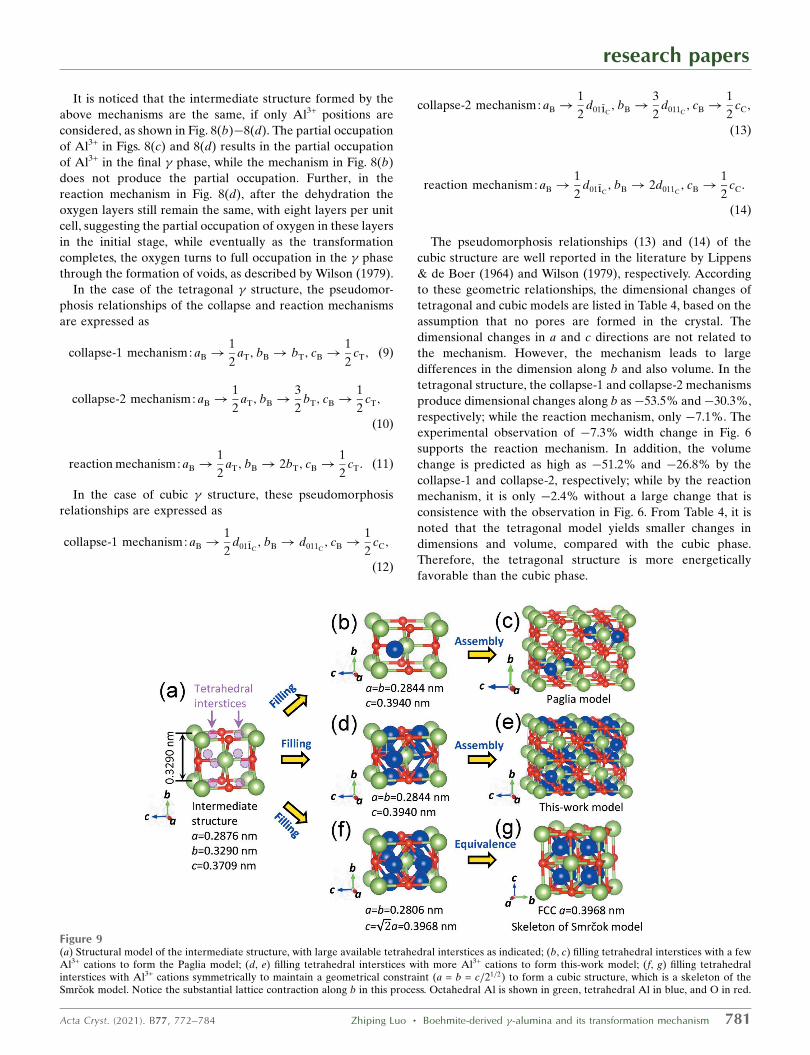
Figure 9(a) Structural model of the intermediate structure, with large available tetrahedral interstices as indicated; (b, c) filling tetrahedral interstices with a fewAl3+ cations to form the Paglia model; (d, e) filling tetrahedral interstices with more Al3+ cations to form this-work model; (f, g) filling tetrahedralinterstices with Al3+ cations symmetrically to maintain a geometrical constraint (a = b = c=21=2) to form a cubic structure, which is a skeleton of theSmrcok model. Notice the substantial lattice contraction along b in this process. Octahedral Al is shown in green, tetrahedral Al in blue, and O in red.
It is noted that our reaction mechanism proposed here
involves lattice expansion followed with contraction, which a
process is somehow different from the reaction mechanism
proposed by Wilson (1979), who pointed out the idealized
reaction mechanism requires pore volume to be 14 of the
original boehmite crystal, the pores occupy 14 of surface areas.
During the transformation induced by e-beam irradiation, the
dehydration process may involve the formation of H2
produced by the high-energy e-beam irradiation, and probably
also with the formation of H2O molecules by the e-beam
heating effect in the high vacuum; while during the dehydra-
tion by conventional calcination to synthesize �-alumina, only
H2O molecules are removed. The final products have the same
structure, as demonstrated in Fig. 4. However, the e-beam
irradiation enables a direct observation of the transformation
in the initial stage. As shown in Fig. 6, it is observed that the
transformation occurs continuously by gradual disappearance
of boehmite lattice fringes without the formation of pores in
the initial stage, implying that the space filling can occur
through partial occupation at this stage, rather than full
occupation to form pores. In fact, in the refined structures, the
Al3+ cations are highly partially occupied. Whereas with high-
dose electron illumination, when the transformation
completes, partially occupied O anions turn to fully occupied
in the lattice by forming nanopores as shown in Fig. 3(h),
which is consistent with the observation by Wilson (1979).
3.5. Selection of c structural models
The intermediate structure formed in Fig. 8 is presented in
Fig. 9(a), after slight realignment of O positions to symme-
trical positions, while the Al3+ positions are inherited directly
from boehmite. It is a body-centered orthorhombic structure,
with dimensions of a = 0.2876 nm, b = 0.3290 nm, and c =
0.3709 nm. In fact, it is a largely distorted NaCl-type structure,
as Wilson (1979) discussed previously. Along [101], ½�1101� and
[001] directions, Al and O are alternatively spaced which is a
characteristic of the NaCl-type structure. We use this
intermediate structure to further discuss the � structure
models.
This intermediate structure contains large tetrahedral
interstice space in this unit cell, as indicated in Fig. 9(a). On
the (010) and (100) planes, the distances of the interstice
center to Al3+/O2� are 0.1711 nm and 0.1888 nm, respectively.
Since the radii of Al3+ and O2� are 0.053 nm and 0.14 nm,
respectively, it is possible to accommodate Al3+ in these
tetrahedral interstices. In the following process, filling these
tetrahedral interstices with lattice distortion constructs
different �-phase structures as follows:
(1) Filling the tetrahedral interstices with a few tetrahedral
Al3+ cations, with a lattice distortion as indicated in Fig. 9(b),
Paglia structure model unit is obtained. Assembly of eight of
such units, with different tetrahedral Al3+ cations, forms the
Paglia model [Fig. 9(c)].
(2) Filling the tetrahedral interstices with more tetrahedral
Al3+ cations yields a unit for this-work model [Fig. 9(d)].
Again, assembly of eight of such units, with different Al3+
cation configurations, produces the model in Fig. 9(e).
(3) Filling the tetrahedral interstices with the tetrahedral
Al3+ cations in a symmetrically way to maintain a geometric
constraint of c ¼ 21=2a (without the tetragonal distortion), as
shown in Fig. 9(f), a face-centered cubic (f.c.c.) structure is
obtained, since the unit cell in Fig. 9(f) is equivalent to the
f.c.c. structure in Fig. 9(g). It is the skeleton of the Smrcok
model, with eight of such units with different assembly of the
Al3+ cations.
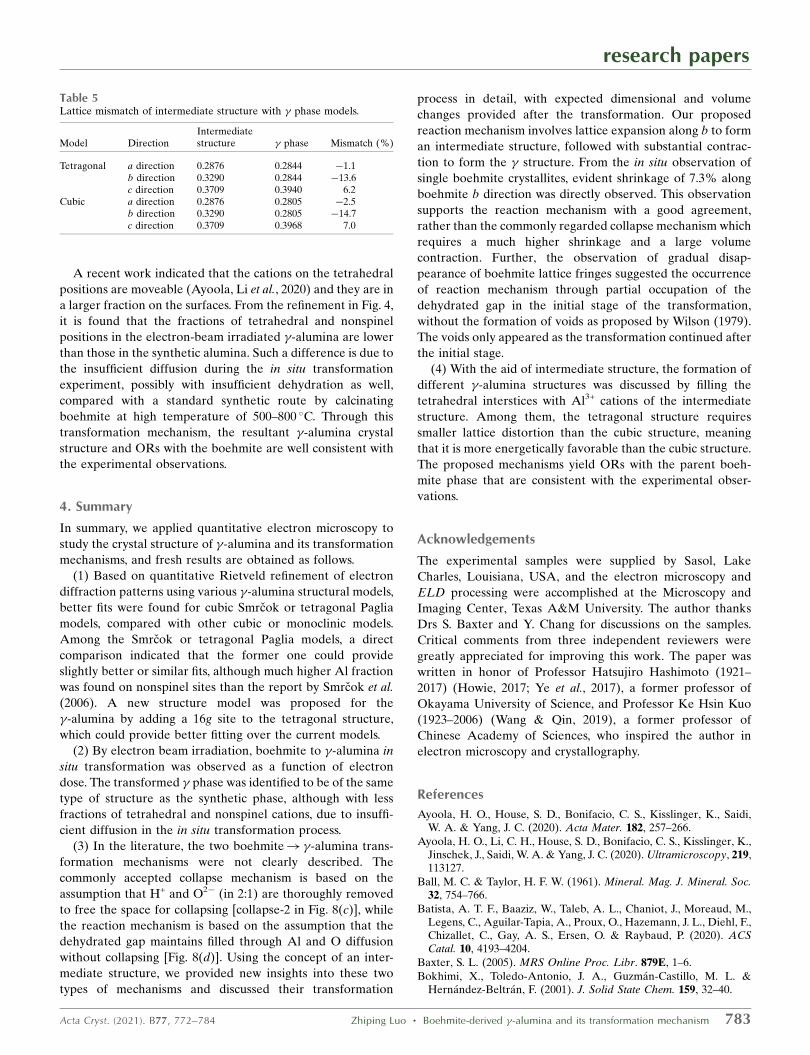
From Fig. 9, filling the tetrahedral sites with Al cations
yields expansion along c but substantial contractions along b,
as listed in Table 5. The contraction along b is so large, causing
the overall dimensional change to be negative for the reaction
mechanism, even though the lattice slightly expands in the first
step [Fig. 8(d)]. During the boehmite! �-alumina transition,
the largest lattice mismatch between the intermediate and
�-alumina phases is along the b direction. Comparing the
tetragonal structure with the cubic structure, the former one
possesses shorter distance along c but longer distance along a
or b, i.e. its tetragonal distortion (when considered as a near
cubic structure after unit-cell conversion) c/a < 1; therefore,
the distortion along b direction is reduced. In fact, the lattice
distortions along the other a and c directions are also less than
those of the cubic phase (Table 5).
research papers
782 Zhiping Luo � Boehmite-derived �-alumina and its transformation mechanism Acta Cryst. (2021). B77, 772–784
Table 4Changes in dimensions through the boehmite! �-alumina transformation based on assumption no pores are present in the crystal (length unit: nm).
Model DirectionUnit-cellparameter �
Matchingdistancein � Boehmite
Change indimension(%)
Change of volume(%)
Tetragonal a direction 0.5687 0.2844 0.2876 �1.1 �51.2 (collapse-1 mechanism);�26.8 (collapse-2 mechanism);�2.4 (reaction mechanism)
b direction in collapse-1 mechanism 0.5687 0.5687 1.2240 �53.5b direction in collapse-2 mechanism 0.5687 0.8531 1.2240 �30.3b direction in reaction mechanism 0.5687 1.1374 1.2240 �7.1c direction 0.7880 0.3940 0.3709 6.2
Cubic a direction 0.7935 0.2805 0.2876 �2.5 �52.2 (collapse-1 mechanism);�28.3 (collapse-2 mechanism);�4.3 (reaction mechanism)
b direction in collapse-1 mechanism 0.7935 0.5611 1.2240 �54.2b direction in collapse-2 mechanism 0.7935 0.8416 1.2240 �31.2b direction in reaction mechanism 0.7935 1.1222 1.2240 �8.3c direction 0.7935 0.3968 0.3709 7.0
A recent work indicated that the cations on the tetrahedral
positions are moveable (Ayoola, Li et al., 2020) and they are in
a larger fraction on the surfaces. From the refinement in Fig. 4,
it is found that the fractions of tetrahedral and nonspinel
positions in the electron-beam irradiated �-alumina are lower
than those in the synthetic alumina. Such a difference is due to
the insufficient diffusion during the in situ transformation
experiment, possibly with insufficient dehydration as well,
compared with a standard synthetic route by calcinating
boehmite at high temperature of 500–800 �C. Through this
transformation mechanism, the resultant �-alumina crystal
structure and ORs with the boehmite are well consistent with
the experimental observations.
4. Summary
In summary, we applied quantitative electron microscopy to
study the crystal structure of �-alumina and its transformation
mechanisms, and fresh results are obtained as follows.
(1) Based on quantitative Rietveld refinement of electron
diffraction patterns using various �-alumina structural models,
better fits were found for cubic Smrcok or tetragonal Paglia
models, compared with other cubic or monoclinic models.
Among the Smrcok or tetragonal Paglia models, a direct
comparison indicated that the former one could provide
slightly better or similar fits, although much higher Al fraction
was found on nonspinel sites than the report by Smrcok et al.
(2006). A new structure model was proposed for the
�-alumina by adding a 16g site to the tetragonal structure,
which could provide better fitting over the current models.
(2) By electron beam irradiation, boehmite to �-alumina in
situ transformation was observed as a function of electron
dose. The transformed � phase was identified to be of the same
type of structure as the synthetic phase, although with less
fractions of tetrahedral and nonspinel cations, due to insuffi-
cient diffusion in the in situ transformation process.
(3) In the literature, the two boehmite! �-alumina trans-
formation mechanisms were not clearly described. The
commonly accepted collapse mechanism is based on the
assumption that H+ and O2� (in 2:1) are thoroughly removed
to free the space for collapsing [collapse-2 in Fig. 8(c)], while
the reaction mechanism is based on the assumption that the
dehydrated gap maintains filled through Al and O diffusion
without collapsing [Fig. 8(d)]. Using the concept of an inter-
mediate structure, we provided new insights into these two
types of mechanisms and discussed their transformation
process in detail, with expected dimensional and volume
changes provided after the transformation. Our proposed
reaction mechanism involves lattice expansion along b to form
an intermediate structure, followed with substantial contrac-
tion to form the � structure. From the in situ observation of
single boehmite crystallites, evident shrinkage of 7.3% along
boehmite b direction was directly observed. This observation
supports the reaction mechanism with a good agreement,
rather than the commonly regarded collapse mechanism which
requires a much higher shrinkage and a large volume
contraction. Further, the observation of gradual disap-
pearance of boehmite lattice fringes suggested the occurrence
of reaction mechanism through partial occupation of the
dehydrated gap in the initial stage of the transformation,
without the formation of voids as proposed by Wilson (1979).
The voids only appeared as the transformation continued after
the initial stage.
(4) With the aid of intermediate structure, the formation of
different �-alumina structures was discussed by filling the
tetrahedral interstices with Al3+ cations of the intermediate
structure. Among them, the tetragonal structure requires
smaller lattice distortion than the cubic structure, meaning
that it is more energetically favorable than the cubic structure.
The proposed mechanisms yield ORs with the parent boeh-
mite phase that are consistent with the experimental obser-
vations.
Acknowledgements
The experimental samples were supplied by Sasol, Lake
Charles, Louisiana, USA, and the electron microscopy and
ELD processing were accomplished at the Microscopy and
Imaging Center, Texas A&M University. The author thanks
Drs S. Baxter and Y. Chang for discussions on the samples.
Critical comments from three independent reviewers were
greatly appreciated for improving this work. The paper was
written in honor of Professor Hatsujiro Hashimoto (1921–
2017) (Howie, 2017; Ye et al., 2017), a former professor of
Okayama University of Science, and Professor Ke Hsin Kuo
(1923–2006) (Wang & Qin, 2019), a former professor of
Chinese Academy of Sciences, who inspired the author in
electron microscopy and crystallography.
References
Ayoola, H. O., House, S. D., Bonifacio, C. S., Kisslinger, K., Saidi,W. A. & Yang, J. C. (2020). Acta Mater. 182, 257–266.
Ayoola, H. O., Li, C. H., House, S. D., Bonifacio, C. S., Kisslinger, K.,Jinschek, J., Saidi, W. A. & Yang, J. C. (2020). Ultramicroscopy, 219,113127.
Ball, M. C. & Taylor, H. F. W. (1961). Mineral. Mag. J. Mineral. Soc.32, 754–766.
Batista, A. T. F., Baaziz, W., Taleb, A. L., Chaniot, J., Moreaud, M.,Legens, C., Aguilar-Tapia, A., Proux, O., Hazemann, J. L., Diehl, F.,Chizallet, C., Gay, A. S., Ersen, O. & Raybaud, P. (2020). ACSCatal. 10, 4193–4204.
Baxter, S. L. (2005). MRS Online Proc. Libr. 879E, 1–6.Bokhimi, X., Toledo-Antonio, J. A., Guzman-Castillo, M. L. &
Hernandez-Beltran, F. (2001). J. Solid State Chem. 159, 32–40.
research papers
Acta Cryst. (2021). B77, 772–784 Zhiping Luo � Boehmite-derived �-alumina and its transformation mechanism 783
Table 5Lattice mismatch of intermediate structure with � phase models.
Model DirectionIntermediatestructure � phase Mismatch (%)
Tetragonal a direction 0.2876 0.2844 �1.1b direction 0.3290 0.2844 �13.6c direction 0.3709 0.3940 6.2
Cubic a direction 0.2876 0.2805 �2.5b direction 0.3290 0.2805 �14.7c direction 0.3709 0.3968 7.0
Boumaza, A., Favaro, L., Ledion, J., Sattonnay, G., Brubach, J. B.,Berthet, P., Huntz, A. M., Roy, P. & Tetot, R. (2009). J. Solid StateChem. 182, 1171–1176.
Bruckner, S. (2000). J. Appl. Cryst. 33, 977–979.Cai, W. Q. & Yu, X. F. (2007). Prog. Chem. 19, 1322–1330.Christensen, A. N., Lehmann, M. S. & Convert, P. (1982). Acta Chem.
Scand. 36a, 303–308.Czigany, Z. & Hultman, L. (2010). Ultramicroscopy, 110, 815–819.Deng, Y. D., Yang, Q., Lu, G. W. & Hu, W. B. (2010). Ceram. Int. 36,
1773–1777.Desiraju, G. R. & Rao, M. (1982). Mater. Res. Bull. 17, 443–449.Digne, M., Sautet, P., Raybaud, P., Euzen, P. & Toulhoat, H. (2004). J.
Catal. 226, 54–68.Figlarz, M., Guenot, J. & Fievet-Vincent, F. (1976). J. Mater. Sci. 11,
2267–2270.Gog, H. van (2021). Appl. Surf. Sci. 541, 148501.Gu, X.-F., Furuhara, T. & Zhang, W.-Z. (2016). J. Appl. Cryst. 49,
1099–1106.Gutierrez, G., Taga, A. & Johansson, B. (2002). Phys. Rev. B, 65,
012101.Hovmoller, S. (1992). Ultramicroscopy, 41, 121–135.Howie, A. (2017). Ultramicroscopy, 182, A1–A4.Huestis, P. L., Graham, T. R., Mergelsberg, S. T. & LaVerne, J. A.
(2020). Thermochim. Acta, 689, 178611.Ingram-Jones, V. J., Slade, R. C. T., Davies, T. W., Southern, J. C. &
Salvador, S. (1996). J. Mater. Chem. 6, 73–79.Kaddissy, J. A., Esnouf, S., Durand, D., Saffre, D., Foy, E. & Renault,
J.-P. (2017). J. Phys. Chem. C, 121, 6365–6373.Kaddissy, J. A., Esnouf, S., Saffre, D. & Renault, J.-P. (2019). Int. J.
Hydrogen Energy, 44, 3737–3743.Khivantsev, K., Jaegers, N. R., Kwak, J.-H., Szanyi, J., Kovarik, L. &
Khivantsev, K. (2020). Angew. Chem. 60, 17522–17530.Krokidis, X., Raybaud, P., Gobichon, A. E., Rebours, B., Euzen, P. &
Toulhoat, H. (2001). J. Phys. Chem. B, 105, 5121–5130.Kuo, K. H. & Jia, C. L. (1985). Acta Metall. 33, 991–996.LaVerne, J. A. & Huestis, P. L. (2019). J. Phys. Chem. C, 123, 21005–
21010.Lee, J., Jeon, H., Oh, D. G., Szanyi, J. & Kwak, J. H. (2015). Appl.
Catal. Gen. 500, 58–68.Li, X.-Z. (2012). J. Appl. Cryst. 45, 862–868.Li, X. Z. (2018). Microsc. Microanal. 24, 582–583.Lippens, B. C. & de Boer, J. H. (1964). Acta Cryst. 17, 1312–1321.Luo, Z. (2016). A Practical Guide to Transmission Electron
Microscopy, Vol. II: Advanced Microscopy. New York: MomentumPress.
Luo, Z., Vasquez, Y., Bondi, J. F. & Schaak, R. E. (2011).Ultramicroscopy, 111, 1295–1304.
Luo, Z. P. (2006). Acta Mater. 54, 47–58.Mandic, V., Kurajica, S., Muzina, K., Brlekovic, F. & Munda, I. K.
(2020). J. Therm. Anal. Calorim. 142, 1681–1691.Mitchell, D. R. G. (2008). Microsc. Res. Tech. 71, 588–593.Momma, K. & Izumi, F. (2011). J. Appl. Cryst. 44, 1272–1276.Nguefack, M., Popa, A. F., Rossignol, S. & Kappenstein, C. (2003).
Phys. Chem. Chem. Phys. 5, 4279–4289.
Niepce, J. C., Mesnier, M. T. & Louer, D. (1977). J. Solid State Chem.22, 341–351.
Paglia, G., Buckley, C. E., Rohl, A. L., Hart, R. D., Winter, K., Studer,A. J., Hunter, B. A. & Hanna, J. V. (2004). Chem. Mater. 16, 220–236.
Paglia, G., Buckley, C. E., Rohl, A. L., Hunter, B. A., Hart, R. D.,Hanna, J. V. & Byrne, L. T. (2003). Phys. Rev. B, 68, 144110.
Paglia, G., Rohl, A. L., Buckley, C. E. & Gale, J. D. (2005). Phys. Rev.B, 71, 224115.
Peng, L. L., Xu, X. Y., Lv, Z., Song, J. Q., He, M. Y., Wang, Q., Yan,L. J., Li, Y. & Li, Z. F. (2012). J. Therm. Anal. Calorim. 110, 749–754.
Pinto, H. P., Nieminen, R. M. & Elliott, S. D. (2004). Phys. Rev. B, 70,125402.
Poco, J. F., Satcher, J. H. & Hrubesh, L. W. (2001). J. Non-Cryst.Solids, 285, 57–63.
Prins, R. (2020). J. Catal. 392, 336–346.Rudolph, M., Motylenko, M. & Rafaja, D. (2019). IUCrJ, 6, 116–127.Rudolph, M., Salomon, A., Schmidt, A., Motylenko, M., Zienert, T.,
Stocker, H., Himcinschi, C., Amirkhanyan, L., Kortus, J., Aneziris,C. G. & Rafaja, D. (2017). Adv. Eng. Mater. 19, 1700141.
Samain, L., Jaworski, A., Eden, M., Ladd, D. M., Seo, D. K., JavierGarcia-Garcia, F. & Haussermann, U. (2014). J. Solid State Chem.217, 1–8.
Sasol (2021). PURAL CATAPAL: High-purity aluminahydrates. https://www.sasolgermany.de/fileadmin/doc/alumina/2021/Sasol_brochure_PURAL_CATAPAL_04-2021.pdf (accessedon June 24, 2021).
Smrcok, L., Langer, V. & Krestan, J. (2006). Acta Cryst. C62, i83–i84.Trueba, M. & Trasatti, S. P. (2005). Eur. J. Inorg. Chem. 2005, 3393–
3403.Verwey, E. J. W. (1935). Z. Kristallogr. 91, 65–69.Wang, D. N. & Qin, L. C. (2019). Protein Cell, 10, 79–86.Weirich, T. E., Ramlau, R., Simon, A., Hovmoller, S. & Zou, X. D.
(1996). Nature, 382, 144–146.Weirich, T. E., Winterer, M., Seifried, S., Hahn, H. & Fuess, H. (2000).
Ultramicroscopy, 81, 263–270.Weirich, T. E., Winterer, M., Seifried, S. & Mayer, J. (2002). Acta
Cryst. A58, 308–315.Weirich, T. E., Zou, X. D., Ramlau, R., Simon, A., Cascarano, G. L.,
Giacovazzo, C. & Hovmoller, S. (2000). Acta Cryst. A56, 29–35.Westbrook, M. L., Sindelar, R. L. & Fisher, D. L. (2015). J. Radioanal.
Nucl. Chem. 303, 81–86.Wilson, S. J. (1979). J. Solid State Chem. 30, 247–255.Xu, S., Jaegers, N. R., Hu, W., Kwak, J. H., Bao, X., Sun, J., Wang, Y. &
Hu, J. Z. (2021). ACS Omega, 6, 4090–4099.Ye, H., Li, F., Zhu, J., Zhang, Z., Yu, D. & Han, X. (2017). Microscopy,
66, 303–304.Zhou, R.-S. & Snyder, R. L. (1991). Acta Cryst. B47, 617–630.Zolotoyabko, E. (2009). J. Appl. Cryst. 42, 513–518.Zou, X., Sukharev, Y. & Hovmoller, S. (1993a). Ultramicroscopy, 49,
147–158.Zou, X., Sukharev, Y. & Hovmoller, S. (1993b). Ultramicroscopy, 52,
436–444.
research papers
784 Zhiping Luo � Boehmite-derived �-alumina and its transformation mechanism Acta Cryst. (2021). B77, 772–784


![Surface Science Volume 295 issue 1-2 1993 [doi 10.1016%2F0039-6028%2893%2990202-u] S. Blonski; S.H. Garofalini -- Molecular dynamics simulations of α-alumina and γ-alumina surfaces.pdf](https://static.fdocument.org/doc/165x107/5695d1ee1a28ab9b02987989/surface-science-volume-295-issue-1-2-1993-doi-1010162f0039-602828932990202-u.jpg)