
Solid State Ionics - TU Wien · for intermediate-temperature solid oxide fuel cell ... Alphagaz...
5
Mapping electrochemically driven gas exchange of mixed conducting SrTi 0.7 Fe 0.3 O 3 - δ and Ce 0.8 Gd 0.2 O 1.9 thin films by 18 O tracer incorporation under reducing atmosphere Andreas Nenning, Edvinas Navickas, Peter Velicsanyi, Alexander K. Opitz ⁎, Herbert Hutter, Jürgen Fleig Vienna University of Technology, Institute of Chemical Technologies and Analytics, Getreidemarkt 9/164, 1060 Vienna, Austria abstract article info Article history: Received 15 June 2014 Received in revised form 16 October 2014 Accepted 17 October 2014 Available online 26 November 2014 Keywords: Thin film electrode Isotopic surface exchange 18 O enriched water Electrochemical water splitting Electrochemically active zone Thermally and electrochemically driven 18 O tracer exchange experiments in H 2 /H 2 18 O atmosphere were performed on SrTi 0.7 Fe 0.3 O 3 - δ and Ce 0.8 Gd 0.2 O 2 - δ thin films on single crystalline YSZ substrates. Noble metal current collectors were deposited on both films and electrochemically polarized during the exchange experiment. The resulting tracer distribution was analyzed by spatially resolved secondary ion mass spectrometry. Increased tracer fraction near the current collectors was found under cathodic polarization and decreased tracer fraction under anodic polarization. High cathodic bias leads to enhanced n-type electronic conductivity, which increases the extent of the electrochemically active zone. © 2014 The Authors. Published by Elsevier B.V. This is an open access article under the CC BY license (http://creativecommons.org/licenses/by/3.0/). 1. Introduction Mixed ionic and electronic conduction (MIEC) is widely investigated for intermediate-temperature solid oxide fuel cell (SOFC) cathodes [1–3] and there is also strongly growing interest in applying reduction stable MIECs as SOFC anodes [4–10]. Studies on some perovskite-type porous anodes demonstrated low area specific resistance and high stability for redox cycling [4–7]. For ceria-based anode materials also mechanistic investigations on geometrically well-defined thin films have been performed [8–10]. However, details on the surface exchange rate and ionic or electronic conductivity are still scarce for most oxide electrodes in reducing atmosphere. Additional measurements, also employing new analysis methods, are therefore of high relevance for a better understanding of the properties of mixed conducting anodes and the search for new materials. It has been demonstrated that isotope exchange with subsequent SIMS analysis is a very powerful tool to monitor the surface reaction ki- netics and the bulk diffusion of oxygen in SOFC electrode and electrolyte materials under both equilibrium and polarized conditions [11–18]. Moreover, because of the relatively high lateral and depth resolution of SIMS, the electrochemically active regions of the electrodes can be visualized. This has already been shown for cathode materials [14,17], while in reducing atmosphere imaging of oxygen incorporation zones by voltage driven 18 O tracer exchange is rarely employed. In the present study, we analyze the distribution of 18 O in polar- ized and non-polarized thin films of SrTi 0.7 Fe 0.3 O 3 - δ (STFO) and Ce 0.8 Gd 0.2 O 2 - δ (GDC) on yttria stabilized zirconia (YSZ) substrates. By comparison of the tracer distribution after thermally driven oxygen exchange and after experiments with cathodic and anodic bias, the width of the electrochemically active region and the factors governing the oxygen exchange could be visualized. 2. Experimental 2.1. Sample preparation The GDC target (Ce 0.8 Gd 0.2 O 2 - δ ) for pulsed laser deposition was pre- pared from powder (Treibacher, Austria) by isostatical pressing and sub- sequent sintering at 1550 °C for 5 h. The STFO (SrTi 0.7 Fe 0.3 O 3 - δ ) powder was prepared by solid state reaction from SrCO 3 (99.99% pure, Sigma- Aldrich), TiO 2 (99.99% pure, Sigma Aldrich), and Fe 2 O 3 (99.98% pure, Sigma Aldrich). The educts were thoroughly mixed, calcined at 800 °C, ground, again calcined at 1000 °C, and—after a further grinding step— isostatically pressed and sintered at 1250 °C. The phase purity of both targets was confirmed by X-ray diffraction. STFO and GDC thin films were deposited on (100)-oriented yttria stabilized zirconia single crys- tals (YSZ, 9.5 mol% Y 2 O 3 in ZrO 2 , supplier: CrysTec, Germany) by pulsed Solid State Ionics 273 (2015) 25–29 ⁎ Corresponding author. E-mail address: [email protected] (A.K. Opitz). http://dx.doi.org/10.1016/j.ssi.2014.10.024 0167-2738/© 2014 The Authors. Published by Elsevier B.V. This is an open access article under the CC BY license (http://creativecommons.org/licenses/by/3.0/). Contents lists available at ScienceDirect Solid State Ionics journal homepage: www.elsevier.com/locate/ssi
Transcript of Solid State Ionics - TU Wien · for intermediate-temperature solid oxide fuel cell ... Alphagaz...
Solid State Ionics 273 (2015) 25–29
Contents lists available at ScienceDirect
Solid State Ionics
j ourna l homepage: www.e lsev ie r .com/ locate /ss i
Mapping electrochemically driven gas exchange of mixed conductingSrTi0.7Fe0.3O3 − δ and Ce0.8Gd0.2O1.9 thin films by 18O tracer incorporationunder reducing atmosphere
Andreas Nenning, Edvinas Navickas, Peter Velicsanyi, Alexander K. Opitz ⁎, Herbert Hutter, Jürgen FleigVienna University of Technology, Institute of Chemical Technologies and Analytics, Getreidemarkt 9/164, 1060 Vienna, Austria
⁎ Corresponding author.E-mail address: [email protected] (A.K. Op
http://dx.doi.org/10.1016/j.ssi.2014.10.0240167-2738/© 2014 The Authors. Published by Elsevier B.V
a b s t r a c t
a r t i c l e i n f oArticle history:Received 15 June 2014Received in revised form 16 October 2014Accepted 17 October 2014Available online 26 November 2014
Keywords:Thin film electrodeIsotopic surface exchange18O enriched waterElectrochemical water splittingElectrochemically active zone
Thermally and electrochemically driven 18O tracer exchange experiments in H2/H218O atmosphere were
performed on SrTi0.7Fe0.3O3 − δ and Ce0.8Gd0.2O2 − δ thin films on single crystalline YSZ substrates. Noblemetal current collectors were deposited on both films and electrochemically polarized during the exchangeexperiment. The resulting tracer distribution was analyzed by spatially resolved secondary ion mass spectrometry.Increased tracer fraction near the current collectors was found under cathodic polarization and decreased tracerfraction under anodic polarization. High cathodic bias leads to enhanced n-type electronic conductivity,which increases the extent of the electrochemically active zone.
© 2014 The Authors. Published by Elsevier B.V. This is an open access article under the CC BY license(http://creativecommons.org/licenses/by/3.0/).
1. Introduction
Mixed ionic and electronic conduction (MIEC) is widely investigatedfor intermediate-temperature solid oxide fuel cell (SOFC) cathodes[1–3] and there is also strongly growing interest in applying reductionstable MIECs as SOFC anodes [4–10]. Studies on some perovskite-typeporous anodes demonstrated low area specific resistance and highstability for redox cycling [4–7]. For ceria-based anode materials alsomechanistic investigations on geometrically well-defined thin filmshave been performed [8–10]. However, details on the surface exchangerate and ionic or electronic conductivity are still scarce for most oxideelectrodes in reducing atmosphere. Additional measurements, alsoemploying new analysis methods, are therefore of high relevance for abetter understanding of the properties of mixed conducting anodesand the search for new materials.
It has been demonstrated that isotope exchange with subsequentSIMS analysis is a very powerful tool to monitor the surface reaction ki-netics and the bulk diffusion of oxygen in SOFC electrode and electrolytematerials under both equilibrium and polarized conditions [11–18].Moreover, because of the relatively high lateral and depth resolutionof SIMS, the electrochemically active regions of the electrodes can be
itz).
. This is an open access article under
visualized. This has already been shown for cathode materials [14,17],while in reducing atmosphere imaging of oxygen incorporation zonesby voltage driven 18O tracer exchange is rarely employed.
In the present study, we analyze the distribution of 18O in polar-ized and non-polarized thin films of SrTi0.7Fe0.3O3 − δ (STFO) andCe0.8Gd0.2O2 − δ (GDC) on yttria stabilized zirconia (YSZ) substrates.By comparison of the tracer distribution after thermally driven oxygenexchange and after experiments with cathodic and anodic bias, thewidth of the electrochemically active region and the factors governingthe oxygen exchange could be visualized.
2. Experimental
2.1. Sample preparation
TheGDC target (Ce0.8Gd0.2O2− δ) for pulsed laser depositionwas pre-pared from powder (Treibacher, Austria) by isostatical pressing and sub-sequent sintering at 1550 °C for 5 h. The STFO (SrTi0.7Fe0.3O3− δ) powderwas prepared by solid state reaction from SrCO3 (99.99% pure, Sigma-Aldrich), TiO2 (99.99% pure, Sigma Aldrich), and Fe2O3 (99.98% pure,Sigma Aldrich). The educts were thoroughly mixed, calcined at 800 °C,ground, again calcined at 1000 °C, and—after a further grinding step—isostatically pressed and sintered at 1250 °C. The phase purity of bothtargets was confirmed by X-ray diffraction. STFO and GDC thin filmswere deposited on (100)-oriented yttria stabilized zirconia single crys-tals (YSZ, 9.5 mol% Y2O3 in ZrO2, supplier: CrysTec, Germany) by pulsed
the CC BY license (http://creativecommons.org/licenses/by/3.0/).
26 A. Nenning et al. / Solid State Ionics 273 (2015) 25–29
laser deposition (PLD) using a KrF excimer-laser (Lambda COMPexPro201 F, 248 nm wavelength). The deposition of 200 nm thin films wascarried out in 4 × 10⁻² mbar of pure oxygen with a pulse repetitionrate of 5 Hz and a nominal pulse energy of 400mJ. The substrate temper-ature during the deposition was controlled by a pyrometer (Heitronics,Germany) and was 650 °C.
2.2. Electrode design
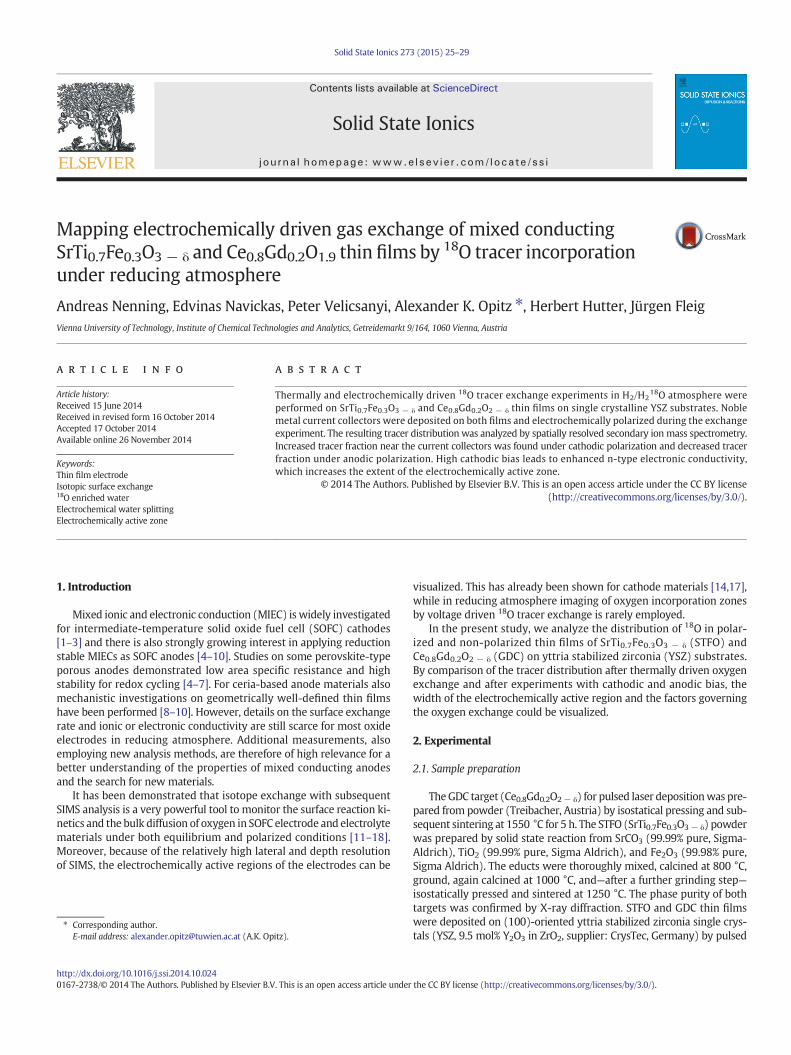
Acceptor-doped mixed conductors are often very good electronicp-type conductors in oxidizing atmosphere. For such materials, an elec-tric contact with a metallic tip is typically sufficient for a homogeneouspolarization of a small thin film electrode [19]. In reducing atmosphere,however, the p-type conductivity decreases by several orders ofmagnitude. Despite acceptor doping SrTi0.7Fe0.3O3 − δ (STFO) andCe0.8Gd0.2O1.9 (GDC) are even weak n-type conductors in reducing at-mosphere at the 18O exchange temperature [20–23]. Due to the muchlower electronic conductivity compared to oxidizing conditions, theelectrochemically active region is expected to be limited to a smallarea around the electric contact. In order to investigate the width ofthis active region, rectangular (160 μm × 400 μm) noble metal currentcollectors were sputter deposited (MCS 020, BAL-TEC AG, Germany) intwo steps: on top of the YSZ substrate (prior to MIEC deposition) andon top of the deposited MIEC layer. The sample design is sketched inFig. 1a; bottom and top current collectors and one large counter-electrodewere placed on one and the same sample. The bottom current
Fig. 1. (a) Noble metal electrodes, which provide an electrical contact and block oxygendiffusion were prepared below (EB geometry) and on top (ET geometry) of the GDC orSTFO layer. The oxygen diffusion pathways under equilibrium conditions are sketchedfor ET and EB current collectors. Working and counter electrodes were contacted and po-larized in the tracer exchange chamber. (b) Increased oxygen incorporation rate causedbycathodic bias near an EB current collector; in some distance from the current collectoredge only thermally driven tracer exchange remains due to limited electronic conductivitywithin the MIEC thin film.
collectors (5 nm Ti/100 nm Pt) were structured from a thin film by ionbeam etching, the top electrodes (5 nm Cr/100 nm Au) were producedby a lift-offmethod. For the buried current collectors platinumwas cho-sen, since it is sufficiently stable during subsequent PLD deposition ofthe oxide. For the top electrodes Auwas used owing to its poor catalyticactivity to avoid three phase boundary activity. For the sake of clarity,the electrode regions with contacting noble metal collectors arenamed as electrodes with top current collectors (ET) and electrodeswith bottom current collectors (EB), and abbreviations ET and EB areused throughout the text.
2.3. Procedure of the isotope exchange experiments
A mixture of hydrogen and 18O tracer enriched water was used tocarry out the experiments in a thermodynamically defined, reducing at-mosphere. This atmosphere was produced by mixing diluted hydrogen(2.5% H2 in Ar, Alphagaz ARCAL 10, Air Liquide) with a defined amountof 18O2 (97% isotopic enrichment, 0.625% O2 in themixture) and feedingthismixture through a platinum sponge at 500 °C to form a gas contain-ing equal amounts of water and hydrogen. The formation of tracer-enriched water with a tracer fraction of 60–70% was monitored by amass spectrometer (Pfeiffer, OmniStar GSD 320). Probably the (porous)quartz supported Pt catalyst, which is present in the reaction chamber,is a source of oxygen exchange and therefore reduces the tracer contentin the resulting atmosphere. In this reducing, tracer containing atmo-sphere, the samples were heated from room temperature to 410 ±10 °C for 10 min and were subsequently quenched to freeze the distri-bution of 18O (the corresponding oxygen partial pressure in the men-tioned humid hydrogen atmosphere at 410 °C can be calculated to be8.4 × 10−30 bar [24]). The heating and cooling rate was 150 °C/min,so the time of sample heating and cooling was short compared to theexchange experiments. During the exchange process, on each sampleone ET and one EB current collector were simultaneously polarizedagainst the counter electrode—cf. Fig. 1a. Current flow and out of equi-librium reaction for ET polarization are sketched in Fig. 1b in moredetail. In this manner, the tracer distribution can be monitored in theMIEC above the electrolyte, above the EB current collectors and beneathET current collectors for the case of pure thermal diffusion as well as fordifferent dc polarization on the same sample.
The resulting 18O distribution in the thin films was subsequently in-vestigated bymeans of time-of-flight secondary ion mass spectrometry(ToF-SIMS). These measurements were done on a ToF-SIMS 5 machine(ION-TOF GmbH, Germany) in collimated burst alignment (CBA) mode,which allows accurate determination of 18O concentration in oxides [25,26]. As primary ions Bi3++ were used (25 kV accelerating voltage). Neg-ative secondary ions were analyzed in areas of 50 μm × 50 μm and160 μm × 160 μm, using a raster of 512 × 512 and 1024 × 1024 pixels,respectively. For the sputtering of material Cs+ ions (1 kV acceleratingvoltage) were used with a sputter crater of 500 μm × 500 μm and asputtering ion current of 70 nA. The charging of the surface was com-pensated with an electron flood gun and partly by additional argonflooding if the electron flood gunwas not sufficient. The isotope fraction(f18O) was obtained by normalizing integrated intensities (I) via f18O =I18O/(I18O + I16O).
In Fig. 1a, the different locations of the SIMS analysis and the path-ways of thermally driven gas exchange are sketched. The metal layersare supposed to be sufficiently blocking for oxygen, which was experi-mentally confirmed by measuring a tracer fraction close to naturalabundance beneath the EB current collector as well as beneath the ETcollectors (see Section 3). The remaining slight tracer enrichment be-neath the Au current collectors (ET), which is nearly two orders of mag-nitude lower than without a metal layer, may be due to some grainboundary diffusion of oxygen through themetal layer [13]. Nonetheless,the amount of tracer beneath the current collectors is sufficiently smallto assume blocking metal layers in the discussion. In order to comparethe lateral isotope distribution of different electrodes, the current
27A. Nenning et al. / Solid State Ionics 273 (2015) 25–29
collector and MIEC layer boundaries were aligned to the same positionin the images.
3. Results and discussion
3.1. Thermal diffusion profiles
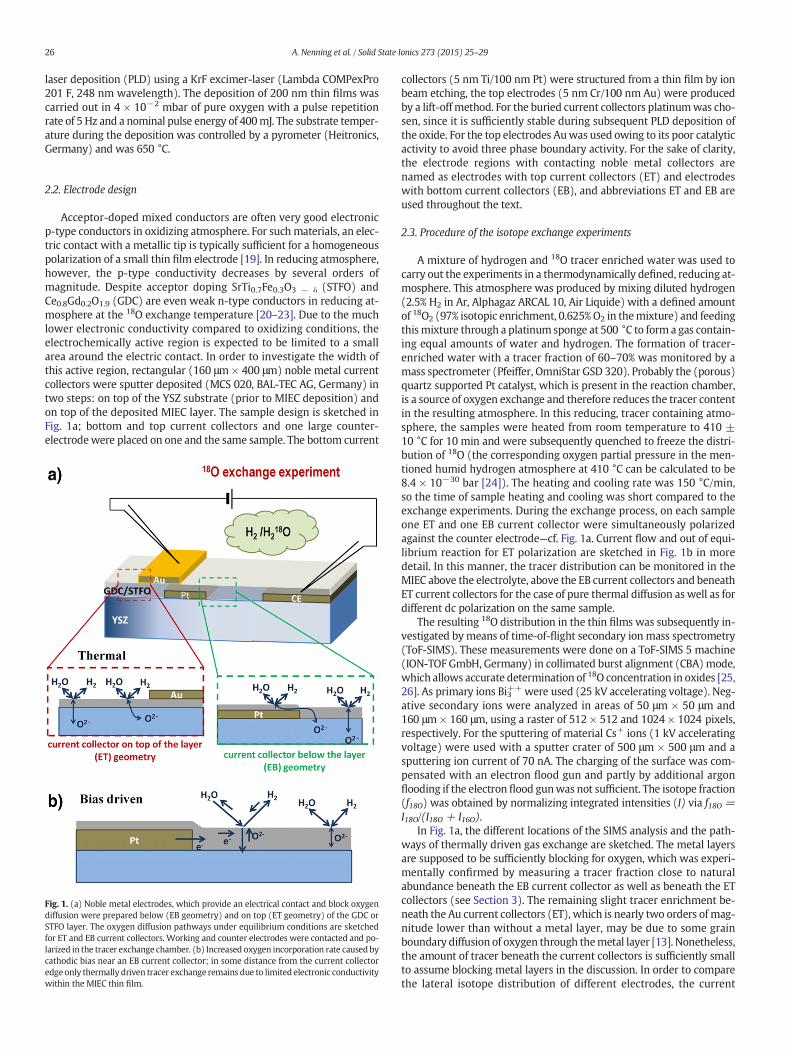
Distribution images of 18O as well as lateral profiles of the 18O frac-tion obtained under equilibrium conditions (EB geometry) are depictedin Figs. 2 and 3 for STFO and GDC, respectively (in the lateral profiles thezero-bias curves are given in red color). The zero-bias profiles of bothmaterials exhibit laterally almost constant tracer fractions for the freeMIEC part and an increase to a higher value close to the EB current col-lector edge. The high tracer content above the EB current collectors canbe explained by the oxide ion blocking character of the Pt layer, whichimpedes the diffusion of 18O2− ions into the YSZ electrolyte. Therefore,the tracer is simply piled up above Pt, leading to the high tracer fractionobserved. Strongly different surface exchange coefficients k⁎ caused bydifferent microstructures of the MIEC parts on Pt and YSZ can be ruledout by previous electrochemical experiments [10,20,27]. It should fur-ther be noted, that the depth profiles reveal constant tracer fractionwithin theMIEC film, thus indicating surface kinetics to be almost exclu-sively rate limiting for the thermal exchange of oxygen in bothmaterials(cf. Fig. 3b for GDC; the small concentration step at the MIEC/YSZ inter-face indicates an additional small resistance).
Interestingly, for bothMIECmaterials the zero-bias lateral tracer dis-tribution exhibits a certain slope rather than an ideal step close to theedge of the EB current collectors. This lateral profile can be explainedby in-plane diffusion of oxygen in the MIEC film from the region withhigh tracer fraction (above Pt) to the MIEC on YSZ and then into theelectrolyte—see Fig. 1a, EB. Hence, the width of this slope should corre-late with the diffusion length of oxygen ions. By comparison of Figs. 2band 3c it becomes obvious that the thermal profile of STFO is steeperthan that of the GDCfilm,which is expected due to the higher ionic con-ductivity in GDC (σGDC = 3.3 × 10⁻⁴ S cm−1 [21], σSTFO =5.5 × 10⁻⁶ S cm−1 [20] at 410 °C).
Fig. 2. (a) Isotopedistribution imagesmeasuredby ToF-SIMS and (b) lateral tracer fractionprofiles of an STFO thinfilmnear to the edge of an electrodewith EB geometry for thermallyand bias driven 18O incorporation.
3.2. Effect of cathodic bias
The incorporation of 18O into the region close to the EB current col-lector changes upon polarization (see Figs. 2 and 3). Close to the currentcollector, tracer incorporation is enhancedwith cathodic bias and the in-crease of the tracer fraction in the active zone is partly (or even mostly)due to the (electro-) chemically driven current. At a sufficient distancefrom the electrode, however, the surface exchange rate of 18O againapproaches its equilibrium value. This can be easily understood by thefollowing consideration: On the one hand, the cathodic voltage causesan increased 18O incorporation rate into the MIEC. On the other hand,the electronic sheet resistance in the MIEC becomes more importantfor longer distances from the current collector and hence causes adecay of the voltage driven 18O incorporation rate (this is sketched inFig. 1b).
Also on top of the Pt current collector, the tracer fraction was foundto be virtually unaffected by the applied bias (the slight differences inthe tracer fraction on top of the Pt electrodes can probably be attributedto a small inhomogeneity of the surface exchange coefficient e.g. due toa slight temperature inhomogeneity). This is due to the fact that oxygenions incorporated above the current collector need to diffuse from thereaction site, which is remote from the current collector edges, intothe electrolyte. Because of the high in-plane transport resistance of theoxygen ions [20,21], the MIEC above the current collector remains un-polarized and the tracer fraction is independent of the applied bias. Ac-cordingly, this region is not electrochemically active despite having thehighest tracer fraction.
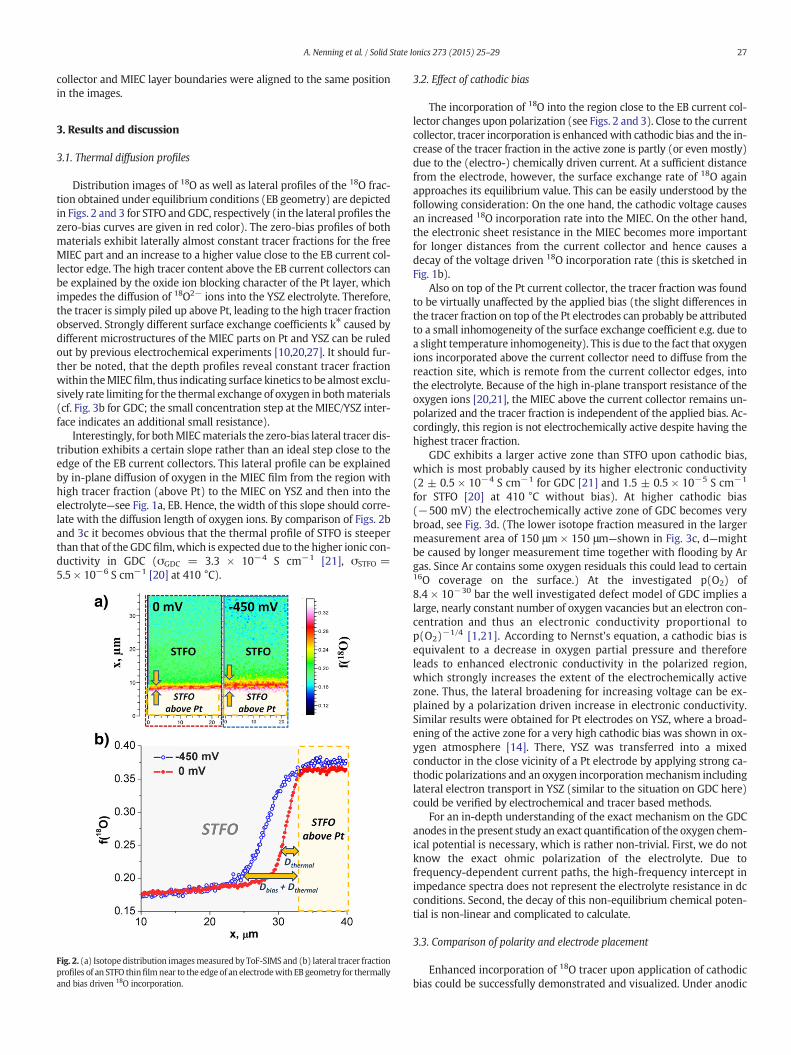
GDC exhibits a larger active zone than STFO upon cathodic bias,which is most probably caused by its higher electronic conductivity(2 ± 0.5 × 10⁻⁴ S cm−1 for GDC [21] and 1.5 ± 0.5 × 10⁻⁵ S cm−1
for STFO [20] at 410 °C without bias). At higher cathodic bias(−500 mV) the electrochemically active zone of GDC becomes verybroad, see Fig. 3d. (The lower isotope fraction measured in the largermeasurement area of 150 μm × 150 μm—shown in Fig. 3c, d—mightbe caused by longer measurement time together with flooding by Argas. Since Ar contains some oxygen residuals this could lead to certain16O coverage on the surface.) At the investigated p(O2) of8.4 × 10−30 bar the well investigated defect model of GDC implies alarge, nearly constant number of oxygen vacancies but an electron con-centration and thus an electronic conductivity proportional top(O2)−1/4 [1,21]. According to Nernst's equation, a cathodic bias isequivalent to a decrease in oxygen partial pressure and thereforeleads to enhanced electronic conductivity in the polarized region,which strongly increases the extent of the electrochemically activezone. Thus, the lateral broadening for increasing voltage can be ex-plained by a polarization driven increase in electronic conductivity.Similar results were obtained for Pt electrodes on YSZ, where a broad-ening of the active zone for a very high cathodic bias was shown in ox-ygen atmosphere [14]. There, YSZ was transferred into a mixedconductor in the close vicinity of a Pt electrode by applying strong ca-thodic polarizations and an oxygen incorporationmechanism includinglateral electron transport in YSZ (similar to the situation on GDC here)could be verified by electrochemical and tracer based methods.
For an in-depth understanding of the exact mechanism on the GDCanodes in the present study an exact quantification of the oxygen chem-ical potential is necessary, which is rather non-trivial. First, we do notknow the exact ohmic polarization of the electrolyte. Due tofrequency-dependent current paths, the high-frequency intercept inimpedance spectra does not represent the electrolyte resistance in dcconditions. Second, the decay of this non-equilibrium chemical poten-tial is non-linear and complicated to calculate.
3.3. Comparison of polarity and electrode placement
Enhanced incorporation of 18O tracer upon application of cathodicbias could be successfully demonstrated and visualized. Under anodic
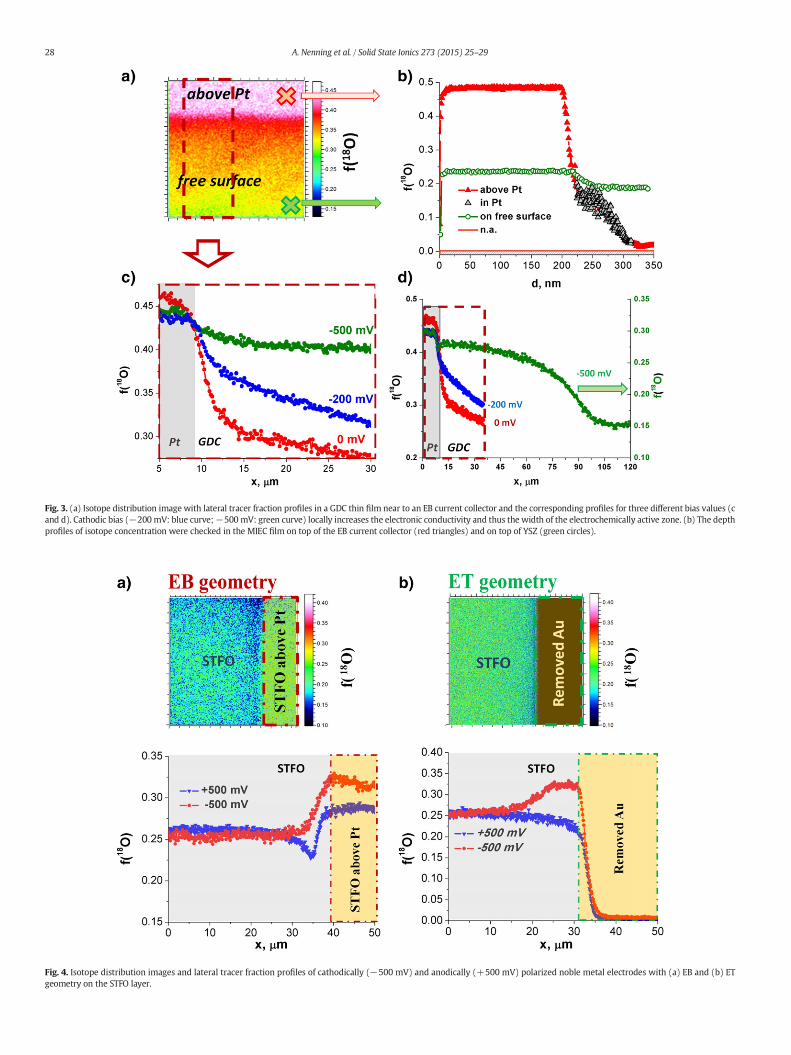
Fig. 3. (a) Isotope distribution image with lateral tracer fraction profiles in a GDC thin film near to an EB current collector and the corresponding profiles for three different bias values (cand d). Cathodic bias (−200mV: blue curve;−500 mV: green curve) locally increases the electronic conductivity and thus the width of the electrochemically active zone. (b) The depthprofiles of isotope concentration were checked in the MIEC film on top of the EB current collector (red triangles) and on top of YSZ (green circles).
Fig. 4. Isotope distribution images and lateral tracer fraction profiles of cathodically (−500 mV) and anodically (+500 mV) polarized noble metal electrodes with (a) EB and (b) ETgeometry on the STFO layer.
28 A. Nenning et al. / Solid State Ionics 273 (2015) 25–29
29A. Nenning et al. / Solid State Ionics 273 (2015) 25–29
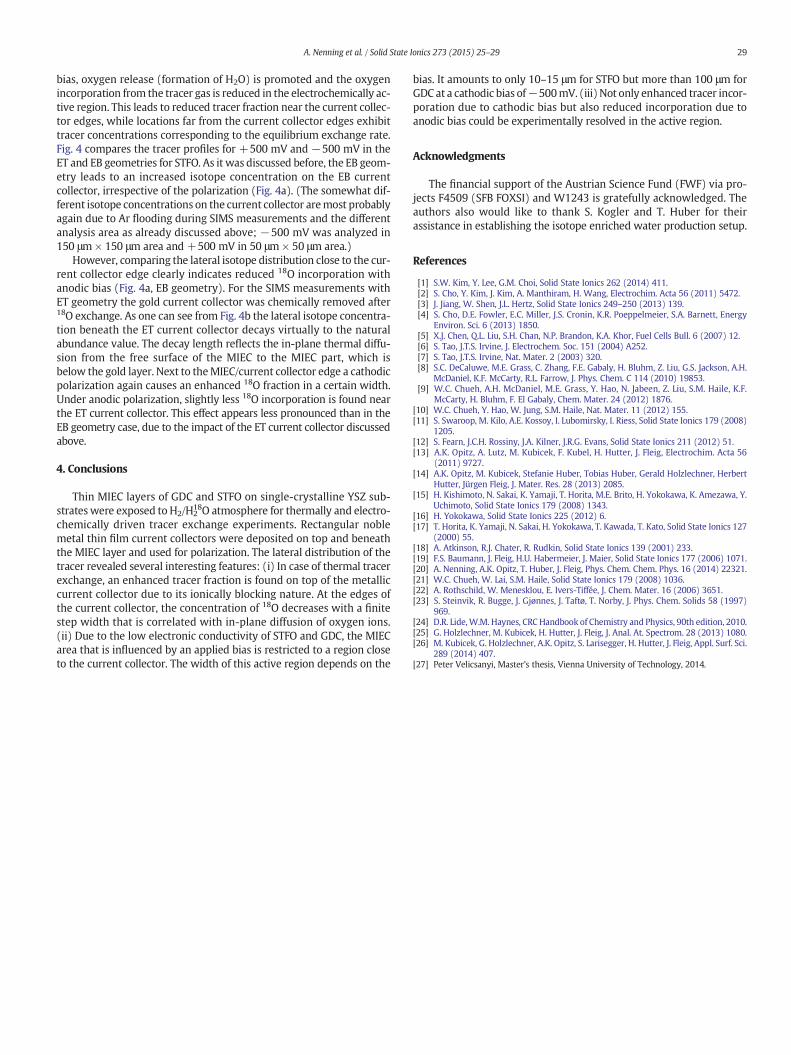
bias, oxygen release (formation of H2O) is promoted and the oxygenincorporation from the tracer gas is reduced in the electrochemically ac-tive region. This leads to reduced tracer fraction near the current collec-tor edges, while locations far from the current collector edges exhibittracer concentrations corresponding to the equilibrium exchange rate.Fig. 4 compares the tracer profiles for +500 mV and −500 mV in theET and EB geometries for STFO. As it was discussed before, the EB geom-etry leads to an increased isotope concentration on the EB currentcollector, irrespective of the polarization (Fig. 4a). (The somewhat dif-ferent isotope concentrations on the current collector aremost probablyagain due to Ar flooding during SIMS measurements and the differentanalysis area as already discussed above; −500 mV was analyzed in150 μm × 150 μm area and +500 mV in 50 μm × 50 μm area.)
However, comparing the lateral isotope distribution close to the cur-rent collector edge clearly indicates reduced 18O incorporation withanodic bias (Fig. 4a, EB geometry). For the SIMS measurements withET geometry the gold current collector was chemically removed after18O exchange. As one can see from Fig. 4b the lateral isotope concentra-tion beneath the ET current collector decays virtually to the naturalabundance value. The decay length reflects the in-plane thermal diffu-sion from the free surface of the MIEC to the MIEC part, which isbelow the gold layer. Next to theMIEC/current collector edge a cathodicpolarization again causes an enhanced 18O fraction in a certain width.Under anodic polarization, slightly less 18O incorporation is found nearthe ET current collector. This effect appears less pronounced than in theEB geometry case, due to the impact of the ET current collector discussedabove.
4. Conclusions
Thin MIEC layers of GDC and STFO on single-crystalline YSZ sub-strateswere exposed to H2/H2
18O atmosphere for thermally and electro-chemically driven tracer exchange experiments. Rectangular noblemetal thin film current collectors were deposited on top and beneaththe MIEC layer and used for polarization. The lateral distribution of thetracer revealed several interesting features: (i) In case of thermal tracerexchange, an enhanced tracer fraction is found on top of the metalliccurrent collector due to its ionically blocking nature. At the edges ofthe current collector, the concentration of 18O decreases with a finitestep width that is correlated with in-plane diffusion of oxygen ions.(ii) Due to the low electronic conductivity of STFO and GDC, the MIECarea that is influenced by an applied bias is restricted to a region closeto the current collector. The width of this active region depends on the
bias. It amounts to only 10–15 μm for STFO but more than 100 μm forGDC at a cathodic bias of−500mV. (iii) Not only enhanced tracer incor-poration due to cathodic bias but also reduced incorporation due toanodic bias could be experimentally resolved in the active region.
Acknowledgments
The financial support of the Austrian Science Fund (FWF) via pro-jects F4509 (SFB FOXSI) and W1243 is gratefully acknowledged. Theauthors also would like to thank S. Kogler and T. Huber for theirassistance in establishing the isotope enriched water production setup.
References
[1] S.W. Kim, Y. Lee, G.M. Choi, Solid State Ionics 262 (2014) 411.[2] S. Cho, Y. Kim, J. Kim, A. Manthiram, H. Wang, Electrochim. Acta 56 (2011) 5472.[3] J. Jiang, W. Shen, J.L. Hertz, Solid State Ionics 249–250 (2013) 139.[4] S. Cho, D.E. Fowler, E.C. Miller, J.S. Cronin, K.R. Poeppelmeier, S.A. Barnett, Energy
Environ. Sci. 6 (2013) 1850.[5] X.J. Chen, Q.L. Liu, S.H. Chan, N.P. Brandon, K.A. Khor, Fuel Cells Bull. 6 (2007) 12.[6] S. Tao, J.T.S. Irvine, J. Electrochem. Soc. 151 (2004) A252.[7] S. Tao, J.T.S. Irvine, Nat. Mater. 2 (2003) 320.[8] S.C. DeCaluwe, M.E. Grass, C. Zhang, F.E. Gabaly, H. Bluhm, Z. Liu, G.S. Jackson, A.H.
McDaniel, K.F. McCarty, R.L. Farrow, J. Phys. Chem. C 114 (2010) 19853.[9] W.C. Chueh, A.H. McDaniel, M.E. Grass, Y. Hao, N. Jabeen, Z. Liu, S.M. Haile, K.F.
McCarty, H. Bluhm, F. El Gabaly, Chem. Mater. 24 (2012) 1876.[10] W.C. Chueh, Y. Hao, W. Jung, S.M. Haile, Nat. Mater. 11 (2012) 155.[11] S. Swaroop, M. Kilo, A.E. Kossoy, I. Lubomirsky, I. Riess, Solid State Ionics 179 (2008)
1205.[12] S. Fearn, J.C.H. Rossiny, J.A. Kilner, J.R.G. Evans, Solid State Ionics 211 (2012) 51.[13] A.K. Opitz, A. Lutz, M. Kubicek, F. Kubel, H. Hutter, J. Fleig, Electrochim. Acta 56
(2011) 9727.[14] A.K. Opitz, M. Kubicek, Stefanie Huber, Tobias Huber, Gerald Holzlechner, Herbert
Hutter, Jürgen Fleig, J. Mater. Res. 28 (2013) 2085.[15] H. Kishimoto, N. Sakai, K. Yamaji, T. Horita, M.E. Brito, H. Yokokawa, K. Amezawa, Y.
Uchimoto, Solid State Ionics 179 (2008) 1343.[16] H. Yokokawa, Solid State Ionics 225 (2012) 6.[17] T. Horita, K. Yamaji, N. Sakai, H. Yokokawa, T. Kawada, T. Kato, Solid State Ionics 127
(2000) 55.[18] A. Atkinson, R.J. Chater, R. Rudkin, Solid State Ionics 139 (2001) 233.[19] F.S. Baumann, J. Fleig, H.U. Habermeier, J. Maier, Solid State Ionics 177 (2006) 1071.[20] A. Nenning, A.K. Opitz, T. Huber, J. Fleig, Phys. Chem. Chem. Phys. 16 (2014) 22321.[21] W.C. Chueh, W. Lai, S.M. Haile, Solid State Ionics 179 (2008) 1036.[22] A. Rothschild, W. Menesklou, E. Ivers-Tiffée, J. Chem. Mater. 16 (2006) 3651.[23] S. Steinvik, R. Bugge, J. Gjønnes, J. Taftø, T. Norby, J. Phys. Chem. Solids 58 (1997)
969.[24] D.R. Lide,W.M. Haynes, CRC Handbook of Chemistry and Physics, 90th edition, 2010.[25] G. Holzlechner, M. Kubicek, H. Hutter, J. Fleig, J. Anal. At. Spectrom. 28 (2013) 1080.[26] M. Kubicek, G. Holzlechner, A.K. Opitz, S. Larisegger, H. Hutter, J. Fleig, Appl. Surf. Sci.
289 (2014) 407.[27] Peter Velicsanyi, Master's thesis, Vienna University of Technology, 2014.