Runway Capacity
34
Runway Capacity
description
Runway Capacity. Runway Capacity. Ability to accommodate Departures Arrivals Minimize delays Computational models Minimum aircraft separation FAA Handbook. Basic Concepts. Time. δ ij. A-A δ ij (mi). v i. γ. v i. δ ij. v j. v j. Entry Gate. Basic Concepts. Time. t ij. δ d. - PowerPoint PPT Presentation
Transcript of Runway Capacity

Runway Capacity
Runway Capacity
Ability to accommodate Departures Arrivals
Minimize delays Computational models
Minimum aircraft separation FAA Handbook
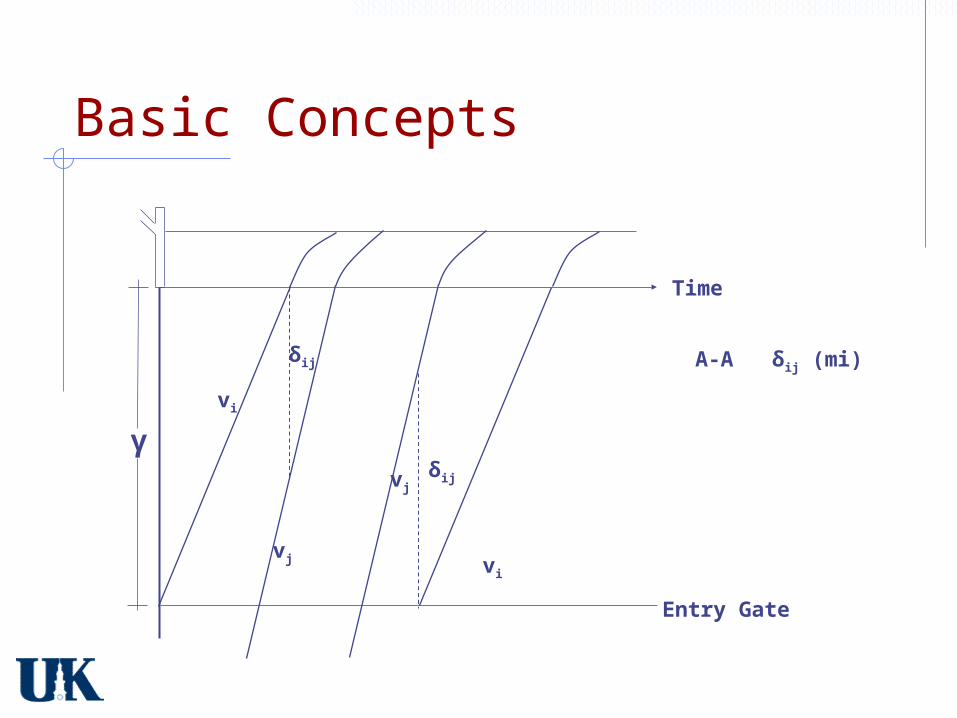
Basic Concepts
γ
δij
vi
vj
δij
A-A δij (mi)
Entry Gate
Time
vj
vi
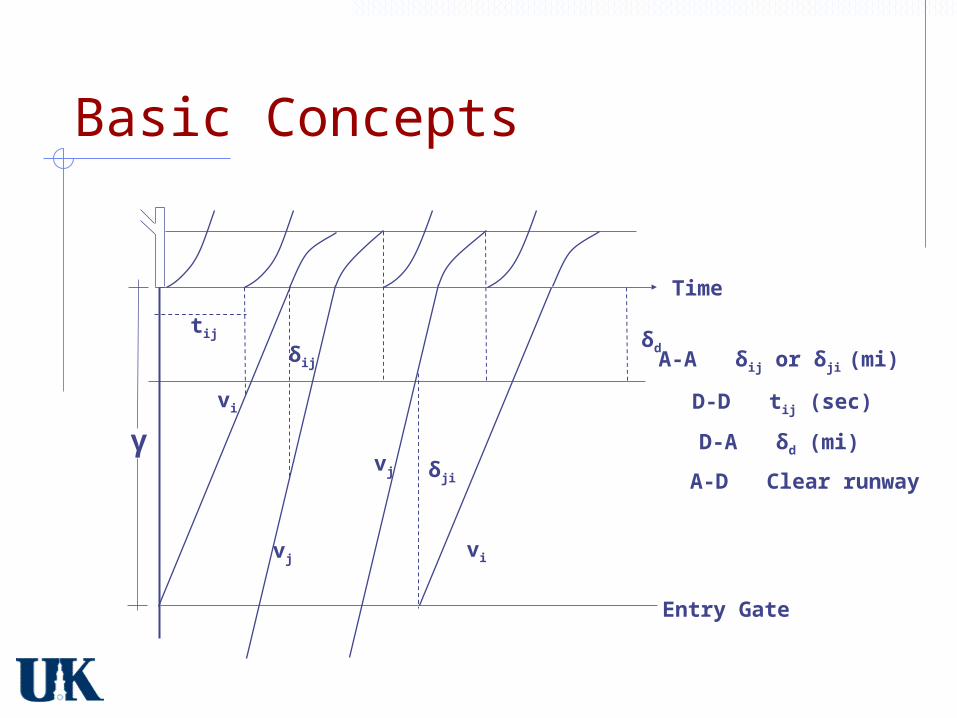
Basic Concepts
γ
δij
vi
vj
δd
tij
δjivj
vi
A-A δij or δji (mi)
D-D tij (sec)
D-A δd (mi)
A-D Clear runway
Entry Gate
Time
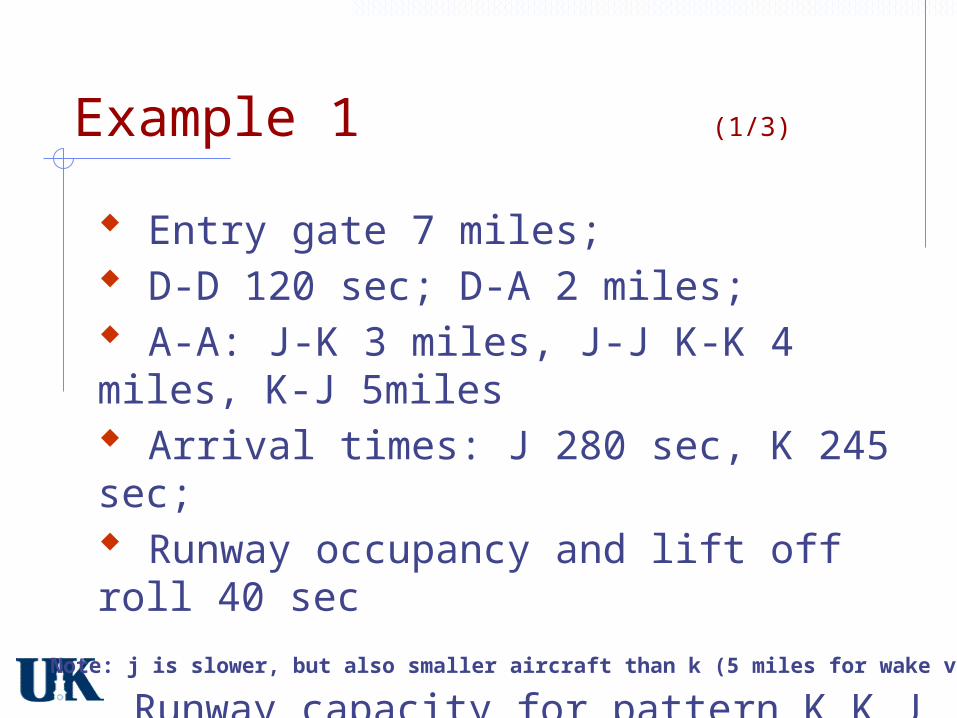
Example 1 (1/3)
Entry gate 7 miles; D-D 120 sec; D-A 2 miles; A-A: J-K 3 miles, J-J K-K 4 miles, K-J 5miles Arrival times: J 280 sec, K 245 sec; Runway occupancy and lift off roll 40 sec
Runway capacity for pattern K K J K J?Note: j is slower, but also smaller aircraft than k (5 miles for wake vortex)
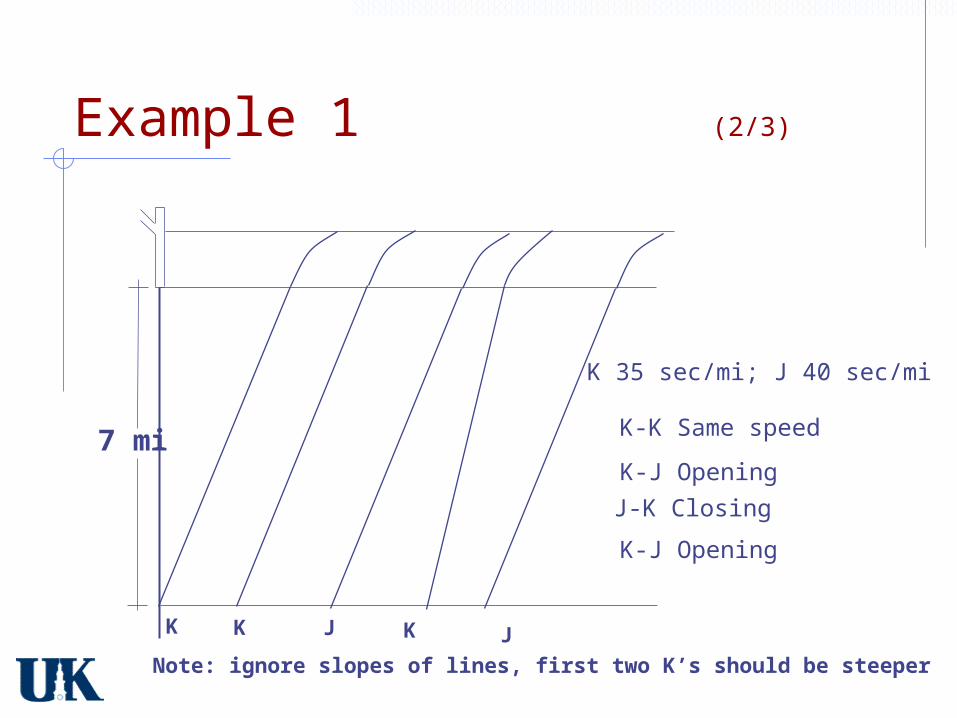
Example 1 (2/3)
7 mi
K JK K J
K 35 sec/mi; J 40 sec/mi
K-K Same speed
K-J Opening
K-J Opening
J-K Closing
Note: ignore slopes of lines, first two K’s should be steeper
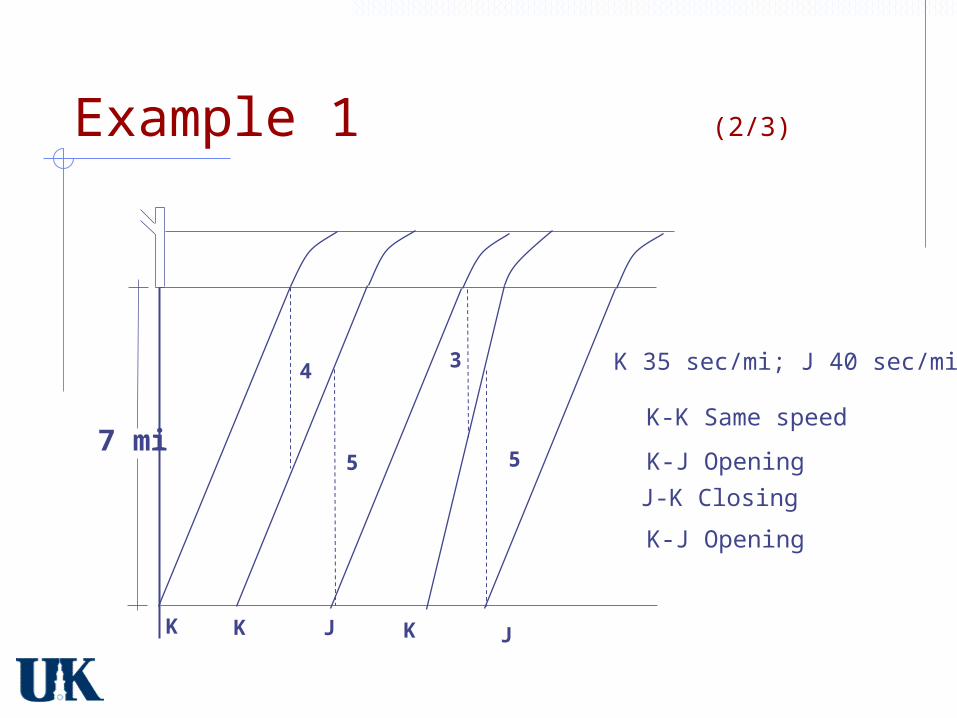
Example 1 (2/3)
7 mi
K JK
4
5
3
K J
5
K 35 sec/mi; J 40 sec/mi
K-K Same speed
K-J Opening
K-J Opening
J-K Closing
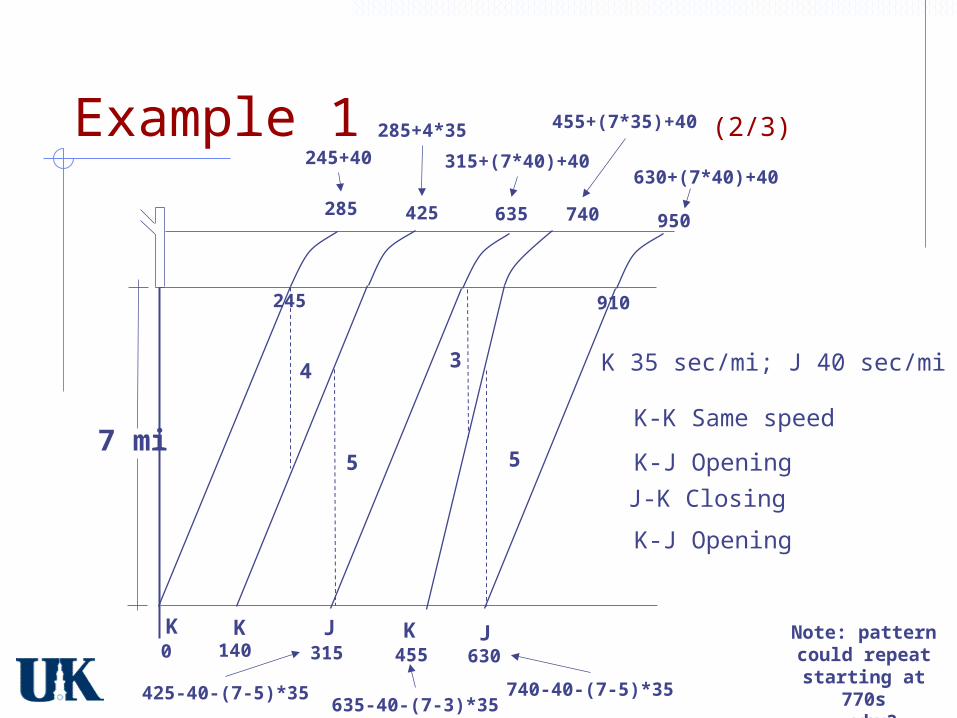
Example 1 (2/3)
7 mi
K JK
4
5
3
K J
5
285 425 635 740
910245
K 35 sec/mi; J 40 sec/mi
K-K Same speed
K-J Opening
K-J Opening
J-K Closing
425-40-(7-5)*35
315
285+4*35
245+40 315+(7*40)+40
635-40-(7-3)*35
455
740-40-(7-5)*35
630
630+(7*40)+40
950
455+(7*35)+40
1400Note: pattern could repeat
starting at 770s… why?
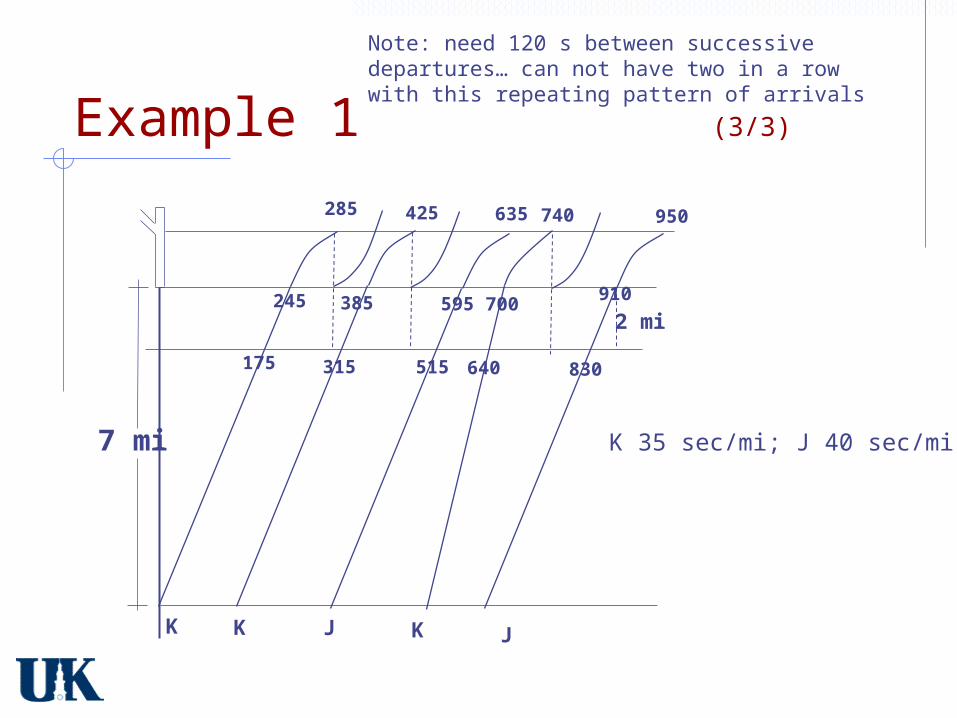
Example 1 (3/3)
7 mi
K JK K J
285 425 635 740
9102452 mi
175
K 35 sec/mi; J 40 sec/mi
315
385 595 700
515 640 830
950
Note: need 120 s between successive departures… can not have two in a row with this repeating pattern of arrivals
Example 1 (3/3)
7 mi
K JK K J
285 425 635 740
910245
2 mi
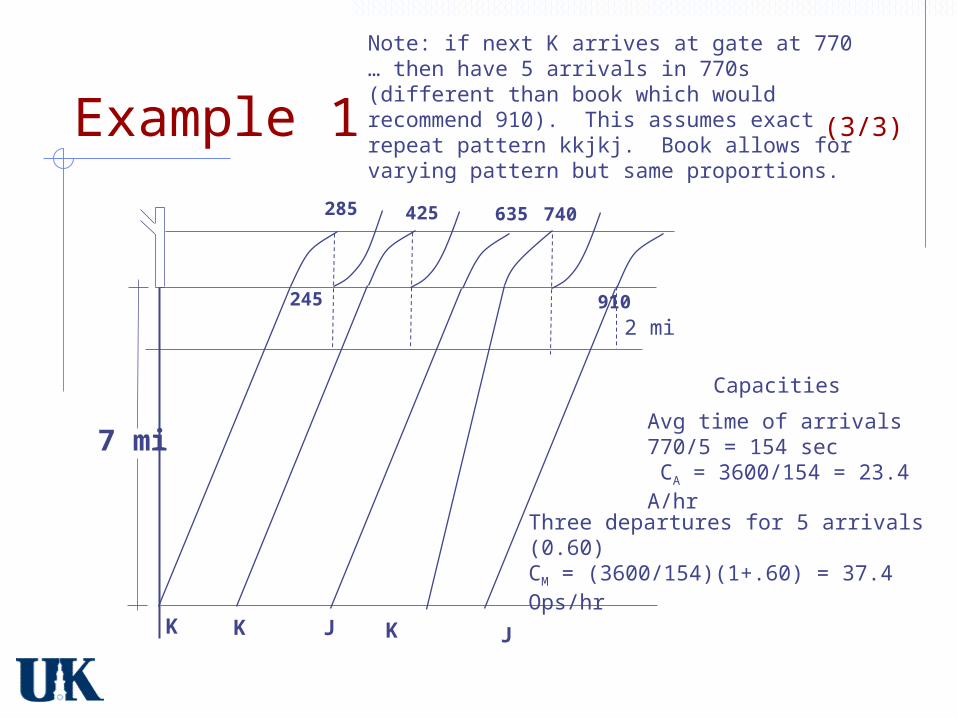
Capacities
Avg time of arrivals 770/5 = 154 sec CA = 3600/154 = 23.4 A/hr
Three departures for 5 arrivals (0.60) CM = (3600/154)(1+.60) = 37.4 Ops/hr
Note: if next K arrives at gate at 770 … then have 5 arrivals in 770s (different than book which would recommend 910). This assumes exact repeat pattern kkjkj. Book allows for varying pattern but same proportions.
Error Free Operations
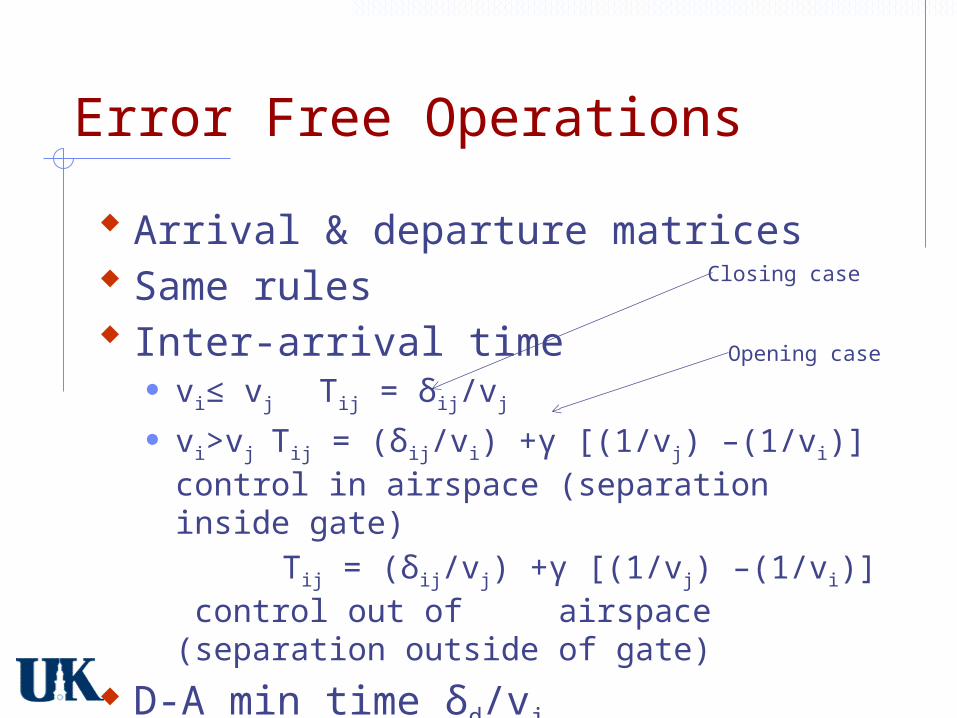
Arrival & departure matrices Same rules Inter-arrival time
vi≤ vj Tij = δij/vj
vi>vj Tij = (δij/vi) +γ [(1/vj) –(1/vi)] control in airspace (separation inside gate)
Tij = (δij/vj) +γ [(1/vj) –(1/vi)] control out of airspace (separation outside of gate)
D-A min time δd/vj
Closing case
Opening case
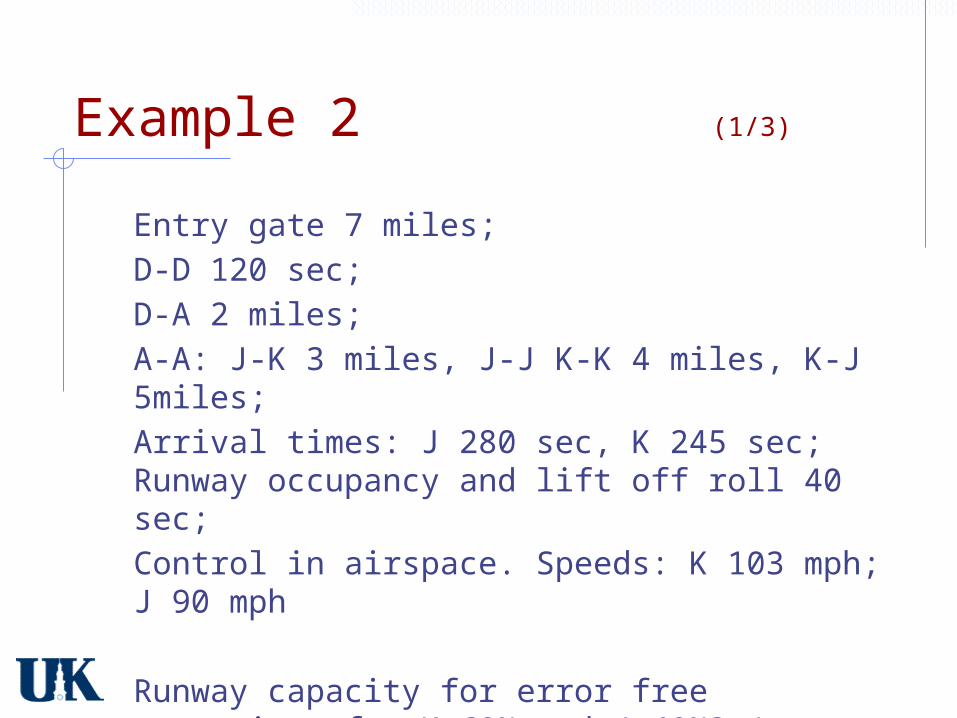
Example 2 (1/3)
Entry gate 7 miles; D-D 120 sec; D-A 2 miles; A-A: J-K 3 miles, J-J K-K 4 miles, K-J 5miles; Arrival times: J 280 sec, K 245 sec; Runway occupancy and lift off roll 40 sec; Control in airspace. Speeds: K 103 mph; J 90 mph
Runway capacity for error free operations for K 60% and J 40%? (note: proportion same as previous problem, but order not specified here so may have different pattern, e.g., kkjkj or kkkjj or kjkjk.)
Example 2 (2/3)
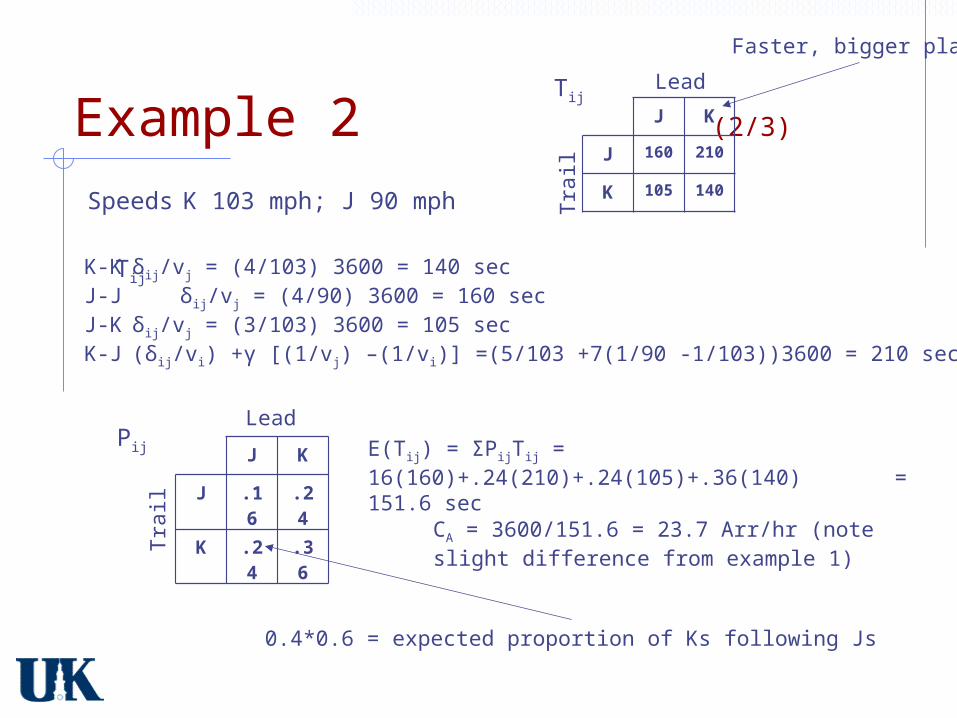
Speeds K 103 mph; J 90 mph
TijK-K δij/vj = (4/103) 3600 = 140 secJ-J δij/vj = (4/90) 3600 = 160 secJ-K δij/vj = (3/103) 3600 = 105 secK-J (δij/vi) +γ [(1/vj) –(1/vi)] =(5/103 +7(1/90 -1/103))3600 = 210 sec
Pij J K
J .16
.24
K .24
.36
Trail
LeadE(Tij) = ΣPijTij = 16(160)+.24(210)+.24(105)+.36(140)
= 151.6 secCA = 3600/151.6 = 23.7 Arr/hr (note slight difference from example 1)
J K
J 160
210
K 105
140
Trail
LeadTij
0.4*0.6 = expected proportion of Ks following Js
Faster, bigger plane
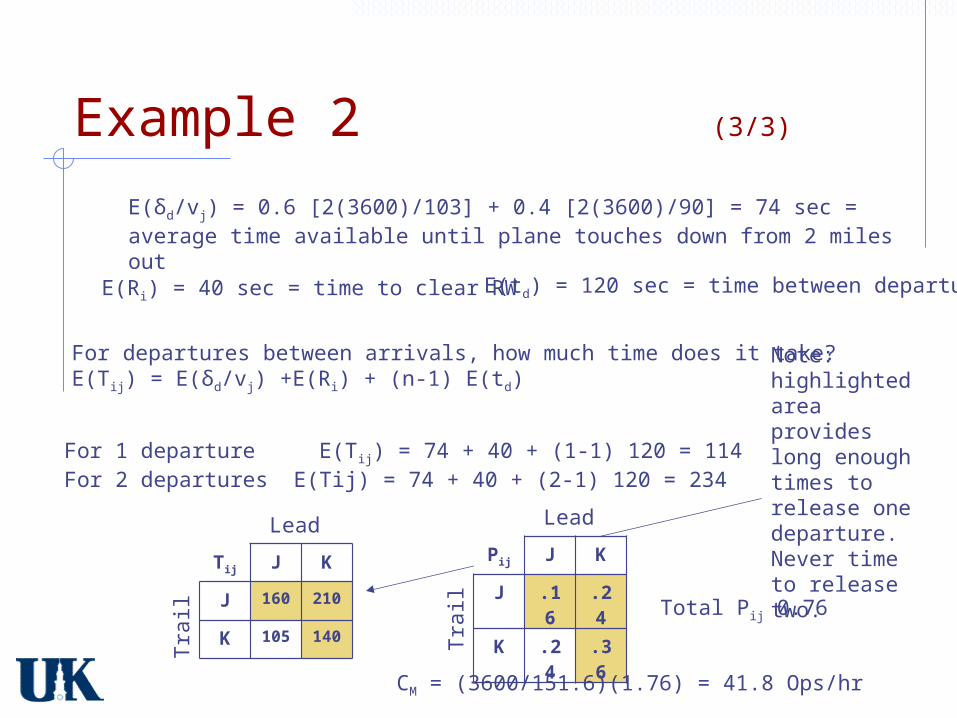
Example 2 (3/3)
E(δd/vj) = 0.6 [2(3600)/103] + 0.4 [2(3600)/90] = 74 sec = average time available until plane touches down from 2 miles out
E(Ri) = 40 sec = time to clear RW E(td) = 120 sec = time between departures
For departures between arrivals, how much time does it take?E(Tij) = E(δd/vj) +E(Ri) + (n-1) E(td)
For 1 departure E(Tij) = 74 + 40 + (1-1) 120 = 114For 2 departures E(Tij) = 74 + 40 + (2-1) 120 = 234
Pij J K
J .16
.24
K .24
.36
Trail
Lead
Tij J K
J 160
210
K 105
140
Trail
Lead
Total Pij 0.76
CM = (3600/151.6)(1.76) = 41.8 Ops/hr
Note: highlighted area provides long enough times to release one departure. Never time to release two.
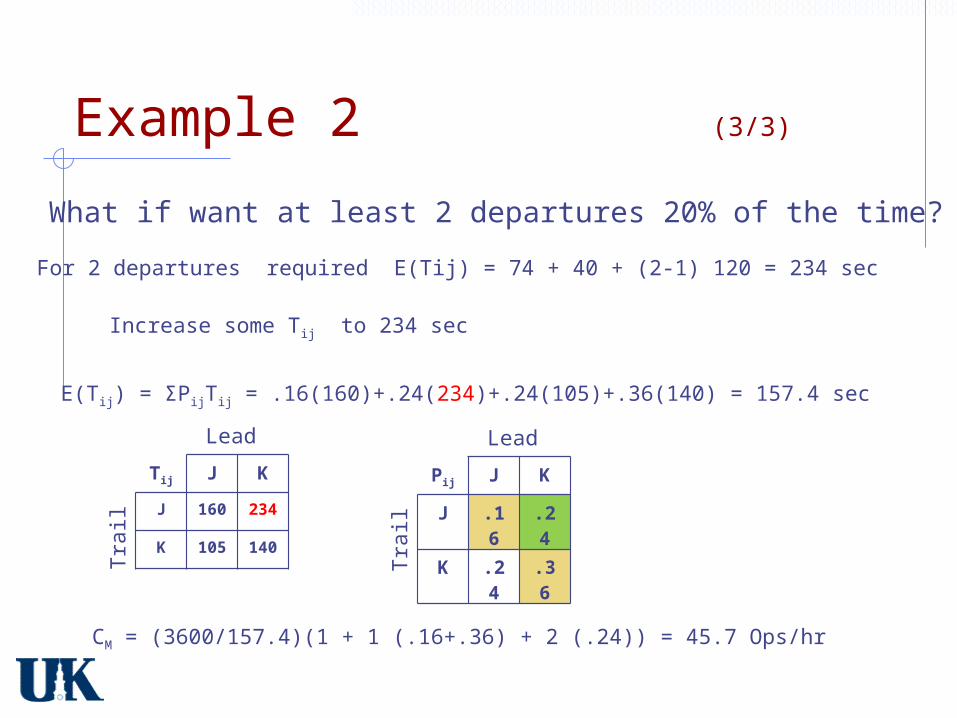
Example 2 (3/3)
What if want at least 2 departures 20% of the time?
Increase some Tij to 234 sec
For 2 departures required E(Tij) = 74 + 40 + (2-1) 120 = 234 sec
Pij J K
J .16
.24
K .24
.36
Trail
Lead
Tij J K
J 160
234
K 105
140
Trail
Lead
CM = (3600/157.4)(1 + 1 (.16+.36) + 2 (.24)) = 45.7 Ops/hr
E(Tij) = ΣPijTij = .16(160)+.24(234)+.24(105)+.36(140) = 157.4 sec
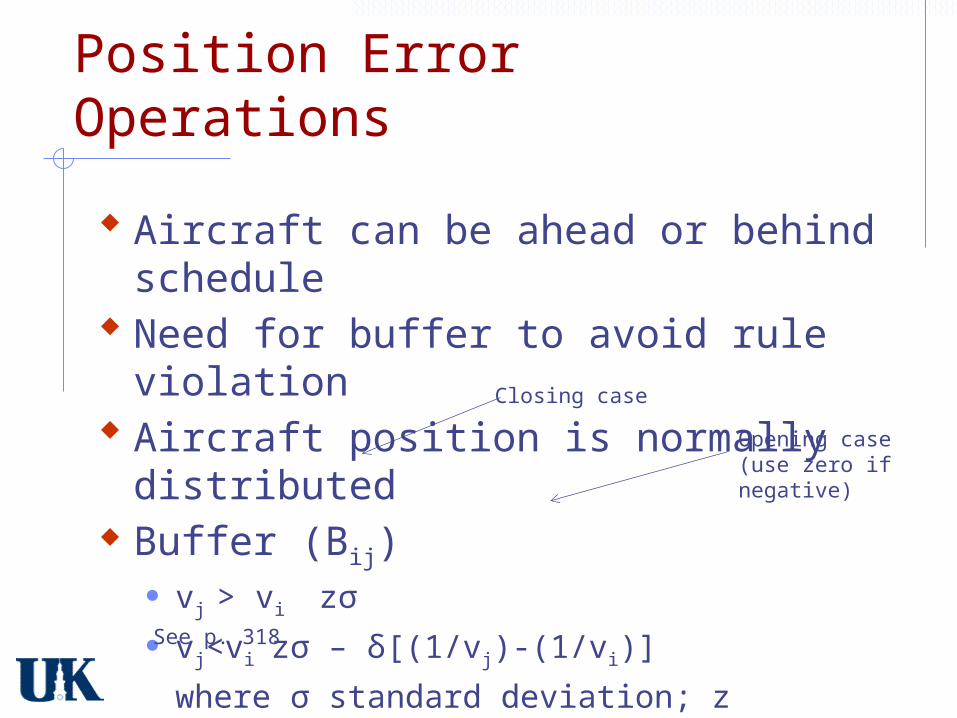
Position Error Operations
Aircraft can be ahead or behind schedule
Need for buffer to avoid rule violation Aircraft position is normally
distributed Buffer (Bij)
vj > vi zσ vj<vi zσ – δ[(1/vj)-(1/vi)]
where σ standard deviation; z standard score for 1-Pv; Pv probability of violation
Closing case
Opening case (use zero if negative)
See p. 318
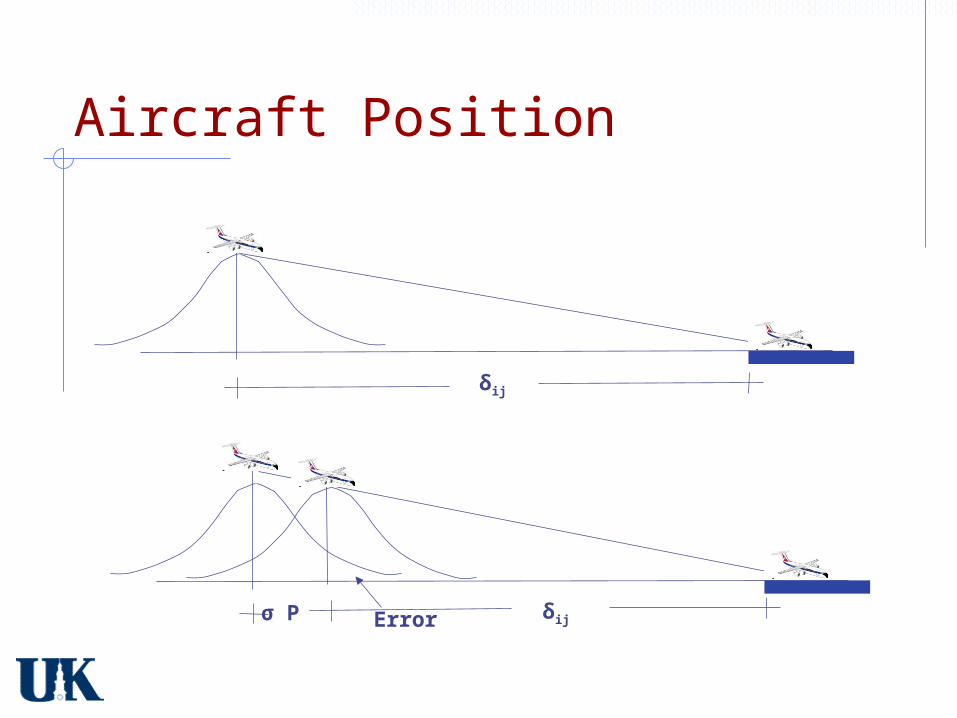
Aircraft Position
Error
δij
δijσ P
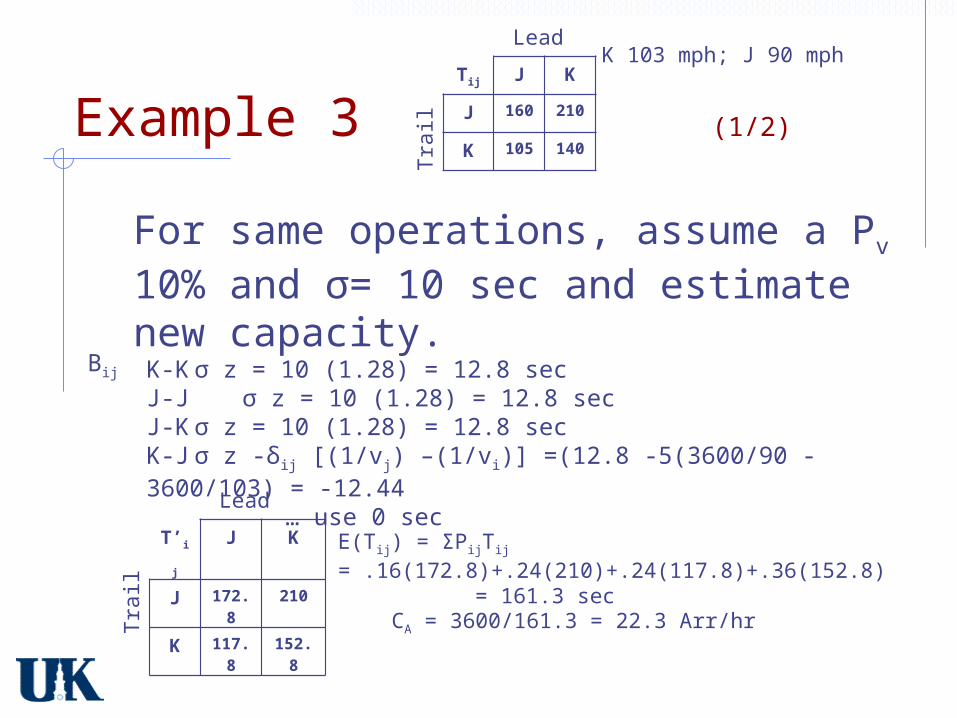
Example 3 (1/2)
For same operations, assume a Pv 10% and σ= 10 sec and estimate new capacity.K-K σ z = 10 (1.28) = 12.8 secJ-J σ z = 10 (1.28) = 12.8 secJ-K σ z = 10 (1.28) = 12.8 secK-J σ z -δij [(1/vj) –(1/vi)] =(12.8 -5(3600/90 -3600/103) = -12.44
… use 0 sec
Bij
T’ij J K
J 172.8
210
K 117.8
152.8
Trail
Lead
CA = 3600/161.3 = 22.3 Arr/hr
E(Tij) = ΣPijTij = .16(172.8)+.24(210)+.24(117.8)+.36(152.8)
= 161.3 sec
Tij J K
J 160
210
K 105
140
Trail
LeadK 103 mph; J 90 mph
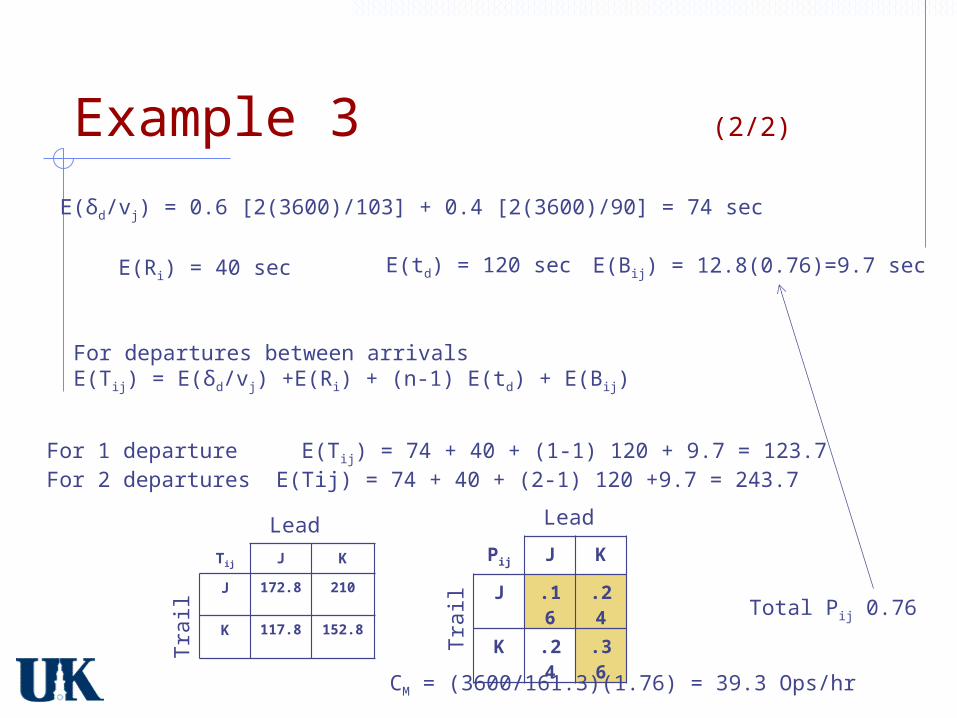
Example 3 (2/2)
E(δd/vj) = 0.6 [2(3600)/103] + 0.4 [2(3600)/90] = 74 sec
E(Ri) = 40 sec E(td) = 120 sec
For departures between arrivalsE(Tij) = E(δd/vj) +E(Ri) + (n-1) E(td) + E(Bij)
For 1 departure E(Tij) = 74 + 40 + (1-1) 120 + 9.7 = 123.7For 2 departures E(Tij) = 74 + 40 + (2-1) 120 +9.7 = 243.7
Pij J K
J .16
.24
K .24
.36
Trail
Lead
Tij J K
J 172.8
210
K 117.8
152.8Tr
ail
Lead
Total Pij 0.76
CM = (3600/161.3)(1.76) = 39.3 Ops/hr
E(Bij) = 12.8(0.76)=9.7 sec
Runway Configuration
Approach works for single runway Adequate for small airports Charts and software is used for more
than one runways
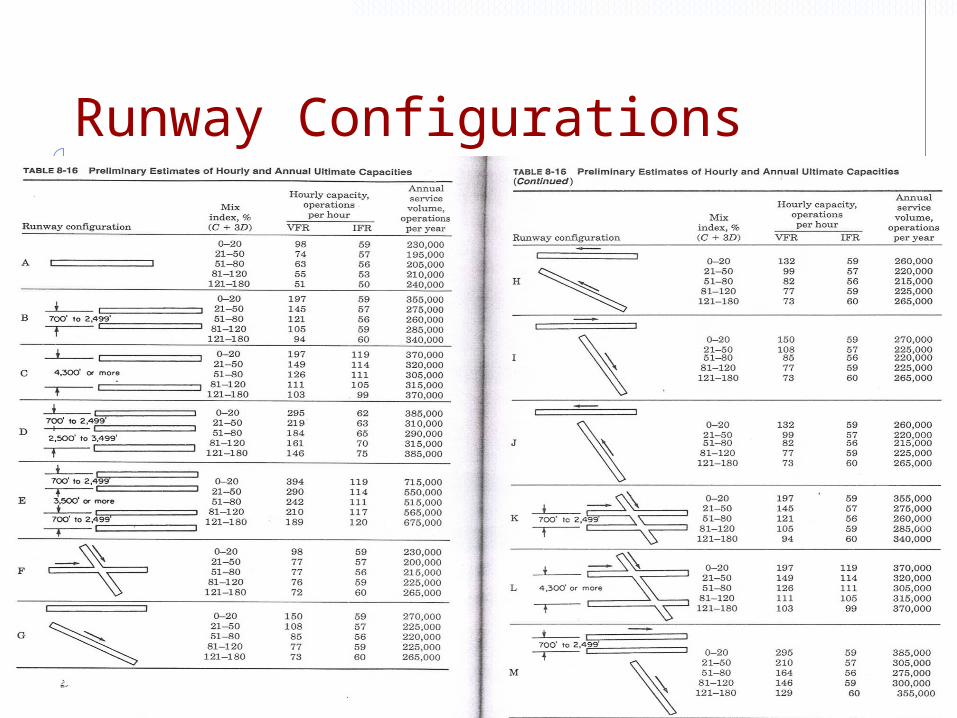
Runway Configurations
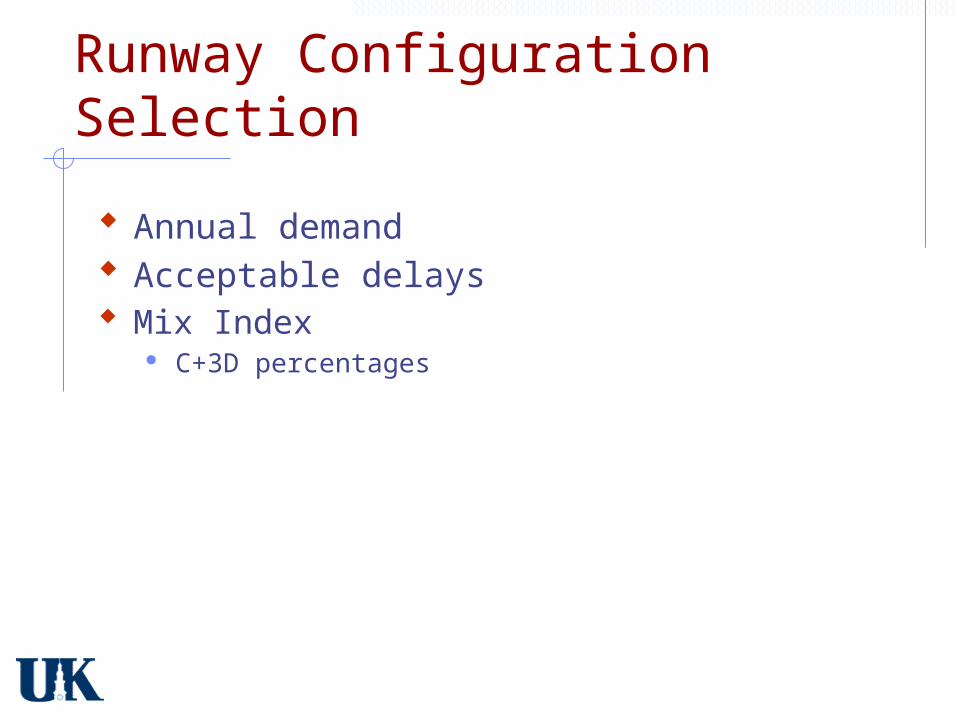
Runway Configuration Selection
Annual demand Acceptable delays Mix Index
C+3D percentages
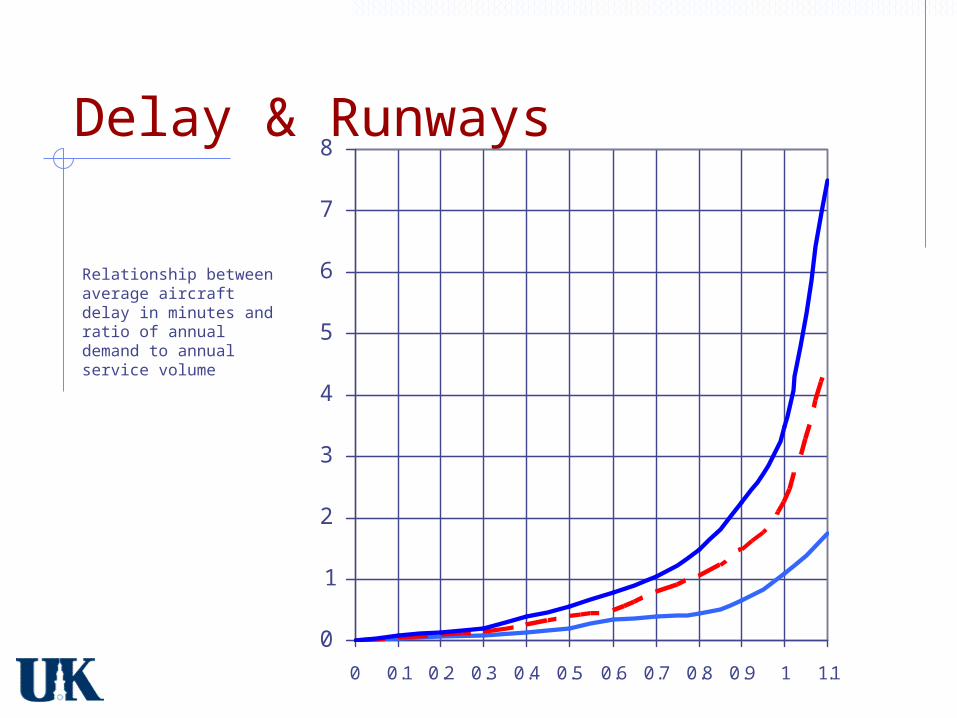
Delay & Runways
0
1
2
3
4
5
6
7
8
0 0.1 0.2 0.3 0.4 0.5 0.6 0.7 0.8 0.9 1 1.1
Relationship between average aircraft delay in minutes and ratio of annual demand to annual service volume

Example 4
For a demand of 310,000 operations, maximum delay of 5 minutes,and MI 90 VFR, 100 IFR determine possible runway configurations
0 0.1 0.2 0.3 0.4 0.5 0.6 0.7 0.8 0.9 1 1.10
1
2
3
4
5
6
7
8
Demand/Service ratio
Dela
y (
min
/op)
Possible Options
C ASV 315000D ASV 315000L ASV 315000
Demand/Service 310000/315000 = .98
Delays 1-3.5 min All OK
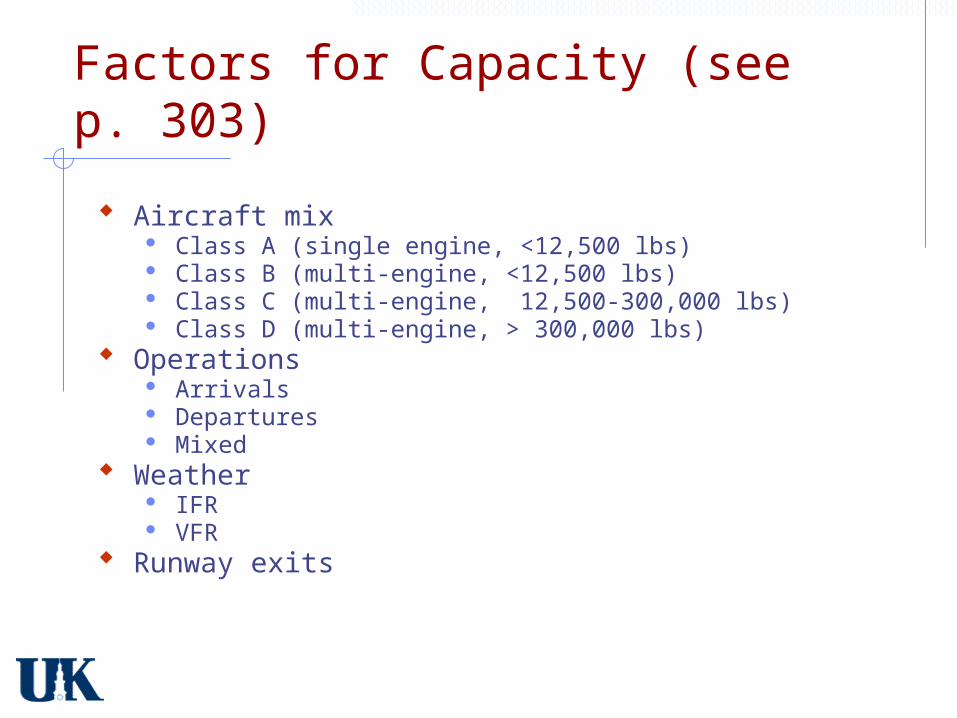
Factors for Capacity (see p. 303)
Aircraft mix Class A (single engine, <12,500 lbs) Class B (multi-engine, <12,500 lbs) Class C (multi-engine, 12,500-300,000 lbs) Class D (multi-engine, > 300,000 lbs)
Operations Arrivals Departures Mixed
Weather IFR VFR
Runway exits
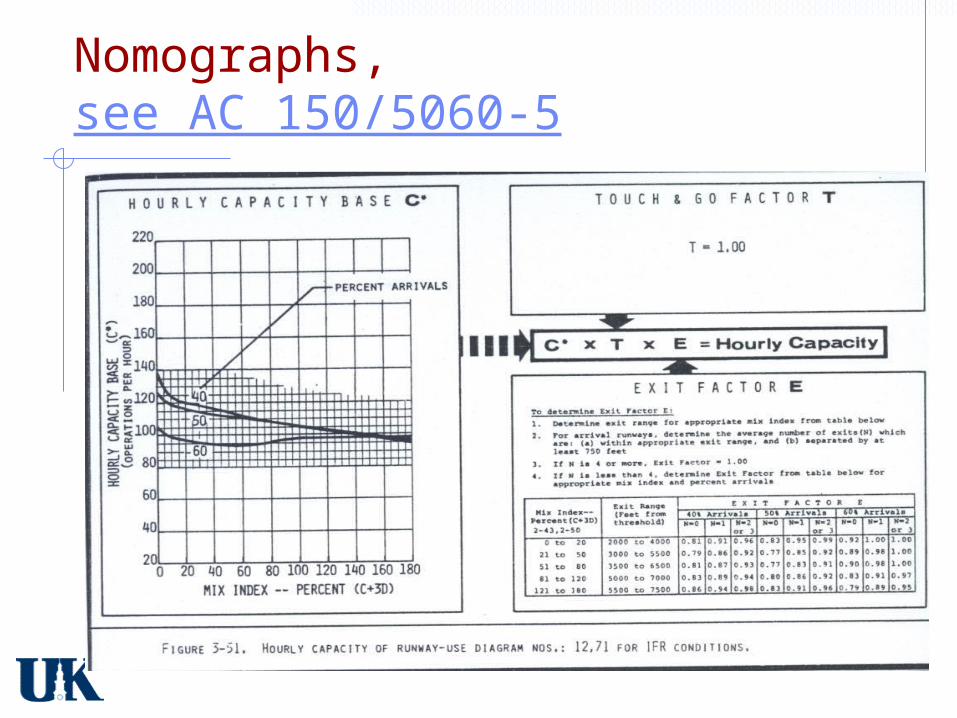
Nomographs, see AC 150/5060-5
Example 5 (1/3)
• Two parallel runways; • Aircraft classes: A 26%; B 20%; C 50%;
D 4%; • Touch and go 8%; • 2 exits at 4,700 ft and 6,500 ft from
arrival threshold; • 60% arrivals in peak hour.
Capacity?
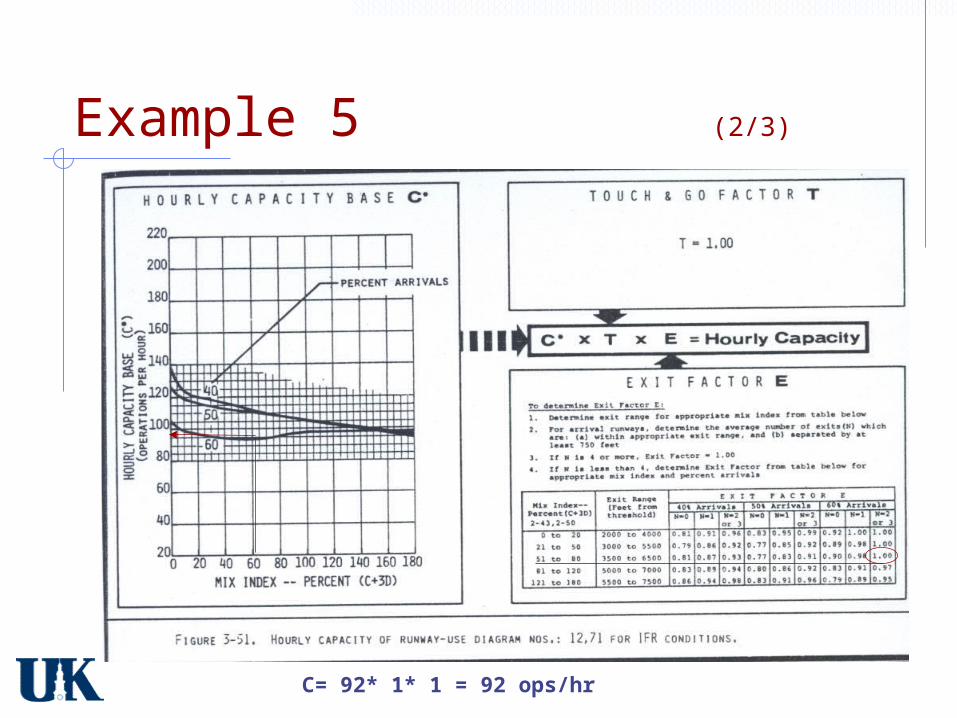
Example 5 (2/3)
C= 92* 1* 1 = 92 ops/hr
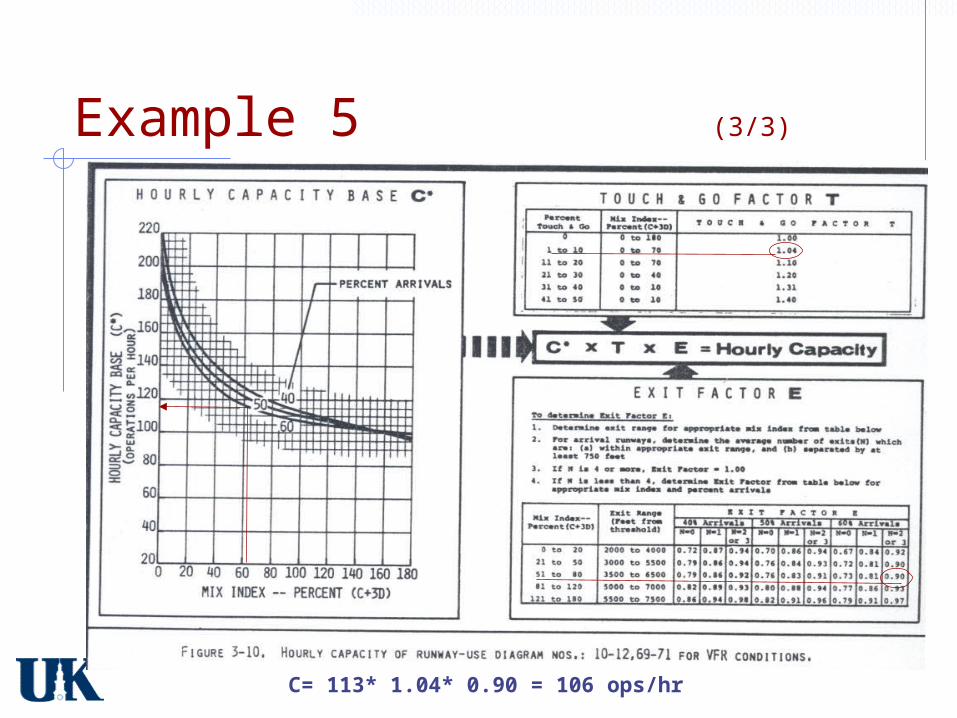
Example 5 (3/3)
C= 113* 1.04* 0.90 = 106 ops/hr
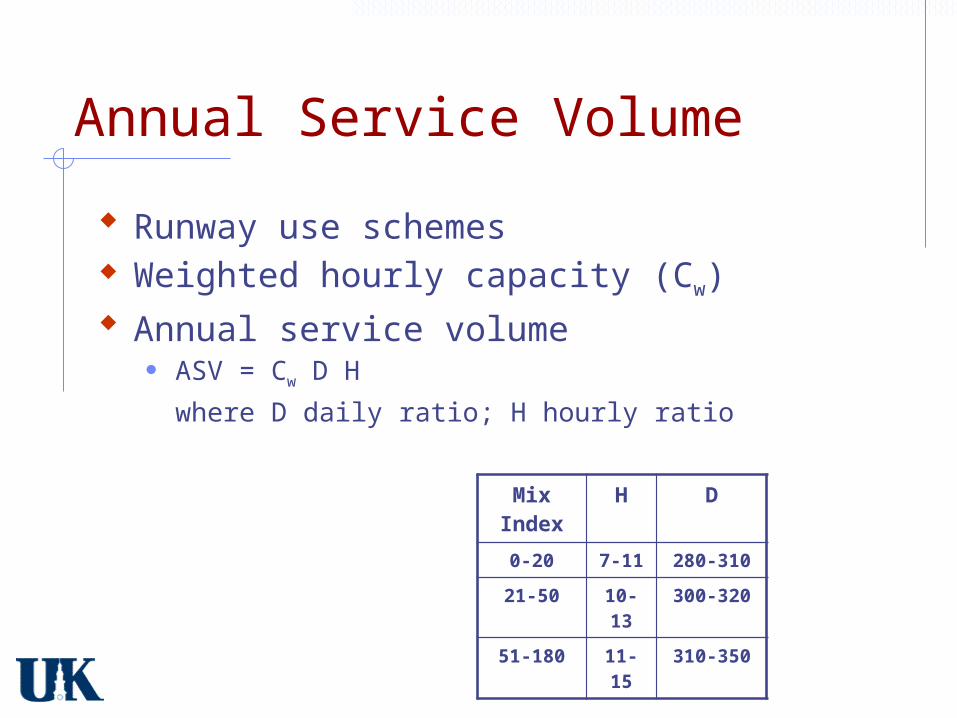
Annual Service Volume
Runway use schemes Weighted hourly capacity (Cw) Annual service volume
ASV = Cw D H
where D daily ratio; H hourly ratio
Mix Index
H D
0-20 7-11 280-310
21-50 10-13
300-320
51-180 11-15
310-350
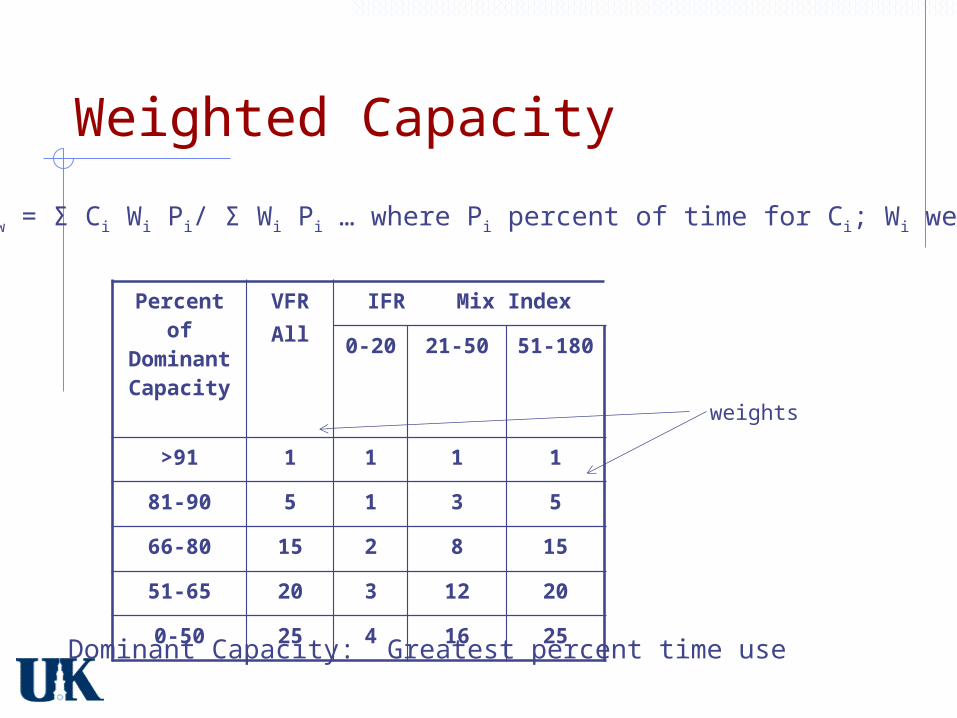
Weighted Capacity
Cw = Σ Ci Wi Pi/ Σ Wi Pi … where Pi percent of time for Ci; Wi weight
Percent of
Dominant
Capacity
VFRAll
IFR Mix Index
0-20 21-50 51-180
>91 1 1 1 1
81-90 5 1 3 5
66-80 15 2 8 15
51-65 20 3 12 20
0-50 25 4 16 25Dominant Capacity: Greatest percent time use
weights

Example 6 (1/3)
VFR IFR
70% - 110 ops 80% - 88 ops
20% - 88 ops 0% - 0 ops
10% - 40 ops 20% - 55 ops
VFR 85%, MI 60; IFR 15% MI 95
A
B
C
capacity
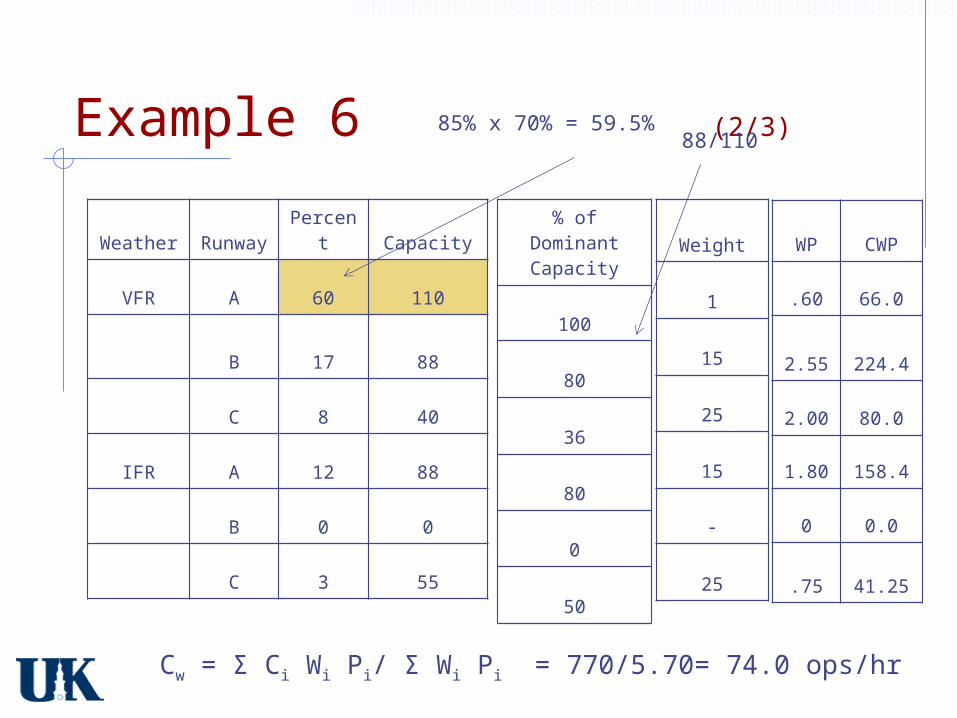
Example 6 (2/3)
WeatherRunwa
y Percent Capacity
VFR A 60 110
B 17 88
C 8 40
IFR A 12 88
B 0 0
C 3 55
% of Dominant Capacity
100
80
36
80
0
50
Weight
1
15
25
15
-
25
Cw = Σ Ci Wi Pi/ Σ Wi Pi = 770/5.70= 74.0 ops/hr
WP CWP
.60 66.0
2.55 224.4
2.00 80.0
1.80 158.4
0 0.0
.75 41.25
85% x 70% = 59.5%88/110
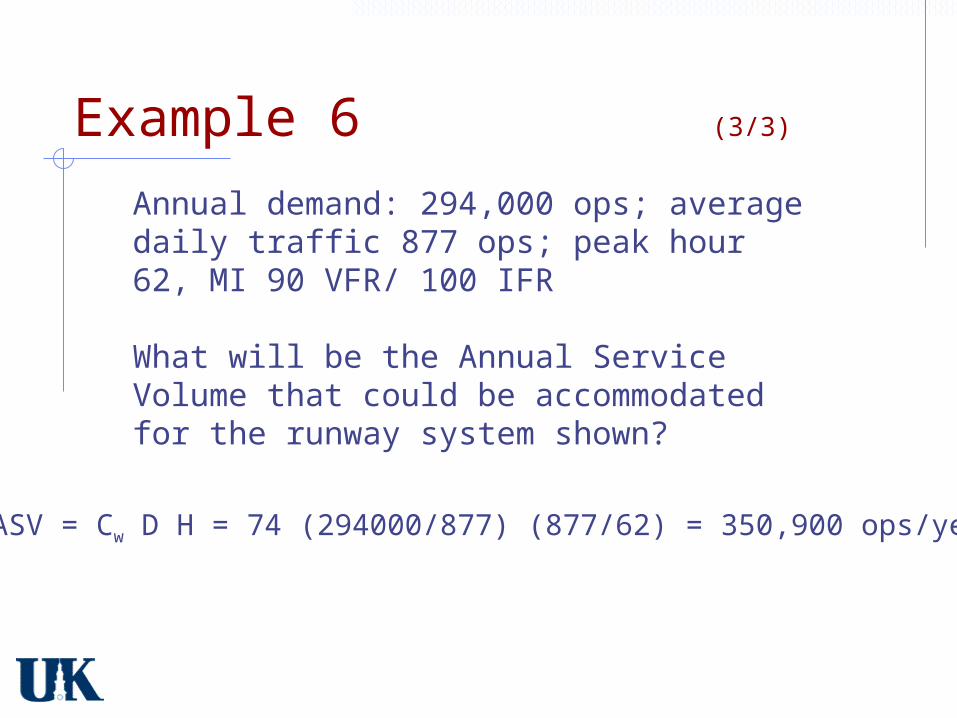
Example 6 (3/3)
Annual demand: 294,000 ops; average daily traffic 877 ops; peak hour 62, MI 90 VFR/ 100 IFR
What will be the Annual Service Volume that could be accommodated for the runway system shown?
ASV = Cw D H = 74 (294000/877) (877/62) = 350,900 ops/year


![EE359 Discussion Session 3 Capacity of Flat and Frequency ...p g[i] ˘fading distribution E[jx[i]j2] P g[i] known at transmitter and receiver What is capacity with xed TX power? ...](https://static.fdocument.org/doc/165x107/5e6ecee5b21002337c3077f3/ee359-discussion-session-3-capacity-of-flat-and-frequency-p-gi-fading-distribution.jpg)

![Bearing Capacity of Rocks - IITKhome.iitk.ac.in/~sarv/New Folder/Presentation-14.pdf · Bearing Capacity of Rocks ... PtTtPressuremeter Test: [] 3 1 q a = γD ... Plate Load TestPlate](https://static.fdocument.org/doc/165x107/5a7686857f8b9a0d558d39f3/bearing-capacity-of-rocks-iitkhomeiitkacinsarvnew-folderpresentation-14pdf.jpg)