Relation between α -casein, proteolytic activity and ...
45
Relation between α s1 -casein, proteolytic activity and composition of milk from Swedish goats Sambandet mellan αs1-kasein, proteolytisk aktivitet och sammansättning i mjölk från svenska getter Emma Larsson Master thesis Food Science • 30 hp Swedish University of Agricultural Sciences, SLU Department of Molecular Sciences Agricultural programme - Food Science Molecular Sciences, 2021:40 Uppsala, 2021
Transcript of Relation between α -casein, proteolytic activity and ...
Relation between αs1-casein, proteolytic activity and composition of milk from Swedish goats Sambandet mellan αs1-kasein, proteolytisk aktivitet och sammansättning i mjölk från svenska getter
Emma Larsson
Master thesis Food Science • 30 hp Swedish University of Agricultural Sciences, SLU Department of Molecular Sciences Agricultural programme - Food Science Molecular Sciences, 2021:40 Uppsala, 2021

Sambandet mellan as1-kasein, proteolytisk aktivitet och sammansättning i mjölk från svenska getter
Emma Larsson
Supervisor: Examiner:
Credits: Level: Course title: Course code: Programme/education: Course coordinating dept:
Place of publication: Year of publication: Title of series: Part number:
Monika Johansson, SLU, Department of Molecular Sciences Åse Lundh, SLU, Department of Molecular Sciences
30 hp A2E Master thesis in Food Science EX0877 Agricultural programme - Food Science Department of Molecular Sciences
Uppsala 2021 Molecular Sciences 2021:40
Keywords: Swedish goat milk, αs1-casein, total proteolysis, plasmin, plasminogen, spectrophotometry
Swedish University of Agricultural Sciences Faculty of Natural Resources and Agricultural Sciences Department of Molecular Sciences
Relation between αs1-casein, proteolytic activity and composition of milk from Swedish goats

Approved students’ theses at SLU are published electronically. As a student, you have the copyright to your own work and need to approve the electronic publishing. If you check the box for YES, the full text (pdf file) and metadata will be visible and searchable online. If you check the box for NO, only the metadata and the abstract will be visible and searchable online. Nevertheless, when the document is uploaded it will still be archived as a digital file.
If you are more than one author you all need to agree on a decision. Read about SLU’s publishing agreement here: https://www.slu.se/en/subweb/library/publish-and-analyse/register-and-publish/agreement-for-publishing/.
☒ YES, I/we hereby give permission to publish the present thesis in accordancewith the SLU agreement regarding the transfer of the right to publish a work.
☐ NO, I/we do not give permission to publish the present work. The work will stillbe archived and its metadata and abstract will be visible and searchable.
Publishing and archiving
In the recent decade, locally produced food has gained in interest among Swedish consumers. Consumer values for buying local food has to do with concerns about diversity, purity and authenticity of food as well as a desire to support rural areas. One type of product that has gained in interest is locally produced goat cheese. The goat industry in Sweden is small scaled, however, steadily increasing. In goats, the CSN1S1 gene regulates the expression of the protein αS1-casein (αS1-CN). This casein has been found to be important for the cheese yield. Over the years, breeding animals have been imported to Sweden from Norway. Historically a high frequency of the Norwegian goat population carried a polymorphism at the CSN1S1 gene. This polymorphism, called the Norwegian null allele (D), leads to zero or heavily reduced expression of αS1-CN. Consequently, in Sweden, the number of goats homozygous for the Norwegian null allele, increased dramatically. This study aimed to investigate how the expression of αS1-CN and the genetic profile of the CSN1S1 gene influence the proteolytic activity and milk composition of milk from Swedish dairy goats. Within the study, milk samples from 75 goats were analysed for total proteolysis, plasmin activity (PL) and plasminogen derived activity (PG). Total proteolysis was determined by a luminescent method, measuring the amount of free terminal amino groups present in the milk. For PL and PG analysis, a spectrophotometric method with chromogenic substrate was used, where PG was activated with urokinase. The results for gross composition, somatic cell count, protein profile and genotype were also included in this investigation. Milk samples were grouped according to level of αS1-CN (low 0-6.9% and medium-high 7-25% of total protein) and genotype (DD, DG and DA/AG/AA). For the statistical analysis, Pearson and Spearman correlations were applied. The groups were compared with two-sample T-test and one-way ANOVA. The frequency of individuals homozygous for the Norwegian null allele (DD) was 58%, and only 15% of the studied goats carried an A allele. A significant association was found between the level of αS1-CN in the milk and allele combination (p <0.001). Moreover, a significant positive correlation was found between αS1-CN with total protein (p ≤ 0.001). Total protein was negatively correlated with total proteolysis (p ≤ 0.001) and PG (p ≤ 0.01) and positively correlated with PL (p ≤ 0.05). However, no correlation between total proteolysis and PL was found. SCC, pH and FFA were significantly higher among the genotype homozygous for the null allele (DD) compared to genotypes with an A allele (p ≤ 0.05). This may have effects on milk processability and the sensory properties of the processed dairy product. Further research is needed to understand the relationship between αS1-CN and proteolytic activity, for example including additional parameters within the plasmin-plasminogen system such as the activity of plasminogen activators and plasmin inactivators. In addition, the bacterial status of the milk could be included.
Keywords: Swedish goat milk, αS1-CN, proteolytic activity, total proteolysis, plasmin, plasminogen, spectrophotometry
Abstract
Sammanfattning Lokalt och småskaligt producerad mat har under de senaste åren erhållit ett ökat intresse hos de svenska konsumenterna. De värderingar som är drivande för att köpa lokalt producerad mat har bland annat att göra med mångfald och autenticitet, samt att konsumenten vill stödja landsbygden. En produkt med en ökad efterfrågan är lokalt producerad getost. Den svenska getindustrin är småskalig men har en uppåtgående trend. Hos getter finns en gen, CSN1S1, som reglerar uttrycket av proteinet αS1-kasein (αS1-CN). Detta kasein har i studier observerats vara gynnsamt för ostutbytet. Avelsdjur har förts från Norge till Sverige varför den svenska lantrasen är nära besläktad med den norska getpopulationen. Historiskt har en hög andel av den norska getpopulationen burit på en mutation i αS1-CN genen. Som en konsekvens, har antalet getter med den norska genvarianten ökat kraftigt inom den svenska getstammen. Denna studie syftade till att undersöka hur uttrycket av αS1-CN och den genetiska profilen av genen CSN1S1 påverkar proteolytisk aktivitet och mjölksammansättning i mjölk från svenska getter. Studien inkluderade mjölkprover från 75 getter som analyserades för totalproteolys samt aktivitet av plasmin (PL) och plasminogen (PG). Totalproteolys bestämdes med en luminiscensmetod genom att mäta mängden fria, terminala aminogrupper i mjölken. För PL och PG användes en spektrofotometrisk metod och ett kromogent substrat, varvid PG aktiverades med urokinas. Resultat för mjölksammansättning, somatiska celltal, proteinprofil och genotyp inkluderades också i denna undersökning. Mjölkproverna grupperades utifrån mängden αS1-CN i mjölken (låg 0-6,9% och medium-high 7-25% av totalprotein) och genotyp (DD, DG och DA/AG/AA). I den statistiska analysen testades korrelationer med Pearson och Spearman. Skillnad mellan grupper testades med t-test och envägs ANOVA. Andelen individer som var homozygoter för den norska null-allelen var 58% och endast 15% av individerna bar på en A-allel. Ett signifikant förhållande observerades mellan mängd αS1-CN i mjölken och kombinationen av alleler (p <0,001). Vidare observerades en positiv korrelation mellan αS1-CN och totalprotein (p ≤ 0,001). Totalprotein uppvisade en negativ korrelation med totalproteolys (p ≤ 0,001) och PG (p ≤ 0,01) och en positiv korrelation med PL (p ≤ 0,05). Studien kunde inte påvisa en korrelation mellan totalproteolys och plasmin. Medelvärdena för somatiskt celltal, pH-värde och fria fettsyror var signifikant högre i gruppen som var homozygoter för null-allelen (DD) jämfört med gruppen med A-alleler (p ≤ 0,05). Resultatet kan ha effekt på mjölkens lämplighet för vidare förädling samt för sensoriska egenskaper hos slutprodukten. Ytterligare studier krävs för att förstå relationen mellan αS1-CN och proteolytisk aktivitet. Ett förslag är att inkludera fler parametrar så som aktiviteten av aktivatorer av plasminogen samt inhibitorer av plasmin. Vidare bör även den mikrobiologiska statusen för mjölken inkluderas i framtida studier.
Nyckelord: svensk getmjölk, αS1-CN, proteolytisk aktivitet, totalproteolys, plasmin, plasminogen, spektrofotometri
List of tables ...................................................................................................................... 9 Abbreviations .................................................................................................................. 10
1. Introduction ............................................................................................................. 11
1.1. Aim ............................................................................................................... 12 1.2. Delimitations ................................................................................................ 12
2. Background ............................................................................................................. 13
2.1. Gross composition of milk ........................................................................... 13 2.2. Protein profile of goat milk ........................................................................... 13 2.3. Casein micelle ............................................................................................. 14 2.4. Proteolytic activity ........................................................................................ 14
2.4.1. Endogenous proteases ....................................................................... 14 2.4.2. Exogenous proteases ......................................................................... 16
2.5. Genetic profile ............................................................................................. 17 2.6. Processing properties – cheese production ................................................ 18 2.7. Total proteolysis – analytical method .......................................................... 19 2.8. Plasmin and plasminogen – analytical method ........................................... 19
3. Experimental procedures ...................................................................................... 20
3.1. Milk samples and storage ............................................................................ 20 3.2. Sample preparation ..................................................................................... 20 3.3. Analysis of total proteolysis ......................................................................... 21 3.4. Analysis of plasmin and plasminogen ......................................................... 21 3.5. Statistical analysis ....................................................................................... 22
4. Results ..................................................................................................................... 24
4.1. Milk composition and proteolytic activity ..................................................... 24 4.2. Correlation - milk composition and proteolytic activity ................................ 24 4.3. Distribution of αS1-casein ............................................................................. 27 4.4. Differences in milk traits based on level of αS1-CN ...................................... 27 4.5. Distribution of genotype ............................................................................... 28 4.6. Relation between genotype and expression of αS1-CN ............................... 29 4.7. Differences in milk traits based on genotype ............................................... 29
5. Discussion............................................................................................................... 31
5.1. Distribution of αs1-CN and genotype ............................................................ 31 5.2. αS1-CN in relation to milk composition ......................................................... 31 5.3. αS1-CN in relation to proteolytic activity, SCC, pH and FFA ........................ 32 5.4. General discussion ...................................................................................... 34 5.5. Future research ........................................................................................... 34 5.6. Conclusion ................................................................................................... 35
References ....................................................................................................................... 36
Acknowledgements......................................................................................................... 43
Table of contents

Appendix 1 – Popular Scientific summary ................................................................... 44
9
Table 1. Average composition and proteolytic activity of goat milk samples ...... 24 Table 2. Correlation coefficients of goat milk traits .............................................. 26 Table 3. Distribution of goat milk samples based on expression of αS1-casein ..... 27 Table 4. Differences in milk composition and proteolytic activity between goat milk
samples based on the level of αS1-casein (CN) .......................................... 28 Table 5. Genotype distribution in the studied goat population. ............................. 28 Table 6. Relationship between genotype and level of αS1-casein .......................... 29 Table 7. Differences in milk composition and proteolytic activity between goat milk
samples based on genotype........................................................................ 30
List of tables
10
αs1-CN αs1-casein β-CN β-casein κ-CN κ-casein CCP Colloidal calcium phosphate FFA Free fatty acids LPL Lipoprotein lipase MFGM Milk fat globule membrane PL Plasmin PG Plasminogen PA Plasminogen activator PMNL Polymorphonuclear neutrophilic leucocytes SCC Somatic cell count UHT Ultra-high temperature
Abbreviations
11
In the recent decade, locally produced food has gained in interest among consumers (Bosona & Gebresenbet 2018; AGFO 2019). Consumers connect the term “local” to food productions that are small scaled and to producers of food that are devoted to their artisanal work and to the quality of their food products (Ditlevsen et al. 2020). Moreover, consumer values for buying local food have to do with concerns about diversity, purity and authenticity of food as well as to support rural areas (Ditlevsen et al. 2020). In addition, short food supply chains can be beneficial at both farm and consumer level regarding economic, social and environmental aspects. Thus, it can provide fresh foods for everyone and establish a relationship between farmers and consumers. It can also result in an added value for farmers and producers of their products (Kneafsey et al. 2013). Initiatives related to short supply chains are farmers’ markets, box deliveries and farm sales (Åsebø et al. 2008).
Locally produced goat cheese is one type of product that has experienced an increased demand in the latest years (LRF Jordmån, no year). The Swedish goat industry is small scaled, nevertheless during the last 30 years it has increased. According to the agricultural index, there were approximately 518 registered goat farms in 2003 (Jordbruksverket 2019). In 2018 the number had increased to 746 farms, holding approximately 11 000 goats. However, not all farms produce goat milk with profit-making approach. Though, in 2018, approximately 1374 tons goat milk and 126 tons goat cheese were produced (Jordbruksverket 2019). Most common is to process the milk at farmhouse dairies (Jordbruksverket 2015). The largest part of the goat milk is processed into cheese, other types of products are milk, yoghurt and ice cream (LRF Jordmån, no year). The most common dairy goat breed in Sweden is the Swedish Landrace (Högberg 2016). The Swedish Landrace goat is high yielding and can produce between 1000 and 1400 litres of milk per year (Jordbruksverket 2015). Other local breeds in Sweden are Jämt goat, Lapp goat and Göinge goat (Allmogegeten 2018).
The Swedish Landrace is closely related to the Norwegian Landrace (Jordbruksverket 2015). Historically, a high frequency (>70%) of the Norwegian goat population contained a deletion in exon 12 of the CSN1S1 gene where αS1-casein (αS1-CN) is encoded. The deletion causes a reduced or null expression of αS1-CN (Devold et al. 2011). A reduced expression of αS1-CN has also been detected in the Swedish goat population (Johansson et al. 2014). Milk with a high concentration of αS1-CN has been observed to be beneficial for the cheese yield (Skeie et al. 2014; Johansson et al. 2015). Another important parameter for the cheese yield is the proteolytic activity in the raw milk. This since proteolysis can lead to a lowered cheese yield due to the degradation of caseins (Walstra et al. 2006).
1. Introduction
12
1.1. Aim The aim of this study was to investigate if the expression of αS1-CN and genetic profile of the CSN1S1 gene influence the proteolytic activity and composition of milk from Swedish dairy goats. In particular, for proteolytic activity, it was the total proteolysis, plasmin and plasminogen derived activity that were investigated. The hypothesis was that the level of αS1-CN in the milk influences the proteolytic activity in the milk.
1.2. Delimitations This study was conducted as an explorative study. Thus, the aim was to examine the relation between investigated traits in a broad perspective including several parameters. Moreover, the experiment was limited to a single sampling, which set limitations for the ability to generalize the result. Consequently, this study intended to identify potential relations between investigated parameters to be further studied.
13
2.1. Gross composition of milk The composition of milk from different ruminants varies. The variation concerns amongst others the fat and protein contents, which in turn affects the yield in cheese production (Walstra et al. 2006). Soliman (2005) and Kapadiya et al. (2016) compared goat, cow and buffalo milk. Goat milk had the lowest and buffalo milk the highest content of total solids, fat, protein and lactose. Moreover, Kapadiya et al. (2016) found that cow milk had, except for protein, a significantly higher content of total solids, fat and lactose compared to goat milk. In contrast, the study of Soliman (2005) showed that cow milk had a significantly higher protein content but not fat, when compared to goat milk. Additionally, the average protein and fat content of sheep milk is higher than in goat milk (Park et al. 2007). Moreover, milk of small ruminants contains a higher content of short chain fatty acids compared to large ruminants (Skeie 2010).
Goat milk has an average composition of 3.8% fat, 3.4% protein, 2.4% casein and 4.1% lactose (Park et al. 2007). However, there is a great variation in the gross composition of milk, both among breeds and among individuals. Differences are for example caused by genetic factors, stage of lactation, number of lactation and feed (Walstra et al. 2006; Park et al. 2007). As an example, type of feed is reported to alter the content of αS1-CN, β-CN and κ-CN. Goats grazing at cultivated pasture have higher contents of αS1-CN and κ-CN, while goats grazing on rangeland have highest content of β-CN (Inglingstad et al. 2014). In addition, the composition of fatty acids is highly related to the type of fat in the feed (Skeie 2010). In the study by Inglingstad et al. (2017), feed was seen to affect the content of free fatty acids (FFA) in goat milk. Feed containing unsaturated fat, such as rapeseed oil, provided a lower lipoprotein lipase (LPL) activity and lower levels of FFA in the milk.
2.2. Protein profile of goat milk Caseins make up approximately 80% and serum proteins 20% of the total protein content of goat milk (Ambrosoli et al. 1988). Caseins can further be divided into αS1-CN, αS2-CN, β-CN and κ-CN (Moatsou 2004; Johansson et al. 2015). β-CN forms the main part of the caseins in goat milk (Walstra et al. 2006; Potočnik et al. 2011; Iskender et al. 2018), followed by α-CN and κ-CN (Walstra et al. 2006; Potočnik et al. 2011). Included in the serum fraction are proteins such as α-
2. Background
14
lactalbumin, β-lactoglobulin, lactoferrin, serum albumin and lactoperoxidase (Gupta et al. 2012). In goat milk, the main serum proteins are β-lactoglobulin and α-lactalbumin, whereof β-lactoglobulin constitutes the largest proportion (Potočnik et al. 2011; Selvaggi et al. 2014).
2.3. Casein micelle Caseins are organised in casein micelles. The hydrophobic αs-CN and β-CN are present in the core, whereas κ-CN which is more hydrophilic is present in the surface region of the micelle. κ-CN contains carbohydrate groups providing a negative net charge and its hydrophilic part of the C-terminal reaches out from the surface of the micelle. This stabilizes the micelles from clotting and avoids precipitation from the milk serum. Inside the micelle, bonds between the casein molecules are to a large extent via nanoclusters of calcium phosphate. The bonding is through the phosphorylated serine residues present in the caseins. The β-CN contains less serine residues compared to αs-CN, hence β-CN is not as tightly bound to the micelle. Furthermore, colloidal calcium phosphate (CCP) present in the micelle is in a dynamic equilibrium with calcium and phosphates in the milk serum (Walstra et al. 2006; Skeie 2010). At enzymatic coagulation, the negative surface charge of the casein micelle is removed by the action of rennet. This leads to aggregation of the casein micelles, and through the action of calcium, a gel network is formed (Skeie et al. 2014).
2.4. Proteolytic activity Proteolysis of milk proteins can be ascribed to proteases of both endogenous and exogenous origin. In cow milk, around 70 enzymes of endogenous origin have been found. With some exceptions, the largest part of the native enzymes does not have an evident biological role in the production and secretion of milk (Fox & Kelly 2006). Proteolysis can occur in the udder prior to milking as well as during storage of the milk (Saeman et al. 1988; Kelly et al. 2006). Enzymes influence milk in several aspects. Enzymes may lead to deterioration of milk and such enzymes include LPL and proteases. Some enzymes can preserve milk quality such as lactoperoxidase and sulphydryl oxidase. Moreover, enzyme activity, such as of alkaline phosphatase, can be used as a processing indicator of proper heat treatment of milk. Nevertheless, most native enzymes are likely to have a function for the neonate or in the mammary gland (Fox & Kelly 2006).
2.4.1. Endogenous proteases Endogenous enzymes in milk may origin from different sources. One such is blood plasma, enzymes finding their way into milk via leaky junctions between mammary cells. Another way into milk is through the secretory cell cytoplasm, where enzymes are located within the fat globule during excretion from the cell. Moreover, enzymes may also exist in the milk fat globule membrane (MFGM)
15
since the membrane arises from the apical membrane of the mammary cell. Lastly, in bacterial infections, enzymes may come from somatic cells entering mammary gland from the blood (Fox & Kelly 2006).
The major endogenous proteolytic enzymes belong to the plasmin-plasminogen system. Plasmin (PL) is a serine proteinase originating from blood plasma and is organised in a complex system including its inactive zymogen plasminogen (PG) (Korycka-Dahl et al. 1983). The system also includes plasminogen activators (PA), plasminogen activator inhibitors and plasmin inhibitors (Bastian & Brown 1996; Fox & Kelly 2006). The conversion of PG to active PL entails that PAs cleave a specific peptide bond on PG. The PAs are serine proteinases located in the tissues of the mammary gland and in the milk (Korycka-Dahl et al. 1983). PL activity can also be increased by macrophages through their release of PAs (Albenzio et al. 2004). PL activity is also regulated by inhibitors that constrain the PAs (Korycha-Dahl et al. 1983). In milk, PL, PG, and PAs are associated with the casein micelle, while inhibitors are concentrated in the milk serum (Korycka-Dahl et al. 1983; Fox & Kelly 2006).
The heat stability of the PL and PG system has been studied for bovine milk (Lu & Nielsen 1993; Metwalli et al. 1998; Prado et al. 2006). PL has been observed to be relatively heat stable in the presence of caseins (Metwalli et al. 1998). Lu and Nielsen (1993) showed that PAs were not inactivated by pasteurization and to a large extent not either by UHT processing. However, the activity of PL and PAs also depend on the presence of PL inhibitors and PA inhibitors. Prado et al. (2006) studied the stability of PL and PA inhibitors in bovine milk after heat treatment at 74.5℃ for 15 s. The thermal inactivation of PA inhibitors in milk was 80% and PL inhibitors 36%. Subsequently, a high percentage of the PL inhibitors was preserved in the milk after heat treatment. The authors suggested the inactivation of the PA inhibitors was most likely the explanation for any increase in PL activity after pasteurization.
PL is specific in its action for peptide bonds with Lysine or Arginine at the N-terminal side (Fox & Kelly 2006). Moreover, PL seems to have a specificity for αS1-CN, αS2-CN and β-CN (Bastian & Brown 1996), of which β-CN is the main substrate (Fox & Kelly 2006). PL has only little or no action on κ-casein, α-lactalbumin and β-lactoglobulin (Fox & Kelly 2006). β-CN is hydrolysed into γ-CN and proteose peptones (Bastian & Brown 1996; Walstra et al. 2006). The amount of γ-CN in milk varies depending on the age and the storage temperature of the milk (Walstra et al. 2006).
Other milk proteases are cathepsin D and elastase, which are associated with leucocytes (somatic cells) (Fox & Kelly 2006; Albenzio & Santillo 2011). There are different types of cells, such as polymorphonuclear neutrophilic leucocytes (PMNL), macrophages and lymphocytes (Albenzio et al. 2015). In milk, these immune cells together with mammary epithelial cells, are known as somatic cells (Albenzio & Santillo 2011). In cow milk, it is suggested that mainly PL is responsible for proteolysis at low somatic cell count (SCC) with a smaller impact of cathepsin D. Consequently, the relative significance of plasmin decreases as cell count increases (Kelly et al. 2006). However, Albenzio et al. (2015) examined activities of PL, cathepsin D and elastase in goat milk with different levels of SCC. PL was most prevalent at high SCC (>1500 x 103 cells mL-1) milk, whereas cathepsin D and elastase activity were highest at medium level SCC (701 x 103-
16
1500 x 103 cells mL-1). Additionally, Rebucci et al. (2005) reported for late lactating goats that the PG derived activity was significantly lower in milk with high SCC than in milk with low SCC. They also reported that PG/PL ratio was significantly lower in milk with high SCC compared to milk with low SCC. They suggest their findings could indicate an elevated conversion of PG to PL due to an increase in PA activity.
Goat milk is reported to have a naturally higher SCC compared to cow milk (Paape et al. 2007; Albenzio et al. 2015). A level of 700,000 cells mL-1 is reported as a threshold for an altered immune status of the mammary gland in goats (Albenzio et al. 2015). Yet, values of SCC are varying and are reported between 200 and 1000 x103 mL-1 milk. In addition, the SCC increases with number of lactation and towards the end of lactation (Paape et al. 2007).
2.4.2. Exogenous proteases The microbiological quality of raw milk is of high importance for the processability of raw milk and shelf-life of dairy products. The predominant microflora of raw milk varies depending on environment, feeding management, breed (Zhang et al. 2020) and storage conditions (Kamilari et al. 2020; Zhang et al. 2020). In fresh raw milk 1-10% of the total bacterial count consist of psychrotrophic bacteria (Sorhaug & Stepaniak 1991). Mesophilic lactic acid bacteria are the dominating microflora of fresh raw milk (Zhang et al. 2020). At cool storage the growth of the mesophilic lactic acid microflora is inhibited (Skeie 2010). To prevent growth of spoilage microorganisms, it is common practise to refrigerate milk directly after milking (Kamilari et al. 2020). Wiking et al. (2002) observed that storage of milk at 4°C after milking, inhibited growth of total bacteria for 72 h. However, during this time the microflora was altered towards psychrotrophs. Kamilari et al. (2020) applied 16S rDNA high-throughput sequencing to examine the bacterial composition of goat milk samples stored at -80°C and 4°C respectively, for 16 hours after milking. Samples stored at -80°C primarily consisted of gram-negative genera such as Acinetobacter and Pseudomonas. In addition, the genera Chryseobacterium, Corynebacterium, Methylobacterium, Enhydrobacter, Bacterioides and Clostridium were found. In contrast, goat milk samples stored at 4°C experienced a decrease in bacterial species diversity and was dominated by the gram-negative Phyllobacterium.
Most psychrotrophic bacteria are susceptible to pasteurization temperatures but not their extracellular enzymes. Enzymes secreted are proteases and lipases and their action can lead to spoilage of milk and dairy products. Pseudomonas spp are known to secrete extracellular enzymes that hydrolyse milk protein and fat during cold storage (Walstra et al. 2006). In the study by Zhang et al. (2020) isolated Pseudomonas spp were able to exude proteases alone or together with lipases. These enzymes were found to be active during cold storage, indicating that cellular enzymes contribute to the degradation of milk protein and fat prior to processing.
Gasparini et al. (2020) found that cheese produced with raw milk samples containing psychrotrophic bacteria above seven log cfu mL-1 experienced an increased hardness and chewiness. In addition, an increased proteolysis was found in these samples. However, the count of psychrotrophic bacteria did not influence the overall sensory acceptance of the cheese. Furthermore, Alessandria et al. (2016)
17
investigated the microbiome of hard cheese made of raw milk. Their study found that the starter culture tended to dominate the cheese microbiota. However, in one production, contaminant bacteria such as P. acnes was present in the raw milk as in the cheese at the end of ripening. They underlined that despite of a starter culture, raw milk with low microbiological quality can affect the quality of the final product due to metabolic processes related to spoilage microorganisms.
2.5. Genetic profile Goats have a polymorphism at the CSN1S1 gene expressing the protein αS1-CN, of which some of the alleles are associated with a reduced expression of this protein (Mahé & Grosclaude 1989). Alleles A, B1, B2, B3, B4, C, H, L and M are high expressing ~3.5 g L-1, alleles E and I are intermediate expressing ~1.1 g L-1, while the F and G variants are low expressing ~0.45 g L-1. The null-variants 01, 02 and N only express traces of αS1-CN (Martin et al. 1999; Marletta et al. 2007).
Historically, a high frequency of the Norwegian goat population carried a deletion in exon 12 at the CSN1S1 gene. The deletion, called the Norwegian null allele (D) leads to zero or heavily reduced expression of αS1-CN (Devold et al. 2011; Skeie et al. 2014). In Norway, a new breeding strategy was launched in 2007, with the aim to reduce the number of defective null alleles in the population (Skeie et al. 2014). Over the years breeding animals have been introduced from Norway to Sweden. Thus, the Swedish goat population, with the Swedish landrace breed, is closely related to the Norwegian goat population (Svenska Getavelsförbundet 2015). In a previous study on Swedish goats, it was observed that among 283 goats, 65% showed low, 22% medium and only 12% strong expression of αS1-CN (Johansson et al. 2014). In another study of Swedish goats by Johansson et al. (2015) it was found that of 62 goats, 44% had a low expression of αS1-CN, 33% medium and 24% were strong expressing.
The study of Dagnachew et al. (2011) reported the defective null-allele to increase milk yield. However, milk with low level of αS1-CN have been found to have a significantly lower content of total protein and total casein compared to milk with high level of αS1-CN (Ambrosoli et al. 1988; Pierre et al. 1998; Clark & Sherbon 2000; Devold et al. 2011; Johansson et al. 2015). Studies have also reported a higher fat content in milk with high level of αS1-CN (Pierre et al. 1998; Clark & Sherbon 2000; Dagnachew et al. 2011). Studies have found a negative correlation between αS1-CN and pH (Ambrosoli et al. 1988; Pierre et al. 1998; Johansson et al. 2015). Moreover, a negative correlation has also been found between αS1-CN and total β-CN (Pierre et al. 1998) whereas a positive correlation with κ-CN (Inglingstad et al. 2014).
The Norwegian null allele has also been reported to correlate with an increased level of FFA and rancid flavour (Dagnachew et al. 2011). In the study by Cebo et al. (2012) it was demonstrated that the physicochemical characteristics of the milk fat globule membrane (MFGM) were affected by the genotype of the αs1-CN gene. In mid-lactation, they observed that milk with a low level of αs1-CN contained smaller milk fat globules with more polar lipids and higher surface charge, compared to fat globules of milk with a high level of αs1-CN. Consequently, the surface area was larger of fat globules in milk with low content of αs1-CN. These
18
differences were reduced at the beginning and end of lactation. They suggested that the larger surface area of the fat globules could lead to higher lipolysis by lipase and release of FFA.
2.6. Processing properties – cheese production To produce high quality cheese, milk should contain low SCC and bacterial count (Skeie 2014). Moreover, milk containing a high proportion of protein and fat will improve cheesemaking properties (Clark & Sherbon 2000). Additionally, studies have shown that a high content of αS1-CN improve cheesemaking properties due to a higher total protein content and lower pH leading to a firmer gel (Ambrosoli et al. 1988; Johansson et al. 2015). Furthermore, milk with low levels of αS1-CN have larger casein micelles (Devold et al. 2011; Inglingstad et al. 2014). This is to some extent explained by the fact that these micelles are more hydrated (Devold et al. 2011). Several studies have investigated the coagulation time, coagulation rate and curd firmness related to the content of αs1-CN. In the studies by Devold et al. (2011) and Johansson et al. (2015) the coagulation time tended to be longer in milk with low level of αS1-CN when compared to milk with high level of αS1-CN. Whereas other studies have reported the coagulation time to be longer for milk with high content of αS1-CN (Ambrosoli et al. 1988; Clark & Sherbon 2000). Moreover, Inglingstad et al. (2014) found the coagulation rate to be lower in milk from goats homozygous of the null allele. In addition, studies have reported a positive correlation between gel firmness and milk with high level of αS1-CN (Ambrosoli et al. 1988; Clark & Sherbon 2000; Devold et al. 2011; Inglingstad et al. 2014; Johansson et al. 2015). Thus, goat milk containing a low level of αS1-CN may not produce an appropriately firm gel. This can lead to a decreased cheese yield, since casein not properly bound to the casein gel network, could easily be lost in the whey (Skeie et al. 2014). Furthermore, Grosclaude et al. (1994) observed differences in firmness of cheese resulting from milk with low and high levels αs1-CN, respectively. Cheese produced from milk with high level of αs1-CN was firmer and had a less pronounced goat flavor. In addition, Skeie et al. (2014) reported that cheese made of milk with low level αs1-CN had higher moisture content. Moreover, it was found that milk with high level of αs1-CN contained a higher Ca-ion activity compared to milk with low αs1-CN level (Devold et al. 2011). Calcium is essential for hydrophillic interactions and for interactions between and within the casein micelles (Walstra et al. 2006).
Proteolysis is reported to have both positive and negative effects on milk and dairy products (Ismail & Nielsen 2010). A positive effect is the flavour and texture development in cheese during ripening (McSweeney 2004). In addition, proteolysis in cheese during ripening can result in bitter compounds leading to off-flavors in the final cheese (McSweeney 2004). Proteolysis in the maturing cheese is mainly attributed to rennet. Other sources are plasmin and cellular enzymes from the raw milk, as well as proteases of starter cultures, non-starters and secondary cultures (Sousa et al. 2001). Nevertheless, proteolysis in milk before curd separation could negatively impact the production yield since peptides from proteolysis will be lost in the whey (Walstra et al. 2006). In the study by Wiking et al. (2002) there was a higher proteolysis at day one in raw milk samples stored at 4°C compared to 8°C,
19
which is suggested to be related to the higher dissociation of β-CN from the casein micelle at the lower temperature. At low temperatures hydrophobic bonds within the casein micelle weaken leading to β-CN, which is the most hydrophobic casein, dissolving from the micelle into the serum (Walstra et al. 2006).
Leitner et al. (2008) found that an increase of SCC from 450 to 840 x 103 mL-1
gave a curd loss of 3.3% and a SCC exceeding 1600 x 103 mL-1 gave a curd loss of 9.8%. Additionally, in goat cheese, SCC have been observed to be positively correlated with the level of FFA (Sánchez-Macías et al. 2013). According to the study of Eknæs & Skeie (2006) rancid and tart flavors of goat milk are associated with a high content of FFA. In goat milk, LPL is bound to the milk fat globule, while in cow milk, LPL is associated with the casein micelle. Hence, goat milk fat is readily available for LPL. Mechanical disruption of the globules due to processing can release triacylglycerides and lead to lipolytic action and the formation of FFA (Skeie et al. 2014).
2.7. Total proteolysis – analytical method Proteolysis results in an increased number of peptides and free amino acids in the milk (Walstra et al. 2006). Thus, total proteolysis can be determined by measuring the amount of terminal amino groups produced by proteolysis, e.g. by use of the fluorescamine method. In this method, peptides and free amino acids are separated from proteins by precipitation with trichloroacetic acid (TCA) (Wiking et al. 2002). Fluorescamine is added to develop a fluorescent product from its reaction with primary amino groups (Castell et al. 1979). Other quantitative methods are also available for proteolysis determination, e.g. by RP-HPLC. This technique is superior compared to the fluorescamine method based on its accuracy, sensitivity, and reproducibility. However, the HPLC equipment is more expensive, and has a relatively low upper limit for detection. Thus, the fluorescamine method is still commonly used (Chove et al. 2011).
2.8. Plasmin and plasminogen – analytical method PL and PG derived activity can be determined by adding a chromogenic substrate to the milk serum, which reaction product is measured as a change in absorbance and reflects the PL activity. To do so, PL and PG are dissociated from the casein micelle. The chromogenic substrate, pyro-Glu-Phe-Lys-p-nitroanilide hydroxychloride, contains a peptide sequence which is cleaved by PL. The cleavage results in the product p-nitroanilide, that can be measured as a change in absorbance at 405 nm (Korycka-Dahl et al. 1983). Moreover, the activity of plasminogen is measured by activation of PG to PL with urokinase (Korycka-Dahl et al. 1983: Politis et al. 1992). Urokinase is a serine protease that converts PG to the active form PL (Crippa 2007).
20
3.1. Milk samples and storage In total 75 samples of raw goat milk were collected from five different farms in Sweden. Milk samples from each farm were sent frozen to SLU, and upon their arrival, samples were kept in a freezer at -20°C prior to analysis.
Prior to this thesis, the samples had been externally characterized concerning gross composition, SCC and DNA sequencing at the Department of Animal Nutrition and Management, SLU. The procedures for these analyses are not described in detail in this thesis. Gross composition was analyzed by mid-infrared spectroscopy method (Fourier Transform Infrared Spectroscopy; FTIR); (FOSS Electric A/S (Hilleröd, Denmark). Somatic cell count (SCC) was analysed by electronic fluorescence-based cell counting (Fossomatic Foss FT 120, Hilleröd, Denmark). Sequencing of DNA was performed with the BigDye® Direct Cycle Sequencing Kit from Applied Biosystems® by Life TechnologiesTM as described in Björk (2018). Free fatty acids (FFA) and protein profile were previously analyzed at the Department of Molecular Sciences, SLU. FFA were analyzed by an extraction-titration method according to Vidanarachchi et al. (2015). The protein profile was analysed by capillary electrophoresis (CE) (Agilent Technologies 7100, Capillary electrophoresis) according to Johansson et al. (2013).
3.2. Sample preparation Milk samples were defatted prior to determination of total proteolysis, PL and PG derived activity. Defatting of milk samples was done by centrifugation. For this, 2 ml of a milk sample was centrifuged (2093 x g, 4°C, 10 min, Himac CT 15RE; Hitachi Koki Co., Ltd.) using a T15A61 rotor. After the centrifugation, the fat layer on top of each sample was removed with a cotton stick. If not analyzed the same day as defatting, samples were stored in -20°C up until analysis.
3. Experimental procedures
21
3.3. Analysis of total proteolysis The following procedures were carried out to determine total proteolysis (eq. mM leucine) in the goat milk. Procedures were performed according to Wiking et al. (2002) and modified according to Johansson et. al (2017).
A trichloroacetic acid (TCA) (24%) solution was used to precipitate the milk proteins. It was prepared by dissolving 12 g of TCA (Sigma Aldrich, CAS no: 76-03-9) in distilled water to the final volume of 50 ml. Moreover, L-leucine standards (1.0, 0.75, 0.5, 0.3, 0.05 mM L-leucine) were prepared for the analysis. A 0.1M L-leucine solution was prepared by dissolving 66.1 g L-leucine (Sigma Aldrich, CAS no: L8000) in 1mM HCl (Merck KGaA, CN: 100317) to the final volume of 5 ml. Fluorescamine (0.2 mg/ml) was used as a reactant to measure the fluorescence. The fluorescamine solution was prepared by dissolving 10 mg fluorescamine (Sigma Aldrich, CAS no: 38183-12-9) in 50 ml acetone (Merck KGaA, CAS no: 67-64-1). Furthermore, a sodium tetraborate buffer (0.10 M) was made daily for the measurements. To prepare the buffer, 503.1 mg sodium borate (Sigma Aldrich, CAS no: 1303-96-4) was dissolved in 18 ml distilled water. Then, the pH of the buffer was measured (Mettler Toledo, SevenCompact pH-meter S210) and adjusted to pH 8.0 by addition of 1M HCL. After the pH adjustment, distilled water was added to the final volume of 25 ml.
To precipitate the proteins, 0.5 ml milk sample was mixed with 0.5 ml TCA in an Eppendorf tube and left on ice for 30 minutes. Subsequently, samples were centrifuged (21 500 x g, 4°C, 20 min, Himac CT 15RE; Hitachi Koki Co., Ltd.) using a T15A61 rotor. The supernatant from each sample was transferred to an Eppendorf tube and kept on ice until analysis on the same day. Supernatant that was not used for analysis the same day, was stored at -20°C.
Following, 20 µl of each supernatant was mixed with 600 µl of the sodium tetraborate buffer (0.10 M) in an Eppendorf tube. Then, 200 µl of the fluorescamine solution was added. In parallel with the goat milk samples, pasteurized, non-homogenized cow milk was used as a control. As a blank, 620 µl tetraborate buffer and 200 µl fluorescamine solution were used.
For the luminescence measurement, 200 µl of each sample, was added in triplicates to a 96-well microplate (Sarstedt, Nümbrecht, Germany). Samples were measured 35 minutes after addition of fluorescamine. Luminescence spectrometer (Perkin Elmer LS55, Waltham, USA) was used for the detection of the fluorescence. The setup of parameters was as follow; excitation wavelength 390, emission wavelength 480, excitation slit 10.0, emission slit 10.0, emission filter 430 nm cut-off, number of measurement cycles 1, read time per well 0.10 sec, cycle time per plate 120 sec. The software FL Winlab version 4.00.03 (PerkinElmer) was used for the measurement.
3.4. Analysis of plasmin and plasminogen The following procedures were carried out for the detection of PL and PG derived activity in the goat milk. Procedures were performed according to Korycka-Dahl et al. (1983) and modified by de Vries et al. (2016). Chemicals, if not stated differently, were obtained from Sigma-Aldrich, Germany.
22
Plasmin buffer was prepared by dissolving 2.62 g of 20 mM 6-aminocaproic acid (EACE) (Mw 131.17), 8.35 g of 53 mM Trizma hydrochloride (Mw 157.6) and 6.84 g of 117 mM NaCl (Mw 58.44) and by adjusting pH to 7.4 (Mettler Toledo, SevenCompact pH-meter S210) with 1M NaOH.
The frozen, defatted milk samples were defrosted at room temperature. To dissociate PL and PG from the casein micelles, 320 µl of the milk sample was incubated with 4680 µl of the plasmin buffer at room temperature for two hours and subsequently followed by ultracentrifugation. For the ultracentrifugation, 3.9 ml of each sample was added to a Beckman Coulter plastic tube. Samples were centrifuged at 100 000 x g, 4°C for 60 minutes (OptimaTM MAX-XP, Beckman Coulter, Inc., Bromma, Sweden) using a RP55T angle rotor. After the centrifugation, the supernatant (serum) was collected and divided into 1.5 ml aliquots and kept at -20°C.
For the PL and PG derived activity measurement, a chromogenic substrate (pyro-GLU-Phe-Lys-p-nitroanilide hydroxychloride) was used. The substrate was prepared by mixing 10 ml of distilled water with 25 mg chromogenic substrate (Biophen CS-41(03); Hyphen BioMed, Neuville Sur Oise, France). The substrate was divided into one ml aliquots and stored at 4°C up until analysis. The PG derived activity was measured by activation of PG into PL with urokinase from human kidney cells (U4010-10KU; Sigma-Aldrich, Co., St Louise, MO, USA). The urokinase solution was prepared by mixing 600 µl distilled water with 13.1 mg urokinase. The urokinase solution was divided into 100 µl aliquots and kept at -20°C.
For PL and PG determination, 650 µl of milk serum was mixed with 173 µl of the chromogenic substrate in an Eppendorf tube. Next, 190 µl of the milk serum-substrate mixture was loaded in duplicates on a micro well plate (Sarstedt, Nümbrecht, Germany). To the remaining volume in the tube, 10.5 µl of the urokinase solution was added for activation of plasminogen to plasmin. Then, 190 µl of the solution was loaded in duplicates on the microwell plate. As a control, cow milk was prepared according to the same procedure. For the blank, 200 µl of the plasmin buffer was loaded in triplicate. The analysis was carried out on a multi-mode microplate reader (FLUOstar Omega, BMG Labtech, Ortenberg, Germany). Absorbance was measured at 405 nm for 120 minutes and the following set up of parameters was applied; samples were run 41 cycles, 3 minutes per cycle, at 37°C.
The PL and PG derived activities correspond to a change in absorbance per time unit (ΔA405/Δt). PL and PG are stated as units mL-1, where one unit corresponds to the amount of enzyme producing a change in absorbance at 405 nm of 0.001 per minute at pH 7.4 and 37°C (de Vries et al. 2016). In addition, the rate at which p-nitroanilide is formed, was calculated from the part of the absorbance/time curve showing a linear mode. Moreover, to calculate plasminogen derived activity, the difference between total activity (the activity measured after activation of PG to PL by urokinase) and plasmin activity was used (de Vries et al. 2016).
3.5. Statistical analysis Merely, the analyses for proteolytic activity i.e., total proteolysis, plasmin activity and plasminogen derived activity, were carried out within this work. The data for
23
the gross composition, SCC, protein profile, FFA, pH and genotypes were obtained as raw data and statistically analysed together with the data generated in this study.
The statistical analysis was performed using the Minitab® software version 19.2020.1 (Minitab Inc., United States). The population was categorized in two ways, according to the level of αS1-CN in the milk (Johansson et al. 2014) and the genotype, respectively (Devold et al. 2011). The frequency of goats producing high levels of αS1-CN was low. To obtain reliable results in terms of number of samples, medium and high producing goats were clustered. Likewise, few goats carried an A allele, why all genotypes containing an A allele were clustered. The DD and DG genotype were each in a separate group. The arrangement of alleles was done according to Devold et al. (2011) who classified the D allele as a null allele in terms of αS1-CN. Similarly, G allele is classified as a weak allele, while A is classified as a strong allele (Martin et al. 1999).
Correlation coefficients of milk traits were determined using Pearson and Spearman correlation coefficients. Data for SCC, αS1-CN and plasmin were log-transformed to obtain normal distribution.
A Two-Sample T-test was applied where two groups were investigated (low and medium-high). Data for total protein, SCC, FFA, PL and PG were log-transformed to obtain normal distribution. For non-normally distributed data (total whey protein and total casein), the nonparametric test Mann-Whitney was applied.
A One-way Analysis of variance (ANOVA) was applied where more than two groups were tested (genotypes). In addition, a Tukey-test was used for pairwise comparison of means for statistical relationships. For data where equal variances could not be assumed, the Games-Howell method was used for comparison. Data for total protein, total fat, total whey protein, total casein, αS1-CN, κ-CN, SCC, FFA, pH, total proteolysis, PL and PG were log-transformed to obtain normal distribution. Also, for genotypes the nonparametric test Mann-Whitney was used for non-normally distributed data (β-CN).
Lastly, a Chi-square test was applied to determine if the presence of certain genotypes was different between groups based on the expression level of αS1-CN.
24
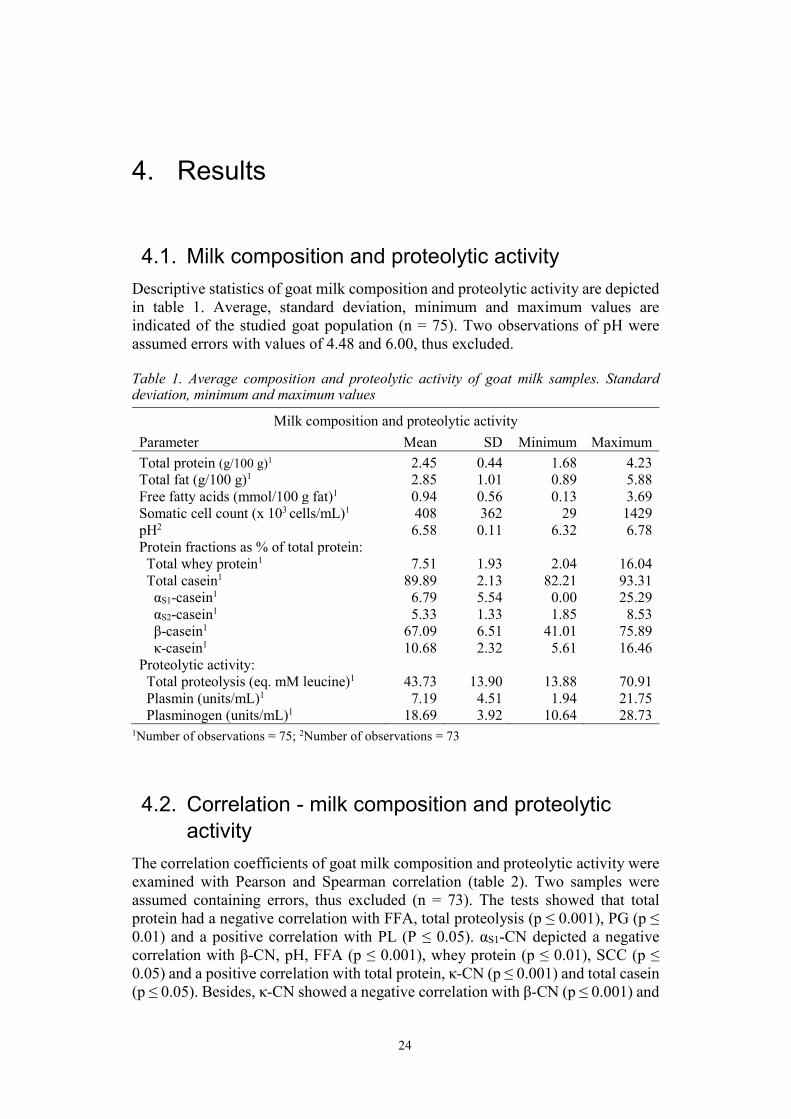
4.1. Milk composition and proteolytic activity Descriptive statistics of goat milk composition and proteolytic activity are depicted in table 1. Average, standard deviation, minimum and maximum values are indicated of the studied goat population (n = 75). Two observations of pH were assumed errors with values of 4.48 and 6.00, thus excluded.
Table 1. Average composition and proteolytic activity of goat milk samples. Standard deviation, minimum and maximum values
Milk composition and proteolytic activity Parameter Mean SD Minimum Maximum
Total protein (g/100 g)1 2.45 0.44 1.68 4.23 Total fat (g/100 g)1 2.85 1.01 0.89 5.88 Free fatty acids (mmol/100 g fat)1 0.94 0.56 0.13 3.69 Somatic cell count (x 103 cells/mL)1 408 362 29 1429 pH2 6.58 0.11 6.32 6.78 Protein fractions as % of total protein: Total whey protein1 7.51 1.93 2.04 16.04 Total casein1 89.89 2.13 82.21 93.31 αS1-casein1 6.79 5.54 0.00 25.29 αS2-casein1 5.33 1.33 1.85 8.53 β-casein1 67.09 6.51 41.01 75.89 κ-casein1 10.68 2.32 5.61 16.46 Proteolytic activity: Total proteolysis (eq. mM leucine)1 43.73 13.90 13.88 70.91 Plasmin (units/mL)1 7.19 4.51 1.94 21.75 Plasminogen (units/mL)1 18.69 3.92 10.64 28.73
1Number of observations = 75; 2Number of observations = 73
4.2. Correlation - milk composition and proteolytic activity
The correlation coefficients of goat milk composition and proteolytic activity were examined with Pearson and Spearman correlation (table 2). Two samples were assumed containing errors, thus excluded (n = 73). The tests showed that total protein had a negative correlation with FFA, total proteolysis (p ≤ 0.001), PG (p ≤ 0.01) and a positive correlation with PL (P ≤ 0.05). αS1-CN depicted a negative correlation with β-CN, pH, FFA (p ≤ 0.001), whey protein (p ≤ 0.01), SCC (p ≤ 0.05) and a positive correlation with total protein, κ-CN (p ≤ 0.001) and total casein (p ≤ 0.05). Besides, κ-CN showed a negative correlation with β-CN (p ≤ 0.001) and
4. Results
25
a positive correlation with total casein (p ≤ 0.001) and total fat (p ≤ 0.01). Furthermore, total casein (p ≤ 0.001) and total fat (p ≤ 0.05) depicted a negative correlation with total whey protein. SCC indicated a positive correlation with PL (p ≤ 0.001). FFA (p ≤ 0.001) and total proteolysis (p ≤ 0.05) depicted a positive correlation with pH. Besides, FFA showed a positive correlation with PG (p ≤ 0.05).
26
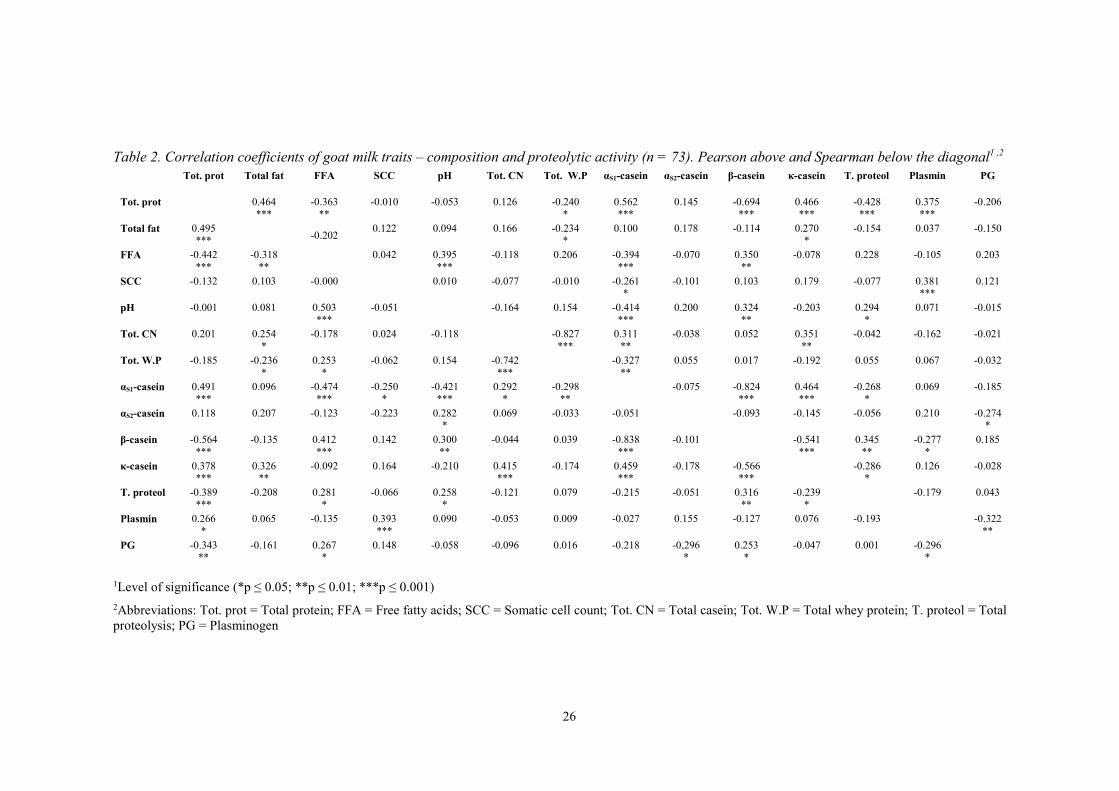
Table 2. Correlation coefficients of goat milk traits – composition and proteolytic activity (n = 73). Pearson above and Spearman below the diagonal1 ,2
Tot. prot Total fat FFA SCC pH Tot. CN Tot. W.P αS1-casein αS2-casein β-casein κ-casein T. proteol Plasmin PG
Tot. prot 0.464 ***
-0.363 **
-0.010 -0.053 0.126 -0.240 *
0.562 ***
0.145 -0.694 ***
0.466 ***
-0.428 ***
0.375 ***
-0.206
Total fat 0.495 ***
-0.202 0.122 0.094 0.166 -0.234 *
0.100 0.178
-0.114 0.270 *
-0.154 0.037 -0.150
FFA -0.442 ***
-0.318 **
0.042 0.395 ***
-0.118 0.206 -0.394 ***
-0.070 0.350 **
-0.078 0.228
-0.105 0.203
SCC -0.132 0.103 -0.000 0.010 -0.077 -0.010 -0.261 *
-0.101 0.103 0.179 -0.077 0.381 ***
0.121
pH -0.001 0.081 0.503 ***
-0.051 -0.164 0.154 -0.414 ***
0.200 0.324 **
-0.203 0.294 *
0.071 -0.015
Tot. CN 0.201 0.254 *
-0.178 0.024 -0.118 -0.827 ***
0.311 **
-0.038 0.052 0.351 **
-0.042 -0.162 -0.021
Tot. W.P -0.185
-0.236 *
0.253 *
-0.062 0.154 -0.742 ***
-0.327 **
0.055 0.017 -0.192 0.055 0.067 -0.032
αS1-casein 0.491 ***
0.096 -0.474 ***
-0.250 *
-0.421 ***
0.292 *
-0.298 **
-0.075 -0.824 ***
0.464 ***
-0.268 *
0.069 -0.185
αS2-casein 0.118 0.207 -0.123 -0.223 0.282 *
0.069 -0.033 -0.051 -0.093 -0.145 -0.056 0.210 -0.274 *
β-casein -0.564 ***
-0.135 0.412 ***
0.142 0.300 **
-0.044 0.039 -0.838 ***
-0.101 -0.541 ***
0.345 **
-0.277 *
0.185
κ-casein 0.378 ***
0.326 **
-0.092 0.164 -0.210 0.415 ***
-0.174 0.459 ***
-0.178 -0.566 ***
-0.286 *
0.126 -0.028
T. proteol -0.389 ***
-0.208 0.281 *
-0.066 0.258 *
-0.121 0.079 -0.215 -0.051 0.316 **
-0.239 *
-0.179 0.043
Plasmin 0.266 *
0.065 -0.135 0.393 ***
0.090 -0.053 0.009 -0.027 0.155 -0.127 0.076 -0.193 -0.322 **
PG -0.343 **
-0.161 0.267 *
0.148 -0.058 -0.096 0.016 -0.218 -0,296 *
0.253 *
-0.047 0.001 -0.296 *
1Level of significance (*p ≤ 0.05; **p ≤ 0.01; ***p ≤ 0.001) 2Abbreviations: Tot. prot = Total protein; FFA = Free fatty acids; SCC = Somatic cell count; Tot. CN = Total casein; Tot. W.P = Total whey protein; T. proteol = Total proteolysis; PG = Plasminogen
27
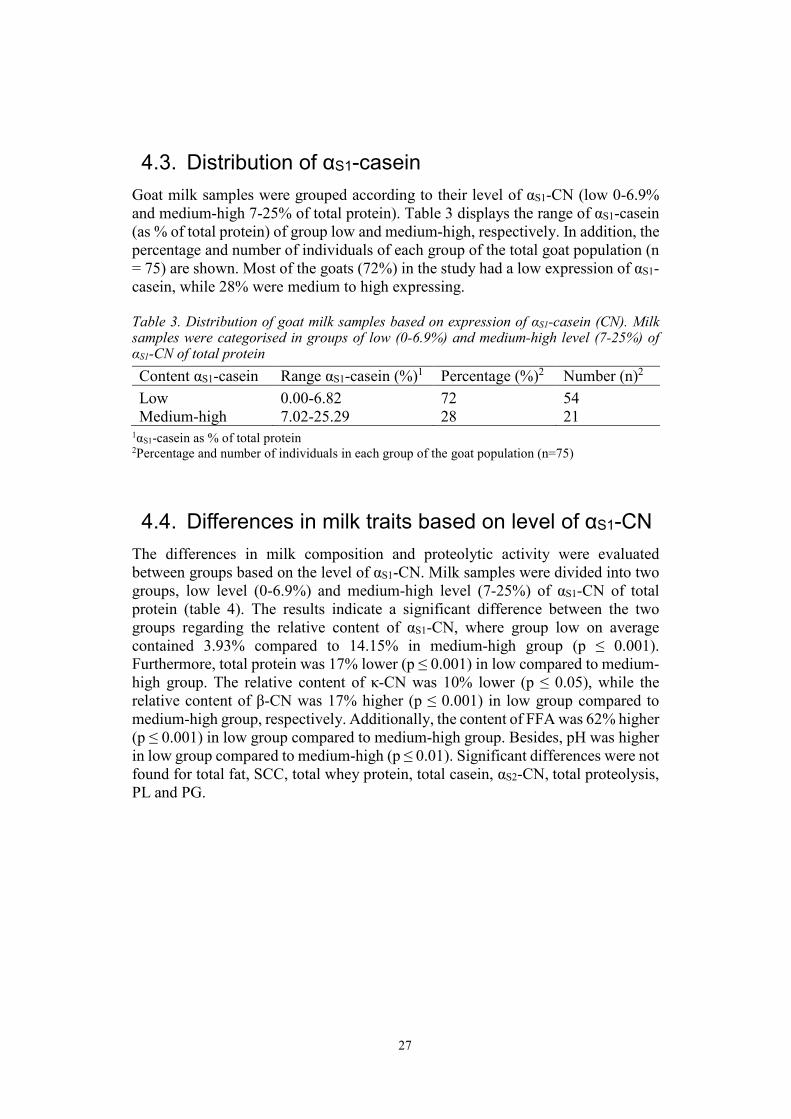
4.3. Distribution of αS1-casein Goat milk samples were grouped according to their level of αS1-CN (low 0-6.9% and medium-high 7-25% of total protein). Table 3 displays the range of αS1-casein (as % of total protein) of group low and medium-high, respectively. In addition, the percentage and number of individuals of each group of the total goat population (n = 75) are shown. Most of the goats (72%) in the study had a low expression of αS1-casein, while 28% were medium to high expressing.
Table 3. Distribution of goat milk samples based on expression of αS1-casein (CN). Milk samples were categorised in groups of low (0-6.9%) and medium-high level (7-25%) of αS1-CN of total protein
Content αS1-casein Range αS1-casein (%)1 Percentage (%)2 Number (n)2
Low 0.00-6.82 72 54 Medium-high 7.02-25.29 28 21
1αS1-casein as % of total protein 2Percentage and number of individuals in each group of the goat population (n=75)
4.4. Differences in milk traits based on level of αS1-CN The differences in milk composition and proteolytic activity were evaluated between groups based on the level of αS1-CN. Milk samples were divided into two groups, low level (0-6.9%) and medium-high level (7-25%) of αS1-CN of total protein (table 4). The results indicate a significant difference between the two groups regarding the relative content of αS1-CN, where group low on average contained 3.93% compared to 14.15% in medium-high group (p ≤ 0.001). Furthermore, total protein was 17% lower (p ≤ 0.001) in low compared to medium-high group. The relative content of κ-CN was 10% lower (p ≤ 0.05), while the relative content of β-CN was 17% higher (p ≤ 0.001) in low group compared to medium-high group, respectively. Additionally, the content of FFA was 62% higher (p ≤ 0.001) in low group compared to medium-high group. Besides, pH was higher in low group compared to medium-high (p ≤ 0.01). Significant differences were not found for total fat, SCC, total whey protein, total casein, αS2-CN, total proteolysis, PL and PG.
28
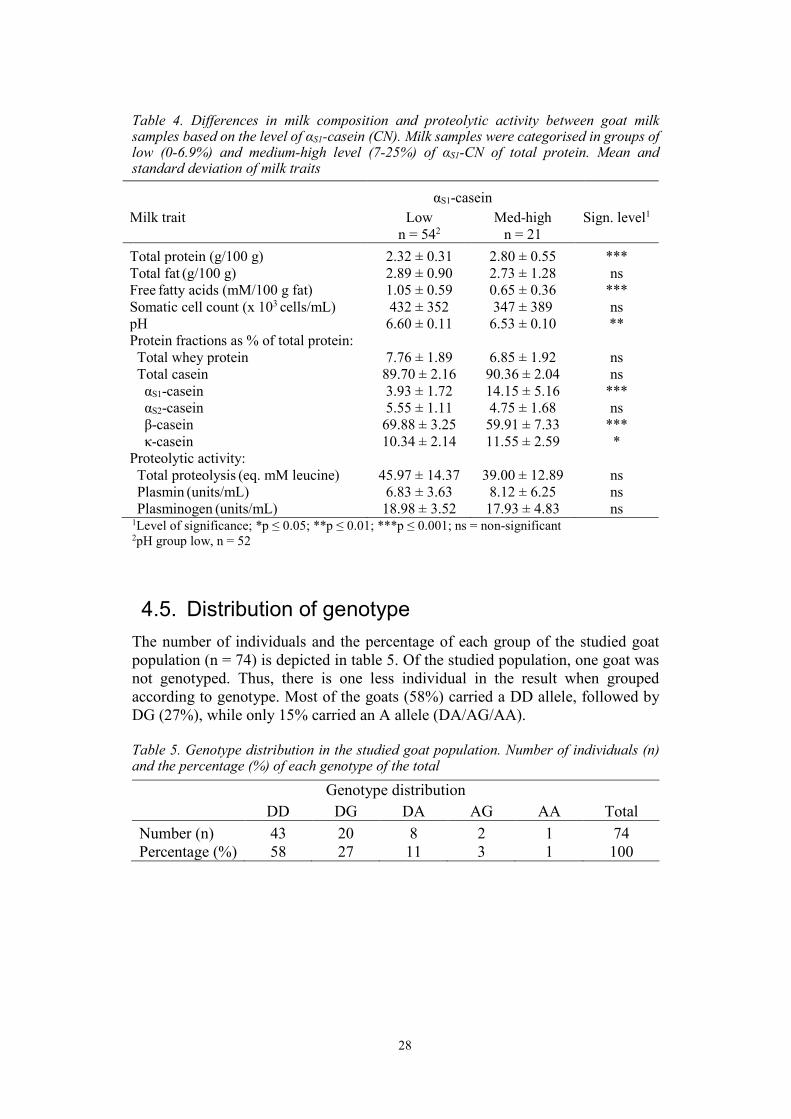
Table 4. Differences in milk composition and proteolytic activity between goat milk samples based on the level of αS1-casein (CN). Milk samples were categorised in groups of low (0-6.9%) and medium-high level (7-25%) of αS1-CN of total protein. Mean and standard deviation of milk traits
αS1-casein
Milk trait Low n = 542
Med-high n = 21
Sign. level1
’
Total protein (g/100 g) 2.32 ± 0.31 2.80 ± 0.55 *** Total fat (g/100 g) 2.89 ± 0.90 2.73 ± 1.28 ns Free fatty acids (mM/100 g fat) 1.05 ± 0.59 0.65 ± 0.36 *** Somatic cell count (x 103 cells/mL) 432 ± 352 347 ± 389 ns pH 6.60 ± 0.11 6.53 ± 0.10 ** Protein fractions as % of total protein: Total whey protein 7.76 ± 1.89 6.85 ± 1.92 ns Total casein 89.70 ± 2.16 90.36 ± 2.04 ns αS1-casein 3.93 ± 1.72 14.15 ± 5.16 *** αS2-casein 5.55 ± 1.11 4.75 ± 1.68 ns β-casein 69.88 ± 3.25 59.91 ± 7.33 *** κ-casein 10.34 ± 2.14 11.55 ± 2.59 * Proteolytic activity: Total proteolysis (eq. mM leucine) 45.97 ± 14.37 39.00 ± 12.89 ns Plasmin (units/mL) 6.83 ± 3.63 8.12 ± 6.25 ns Plasminogen (units/mL) 18.98 ± 3.52 17.93 ± 4.83 ns 1Level of significance; *p ≤ 0.05; **p ≤ 0.01; ***p ≤ 0.001; ns = non-significant 2pH group low, n = 52
4.5. Distribution of genotype The number of individuals and the percentage of each group of the studied goat population (n = 74) is depicted in table 5. Of the studied population, one goat was not genotyped. Thus, there is one less individual in the result when grouped according to genotype. Most of the goats (58%) carried a DD allele, followed by DG (27%), while only 15% carried an A allele (DA/AG/AA).
Table 5. Genotype distribution in the studied goat population. Number of individuals (n) and the percentage (%) of each genotype of the total
Genotype distribution
DD DG DA AG AA Total
Number (n) 43 20 8 2 1 74 Percentage (%) 58 27 11 3 1 100
29
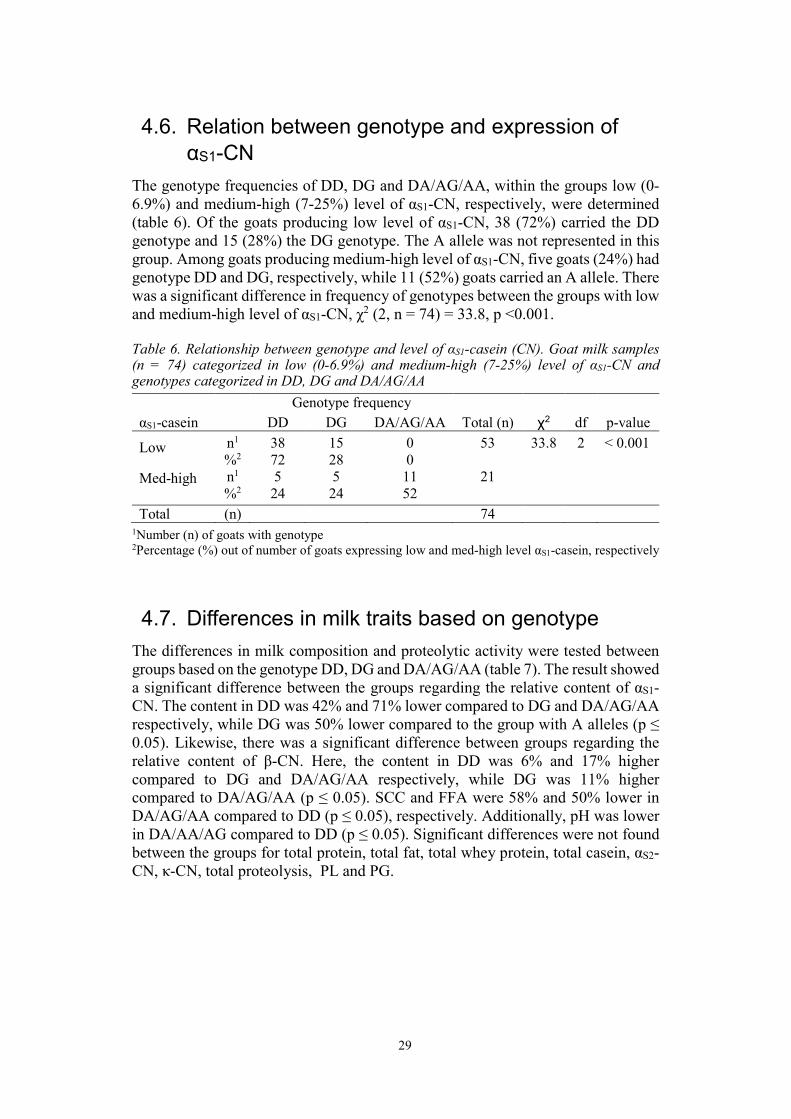
4.6. Relation between genotype and expression of αS1-CN
The genotype frequencies of DD, DG and DA/AG/AA, within the groups low (0-6.9%) and medium-high (7-25%) level of αS1-CN, respectively, were determined (table 6). Of the goats producing low level of αS1-CN, 38 (72%) carried the DD genotype and 15 (28%) the DG genotype. The A allele was not represented in this group. Among goats producing medium-high level of αS1-CN, five goats (24%) had genotype DD and DG, respectively, while 11 (52%) goats carried an A allele. There was a significant difference in frequency of genotypes between the groups with low and medium-high level of αS1-CN, χ2 (2, n = 74) = 33.8, p <0.001.
Table 6. Relationship between genotype and level of αS1-casein (CN). Goat milk samples (n = 74) categorized in low (0-6.9%) and medium-high (7-25%) level of αS1-CN and genotypes categorized in DD, DG and DA/AG/AA
Genotype frequency
αS1-casein DD DG DA/AG/AA Total (n) χ2 df p-value
Low
n1
%2 38 72
15 28
0 0
53
33.8 2 < 0.001
Med-high
n1 %2
5 24
5 24
11 52
21
Total (n) 74 1Number (n) of goats with genotype 2Percentage (%) out of number of goats expressing low and med-high level αS1-casein, respectively
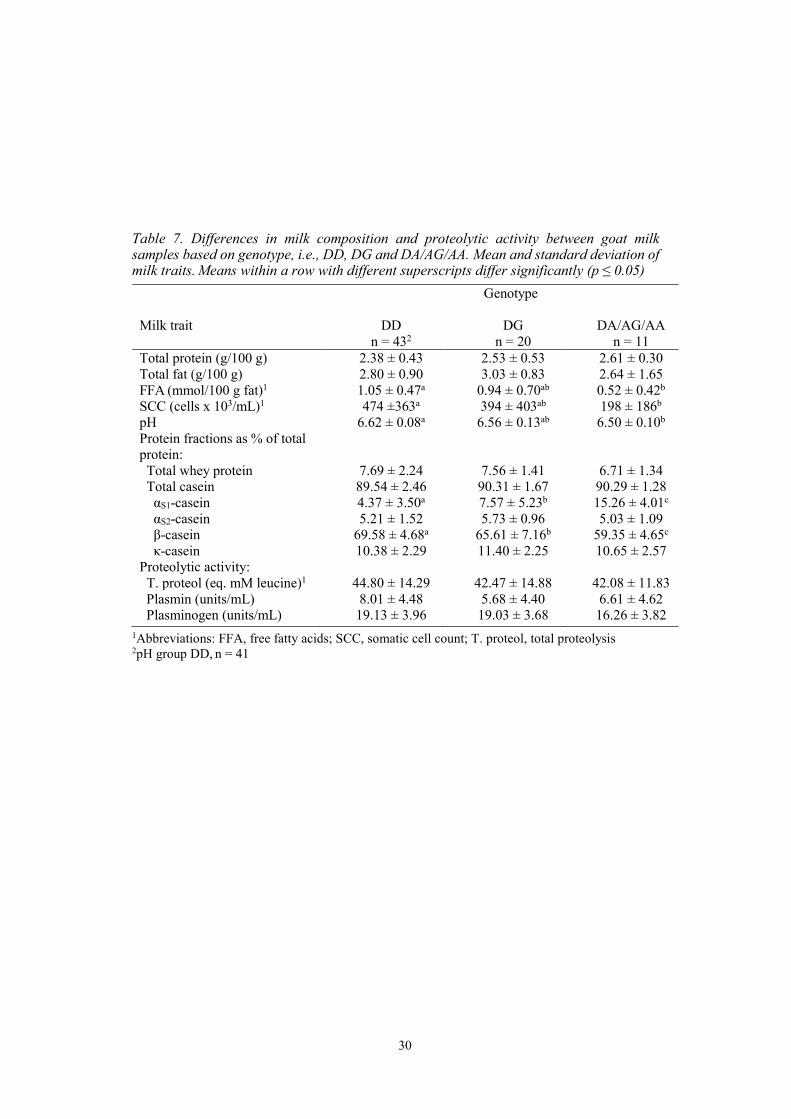
4.7. Differences in milk traits based on genotype The differences in milk composition and proteolytic activity were tested between groups based on the genotype DD, DG and DA/AG/AA (table 7). The result showed a significant difference between the groups regarding the relative content of αS1-CN. The content in DD was 42% and 71% lower compared to DG and DA/AG/AA respectively, while DG was 50% lower compared to the group with A alleles (p ≤ 0.05). Likewise, there was a significant difference between groups regarding the relative content of β-CN. Here, the content in DD was 6% and 17% higher compared to DG and DA/AG/AA respectively, while DG was 11% higher compared to DA/AG/AA (p ≤ 0.05). SCC and FFA were 58% and 50% lower in DA/AG/AA compared to DD (p ≤ 0.05), respectively. Additionally, pH was lower in DA/AA/AG compared to DD (p ≤ 0.05). Significant differences were not found between the groups for total protein, total fat, total whey protein, total casein, αS2-CN, κ-CN, total proteolysis, PL and PG.
30
Table 7. Differences in milk composition and proteolytic activity between goat milk samples based on genotype, i.e., DD, DG and DA/AG/AA. Mean and standard deviation of milk traits. Means within a row with different superscripts differ significantly (p ≤ 0.05)
Genotype
Milk trait DD DG DA/AG/AA n = 432 n = 20 n = 11
Total protein (g/100 g) 2.38 ± 0.43 2.53 ± 0.53 2.61 ± 0.30 Total fat (g/100 g) 2.80 ± 0.90 3.03 ± 0.83 2.64 ± 1.65 FFA (mmol/100 g fat)1 1.05 ± 0.47a 0.94 ± 0.70ab 0.52 ± 0.42b SCC (cells x 103/mL)1 474 ±363a 394 ± 403ab 198 ± 186b pH 6.62 ± 0.08a 6.56 ± 0.13ab 6.50 ± 0.10b Protein fractions as % of total protein:
Total whey protein 7.69 ± 2.24 7.56 ± 1.41 6.71 ± 1.34 Total casein 89.54 ± 2.46 90.31 ± 1.67 90.29 ± 1.28 αS1-casein 4.37 ± 3.50a 7.57 ± 5.23b 15.26 ± 4.01c αS2-casein 5.21 ± 1.52 5.73 ± 0.96 5.03 ± 1.09 β-casein 69.58 ± 4.68a 65.61 ± 7.16b 59.35 ± 4.65c κ-casein 10.38 ± 2.29 11.40 ± 2.25 10.65 ± 2.57 Proteolytic activity: T. proteol (eq. mM leucine)1 44.80 ± 14.29 42.47 ± 14.88 42.08 ± 11.83 Plasmin (units/mL) 8.01 ± 4.48 5.68 ± 4.40 6.61 ± 4.62 Plasminogen (units/mL) 19.13 ± 3.96 19.03 ± 3.68 16.26 ± 3.82
1Abbreviations: FFA, free fatty acids; SCC, somatic cell count; T. proteol, total proteolysis 2pH group DD, n = 41
31
5.1. Distribution of αs1-CN and genotype The aim of this study was to investigate if the expression of αS1-CN and genetic profile of the CSN1S1 gene influence proteolytic activity and composition in milk from Swedish dairy goats. The expression of αS1-CN within the Swedish goat population has been studied by Johansson et al. (2014) and the distribution of alleles of the CSN1S1 gene has been studied in a master thesis by Björk (2018). In addition, in the closely related Norwegian goat population, the deletion in exon 12 of the CSN1S1 gene has been well studied (Hayes et al. 2006; Dagnachew et al. 2011; Devold et al. 2011).
In the current study, the distribution of goats producing low (72%) and medium-high (28%) level of αS1-CN, was similar to the distribution seen in the study by Johansson et al. (2014). Moreover, the frequency of individuals homozygous for the Norwegian null allele (DD) was 58%. This was lower compared to the findings by Björk (2018) where 94% of the 48 goats were genotyped as DD. The frequency of DD genotypes was also lower than in the study by Devold et al. (2011). They found that 70% of the Norwegian goats were homozygous for the null allele. However, the status for the null-allele in Norway has improved with the breeding program released in 2007 (Skeie 2014). According to Ådnøy (2014), DNA testing of Norwegian bucks intended for breeding has lowered the frequency of bucks carrying the deletion in exon 12 from approximately 80% (including a deletion in exon 9) in 2005 to 16% in 2012.
It is worrying that only 15% of the goats in this study carried an A allele, since it is known that high expression of αS1-CN is beneficial for the cheese yield (Ambrosoli et al. 1988; Johansson et al. 2015). As the majority of goat milk in Sweden is used for cheese production (LRF Jordmån, no year) and since the goat cheese manufacturing in Sweden is growing (Jordbruksverket 2019), there are incitements to breed for the A allele.
5.2. αS1-CN in relation to milk composition In agreement with Clark and Sherbon (2000), a correlation between αS1-CN with total protein and total casein was observed also in the current study. Ambrosoli et al. (1988) and Clark and Sherbon (2000) observed a significantly higher content of total protein and total casein in milk with high level of αS1-CN compared to milk
5. Discussion
32
with low level. In this study, a significant difference between groups (low and medium-high) based on the level of αS1-CN was found for total protein. Furthermore, Balia et al. (2013) found that goats with a lower production of αS1-CN had a partial compensation in production of β-CN, αS2-CN and κ-CN. The results in the current study does not indicate a compensation of other caseins.
Previous studies reported a positive correlation between αS1-CN and total fat (Pierre et al. 1998; Clark & Sherbon 2000; Dagnachew et al. 2011). This study did not find a correlation with total fat, in agreement with the studies of Ambrosoli et al. (1988) and Balia et al. (2013). Pierre et al. (1998) reported a large variation of total fat during lactation. The maximum difference in fat level of strong and null milk was seen in early lactation where after it decreased in milk during late lactation. Thus, the stage of lactation might have affected the results in the case of total fat. In our study, the lactation stage of the goats was not known. According to Dagnachew et al. (2011) and Balia et al. (2013), the effect on milk fat content is not to be considered as a direct genetic cause. Instead, it is believed to be related to the physical absence of αS1-CN, causing an interruption of the intercellular transport of caseins, leading to a disturbance of the milk lipid secretion in mammary epithelial cells.
5.3. αS1-CN in relation to proteolytic activity, SCC, pH and FFA
Proteolysis can be attributed to a complex spectrum of proteases of both endogenous and exogenous origin. The major endogenous proteolytic enzyme in milk is PL with its inactive zymogen PG. However, also other endogenous proteases such as cathepsin D and elastase may be responsible for proteolysis in milk (Fox & Kelly 2006; Albenzio et al. 2015). Exogenous proteases are mainly of bacterial origin and the bacterial spp. responsible for the proteases depend on factors such as storage conditions and processing of milk (Kamilari et al. 2020; Zhang et al. 2020).
Studies of goat milk have found the relative PL to be in excess to PG (Fantuz et al. 2001; Leitner et al. 2004). Fantuz et al. (2001) suggested the low PG to be due to a low influx from blood into the mammary gland or to a rapid conversion of PG into PL by the action of PAs. However, in this study we observed the reverse, which agrees with studies of cow and sheep milk (Politis 1992; Leitner et al. 2004). Leitner et al. (2004) compared goat and sheep milk. In their study, the PA activity was found to be lower in sheep milk compared to goat milk. A low PA activity indicates a low transformation of PG into PL. In our study, a low PA activity could be a possible explanation for PG in excess of PL in the milk. For more detailed knowledge related to the cause of the low PL in the current study, the plasmin-plasminogen system should be studied including the PA activity.
The study by Pierre et al. (1998) found that plasmin-like activity was higher in milk with high level of αS1-CN. They suggested that the higher plasmin-like activity in their milk samples was related to an increased expression of αS1-CN. However, in the current study PL was not significantly different among groups (level of αS1-CN and genotype).
33
Total protein was negatively correlated with total proteolysis and PG, whereas positively correlated with PL. Also, Fantuz et al. (2001) and Santillo et al. (2009) found a positive correlation between total protein and PL. Additionally, total proteolysis and PL were expected to correlate. However, a significant correlation was not found in this study. Albenzio et al. (2015) found cellular proteases such as cathepsin D and elastase to be involved in the proteolysis alongside PL, whereas Zhang et al. (2020) found bacterial proteases to be active during cold storage. Thus, the non-significant correlation between total proteolysis and PL could be the result of cellular and microbial proteases.
The SCC in milk is used as a measure of udder health status and milk quality (Andersson et al. 2011). Goat milk is reported to have a naturally higher SCC compared to cow milk (Albenzio et al. 2015). The SCC limit of cow bulk milk in the EU is 400 x 103 cells mL-1. An altered udder health status of cows is reported to take place already at bulk milk counts exceeding 200 x 103 cells mL-1 (Andersson et al. 2011). In this study, the average SCC within the whole population was 408 x 103 cells mL-1. As expected, the average count exceeded the limit for cow milk, but it was still below the identified threshold i.e., 700 x 103 cells mL-1, for an altered udder health status in goats (Albenzio et al. 2015). In the current study, PL was positively correlated with SCC, which was also reported in the study by Albenzio et al. (2015). Moreover, Rebucci et al. (2005) found PG significantly lower in high SCC milk. They suggested that the lower levels of PG could indicate an elevated conversion of PG to PL due to an increase in PA activity. However, in the current study a significant correlation between SCC and PG was not observed and PA activity was not investigated.
The current study found that αS1-CN was negatively correlated with SCC. A significance was also seen for SCC among the genotype homozygous for the null allele (DD) and genotypes with the A allele, where lower SCC was found in allele variants with a high expression level of αS1-CN. SCC and genotypes were also compared in the study by Balia et al. (2013). However, these authors did not find any significant difference in SCC between genotypes.
The negative correlation between αS1-CN and pH observed in this study, was also noticed in the study by Ambrosoli et al. (1988), Pierre et al. (1998) and Johansson et al. (2015). Subsequently, pH was significantly lower in the group medium-high compared to low level of αS1-CN, and in the group with genotypes containing an A allele compared to the group homozygous for the null allele (DD), respectively. The lower pH in milk with higher levels of αS1-CN could positively influence the coagulation rate and curd firmness, which is well documented for cow milk (Ambrosoli et al. 1988; Walstra et al. 2006).
Total protein and αS1-CN were negatively correlated with FFA, and the content of FFA was significantly higher in the group with low level of αS1-CN compared to medium-high. A similar result was found between goats with genotypes containing an A allele compared to goats homozygous for the null allele (D). This relation was also seen by Pierre et al. (1998) and Cebo et al. (2012). Cebo et al. (2012) suggests the higher content of FFA in milk with low level of αS1-CN to be related to a larger specific surface area of fat globules from null milks resulting in increased lipolytic enzyme-fat interactions.
34
5.4. General discussion The current study was performed with an explorative approach. This type of approach is suitable for problems that have not previously been well investigated. Up until today, research on Swedish goat milk, exploring relations between αS1-CN, genotype, total proteolysis and milk composition has not been reported. However, the relations have to some extent been investigated in Swedish cow milk. In this approach, a wide spectrum of parameters was included, leading to an increased understanding of the problem with low αS1-CN. Thus, the result of this study may function as a starting point for further studies within this area.
The assessment included milk samples from 75 goats collected from five different farms in Sweden. Goats included in the study, were Swedish Landrace breed randomly selected, where no specific factors as lactation stage, lactation number, type of production (extensive or intensive) and/or feed were considered. One possible limitation was that the sampling method varied between farms and were not fully controlled. Also, the variability in milk composition over time needs to be considered since only one sampling per individual was done. Another limiting factor may be the bacterial status of the milk, which was not known. This may have affected parameters such as pH and proteolytic activity. Furthermore, the low frequency of high expressing goats and of goats with an A allele was a limiting factor for the statistical analysis. For this reason, the groups with the medium and high expression of αS1-CN were clustered to one group, and all genotypes containing an A allele were clustered in one group.
5.5. Future research The fact that no correlation was found between total proteolysis and PL, indicates that other proteases might contribute to proteolytic activity in the milk. Therefore, it would be of interest to identify other proteases besides PL. Thus, the bacterial status of the milk should be included. Furthermore, inclusion of PA activity in the analysis would help to explain the relation between PL and PG in different samples.
Most of the goat milk produced in Sweden is used for further processing into cheese. Therefore, the coagulation properties of the milk from Swedish goats with different allele combinations would be an interesting approach. Besides coagulation properties, sensory parameters of milk are of high importance. One example is that proteolysis during maturation of cheese is highly important for the flavour development. Another example is that FFA contribute to the goaty flavour of the milk and sometimes also to the rancid taste. Since FFA was negatively correlated with levels of αS1-CN in this study, another area for future research could be to investigate how expression of αS1-CN influences flavour development in goat dairy products.
35
5.6. Conclusion The objective of this study was to investigate if the expression of αS1-CN and genetic profile of the CSN1S1 gene influence the proteolytic activity and composition of milk from Swedish dairy goats. The study indicates a strong association between level of αS1-CN in the milk and allele combination. Goats with low expression of αS1-CN did not carry an A allele, indicating that one A allele is enough to significantly increase the expression of αS1-CN. Moreover, the frequency of goats homozygous for the null allele was relatively high (58%), whereas the frequency of goats with an A allele was low (15%). However, frequencies may not be generalizable since only five farms were included in this study. Even so, the low frequency of A alleles is troublesome since it affects not only the αS1-CN expression but also the total protein content of the milk.
As concluded in previous studies, αS1-CN positively correlated with total protein. The protein and casein contents are parameters commonly used to monitor processability of milk. Since the correlation with total protein was strong, protein should work well to predict the level of αS1-CN in the milk.
The content of FFA was higher in milk from goats with low expression of αS1-CN. Since levels of FFA influence the specific goat milk taste it may have implications for sensory aspects of dairy products. Total protein was found to be negatively correlated with total proteolysis. In addition, total protein was negatively correlated with PG and positively correlated with PL. Implying that milk with a higher protein content, hence a higher level of αS1-CN, is related to lower total proteolysis at the same time as the PL activity is higher than in milk with lower level of αS1-CN. Furthermore, PL and total proteolysis did not correlate which may indicate a presence of proteases of cellular and microbial origin. Moreover, PG derived activity was exceeding that of PL in this study. This is not in line with previous studies of goat milk. The higher level of PG compared to PL may indicate a low PA activity in the milk. Nevertheless, certain conclusions cannot be drawn since PA activity was not included in this study. Thus, one suggestion for further studies, is to include additional parameters within the plasmin-plasminogen system.
36
AGFO (2019). Matjättarna: Här är de svenska råvarorna vi efterfrågar. https://agfo.se/2019/12/matjattarna-har-ar-de-svenska-ravarorna-vi-efterfragar/ [2020-11-19]
Albenzio, M., Caroprese, M., Santillo, A., Marino, R., Taibi, L. & Sevi, A. (2004). Effects of somatic cell count and stage of lactation on the plasmin activity and cheese-making properties of ewe milk. Journal of dairy science, 87, pp. 533-542. doi:10.3168/jds.S0022-0302(04)73194-X
Albenzio, M. & Santillo, A. (2011). Biochemical characteristics of ewe and goat milk: Effect on the quality of dairy products. Small ruminant research, 101, pp. 33- 40. doi:10.1016/j.smallrumres.2011.09.023
Albenzio, M., Santillo, A., Kelly, A. L., Caroprese, M., Marino, R. & Sevi, A. (2015). Activities of indigenous proteolytic enzymes in caprine milk of different somatic cell counts. Journal of dairy science, 98(11), pp. 7587-7594. doi:10.3168/jds.2015-9762
Alessandria, V., Ferrocino, I., De Filippis, F., Fontana, M., Rantsiou, K., Ercolini, D. & Cocolina, L. (2016). Microbiota of an Italian grana-like cheese during manufacture and ripening, unraveled by 16S rRNA-based approaches. Applied and environmental microbiology, 82(13), pp. 3988-3995. doi:10.1128/AEM.00999-16
Allmogegeten (2014). Allmogegetter. https://www.allmogegeten.se/getter_index.html [2021-04-20]
Ambrosoli, R., di Stasio, L. & Mazzocco, P. (1988). Content of αs1-casein and coagulation properties in goat milk. Journal of diary science, 71(1), pp. 24-28. doi:10.3168/jds.S0022-0302(88)79520-X
Andersson, I., Andersson, H., Chritsiansson, A., Oscarsson, M., Persson, Y. & Widell, A. (2011). Systemanalys celltal (Rapport 7091). http://juverportalen.se/media/1099/systemanalys-celltal-2011-10-20.pdf [2021-04-20]
Balia, F., Pazzola, M, Dettori, M. L, Mura, M. C., Luridiana, S., Carcangiu, V., Piras, G. & Vacca, G. M. (2013). Effect of CSN1S1 gene polymorphism and stage of lactation on milk yield and composition of extensively reared goats. Journal of dairy research, 80, pp. 129–137. doi:10.1017/S0022029912000702
Bastian, E. D. & Brown, R. J. (1996). Plasmin in milk and dairy products: an update. Dairy journal, 6, pp. 435-457. doi:10.1016/0958-6946(95)00021-6
References
37
Björk, A. (2018). Detection of mutational sites in the CSN1S1 gene and analysis of αs1-casein composition of the milk in Swedish goats (Capra hircus). Master thesis, Department of Animal breeding and Genetics. Uppsala: Swedish University of Agriculture. https://stud.epsilon.slu.se/14201/
Bosona, T. & Gebresenbet, G. (2018). Swedish consumers’ perception of food quality and sustainability in relation to organic food production. Foods, 7(54). doi:10.3390/foods7040054
Castell, J. V., Cervera, M. & Marco, R. (1979). Convenient micro method for the assay of primary amines and proteins with fluorescamine. A re-examination of the conditions of reaction. Analytical biochemistry, 99, pp. 379-391. doi: 10.1016/s0003-2697(79)80022-6
Cebo, C., Lopez, C., Henry, C., Beauvallet, C., Ménard, O., Bevilacqua, C., Bouvier, F., Caillat, H. & Martin, P. (2012). Goat as1-casein genotype affects milk fat globule physicochemical properties and the composition of the milk fat globule membrane. Journal of dairy science, 95, pp. 6215-6229. doi:10.3168/jds.2011-5233
Chove, L. M., Grandison, A. S. & Lewis, M. J. (2011). Comparison of methods for analysis of proteolysis by plasmin in milk. Journal of dairy research, 78, pp. 184-190. doi:10.1017/S0022029911000094
Clark, S. & Sherbon, J. W. (2002). Alphas1-casein, milk composition and coagulation properties of goat milk. Small ruminant research, 38, pp. 123-134. doi:10.1016/S0921-4488(00)00154-1
Crippa, M. P. (2007). Urokinase-type plasminogen activator. The international journal of biochemistry & cell biology, 39, pp. 690-694. doi: 10.1016/j.biocel.2006.10.008
Dagnachew, B. S., Thaller, G., Lien, S. & Ådnøy, T. (2011). Casein SNP in Norwegian goats: additive and dominance effects on milk composition and quality. Genetics selection evolution, 43(31). doi:10.1186/1297-9686-43-31
Devold, T. G., Nordbø, R., Langsrud, T., Svenning, C., Brovold, M. J., Sørensen, E. S., Christensen, B., Ådnøy, T. & Vegarud, G. E. (2011). Extreme frequencies of the αS1-casein “null” variant in milk from Norwegian dairy goats - implications for milk composition, micellar size and renneting properties. Dairy science technology, 91, pp. 39-51. doi:10.1051/dst/2010033
Ditlevsen, K., Denver, S., Christensen, T. & Lassen, J. (2020). A taste for locally produced food - Values, opinions and sociodemographic differences among ‘organic’ and ‘conventional’ consumers. Appetite, 147. doi:10.1016/j.appet.2019.104544
Eknæs, M. & Skeie, S. (2006). Effect of different level of roughage availability and contrast levels of concentrate supplementation on flavour of goat milk. Small ruminant research, 66, pp. 32-43. doi:10.1016/j.smallrumres.2005.06.029
38
Fantuz, F., Polidori, F., Cheli, F. & Baldi, A. (2001). Plasminogen activation system in goat milk and its relation with composition and coagulation properties. Journal of dairy science, 84, pp. 1786-1790. doi:10.3168/jds.S0022-0302(01)74616-4
Fox, P. F. & Kelly, A. L. (2006). Indigenous enzymes in milk: Overview and historical aspects - Part 1. International dairy journal, 16, pp. 500-516. doi:10.1016/j.idairyj.2005.09.013
Gasparini, G. B. F. B, Amorim, F. R., de Souza-Correa, S., Bruzaroski, S. R., Fagnani, R., de Souza, C. H. B., Damião, B. C. M. & de Santana, E. H. W. (2020). Psychrotrophs in raw milk: effect on texture, proteolysis index, and sensory evaluation of smoked provolone cheese. Journal of science food agriculture, 100, pp. 3291-3296. doi:10.1002/jsfa.10329
Grosclaude, F., Ricordeau, G., Martin, P., Remeuf, F., Vassal, L. and Bouillon, J. (1994). From gene to cheese: The caprine αs1-casein polymorphism, its effects and its evolution. Productions animales, 7(1), pp. 3-19.
Gupta, C., Prakash, D., Garg, A. P. & Gupta, S. (2012). Whey proteins: A novel source of bioceuticals. Middle-East journal of scientific research, 12(3), pp. 365-375. doi:10.5829/idosi.mejsr.2012.12.3.64227
Hayes, B., Hagesæther, N., Adnøy, T., Pellerud, G., Berg, P. R. & Lien, S. (2006). Effects on production traits of haplotypes among casein genes in Norwegian goats and evidence for a site of preferential recombination. Genetics, 174, pp. 455-464. doi:10.1534/genetics.106.058966
Högberg, M. (2016). Keeping goats and kids together. Doctoral thesis 2016:41. Uppsala: Swedish University of Agriculture. https://pub.epsilon.slu.se/13332/
Inglingstad, R. A., Skeie, S., Vegarud, G. E., Devold, T. G., Chilliard, Y. & Eknæs, M. (2017). Feeding a concentrate rich in rapeseed oil improves fatty acid composition and flavor in Norwegian goat milk. Journal dairy science, 100, pp. 7088-7105. doi:10.3168/jds.2016-12383
Inglingstad, R. A., Steinshamn, H., Dagnachew, B. S., Valenti, B., Criscione, A., Rukke, E. O., Devold, T. G., Skeie, S. B. & Vegarud, G. E. (2014). Grazing season and forage type influence goat milk composition and rennet coagulation properties. Journal of dairy science, 97, pp. 3800-3814. doi:10.3168/jds.2013-7542
Iskender, H., Kaynarb, O., Hayirlic, A., & Camadand, Y. (2018). Milk lipid and protein profiles of Abkhazian and Kackar goats. Tropical animal science journal, 41(1), pp. 60-66. doi:10.5398/tasj.2018.41.1.60
Ismail, B. & Nielsen, S. S. (2010). Invited review: Plasmin protease in milk: Current knowledge and relevance to dairy industry. Journal of dairy science, 93, pp. 4999-5009. doi: 10.3168/jds.2010-3122
Johansson, M., Akerstedt, M., Li, S. J., Zamaratskaia, G., & Lundh, A. S. (2013). Casein breakdown in bovine milk by a field strain of Staphylococcus aureus. Journal of Food Protection, 76(9), pp. 1638-1642. doi:10.4315/0362-028X.JFP-13-112
39
Johansson, M., Högberg, M. & Andrén, A. (2014). High frequencies of the αS1-casein zero variant in milk from Swedish dairy goats. Sheep & Goat research journal, 29, pp. 1-4.
Johansson, M., Högberg, M. & Andrén, A. (2015). Relation between αS1-casein content and coagulation properties of milk from Swedish dairy goats. The open food science journal, 9, pp. 1-4. doi:10.2174/1874256401509010001
Johansson, M., Lundh, Å., de Vries, R. & Svennersten-Sjaunja, K. (2017). Composition and enzymatic activity in bulk milk from dairy farms with conventional or robotic milking systems. Journal of dairy research, 84, pp. 154-158. doi:10.1017/S0022029917000140
Jordbruksverket (2015). Svensk lantrasget. http://smakasverige.se/ravaror/ravarorarkiv/svensklantrasget.194.html [2021-01-02]
Jordbruksverket (2019). Gethållning 2018. Rapportserie 2019:01. https://jordbruksverket.se/download/18.29196bdf172db848a9e1384f/1592839852350/201901.pdf [2021-01-02]
Kamilari, E., Anagnostopoulos, D. A., Papademas, P., Efthymiou, M, Tretiak, S. and Tsaltas, D. (2020). Snapshot of Cyprus Raw Goat Milk Bacterial Diversity via 16S rDNA High-Throughput Sequencing; Impact of Cold Storage Conditions. Fermentation, 6(100). doi:10.3390/fermentation6040100
Kapadiya, D. B., Prajapati, D. B., Jain, A. K., Mehta, B. M., Darji, V. B. & Aparnathi, K. D. (2016). Comparison of Surti goat milk with cow and buffalo milk for gross composition, nitrogen distribution, and selected minerals content. Veterinary world, 9(7), pp. 710-716. doi:10.14202/vetworld.2016.710-716
Kelly, A. L., O’Flaherty, F. & Fox. P. F. (2006). Indigenous proteolytic enzymes in milk: A brief overview of the present state of knowledge. International dairy journal, 16, pp. 563-572. doi:10.1016/j.idairyj.2005.10.019
Kneafsey, M., Venn, L., Schmutz, U., Balázs, B., Trenchard, L., Eyden-Wood, T., Bos, E., Sutton, G. & Blackett, M. (2013). Short food supply chains and local food systems in the EU. A state of play of their socio-economic characteristics. Report EUR 25911 EN. doi:10.2791/88784
Korycka-Dahl, M., Dumas, B. R., Chene, N. & Martal, J. (1983). Plasmin activity in milk. Journal of dairy science, 66, pp. 704-711. doi:10.3168/jds.S0022-0302(83)81848-7
Leitner, G., Merin, U. & Silanikove, N. (2004). Changes in milk composition as affected by subclinical mastitis in goats. Journal of Dairy Science, 87(6), pp. 1719-1726. doi:10.3168/jds.S0022-0302(04)73325-1
Leitner, G., Silanikove, N. & Merin, U. (2008). Estimate of milk and curd yield loss of sheep and goats with intramammary infection and its relation to somatic cell count. Small ruminant research, 74, pp. 221-225. doi:10.1016/j.smallrumres.2007.02.009
LRF Jordmån (no year). Get. https://jordman.nu/branscher/get/ [2021-01-02]
40
Lu, D. D. & Nielsen, S. S. (1993). Heat inactivation of native plasminogen activators in bovine milk. Journal of food science, 58(5). doi:10.1111/j.1365-2621.1993.tb06100.x
Mahé, M. F. & Grosclaude, F. (1989). αS1-CND, another allele associated with a decreased synthesis rate at the caprine αS1-casein locus. Genetics selection evolution, 21(127), pp. 127-129. doi:10.1186/1297-9686-21-2-127
Marletta, D., Criscione, A., Bordonaro, S., Guastella, A. M. & d’Urso, G. (2007). Casein polymorphism in goat’s milk. Le Lait, 87(6), pp. 491-504. doi:10.1051/lait:2007034
Martin, P., Ollivier-Bousquet, M. & Grosclaude, F. (1999). Genetic polymorphism of caseins: A tool to investigate casein micelle organization. International dairy journal, 9, pp. 163-171. doi:10.1016/S0958-6946(99)00055-2
McSweeney, P. (2004). Biochemistry of cheese ripening. International journal of dairy technology, 57, pp. 127-144. doi:10.1111/j.1471-0307.2004.00147.x
Metwalli, A. A. M., de Jongh, H. H. J. & van Boekels, M. A. J. S. (1998). Heat inactivation of bovine plasmin. International dairy journal, 8, pp. 47-56. doi:10.1016/S0958-6946(98)00017-X
Moatsou, G., Samolada, M., Panagiotou, P. & Anifantakis, E. (2004). Casein fraction of bulk milks from different caprine breeds. Food Chemistry, 87, pp. 75-81. doi:10.1016/j.foodchem.2003.10.020
Paape, M. J., Wiggans, G. R. Bannermana, D. D., Thomas, D. L. Sanders, A. H., A. Contreras, A., Moroni, P. & Miller R.H. (2007). Monitoring goat and sheep milk somatic cell counts. Small ruminant research, 68, pp. 114-125. doi:10.1016/j.smallrumres.2006.09.014
Park, Y. W., Juarez, M., Ramos, M. & Haenlein, G. F. W. (2007). Physico-chemical characteristics of goat and sheep milk. Small ruminant research, 68, pp. 88-113. doi:10.1016/j.smallrumres.2006.09.013
Pierre, A., Le Quéré, J-L., Riaublanc, A., Le Graët, Y., Demaizières, D. & Michel, F. (1998). Composition and physico-chemical characteristics of goat milks containing the A or 0 as casein variants. Le Lait, 78(2), pp. 191-202.
Politis, I., Barbano, D.M., & Gorewit, R.C. (1992). Distribution of plasminogen and plasmin in fractions of bovine milk. Journal of dairy science, 75, pp. 1402-1410. doi:10.3168/jds.S0022-0302(92)77893-X
Potočnik, K., Gantner, V., Kuterovac & K., Cividini, A. (2011). Mare’s milk: Composition and protein fraction in comparison with different milk species. Mljekarstvo, 61(2), pp. 107-113.
Prado, B.M., Sombers, S.E., Ismail, B. & Hayes, K. D. (2006). Effect of heat treatment on the activity of inhibitors of plasmin and plasminogen activators in milk. International dairy journal, 16, pp. 593–599. doi:10.1016/j.idairyj.2005.09.018
Rebucci, R., Fusi, E., Pecorini, C., Pinotti, L., Cheli, F. & Baldi, A. (2005). Evaluation of the biological activation of plasmin plasminogen system in
41
sheep and goat milk. Italian journal of animal science, 4(2), pp. 330-332. doi:10.4081/ijas.2005.2s.330
Saeman, A. I., Verdi, R. J., Galton, D. M. & Barbano, D. M. (1988). Effect of mastitis on proteolytic activity in bovine milk. Journal of dairy science, 71, pp. 505-512. doi:10.3168/jds.S0022-0302(88)79581-8
Sánchez-Macías, D., Morales-delaNuez, A., Torres, A., Hernández-Castellano, L. E., Jiménez-Flores, R., Castro, N. & Argüello, A. (2013). Effects of addition of somatic cells to caprine milk on cheese quality. International dairy journal, 29, pp. 61-67. doi:10.1016/j.idairyj.2012.10.010
Santillo, A., Kelly, A. L., Palermo, C., Sevi, A. and Albenzio, M. (2009). Role of indigenous enzymes in proteolysis of casein in caprine. International dairy journal, 19, pp. 655-660. doi:10.1016/j.idairyj.2009.06.011
Selvaggi, M., Laudadio, V., Cataldo, D., Tufarelli, V. (2014). Major proteins in goat milk: an updated overview on genetic variability. Molecular biology reports, 41, pp. 1035-1048. doi:10.1007/s11033-013-2949-9
Skeie, S. B. (2010). Milk quality requirements for cheesemaking. In Griffiths, M. W. (ed.) Improving the safety and quality of milk, Cambridge: Woodhead Publishing Limited, pp. 433-453.
Skeie, S. B. (2014). Quality aspects of goat milk for cheese production in Norway: A review. Small ruminant research, 122, pp. 10-17. doi:10.1016/j.smallrumres.2014.07.012
Skeie, S. B., Inglingstad, R. A., Brunborga, L. J. & Eknæs, M. (2014). The influence of the deletion in exon 12 of the gene encoding αs1-casein (CSN1S1) in the milk of the Norwegian dairy goat breed on milk coagulation properties and cheese quality. Small ruminant research, 122, pp. 50-58. doi:10.1016/j.smallrumres.2014.07.019
Soliman, G. Z. A. (2005). Comparison of chemical and mineral content of milk from human, cow, buffalo, camel and goat in Egypt. The Egyptian journal of hospital medicine. 21, pp. 116-130. doi:10.12816/EJHM.2005.18054
Sorhaug, T. & Stepaniak, L. (1991). Microbial enzymes in the spoilage of milk and dairy products. Food enzymology, 1, pp. 169-218.
Sousa, M. J., Ardö, Y. & McSweeney, P. L. H. (2001). Advances in the study of proteolysis during cheese ripening. International dairy journal, 11, pp. 327–345. doi:10.1016/S0958-6946(01)00062-0
Svenska getavelsförbundet (2015). Lantrasget ”mjölkgeten”. https://www.svenskagetavelsforbundet.se/mjolkgeten [2021-04-19]
Vidanarachchi J. K., Li, S., Lundh, Å. & Johansson, M. (2015). Short communication: Lipolytic activity on milk fat by Staphylococcus aureus and Streptococcus agalactiae strains commonly isolated in Swedish dairy herds. Journal of dairy Science, 98, pp. 8560-8564. doi:10.3168/jds.2015-9559
de Vries, R., Brandt, M., Lundh, Å., Holtenius, K., Hettinga, K. & Johansson, M. (2016). Short communication: Influence of shortening the dry period of
42
Swedish dairy cows on plasmin activity in milk. Journal of dairy science, 99, pp. 1-7. doi:10.3168/jds.2016-11502
Walstra, P., Wouters, J. T. M. & Geurts, T. J. (2006). Dairy Science and Technology. 2nd ed. Boca Raton: CRC Press.
Wiking, L., Fröst, M. B., Larsen, L. B. & Nielsen, J. H. (2002). Effects of storage conditions on lipolysis, proteolysis and sensory attributes in high quality raw milk. Milchwissenschaft, 54(4).
Zhang, D., Palmer, J., The, K. H. & Flint, S. (2020). Identification and selection of heat-stable protease and lipase-producing psychrotrophic bacteria from fresh and chilled raw milk during up to five days storage. LWT - Food science and technology, 134. doi:10.1016/j.lwt.2020.110165
Ådnøy, T. (2014). The dairy goat industry in Norway: Challenges in a historical perspective. Small ruminant research, 122, pp. 4-9. doi:10.1016/j.smallrumres.2014.07.011
Åsebø, K., Moxnes Jervell, A., Lieblein, G., Svennerud M. & Francis, C. (2008). Farmer and consumer attitudes at farmers markets in Norway. Journal of sustainable agriculture, 30(4). doi:10.1300/J064v30n04_06
43
I would like to give a special thanks to my supervisor Monika Johansson for giving me this opportunity and for your valuable guidance and inspiration during this work. I would also like to say thank you to Anna Maria Johansson and to Jonas Ohlsson for your advice regarding statistical methods. To the farmers, who provided the milk samples, many thanks to you for participating in this study.
Acknowledgements
44
Did you know that, to produce one kilo of goat cheese, you need 11 litres of goat milk? A goat of the Swedish landrace breed produces on average 1.9 litres of milk per day. In 2018, 126 tons of goat cheese were produced in Sweden. Compared to cow milk cheese, the Swedish goat cheese production is small scaled. However, compared to other livestock sectors, the number of goats is increasing. One reason for the increasing goat population is the growing demand for artisanal goat milk cheese. Have you ever thought of which factors that influence the final quality of the cheese you consume? To start, there are a couple of parameters the raw milk should fulfil to obtain a high cheese yield and a high-quality cheese. Firstly, milk needs to be of good hygienic quality with low bacterial count. In addition, somatic cell count should be as low as possible. Somatic cell count is a measure of the udder health status of the goat. If the udder is infected, the somatic cell count, i.e., the number of white blood cells, increases in the milk. Secondly, the milk protein and fat content should be high. A high milk protein and fat content is associated with a higher cheese yield, i.e., less milk is needed per kg of cheese. Moreover, milk proteins can be separated into caseins and whey protein. It is the caseins that constitute the cheese, and that form a gel with help of a rennet enzyme. In contrast, the whey proteins will be separated with the whey, i.e., the water phase of the milk, at the end of the cheese production process. A third parameter of importance for a high cheese yield and high-quality cheese is a low enzyme activity in the raw milk. Milk contains enzymes that can degrade the caseins. If caseins are degraded in the raw milk, they will be lost in the whey resulting in a lower cheese yield. Enzymes can origin from the blood or be of cellular or bacterial origin. Thus, enzyme activity is higher if milk contains a high bacterial count and/or a high somatic cell count. To maintain a low bacterial count in the raw milk, it is common practice to refrigerate the milk directly after milking up until production. However, there are bacteria that thrive in refrigerated temperatures, and these can readily grow and take over the microflora if milk is stored for several days. Bacterial enzymes will then be secreted as part of the bacterial metabolism and may degrade milk caseins and fat. Thus, milk should be processed as soon as possible after milking. Moreover, the main protein degrading enzyme in milk is plasmin. Plasmin exists in an inactive form called plasminogen, from which it can be activated to its active form by plasminogen activators. In addition, milk consists of plasmin inactivators. Plasminogen activators are relatively heat stable. Thus, plasminogen can be activated to plasmin also after heat
Appendix 1 – Popular Scientific summary
45
treatment. Therefore, it is important to keep a low enzyme activity already from start. This is done by applying good hygiene praxis as well as working towards a good udder health status among the animals. The gross composition of milk, such as the protein and fat content, is influenced by feed, stage of lactation, lactation number and genetics. Thus, the genetics of the goat have an impact on the cheese yield. One example is the gene coding for one of the milk proteins, called αs1-casein. This gene exists in different variants, giving rise to different properties of goats with respect to their expression level of αs1-casein in the milk. Some gene variants give rise to a high expression, i.e., high levels of αs1-casein in milk, while other variants give rise to zero or low levels of αs1-casein. A high level of αs1-casein improves the properties of milk for cheese production and results in a higher cheese yield. It has been observed that the Swedish goat population contains a gene variant that produces zero or very low amounts of αs1-casein. In this study, 58% of the goats carried the gene version responsible for the low production on both chromosomes. Only 15% of the goats carried a high producing variant of this gene. Moreover, when looking at the level of αs1-casein in the milk, 72% of the milk samples contained a low level of αs1-casein. The result of this study showed no improvement regarding the number of goats producing a low level of αs1-casein, when compared to earlier studies of the Swedish goat population. The content of total protein was higher in milk with high level of αs1-casein compared to milk with low level of αs1-casein. Hence, protein content can work as an indicator of the level of αs1-casein in goat milk. In addition, the plasmin activity was found to be positively correlated with total protein. This indicates that plasmin activity is higher in milk with a high protein content. Possibly, the higher αs1-casein level in the samples with higher protein content can act as a substrate for plasmin activity. Moreover, pH was lower in milk with high level of αs1-casein. A low pH is associated to improved properties of the milk in the first steps of cheese production, i.e., gel formation. In addition, the content of free fatty acids was higher in milk with low level of αs1-casein. A high level of free fatty acids can give rise to a rancid flavour of the goat milk. In conclusion, milk with high level of αs1-casein is more advantageous for cheese production. As you understand there are many factors to consider for the cheese maker to obtain a high-quality cheese. The factors mentioned here are just a few of all the factors influencing the final cheese quality. Perhaps this knowledge will even more make you appreciate the cheese on your plate and the artisanal work behind.