18 Co-Adsorption of the Proteins ²-Casein and BSA in Relation to
20
439 18 Co-Adsorption of the Proteins β -Casein and BSA in Relation to the Stability of Thin Liquid Films and Foams Krastanka G. Marinova, Rumyana D. Stanimirova, Mihail T. Georgiev, Nikola A. Alexandrov, Elka S. Basheva, and Peter A. Kralchevsky CONTENTS 18.1 Introduction .................................................................................................. 440 18.2 Mixed Protein Solutions—Experimental Methods ...................................... 441 18.2.1 BSA versus β-Casein ........................................................................ 441 18.2.2 Experiments with Single Interfaces .................................................. 442 18.2.3 Experiments with Thin Foam Films................................................. 443 18.2.4 Experiments with Foams .................................................................. 444 18.3 Characterization of the Protein Adsorption Layers ...................................... 444 18.3.1 Surface Tension and Dilatational Rheology ..................................... 444 18.3.2 Thickness and Stability of the Liquid Films .................................... 448 18.3.3 Foaminess and Foam Stability ......................................................... 449 18.4 Discussion on the Structure and Interactions ............................................... 451 18.4.1 Adsorption Layers from BSA ........................................................... 451 18.4.2 Adsorption Layers from β-Casein .................................................... 453 18.4.3 Parallel Adsorption of BSA and β-Casein ........................................ 453 18.4.4 Sequential Adsorption of BSA and β-Casein ................................... 454 18.5 Summary and Conclusions ........................................................................... 455 Acknowledgments.................................................................................................. 456 References .............................................................................................................. 456 © 2014 by Taylor & Francis Group, LLC
Transcript of 18 Co-Adsorption of the Proteins ²-Casein and BSA in Relation to
439
18 Co-Adsorption of the Proteins β-Casein and BSA in Relation to the Stability of Thin Liquid Films and Foams
Krastanka G. Marinova, Rumyana D. Stanimirova, Mihail T. Georgiev, Nikola A. Alexandrov, Elka S. Basheva, and Peter A. Kralchevsky
Contents
18.1 Introduction ..................................................................................................44018.2 Mixed Protein Solutions—Experimental Methods ...................................... 441
18.2.1 BSA versus β-Casein ........................................................................ 44118.2.2 Experiments with Single Interfaces ..................................................44218.2.3 Experiments with Thin Foam Films ................................................. 44318.2.4 Experiments with Foams ..................................................................444
18.3 Characterization of the Protein Adsorption Layers ......................................44418.3.1 Surface Tension and Dilatational Rheology .....................................44418.3.2 Thickness and Stability of the Liquid Films ....................................44818.3.3 Foaminess and Foam Stability .........................................................449
18.4 Discussion on the Structure and Interactions ............................................... 45118.4.1 Adsorption Layers from BSA ........................................................... 45118.4.2 Adsorption Layers from β-Casein .................................................... 45318.4.3 Parallel Adsorption of BSA and β-Casein ........................................ 45318.4.4 Sequential Adsorption of BSA and β-Casein ................................... 454
18.5 Summary and Conclusions ........................................................................... 455Acknowledgments .................................................................................................. 456References .............................................................................................................. 456
© 2014 by Taylor & Francis Group, LLC
440 Colloid and Interface Chemistry for Nanotechnology
18.1 IntroduCtIon
Proteins are primary natural stabilizers of numerous food dispersion products, for example, creams, cheese, spreads, mousses, souses, and so on (Dickinson 2001; McClements 2005). The practical applications usually involve the use of natural pro-tein mixtures, for example, the mixtures of caseins and globular whey proteins from milk (Mackie et al. 2001; Sengupta and Damodaran 2000; Zhang et al. 2004) and egg protein mixtures (Foegeding et al. 2006). Competitive adsorption and the forma-tion of mixed adsorption layers in these systems are expected to govern the foaming and emulsifying ability, as well as the subsequent product stability (Foegeding et al. 2006; Maldonado-Valderrama et al. 2007; Zhang et al. 2004). Co-adsorption has been investigated and used in foam fractionation applications (Merz et al. 2001).
Co-adsorption and structure of protein adsorption layers from various protein mixtures have been studied by using different techniques: atomic force micros-copy, fluorescent labeling and imaging, radiolabeling, and radiotracing (Damodaran 2004; Mackie et al. 2001; Sengupta and Damodaran 2000). The dynamics of pro-tein adsorption/desorption and the displacement of proteins by surfactants can be investigated by recording the adsorption by ellipsometry (Russev et al. 2000) and the surface tension by various methods, for example, by drop shape analysis (DSA) (Hoorfar and Neumann 2006; Kotsmar et al. 2009; Rotenberg et al. 1983). The latter method allows replacing the outer phase around a pendant drop or buoyant bubble with another protein solution and investigating the sequential adsorption of proteins (Svitova et al. 2003; Svitova and Radke 2005). The microfluidics techniques also allow exchanging the protein solution within a pendant drop by using two coaxial capillaries (Cabrerizo-Vilchez et al. 1999; Ferri et al. 2008, 2010).
The transfer of knowledge from the model experiments with single surfaces to explain the behavior of foams and emulsions is not always straightforward (Wierenga et al. 2009b). The foam longevity depends not only on the rate of surfactant or protein adsorption but also on the stability of the thin liquid films (TLFs) formed between the bubbles in the foam (Marinova et al. 2009; Saint-Jalmes et al. 2005). Another important factor is the permeability of the films to the transport of gases (that leads to Ostwald ripening), which can be blocked by densely packed adsorption layers (Danov et al. 2012; Tcholakova et al. 2011).
In this chapter, we combine experimental measurements with single bubbles, TLFs, and foams to obtain information on the adsorption behavior and interactions of two proteins at the air/water interface in relation to the stabilization of foams. We selected a pair of rather different proteins: the disordered protein β-casein and the globular bovine serum albumin (BSA). Their adsorption behavior has been studied separately (Bantchev and Schwartz 2004; Cascão-Pereira et al. 2003a; Dickinson et al. 1993; Engelhardt et al. 2012; Graham and Philips 1979). At the best of our knowledge, this chapter is the first systematic study on the co-adsorption of BSA and β-casein. Our goal is to obtain information for the structure of the mixed adsorption layers and the foam film stability by analysis of data obtained by different methods. For this goal, we employed the DSA technique with buoyant bubbles. This technique is upgraded with the oscillating bubble method and with an option for replacement of the liquid phase. The used device for TLFs also allows phase exchange. These
© 2014 by Taylor & Francis Group, LLC
441Co-Adsorption of β-Casein and BSA in Relation to Liquid Films and Foams
methods yield the dynamic and equilibrium surface tension, the surface dilatation storage and loss moduli, and the film thickness at low and high applied pressures, and allow comparing data from parallel and sequential adsorption of the two pro-teins. The properties of foams from the mixed solutions are compared with foams from solutions of the separate components. The results give information about the most favorable structure of the compound protein adsorption layer in relation to foam stability.
18.2 MIxed ProteIn solutIons—exPerIMental Methods
18.2.1 BSA verSuS β-CASein
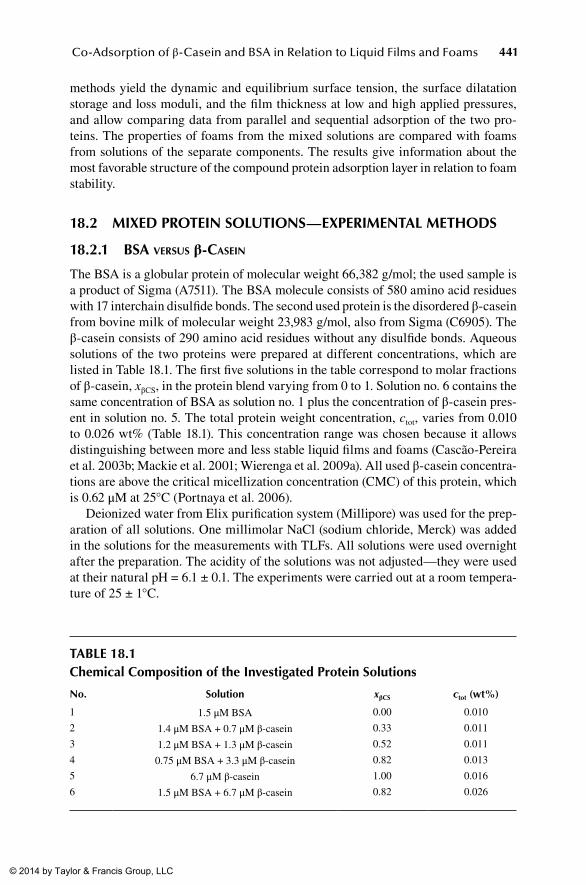
The BSA is a globular protein of molecular weight 66,382 g/mol; the used sample is a product of Sigma (A7511). The BSA molecule consists of 580 amino acid residues with 17 interchain disulfide bonds. The second used protein is the disordered β-casein from bovine milk of molecular weight 23,983 g/mol, also from Sigma (C6905). The β-casein consists of 290 amino acid residues without any disulfide bonds. Aqueous solutions of the two proteins were prepared at different concentrations, which are listed in Table 18.1. The first five solutions in the table correspond to molar fractions of β-casein, xβCS, in the protein blend varying from 0 to 1. Solution no. 6 contains the same concentration of BSA as solution no. 1 plus the concentration of β-casein pres-ent in solution no. 5. The total protein weight concentration, ctot, varies from 0.010 to 0.026 wt% (Table 18.1). This concentration range was chosen because it allows distinguishing between more and less stable liquid films and foams (Cascão-Pereira et al. 2003b; Mackie et al. 2001; Wierenga et al. 2009a). All used β-casein concentra-tions are above the critical micellization concentration (CMC) of this protein, which is 0.62 μM at 25°C (Portnaya et al. 2006).
Deionized water from Elix purification system (Millipore) was used for the prep-aration of all solutions. One millimolar NaCl (sodium chloride, Merck) was added in the solutions for the measurements with TLFs. All solutions were used overnight after the preparation. The acidity of the solutions was not adjusted—they were used at their natural pH = 6.1 ± 0.1. The experiments were carried out at a room tempera-ture of 25 ± 1°C.
table 18.1Chemical Composition of the Investigated Protein solutions
no. solution xβCs ctot (wt%)
1 1.5 μM BSA 0.00 0.010
2 1.4 μM BSA + 0.7 μM β-casein 0.33 0.011
3 1.2 μM BSA + 1.3 μM β-casein 0.52 0.011
4 0.75 μM BSA + 3.3 μM β-casein 0.82 0.013
5 6.7 μM β-casein 1.00 0.016
6 1.5 μM BSA + 6.7 μM β-casein 0.82 0.026
© 2014 by Taylor & Francis Group, LLC
442 Colloid and Interface Chemistry for Nanotechnology
18.2.2 experimentS with Single interfACeS
In these experiments, a buoyant bubble was formed at the tip of a U-shaped needle dipped in the aqueous phase. The bubble was observed by the instrument DSA100R (Krüss GmbH, Hamburg, Germany), and the surface tension, σ, was determined from the bubble instantaneous shape using the software DSA1 (Krüss GmbH). The decrease of surface tension was recorded during a period of 30 min after the bubble formation.
At a given moment (in our experiments—10 min from the beginning), sinusoidal oscillations of the bubble volume (and of its surface area) were applied to determine the surface dilatational storage and loss moduli, E′ and E″, following a standard procedure (Benjamins et al. 1996; Lucassen and van den Tempel 1972). The periods of oscillations varied from 1 to 20 s; the data were processed as described by Russev et al. (2008).
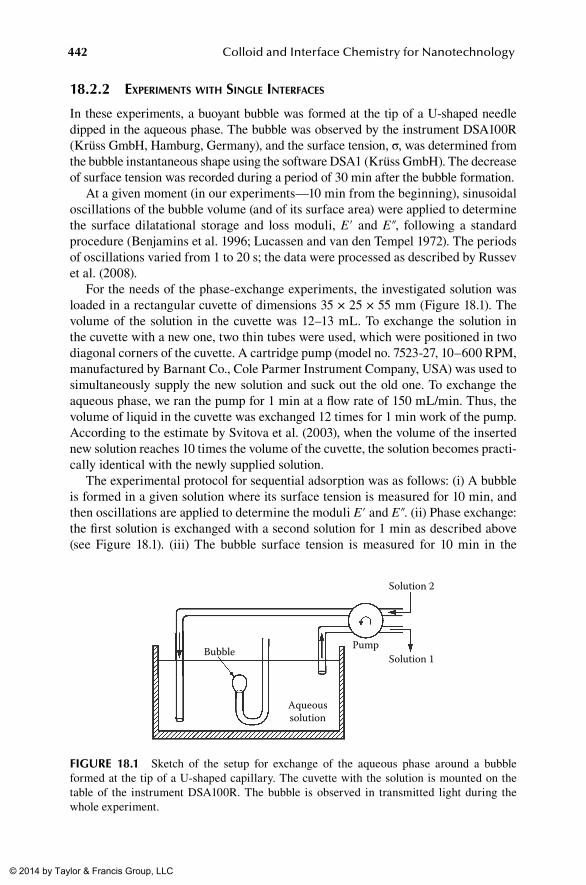
For the needs of the phase-exchange experiments, the investigated solution was loaded in a rectangular cuvette of dimensions 35 × 25 × 55 mm (Figure 18.1). The volume of the solution in the cuvette was 12–13 mL. To exchange the solution in the cuvette with a new one, two thin tubes were used, which were positioned in two diagonal corners of the cuvette. A cartridge pump (model no. 7523-27, 10–600 RPM, manufactured by Barnant Co., Cole Parmer Instrument Company, USA) was used to simultaneously supply the new solution and suck out the old one. To exchange the aqueous phase, we ran the pump for 1 min at a flow rate of 150 mL/min. Thus, the volume of liquid in the cuvette was exchanged 12 times for 1 min work of the pump. According to the estimate by Svitova et al. (2003), when the volume of the inserted new solution reaches 10 times the volume of the cuvette, the solution becomes practi-cally identical with the newly supplied solution.
The experimental protocol for sequential adsorption was as follows: (i) A bubble is formed in a given solution where its surface tension is measured for 10 min, and then oscillations are applied to determine the moduli E′ and E″. (ii) Phase exchange: the first solution is exchanged with a second solution for 1 min as described above (see Figure 18.1). (iii) The bubble surface tension is measured for 10 min in the
Bubble
Aqueoussolution
Solution 2
Solution 1Pump
FIGure 18.1 Sketch of the setup for exchange of the aqueous phase around a bubble formed at the tip of a U-shaped capillary. The cuvette with the solution is mounted on the table of the instrument DSA100R. The bubble is observed in transmitted light during the whole experiment.
© 2014 by Taylor & Francis Group, LLC
443Co-Adsorption of β-Casein and BSA in Relation to Liquid Films and Foams
second solution, and then oscillations are applied again to determine the new values of the moduli E′ and E″. Furthermore, in the same way the second solution can be exchanged with a third solution, and so on.
In some experiments, we exchanged the protein solution with pure water (“rins-ing” of the bubble). The aim of this experiment is to verify whether the protein desorbs from the bubble surface into the pure water, that is, whether the protein adsorption is irreversible. If the values of σ, E′, and E″ remain the same after the exchange of the protein solution with pure water, this would indicate that the protein adsorption is irreversible.
18.2.3 experimentS with thin foAm filmS
We used two devices for experiments with thin foam films. The first is the Scheludko–Exerowa (SE) cell with one side capillary (Scheludko 1967; Scheludko and Exerowa 1959). This cell can be applied to investigate both foam and emulsion films stabilized by proteins (Basheva et al. 2006, 2011; Marinova et al. 1997).
The second setup, called the “flush cell” for brevity, is a modification of the SE cell with two capillaries, which allows exchange of the solutions within the cell with a new solution (Wierenga et al. 2009a). The flush cell allows to adsorb a given pro-tein on the film surfaces and afterward to create a second adsorption layer from another protein (sequential adsorption).
The foam films were observed in reflected monochromatic light (564 nm, inter-ference filter) by using a Jenavert microscope (Carl Zeiss, Jena) equipped with a long working distance objective (×20). The film thickness was determined by the inter-ferometric method (Scheludko 1967). Substituting the refractive index of water, n = 1.33, in the basic formula of this method, we obtain the equivalent water thickness of the investigated films from the measured intensity of the reflected light.
Both the SE and flush cells can be used in the regimes of closed and open cell. In the case of “closed cell,” the water vapors in the gas phase around the film are equili-brated with the aqueous (film) phase, so that there is no evaporation of water from the film. In this case, the equilibrium capillary pressure of the meniscus around the film, which is counterbalanced by the film’s disjoining pressure, Π, can be estimated from the formula P R R rc c/= −2 2 2σ ( ), where R is the inner radius of the capillary cell and rc is the film radius (Nikolov and Wasan 1989). Using experimental parameter values, R = 1.2 mm, rc = 100 μm, and σ ≈ 50 mN/m, we estimate Pc ≈ 84 Pa for the SE cell.
In the case of “open cell,” the cover of the cell is removed so that evaporation of water from the film takes place. The evaporation drives a flux of water from the Plateau border around the film toward the center of the film. Under steady-state conditions, this hydrodynamic flux leads to a significant pressure difference, Pc ≈ 5 × 10⁵ Pa, between the film’s periphery and center (Basheva et al. 2011; Kralchevsky and Nagayama 2001). This pressure difference forces the two film surfaces against each other, which leads to overcoming of the soft electrostatic (double layer) repulsion between them. In this way, the film thickness becomes considerably smaller, approximately equal to the thickness of the two protein adsorption layers.
© 2014 by Taylor & Francis Group, LLC
444 Colloid and Interface Chemistry for Nanotechnology
In our experiments with the SE cell, foam films of radius rc = 100 μm were formed after 15 min aging of their surfaces and the film thinning was observed for 15 min in closed cell and for 1–2 min in open cell. Here, the SE cell was used to investigate the films in the case of parallel adsorption of the two proteins.
In the case of sequential adsorption of the two proteins, the experiments with foam films were carried out in the flush cell following the protocol given by Wierenga et al. (2009a). Again, films of radius rc = 100 μm were formed after 15 min aging of their surfaces and the film thinning was observed for 15 min in closed cell and for 1–2 min in open cell.
18.2.4 experimentS with foAmS
Foams were formed and observed by means of the Dynamic Foam Analyzer DFA100 (Krüss GmbH). In this instrument, the foam is formed by bubbling of gas through a glass porous frit into the foaming solution. The frit is mounted at the base of a glass cylinder of 40 mm inner diameter and 250 mm height. The height of the foam and of the liquid beneath (the serum) has been detected and recorded automatically by means of a computer-controlled linear LED panel and a line sensor mounted along the column height. The foam height is calculated as a difference between the upper and lower foam levels. For the used cylinder, a foam height of 10 mm corresponds to a foam volume of 12.56 mL.
The used foaming procedure was as follows: 50 mL of the solution was loaded into the cylinder and the gas was bubbling for 10 s with a flow rate of 0.5 L/min through a frit of porosity G2 (40–100 μm pore size). The foam decay was recorded for 1 h after the foaming. The glass column with the foam was sealed with Parafilm-M at the top, after ceasing of the bubbling, to prevent foam destruction because of water evaporation.
18.3 CharaCterIzatIon oF the ProteIn adsorPtIon layers
In this section, we present the experimental results. They are analyzed and discussed in Section 18.4.
18.3.1 SurfACe tenSion And dilAtAtionAl rheology
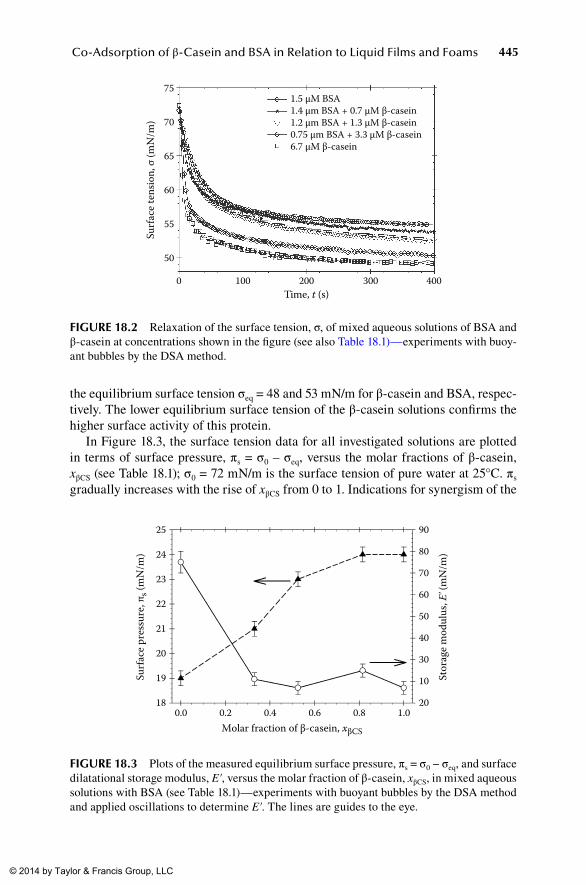
Figure 18.2 shows data for the relaxation of surface tension with time, σ(t), measured by the DSA method applied to buoyant bubbles (Figure 18.1). Measurements with solution nos. 1–5 in Table 18.1 have been carried out. The data in Figure 18.2 indicate that σ decreases faster with the rise of the β-casein concentration and molar fraction, xβCS. This can be explained by the fact that β-casein is more surface active than BSA (Graham and Phillips 1979) and by the circumstance that the used β-casein concen-trations are above the CMC of this protein (Portnaya et al. 2006).
At the longer times, the curves in Figure 18.2 follow the law (σ − σeq) ∝ t−1/2, which is the relaxation asymptotics in the case of adsorption under diffusion control (Sutherland 1952). The extrapolation of the σ versus t−1/2 dependence at t → ∞ yields
© 2014 by Taylor & Francis Group, LLC
445Co-Adsorption of β-Casein and BSA in Relation to Liquid Films and Foams
the equilibrium surface tension σeq = 48 and 53 mN/m for β-casein and BSA, respec-tively. The lower equilibrium surface tension of the β-casein solutions confirms the higher surface activity of this protein.
In Figure 18.3, the surface tension data for all investigated solutions are plotted in terms of surface pressure, πs = σ0 – σeq, versus the molar fractions of β-casein, xβCS (see Table 18.1); σ0 = 72 mN/m is the surface tension of pure water at 25°C. πs gradually increases with the rise of xβCS from 0 to 1. Indications for synergism of the
751.5 µM BSA1.4 µm BSA + 0.7 µM β-casein1.2 µm BSA + 1.3 µM β-casein0.75 µm BSA + 3.3 µM β-casein6.7 µM β-casein
70
65
60
55
50
0 100 200Time, t (s)
Surf
ace
tens
ion,
σ (m
N/m
)
300 400
FIGure 18.2 Relaxation of the surface tension, σ, of mixed aqueous solutions of BSA and β-casein at concentrations shown in the figure (see also Table 18.1)—experiments with buoy-ant bubbles by the DSA method.
25
24
23
22
21
20
19
180.0 0.2 0.4 0.6
Molar fraction of β-casein, xβCS
Surf
ace
pres
sure
, πs (
mN
/m)
Stor
age
mod
ulus
, E' (
mN
/m)
0.8 1.0
90
80
70
60
50
40
30
20
10
FIGure 18.3 Plots of the measured equilibrium surface pressure, πs = σ0 − σeq, and surface dilatational storage modulus, E′, versus the molar fraction of β-casein, xβCS, in mixed aqueous solutions with BSA (see Table 18.1)—experiments with buoyant bubbles by the DSA method and applied oscillations to determine E′. The lines are guides to the eye.
© 2014 by Taylor & Francis Group, LLC
446 Colloid and Interface Chemistry for Nanotechnology
two proteins (a local maximum in πs) are missing. The πs-versus-xβCS curve in Figure 18.3 indicates an increasing influence of the more surface active β-casein with the rise of its molar fraction.
Ten to fifteen minutes after the bubble formation, we applied oscillations of fre-quency 0.5 Hz to determine the surface dilatational storage and loss moduli, E′ and E″. As seen in Figure 18.3, there is a considerable difference between the two pro-teins with respect to the storage modulus: E′ = 76 mN/m for BSA versus 15 mN/m for β-casein. In other words, the adsorption layers from BSA are considerably more elastic. For the mixed solutions, xβCS = 0.33, 0.52, and 0.82, E′ is close to its value for β-casein alone. In other words, the β-casein dominates the surface elasticity in the case of simultaneous (parallel) adsorption of the two proteins. Concerning the loss modulus, E″, it gradually decreases with the rise of xβCS, from 11 mN/m for BSA to 7 mN/m for β-casein.
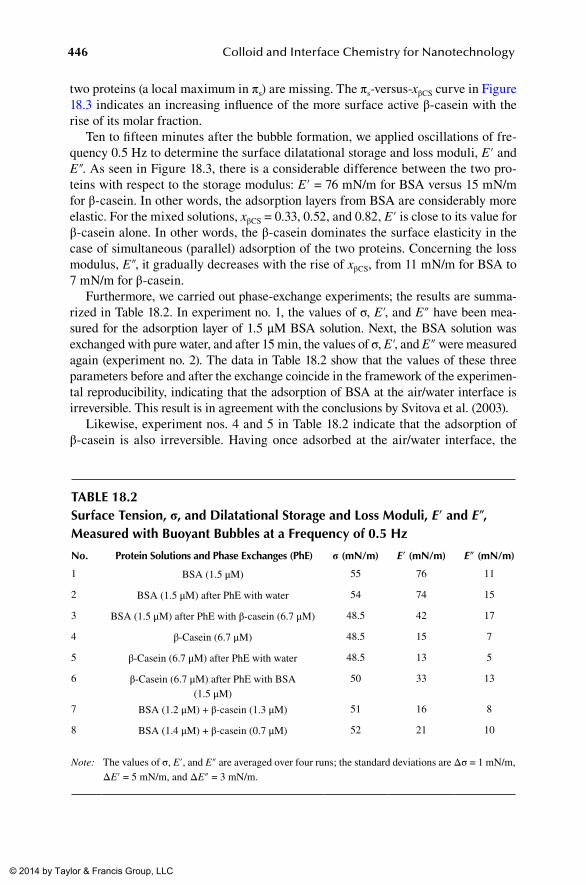
Furthermore, we carried out phase-exchange experiments; the results are summa-rized in Table 18.2. In experiment no. 1, the values of σ, E′, and E″ have been mea-sured for the adsorption layer of 1.5 μM BSA solution. Next, the BSA solution was exchanged with pure water, and after 15 min, the values of σ, E′, and E″ were measured again (experiment no. 2). The data in Table 18.2 show that the values of these three parameters before and after the exchange coincide in the framework of the experimen-tal reproducibility, indicating that the adsorption of BSA at the air/water interface is irreversible. This result is in agreement with the conclusions by Svitova et al. (2003).
Likewise, experiment nos. 4 and 5 in Table 18.2 indicate that the adsorption of β-casein is also irreversible. Having once adsorbed at the air/water interface, the
table 18.2surface tension, σ, and dilatational storage and loss Moduli, E′ and E″, Measured with buoyant bubbles at a Frequency of 0.5 hz
no. Protein solutions and Phase exchanges (Phe) σ (mn/m) E′ (mn/m) E″ (mn/m)
1 BSA (1.5 μM) 55 76 11
2 BSA (1.5 μM) after PhE with water 54 74 15
3 BSA (1.5 μM) after PhE with β-casein (6.7 μM) 48.5 42 17
4 β-Casein (6.7 μM) 48.5 15 7
5 β-Casein (6.7 μM) after PhE with water 48.5 13 5
6 β-Casein (6.7 μM) after PhE with BSA (1.5 μM)
50 33 13
7 BSA (1.2 μM) + β-casein (1.3 μM) 51 16 8
8 BSA (1.4 μM) + β-casein (0.7 μM) 52 21 10
Note: The values of σ, E′, and E″ are averaged over four runs; the standard deviations are Δσ = 1 mN/m, ΔE′ = 5 mN/m, and ΔE″ = 3 mN/m.
© 2014 by Taylor & Francis Group, LLC
447Co-Adsorption of β-Casein and BSA in Relation to Liquid Films and Foams
β-casein cannot be washed out by flushing with pure water. An analogous result was obtained by MacRitchie (1998) (see also the review by Fainerman et al. 2006).
The practically equal values of the loss modulus E″ before and after the exchange of the protein solution with pure water deserves a special discussion. This indicates that the energy dissipation (giving rise to E″) is not related to diffusion transport of protein molecules to/from the interface but is due to interfacial processes. Such processes can be the attachment/detachment of protein molecules to surface aggre-gates, the energy dissipation accompanying breakage and restoration of adhesive contacts between the adsorbed proteins, or conformational changes in their mol-ecules (Ivanov et al. 2005). In the case of BSA, the relatively great value of E″ is probably due to adhesive contacts between the molecules of this protein. An indication for the existence of such adhesive contacts is the fact that in the vicin-ity of the isoelectric point of BSA, where our experiments have been carried out, a bilayer (rather than monolayer) of BSA molecules is formed at the air/water inter-face (Engelhardt et al. 2012).
In another series of experiments, the bubble was first formed in a solution of BSA, which was subsequently exchanged with a β-casein solution (rather than with pure water) (compare experiment nos. 1 and 3 in Table 18.2). The surface tension σ drops from 55 mN/m for BSA to 48.5 mN/m after the phase exchange; the latter coincides with the value of σ for β-casein. However, the large storage modulus E′ = 42 mN/m (approximately two times greater than that of β-casein) indicates that BSA molecules are still present at the interface after the phase exchange.
The above experiment was carried out also in the opposite order: first, β-casein was adsorbed on the bubble surface and then the β-casein solution was replaced with a BSA solution (compare experiment nos. 4 and 6 in Table 18.2). After the phase exchange, the values of both σ and E′ are intermediate between the values for BSA and β-casein alone. In the two cases of sequential adsorption (experiment nos. 3 and 6 in Table 18.2), the dilatational loss modulus, E″, reaches its maximal values, indicating the formation of a thicker composite layer of the two proteins (see below).
Finally, the last two rows of Table 18.2 show data for the case of parallel adsorp-tion of β-casein and BSA. In this case, σ is intermediate between its values for β-casein and BSA, whereas the values of the storage modulus E′ are close to those for β-casein layers.
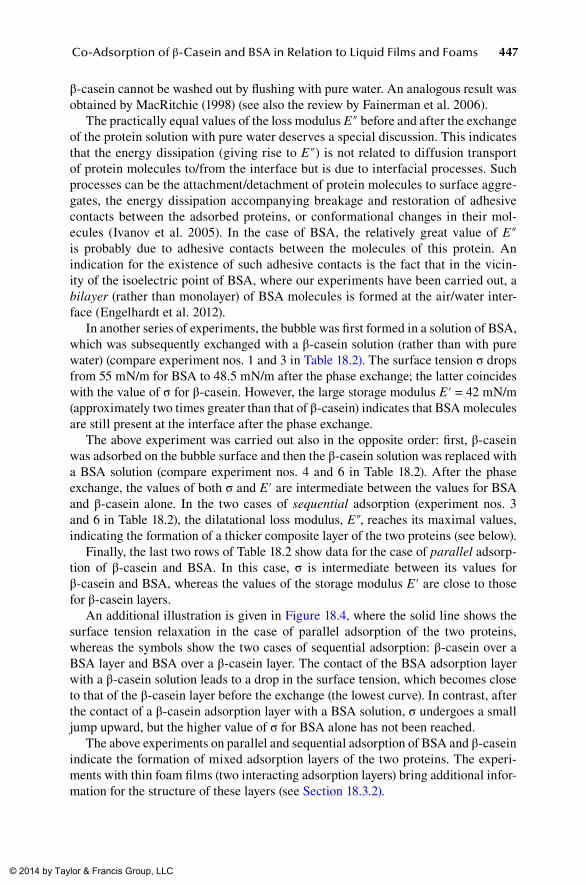
An additional illustration is given in Figure 18.4, where the solid line shows the surface tension relaxation in the case of parallel adsorption of the two proteins, whereas the symbols show the two cases of sequential adsorption: β-casein over a BSA layer and BSA over a β-casein layer. The contact of the BSA adsorption layer with a β-casein solution leads to a drop in the surface tension, which becomes close to that of the β-casein layer before the exchange (the lowest curve). In contrast, after the contact of a β-casein adsorption layer with a BSA solution, σ undergoes a small jump upward, but the higher value of σ for BSA alone has not been reached.
The above experiments on parallel and sequential adsorption of BSA and β-casein indicate the formation of mixed adsorption layers of the two proteins. The experi-ments with thin foam films (two interacting adsorption layers) bring additional infor-mation for the structure of these layers (see Section 18.3.2).
© 2014 by Taylor & Francis Group, LLC
448 Colloid and Interface Chemistry for Nanotechnology
18.3.2 thiCkneSS And StABility of the liquid filmS
We carried out experiments with free foam films in the SE and flush cells at con-centrations of BSA and β-casein corresponding to solution nos. 1, 3, 5, and 6 in Table 18.1 (xβCS = 0, 0.52, 0.82, and 1). In the closed cell, all films had a radius rc = 100 μm, which was maintained by control of the applied pressure, Pc. [We recall the relation P R R rc c/= −2 2 2σ ( ).] The thickness of these films (measured interferometri-cally) was greater than 100 nm for all investigated solutions. Such thick films have been observed in many experiments with protein solutions and explained with the long-range electrostatic (double layer) repulsion owing to the charge of the adsorbed protein molecules (Basheva et al. 2006; Dimitrova et al. 2004; Marinova et al. 1997).
To decrease the strong electrostatic repulsion in the investigated foam films, we added 1 mM NaCl to all solutions. This resulted in a decrease of the film thickness, h, from above 100 nm to approximately 80 nm for the films with β-casein and 41 nm for the films with BSA (see Table 18.3 and Figure 18.5, closed cell). The smaller thickness of the films from BSA evidences for a lower surface charge density. Note that for all investigated protein solutions with 1 mM NaCl, the Debye screening length is the same: κ−1 = 9.6 nm.
The soft character of the long-range double-layer repulsion leads to a sensitiv-ity of the film thickness, h, to the applied pressure, Pc: The increase of Pc leads to smaller values of h. This is the reason for the different h values reported for films from BSA solutions with 1 mM NaCl, varying from 8 to 80 nm (Cascão-Pereira et al. 2003b; Wierenga et al. 2009a; Yampolskaya and Platikanov 2006), which most probably correspond to different Pc values. In our experiments, all measured values of the film thickness h correspond to a film radius rc = 100 μm, which defines also
70
Proteinsolution
replacement
1.5 µM BSA + 6.7 µM β-cas1.5 µM BSA 6.7 µM β-cas
6.7 µM β-cas 1.5 µM BSA65
60
55
50
450 200 400 600
Time, t (s)
Surf
ace
tens
ion,
σ (m
N/m
)
800 1000 1200 1400
FIGure 18.4 Comparison of surface tension, σ, versus time, t, curves in the cases of parallel and sequential adsorption from solutions of BSA and β-casein. In the cases of sequential adsorption, approximately 900 s after the beginning of the experiment, the solu-tion of the first protein is replaced by a solution of the second protein using the device sketched in Figure 18.1.
© 2014 by Taylor & Francis Group, LLC
449Co-Adsorption of β-Casein and BSA in Relation to Liquid Films and Foams
the value of the capillary pressure Pc at a given σ. Thus, in the closed cell, the range of applied pressures was 81 < Pc < 89 Pa, the lowest limit being for β-casein alone, and the upper one, for BSA alone.
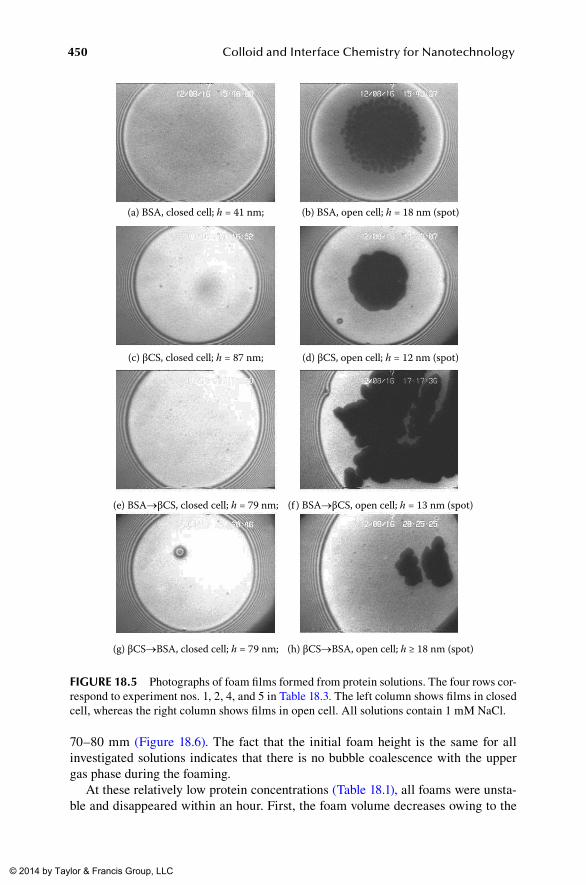
In the open cell, the pressure difference is much higher, Pc ≈ 5 × 10⁵ Pa (see above). At such high pressures, the long-range electrostatic repulsion is overcome and the two protein adsorption layers come into a direct contact; that is, we are deal-ing with a steric stabilization. This is evidenced by the appearance of dark spots, that is, films of smaller thickness in the open cell—see the right column of photos in Figure 18.5 (observations in reflected light). In Figure 18.5b and h (BSA-dominated films), the spots have an equivalent water thickness of 18 nm, but the films ruptured soon after the spot appearance. In Figure 18.5d and f (β-casein-dominated films), the spots have a smaller thickness, h = 12–13 nm, and the films remained stable despite the spot expansion.
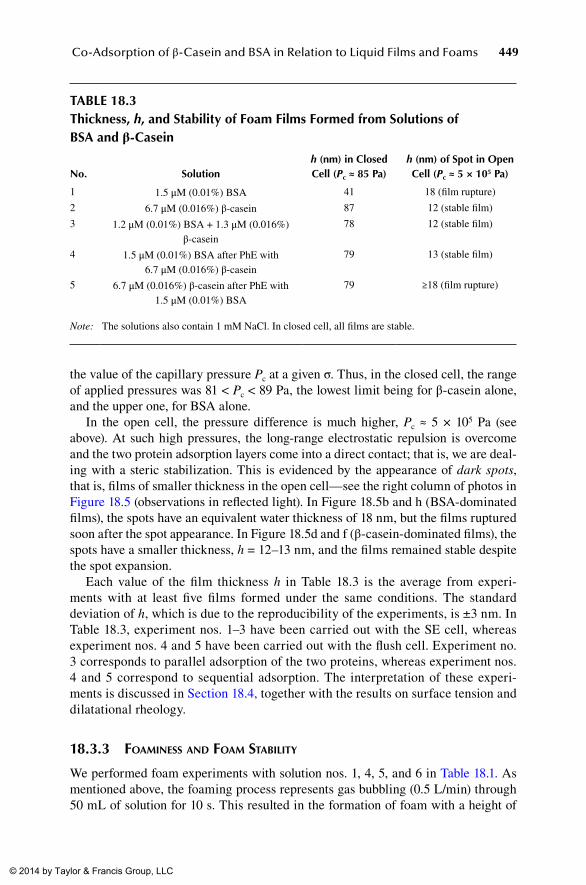
Each value of the film thickness h in Table 18.3 is the average from experi-ments with at least five films formed under the same conditions. The standard deviation of h, which is due to the reproducibility of the experiments, is ±3 nm. In Table 18.3, experiment nos. 1–3 have been carried out with the SE cell, whereas experiment nos. 4 and 5 have been carried out with the flush cell. Experiment no. 3 corresponds to parallel adsorption of the two proteins, whereas experiment nos. 4 and 5 correspond to sequential adsorption. The interpretation of these experi-ments is discussed in Section 18.4, together with the results on surface tension and dilatational rheology.
18.3.3 foAmineSS And foAm StABility
We performed foam experiments with solution nos. 1, 4, 5, and 6 in Table 18.1. As mentioned above, the foaming process represents gas bubbling (0.5 L/min) through 50 mL of solution for 10 s. This resulted in the formation of foam with a height of
table 18.3thickness, h, and stability of Foam Films Formed from solutions of bsa and β-Casein
no. solutionh (nm) in Closed Cell (Pc ≈ 85 Pa)
h (nm) of spot in open Cell (Pc ≈ 5 × 10⁵ Pa)
1 1.5 μM (0.01%) BSA 41 18 (film rupture)
2 6.7 μM (0.016%) β-casein 87 12 (stable film)
3 1.2 μM (0.01%) BSA + 1.3 μM (0.016%) β-casein
78 12 (stable film)
4 1.5 μM (0.01%) BSA after PhE with 6.7 μM (0.016%) β-casein
79 13 (stable film)
5 6.7 μM (0.016%) β-casein after PhE with 1.5 μM (0.01%) BSA
79 ≥18 (film rupture)
Note: The solutions also contain 1 mM NaCl. In closed cell, all films are stable.
© 2014 by Taylor & Francis Group, LLC
450 Colloid and Interface Chemistry for Nanotechnology
70–80 mm (Figure 18.6). The fact that the initial foam height is the same for all investigated solutions indicates that there is no bubble coalescence with the upper gas phase during the foaming.
At these relatively low protein concentrations (Table 18.1), all foams were unsta-ble and disappeared within an hour. First, the foam volume decreases owing to the
(a) BSA, closed cell; h = 41 nm; (b) BSA, open cell; h = 18 nm (spot)
(c) βCS, closed cell; h = 87 nm; (d) βCS, open cell; h = 12 nm (spot)
(e) BSA→βCS, closed cell; h = 79 nm; (f ) BSA→βCS, open cell; h = 13 nm (spot)
(g) βCS→BSA, closed cell; h = 79 nm; (h) βCS→BSA, open cell; h ≥ 18 nm (spot)
FIGure 18.5 Photographs of foam films formed from protein solutions. The four rows cor-respond to experiment nos. 1, 2, 4, and 5 in Table 18.3. The left column shows films in closed cell, whereas the right column shows films in open cell. All solutions contain 1 mM NaCl.
© 2014 by Taylor & Francis Group, LLC
451Co-Adsorption of β-Casein and BSA in Relation to Liquid Films and Foams
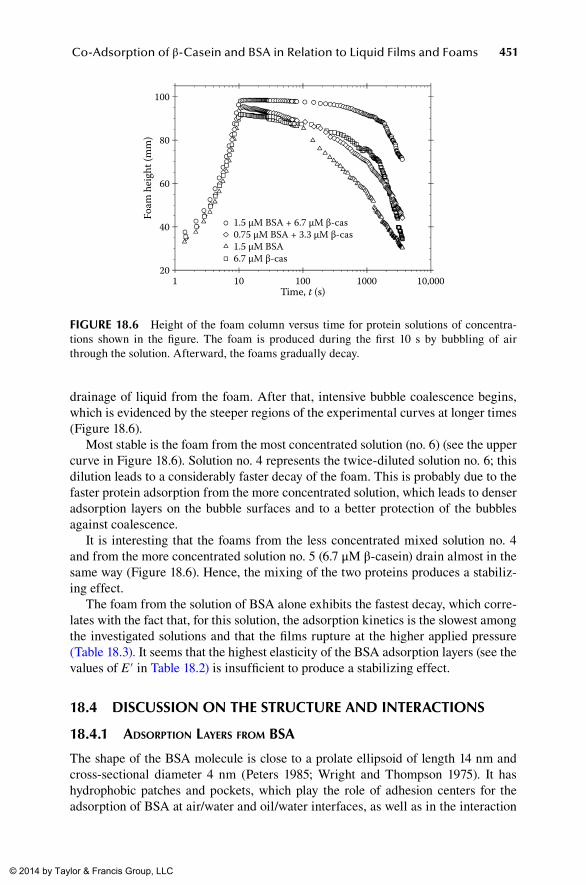
drainage of liquid from the foam. After that, intensive bubble coalescence begins, which is evidenced by the steeper regions of the experimental curves at longer times (Figure 18.6).
Most stable is the foam from the most concentrated solution (no. 6) (see the upper curve in Figure 18.6). Solution no. 4 represents the twice-diluted solution no. 6; this dilution leads to a considerably faster decay of the foam. This is probably due to the faster protein adsorption from the more concentrated solution, which leads to denser adsorption layers on the bubble surfaces and to a better protection of the bubbles against coalescence.
It is interesting that the foams from the less concentrated mixed solution no. 4 and from the more concentrated solution no. 5 (6.7 μM β-casein) drain almost in the same way (Figure 18.6). Hence, the mixing of the two proteins produces a stabiliz-ing effect.
The foam from the solution of BSA alone exhibits the fastest decay, which corre-lates with the fact that, for this solution, the adsorption kinetics is the slowest among the investigated solutions and that the films rupture at the higher applied pressure (Table 18.3). It seems that the highest elasticity of the BSA adsorption layers (see the values of E′ in Table 18.2) is insufficient to produce a stabilizing effect.
18.4 dIsCussIon on the struCture and InteraCtIons
18.4.1 AdSorption lAyerS from BSA
The shape of the BSA molecule is close to a prolate ellipsoid of length 14 nm and cross-sectional diameter 4 nm (Peters 1985; Wright and Thompson 1975). It has hydrophobic patches and pockets, which play the role of adhesion centers for the adsorption of BSA at air/water and oil/water interfaces, as well as in the interaction
100
80
60
1.5 µM BSA + 6.7 µM β-cas0.75 µM BSA + 3.3 µM β-cas1.5 µM BSA6.7 µM β-cas
40
201 10 100
Time, t (s)
Foam
hei
ght (
mm
)
1000 10,000
FIGure 18.6 Height of the foam column versus time for protein solutions of concentra-tions shown in the figure. The foam is produced during the first 10 s by bubbling of air through the solution. Afterward, the foams gradually decay.
© 2014 by Taylor & Francis Group, LLC
452 Colloid and Interface Chemistry for Nanotechnology
of BSA with surfactants (Díaz et al. 2003; Zhang et al. 2011). In the vicinity of the isoelectric point, the BSA adsorption layer represents a bilayer (Engelhardt et al. 2012). A foam film with BSA bilayers at its surfaces is sketched in Figure 18.7a. The equivalent water thickness of the black spots in the films from BSA solutions is h = 18 nm (Figure 18.5b and Table 18.3), which corresponds to a real thickness of 18 × 1.33/1.45 ≈ 16 nm, where 1.45 is a typical value for the refractive index of proteins (Russev et al. 2000). The latter thickness corresponds to two bilayers (like those in Figure 18.7a) in contact: 4 layers × 4 nm = 16 nm. At 1 mM added NaCl, the appear-ance of BSA film of equivalent water thickness 18 nm leads to film destabilization and rupture. Similar results have been obtained by Cascão-Pereira et al. (2003b). At a higher salt concentration (25 mM NaCl), or at the lower pH = 5.2, the latter authors have observed stable films of thickness h = 18 nm, which thin down to h = 8.6 nm (approximately two monolayers) if the two film surfaces are pressed stronger against each other. In other words, the two inner layers of BSA (Figure 18.7a) are loosely attached and can be squeezed out of the film at higher pressures. The formation of a weakly attached sublayer has been observed also with β-casein at higher concentra-tions (Grigoriev et al. 2002).
The relatively high storage modulus, E′, of the BSA adsorption layers (see experi-ment no. 1 in Table 18.2) can be attributed to the rigid packing of the polypep-tide chain in the BSA molecules, which is stabilized by 17 disulfide bonds. In other
(a)
(b)
(c)
Air
Air
Water
Air β-Casein
β-Casein
Air
Water
Air BSA
Air
Water
BSA
FIGure 18.7 Models of foam films from solutions of (a) BSA, (b) β-casein, and (c) their mixture in the case of parallel adsorption, constructed on the basis of the data for σ, E′, and h (Tables 18.2 and 18.3 and Figures 18.1 through 18.5).
© 2014 by Taylor & Francis Group, LLC
453Co-Adsorption of β-Casein and BSA in Relation to Liquid Films and Foams
words, the dilatational elasticity of the BSA adsorption layers (Figure 18.7a) is most probably due to the elastic response of the relatively rigid BSA molecules when sub-jected to compression or expansion.
18.4.2 AdSorption lAyerS from β-CASein
The β-casein molecule consists of a shorter hydrophilic part (≈20%) and a longer hydrophobic part (≈80%). The hydrophilic chain includes the amino acids at position from 1 to 43 at the N-terminus. This chain has 21 negative charges and 5 positive charges, so that its net charge is −16 (Farrell et al. 2001). If the length per amino acid residue is 0.3 nm (Horne 2006), then the length of the extended hydrophilic chain of β-casein is approximately 13 nm. However, in water, this chain forms an undulated tail of end-to-end distance that could be about twice shorter.
The remaining 80% of the β-casein molecule is very hydrophobic; its net charge is either +1 or +2, depending on the pH. The water is a poor solvent for this chain, so that the β-casein forms micelles of diameter ≈13 nm in aqueous solutions (Portnaya et al. 2006). Upon adsorption at the air/water interface, the hydrophobic chain of the β-casein molecule forms trains and loops, whereas the charged hydrophilic part protrudes as a tail in the water phase (Graham and Phillips 1979) (see Figure 18.7b). A compression of the β-casein adsorption layer results in the increase of the rela-tive part of the loops with respect to those of the trains. The relatively low values of the storage modulus E′ (see experiment nos. 4 and 5 in Table 18.2) means that these train-to-loop transformations are accompanied with relatively small changes in the elastic energy of the molecule (in comparison with the deformations of the more rigid BSA molecule). The 12 nm thickness of the thinnest films with β-casein (experiment no. 2 in Table 18.3) can be explained with the steric overlap repulsion (Israelachvili 2011), which is due to the protruding hydrophilic parts of the β-casein molecules (see Figure 18.7b).
18.4.3 pArAllel AdSorption of BSA And β-CASein
In this case, the surface tension, σ, has intermediate values between those for BSA and β-casein, whereas the values of the storage modulus, E′, are close to those for β-casein (see experiment nos. 7 and 8 in Table 18.2). In addition, the 12 nm film thickness at high pressure is identical with that for the case of β-casein alone (com-pare experiment nos. 2 and 3 in Table 18.3).
The above experimental facts can be explained with the attachment of both β-casein and BSA molecules at the air/water interface, as sketched in Figure 18.7c. This can explain the intermediate value of σ. Moreover, surface compres-sions and expansions would result in deformations of the adsorbed flexible chain of the β-casein (which undergoes train-to-loop transformations), whereas the more rigid BSA molecules are not deformed. This could explain why the values of E′ are close to those for β-casein. Finally, the 12 nm thickness of the thinnest films with β-casein can be attributed to the steric overlap repulsion owing to the protruding hydrophilic portions of the β-casein molecules (compare Figure 18.7b and c).
© 2014 by Taylor & Francis Group, LLC
454 Colloid and Interface Chemistry for Nanotechnology
18.4.4 SequentiAl AdSorption of BSA And β-CASein
Let us begin with the case where the BSA adsorbs first, and then the aqueous phase is exchanged with a β-casein solution. After the exchange, the surface tension σ decreases from its value for BSA to that for β-casein, but E′ remains considerably greater than for β-casein (see Figure 18.4 and experiment no. 3 in Table 18.2). At the higher pressure, the respective foam films are stable and have a thickness of 13 nm, almost the same as in the case of β-casein alone (compare experiment nos. 2 and 4 in Table 18.3).
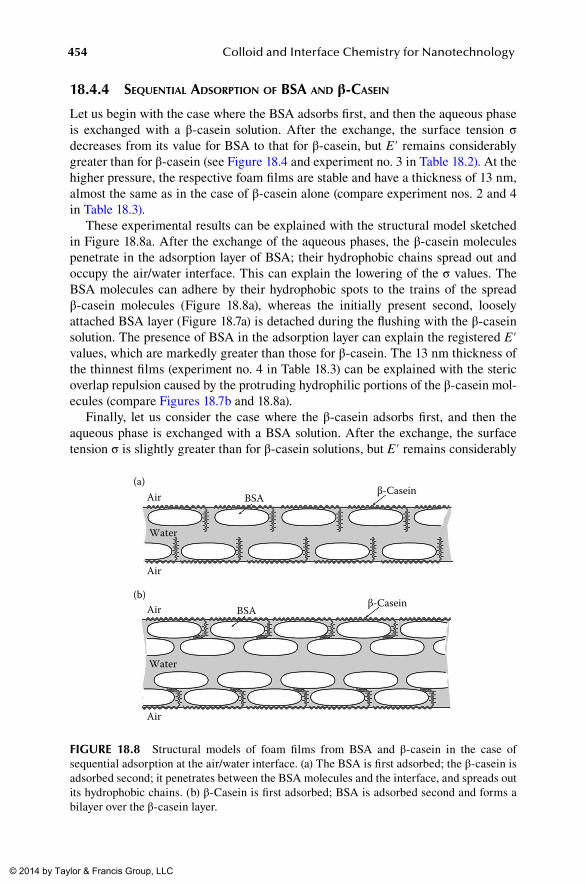
These experimental results can be explained with the structural model sketched in Figure 18.8a. After the exchange of the aqueous phases, the β-casein molecules penetrate in the adsorption layer of BSA; their hydrophobic chains spread out and occupy the air/water interface. This can explain the lowering of the σ values. The BSA molecules can adhere by their hydrophobic spots to the trains of the spread β-casein molecules (Figure 18.8a), whereas the initially present second, loosely attached BSA layer (Figure 18.7a) is detached during the flushing with the β-casein solution. The presence of BSA in the adsorption layer can explain the registered E′ values, which are markedly greater than those for β-casein. The 13 nm thickness of the thinnest films (experiment no. 4 in Table 18.3) can be explained with the steric overlap repulsion caused by the protruding hydrophilic portions of the β-casein mol-ecules (compare Figures 18.7b and 18.8a).
Finally, let us consider the case where the β-casein adsorbs first, and then the aqueous phase is exchanged with a BSA solution. After the exchange, the surface tension σ is slightly greater than for β-casein solutions, but E′ remains considerably
(a)Air BSA
β-Casein
Air
Water
Air BSAβ-Casein
Air
Water
(b)
FIGure 18.8 Structural models of foam films from BSA and β-casein in the case of sequential adsorption at the air/water interface. (a) The BSA is first adsorbed; the β-casein is adsorbed second; it penetrates between the BSA molecules and the interface, and spreads out its hydrophobic chains. (b) β-Casein is first adsorbed; BSA is adsorbed second and forms a bilayer over the β-casein layer.
© 2014 by Taylor & Francis Group, LLC
455Co-Adsorption of β-Casein and BSA in Relation to Liquid Films and Foams
greater than for β-casein (see Figure 18.4 and experiment no. 6 in Table 18.2). In addition, at the higher pressure, the respective foam films have a thickness close to that for BSA alone, and like them, they are unstable and rupture soon after the spot formation (compare experiment nos. 1 and 5 in Table 18.3).
These results can be explained with the structural model sketched in Figure 18.8b. After the exchange of the aqueous phases, the β-casein adsorption layer is brought into contact with a BSA solution. BSA molecules adsorb on the hydro-phobic chains of β-casein, and afterward, a second BSA layer is formed just as in Figure 18.7a. Because the hydrophilic chains of the β-casein molecules are built in the BSA bilayer, the steric overlap repulsion caused by the β-casein chains is absent, and the film behavior is dominated by the BSA (Figure 18.8b), which leads to film rupture at the higher applied pressures as in the case sketched in Figure 18.7a.
18.5 suMMary and ConClusIons
In the present study, we combined surface tension and dilatational rheology mea-surements with experiments on TLFs to investigate the properties and structure of mixed adsorption layers from the proteins BSA and β-casein and the stability of the respective foam films. These two proteins, which find applications in aerated and emulsified foods, are rather different in structure and properties. The molecule of BSA is 2.8 times bigger than that of β-casein by mass and represents a rigid globule stabilized by 17 disulfide bonds. In contrast, the β-casein molecule has no disulfide bonds. It is a disordered protein consisting of 20% hydrophilic chain and 80% hydro-phobic chain. For this reason, the β-casein is strongly amphiphilic: in the bulk, it forms micelles, whereas at the air/water interface, its hydrophobic part forms trains and loops, whereas its hydrophilic part protrudes as a tail into the water phase. Our goal is to investigate how these two quite different macromolecules interact in mixed adsorption layers and how the combination of their properties affects the stability of liquid films and foams.
Our experiments showed that in the investigated range of concentrations, the adsorption layers from β-casein have a lower surface tension and dilatational elastic-ity than the adsorption layers from BSA. At low applied pressures (in closed cell), the foam films from the aqueous solutions of both proteins are thick and electrostatically stabilized. However, at high applied pressures (in open cell), the films with β-casein are stable, whereas those with BSA are unstable.
In the case of mixed adsorption layers, we investigated the cases of parallel and sequential adsorption of the two proteins. The experiments show that adsorption layers and films of different properties and stability are obtained depending on the order of protein adsorption. The analysis of the whole set of data allowed us to draw conclusions about the possible structure of the formed adsorption layers. The experi-ments indicate that in the case of parallel adsorption, β-casein molecules are situated among the BSA molecules at the interface, thus lowering the surface tension and elasticity (Figure 18.7c). In the case of sequential adsorption, the situation is different depending on whether BSA or β-casein adsorbs first. If β-casein adsorbs first, the film behavior is dominated by the BSA, and the films are unstable under high applied pressures. In contrast, if BSA adsorbs first, the surface tension is relatively low, the
© 2014 by Taylor & Francis Group, LLC
456 Colloid and Interface Chemistry for Nanotechnology
surface elasticity is high, and the foam films are stable, which is the most favorable combination.
The results can be useful for the design and control of the properties of foams and emulsions stabilized by protein mixtures.
aCknowledGMents
The authors gratefully acknowledge the support from the National Science Fund of Bulgaria (grant no. DO-02-121/2009) and from the ESF COST Actions D43 and CM1101.
reFerenCes
Bantchev, G. B. and Schwartz, D. K. 2004. Structure of β-casein layers at the air/solution interface: atomic force microscopy studies of transferred layers. Langmuir 20:11692–7.
Basheva E. S., Gurkov, T. D., Christov, N. C. and Campbell, B. 2006. Interactions in oil/water/oil films stabilized by β-lactoglobulin; role of the surface charge. Colloids Surf. A, 282:99–108.
Basheva, E. S., Kralchevsky, P. A., Christov, N. C., Danov, K. D., Stoyanov, S. D., Blijdenstein, T. B. J. et al. 2011. Unique properties of bubbles and foam films stabilized by HFBII hydrophobin. Langmuir 27:2382–92.
Benjamins, J., Cagna, A. and Lucassen-Reynders, E. H. 1996. Viscoelastic properties of triac-ylglycerol/water interfaces covered by proteins. Colloids Surf. A, 114:245–54.
Cabrerizo-Vilchez, M. A., Wege, H. A., Holgado-Terriza, J. A. and Neumann, A. W. 1999. Axisymmetric drop shape analysis as penetration Langmuir balance. Rev. Sci. Instrum. 70:2438–44.
Cascão-Pereira, L. G., Theodoly, O., Blanch, H. W. and Radke, C. J. 2003a. Dilatational rheol-ogy of BSA conformers at the air/water interface. Langmuir 19:2349–56.
Cascão-Pereira, L. G., Johansson, C., Radke, C. J. and Blanch, H. W. 2003b. Surface forces and drainage kinetics of protein-stabilized aqueous films. Langmuir 19:7503–13.
Damodaran, S. 2004. Adsorbed layers formed from mixtures of proteins. Curr. Opin. Colloid Interface Sci. 9:328–39.
Danov, K. D., Radulova, G. M., Kralchevsky, P. A., Golemanov, K. and Stoyanov, S. D. 2012. Surface shear rheology of hydrophobin adsorption layers: laws of viscoelastic behaviour with applications to long-term foam stability. Faraday Discuss. 158:195–221.
Díaz, X., Abuin, E. and Lissi, E. 2003. Quenching of BSA intrinsic fluorescence by alkyl-pyridinium cations Its relationship to surfactant-protein association. J. Photochem. Photobiol. A, 155:157–62.
Dickinson, E. 2001. An Introduction to Food Colloids. Oxford University Press, Oxford.Dickinson, E., Horne, D. S., Phipps, J. S. and Richardson, R. M. 1993. A neutron reflectivity
study of the adsorption of beta-casein at fluid interfaces. Langmuir 9:242–8.Dimitrova, T. D., Leal-Calderon, F., Gurkov, T. D. and Campbell, B. 2004. Surface forces
in model oil-in-water emulsions stabilized by proteins. Adv. Colloid Interface Sci. 108:73–86.
Engelhardt, K., Rumpel, A., Walter, J., Dombrowski, J., Kulozik, U., Braunschweig, B. et al. 2012. Protein adsorption at the electrified air–water interface: implications on foam stability. Langmuir 28:7780−7.
Fainerman, V. B., Miller, R., Ferri, J. K., Watzke, H., Leser, M. E. and Michel, M. 2006. Reversibility and irreversibility of adsorption of surfactants and proteins at liquid inter-faces. Adv. Colloid Interface Sci. 123:163–71.
© 2014 by Taylor & Francis Group, LLC
457Co-Adsorption of β-Casein and BSA in Relation to Liquid Films and Foams
Farrell Jr., H. M., Wickham, E. D., Unruh, J. J., Qi, P. X. and Hoagland, P. D. 2001. Secondary structural studies of bovine caseins: temperature dependence of β-casein structure as analyzed by circular dichroism and FTIR spectroscopy and correlation with micelliza-tion. Food Hydrocolloids 15:341–54.
Ferri, J. K., Gorevski, N., Kotsmar, Cs., Leser, M. E. and Miller, R. 2008. Desorption kinetics of surfactants at fluid interfaces by novel coaxial capillary pendant drop experiments. Colloids Surf. A, 319:13–20.
Ferri, J. K., Kotsmar, Cs. and Miller, R. 2010. From surfactant adsorption kinetics to asym-metric nanomembrane mechanics: Pendant drop experiments with subphase exchange. Adv. Colloid Interface Sci. 161:29–47.
Foegeding, E. A., Luck, P. J. and Davis, J. P. 2006. Factors determining the physical properties of protein foams. Food Hydrocolloids 20:284–92.
Graham, D. E. and Phillips, M. C. 1979. Proteins at liquid interfaces III. Molecular structures of adsorbed films. J. Colloid Interface Sci. 70:427–39.
Grigoriev, D. O., Fainerman, V. B., Makievski, A. V., Krägel, J., Wüstneck, R. and Miller, R. 2002. β-Casein bilayer adsorption at the solution/air interface: experimental evidences and theoretical description. J. Colloid Interface Sci. 253:257–64.
Hoorfar, M. and Neumann, A.W. 2006. Recent progress in axisymmetric drop shape analysis (ADSA). Adv. Colloid Interface Sci. 121:25–49.
Horne, D. S. 2006. Casein micelle structure: models and muddles. Curr. Opin. Colloid Interface Sci. 11:148–53.
Israelachvili, J. N. 2011. Intermolecular and Surface Forces, 3rd ed. Academic Press, New York.
Ivanov, I. B. Danov, K. D., Ananthapadmanabhan, K. P. and Lips, A. 2005. Interfacial rheol-ogy of adsorbed layers with surface reaction: on the origin of the dilatational surface viscosity, Adv. Colloid Interface Sci. 114:61–92.
Kotsmar, Cs., Pradines, V., Alahverdjieva, V.S., Aksenenko, E.V., Fainerman, V.B., Kovalchuk, V.I. et al. 2009. Thermodynamics, adsorption kinetics and rheology of mixed protein–surfactant interfacial layers. Adv. Colloid Interface Sci. 150:41–54.
Kralchevsky, P. A. and Nagayama, K. 2001. Particles at fluid interfaces and membranes. Chapter 14. Elsevier, Amsterdam.
Lucassen, J. and van den Tempel, M. 1972. Dynamic measurements of dilatational properties of a liquid interface, Chem. Eng. Sci. 27:1283–91.
Mackie, A. R., Gunning, A. P., Ridout, M. J., Wilde, P. J. and Morris, V.J. 2001. Orogenic displacement in mixed β-lactoglobulin/β-casein films at the air/water interfac. Langmuir 17:6593–8.
MacRitchie, F. 1998. Reversibility of protein adsorption. In: Proteins at Liquid Interfaces, eds. D. Möbius and R. Miller, 149–177. Elsevier, Amsterdam.
Maldonado-Valderrama, J., Martín-Molina, A., Martín-Rodriguez, A., Cabrerizo-Vílchez, M. A., Gálvez-Ruiz, M. J. and Langevin, D. 2007. Surface properties and foam stability of protein/surfactant mixtures: theory and experiment. J. Phys. Chem. C, 111: 2715–23.
Marinova, K. G., Gurkov, T. D., Velev, O. D., Ivanov, I. B., Campbell B. and Borwankar, R. P. 1997. The role of additives for the behaviour of thin emulsion films stabilised by pro-teins. Colloids Surf. A, 123, 155–67.
Marinova, K. G., Basheva, E. S., Nenova, B., Temelska, M., Mirarefi, A. Y., Campbell, B. et al. 2009. Physico-chemical factors controlling the foamability and foam stability of milk proteins: Sodium caseinate and whey protein concentrates. Food Hydrocolloids 23:1864–76.
McClements, D. J. 2005. Food Emulsions: Principles, Practices, and Techniques; 2nd edition. CRC Press, Boca Raton.
Merz, J., Burghoff, B., Zorn, H. and Schembecker, G. 2001. Continuous foam fractionation: Performance as a function of operating variables. Sep. Purif. Technol 82:10–18.
© 2014 by Taylor & Francis Group, LLC
458 Colloid and Interface Chemistry for Nanotechnology
Nikolov, A. D. and Wasan, D. T. 1989. Ordered micelle structuring in thin films formed from anionic surfactant solutions. I. Experimental. J. Colloid Interface Sci. 133:1–12.
Peters, T., Jr. 1985. Serum albumin. Adv. Protein Chem. 37:161–245.Portnaya, I., Cogan, U., Livney, Y. D., Ramon, O., Shimoni, K., Rosenberg, M. and Danino, D.
2006. Micellization of bovine β-casein studied by isothermal titration microcalorimetry and cryogenic transmission electron microscopy. J. Agric. Food Chem. 54:5555–61.
Rotenberg, Y., Boruvka, L. and Neumann, A. W. 1983. Determination of surface tension and contact angle from the shapes of axisymmetric fluid interfaces. J. Colloid Interface Sci. 93:169–83.
Russev, S. C., Arguirov, T. V. and Gurkov, T. D. 2000. Beta-casein adsorption kinetics on air-water and oil-water interfaces studied by ellipsometry. Colloids Surf. B 19:89–100.
Russev, S. C., Alexandrov, N., Marinova, K. G., Danov, K. D., Denkov, N. D. Lyutov, L. et al. 2008. Instrument and methods for surface dilatational rheology measurements. Rev. Scientific Instrum. 79:104102.
Saint-Jalmes, A., Peugeot, M.-L., Ferraz, H. and Langevin, D. 2005. Differences between protein and surfactant foams: microscopic properties, stability and coarsening. Colloids Surf. A, 263:219–25.
Scheludko, A. and Exerowa, D. 1959. Device for interferometric measurement of the thickness of microscopic foam films. Comm. Dept. Chem. Bulg. Acad. Sci. 7:123–32.
Sengupta, T. and Damodaran, S. 2000. Incompatibility and phase separation in bovine serum albumin/b-casein/water ternary film at the air–water interface. J. Colloid Interface Sci. 229:21–28.
Sheludko, A. 1967. Thin liquid films. Adv. Colloid Interface Sci. 1:391–464.Sutherland, K. L. 1952. The kinetics of adsorption at liquid surfaces. Aust. J. Sci. Res.
5:683– 96; http://dx.doi.org/10.1071/CH9520683.Svitova, T. F., Wetherbee, M. J. and Radke, C. J. 2003. Dynamics of surfactant sorption at the
air/water interface: continuous-flow tensiometry. J. Colloid Interface Sci. 261:170–9.Svitova, T. F. and Radke, C. J. 2005. AOT and Pluronic F68 coadsorption at fluid/fluid inter-
faces: A continuous-flow tensiometry study. Ind. Eng. Chem. Res. 44:1129–38.Tcholakova, S., Mitrinova, Z., Golemanov, K., Denkov, N. D., Vethamuthu, M. and Anan-
thapadmanabhan, K. P. 2011. Control of Ostwald ripening by using surfactants with high surface modulus. Langmuir 27:14807–19.
Wierenga, P. A., Basheva, E. S. and Denkov, N. D. 2009a. Modified capillary cell for foam film studies allowing exchange of the film-forming liquid. Langmuir 25:6035–9.
Wierenga, P. A., van Norél, L. and Basheva, E. S. 2009b. Reconsidering the importance of interfacial properties in foam stability. Colloids Surf. A 344:72–8.
Wright, A. K., Thompson, M. R. 1975. Hydrodynamic structure of bovine serum albumin determined by transient electric birefringence. Biophys. J. 15:137–41.
Yampolskaya, G. and Platikanov, D. 2006. Proteins at fluid interfaces: adsorption layers and thin liquid films. Adv. Colloid Interface Sci. 128:159–183.
Zhang, J., Gao, Y., Su, F. Gong, Zh. and Zhang, Y. 2011. Interaction characteristics with bovine serum albumin and retarded nitric oxide release of ZCVI4-2, a new nitric oxide-releasing derivative of oleanolic acid. Chem. Pharm. Bull. 59(6) 734–41.
Zhang, Z., Dalgleish, D. G. and Goff, H. D. 2004. Effect of pH and ionic strength on competi-tive protein adsorption to air/water interfaces in aqueous foams made with mixed milk proteins. Colloids Surf. B 34:113–21.
© 2014 by Taylor & Francis Group, LLC

![Adsorption of Milk Proteins (-Casein and -Lactoglobulin ... · protein with a random coil conformation in solution, but recent studies have challenged this view [16]. On the contrary,](https://static.fdocument.org/doc/165x107/5fa3935da2da091e9e210d6e/adsorption-of-milk-proteins-casein-and-lactoglobulin-protein-with-a-random.jpg)