Reaction Mechanism in Crystalline Solids: Kinetics and ...
27
S1 Reaction Mechanism in Crystalline Solids: Kinetics and Conformational Dynamics of the Norrish Type II Biradicals from α -Adamantyl p-Methoxyacetophenone Gregory Kuzmanich, † Cortnie S. Vogelsberg, † Emily F. Maverick, † José Carlos Netto-Ferreira, ‡ J. C. Scaiano, ‡ and Miguel A. Garcia-Garibay †* † Department of Chemistry and Biochemistry, University of California, Los Angeles, CA 90095-1569, USA. ‡ Department of Chemistry and Centre for Catalysis Research and Innovation, University of Ottawa, Ottawa, Ontario, Canada Contents Page Numbers General Synthetic, Computational, and Solid-State NMR Methods S2 Synthetic Procedures and Characterization of 1, 1-d 3 , and 1-d 7 S4 Synthesis of Nanocrystalline Suspensions of 1 S8 X-Ray Powder Diffraction of Bulk and Nanocrystalline 1 S8 Dynamic Light Scattering and Scanning Electron Microscopy of 1 S9 Quantum Yield Determination of 1 in Acetonitrile and as a Nanocrystalline Suspension S10 Representative Solid-State NMR Spectra of 1, 1-d 3 , and 1-d 7 S11 Comparison of the Experimental Constant C of the Kubo-Tomita Relaxation Expression with the Experimental Proton Second Moment S20 Thermal Motion Analysis: Results from Crystal Structures at 100, 200 and 300K, using THMA14C S21 Force Field Rotational Potential in Crystals of 1 S26 References S27
Transcript of Reaction Mechanism in Crystalline Solids: Kinetics and ...
S1
Reaction Mechanism in Crystalline Solids: Kinetics and Conformational Dynamics of the
Norrish Type II Biradicals from α-Adamantyl p-Methoxyacetophenone
Gregory Kuzmanich,† Cortnie S. Vogelsberg,† Emily F. Maverick,† José Carlos Netto-Ferreira,‡ J. C. Scaiano,‡ and Miguel A. Garcia-Garibay†*
† Department of Chemistry and Biochemistry, University of California, Los Angeles, CA 90095-1569, USA.
‡ Department of Chemistry and Centre for Catalysis Research and Innovation, University of Ottawa, Ottawa, Ontario,
Canada
Contents Page Numbers
General Synthetic, Computational, and Solid-State NMR Methods S2
Synthetic Procedures and Characterization of 1, 1-d3, and 1-d7 S4
Synthesis of Nanocrystalline Suspensions of 1 S8
X-Ray Powder Diffraction of Bulk and Nanocrystalline 1 S8
Dynamic Light Scattering and Scanning Electron Microscopy of 1 S9
Quantum Yield Determination of 1 in Acetonitrile
and as a Nanocrystalline Suspension S10
Representative Solid-State NMR Spectra of 1, 1-d3, and 1-d7 S11
Comparison of the Experimental Constant C of the Kubo-Tomita Relaxation Expression
with the Experimental Proton Second Moment S20
Thermal Motion Analysis: Results from Crystal Structures at 100, 200 and 300K,
using THMA14C S21
Force Field Rotational Potential in Crystals of 1 S26
References S27
S2
General Methods. All chemicals were purchased from Sigma-Aldrich Co. Inc. and used without further
purification, except for anisole-d3 and anisole-d8 which were purchased from Cambridge Isotope Laboratories.
Anhydrous dichloromethane (DCM) was acquired via distillation from sodium. Silica used for purification was
Silica-P flash silica gel (40-62 Å), purchased from SiliCycle Inc. Solution 1H and 13C NMR spectra were
acquired on a Bruker Avance AV300. FT-IR spectra were obtained with a Perkin-Elmer Spectrum instrument
equipped with a universal attenuated total reflectance (ATR) accessory. Gas chromatography data were
acquired on a Hewlett-Packard 5890 series II gas chromatograph equipped with an HP3396 series II integrator
and an HP-5 capillary column of dimensions 25 m × 0.2 mm with a film thickness of 0.11 mm. UV-vis spectra
were taken on an Ocean Optics USB2000. The dynamic light scattering (DLS) measurements were conducted
using a Beckman-Coulter N4 Plus particle analyzer with a 10 mW helium-neon laser at 632.8 nm. The particle
size was determined using a detector angle of 90 degrees and it was calculated using the size distribution
processor (SDP) analysis package provided by the manufacturer. Nanocrystals obtained by the reprecipitation
protocol were analyzed by scanning electron microscopy (SEM) to verify the size, shape, and formation of
crystal faces. SEM studies were performed with a JEOL JSM-6700F field-emission scanning electron
microscope. To prepare the SEM sample, a dilute α-adamantyl-p-methoxyacetophenone suspension (4×10⁻⁴ M)
was drop-cast onto a freshly cleaned silicon wafer and allowed to dry in a desiccator. Both isolated crystals and
aggregates consisting of 2-10 crystals were observed. The particles are clearly faceted and crystalline. A
Surelite-II and OPO Plus (pump with a Nd-YAG 355 nm) at 255 nm; 10 mJ/pulse was used as excitation
source. In all cases, fused silica cells with a path length of 1.0 cm were used. Data was recorded with an LFP
111 laser-flash photolysis system (Luzchem Inc., Ottawa, Canada). All solution measurements were performed
in flowing N2(g)-saturated solutions. All nanocrystalline suspension measurements were performed in air-
saturated water. To minimize degradation of the sample, a gravity flow system was employed and 10 single
laser shots were averaged.
Computational Methods: The conformation of 1 used was exported from the experimentally determined X-
ray crystal structure. The structures of 2 and 3 were optimized from 1 in the gas phase (MM2) as implemented
S3
in Macromodel, while freezing the relative location of the p-methoxyphenyl and carbonyl moieties. RMSD
values were calculated as implemented in PyMOL.
Solid-State NMR Methods.
Solid-State 1H NMR Spin-Lattice Rotation in the Rotating Frame (T1ρ, NMR). Solid-state proton (1H) NMR spin-
lattice relaxation in the rotating frame (T1ρ, NMR) for α-adamantyl-p-methoxyacetophenones 1, 1-d3, and 1-d7
were acquired at UCLA on polycrystalline samples via a variable-pulse spin-locking sequence with a static
wideline probe using a Bruker DRX 300 solid-state spectrometer operating at a 1H Larmor frequency of 300
MHz and an average spin-lock field of 56 kHz at a power level of 17.00 decibels (dB). At temperatures between
235 K – 325 K, ninety-degree (π/2) pulses were calibrated as necessary, with a typical pulse width (p1) of 1.00
microseconds (µs) and a power level of 4.00 dB over the entire temperature range studied. The frequency of the
spin-lock field was determined based on the calibrated hard pulse width (PW) of the π/2 pulse considering the
additional 13.00 dB of attenuation. In general, Bspin-lock(Hz) = 1/[4*PWπ/2]. Therefore, to find the corresponding
attenuated π/2 PWsoft,
dB= 13.00 = 20·log10 (PWsoft/PWhard) (1)
For T1ρ, NMR measurements on 1-d7, the average PWhard = 0.99 µs, resulting in a PWsoft = 4.44 µs and a spin-
lock field of ca. 56 kHz. For each measurement, an acquisition time of 2.0985 microseconds (ms) and a
relaxation delay of greater than five times the spin-lattice relaxation time (T1, NMR) of the protons was used.
Solid-State 1H NMR Spin-Lattice Rotation in the Lab Frame (T1, NMR). The 1H spin-lattice relaxation (T1, NMR)
was determined for T=245-235 K, prior to the 1H T1ρ, NMR measurements. The T1 value at 235 K was assumed
to be the same as that for 245 K and 255 K, based upon the unchanging T1 times for T<255 K, as shown in
Figure 3. 1H T1, NMR relaxation was measured using a saturation recovery sequence in which a saturation pulse
comb was followed a time τ’ later (τ’ values taken from the variable delay list) with a π/2 pulse p1. For each
measurement, an acquisition time of 2.0985 ms was used.
S4
Synthesis of 1. In a flame-dried, argon filled three-neck round bottom, oxalyl chloride (2.5 eq.) was added to a
α-adamantyl acetic acid (1 eq.) in dry DCM. The solution was allowed to stir for 45 minutes at room
temperature. The solvent and oxalyl chloride were removed under reduced pressure. The resulting oil was re-
dissolved in DCM. The flask was then cooled to 0 oC. To this, aluminum chloride (1 eq.) was added. To this
stirring suspension, anisole (2 eqs.) was added dropwise over the course of five minutes. The reaction was
allowed to stir at room temperature for 90 min. The suspension was then quenched slowly with satd.
ammonium chloride solution and extracted with DCM and washed with brine. The solvents were removed
under reduced pressure, and crude 1 was subjected to column chromatography (9:1 hexane:diethyl ether) Rf =
0.4. The resulting crystalline solid (95% yield) was recrystallized from ethanol. Characterization was identical
to that of previously reported 1.1
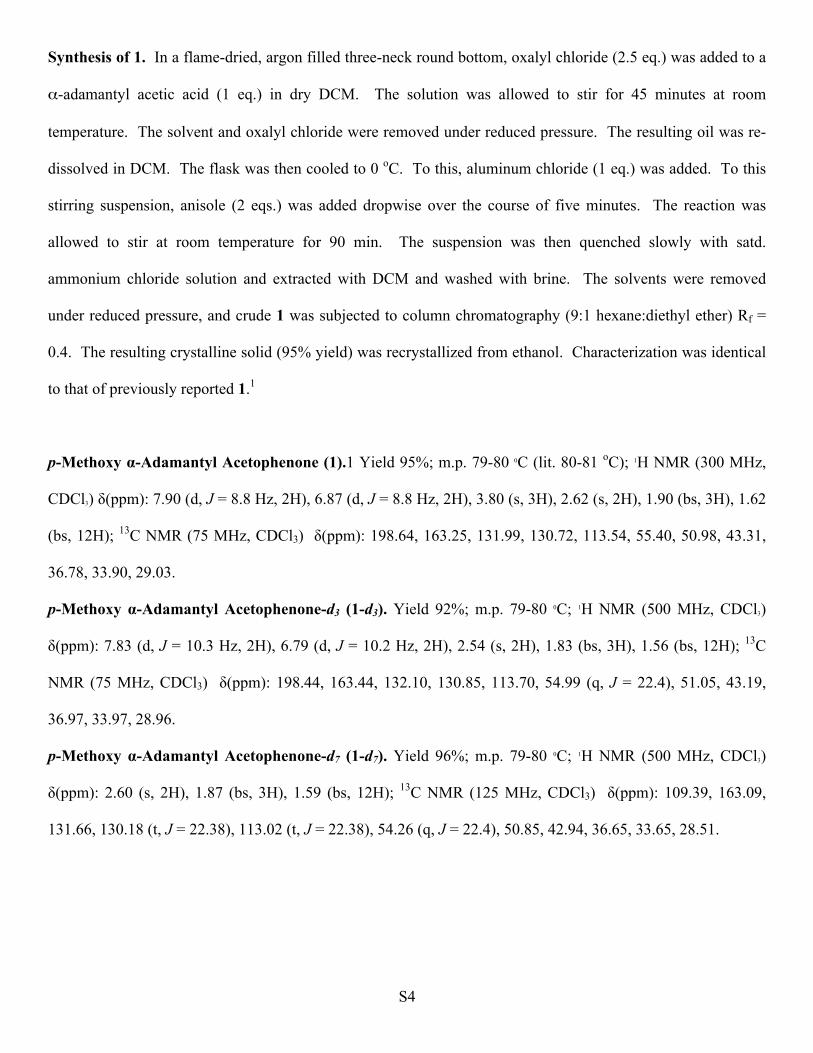
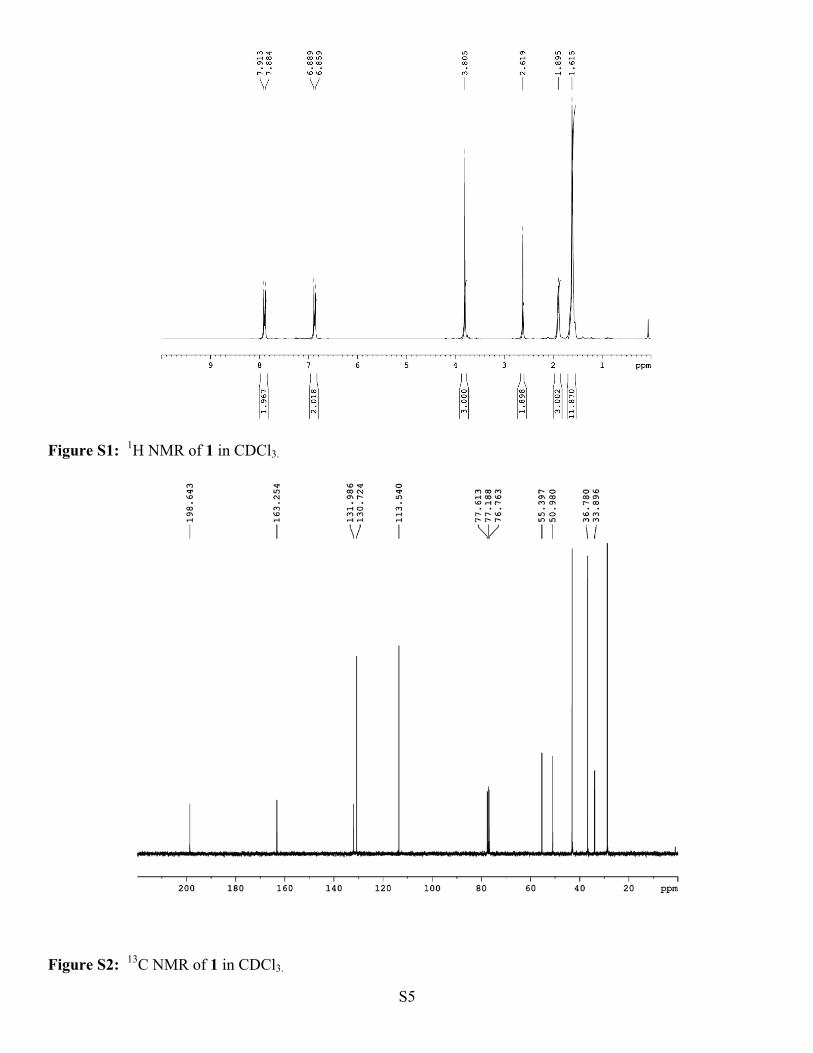
p-Methoxy α-Adamantyl Acetophenone (1).1 Yield 95%; m.p. 79-80 0C (lit. 80-81 oC); 1H NMR (300 MHz,
CDCl3) δ(ppm): 7.90 (d, J = 8.8 Hz, 2H), 6.87 (d, J = 8.8 Hz, 2H), 3.80 (s, 3H), 2.62 (s, 2H), 1.90 (bs, 3H), 1.62
(bs, 12H); 13C NMR (75 MHz, CDCl3) δ(ppm): 198.64, 163.25, 131.99, 130.72, 113.54, 55.40, 50.98, 43.31,
36.78, 33.90, 29.03.
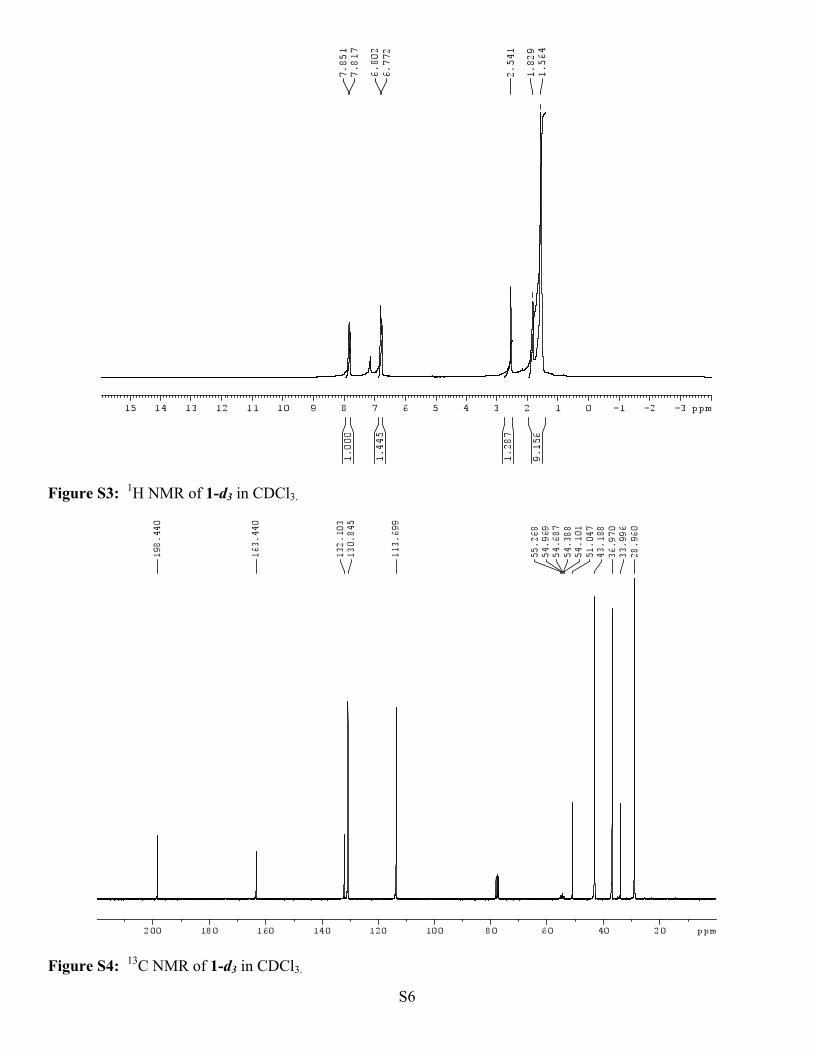
p-Methoxy α-Adamantyl Acetophenone-d3 (1-d3). Yield 92%; m.p. 79-80 0C; 1H NMR (500 MHz, CDCl3)
δ(ppm): 7.83 (d, J = 10.3 Hz, 2H), 6.79 (d, J = 10.2 Hz, 2H), 2.54 (s, 2H), 1.83 (bs, 3H), 1.56 (bs, 12H); 13C
NMR (75 MHz, CDCl3) δ(ppm): 198.44, 163.44, 132.10, 130.85, 113.70, 54.99 (q, J = 22.4), 51.05, 43.19,
36.97, 33.97, 28.96.
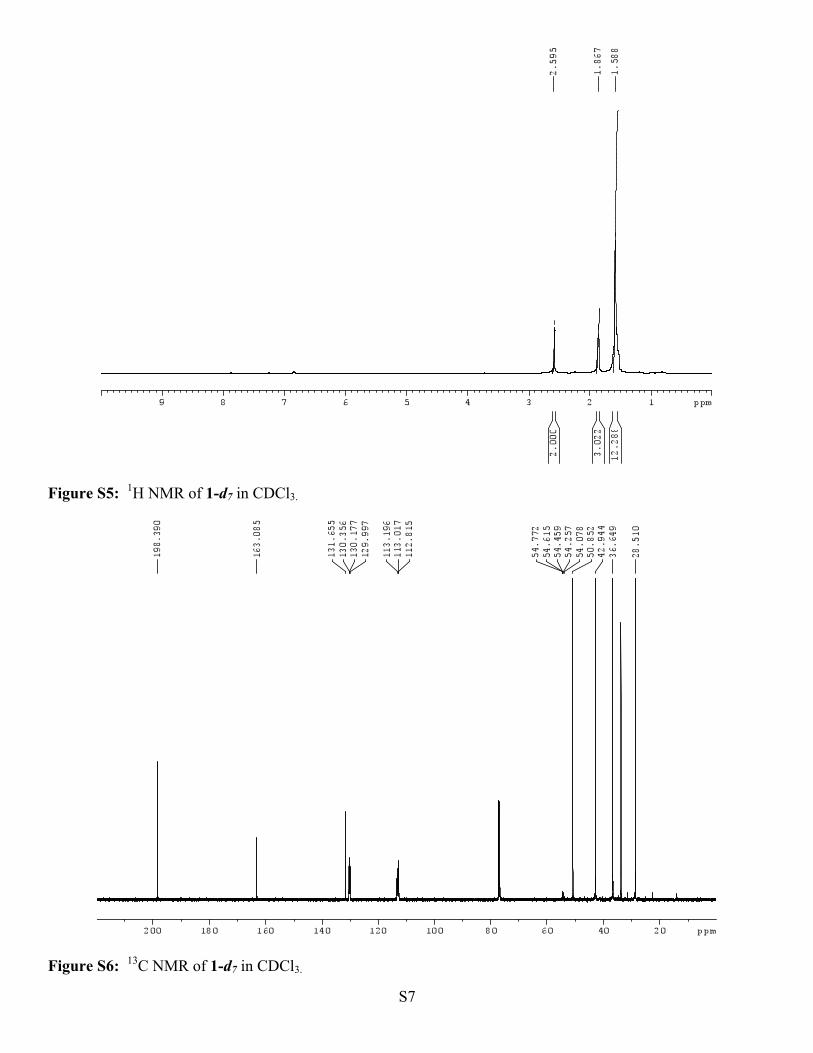
p-Methoxy α-Adamantyl Acetophenone-d7 (1-d7). Yield 96%; m.p. 79-80 0C; 1H NMR (500 MHz, CDCl3)
δ(ppm): 2.60 (s, 2H), 1.87 (bs, 3H), 1.59 (bs, 12H); 13C NMR (125 MHz, CDCl3) δ(ppm): 109.39, 163.09,
131.66, 130.18 (t, J = 22.38), 113.02 (t, J = 22.38), 54.26 (q, J = 22.4), 50.85, 42.94, 36.65, 33.65, 28.51.
S5
Figure S1: 1H NMR of 1 in CDCl3.
Figure S2: 13C NMR of 1 in CDCl3.
S6
Figure S3: 1H NMR of 1-d3 in CDCl3.
Figure S4: 13C NMR of 1-d3 in CDCl3.
S7
Figure S5: 1H NMR of 1-d7 in CDCl3.
Figure S6: 13C NMR of 1-d7 in CDCl3.
S8
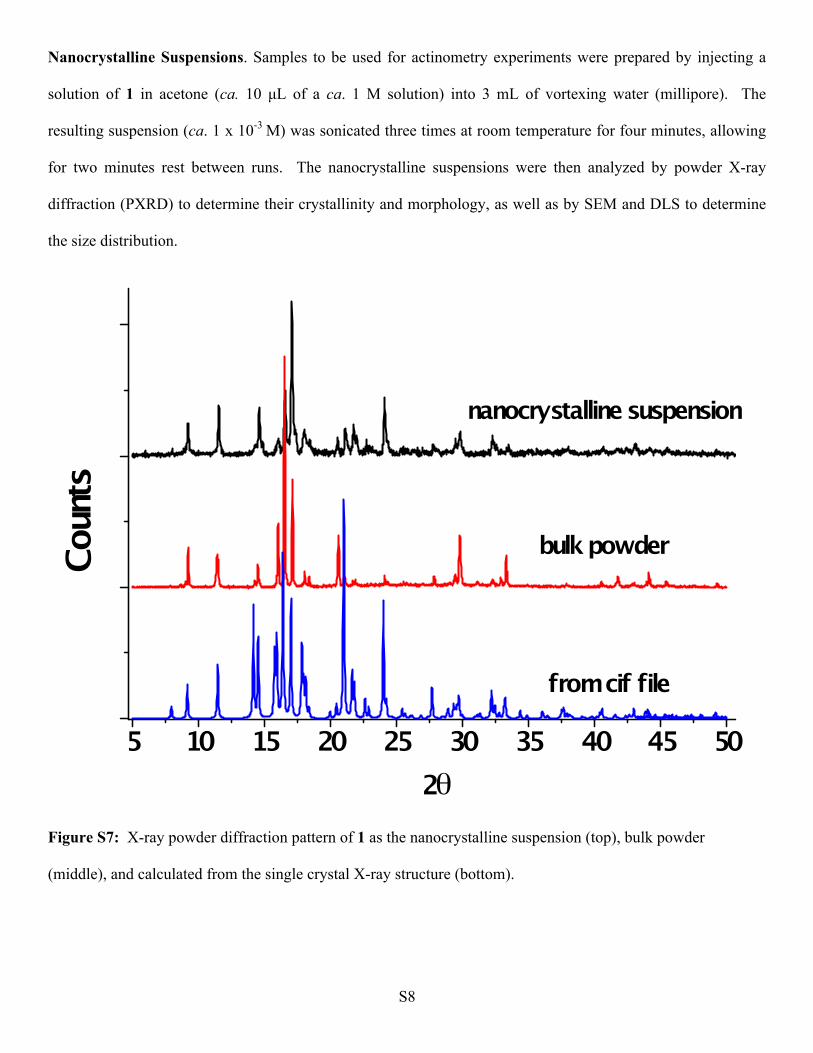
Nanocrystalline Suspensions. Samples to be used for actinometry experiments were prepared by injecting a
solution of 1 in acetone (ca. 10 µL of a ca. 1 M solution) into 3 mL of vortexing water (millipore). The
resulting suspension (ca. 1 x 10⁻³ M) was sonicated three times at room temperature for four minutes, allowing
for two minutes rest between runs. The nanocrystalline suspensions were then analyzed by powder X-ray
diffraction (PXRD) to determine their crystallinity and morphology, as well as by SEM and DLS to determine
the size distribution.
Figure S7: X-ray powder diffraction pattern of 1 as the nanocrystalline suspension (top), bulk powder
(middle), and calculated from the single crystal X-ray structure (bottom).
S9
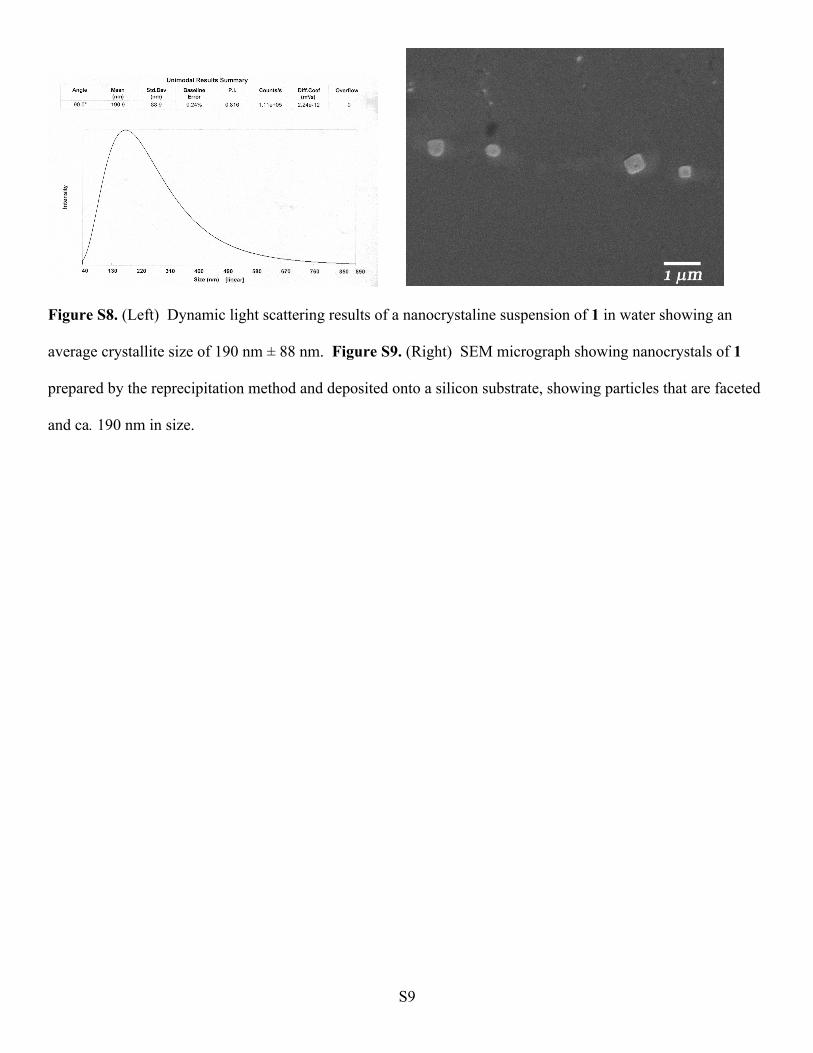
Figure S8. (Left) Dynamic light scattering results of a nanocrystaline suspension of 1 in water showing an
average crystallite size of 190 nm ± 88 nm. Figure S9. (Right) SEM micrograph showing nanocrystals of 1
prepared by the reprecipitation method and deposited onto a silicon substrate, showing particles that are faceted
and ca. 190 nm in size.
S10
Quantum Yield Determination in Acetonitrile. Using both optically matched (three experiments), and
equimolar (three experiments) solutions of 1, relative quantum yield determinations were performed with
valerophenone (φ = 0.33) as an internal standard in a Rayonet photochemical reactor using 312 nm lamps
(BLE-8T312).2 Quantitative conversion of 1 produced the corresponding cyclobutanols cis-2 and trans-3 in
100% yield with no detection of secondary photoproducts. The ratio of cis-2: trans-3 (33:67) remained constant
independent of conversion.
Quantum Yield Determination for Nanocrystalline Suspension. Relative quantum yield determinations
were performed with dicumyl ketone (φ = 0.18) as an internal standard in a Rayonet photochemical reactor
using 312 nm lamps (BLE-8T312). Quantum yields were determined with equimolar, optically dense
suspensions. Two independent suspensions of actinometer and substrate were independently synthesized. The
samples were then combined immediately prior to irradiation in a 50 mL quartz Erlenmeyer flask and irradiated
for 10 min. Every 2 minutes, an aliquot was removed (approximately one-twentieth of the suspension). The
aliquots were extracted with deuterated chloroform (2 mL), washed with brine (2 × 2 mL), and dried over
magnesium sulfate. The same samples were then subjected to gas chromatography immediately to determine
the extent of product formation. These experimental yields were reproduced at least in triplicate. High
conversion data were not used to avoid potential problems caused by the absorption of the products.
Quantitative conversion of 1 produced the corresponding cyclobutanols cis-2 and trans-3 with no detection of
secondary photoproducts. The ratio of cis-2: trans-3 (67:33) remained constant independent of conversion.
S11
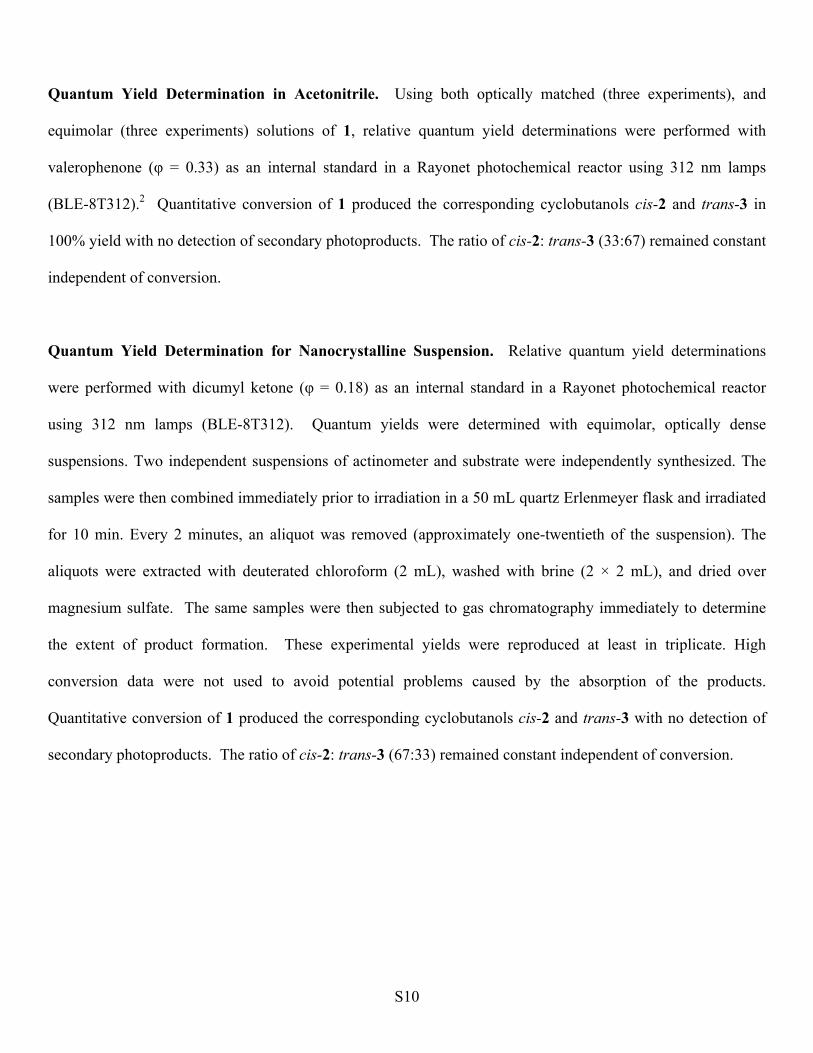
Solid-State NMR Spectra for 1, 1-d3, and 1-d7.
(a)
(b) Figure S10. (a) Representative 1H T1, NMR recovery spectra of 1 from saturation recovery sequence at 297 K as a function of delay time τ = 16 ms, 20 ms, 25 ms, 32 ms, 40 ms, 50 ms, 64 ms, 80 ms, 0.1 s, 0.125 s, 0.16 s, 0.2 s, 0.25 s, 0.32 s, 0.4 s, 0.5 s, 0.63 s, 0.8 s, 1 s, 1.25 s, 1.6 s, 2 s, 2.5 s, 3 s, 4 s, 5 s, 6.3 s, 8 s, 10 s, 12.5 s, 15 s, 20 s, 25 s, 30 s, 40 s. (b) Comparison of normalized 1H spectra of 1 at 297 K taken from early and late delay times, 80 ms (black, partially recovered spectrum) and 40 s (red line, fully recovered spectrum), respectively, show the presence of a narrow component and a broad component that relax at different rates. This suggests that the sample is not undergoing efficient spin diffusion.
S12
(a)
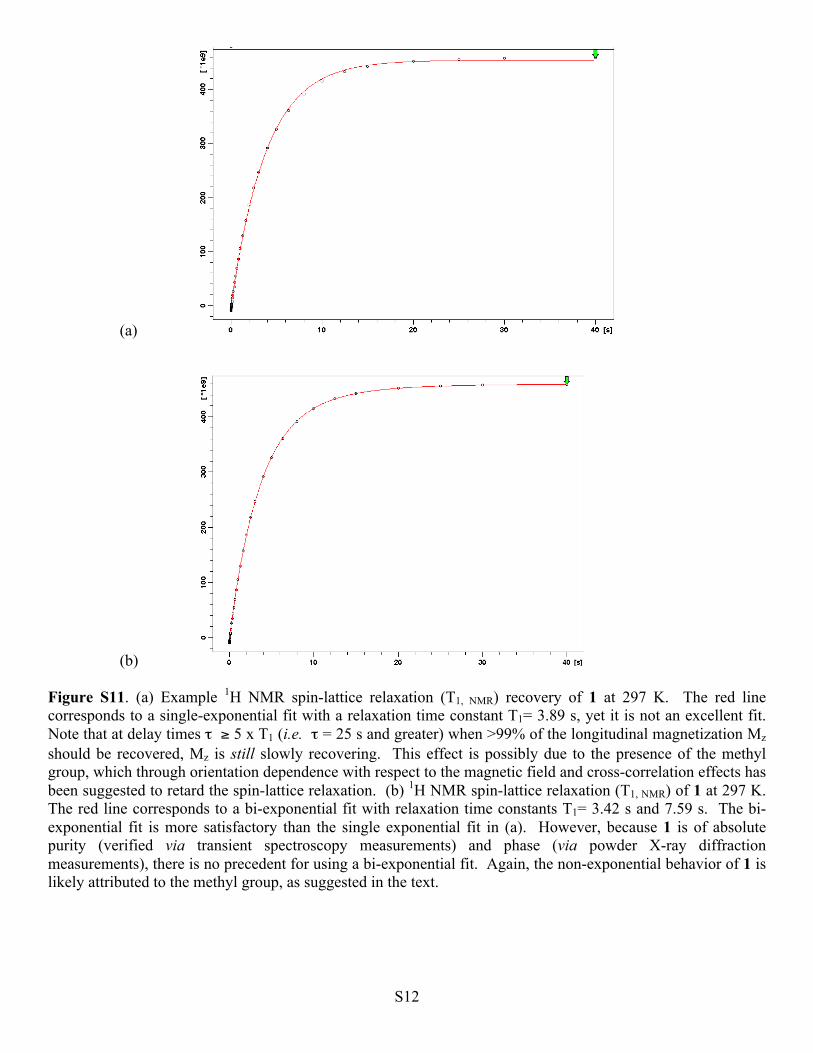
(b) Figure S11. (a) Example 1H NMR spin-lattice relaxation (T1, NMR) recovery of 1 at 297 K. The red line corresponds to a single-exponential fit with a relaxation time constant T1= 3.89 s, yet it is not an excellent fit. Note that at delay times τ ≥ 5 x T1 (i.e. τ = 25 s and greater) when >99% of the longitudinal magnetization Mz should be recovered, Mz is still slowly recovering. This effect is possibly due to the presence of the methyl group, which through orientation dependence with respect to the magnetic field and cross-correlation effects has been suggested to retard the spin-lattice relaxation. (b) 1H NMR spin-lattice relaxation (T1, NMR) of 1 at 297 K. The red line corresponds to a bi-exponential fit with relaxation time constants T1= 3.42 s and 7.59 s. The bi-exponential fit is more satisfactory than the single exponential fit in (a). However, because 1 is of absolute purity (verified via transient spectroscopy measurements) and phase (via powder X-ray diffraction measurements), there is no precedent for using a bi-exponential fit. Again, the non-exponential behavior of 1 is likely attributed to the methyl group, as suggested in the text.
S13
(a)
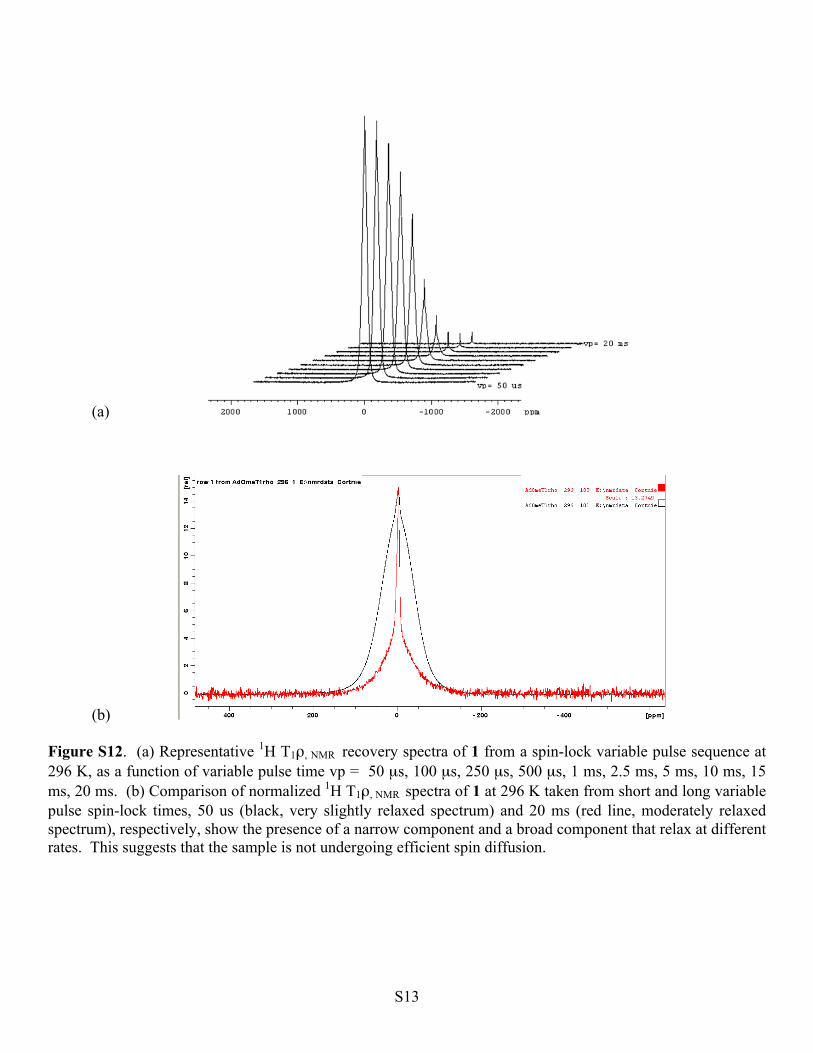
(b) Figure S12. (a) Representative 1H T1ρ, NMR recovery spectra of 1 from a spin-lock variable pulse sequence at 296 K, as a function of variable pulse time vp = 50 µs, 100 µs, 250 µs, 500 µs, 1 ms, 2.5 ms, 5 ms, 10 ms, 15 ms, 20 ms. (b) Comparison of normalized 1H T1ρ, NMR spectra of 1 at 296 K taken from short and long variable pulse spin-lock times, 50 us (black, very slightly relaxed spectrum) and 20 ms (red line, moderately relaxed spectrum), respectively, show the presence of a narrow component and a broad component that relax at different rates. This suggests that the sample is not undergoing efficient spin diffusion.
S14
(a)
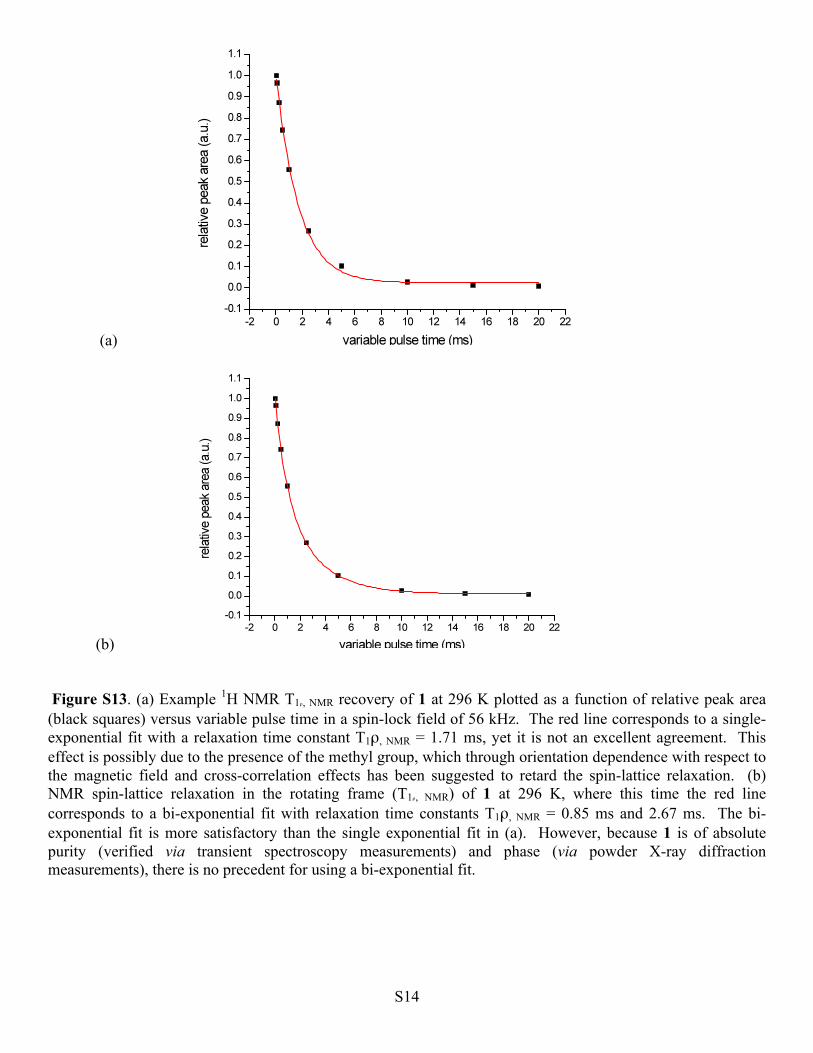
(b) Figure S13. (a) Example 1H NMR T1ρ, NMR recovery of 1 at 296 K plotted as a function of relative peak area (black squares) versus variable pulse time in a spin-lock field of 56 kHz. The red line corresponds to a single-exponential fit with a relaxation time constant T1ρ, NMR = 1.71 ms, yet it is not an excellent agreement. This effect is possibly due to the presence of the methyl group, which through orientation dependence with respect to the magnetic field and cross-correlation effects has been suggested to retard the spin-lattice relaxation. (b) NMR spin-lattice relaxation in the rotating frame (T1ρ, NMR) of 1 at 296 K, where this time the red line corresponds to a bi-exponential fit with relaxation time constants T1ρ, NMR = 0.85 ms and 2.67 ms. The bi-exponential fit is more satisfactory than the single exponential fit in (a). However, because 1 is of absolute purity (verified via transient spectroscopy measurements) and phase (via powder X-ray diffraction measurements), there is no precedent for using a bi-exponential fit.
S15
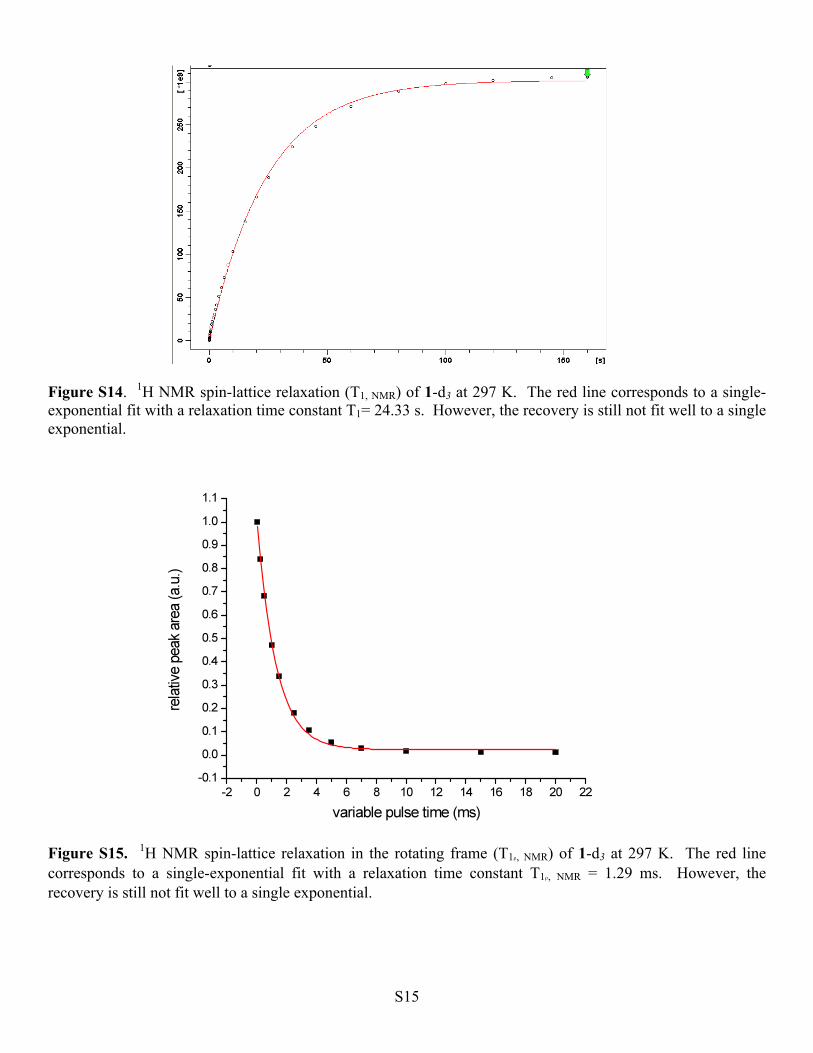
Figure S14. 1H NMR spin-lattice relaxation (T1, NMR) of 1-d3 at 297 K. The red line corresponds to a single-exponential fit with a relaxation time constant T1= 24.33 s. However, the recovery is still not fit well to a single exponential.
Figure S15. 1H NMR spin-lattice relaxation in the rotating frame (T1ρ, NMR) of 1-d3 at 297 K. The red line corresponds to a single-exponential fit with a relaxation time constant T1ρ, NMR = 1.29 ms. However, the recovery is still not fit well to a single exponential.
S16
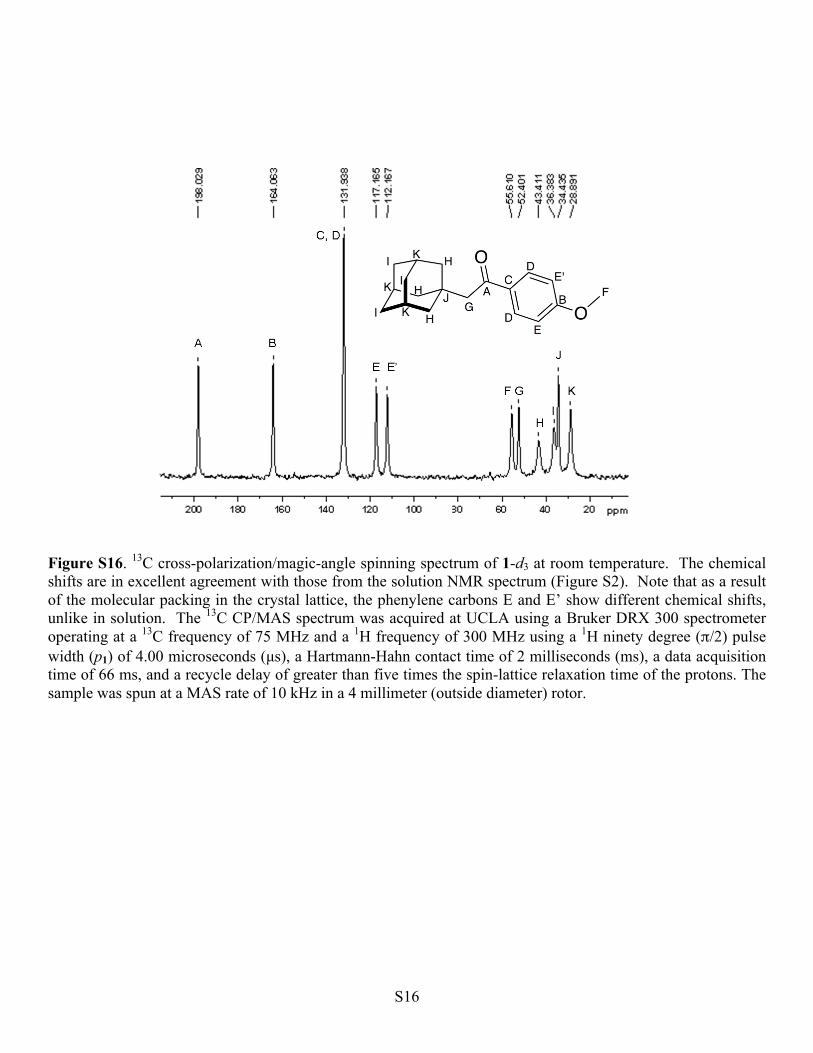
Figure S16. 13C cross-polarization/magic-angle spinning spectrum of 1-d3 at room temperature. The chemical shifts are in excellent agreement with those from the solution NMR spectrum (Figure S2). Note that as a result of the molecular packing in the crystal lattice, the phenylene carbons E and E’ show different chemical shifts, unlike in solution. The 13C CP/MAS spectrum was acquired at UCLA using a Bruker DRX 300 spectrometer operating at a 13C frequency of 75 MHz and a 1H frequency of 300 MHz using a 1H ninety degree (π/2) pulse width (p1) of 4.00 microseconds (µs), a Hartmann-Hahn contact time of 2 milliseconds (ms), a data acquisition time of 66 ms, and a recycle delay of greater than five times the spin-lattice relaxation time of the protons. The sample was spun at a MAS rate of 10 kHz in a 4 millimeter (outside diameter) rotor.
S17
(a)
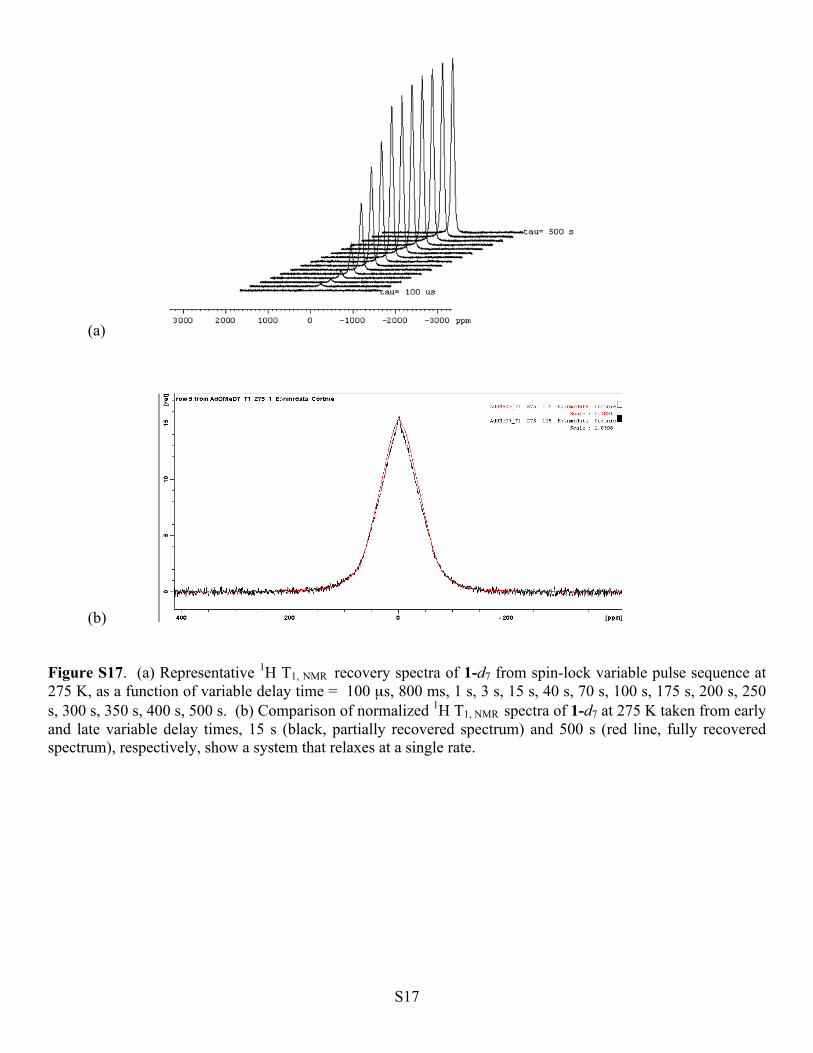
(b) Figure S17. (a) Representative 1H T1, NMR recovery spectra of 1-d7 from spin-lock variable pulse sequence at 275 K, as a function of variable delay time = 100 µs, 800 ms, 1 s, 3 s, 15 s, 40 s, 70 s, 100 s, 175 s, 200 s, 250 s, 300 s, 350 s, 400 s, 500 s. (b) Comparison of normalized 1H T1, NMR spectra of 1-d7 at 275 K taken from early and late variable delay times, 15 s (black, partially recovered spectrum) and 500 s (red line, fully recovered spectrum), respectively, show a system that relaxes at a single rate.
S18
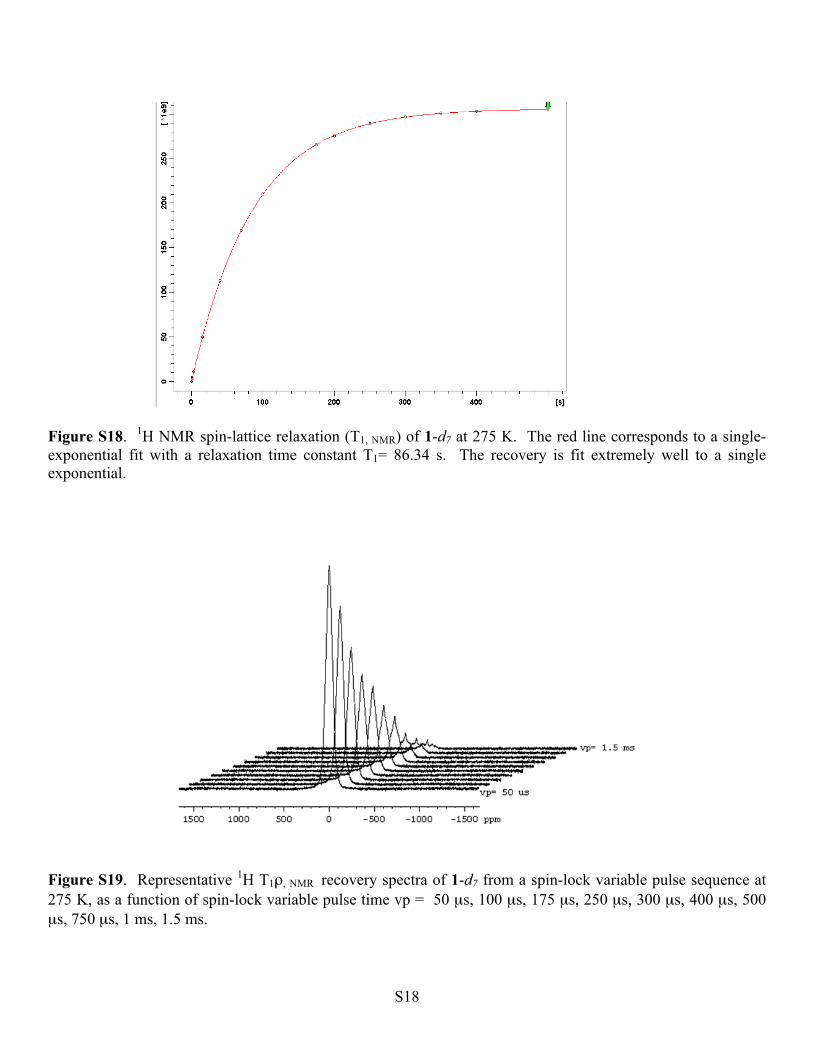
Figure S18. 1H NMR spin-lattice relaxation (T1, NMR) of 1-d7 at 275 K. The red line corresponds to a single-exponential fit with a relaxation time constant T1= 86.34 s. The recovery is fit extremely well to a single exponential.
Figure S19. Representative 1H T1ρ, NMR recovery spectra of 1-d7 from a spin-lock variable pulse sequence at 275 K, as a function of spin-lock variable pulse time vp = 50 µs, 100 µs, 175 µs, 250 µs, 300 µs, 400 µs, 500 µs, 750 µs, 1 ms, 1.5 ms.
S19
(a)
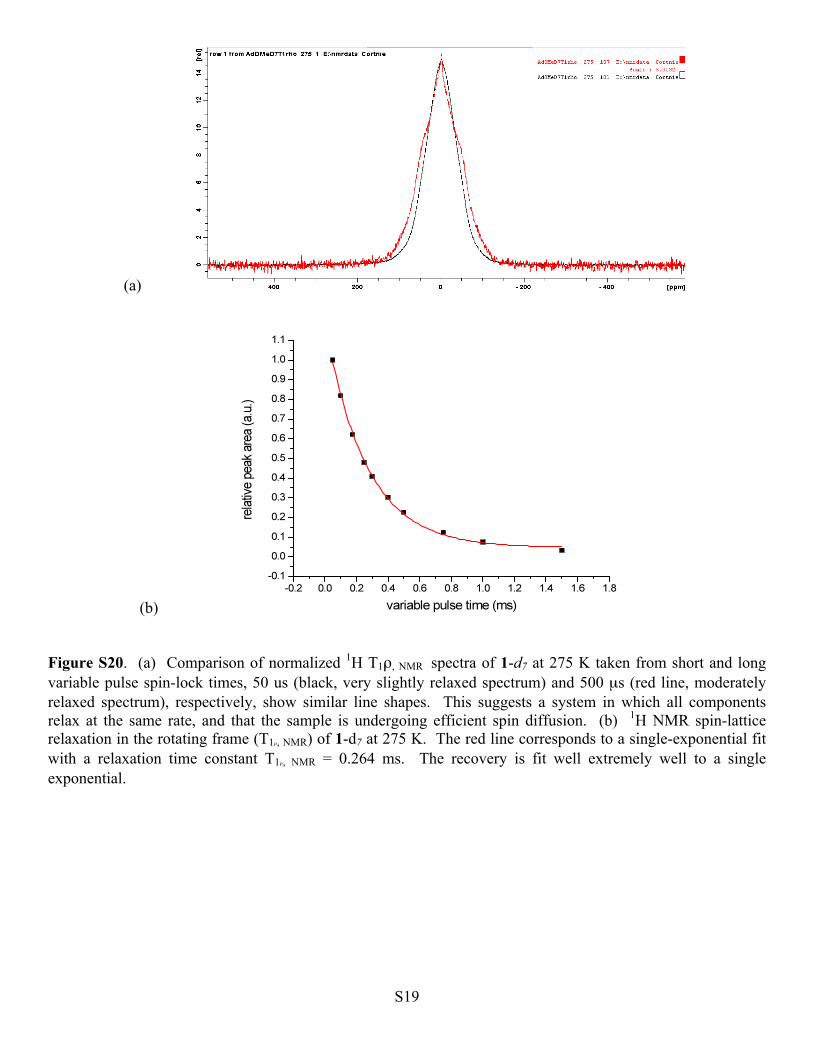
(b) Figure S20. (a) Comparison of normalized 1H T1ρ, NMR spectra of 1-d7 at 275 K taken from short and long variable pulse spin-lock times, 50 us (black, very slightly relaxed spectrum) and 500 µs (red line, moderately relaxed spectrum), respectively, show similar line shapes. This suggests a system in which all components relax at the same rate, and that the sample is undergoing efficient spin diffusion. (b) 1H NMR spin-lattice relaxation in the rotating frame (T1ρ, NMR) of 1-d7 at 275 K. The red line corresponds to a single-exponential fit with a relaxation time constant T1ρ, NMR = 0.264 ms. The recovery is fit well extremely well to a single exponential.
S20
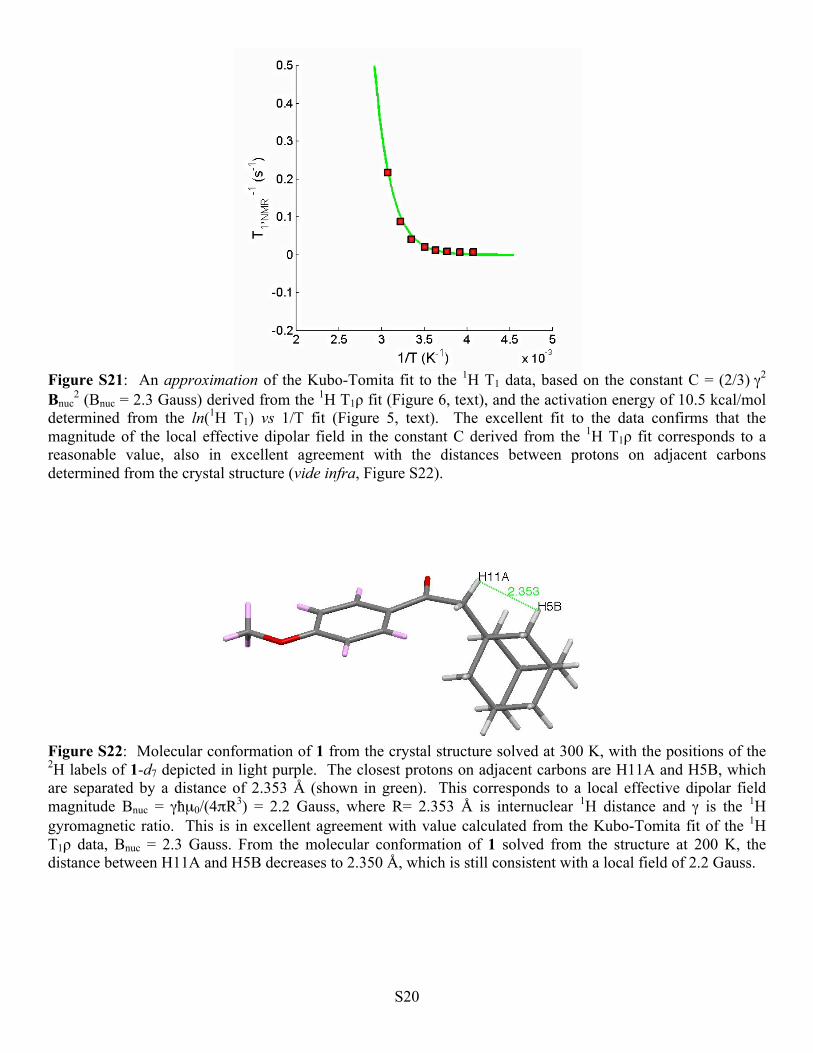
Figure S21: An approximation of the Kubo-Tomita fit to the 1H T1 data, based on the constant C = (2/3) γ2
Bnuc2 (Bnuc = 2.3 Gauss) derived from the 1H T1ρ fit (Figure 6, text), and the activation energy of 10.5 kcal/mol
determined from the ln(1H T1) vs 1/T fit (Figure 5, text). The excellent fit to the data confirms that the magnitude of the local effective dipolar field in the constant C derived from the 1H T1ρ fit corresponds to a reasonable value, also in excellent agreement with the distances between protons on adjacent carbons determined from the crystal structure (vide infra, Figure S22).
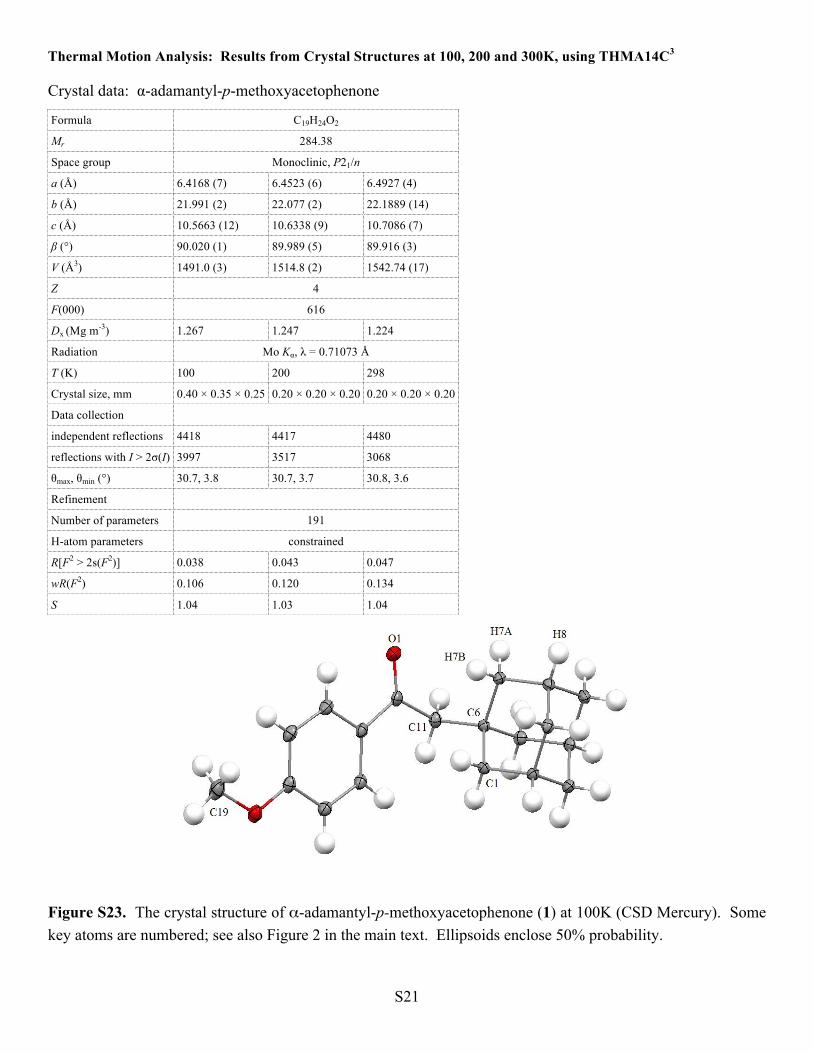
Figure S22: Molecular conformation of 1 from the crystal structure solved at 300 K, with the positions of the 2H labels of 1-d7 depicted in light purple. The closest protons on adjacent carbons are H11A and H5B, which are separated by a distance of 2.353 Å (shown in green). This corresponds to a local effective dipolar field magnitude Bnuc = γħµ0/(4πR3) = 2.2 Gauss, where R= 2.353 Å is internuclear 1H distance and γ is the 1H gyromagnetic ratio. This is in excellent agreement with value calculated from the Kubo-Tomita fit of the 1H T1ρ data, Bnuc = 2.3 Gauss. From the molecular conformation of 1 solved from the structure at 200 K, the distance between H11A and H5B decreases to 2.350 Å, which is still consistent with a local field of 2.2 Gauss.
S21
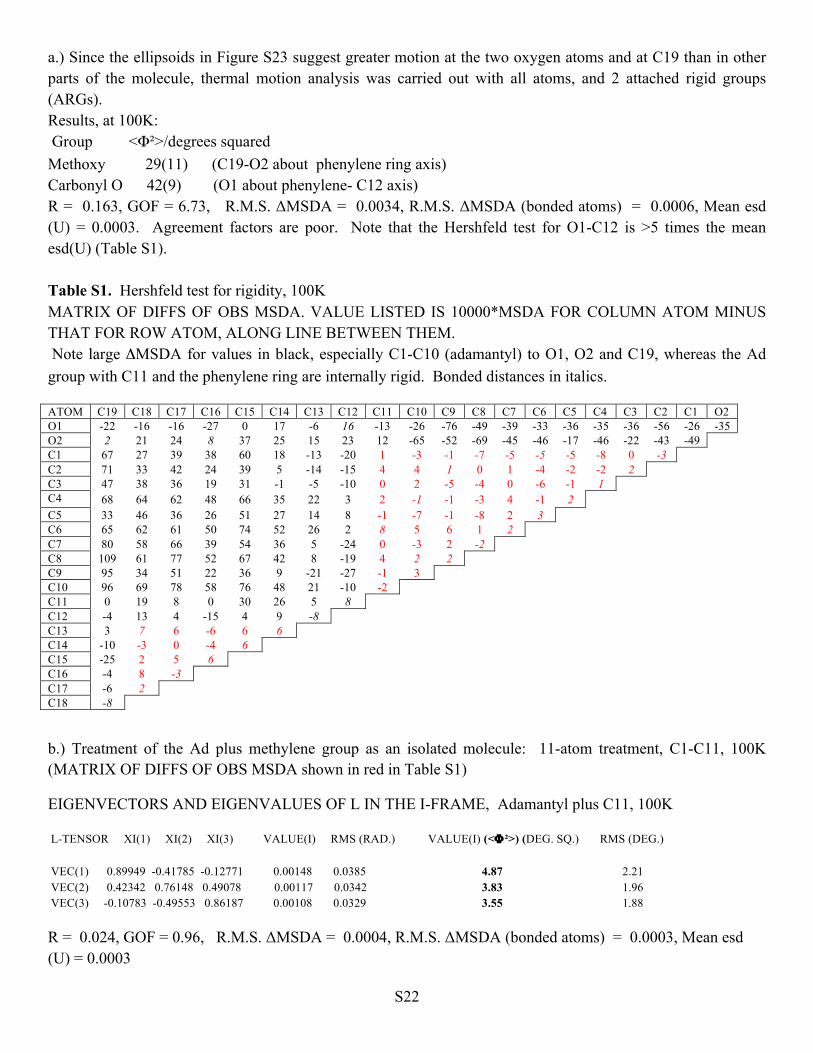
Thermal Motion Analysis: Results from Crystal Structures at 100, 200 and 300K, using THMA14C3 Crystal data: α-adamantyl-p-methoxyacetophenone
Formula C19H24O2
Mr 284.38
Space group Monoclinic, P21/n
a (Å) 6.4168 (7) 6.4523 (6) 6.4927 (4)
b (Å) 21.991 (2) 22.077 (2) 22.1889 (14)
c (Å) 10.5663 (12) 10.6338 (9) 10.7086 (7)
β (°) 90.020 (1) 89.989 (5) 89.916 (3)
V (Å3) 1491.0 (3) 1514.8 (2) 1542.74 (17)
Z 4
F(000) 616
Dx (Mg m-3) 1.267 1.247 1.224
Radiation Mo Kα, λ = 0.71073 Å
T (K) 100 200 298
Crystal size, mm 0.40 × 0.35 × 0.25 0.20 × 0.20 × 0.20 0.20 × 0.20 × 0.20
Data collection
independent reflections 4418 4417 4480
reflections with I > 2σ(I) 3997 3517 3068
θmax, θmin (°) 30.7, 3.8 30.7, 3.7 30.8, 3.6
Refinement
Number of parameters 191
H-atom parameters constrained
R[F2 > 2s(F2)] 0.038 0.043 0.047
wR(F2) 0.106 0.120 0.134
S 1.04 1.03 1.04
Figure S23. The crystal structure of α-adamantyl-p-methoxyacetophenone (1) at 100K (CSD Mercury). Some key atoms are numbered; see also Figure 2 in the main text. Ellipsoids enclose 50% probability.
S22
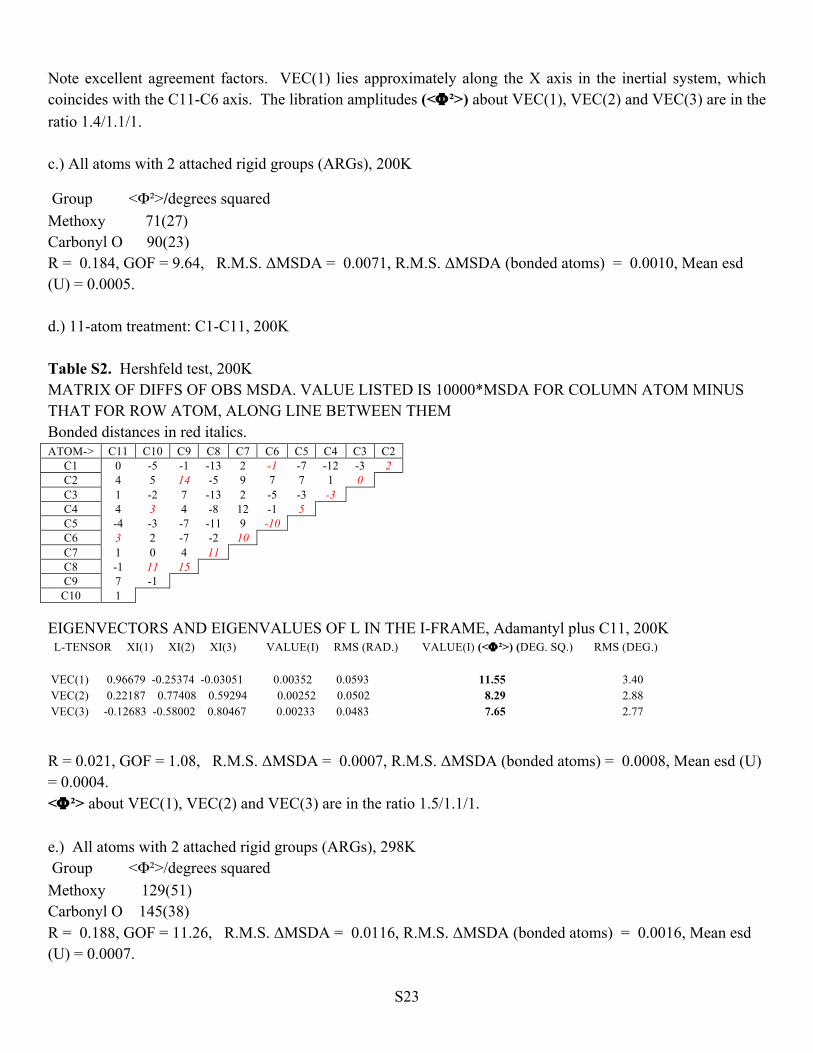
a.) Since the ellipsoids in Figure S23 suggest greater motion at the two oxygen atoms and at C19 than in other parts of the molecule, thermal motion analysis was carried out with all atoms, and 2 attached rigid groups (ARGs). Results, at 100K: Group <Φ²>/degrees squared Methoxy 29(11) (C19-O2 about phenylene ring axis) Carbonyl O 42(9) (O1 about phenylene- C12 axis) R = 0.163, GOF = 6.73, R.M.S. ΔMSDA = 0.0034, R.M.S. ΔMSDA (bonded atoms) = 0.0006, Mean esd (U) = 0.0003. Agreement factors are poor. Note that the Hershfeld test for O1-C12 is >5 times the mean esd(U) (Table S1). Table S1. Hershfeld test for rigidity, 100K MATRIX OF DIFFS OF OBS MSDA. VALUE LISTED IS 10000*MSDA FOR COLUMN ATOM MINUS THAT FOR ROW ATOM, ALONG LINE BETWEEN THEM. Note large ΔMSDA for values in black, especially C1-C10 (adamantyl) to O1, O2 and C19, whereas the Ad group with C11 and the phenylene ring are internally rigid. Bonded distances in italics. ATOM C19 C18 C17 C16 C15 C14 C13 C12 C11 C10 C9 C8 C7 C6 C5 C4 C3 C2 C1 O2 O1 -22 -16 -16 -27 0 17 -6 16 -13 -26 -76 -49 -39 -33 -36 -35 -36 -56 -26 -35 O2 2 21 24 8 37 25 15 23 12 -65 -52 -69 -45 -46 -17 -46 -22 -43 -49 C1 67 27 39 38 60 18 -13 -20 1 -3 -1 -7 -5 -5 -5 -8 0 -3 C2 71 33 42 24 39 5 -14 -15 4 4 1 0 1 -4 -2 -2 2 C3 47 38 36 19 31 -1 -5 -10 0 2 -5 -4 0 -6 -1 1 C4 68 64 62 48 66 35 22 3 2 -1 -1 -3 4 -1 2 C5 33 46 36 26 51 27 14 8 -1 -7 -1 -8 2 3 C6 65 62 61 50 74 52 26 2 8 5 6 1 2 C7 80 58 66 39 54 36 5 -24 0 -3 2 -2 C8 109 61 77 52 67 42 8 -19 4 2 2 C9 95 34 51 22 36 9 -21 -27 -1 3 C10 96 69 78 58 76 48 21 -10 -2 C11 0 19 8 0 30 26 5 8 C12 -4 13 4 -15 4 9 -8 C13 3 7 6 -6 6 6 C14 -10 -3 0 -4 6 C15 -25 2 5 6 C16 -4 8 -3 C17 -6 2 C18 -8
b.) Treatment of the Ad plus methylene group as an isolated molecule: 11-atom treatment, C1-C11, 100K (MATRIX OF DIFFS OF OBS MSDA shown in red in Table S1)
EIGENVECTORS AND EIGENVALUES OF L IN THE I-FRAME, Adamantyl plus C11, 100K L-TENSOR XI(1) XI(2) XI(3) VALUE(I) RMS (RAD.) VALUE(I) (<Φ ²>) (DEG. SQ.) RMS (DEG.) VEC(1) 0.89949 -0.41785 -0.12771 0.00148 0.0385 4.87 2.21 VEC(2) 0.42342 0.76148 0.49078 0.00117 0.0342 3.83 1.96 VEC(3) -0.10783 -0.49553 0.86187 0.00108 0.0329 3.55 1.88
R = 0.024, GOF = 0.96, R.M.S. ΔMSDA = 0.0004, R.M.S. ΔMSDA (bonded atoms) = 0.0003, Mean esd (U) = 0.0003
S23
Note excellent agreement factors. VEC(1) lies approximately along the X axis in the inertial system, which coincides with the C11-C6 axis. The libration amplitudes (<Φ²>) about VEC(1), VEC(2) and VEC(3) are in the ratio 1.4/1.1/1. c.) All atoms with 2 attached rigid groups (ARGs), 200K
Group <Φ²>/degrees squared Methoxy 71(27) Carbonyl O 90(23) R = 0.184, GOF = 9.64, R.M.S. ΔMSDA = 0.0071, R.M.S. ΔMSDA (bonded atoms) = 0.0010, Mean esd (U) = 0.0005. d.) 11-atom treatment: C1-C11, 200K Table S2. Hershfeld test, 200K MATRIX OF DIFFS OF OBS MSDA. VALUE LISTED IS 10000*MSDA FOR COLUMN ATOM MINUS THAT FOR ROW ATOM, ALONG LINE BETWEEN THEM Bonded distances in red italics. ATOM-> C11 C10 C9 C8 C7 C6 C5 C4 C3 C2
C1 0 -5 -1 -13 2 -1 -7 -12 -3 2 C2 4 5 14 -5 9 7 7 1 0 C3 1 -2 7 -13 2 -5 -3 -3 C4 4 3 4 -8 12 -1 5 C5 -4 -3 -7 -11 9 -10 C6 3 2 -7 -2 10 C7 1 0 4 11 C8 -1 11 15 C9 7 -1
C10 1
EIGENVECTORS AND EIGENVALUES OF L IN THE I-FRAME, Adamantyl plus C11, 200K L-TENSOR XI(1) XI(2) XI(3) VALUE(I) RMS (RAD.) VALUE(I) (<Φ ²>) (DEG. SQ.) RMS (DEG.) VEC(1) 0.96679 -0.25374 -0.03051 0.00352 0.0593 11.55 3.40 VEC(2) 0.22187 0.77408 0.59294 0.00252 0.0502 8.29 2.88 VEC(3) -0.12683 -0.58002 0.80467 0.00233 0.0483 7.65 2.77 R = 0.021, GOF = 1.08, R.M.S. ΔMSDA = 0.0007, R.M.S. ΔMSDA (bonded atoms) = 0.0008, Mean esd (U) = 0.0004. <Φ²> about VEC(1), VEC(2) and VEC(3) are in the ratio 1.5/1.1/1. e.) All atoms with 2 attached rigid groups (ARGs), 298K Group <Φ²>/degrees squared Methoxy 129(51) Carbonyl O 145(38) R = 0.188, GOF = 11.26, R.M.S. ΔMSDA = 0.0116, R.M.S. ΔMSDA (bonded atoms) = 0.0016, Mean esd (U) = 0.0007.
S24
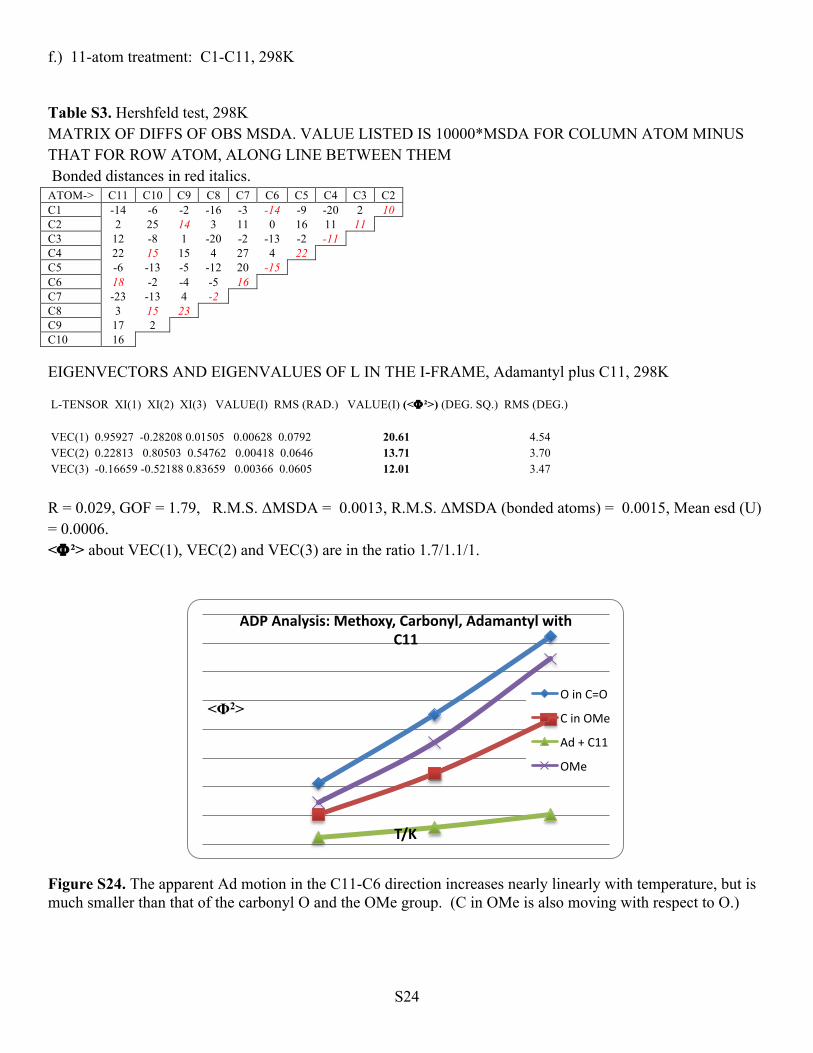
f.) 11-atom treatment: C1-C11, 298K
Table S3. Hershfeld test, 298K MATRIX OF DIFFS OF OBS MSDA. VALUE LISTED IS 10000*MSDA FOR COLUMN ATOM MINUS THAT FOR ROW ATOM, ALONG LINE BETWEEN THEM Bonded distances in red italics. ATOM-> C11 C10 C9 C8 C7 C6 C5 C4 C3 C2 C1 -14 -6 -2 -16 -3 -14 -9 -20 2 10 C2 2 25 14 3 11 0 16 11 11 C3 12 -8 1 -20 -2 -13 -2 -11 C4 22 15 15 4 27 4 22 C5 -6 -13 -5 -12 20 -15 C6 18 -2 -4 -5 16 C7 -23 -13 4 -2 C8 3 15 23 C9 17 2 C10 16 EIGENVECTORS AND EIGENVALUES OF L IN THE I-FRAME, Adamantyl plus C11, 298K
L-TENSOR XI(1) XI(2) XI(3) VALUE(I) RMS (RAD.) VALUE(I) (<Φ ²>) (DEG. SQ.) RMS (DEG.) VEC(1) 0.95927 -0.28208 0.01505 0.00628 0.0792 20.61 4.54 VEC(2) 0.22813 0.80503 0.54762 0.00418 0.0646 13.71 3.70 VEC(3) -0.16659 -0.52188 0.83659 0.00366 0.0605 12.01 3.47 R = 0.029, GOF = 1.79, R.M.S. ΔMSDA = 0.0013, R.M.S. ΔMSDA (bonded atoms) = 0.0015, Mean esd (U) = 0.0006. <Φ²> about VEC(1), VEC(2) and VEC(3) are in the ratio 1.7/1.1/1.
Figure S24. The apparent Ad motion in the C11-C6 direction increases nearly linearly with temperature, but is much smaller than that of the carbonyl O and the OMe group. (C in OMe is also moving with respect to O.)
<Φ2>
T/K
ADP Analysis: Methoxy, Carbonyl, Adamantyl with C11
O in C=O
C in OMe
Ad + C11
OMe
S25
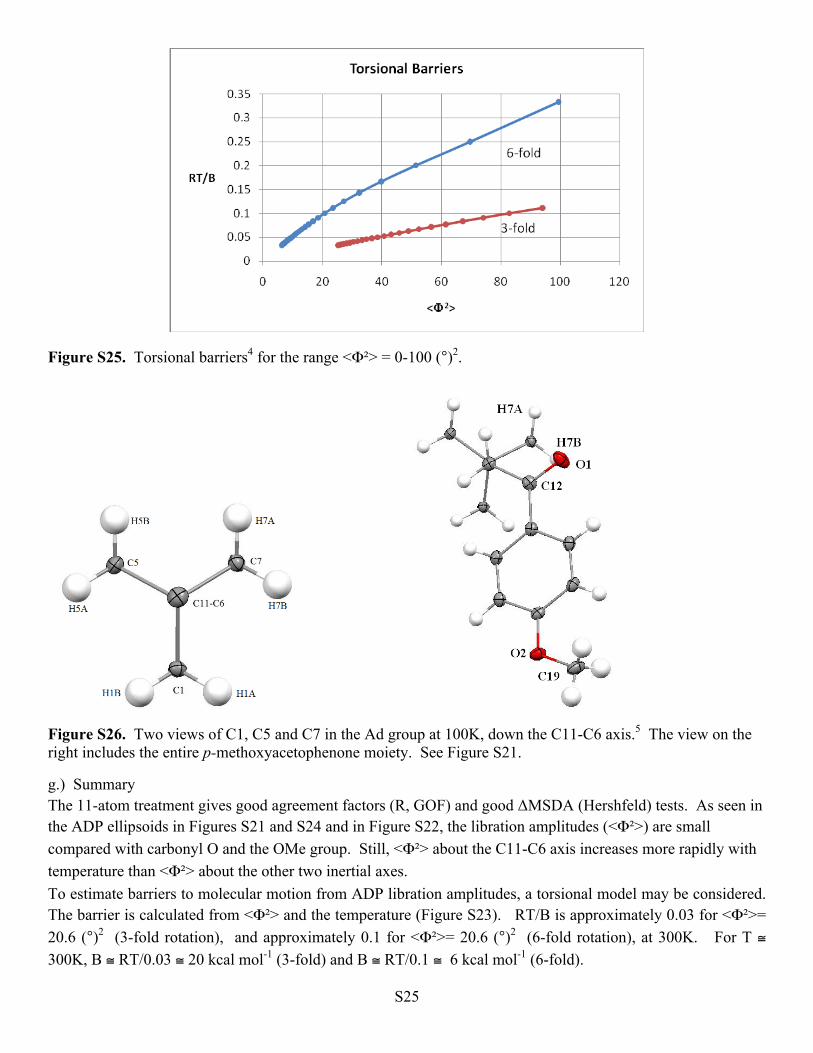
Figure S25. Torsional barriers4 for the range <Φ²> = 0-100 (°)2.
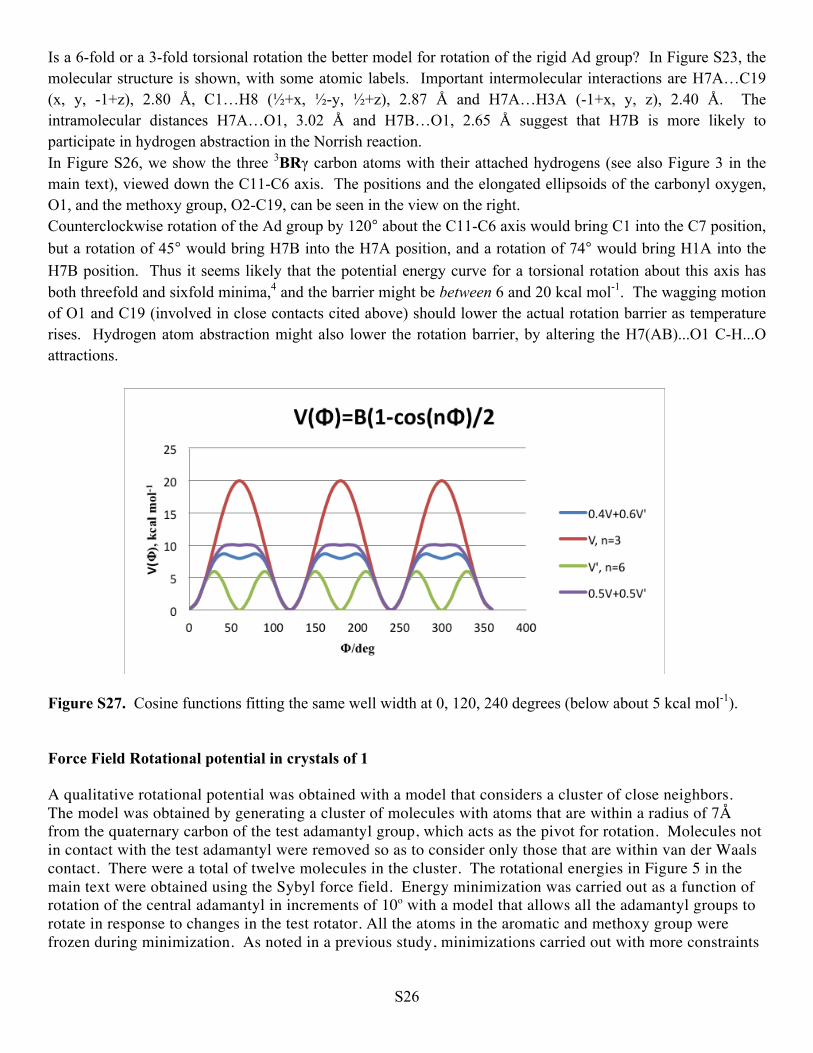
Figure S26. Two views of C1, C5 and C7 in the Ad group at 100K, down the C11-C6 axis.5 The view on the right includes the entire p-methoxyacetophenone moiety. See Figure S21.
g.) Summary The 11-atom treatment gives good agreement factors (R, GOF) and good ΔMSDA (Hershfeld) tests. As seen in the ADP ellipsoids in Figures S21 and S24 and in Figure S22, the libration amplitudes (<Φ²>) are small compared with carbonyl O and the OMe group. Still, <Φ²> about the C11-C6 axis increases more rapidly with temperature than <Φ²> about the other two inertial axes. To estimate barriers to molecular motion from ADP libration amplitudes, a torsional model may be considered. The barrier is calculated from <Φ²> and the temperature (Figure S23). RT/B is approximately 0.03 for <Φ²>= 20.6 (°)2 (3-fold rotation), and approximately 0.1 for <Φ²>= 20.6 (°)2 (6-fold rotation), at 300K. For T ≅ 300K, B ≅ RT/0.03 ≅ 20 kcal mol-1 (3-fold) and B ≅ RT/0.1 ≅ 6 kcal mol-1 (6-fold).
S26
Is a 6-fold or a 3-fold torsional rotation the better model for rotation of the rigid Ad group? In Figure S23, the molecular structure is shown, with some atomic labels. Important intermolecular interactions are H7A…C19 (x, y, -1+z), 2.80 Å, C1…H8 (½+x, ½-y, ½+z), 2.87 Å and H7A…H3A (-1+x, y, z), 2.40 Å. The intramolecular distances H7A…O1, 3.02 Å and H7B…O1, 2.65 Å suggest that H7B is more likely to participate in hydrogen abstraction in the Norrish reaction. In Figure S26, we show the three 3BRγ carbon atoms with their attached hydrogens (see also Figure 3 in the main text), viewed down the C11-C6 axis. The positions and the elongated ellipsoids of the carbonyl oxygen, O1, and the methoxy group, O2-C19, can be seen in the view on the right. Counterclockwise rotation of the Ad group by 120° about the C11-C6 axis would bring C1 into the C7 position, but a rotation of 45° would bring H7B into the H7A position, and a rotation of 74° would bring H1A into the H7B position. Thus it seems likely that the potential energy curve for a torsional rotation about this axis has both threefold and sixfold minima,4 and the barrier might be between 6 and 20 kcal mol-1. The wagging motion of O1 and C19 (involved in close contacts cited above) should lower the actual rotation barrier as temperature rises. Hydrogen atom abstraction might also lower the rotation barrier, by altering the H7(AB)...O1 C-H...O attractions.
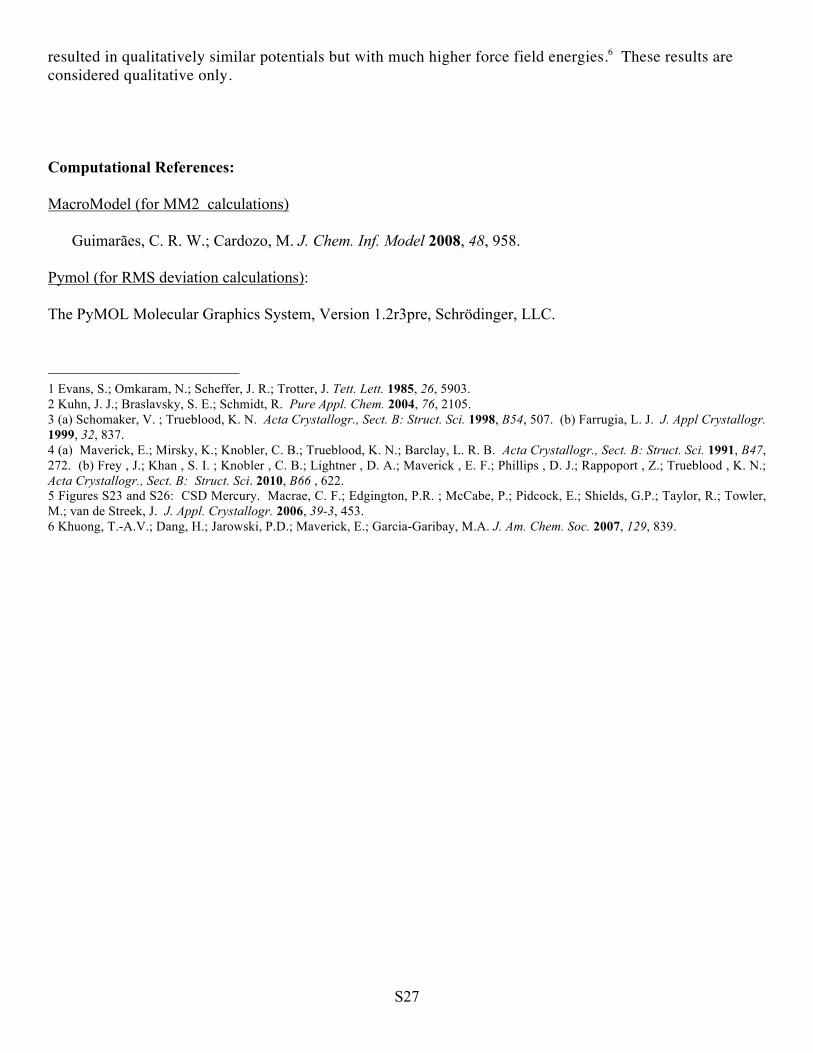
Figure S27. Cosine functions fitting the same well width at 0, 120, 240 degrees (below about 5 kcal mol-1).
Force Field Rotational potential in crystals of 1 A qualitative rotational potential was obtained with a model that considers a cluster of close neighbors. The model was obtained by generating a cluster of molecules with atoms that are within a radius of 7Å from the quaternary carbon of the test adamantyl group, which acts as the pivot for rotation. Molecules not in contact with the test adamantyl were removed so as to consider only those that are within van der Waals contact. There were a total of twelve molecules in the cluster. The rotational energies in Figure 5 in the main text were obtained using the Sybyl force field. Energy minimization was carried out as a function of rotation of the central adamantyl in increments of 10o with a model that allows all the adamantyl groups to rotate in response to changes in the test rotator. All the atoms in the aromatic and methoxy group were frozen during minimization. As noted in a previous study, minimizations carried out with more constraints
S27
resulted in qualitatively similar potentials but with much higher force field energies.6 These results are considered qualitative only.
Computational References:
MacroModel (for MM2 calculations)
Guimarães, C. R. W.; Cardozo, M. J. Chem. Inf. Model 2008, 48, 958.
Pymol (for RMS deviation calculations):
The PyMOL Molecular Graphics System, Version 1.2r3pre, Schrödinger, LLC.
1 Evans, S.; Omkaram, N.; Scheffer, J. R.; Trotter, J. Tett. Lett. 1985, 26, 5903. 2 Kuhn, J. J.; Braslavsky, S. E.; Schmidt, R. Pure Appl. Chem. 2004, 76, 2105. 3 (a) Schomaker, V. ; Trueblood, K. N. Acta Crystallogr., Sect. B: Struct. Sci. 1998, B54, 507. (b) Farrugia, L. J. J. Appl Crystallogr. 1999, 32, 837. 4 (a) Maverick, E.; Mirsky, K.; Knobler, C. B.; Trueblood, K. N.; Barclay, L. R. B. Acta Crystallogr., Sect. B: Struct. Sci. 1991, B47, 272. (b) Frey , J.; Khan , S. I. ; Knobler , C. B.; Lightner , D. A.; Maverick , E. F.; Phillips , D. J.; Rappoport , Z.; Trueblood , K. N.; Acta Crystallogr., Sect. B: Struct. Sci. 2010, B66 , 622. 5 Figures S23 and S26: CSD Mercury. Macrae, C. F.; Edgington, P.R. ; McCabe, P.; Pidcock, E.; Shields, G.P.; Taylor, R.; Towler, M.; van de Streek, J. J. Appl. Crystallogr. 2006, 39-3, 453. 6 Khuong, T.-A.V.; Dang, H.; Jarowski, P.D.; Maverick, E.; Garcia-Garibay, M.A. J. Am. Chem. Soc. 2007, 129, 839.