Rapid removal of organic micropollutants from water by a ...
17
190 | NATURE | VOL 529 | 14 JANUARY 2016 LETTER doi:10.1038/nature16185 Rapid removal of organic micropollutants from water by a porous β-cyclodextrin polymer Alaaeddin Alsbaiee 1 , Brian J. Smith 1 , Leilei Xiao 1 , Yuhan Ling 2 , Damian E. Helbling 2 & William R. Dichtel 1 The global occurrence in water resources of organic micropollutants, such as pesticides and pharmaceuticals, has raised concerns about potential negative effects on aquatic ecosystems and human health 1–5 . Activated carbons are the most widespread adsorbent materials used to remove organic pollutants from water but they have several deficiencies, including slow pollutant uptake (of the order of hours) 6,7 and poor removal of many relatively hydrophilic micropollutants 8 . Furthermore, regenerating spent activated carbon is energy intensive (requiring heating to 500–900 degrees Celsius) and does not fully restore performance 9,10 . Insoluble polymers of β-cyclodextrin, an inexpensive, sustainably produced macrocycle of glucose, are likewise of interest for removing micropollutants from water by means of adsorption 11 . β-cyclodextrin is known to encapsulate pollutants to form well-defined host–guest complexes, but until now cross-linked β-cyclodextrin polymers have had low surface areas and poor removal performance compared to conventional activated carbons 11–13 . Here we crosslink β-cyclodextrin with rigid aromatic groups, providing a high-surface-area, mesoporous polymer of β-cyclodextrin. It rapidly sequesters a variety of organic micropollutants with adsorption rate constants 15 to 200 times greater than those of activated carbons and non-porous β-cyclodextrin adsorbent materials 7,8,11–13 . In addition, the polymer can be regenerated several times using a mild washing procedure with no loss in performance. Finally, the polymer outperformed a leading activated carbon for the rapid removal of a complex mixture of organic micropollutants at environmentally relevant concentrations. These findings demonstrate the promise of porous cyclodextrin-based polymers for rapid, flow-through water treatment. Porous β-CD-containing polymers (P-CDPs) were derived from nucleophilic aromatic substitution of hydroxyl groups of β-CD by tetrafluoroterephthalonitrile (1). Although 1 has been copolymer- ized with bifunctional catechols previously 14 , its reaction with ali- phatic alkoxides is undescribed. β-CD and 1 were polymerized in a suspension of K 2 CO 3 in tetrahydrofuran (THF) at 80 °C to provide a pale-yellow precipitate in 20% yield, which proved to be a meso- porous high-surface-area polymer with the expected chemical bonds (Fig. 1a). The yield was further improved to 45% by performing the polymerization in THF:DMF (dimethylformamide) 9:1 by volume, in which β-CD is more soluble (see Supplementary Information sec- tion ‘Improved synthesis of P-CDP’ and Supplementary Figs 1 and 2). Following activation under high vacuum, N 2 porosimetry of the P-CDPs provided type II isotherms indicative of mesoporosity, and their Brunauer–Emmett–Teller surface areas (S BET ) ranged from 35 to 263 m 2 g −1 , depending on the molar feed ratio of 1:β-CD employed in the polymerization (Fig. 1b). P-CDPs obtained from a 1:β-CD ratio of 3:1 consistently exhibited the highest surface areas. Non-local den- sity functional theory (NLDFT) calculations applied to the isotherms indicate that pores of 1.8–3.5 nm diameter comprise the majority of the free volume of P-CDP (Fig. 1c), much like the pore size distribu- tions of activated carbons (ACs; Extended Data Fig. 1). Alternative polymerization conditions (aqueous NaOH, 60 °C) produced a simi- lar polymer that lacked permanent porosity (non-porous (NP)-CDP, S BET = 6 m 2 g −1 ), which serves as a useful control to demonstrate the importance of surface area for rapid micropollutant removal (see Methods section ‘Synthetic procedures’). ‘Water regain’ analysis of P-CDP and NP-CDP also reflected the higher pore volume of the former, which took up 265% of its weight when dispersed in H 2 O as compared to 86% for the latter (Extended Data Table 1). Nevertheless, NP-CDP swells to a much greater degree, as its H 2 O uptake is approx- imately 300 times its dry pore volume, as compared to a factor of only 23 for P-CDP. P-CDP’s combination of high H 2 O uptake and modest swelling are desirable, as these parameters maximize adsorbent per- formance and minimize undesirable pressure drops associated with filtration processes. Compositional analysis and spectroscopic characterization of the P-CDP and NP-CDP networks indicated the presence of both 1 and β-CD moieties in the polymers (see Methods section ‘FT-IR and solid-state 13 C NMR characterization of P-CDP and NP-CDP’, Extended Data Figs 2 and 3). The ratio of 1:β-CD in each polymer was determined by combustion analysis, with 6.1 equiv. of 1 per β-CD for P-CDP and 3.5 equiv. of 1 per β-CD for NP-CDP (see Methods section ‘Synthetic procedures’). Therefore P-CDP is more densely crosslinked than NP-CDP, which might be responsible for its permanent porosity. The F:N ratio also indicates that the terephthalonitrile moieties in each polymer are substituted by 2.1 and 2.2 alkoxides on average, which are consistent with model studies (see model reactions S1–S4 and Supplementary Figs 3–7), which suggest that the β-CD macrocycles are linked predominantly at both the small and large rims through disubstituted terephthalonitrile moieties. The high surface area and permanent porosity of P-CDP enable the rapid removal of organic contaminants from water. Bisphenol A, a component of plastics that has attracted concerns as an endocrine disruptor, was chosen as a model pollutant to enable comparison with established adsorbents 15,16 . We compared uptake of bisphenol A by P-CDP, NP-CDP, and a non-porous β-CD polymer crosslinked with epichlorohydrin (EPI-CDP, S BET = 23 m 2 g −1 ), which is the most extensively studied β-CD polymer for water purification and has been commercialized 12 . We also tested three types of mesoporous ACs: the hybrid AC/ion exchange resin used in commercial Brita point-of- use filters (Brita AC, S BET = 507 m 2 g −1 ), DARCO granular activated carbon (GAC, S BET = 612 m 2 g −1 ), and Norit RO 0.8 activated carbon (NAC, S BET = 984 m 2 g −1 ), which is a leading AC typically used for high-value water purification (Extended Data Fig. 1). Each adsor- bent (1 mg ml −1 ) eventually removed most of the bisphenol A from a 0.1 mM (22.8 mg l −1 ) aqueous solution, corresponding to equilibrium uptakes of 19–24 mg bisphenol A per g adsorbent (Extended Data Table 2, Extended Data Fig. 4), with P-CDP near the high end of this range (22 mg g −1 ). More importantly, P-CDP removed bisphenol A 1 Department of Chemistry and Chemical Biology, Cornell University, Baker Laboratory, Ithaca, New York 14853, USA. 2 School of Civil and Environmental Engineering, Cornell University, Ithaca, New York 14853, USA. © 2016 Macmillan Publishers Limited. All rights reserved
Transcript of Rapid removal of organic micropollutants from water by a ...
1 9 0 | N A T U R E | V O L 5 2 9 | 1 4 J A N U A R y 2 0 1 6
LETTERdoi:10.1038/nature16185
Rapid removal of organic micropollutants from water by a porous β-cyclodextrin polymerAlaaeddin Alsbaiee1, Brian J. Smith1, Leilei Xiao1, yuhan Ling2, Damian E. Helbling2 & William R. Dichtel1
The global occurrence in water resources of organic micropollutants, such as pesticides and pharmaceuticals, has raised concerns about potential negative effects on aquatic ecosystems and human health1–5. Activated carbons are the most widespread adsorbent materials used to remove organic pollutants from water but they have several deficiencies, including slow pollutant uptake (of the order of hours)6,7 and poor removal of many relatively hydrophilic micropollutants8. Furthermore, regenerating spent activated carbon is energy intensive (requiring heating to 500–900 degrees Celsius) and does not fully restore performance9,10. Insoluble polymers of β-cyclodextrin, an inexpensive, sustainably produced macrocycle of glucose, are likewise of interest for removing micropollutants from water by means of adsorption11. β-cyclodextrin is known to encapsulate pollutants to form well-defined host–guest complexes, but until now cross-linked β-cyclodextrin polymers have had low surface areas and poor removal performance compared to conventional activated carbons11–13. Here we crosslink β-cyclodextrin with rigid aromatic groups, providing a high-surface-area, mesoporous polymer of β-cyclodextrin. It rapidly sequesters a variety of organic micropollutants with adsorption rate constants 15 to 200 times greater than those of activated carbons and non-porous β-cyclodextrin adsorbent materials7,8,11–13. In addition, the polymer can be regenerated several times using a mild washing procedure with no loss in performance. Finally, the polymer outperformed a leading activated carbon for the rapid removal of a complex mixture of organic micropollutants at environmentally relevant concentrations. These findings demonstrate the promise of porous cyclodextrin-based polymers for rapid, flow-through water treatment.
Porous β-CD-containing polymers (P-CDPs) were derived from nucleophilic aromatic substitution of hydroxyl groups of β-CD by tetrafluoroterephthalonitrile (1). Although 1 has been copolymer-ized with bifunctional catechols previously14, its reaction with ali-phatic alkoxides is undescribed. β-CD and 1 were polymerized in a suspension of K2CO3 in tetrahydrofuran (THF) at 80 °C to provide a pale-yellow precipitate in 20% yield, which proved to be a meso-porous high-surface-area polymer with the expected chemical bonds (Fig. 1a). The yield was further improved to 45% by performing the polymerization in THF:DMF (dimethylformamide) 9:1 by volume, in which β-CD is more soluble (see Supplementary Information sec-tion ‘Improved synthesis of P-CDP’ and Supplementary Figs 1 and 2). Following activation under high vacuum, N2 porosimetry of the P-CDPs provided type II isotherms indicative of mesoporosity, and their Brunauer–Emmett–Teller surface areas (SBET) ranged from 35 to 263 m2 g−1, depending on the molar feed ratio of 1:β-CD employed in the polymerization (Fig. 1b). P-CDPs obtained from a 1:β-CD ratio of 3:1 consistently exhibited the highest surface areas. Non-local den-sity functional theory (NLDFT) calculations applied to the isotherms indicate that pores of 1.8–3.5 nm diameter comprise the majority of
the free volume of P-CDP (Fig. 1c), much like the pore size distribu-tions of activated carbons (ACs; Extended Data Fig. 1). Alternative polymerization conditions (aqueous NaOH, 60 °C) produced a simi-lar polymer that lacked permanent porosity (non-porous (NP)-CDP, SBET = 6 m2 g−1), which serves as a useful control to demonstrate the importance of surface area for rapid micropollutant removal (see Methods section ‘Synthetic procedures’). ‘Water regain’ analysis of P-CDP and NP-CDP also reflected the higher pore volume of the former, which took up 265% of its weight when dispersed in H2O as compared to 86% for the latter (Extended Data Table 1). Nevertheless, NP-CDP swells to a much greater degree, as its H2O uptake is approx-imately 300 times its dry pore volume, as compared to a factor of only 23 for P-CDP. P-CDP’s combination of high H2O uptake and modest swelling are desirable, as these parameters maximize adsorbent per-formance and minimize undesirable pressure drops associated with filtration processes.
Compositional analysis and spectroscopic characterization of the P-CDP and NP-CDP networks indicated the presence of both 1 and β-CD moieties in the polymers (see Methods section ‘FT-IR and solid-state 13C NMR characterization of P-CDP and NP-CDP’, Extended Data Figs 2 and 3). The ratio of 1:β-CD in each polymer was determined by combustion analysis, with 6.1 equiv. of 1 per β-CD for P-CDP and 3.5 equiv. of 1 per β-CD for NP-CDP (see Methods section ‘Synthetic procedures’). Therefore P-CDP is more densely crosslinked than NP-CDP, which might be responsible for its permanent porosity. The F:N ratio also indicates that the terephthalonitrile moieties in each polymer are substituted by 2.1 and 2.2 alkoxides on average, which are consistent with model studies (see model reactions S1–S4 and Supplementary Figs 3–7), which suggest that the β-CD macrocycles are linked predominantly at both the small and large rims through disubstituted terephthalonitrile moieties.
The high surface area and permanent porosity of P-CDP enable the rapid removal of organic contaminants from water. Bisphenol A, a component of plastics that has attracted concerns as an endocrine disruptor, was chosen as a model pollutant to enable comparison with established adsorbents15,16. We compared uptake of bisphenol A by P-CDP, NP-CDP, and a non-porous β-CD polymer crosslinked with epichlorohydrin (EPI-CDP, SBET = 23 m2 g−1), which is the most extensively studied β-CD polymer for water purification and has been commercialized12. We also tested three types of mesoporous ACs: the hybrid AC/ion exchange resin used in commercial Brita point-of-use filters (Brita AC, SBET = 507 m2 g−1), DARCO granular activated carbon (GAC, SBET = 612 m2 g−1), and Norit RO 0.8 activated carbon (NAC, SBET = 984 m2 g−1), which is a leading AC typically used for high-value water purification (Extended Data Fig. 1). Each adsor-bent (1 mg ml−1) eventually removed most of the bisphenol A from a 0.1 mM (22.8 mg l−1) aqueous solution, corresponding to equilibrium uptakes of 19–24 mg bisphenol A per g adsorbent (Extended Data Table 2, Extended Data Fig. 4), with P-CDP near the high end of this range (22 mg g−1). More importantly, P-CDP removed bisphenol A
1Department of Chemistry and Chemical Biology, Cornell University, Baker Laboratory, Ithaca, New York 14853, USA. 2School of Civil and Environmental Engineering, Cornell University, Ithaca, New York 14853, USA.
© 2016 Macmillan Publishers Limited. All rights reserved
1 4 J A N U A R y 2 0 1 6 | V O L 5 2 9 | N A T U R E | 1 9 1
Letter reSeArCH
much more quickly than all other adsorbents, reaching ~95% of its equilibrium uptake in 10 s (Fig. 2a). In contrast, NP-CDP required 30 min to reach equilibrium and adsorbed only 46% of its equilib-rium value in 10 s, indicating that the near-instantaneous adsorption of bisphenol A by P-CDP is attributable to its porosity. Likewise, EPI-CDP required more than 1 h to reach equilibrium and only adsorbed 22% of its equilibrium value after 10 s, which is consistent with previ-ous reports17. Finally, Brita AC and GAC each required more than 1 h to reach equilibrium, while NAC required 10 min (Fig. 2a). NAC only adsorbed 53% of its equilibrium value in 10 s despite its nearly four times higher surface area than P-CDP.
The apparent pseudo-second-order rate constant (kobs) of bisphe-nol A adsorption to P-CDP is 1.5 mg g−1 min−1, which is 15 times higher than the high-performance NAC and two or more orders of magnitude higher than the other studied adsorbents (Extended Data Table 2, Extended Data Fig. 4). To our knowledge, this rate constant is the highest reported for bisphenol A or any other pollutant removed by ACs6,7, mesoporous silicas18 or carbohydrate-based adsorbents19–21 under similar experimental conditions. kobs amalgamates the
performance of readily accessible binding sites (conceptualized as the outer surface of the adsorbent) and less accessible binding sites (conceptualized as being within the adsorbent’s interior). P-CDP’s superior kobs for bisphenol A adsorption indicates that nearly all of its β-CD binding sites are readily accessible, a feature not found in other adsorbents of which we are aware. We further probed the readily acces-sible binding sites of each adsorbent by determining the flow-through uptake of bisphenol A. In these experiments, the adsorbent (~3 mg) was trapped as a thin layer on a 0.2 μm syringe filter, and aqueous bisphenol A (3 ml, 0.1 mM) was passed rapidly through the filter at a flow rate of 9 ml min−1. Under these conditions, P-CDP removed 80% of the bisphenol A from the solution, corresponding to more than 85% of its equilibrium uptake (Fig. 2b), whereas NAC removed 59% of the bisphenol A under the same conditions, indicative that nearly half of its binding sites are not accessible on the 20 s timescale. The superior performance of P-CDP further indicates that most of its β-CD moieties are rapidly accessed by bisphenol A.
The thermodynamic parameters of P-CDP’s bisphenol A adsorp-tion are consistent with the formation of β-CD inclusion complexes.
a b
c
+ 3
K2CO3 / THF80 °C/48 h
β-CD 1
O
HO OH
HO
O
7
CN
F
F
CN
F
F
CN
CN
O
HO OH
HO
O
7
OO
F2
P-CDP
0
40
80
120
0 0.2 0.4 0.6 0.8 1.0
N2
abso
rbed
(cm
3 g–1
STP
)
P/P0
0
0.02
0.04
0.06
0 4 8 12 16 20
Por
e vo
lum
e (c
m3
g–1)
Pore width (nm)
SBET = 263 m2 g–1
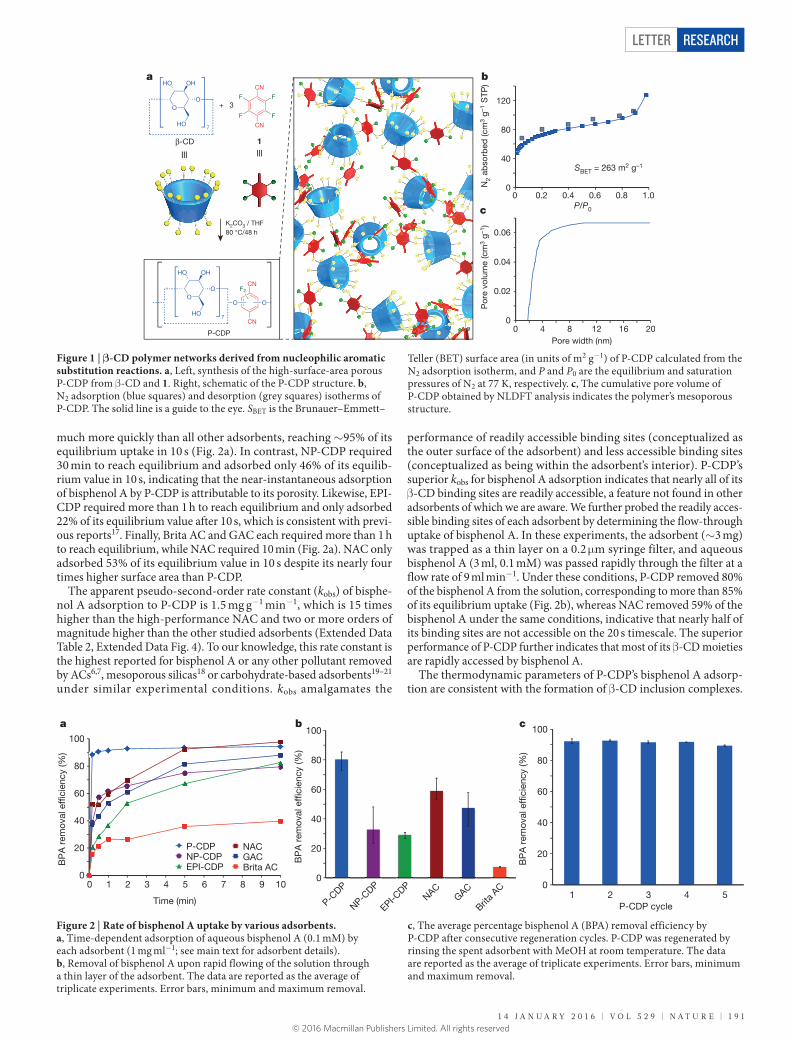
Figure 1 | β-CD polymer networks derived from nucleophilic aromatic substitution reactions. a, Left, synthesis of the high-surface-area porous P-CDP from β-CD and 1. Right, schematic of the P-CDP structure. b, N2 adsorption (blue squares) and desorption (grey squares) isotherms of P-CDP. The solid line is a guide to the eye. SBET is the Brunauer–Emmett–
Teller (BET) surface area (in units of m2 g−1) of P-CDP calculated from the N2 adsorption isotherm, and P and P0 are the equilibrium and saturation pressures of N2 at 77 K, respectively. c, The cumulative pore volume of P-CDP obtained by NLDFT analysis indicates the polymer’s mesoporous structure.
P-CDP NP-CDP EPI-CDP
NAC GAC Brita AC
0
20
40
60
80
100
0 1 2 3 4 5 6 7 8 9 10
BP
A r
emov
al e
f�ci
ency
(%)
Time (min)
0
20
40
60
80
100
P-CDP
NP-CDP
EPI-CDP
NAC
GAC
Brita A
C
BP
A r
emov
al e
f�ci
ency
(%)
0
20
40
60
80
100
1 2 3 4 5
BP
A r
emov
al e
f�ci
ency
(%)
P-CDP cycle
a b c
Figure 2 | Rate of bisphenol A uptake by various adsorbents. a, Time-dependent adsorption of aqueous bisphenol A (0.1 mM) by each adsorbent (1 mg ml−1; see main text for adsorbent details). b, Removal of bisphenol A upon rapid flowing of the solution through a thin layer of the adsorbent. The data are reported as the average of triplicate experiments. Error bars, minimum and maximum removal.
c, The average percentage bisphenol A (BPA) removal efficiency by P-CDP after consecutive regeneration cycles. P-CDP was regenerated by rinsing the spent adsorbent with MeOH at room temperature. The data are reported as the average of triplicate experiments. Error bars, minimum and maximum removal.
© 2016 Macmillan Publishers Limited. All rights reserved
1 9 2 | N A T U R E | V O L 5 2 9 | 1 4 J A N U A R y 2 0 1 6
LetterreSeArCH
P-CDP’s equilibrium uptake as a function of residual bisphenol A concentration after adsorption, [BPA], fitted the Langmuir model (Methods section ‘Thermodynamic studies of adsorption’, Extended Data Fig. 5), suggesting 1:1 inclusion complex formation with an association constant (K) of 56,000 M−1, which is comparable to the values reported for other β-CD polymers22. Furthermore, the max-imum adsorption capacity at equilibrium (qmax,e) was found to be 88 mg g−1, which is similar to the highest reported value of an EPI-CDP (84 mg g−1)11, and corresponds to a bisphenol A:β-CD molar ratio of 0.9. Therefore, most of the β-CD units in the polymer are able to form 1:1 complexes with bisphenol A at equilibrium. At even higher concentrations of bisphenol A, P-CDP achieves bisphenol A:β-CD ratios greater than 1, presumably by binding bisphenol A on the out-side of the CD rings or through other non-specific interactions. For example, 1 mg ml−1 of P-CDP adsorbs 200 mg g−1 of bisphenol A from a 1 mM aqueous solution, indicating significant capacity beyond 1:1 CD inclusion complexes. However, these results suggest that P-CDP’s binding properties will reflect those of β-CD inclusion complex for-mation at concentrations relevant for water purification.
In contrast to the energy intensive and degradative regeneration pro-cesses of ACs, bisphenol A is easily removed from P-CDP by rinsing
the polymer with MeOH at room temperature. Five consecutive bisphenol A adsorption/desorption cycles were performed and the regenerated P-CDP exhibited almost no decrease in performance compared to the as-synthesized polymer (Fig. 2c). A functional cost analysis of P-CDP indicates raw materials costs of US dollar (USD) 3.70 per kg assuming further optimization of the polymerization, corresponding to manufacturing cost estimates of USD 5–25 per kg (see Supplementary Information section ‘Functional cost analysis of P-CDP’). These estimates show promise compared to the costs (more than USD 9 per kg) of advanced ACs used for water treatment and wholesale costs of GAC (USD 22 per kg) and NAC (USD 47 per kg) used in this study. P-CDP’s superior performance, facile regeneration procedure, and practical estimated cost make it reasonable to expect that it will prove economically competitive with ACs when full life- cycle analyses are performed.
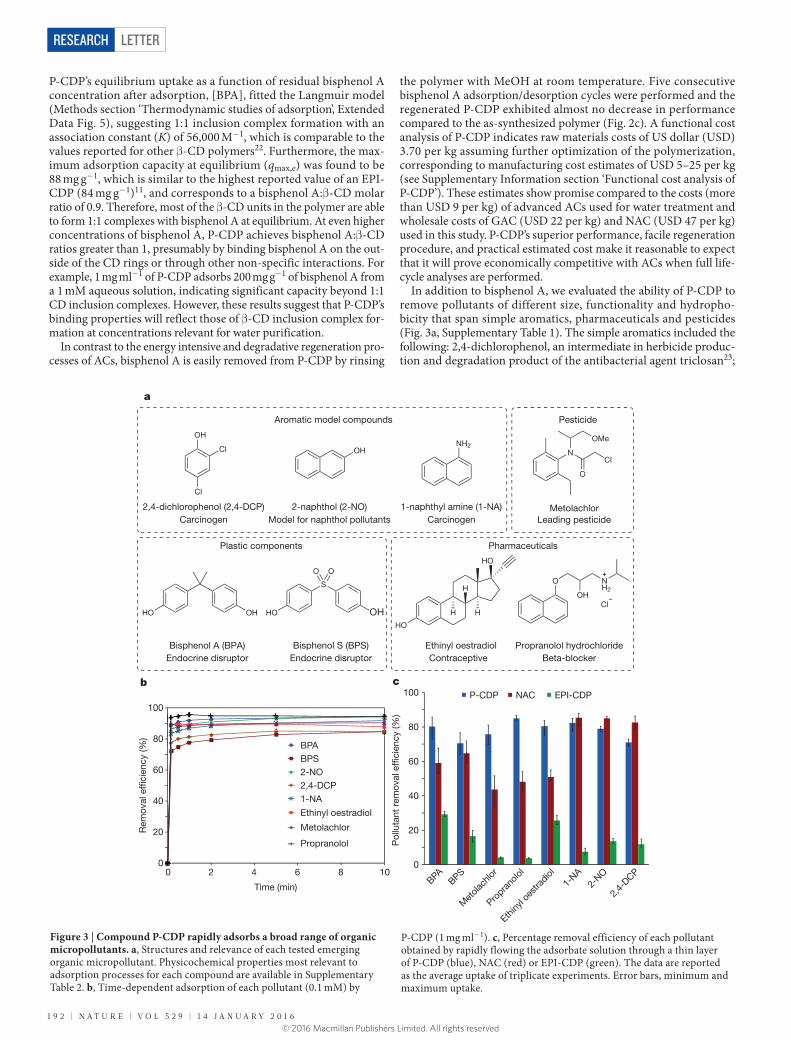
In addition to bisphenol A, we evaluated the ability of P-CDP to remove pollutants of different size, functionality and hydropho-bicity that span simple aromatics, pharmaceuticals and pesticides (Fig. 3a, Supplementary Table 1). The simple aromatics included the following: 2,4-dichlorophenol, an intermediate in herbicide produc-tion and degradation product of the antibacterial agent triclosan23;
Figure 3 | Compound P-CDP rapidly adsorbs a broad range of organic micropollutants. a, Structures and relevance of each tested emerging organic micropollutant. Physicochemical properties most relevant to adsorption processes for each compound are available in Supplementary Table 2. b, Time-dependent adsorption of each pollutant (0.1 mM) by
P-CDP (1 mg ml−1). c, Percentage removal efficiency of each pollutant obtained by rapidly flowing the adsorbate solution through a thin layer of P-CDP (blue), NAC (red) or EPI-CDP (green). The data are reported as the average uptake of triplicate experiments. Error bars, minimum and maximum uptake.
b c
a
0
20
40
60
80
100
0 2 4 6 8 10
Rem
oval
ef�
cien
cy (%
)
Time (min)
BPA BPS 2-NO2,4-DCP 1-NA
Ethinyl oestradiol
0
20
40
60
80
100
BPA
BPS
Met
olach
lor
Propra
nolol
Ethiny
l oes
tradiol
1-NA
2-NO
2,4-
DCP
Pol
luta
nt r
emov
al e
f ci
ency
(%)
P-CDP NAC EPI-CDP
2,4-dichlorophenol (2,4-DCP)Carcinogen
2-naphthol (2-NO)
Aromatic model compounds
1-naphthyl amine (1-NA)
Plastic components
Bisphenol A (BPA) Bisphenol S (BPS)
Pesticide
Metolachlor
Ethinyl oestradiol
Model for naphthol pollutants Carcinogen
Endocrine disruptor Endocrine disruptor
Leading pesticide
Contraceptive
Cl
Propranolol hydrochlorideBeta-blocker
OH
Cl
Cl OHNH2
N
O
Cl
OMe
Pharmaceuticals
HO OH
S
O O
HO OH
HO
H
H H
HO
O
OH
NH2
Metolachlor
Propranolol
© 2016 Macmillan Publishers Limited. All rights reserved
1 4 J A N U A R y 2 0 1 6 | V O L 5 2 9 | N A T U R E | 1 9 3
Letter reSeArCH
1-naphthyl amine, an azo dye precursor and known carcinogen24; and 2-naphthol, a model for various naphthol pollutants. We also evaluated the following anthropogenic contaminants: bisphenol S, which has replaced bisphenol A in many polycarbonates but also appears to be an endocrine disruptor with greater environmental persistence25; metolachlor, one of the most common herbicides that is often detected in streams and groundwater26; ethinyl oestradiol, an oestrogen mimic used in oral contraceptives that has caused the collapse of fish populations at concentrations as low as 5 ng l−1 (ref. 27); and propranolol, a beta-blocker used to treat hypertension, which is not removed efficiently by wastewater treatment protocols and has been detected in effluent streams at concentrations similar to blood serum levels of its users28. Adsorption studies of each of these compounds were performed similarly to those for bisphenol A (0.1 mM adsorbate, 1 mg ml−1 adsorbent), except ethinyl oestradiol, which was tested at a lower concentration because of its low water solubility (0.04 mM adsorbate, 0.5 mg ml−1 adsorbent). Each organic contami-nant is rapidly removed by P-CDP (Fig. 3b, Extended Data Fig. 6), and the time-dependent adsorption curves are similar to that of bisphenol A. The binding constants of the tested pollutants were estimated from the binding efficiency at equilibrium, and all were approximately 104 M−1 (Extended Data Tables 3 and 4). The rapid uptake of these pollutants by P-CDP was also investigated and compared with EPI-CDP and high performance NAC (Fig. 3c). P-CDP shows excellent rapid uptake of all pollutants, in stark contrast to the non-porous EPI-CDP, and it also outperforms NAC for all of the studied emerging contaminants. P-CDP even shows similar performance to NAC for the planar aromatic model compounds, which interact strongly with ACs. P-CDP’s superior perfor-mance for anthropogenic contaminants indicates a major advantage of β-CD-based adsorbents: their three-dimensional cavities are a better match for non-planar compounds.
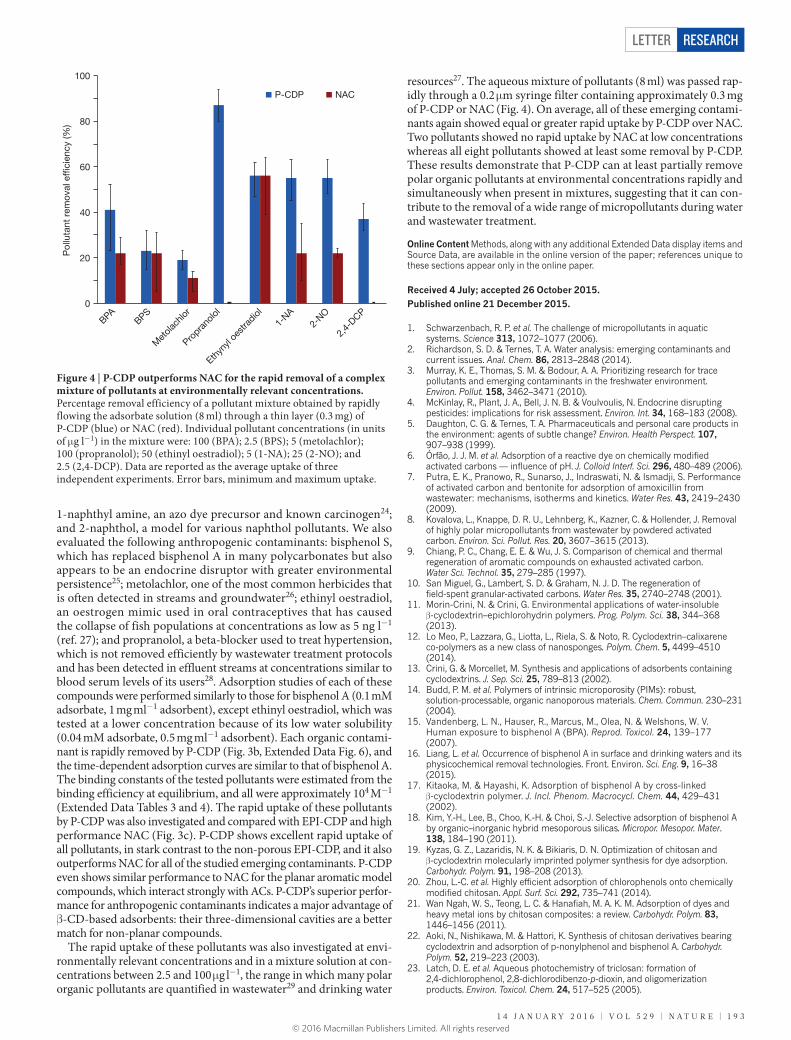
The rapid uptake of these pollutants was also investigated at envi-ronmentally relevant concentrations and in a mixture solution at con-centrations between 2.5 and 100 μg l−1, the range in which many polar organic pollutants are quantified in wastewater29 and drinking water
resources27. The aqueous mixture of pollutants (8 ml) was passed rap-idly through a 0.2 μm syringe filter containing approximately 0.3 mg of P-CDP or NAC (Fig. 4). On average, all of these emerging contami-nants again showed equal or greater rapid uptake by P-CDP over NAC. Two pollutants showed no rapid uptake by NAC at low concentrations whereas all eight pollutants showed at least some removal by P-CDP. These results demonstrate that P-CDP can at least partially remove polar organic pollutants at environmental concentrations rapidly and simultaneously when present in mixtures, suggesting that it can con-tribute to the removal of a wide range of micropollutants during water and wastewater treatment.
Online Content Methods, along with any additional Extended Data display items and Source Data, are available in the online version of the paper; references unique to these sections appear only in the online paper.
received 4 July; accepted 26 October 2015.
Published online 21 December 2015.
1. Schwarzenbach, R. P. et al. The challenge of micropollutants in aquatic systems. Science 313, 1072–1077 (2006).
2. Richardson, S. D. & Ternes, T. A. Water analysis: emerging contaminants and current issues. Anal. Chem. 86, 2813–2848 (2014).
3. Murray, K. E., Thomas, S. M. & Bodour, A. A. Prioritizing research for trace pollutants and emerging contaminants in the freshwater environment. Environ. Pollut. 158, 3462–3471 (2010).
4. McKinlay, R., Plant, J. A., Bell, J. N. B. & Voulvoulis, N. Endocrine disrupting pesticides: implications for risk assessment. Environ. Int. 34, 168–183 (2008).
5. Daughton, C. G. & Ternes, T. A. Pharmaceuticals and personal care products in the environment: agents of subtle change? Environ. Health Perspect. 107, 907–938 (1999).
6. Órfão, J. J. M. et al. Adsorption of a reactive dye on chemically modified activated carbons — influence of pH. J. Colloid Interf. Sci. 296, 480–489 (2006).
7. Putra, E. K., Pranowo, R., Sunarso, J., Indraswati, N. & Ismadji, S. Performance of activated carbon and bentonite for adsorption of amoxicillin from wastewater: mechanisms, isotherms and kinetics. Water Res. 43, 2419–2430 (2009).
8. Kovalova, L., Knappe, D. R. U., Lehnberg, K., Kazner, C. & Hollender, J. Removal of highly polar micropollutants from wastewater by powdered activated carbon. Environ. Sci. Pollut. Res. 20, 3607–3615 (2013).
9. Chiang, P. C., Chang, E. E. & Wu, J. S. Comparison of chemical and thermal regeneration of aromatic compounds on exhausted activated carbon. Water Sci. Technol. 35, 279–285 (1997).
10. San Miguel, G., Lambert, S. D. & Graham, N. J. D. The regeneration of field-spent granular-activated carbons. Water Res. 35, 2740–2748 (2001).
11. Morin-Crini, N. & Crini, G. Environmental applications of water-insoluble β-cyclodextrin–epichlorohydrin polymers. Prog. Polym. Sci. 38, 344–368 (2013).
12. Lo Meo, P., Lazzara, G., Liotta, L., Riela, S. & Noto, R. Cyclodextrin–calixarene co-polymers as a new class of nanosponges. Polym. Chem. 5, 4499–4510 (2014).
13. Crini, G. & Morcellet, M. Synthesis and applications of adsorbents containing cyclodextrins. J. Sep. Sci. 25, 789–813 (2002).
14. Budd, P. M. et al. Polymers of intrinsic microporosity (PIMs): robust, solution-processable, organic nanoporous materials. Chem. Commun. 230–231 (2004).
15. Vandenberg, L. N., Hauser, R., Marcus, M., Olea, N. & Welshons, W. V. Human exposure to bisphenol A (BPA). Reprod. Toxicol. 24, 139–177 (2007).
16. Liang, L. et al. Occurrence of bisphenol A in surface and drinking waters and its physicochemical removal technologies. Front. Environ. Sci. Eng. 9, 16–38 (2015).
17. Kitaoka, M. & Hayashi, K. Adsorption of bisphenol A by cross-linked β-cyclodextrin polymer. J. Incl. Phenom. Macrocycl. Chem. 44, 429–431 (2002).
18. Kim, Y.-H., Lee, B., Choo, K.-H. & Choi, S.-J. Selective adsorption of bisphenol A by organic–inorganic hybrid mesoporous silicas. Micropor. Mesopor. Mater. 138, 184–190 (2011).
19. Kyzas, G. Z., Lazaridis, N. K. & Bikiaris, D. N. Optimization of chitosan and β-cyclodextrin molecularly imprinted polymer synthesis for dye adsorption. Carbohydr. Polym. 91, 198–208 (2013).
20. Zhou, L.-C. et al. Highly efficient adsorption of chlorophenols onto chemically modified chitosan. Appl. Surf. Sci. 292, 735–741 (2014).
21. Wan Ngah, W. S., Teong, L. C. & Hanafiah, M. A. K. M. Adsorption of dyes and heavy metal ions by chitosan composites: a review. Carbohydr. Polym. 83, 1446–1456 (2011).
22. Aoki, N., Nishikawa, M. & Hattori, K. Synthesis of chitosan derivatives bearing cyclodextrin and adsorption of p-nonylphenol and bisphenol A. Carbohydr. Polym. 52, 219–223 (2003).
23. Latch, D. E. et al. Aqueous photochemistry of triclosan: formation of 2,4-dichlorophenol, 2,8-dichlorodibenzo-p-dioxin, and oligomerization products. Environ. Toxicol. Chem. 24, 517–525 (2005).
0
20
40
60
80
100
BPA
BPS
Met
olach
lor
Propra
nolol
Ethyn
yl oe
strad
iol
1-NA
2-NO
2,4-
DCP
Pol
luta
nt r
emov
al e
f ci
ency
(%)
P-CDP NAC
Figure 4 | P-CDP outperforms NAC for the rapid removal of a complex mixture of pollutants at environmentally relevant concentrations. Percentage removal efficiency of a pollutant mixture obtained by rapidly flowing the adsorbate solution (8 ml) through a thin layer (0.3 mg) of P-CDP (blue) or NAC (red). Individual pollutant concentrations (in units of μg l−1) in the mixture were: 100 (BPA); 2.5 (BPS); 5 (metolachlor); 100 (propranolol); 50 (ethinyl oestradiol); 5 (1-NA); 25 (2-NO); and 2.5 (2,4-DCP). Data are reported as the average uptake of three independent experiments. Error bars, minimum and maximum uptake.
© 2016 Macmillan Publishers Limited. All rights reserved
1 9 4 | N A T U R E | V O L 5 2 9 | 1 4 J A N U A R y 2 0 1 6
LetterreSeArCH
24. Occupational Safety and Health Administration (OSHA) Standard, USA. Toxic and Hazardous Substances: 13 Carcinogens (4-Nitrobiphenyl, etc.). Standard number 1910.1003. http://www.osha.gov/pls/oshaweb/owadisp.show_document?p_table=STANDARDS&p_id=10007 (2012).
25. Ike, M., Chen, M. Y., Danzl, E., Sei, K. & Fujita, M. Biodegradation of a variety of bisphenols under aerobic and anaerobic conditions. Water Sci. Technol. 53, 153–159 (2006).
26. Benner, J. et al. Is biological treatment a viable alternative for micropollutant removal in drinking water treatment processes? Water Res. 47, 5955–5976 (2013).
27. Kidd, K. A. et al. Collapse of a fish population after exposure to a synthetic estrogen. Proc. Natl Acad. Sci. USA 104, 8897–8901 (2007).
28. Kostich, M. S., Batt, A. L. & Lazorchak, J. M. Concentrations of prioritized pharmaceuticals in effluents from 50 large wastewater treatment plants in the US and implications for risk estimation. Environ. Pollut. 184, 354–359 (2014).
29. Oulton, R. L., Kohn, T. & Cwiertny, D. M. Pharmaceuticals and personal care products in effluent matrices: a survey of transformation and removal during wastewater treatment and implications for wastewater management. J. Environ. Monit. 12, 1956–1978 (2010).
Supplementary Information is available in the online version of the paper.
Acknowledgements This work was supported by the National Science Foundation (NSF) through the Center for Sustainable Polymers (CHE-1413862). This research made use of the Cornell Center for Materials Research User Facilities, which are supported by the NSF (DMR-1120296). We acknowledge I. Keresztes for help with NMR spectroscopy, and M. Matsumoto for the design of the schematic of the polymer in Fig. 1a.
Author Contributions A.A., B.J.S., and L.X., and W.R.D. designed, synthesized, and characterized the cyclodextrin polymers and their micropollutant uptake at high concentrations. Y.L. and D.E.H. designed and conducted experiments that quantified micropollutant uptake at low concentrations. All authors wrote the manuscript.
Author Information Reprints and permissions information is available at www.nature.com/reprints. The authors declare competing financial interests: details are available in the online version of the paper. Readers are welcome to comment on the online version of the paper. Correspondence and requests for materials should be addressed to W.R.D. ([email protected]) or D.E.H. ([email protected]) .
© 2016 Macmillan Publishers Limited. All rights reserved
Letter reSeArCH
MethODSA complete set of detailed experiments, spectral data and adsorption experiments are available in Supplementary Information.Reagents. β-cyclodextrin (β-CD) (>97%) and tetrafluoroterephthalonitrile (1) (>99%) were purchased from Sigma Aldrich and used without further purification. Tetrahydrofuran (THF) was purified and dried in a custom-built activated alumina solvent purification system. Epichlorohydrin (>99%) was purchased from Sigma Aldrich and used as received. Aqueous solutions of pollutants were prepared using 18 MΩ deionized H2O at neutral pH. Pollutant model compounds were obtained from commercial sources and used as received. Norit RO 0.8 activated carbon (NAC) pellets were purchased from Sigma Aldrich and ground into a fine powder before use. Brita AC was obtained from a Brita Advanced Faucet point-of-use water filter and was ground into fine powder before use. Granular activated carbon (GAC; DARCO 12–20 mesh) was purchased from Sigma Aldrich, and ground into fine powder before use.Materials and instrumentation. Pollutant removal experiments were performed at 25 °C on a stirring hot plate with a 250 r.p.m. stirring rate. Aqueous suspen-sions of adsorption experiments were filtered in syringes equipped with Whatman 0.2 μm inorganic membrane filters. Instant pollutant removal experiments were also performed in syringes equipped with Whatman 0.2 μm inorganic membrane filters.
Ultraviolet–visible (UV–vis) spectroscopy was performed on a Cary 5000 Varian UV–vis spectrometer. UV–vis spectra were recorded at RT over the range 200–600 nm, corrected against an appropriate background spectrum, and normalized to zero absorbance at 600 nm.
Quantification of analytes from the uptake of pollutant mixtures at μg l−1 concen-trations was performed by mass spectrometry (HPLC-MS). The analytical method was adopted from one previously reported for ultratrace level screening of polar and semi-polar organic chemicals30 and involved high-performance liquid chro-matography (HPLC) coupled with a quadrupole-orbitrap mass spectrometer (MS) (QExactive, ThermoFisher Scientific) and on-line solid phase extraction (EQuan Max Plus, ThermoFisher Scientific). Samples were injected at 5 ml volumes and were loaded onto an XBridge (Waters) C-18 Intelligent Speed (2.1 mm × 20 mm, particle size 5 μm) trap column. Elution from the trap column and onto an XBridge (Waters) C-18 analytical column (2.1 mm × 50 mm, particle size 3.5 μm) was per-formed using a gradient pump delivering 200 μl min−1 of a water and MeOH mobile phase, each containing 0.1 vol.% formic acid. The HPLC-MS was operated with electrospray ionization in positive and negative polarity modes. The MS acquired full-scan MS data within a mass-to-charge range of 100–1,000 for each sample fol-lowed by a data-dependent acquisition of product ion spectra (MS/MS). Analytes were quantified from external calibration standards based on the analyte responses by linear least-squares regression. Limits of quantification for each analyte were determined as the lowest point in the external calibration curve at which at least 8 scans were measured across a chromatographic peak and the most intense MS/MS product ion was still detected. Exact molecular masses, ionization behaviour, retention times, and limits of quantification used for the detection and quantifica-tion of each analyte are provided in Supplementary Table 2.
Infrared spectroscopy was performed on a Thermo Nicolet iS10 with a diamond ATR attachment. Solution-phase NMR experiments were performed on a Varian INOVA-400 using a standard 1H{13C, 15N} Z-PFG probe with a 20 Hz sample spin rate. Solid-state NMR analyses were conducted on a Varian INOVA-400 spectrom-eter using an external Kalmus 1H linear pulse amplifier blanked using a spare line. Samples were packed into 7 mm outside diameter silicon nitride rotors and inserted into a Varian HX magic angle spinning (MAS) probe.
Surface area measurements were conducted on a Micromeritics ASAP 2020 Accelerated Surface Area and Porosimetry Analyzer. Each sample (25–50 mg) was degassed at 90 °C for 24 h and then backfilled with N2. N2 isotherms were generated by incremental exposure to ultrahigh-purity nitrogen up to 1 atm in a liquid nitro-gen (77 K) bath, and surface parameters were determined using BET adsorption models included in the instrument software (Micromeritics ASAP 2020 V4.00).Synthetic procedures. Porous β-cyclodextrin polymer (P-CDP). A flame dried 20 ml scintillation vial equipped with a magnetic stir bar was charged with β-CD (0.200 g, 0.176 mmol), 1 (0.100 g, 0.500 mmol), and K2CO3 (0.300 g, 2.17 mmol). The vial was flushed with N2 gas for 5 min, then dry THF (8 ml) was added and the vial was bubbled with N2 for additional 2–3 min. The N2 inlet was removed and the mixture was placed on a hot stirring plate (85 °C) and stirred at 500 r.p.m. for 2 d. The orange suspension was cooled and then filtered, and the residual K2CO3 was removed by washing the solid on the filter paper with 1 N HCl until CO2 evolution stopped. The recovered light yellow solid was isolated and activated by soaking in H2O (2 × 10 ml) for 15 min, THF (2 × 10 ml) for 30 min and CH2Cl2 (1 × 15 ml) for 15 min. Finally, the solid was dried under high vacuum at 77 K in a liquid nitrogen bath for 10 min and then at RT for 2–3 days. P-CDP (0.055 g, 20% yield)
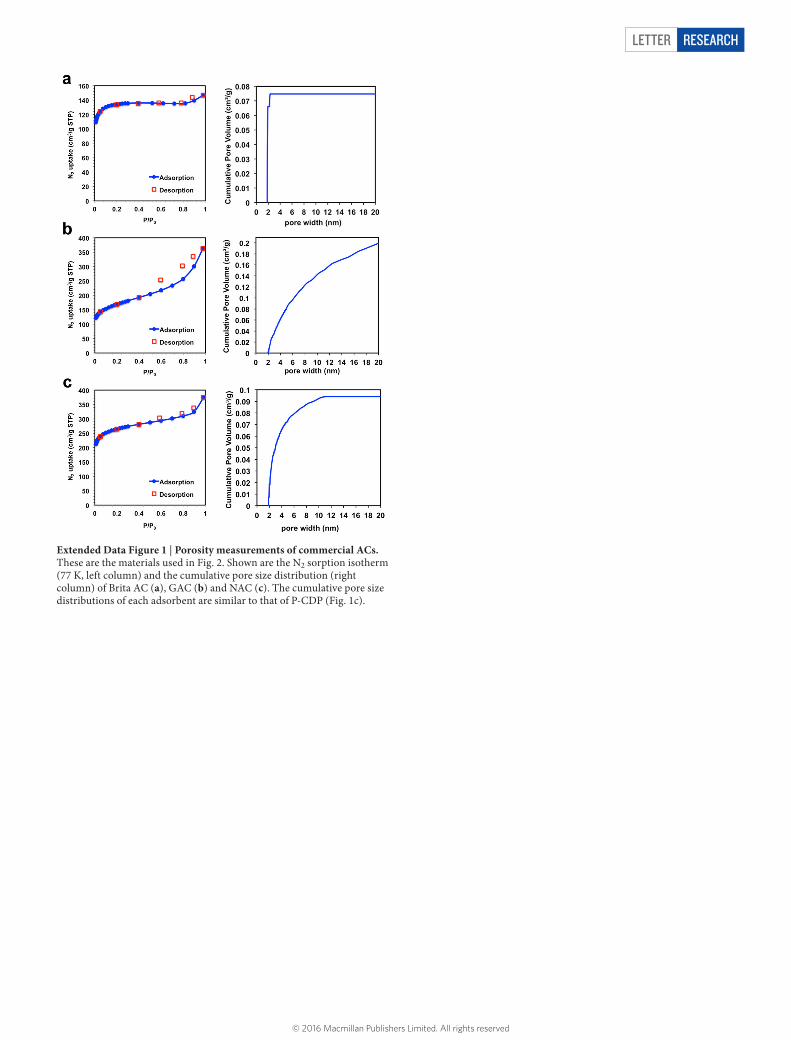
was obtained as a pale yellow powder and subsequently characterized. 13C-MAS SS-NMR (400 MHz): chemical shifts δ of 168.9 p.p.m., 157.2 p.p.m., 131.1 p.p.m., 103.9 p.p.m., 95.2 p.p.m. and 71.8 p.p.m. relative to an external reference (the deu-terium signal of liquid CDCl3). IR (solid, attenuated total reflectance, ATR) 3,368, 2,937, 2,243, 1,684, 1,625, 1,478, 1,376, 1,304, 1,270, 1,153, 1,030 cm−1. Analysis. Calculated for (C42H70O35)1•(C8F2N2)6.1•(CH2Cl2)2•(H2O)2: C, 47.95; H, 3.17; F, 9.97; N, 7.35. Found: C, 48.23; H, 2.99; F, 9.66; N, 7.37.Non-porous β-cyclodextrin polymer (NP-CDP). β-CD (2.00 g, 1.76 mmol) and 1 (2.11 g, 10.6 mmol) were mixed vigorously in an aqueous NaOH solution (6.25 N, 2.00 ml) at 85 °C. The mixture solidified within 1 h, after which deionized H2O was added and the suspension was filtered. The solid was washed by soaking in deionized H2O (2 × 150 ml) for 15 min, THF (3 × 15 ml) for 30 min and CH2Cl2 (1 × 15 ml) for 15 min. Finally, the solid was dried under high vacuum at RT for 2 days to give NP-CDP (0.746 g, 20.1% yield) as a yellow powder. 13C-MAS SS-NMR (400 MHz): δ 162.9, 143.3, 140.4, 135.1, 117.0, 99.0, 96.2, 94.1, 72.6 p.p.m. IR (solid, ATR) 3,327, 2,938, 2,239, 1,674, 1,610, 1,463, 1,370, 1,268, 1,150, 1,100, 1,030 cm−1. Analysis. Calculated for (C42H63O35)1•(C8F1.8N2)3.5•(H2O)13: C, 43.88; H, 4.68; F, 6.25; N, 5.12. Found: C, 43.78; H, 4.51; F, 6.31; N, 5.11.Epichlorohydrin β-cyclodextrin polymer (EPI-CDP). β-CD (0.300 g, 2.64 mmol) was dissolved in aqueous NaOH (6.25 N, 5.00 ml) at 60 °C. Epichlorohydrin (2.50 ml, 32.4 mmol) was added to this solution dropwise while stirring vigorously at 60 °C. The mixture turned into a yellow gel within 1 h, after which 10 ml of deionized H2O was added, and the mixture was filtered on a Büchner funnel. The solid was washed by soaking in deionized H2O (2 × 150 ml) for 15 min, THF (3 × 15 ml) for 30 min and CH2Cl2 (1 × 15 ml) for 15 min. The solid was finally dried under high vacuum for 2 d at RT to give EPI-CDP (3.11 g, 62% yield) as a white powder. 13C-MAS SS-NMR (400 MHz): δ 100.1, 72.0 p.p.m. IR (solid, ATR) 3,387, 2,923, 2,900, 1,702, 1,360, 1,030 cm−1. Analysis. Calculated for (C42H60O35)1•(C3H6O)10• (H2O)4.5: C, 48.40; H, 7.28. Found: C, 48.23; H, 7.09.FT-IR and solid-state 13C NMR characterization of P-CDP and NP-CDP. FTIR spectra of P-CDP and NP-CDP showed absorbances at 2,235 cm−1, correspond-ing to the nitrile stretch, as well as 1,670 cm−1 and 1,463 cm−1, corresponding to C–C aromatic stretches. C–F stretches, which resonate at 1,268 cm−1, are present in the spectra of both polymers and appear weaker compared to the spectrum of 1, as expected for partial F substitution. Finally, the IR spectra of P-CDP and NP-CDP exhibited O–H stretches near 3,330 cm−1, aliphatic C–H stretches around 2,930 cm−1, and an intense C–O stretch at 1,030 cm−1, which are spectral features of intact β-CD (Extended Data Fig. 2). Solid-state 13C NMR spectra of P-CDP and NP-CDP exhibited resonances associated with β-CD at δ = 72 and 100 p.p.m. (Extended Data Fig. 3). Peaks at δ = 95 and 140 ppm correspond to the newly formed alkoxy groups and aromatic carbons, respectively.Water regain analysis. P-CDP or NP-CDP (100 mg) were dispersed in deionized H2O (10 ml) for 1 h and then filtered using 11 μm Whatman filter paper. The solids were collected and blotted using additional Whatman filter paper, and weighed. The water regain (expressed as weight per cent) of each polymer was determined from the average of two measurements using the following equation:
=−
×w w
wWater regain 100w d
d
where ww (mg) and wd (mg) are the masses of the wet and dry polymer, respectively.Batch adsorption kinetic studies. Adsorption kinetic studies were performed in 20 ml scintillation vials equipped with magnetic stir bars. All studies were conducted at ambient temperature on a stirring hot plate adjusted to provide a 250 r.p.m. stirring rate.
In studies involving P-CDP and NP-CDP, the polymer (18 mg) was initially washed with H2O for 2–3 min and then filtered on 11 μm Whatman filter paper. The polymer was then transferred to a 20 ml scintillation vial and then a pollutant stock solution (18 ml) was added. The mixture was immediately stirred and 2 ml aliquots of the suspension were taken at certain intervals via syringe and filtered immediately by a Whatman 0.2 μm inorganic membrane filter. The residual con-centration of the pollutant in each sample was determined by UV–vis spectroscopy. In studies involving EPI-CDP, NAC, GAC and Brita AC, the adsorbent (6 mg) was added to a 20 ml scintillation vial and then a pollutant stock solution (6 ml) was added. The vial was stirred for a measured amount of time before the suspension was filtered using a Whatman 0.2 μm inorganic membrane filter.
The concentrations of pollutants in stock solutions as well as in the filtrates were characterized by UV–vis spectroscopy, based on calibration with their measured molar extinction coefficients (ε in units of M−1 cm−1), which were determined for bisphenol A (3,343 at λmax = 276 nm), bisphenol S (20,700 at λmax = 259 nm), 2-naphthol (4,639 at λmax = 273 nm), 1-naphthyl amine (5,185 at λmax = 305 nm), 2,4-dichlorophenol (2,255 at λmax = 284 nm), and metolachlor (213 at λmax = 15,330 nm) pollutants. ε values of ethinyl oestradiol (8,430 at
© 2016 Macmillan Publishers Limited. All rights reserved
LetterreSeArCH
λmax = 220 nm) and propranolol hydrochloride (5,310 at λmax = 290 nm) were reported elsewhere31,32.
The efficiency of pollutant removal (in %) by the sorbent was determined by the following equation:
=−
×C C
CPollutant removal efficiency 100t0
0
where C0 (mmol l−1) and Ct (mmol l−1) are the initial and residual concentration of pollutant in the stock solution and filtrate, respectively.
The amount of pollutant bound to the sorbent was determined by the following equation:
=( − )q C C M
mtt0 w
where qt (mg g−1) is amount of pollutant adsorbed per g of sorbent at time t (min). C0 (mmol l−1) and Ct (mmol l−1) are the initial and residual concentration of pol-lutant in the stock solution and filtrate, respectively. m (g) is the mass of sorbent used in the study. Mw (g mol−1) is the molar mass of the pollutant.
The uptake rate of each adsorbent was best described by Ho and McKay’s pseudo-second-order adsorption model33, shown in the following equation in a common linearized form:
= +tq
tq k q
1
t e obs e2
where qt and qe are the adsorbate uptakes (mg adsorbate per g polymer) at time t (min) and at equilibrium, respectively, and kobs is an apparent second-order rate constant (g mg−1 min−1).Flow-through adsorption experiments. Individual pollutants at high (mM) con-centrations. 3.0 mg of the adsorbent was stirred in 3 ml deionized H2O for 2–3 min, then the suspension was pushed by a syringe through a Whatman 0.2 μm inorganic membrane filter to form a thin layer of the adsorbent on the filter membrane. 3 ml of the pollutant stock solution was then pushed through the adsorbent over 20 s (8–9 ml min−1 flow rate). The filtrate was then measured by UV–vis spectroscopy to determine the pollutant removal efficiency.Mixture of pollutants at environmentally relevant (μg l−1) concentrations. 15 mg of the adsorbent (P-CDP or NAC) was added into a 20 ml vial and 5 ml nanopure water was added to prepare 3 g l−1 stock suspension. Then 0.1 ml of the suspension was pushed through a Whatman 0.2 μm inorganic membrane filter with a syringe to form a thin layer of the adsorbent on the membrane. 8 ml of the diluted mixture (100 μg l−1 bisphenol A, 2.5 μg l−1 BPS, 50 μg l−1 ethinyl oestradiol, 100 μg l−1 propranolol, 5 μg l−1 metolachlor, 5 μg l−1 1-Na, 25 μg l−1 2-NO, and 2.5 μg l−1 2,4-DCP) was then pushed through the adsorbent over approximately 20 s (25 ml min−1 flow rate). The experiments were conducted in duplicate/triplicate. The filtrate was then measured by HPLC-MS (Supplementary Table 2).
Thermodynamic studies of adsorption. 4.0 mg of sorbent was initially washed with 3 ml of deionized H2O for 2–3 min and then filtered on a Whatman filter paper. Then the solid was transferred to a 4 ml vial equipped with a stirring bar, and 2 ml (for 2 mg ml−1 studies) or 4 ml (for 1 mg ml−1 studies) of pollutant stock solution was added, and the suspension was stirred for 10 min to reach equilibrium. The suspension was then filtered on a Whatman 0.2 μm inorganic membrane filter, and the filtrate was measured by UV–vis spectroscopy.
A Langmuir adsorption isotherm34,35 was generated by plotting 1/qe versus 1/c in the following equation:
= +q q q Kc1 1 1
e max,e max,e
where qe (mg g−1) is the amount of pollutant adsorbed at equilibrium, qmax,e (mg g−1) is the maximum adsorption capacity of adsorbent at equilibrium, c (mol l−1) is the residual pollutant concentration at equilibrium, and K (mol−1) is the equilibrium constant.P-CDP regeneration experiments. 10 mg of P-CDP was initially soaked in 5 ml deionized H2O for 5 min, and then filtered on a Whatman filter paper. The polymer was then transferred to a 20 ml scintillation vial equipped with a magnetic stir bar, to which a bisphenol A stock solution (10 ml, 0.1 mM) was added. The mixture was stirred at RT for 10 min, and then filtered on a Whatman filter paper. The residual bisphenol A concentration in the filtrate was measured by UV–vis. P-CDP was regenerated by soaking in MeOH (10 ml) for 5 min and recovered by filtration. This adsorption/desorption cycle was performed five times to generate the plot shown in Fig. 2c. The MeOH washing filtrate from the first cycle was concentrated under vacuum, and the residual solid was dissolved in 10 ml deionized H2O and measured by UV–vis to determine the amount of recovered bisphenol A that was adsorbed on the polymer.
30. Huntscha, S., Singer, H. P., McArdell, C. S., Frank, C. E. & Hollender, J. Multiresidue analysis of 88 polar organic micropollutants in ground, surface and wastewater using online mixed-bed multilayer solid-phase extraction coupled to high performance liquid chromatography-tandem mass spectrometry. J. Chromatogr. A 1268, 74–83 (2012).
31. Bisby, R., Botchway, S., Crisostomo, A., Parker, A. & Scherer, K. Fluorescence lifetime imaging of propranolol uptake in living glial C6 cells. Spectrosc. Int. J. 27, 533–540 (2012).
32. O’Neil, M. J. (ed.) The Merck Index — An Encyclopedia of Chemicals, Drugs, and Biologicals (Merck and Co., 2006).
33. Ho, Y. S. & McKay, G. Pseudo-second order model for sorption processes. Process Biochem. 34, 451–465 (1999).
34. Liu, H., Cai, X., Wang, Y. & Chen, J. Adsorption mechanism-based screening of cyclodextrin polymers for adsorption and separation of pesticides from water. Water Res. 45, 3499–3511 (2011).
35. García-Zubiri, I. X., González-Gaitano, G. & Isasi, J. R. Sorption models in cyclodextrin polymers: Langmuir, Freundlich, and a dual-mode approach. J. Colloid Interface Sci. 337, 11–18 (2009).
© 2016 Macmillan Publishers Limited. All rights reserved
Letter reSeArCH
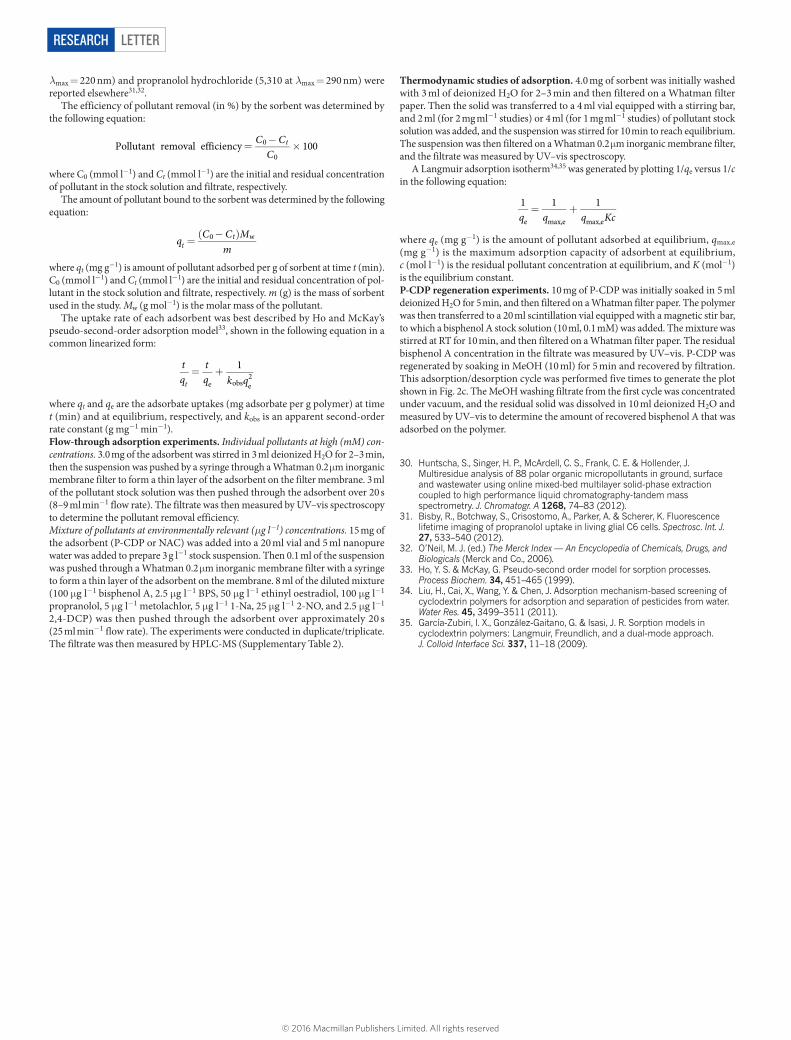
Extended Data Figure 1 | Porosity measurements of commercial ACs. These are the materials used in Fig. 2. Shown are the N2 sorption isotherm (77 K, left column) and the cumulative pore size distribution (right column) of Brita AC (a), GAC (b) and NAC (c). The cumulative pore size distributions of each adsorbent are similar to that of P-CDP (Fig. 1c).
© 2016 Macmillan Publishers Limited. All rights reserved
LetterreSeArCH
Extended Data Figure 2 | Infrared spectra of the cyclodextrin polymers and monomers. Spectra are labelled by chemical structure or compound name (top trace is 1, second trace down is β-CD). The FT-IR spectra shown in this figure of P-CDP and NP-CDP reflect the incorporation of β-CD and 1.
© 2016 Macmillan Publishers Limited. All rights reserved
Letter reSeArCH
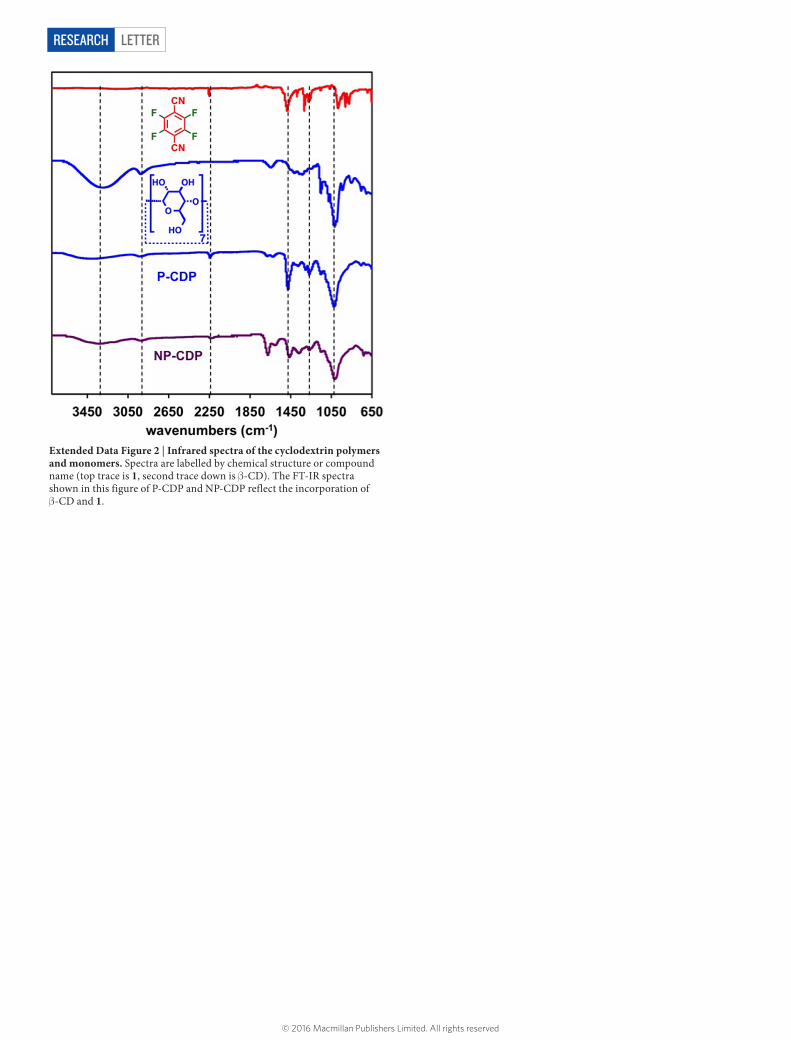
Extended Data Figure 3 | 13C CP-MAS solid-state NMR spectra of P-CDP, NP-CDP, β-CD and 1. The spectra of P-CDP and NP-CDP exhibit resonances associated with β-CD at δ = 72 and 100 p.p.m. (labelled a and b, respectively). Resonances at δ = 95 and 140 p.p.m. (labelled e and c) correspond to the newly formed alkoxy groups and aromatic carbons, respectively. The spectrum of 1 is broadened because of 19F–13C coupling.
© 2016 Macmillan Publishers Limited. All rights reserved
LetterreSeArCH
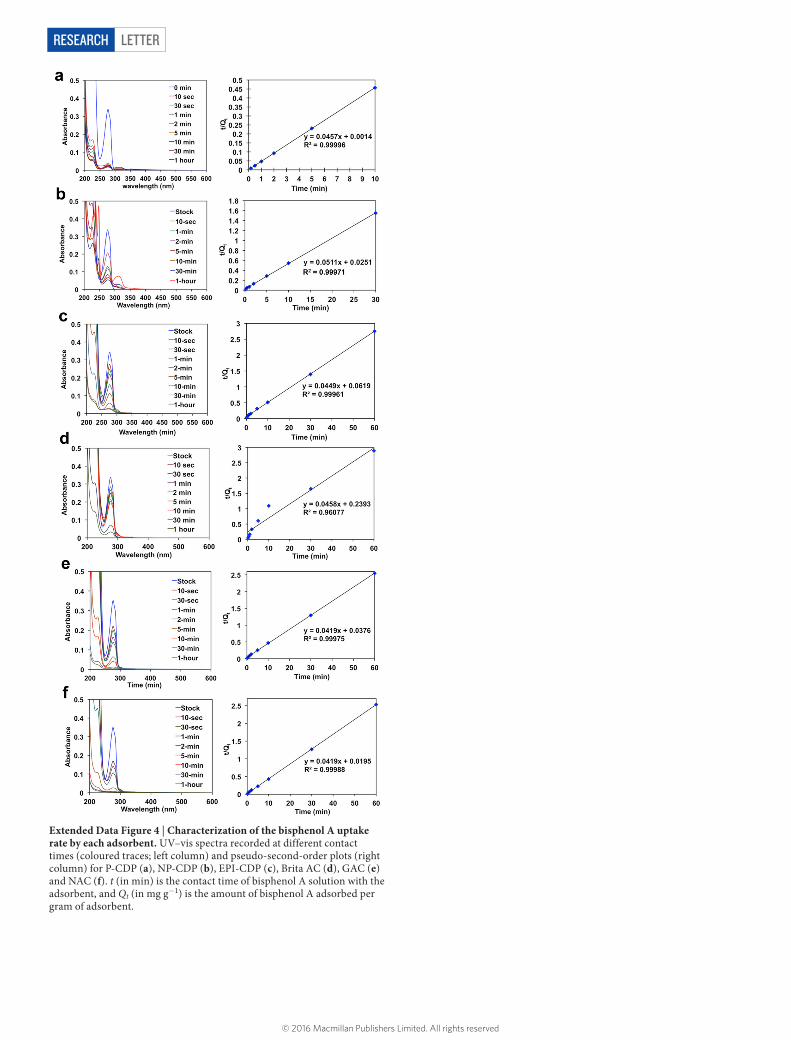
Extended Data Figure 4 | Characterization of the bisphenol A uptake rate by each adsorbent. UV–vis spectra recorded at different contact times (coloured traces; left column) and pseudo-second-order plots (right column) for P-CDP (a), NP-CDP (b), EPI-CDP (c), Brita AC (d), GAC (e) and NAC (f). t (in min) is the contact time of bisphenol A solution with the adsorbent, and Qt (in mg g−1) is the amount of bisphenol A adsorbed per gram of adsorbent.
© 2016 Macmillan Publishers Limited. All rights reserved
Letter reSeArCH
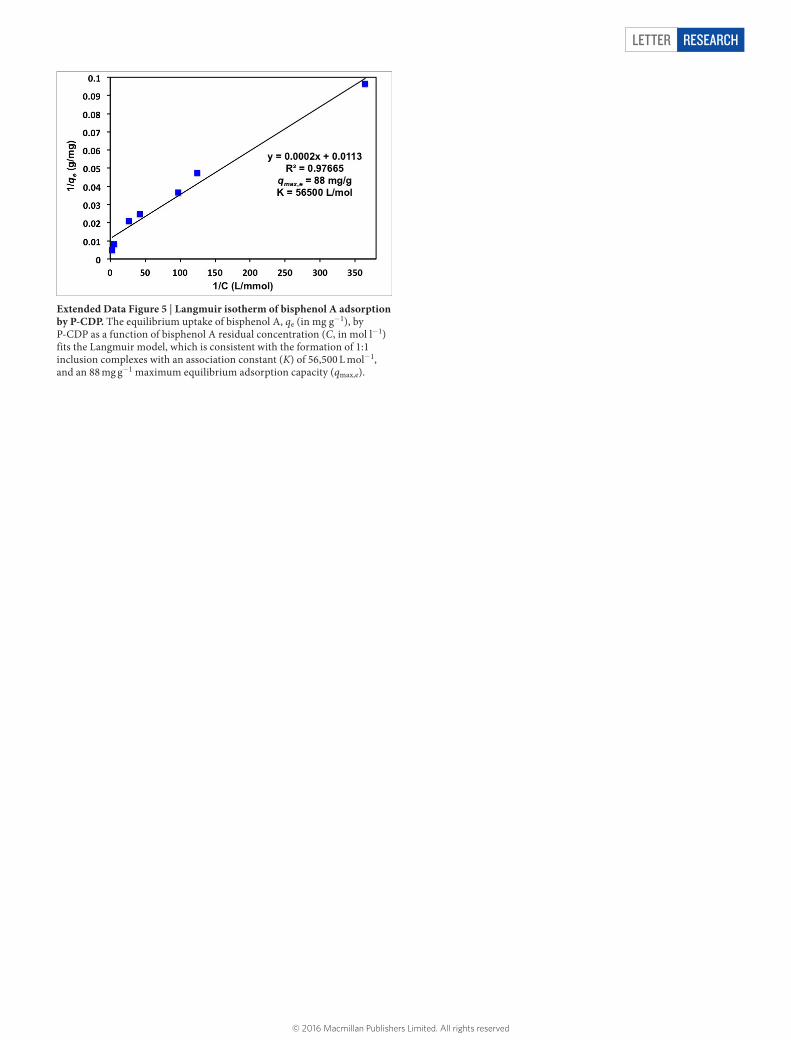
Extended Data Figure 5 | Langmuir isotherm of bisphenol A adsorption by P-CDP. The equilibrium uptake of bisphenol A, qe (in mg g−1), by P-CDP as a function of bisphenol A residual concentration (C, in mol l−1) fits the Langmuir model, which is consistent with the formation of 1:1 inclusion complexes with an association constant (K) of 56,500 L mol−1, and an 88 mg g−1 maximum equilibrium adsorption capacity (qmax,e).
© 2016 Macmillan Publishers Limited. All rights reserved
LetterreSeArCH
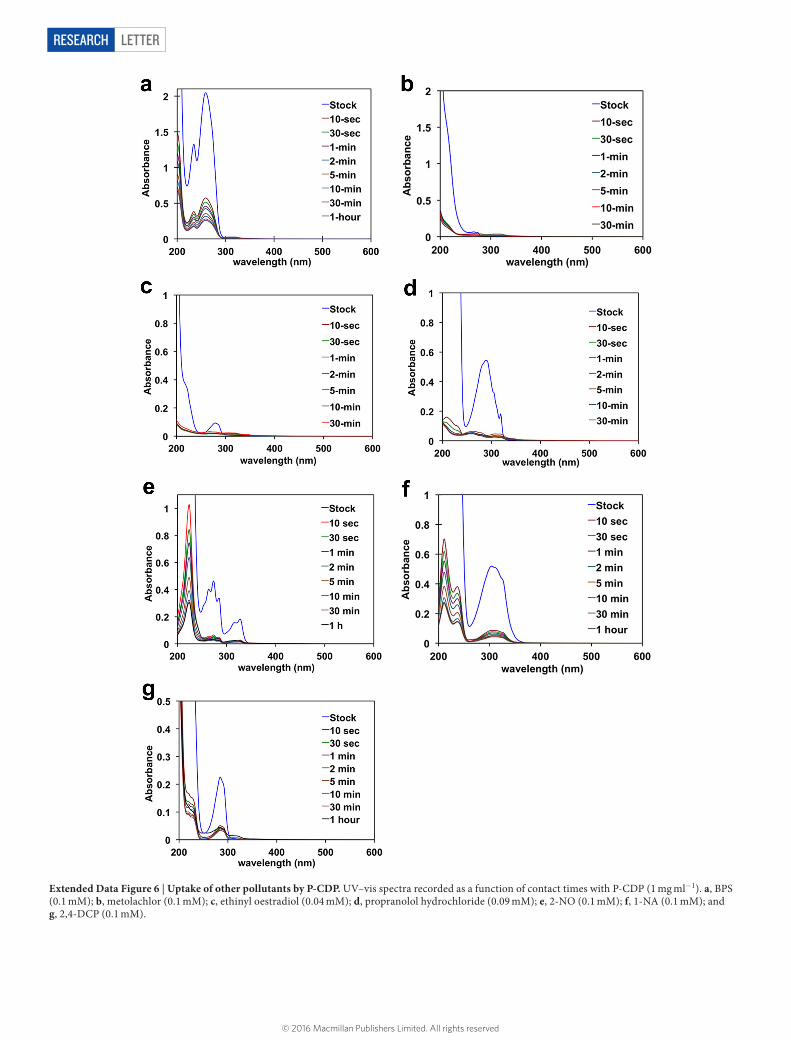
Extended Data Figure 6 | Uptake of other pollutants by P-CDP. UV–vis spectra recorded as a function of contact times with P-CDP (1 mg ml−1). a, BPS (0.1 mM); b, metolachlor (0.1 mM); c, ethinyl oestradiol (0.04 mM); d, propranolol hydrochloride (0.09 mM); e, 2-NO (0.1 mM); f, 1-NA (0.1 mM); and g, 2,4-DCP (0.1 mM).
© 2016 Macmillan Publishers Limited. All rights reserved
Letter reSeArCH
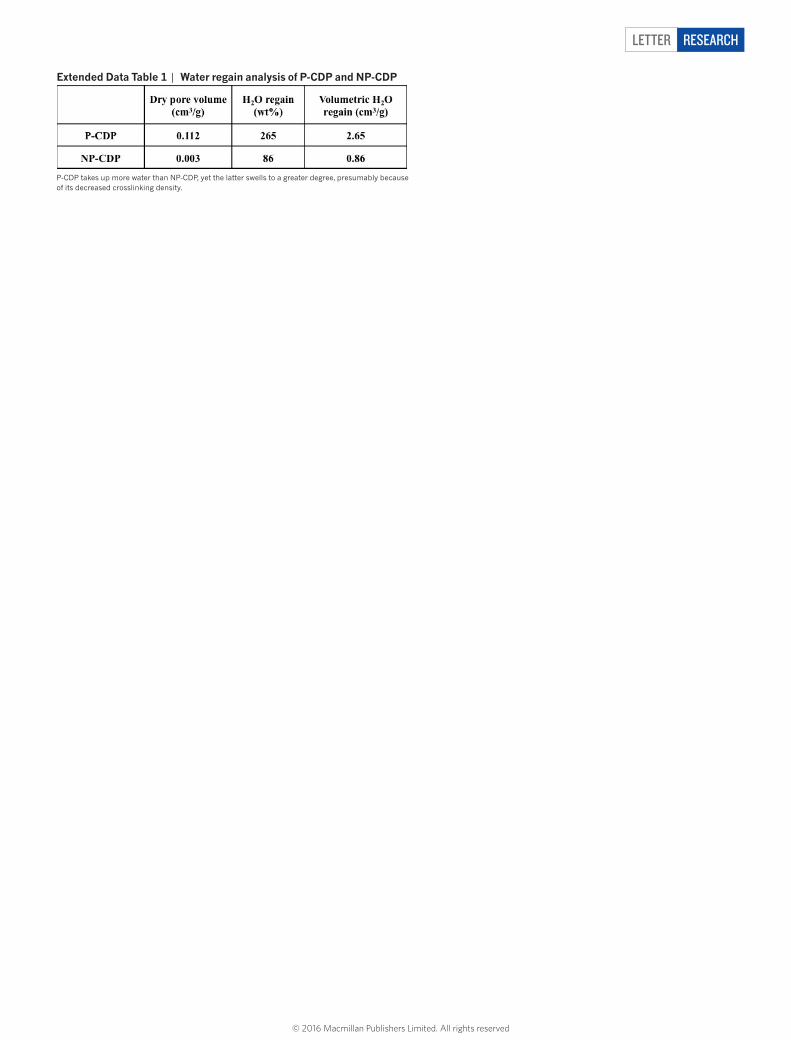
extended Data table 1 | Water regain analysis of P-CDP and NP-CDP
P-CDP takes up more water than NP-CDP, yet the latter swells to a greater degree, presumably because of its decreased crosslinking density.
© 2016 Macmillan Publishers Limited. All rights reserved
LetterreSeArCH
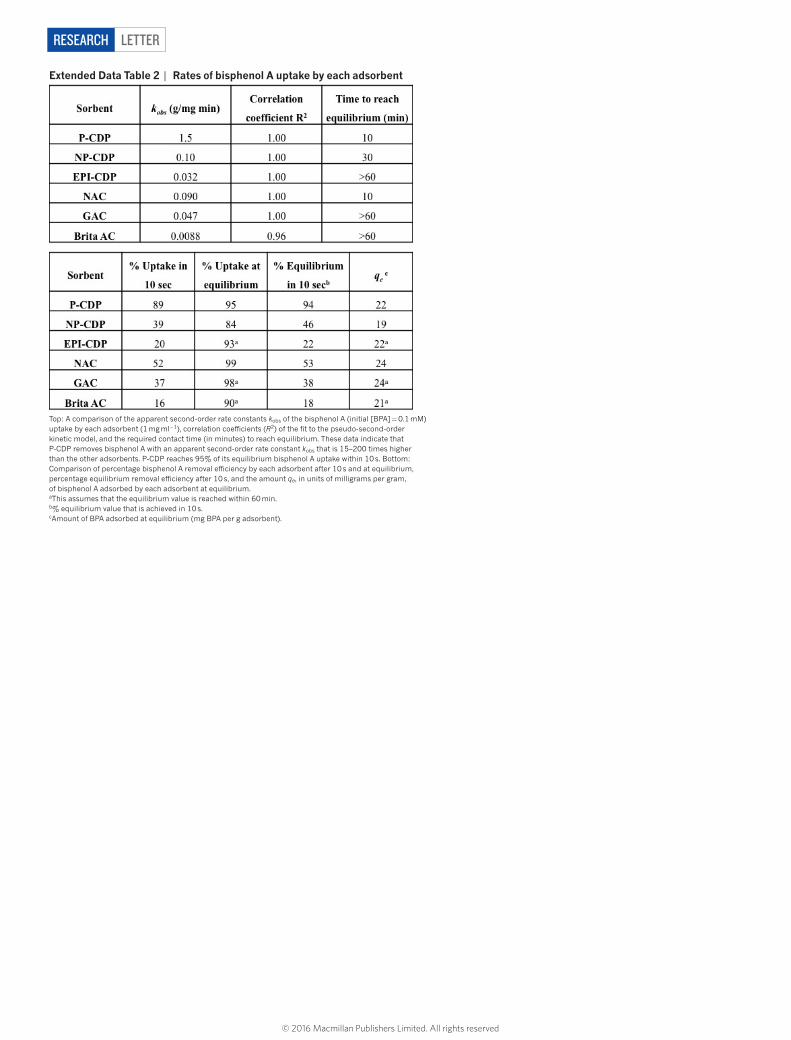
extended Data table 2 | rates of bisphenol A uptake by each adsorbent
Top: A comparison of the apparent second-order rate constants kobs of the bisphenol A (initial [BPA] = 0.1 mM) uptake by each adsorbent (1 mg ml−1), correlation coefficients (R2) of the fit to the pseudo-second-order kinetic model, and the required contact time (in minutes) to reach equilibrium. These data indicate that P-CDP removes bisphenol A with an apparent second-order rate constant kobs that is 15–200 times higher than the other adsorbents. P-CDP reaches 95% of its equilibrium bisphenol A uptake within 10 s. Bottom: Comparison of percentage bisphenol A removal efficiency by each adsorbent after 10 s and at equilibrium, percentage equilibrium removal efficiency after 10 s, and the amount qe, in units of milligrams per gram, of bisphenol A adsorbed by each adsorbent at equilibrium.aThis assumes that the equilibrium value is reached within 60 min.b% equilibrium value that is achieved in 10 s.cAmount of BPA adsorbed at equilibrium (mg BPA per g adsorbent).
© 2016 Macmillan Publishers Limited. All rights reserved
Letter reSeArCH
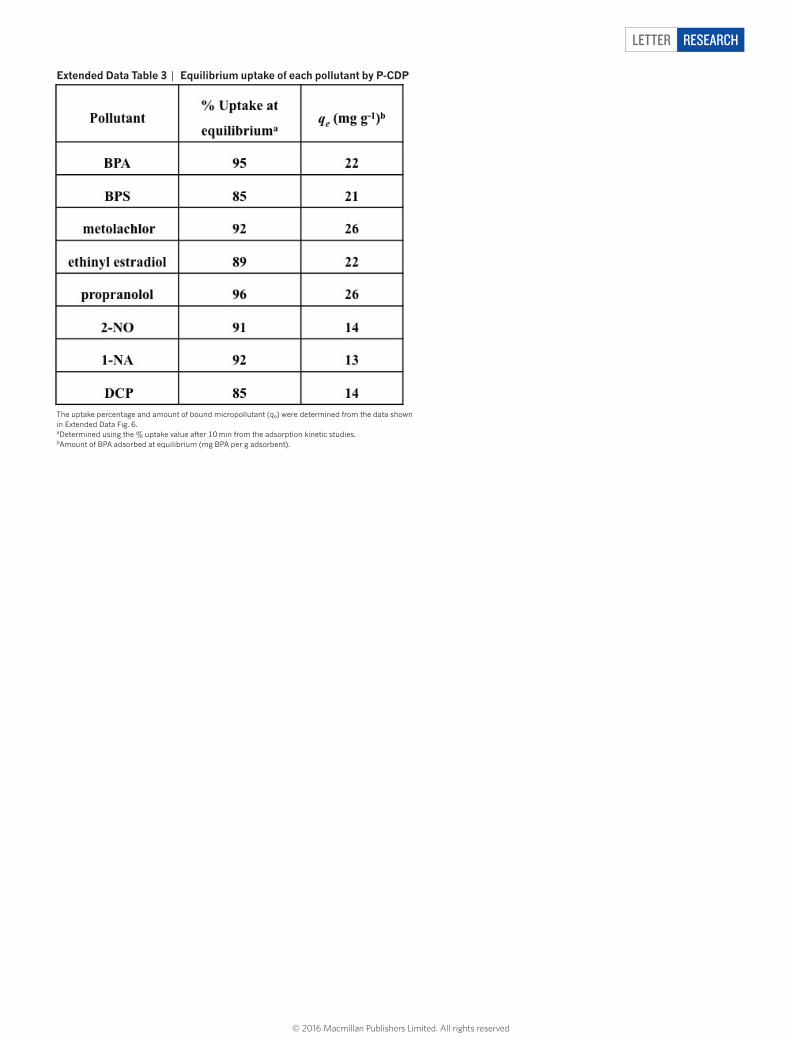
extended Data table 3 | equilibrium uptake of each pollutant by P-CDP
The uptake percentage and amount of bound micropollutant (qe) were determined from the data shown in Extended Data Fig. 6.aDetermined using the % uptake value after 10 min from the adsorption kinetic studies.bAmount of BPA adsorbed at equilibrium (mg BPA per g adsorbent).
© 2016 Macmillan Publishers Limited. All rights reserved
LetterreSeArCH
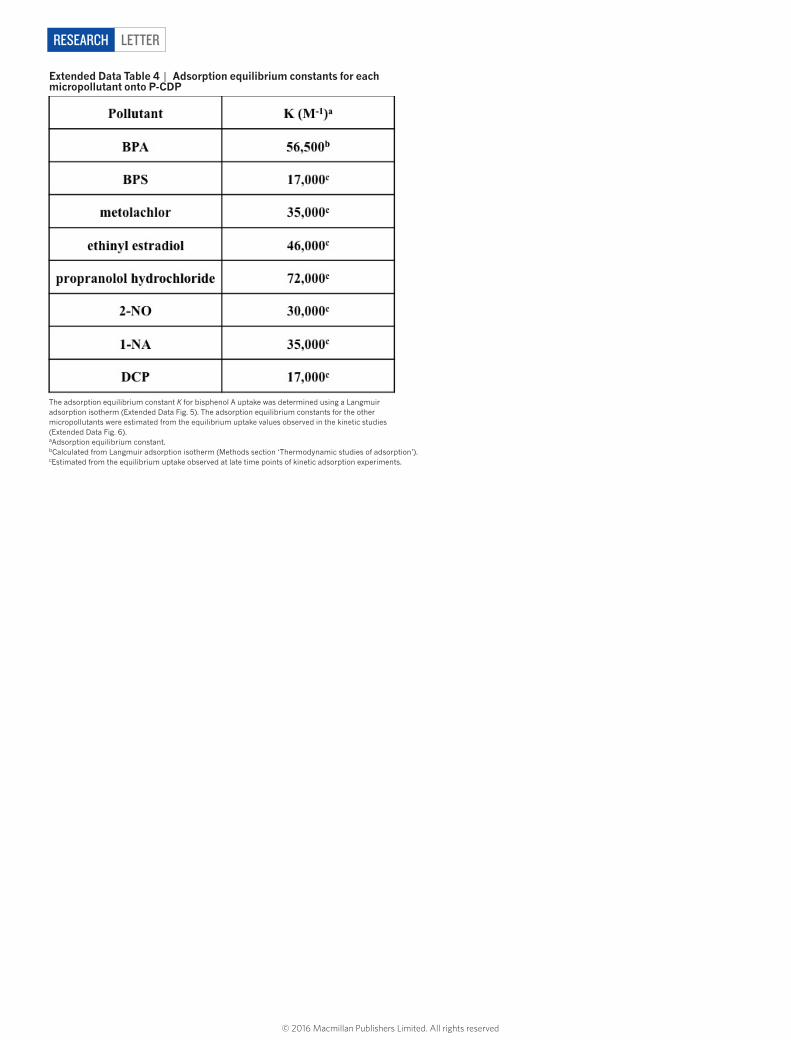
extended Data table 4 | Adsorption equilibrium constants for each micropollutant onto P-CDP
The adsorption equilibrium constant K for bisphenol A uptake was determined using a Langmuir adsorption isotherm (Extended Data Fig. 5). The adsorption equilibrium constants for the other micropollutants were estimated from the equilibrium uptake values observed in the kinetic studies (Extended Data Fig. 6).aAdsorption equilibrium constant.bCalculated from Langmuir adsorption isotherm (Methods section ‘Thermodynamic studies of adsorption’).cEstimated from the equilibrium uptake observed at late time points of kinetic adsorption experiments.
© 2016 Macmillan Publishers Limited. All rights reserved