Removal of pollutants from freshwater using foam ...
6
Abstract—In this study, biocomposite materials have been synthesized and used in freshwater treatment. Total solids (TS) such as silt, clay, organic matter, organic compounds and dissolved inorganics were measured in terms of turbidity. Ground natural fibers with particles size < 300 μm including coconut coir; palm leaves, rice and wheat straw were sieved and mixed with foamed polyurethane. The removal efficiency of total solids using foamed polyurethane biocomposites was compared with commercial activated carbon. Significant removal of total solids was observed using PU- biocomposite. Removal efficiency has been obtained up to 80 % using PU- ground rice straw. PU-palm leaves, PU-wheat straw and PU-coconut coir biocomposites showed 67%, 64% and 68% total solids removal respectively. Experiments were conducted in a vertical Plexiglas cylindrical packed column filled with hollow spherical PU-biocomposites with 5mm diameter. Langmuir and Freundlich adsorption isotherm equilibrium models were applied and evaluated. Surface morphology of biocomposites was investigated using scanning electron microscope. Keywords— Bio-composites; fresh water; bioadsorbent; foam I. INTRODUCTION ollutants are transported and transformed in water, atmospheric air and sites (soil). Water, air and soil are named as environmental impellers and connected to each other by to the global water cycle. Water treatment can be classified in to main three groups (i) Mechanical (ii) Biological and (iii) physical /chemical processes as illustrated in figure 1. M. Bassyouni, Dept. of Chemical and Materials Eng., King Abdulaziz University, Rabigh, Saudi Arabia; Dept. of Chemical Eng., Higher Technological Institute, Tenth of Ramadan City, Egypt. (Corresponding author’s phone: 00966597890121;e-mail:[email protected] ). Mohamed Abdel-Aziz, Dept. of Chemical and Materials Eng., King Abdulaziz University, Rabigh, Saudi Arabia; Chemical Engineering Department, Faculty of Engineering, Alexandria University, Alexandria, Egypt(e-mail:[email protected]). Saud Gutub, Department of Civil Engineering, King bdulaziz University, Saudi Arabia. (e-mail: [email protected]). Mohamed F. Soliman, Faculty of Engineering, King Abdulaziz University, Rabigh 21911, Kingdom of Saudi Arabia (KSA), Civil Eng. Dept., Aswan Univ., Egypt. Shereen Abdel-Hamid, Department of Chemical Engineering, Higher Technological Institute, Tenth of Ramadan City, Egypt (e-mail: [email protected]) Process selection depends on the type of pollutants have to be removed. Settleable (undissolved) solids can be removed by mechanical process. Dissolved solids can be removed by biological or physical/chemical processes. Biological process can be carried out if the pollutants are biodegradable. Physical/chemical process can be applied to remove the non- biodegradable matters where are found in industrial wastewater and ground water. Adsorption process is one of the most effective techniques can be applied to remove non- biodegradable matters. Adsorption process can be taken place by physisorption or chemisorption process. Adsorbate is attached to the adsorbent physically by Van der Waals forces. The chemisorption can be achieved by chemical bond with the molecules of the adsorbent. Adsorption processes based on physisorption can usually be reversed. Mass transfer of the adsorbate includes mainly four stages (i) convection, (ii) film diffusion (iii) grain diffusion and then (iv) Attachment by physical or chemical bonding. Kinetics of adsorption can be controlled mainly by film diffusion and grain diffusion [1-4]. Adsorbent has an outer and inner surface. The inner surface represents the overall surface of all pores. Pore size and structure play a crucial role in the adsorption capacity. PU- biocomposites have different applications [5-7]. Recently, considerable efforts have been made for agricultural waste recycle [8-9]. In this study, a closed system was used. Foam polyurethane biocomposites (PU-Biocomposites) were used as adsorbent. The pollutants (adsorbate) concentrations decrease in water with respect to time. While the loading PU- biocomposites increases [10-15]. Mass of pollutants (adsorbate) “m 1 ” removed from water at a given level at time “t” as given in equation 1: (Eq. 1) Where V w : volume of water sample (L); c o : Initial concentration of the adsorbate (mg/l); and c(t):adsorbate concentration (mg/l) with respect to time (t). The common adsorption isotherm methods are Freundlich, Langmuir and Redlich-Peterson as tabulated in table 1[16-20]. In this study, data fitting was carried out with respect to Freundlich, and Langmuir-2. M. Bassyouni, M. H. Abdel-Aziz, Saud Gutub, Mohamed Soliman and S.M.-S. Abdel-Hamid Removal of pollutants from freshwater using foam biocomposites in a fixed bed packed column: Adsorption and kinetic study P International Conference on Chemical, Environmental and Biological Sciences (CEBS-2015) March 18-19, 2015 Dubai (UAE) http://dx.doi.org/10.15242/IICBE.C0315097 77
Transcript of Removal of pollutants from freshwater using foam ...
Abstract—In this study, biocomposite materials have been
synthesized and used in freshwater treatment. Total solids (TS) such
as silt, clay, organic matter, organic compounds and dissolved
inorganics were measured in terms of turbidity. Ground natural fibers
with particles size < 300 μm including coconut coir; palm leaves, rice
and wheat straw were sieved and mixed with foamed polyurethane.
The removal efficiency of total solids using foamed polyurethane
biocomposites was compared with commercial activated carbon.
Significant removal of total solids was observed using PU-
biocomposite. Removal efficiency has been obtained up to 80 %
using PU- ground rice straw. PU-palm leaves, PU-wheat straw and
PU-coconut coir biocomposites showed 67%, 64% and 68% total
solids removal respectively. Experiments were conducted in a
vertical Plexiglas cylindrical packed column filled with hollow
spherical PU-biocomposites with 5mm diameter. Langmuir and
Freundlich adsorption isotherm equilibrium models were applied and
evaluated. Surface morphology of biocomposites was investigated
using scanning electron microscope.
Keywords— Bio-composites; fresh water; bioadsorbent; foam
I. INTRODUCTION
ollutants are transported and transformed in water,
atmospheric air and sites (soil). Water, air and soil are
named as environmental impellers and connected to each other
by to the global water cycle. Water treatment can be classified
in to main three groups (i) Mechanical (ii) Biological and (iii)
physical /chemical processes as illustrated in figure 1.
M. Bassyouni, Dept. of Chemical and Materials Eng., King Abdulaziz
University, Rabigh, Saudi Arabia; Dept. of Chemical Eng., Higher Technological Institute, Tenth of Ramadan City, Egypt. (Corresponding
author’s phone: 00966597890121;e-mail:[email protected] ).
Mohamed Abdel-Aziz, Dept. of Chemical and Materials Eng., King Abdulaziz University, Rabigh, Saudi Arabia; Chemical Engineering
Department, Faculty of Engineering, Alexandria University, Alexandria,
Egypt(e-mail:[email protected]). Saud Gutub, Department of Civil Engineering, King bdulaziz University,
Saudi Arabia. (e-mail: [email protected]). Mohamed F. Soliman, Faculty of Engineering, King Abdulaziz
University, Rabigh 21911, Kingdom of Saudi Arabia (KSA), Civil Eng. Dept.,
Aswan Univ., Egypt. Shereen Abdel-Hamid, Department of Chemical Engineering, Higher
Technological Institute, Tenth of Ramadan City, Egypt (e-mail:
Process selection depends on the type of pollutants have to be
removed. Settleable (undissolved) solids can be removed by
mechanical process. Dissolved solids can be removed by
biological or physical/chemical processes. Biological process
can be carried out if the pollutants are biodegradable.
Physical/chemical process can be applied to remove the non-
biodegradable matters where are found in industrial
wastewater and ground water. Adsorption process is one of the
most effective techniques can be applied to remove non-
biodegradable matters. Adsorption process can be taken place
by physisorption or chemisorption process. Adsorbate is
attached to the adsorbent physically by Van der Waals forces.
The chemisorption can be achieved by chemical bond with the
molecules of the adsorbent. Adsorption processes based on
physisorption can usually be reversed. Mass transfer of the
adsorbate includes mainly four stages (i) convection, (ii) film
diffusion (iii) grain diffusion and then (iv) Attachment by
physical or chemical bonding. Kinetics of adsorption can be
controlled mainly by film diffusion and grain diffusion [1-4].
Adsorbent has an outer and inner surface. The inner surface
represents the overall surface of all pores. Pore size and
structure play a crucial role in the adsorption capacity. PU-
biocomposites have different applications [5-7]. Recently,
considerable efforts have been made for agricultural waste
recycle [8-9]. In this study, a closed system was used. Foam
polyurethane biocomposites (PU-Biocomposites) were used as
adsorbent. The pollutants (adsorbate) concentrations decrease
in water with respect to time. While the loading PU-
biocomposites increases [10-15]. Mass of pollutants
(adsorbate) “m1” removed from water at a given level at time
“t” as given in equation 1:
(Eq. 1)
Where Vw: volume of water sample (L); co: Initial
concentration of the adsorbate (mg/l); and c(t):adsorbate
concentration (mg/l) with respect to time (t).
The common adsorption isotherm methods are Freundlich,
Langmuir and Redlich-Peterson as tabulated in table 1[16-20].
In this study, data fitting was carried out with respect to
Freundlich, and Langmuir-2.
M. Bassyouni, M. H. Abdel-Aziz, Saud Gutub, Mohamed Soliman and S.M.-S. Abdel-Hamid
Removal of pollutants from freshwater using
foam biocomposites in a fixed bed packed
column: Adsorption and kinetic study
P
International Conference on Chemical, Environmental and Biological Sciences (CEBS-2015) March 18-19, 2015 Dubai (UAE)
http://dx.doi.org/10.15242/IICBE.C0315097 77
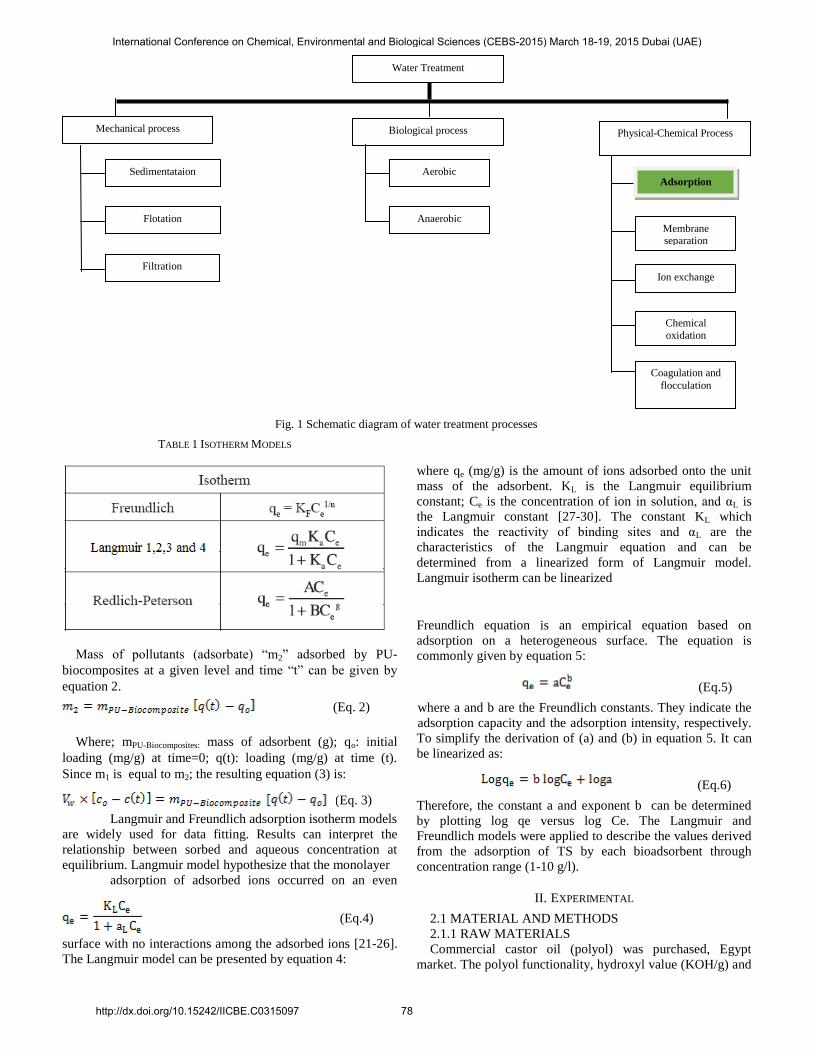
TABLE 1 ISOTHERM MODELS
Mass of pollutants (adsorbate) “m2” adsorbed by PU-
biocomposites at a given level and time “t” can be given by
equation 2.
Where; mPU-Biocomposites: mass of adsorbent (g); qo: initial
loading (mg/g) at time=0; q(t): loading (mg/g) at time (t).
Since m1 is equal to m2; the resulting equation (3) is:
Langmuir and Freundlich adsorption isotherm models
are widely used for data fitting. Results can interpret the
relationship between sorbed and aqueous concentration at
equilibrium. Langmuir model hypothesize that the monolayer
adsorption of adsorbed ions occurred on an even
surface with no interactions among the adsorbed ions [21-26].
The Langmuir model can be presented by equation 4:
where qe (mg/g) is the amount of ions adsorbed onto the unit
mass of the adsorbent. KL is the Langmuir equilibrium
constant; Ce is the concentration of ion in solution, and αL is
the Langmuir constant [27-30]. The constant KL which
indicates the reactivity of binding sites and αL are the
characteristics of the Langmuir equation and can be
determined from a linearized form of Langmuir model.
Langmuir isotherm can be linearized
Freundlich equation is an empirical equation based on
adsorption on a heterogeneous surface. The equation is
commonly given by equation 5:
(Eq.5)
where a and b are the Freundlich constants. They indicate the
adsorption capacity and the adsorption intensity, respectively.
To simplify the derivation of (a) and (b) in equation 5. It can
be linearized as:
(Eq.6)
Therefore, the constant a and exponent b can be determined
by plotting log qe versus log Ce. The Langmuir and
Freundlich models were applied to describe the values derived
from the adsorption of TS by each bioadsorbent through
concentration range (1-10 g/l).
II. EXPERIMENTAL
2.1 MATERIAL AND METHODS
2.1.1 RAW MATERIALS
Commercial castor oil (polyol) was purchased, Egypt
market. The polyol functionality, hydroxyl value (KOH/g) and
(Eq. 2)
(Eq. 3)
(Eq.4)
Fig. 1 Schematic diagram of water treatment processes
Water Treatment
Mechanical process Physical-Chemical Process Biological process
Sedimentataion Aerobic Adsorption
Flotation Anaerobic Membrane separation
Filtration Ion exchange
Coagulation and
flocculation
Chemical
oxidation
International Conference on Chemical, Environmental and Biological Sciences (CEBS-2015) March 18-19, 2015 Dubai (UAE)
http://dx.doi.org/10.15242/IICBE.C0315097 78
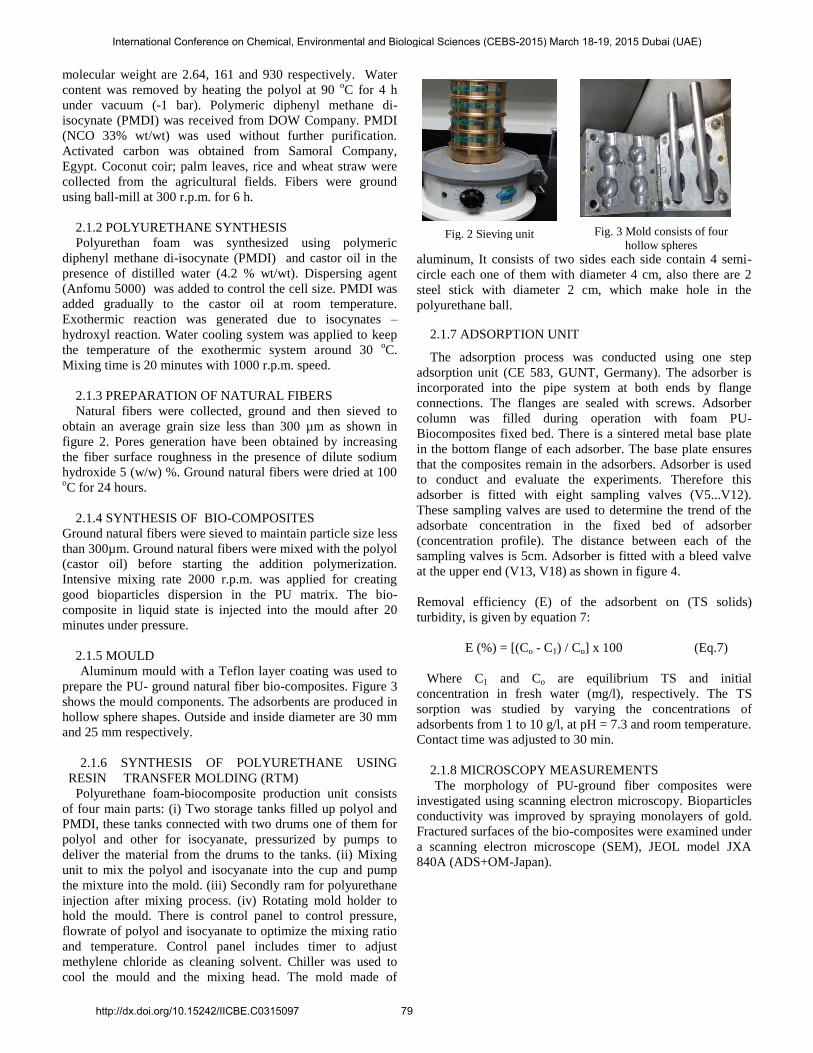
Fig. 2 Sieving unit Fig. 3 Mold consists of four
hollow spheres
molecular weight are 2.64, 161 and 930 respectively. Water
content was removed by heating the polyol at 90 oC for 4 h
under vacuum (-1 bar). Polymeric diphenyl methane di-
isocynate (PMDI) was received from DOW Company. PMDI
(NCO 33% wt/wt) was used without further purification.
Activated carbon was obtained from Samoral Company,
Egypt. Coconut coir; palm leaves, rice and wheat straw were
collected from the agricultural fields. Fibers were ground
using ball-mill at 300 r.p.m. for 6 h.
2.1.2 POLYURETHANE SYNTHESIS
Polyurethan foam was synthesized using polymeric
diphenyl methane di-isocynate (PMDI) and castor oil in the
presence of distilled water (4.2 % wt/wt). Dispersing agent
(Anfomu 5000) was added to control the cell size. PMDI was
added gradually to the castor oil at room temperature.
Exothermic reaction was generated due to isocynates –
hydroxyl reaction. Water cooling system was applied to keep
the temperature of the exothermic system around 30 oC.
Mixing time is 20 minutes with 1000 r.p.m. speed.
2.1.3 PREPARATION OF NATURAL FIBERS
Natural fibers were collected, ground and then sieved to
obtain an average grain size less than 300 µm as shown in
figure 2. Pores generation have been obtained by increasing
the fiber surface roughness in the presence of dilute sodium
hydroxide 5 (w/w) %. Ground natural fibers were dried at 100 oC for 24 hours.
2.1.4 SYNTHESIS OF BIO-COMPOSITES
Ground natural fibers were sieved to maintain particle size less
than 300µm. Ground natural fibers were mixed with the polyol
(castor oil) before starting the addition polymerization.
Intensive mixing rate 2000 r.p.m. was applied for creating
good bioparticles dispersion in the PU matrix. The bio-
composite in liquid state is injected into the mould after 20
minutes under pressure.
2.1.5 MOULD
Aluminum mould with a Teflon layer coating was used to
prepare the PU- ground natural fiber bio-composites. Figure 3
shows the mould components. The adsorbents are produced in
hollow sphere shapes. Outside and inside diameter are 30 mm
and 25 mm respectively.
2.1.6 SYNTHESIS OF POLYURETHANE USING
RESIN TRANSFER MOLDING (RTM)
Polyurethane foam-biocomposite production unit consists
of four main parts: (i) Two storage tanks filled up polyol and
PMDI, these tanks connected with two drums one of them for
polyol and other for isocyanate, pressurized by pumps to
deliver the material from the drums to the tanks. (ii) Mixing
unit to mix the polyol and isocyanate into the cup and pump
the mixture into the mold. (iii) Secondly ram for polyurethane
injection after mixing process. (iv) Rotating mold holder to
hold the mould. There is control panel to control pressure,
flowrate of polyol and isocyanate to optimize the mixing ratio
and temperature. Control panel includes timer to adjust
methylene chloride as cleaning solvent. Chiller was used to
cool the mould and the mixing head. The mold made of
aluminum, It consists of two sides each side contain 4 semi-
circle each one of them with diameter 4 cm, also there are 2
steel stick with diameter 2 cm, which make hole in the
polyurethane ball.
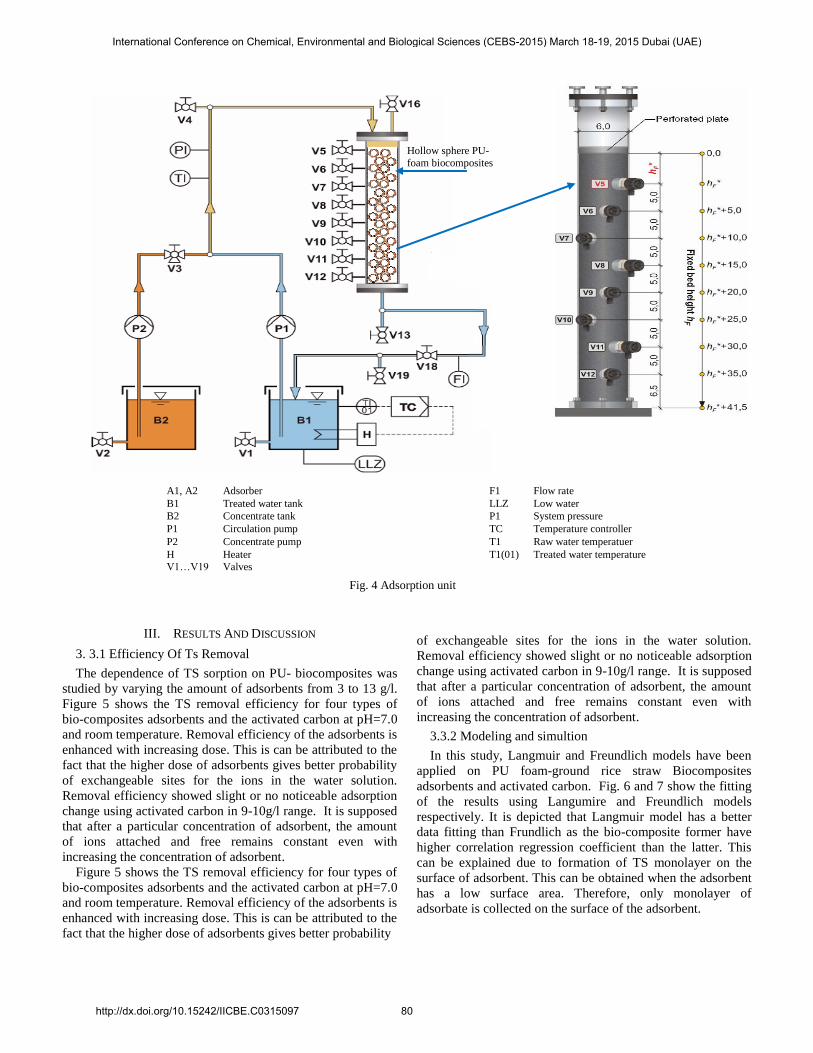
2.1.7 ADSORPTION UNIT
The adsorption process was conducted using one step
adsorption unit (CE 583, GUNT, Germany). The adsorber is
incorporated into the pipe system at both ends by flange
connections. The flanges are sealed with screws. Adsorber
column was filled during operation with foam PU-
Biocomposites fixed bed. There is a sintered metal base plate
in the bottom flange of each adsorber. The base plate ensures
that the composites remain in the adsorbers. Adsorber is used
to conduct and evaluate the experiments. Therefore this
adsorber is fitted with eight sampling valves (V5...V12).
These sampling valves are used to determine the trend of the
adsorbate concentration in the fixed bed of adsorber
(concentration profile). The distance between each of the
sampling valves is 5cm. Adsorber is fitted with a bleed valve
at the upper end (V13, V18) as shown in figure 4.
Removal efficiency (E) of the adsorbent on (TS solids)
turbidity, is given by equation 7:
E (%) = [(Co - C1) / Co] x 100 (Eq.7)
Where C1 and Co are equilibrium TS and initial
concentration in fresh water (mg/l), respectively. The TS
sorption was studied by varying the concentrations of
adsorbents from 1 to 10 g/l, at pH = 7.3 and room temperature.
Contact time was adjusted to 30 min.
2.1.8 MICROSCOPY MEASUREMENTS
The morphology of PU-ground fiber composites were
investigated using scanning electron microscopy. Bioparticles
conductivity was improved by spraying monolayers of gold.
Fractured surfaces of the bio-composites were examined under
a scanning electron microscope (SEM), JEOL model JXA
840A (ADS+OM-Japan).
International Conference on Chemical, Environmental and Biological Sciences (CEBS-2015) March 18-19, 2015 Dubai (UAE)
http://dx.doi.org/10.15242/IICBE.C0315097 79
III. RESULTS AND DISCUSSION
3. 3.1 Efficiency Of Ts Removal
The dependence of TS sorption on PU- biocomposites was
studied by varying the amount of adsorbents from 3 to 13 g/l.
Figure 5 shows the TS removal efficiency for four types of
bio-composites adsorbents and the activated carbon at pH=7.0
and room temperature. Removal efficiency of the adsorbents is
enhanced with increasing dose. This is can be attributed to the
fact that the higher dose of adsorbents gives better probability
of exchangeable sites for the ions in the water solution.
Removal efficiency showed slight or no noticeable adsorption
change using activated carbon in 9-10g/l range. It is supposed
that after a particular concentration of adsorbent, the amount
of ions attached and free remains constant even with
increasing the concentration of adsorbent.
3.3.2 Modeling and simultion
In this study, Langmuir and Freundlich models have been
applied on PU foam-ground rice straw Biocomposites
adsorbents and activated carbon. Fig. 6 and 7 show the fitting
of the results using Langumire and Freundlich models
respectively. It is depicted that Langmuir model has a better
data fitting than Frundlich as the bio-composite former have
higher correlation regression coefficient than the latter. This
can be explained due to formation of TS monolayer on the
surface of adsorbent. This can be obtained when the adsorbent
has a low surface area. Therefore, only monolayer of
adsorbate is collected on the surface of the adsorbent.
A1, A2 Adsorber F1 Flow rate
B1 Treated water tank LLZ Low water
B2 Concentrate tank P1 System pressure
P1 Circulation pump TC Temperature controller
P2 Concentrate pump T1 Raw water temperatuer
H Heater T1(01) Treated water temperature
V1…V19 Valves
Fig. 4 Adsorption unit
Hollow sphere PU-
foam biocomposites
International Conference on Chemical, Environmental and Biological Sciences (CEBS-2015) March 18-19, 2015 Dubai (UAE)
http://dx.doi.org/10.15242/IICBE.C0315097 80
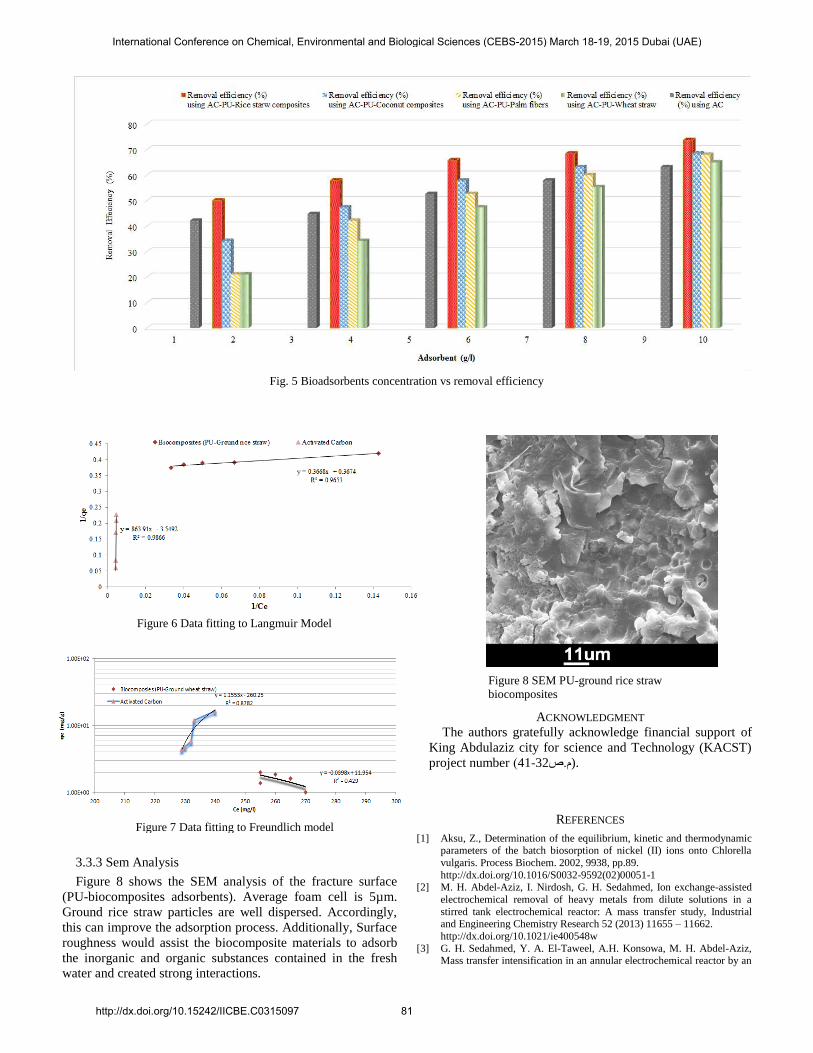
Fig. 5 Bioadsorbents concentration vs removal efficiency
Figure 6 Data fitting to Langmuir Model
Figure 7 Data fitting to Freundlich model
Figure 8 SEM PU-ground rice straw
biocomposites
3.3.3 Sem Analysis
Figure 8 shows the SEM analysis of the fracture surface
(PU-biocomposites adsorbents). Average foam cell is 5µm.
Ground rice straw particles are well dispersed. Accordingly,
this can improve the adsorption process. Additionally, Surface
roughness would assist the biocomposite materials to adsorb
the inorganic and organic substances contained in the fresh
water and created strong interactions.
ACKNOWLEDGMENT
The authors gratefully acknowledge financial support of
King Abdulaziz city for science and Technology (KACST)
project number )41-32م.ص).
REFERENCES
[1] Aksu, Z., Determination of the equilibrium, kinetic and thermodynamic parameters of the batch biosorption of nickel (II) ions onto Chlorella
vulgaris. Process Biochem. 2002, 9938, pp.89.
http://dx.doi.org/10.1016/S0032-9592(02)00051-1 [2] M. H. Abdel-Aziz, I. Nirdosh, G. H. Sedahmed, Ion exchange-assisted
electrochemical removal of heavy metals from dilute solutions in a
stirred tank electrochemical reactor: A mass transfer study, Industrial and Engineering Chemistry Research 52 (2013) 11655 – 11662.
http://dx.doi.org/10.1021/ie400548w
[3] G. H. Sedahmed, Y. A. El-Taweel, A.H. Konsowa, M. H. Abdel-Aziz, Mass transfer intensification in an annular electrochemical reactor by an
International Conference on Chemical, Environmental and Biological Sciences (CEBS-2015) March 18-19, 2015 Dubai (UAE)
http://dx.doi.org/10.15242/IICBE.C0315097 81
inert fixed bed under various hydrodynamic conditions, Chemical
Engineering and Processing, 50 (2011) 1122 – 1127. http://dx.doi.org/10.1016/j.cep.2011.10.002
[4] Babel, S. & Kurniawan, T. A., 2004. Cr (VI) removal from synthetic
wastewater using coconut shell charcoal and commercial activated carbon modified with oxidizing agents and/or chitosan. Chemosphere,
54 (7), pp. 951-967.
http://dx.doi.org/10.1016/j.chemosphere.2003.10.001 [5] Omar Farouk, the use of rice straw and husk fibers as reinforcements in
composites, Biofiber reinforcement in composite materials, 1st edition,
Woodhead Publishing Limited , , ISBN 1 78242 122 X, ISBN-13: 978 1 78242 122 1, 2014.
[6] Sayed A.Sherif, M.A.Sadek, F.H.Ashour, M. Bassyouni, 2009. Effects
of surface treatment of ground rice husk on the polyurethane based on castor oil. Polymer & Polymer composites, 17 (8), pp 467-471.
[7] M. Bassyouni , Sayed A., Sherif , M.A., Sadek and F.H., Ashour,
Synthesis and characterization of Polyurethane – treated waste milled light bulbs composites, Composites Part B: Engineering, Volume 43,
Issue 3, April 2012, PP1439–1444.
http://dx.doi.org/10.1016/j.compositesb.2011.08.014 [8] M. Bassyouni, Waheed Ul hassan, Farid Nasir bin Ani, M.H. Abdel-
aziz, S. M.S Abdel-hamid, date palm waste gasification in downdraft
gasifier and simulation using Aspen HYSYS, journal of energy conversion and management, 2014, 88, 693-699, 2014.
[9] M. Bassyouni, I. Taha, Shereen M.-S. Abdel-hamid and L. Steuernagel
“Physico-Mechanical Properties of Chemically Treated Polypropylene Rice Straw bio-Composites”. Journal of Reinforced Plastics and
Composites, March 2012 31: 303-312, 2012 [10] Bojic, A.L. Bojic, D. & Andjelkovic, T., 2009. Removal of Cu2+ and
Zn2+ from model wastewaters by spontaneous reduction–coagulation
process in flow conditions, Journal of Hazardous Materials, 168, pp.213-218.
http://dx.doi.org/10.1016/j.jhazmat.2009.02.096
[11] Cestari, A.R. Vieira, E.F.S. Lopes, E.C.N. & Da Silva, R.G., 2004. Kinetics and equilibrium.
[12] Chantawong, V. Harvey, N. W.& Bashkin, V. N., 2003.Comparison of
Heavy Metals Adsorption by Thai Kaolin and Ballclay. Water Air Soil Pollution, 148, pp. 111-125.
http://dx.doi.org/10.1023/A:1025401927023
[13] Chen, J. Yiacoumi, S.& Blaydes, T. G., 1996. Equilibrium and kinetic
studies of copper adsorption by activated carbon. Sep. Tech., 6, pp. 33–
146.
http://dx.doi.org/10.1016/0956-9618(96)00146-4 [14] Corapcioglu, M. O.& Huang, C. P., (1987). The adsorption of heavy
metals onto hydrous activated carbon. Water Res., 21(9), pp. 1031-1044.
http://dx.doi.org/10.1016/0043-1354(87)90024-8 [15] Dakiky, M. Khamis, A. Manassra, M. M., 2002. Selective adsorption of
chromium (VI) in industrial wastewater using low-cost abundantly
available adsorbents, Adv. Environ. Res., 6 (4) (2002) 533–540. http://dx.doi.org/10.1016/S1093-0191(01)00079-X
[16] G. Vijaya Lakshmi, N. Chitti Babu, P. V. Ravi Kumar, D. Subba Rao
& P. Venkateswarlu,(2008), potential of erythrina variegata orientalisleaf powder for the removal of cobalt(ii), Chemical
Engineering Communications, Volume 196, Issue 4.
[17] Ho,Y.S., 2006. Isotherms for the sorption of lead onto peat: comparison of linear and non-linear methods. Polish journal of environmental
studies, 15(1), pp. 81-86.
[18] Issabayeva, G. Aroua, M. K. & Sulaiman, N. M., 2007.Continuous
adsorption of lead ions in a column packed with palm shell activated
carbon. Journal of Hazardous materials, 155 (1-2), pp. 109-113.
http://dx.doi.org/10.1016/j.jhazmat.2007.11.036 [19] K.Z. Mohammed, A. Hammdy, A. Abdel-wahab, N .A. Farid.
Temperature Effect on corrosion Inhibition of Carbon Steel in Formation
Water by Non-ionic Inhibitor and Synergistic Influence of Halide Ions. Life Sci J 2012; 9(2):424-434.
[20] Lee, H. Kuan,Y.C.& Chern, J.M. 2007. Equilibrium and kinetics of
heavy metal ion exchange, Journal of the Chinese Institute of Chemical Engineers, 38, pp. 71–84.
http://dx.doi.org/10.1016/j.jcice.2006.11.001
[21] Malek, A. & Farooq, S., 1996. Comparison of isotherm models for hydrocarbon adsorption on activated carbon, AIChE Journal. 42, pp.
3191–3201.
http://dx.doi.org/10.1002/aic.690421120
[22] Mohan, D. & Pittman, C.U., 2007. Arsenic removal from
water/wastewater using adsorbents- A critical review. Journal of Hazardous materials, 142, pp.1-53.
http://dx.doi.org/10.1016/j.jhazmat.2007.01.006
[23] Nabi Saheb D., & Jog J. P. 1999. Natural Fiber Polymer Composites: A Review. Advances in polymer technology, 18, 351-363.
http://dx.doi.org/10.1002/(SICI)1098-2329(199924)18:4<351::AID-
ADV6>3.0.CO;2-X [24] Sekar, M. Sakthi,V. & Rengaraj,S., 2004. Kinetics and equilibrium
adsorption study of lead (II) onto activated carbon prepared from
Coconut Shell,’’ J. Colloid Interface Sci., 279, pp. 307. http://dx.doi.org/10.1016/j.jcis.2004.06.042
[25] Shaidan, N.H. Eldemerdash, U. Awad, S., 2011. Removal of Ni(II) ions
from aqueous solutions using fixed-bed ion exchange column technique, Journal of the Taiwan Institute of Chemical Engineers.
[26] Sofiane Ben Hamouda, Ali Boubakri, Quang Trong Nguyen, and
Mohamed Ben Amor, 2011, PEBAX membranes for water desalination by pervaporation process, high performance polymer, 23(2) 170–173
[27] Volesky, B., 2003. Sorption and Biosorption, BV Sorbex, Inc., 0-9732
983-0-8, Canada. [28] Wang, L.H. & Lin, C., 2010. The removal of heavy metal ions from
spiked aqueous solutions using solid wastes-Comparison of sorption
capability, Journal of the Taiwan Institute of Chemical Engineers, 41, pp. 585–590.
http://dx.doi.org/10.1016/j.jtice.2010.01.005
[29] Yuh-Shan Ho , 2006 Polish Journal of Environmental Studies Vol. 15, No. 1 (2006), Isotherms for the Sorption of Lead onto Peat Comparison
of Linear and Non-Linear Methods81-86. [30] Zvinowanda, C. M. Okonkwo, J. O. Shabalala, P. N.& Agyei,N. M.,
2009. A novel adsorbent for heavy metal remediation in aqueous
environments. International Journal of Environmental Science Technology, 6 (3), pp. 425-434.
http://dx.doi.org/10.1007/BF03326081
International Conference on Chemical, Environmental and Biological Sciences (CEBS-2015) March 18-19, 2015 Dubai (UAE)
http://dx.doi.org/10.15242/IICBE.C0315097 82
![Index []Beer foam carbonation, 314 fatty acids, 71 hops, 46 proteolytic enzymes, 264 total soluble nitrogen, 29 Beer industry advertising, 15 beer sales, 7 beer segments, 12 classification](https://static.fdocument.org/doc/165x107/5f1733991d40922a93492bd1/index-beer-foam-carbonation-314-fatty-acids-71-hops-46-proteolytic-enzymes.jpg)