Pravastatin and Isomers by LC-MS/MSmac-mod.com/pdf/application-packets/ACE Clinical...
26
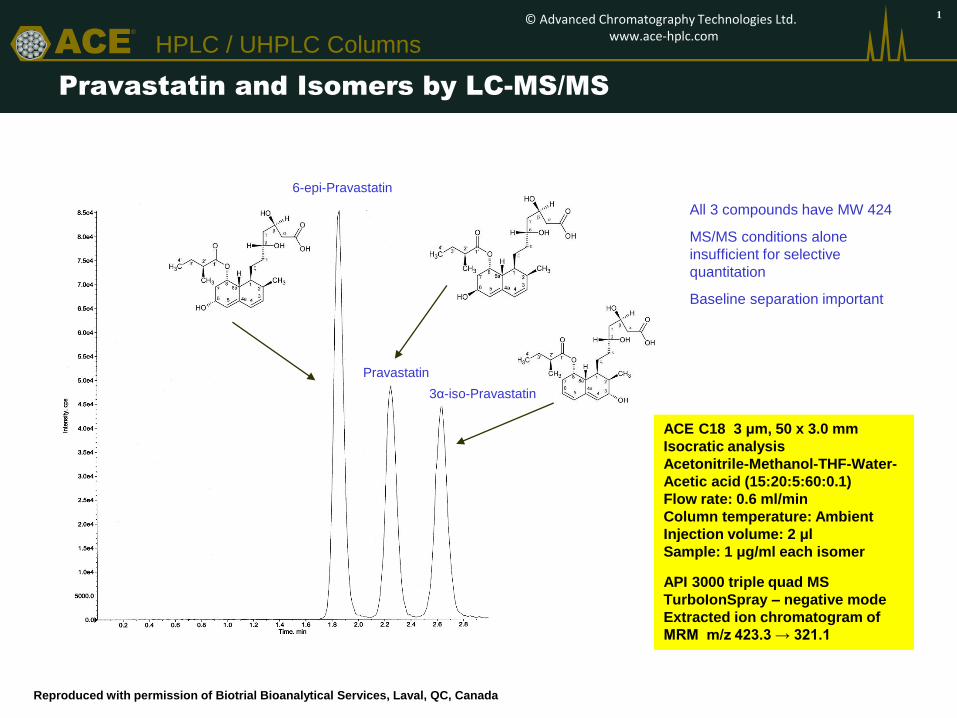
ACE ® HPLC / UHPLC Columns Pravastatin and Isomers by LC-MS/MS ACE C18 3 μm, 50 x 3.0 mm Isocratic analysis Acetonitrile-Methanol-THF-Water- Acetic acid (15:20:5:60:0.1) Flow rate: 0.6 ml/min Column temperature: Ambient Injection volume: 2 μl Sample: 1 μg/ml each isomer API 3000 triple quad MS TurboIonSpray – negative mode Extracted ion chromatogram of MRM m/z 423.3 → 321.1 Reproduced with permission of Biotrial Bioanalytical Services, Laval, QC, Canada All 3 compounds have MW 424 MS/MS conditions alone insufficient for selective quantitation Baseline separation important 6-epi-Pravastatin 3α-iso-Pravastatin Pravastatin © Advanced Chromatography Technologies Ltd. www.ace-hplc.com 1
Transcript of Pravastatin and Isomers by LC-MS/MSmac-mod.com/pdf/application-packets/ACE Clinical...
ACE®
HPLC / UHPLC Columns
Pravastatin and Isomers by LC-MS/MS
ACE C18 3 μm, 50 x 3.0 mm
Isocratic analysis
Acetonitrile-Methanol-THF-Water-
Acetic acid (15:20:5:60:0.1)
Flow rate: 0.6 ml/min
Column temperature: Ambient
Injection volume: 2 μl
Sample: 1 μg/ml each isomer
API 3000 triple quad MS
TurboIonSpray – negative mode
Extracted ion chromatogram of
MRM m/z 423.3 → 321.1
Reproduced with permission of Biotrial Bioanalytical Services, Laval, QC, Canada
All 3 compounds have MW 424
MS/MS conditions alone
insufficient for selective
quantitation
Baseline separation important
6-epi-Pravastatin
3α-iso-Pravastatin
Pravastatin
© Advanced Chromatography Technologies Ltd. www.ace-hplc.com
1
ACE®
HPLC / UHPLC Columns
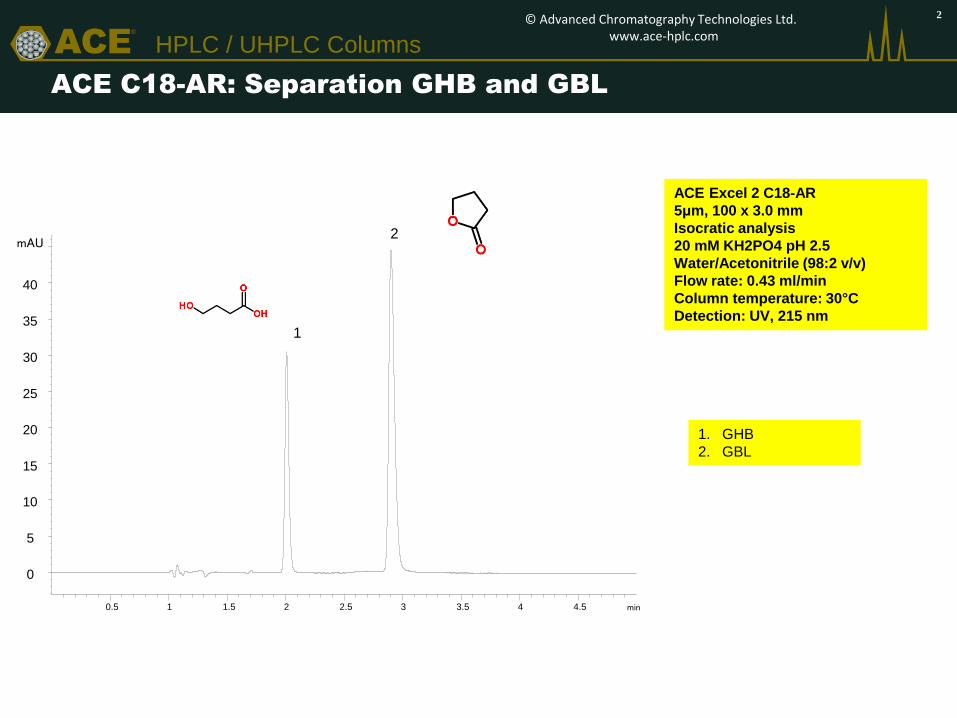
ACE C18-AR: Separation GHB and GBL
ACE Excel 2 C18-AR
5μm, 100 x 3.0 mm
Isocratic analysis
20 mM KH2PO4 pH 2.5
Water/Acetonitrile (98:2 v/v)
Flow rate: 0.43 ml/min
Column temperature: 30°C
Detection: UV, 215 nm
2
min 0.5 1 1.5 2 2.5 3 3.5 4 4.5
mAU
0
5
10
15
20
25
30
35
40
1. GHB
2. GBL
1
2
© Advanced Chromatography Technologies Ltd. www.ace-hplc.com
ACE®
HPLC / UHPLC Columns
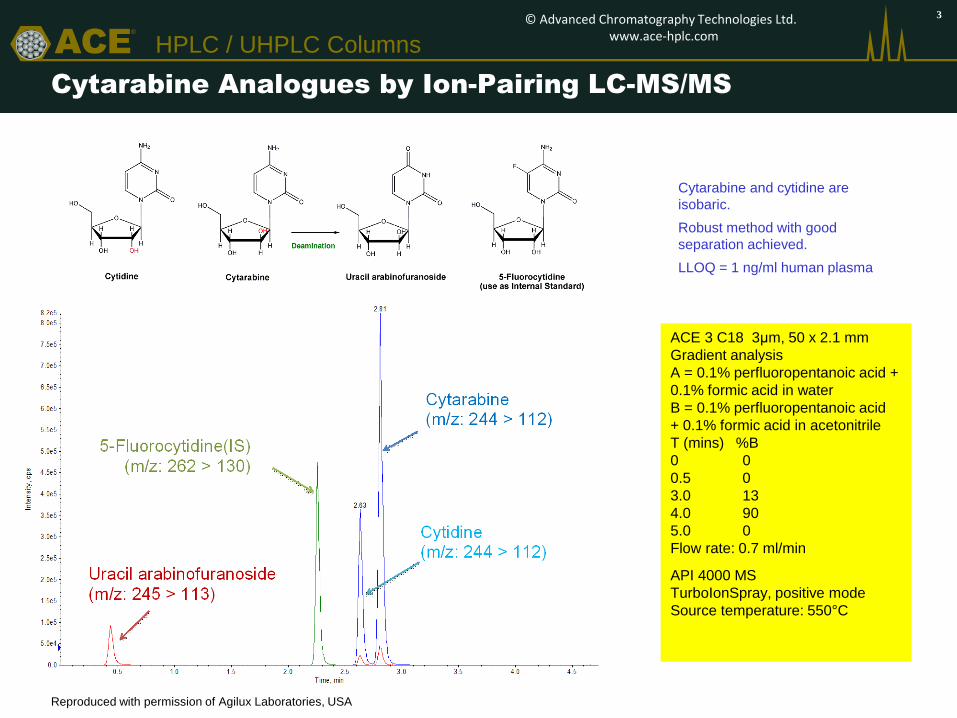
Cytarabine Analogues by Ion-Pairing LC-MS/MS
Reproduced with permission of Agilux Laboratories, USA
ACE 3 C18 3μm, 50 x 2.1 mm
Gradient analysis
A = 0.1% perfluoropentanoic acid +
0.1% formic acid in water
B = 0.1% perfluoropentanoic acid
+ 0.1% formic acid in acetonitrile
T (mins) %B
0 0
0.5 0
3.0 13
4.0 90
5.0 0
Flow rate: 0.7 ml/min
API 4000 MS
TurboIonSpray, positive mode
Source temperature: 550°C
Cytarabine and cytidine are
isobaric.
Robust method with good
separation achieved.
LLOQ = 1 ng/ml human plasma
© Advanced Chromatography Technologies Ltd. www.ace-hplc.com
3
ACE®
HPLC / UHPLC Columns
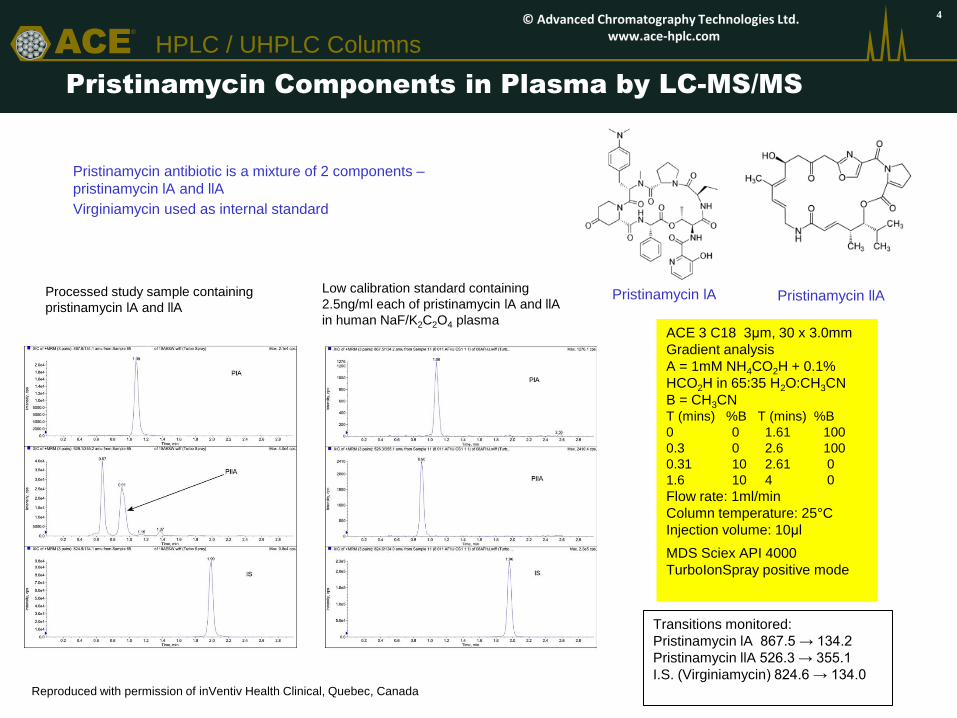
Pristinamycin Components in Plasma by LC-MS/MS
Reproduced with permission of inVentiv Health Clinical, Quebec, Canada
ACE 3 C18 3μm, 30 x 3.0mm
Gradient analysis
A = 1mM NH4CO2H + 0.1%
HCO2H in 65:35 H2O:CH3CN
B = CH3CN T (mins) %B T (mins) %B
0 0 1.61 100
0.3 0 2.6 100
0.31 10 2.61 0
1.6 10 4 0
Flow rate: 1ml/min
Column temperature: 25°C
Injection volume: 10μl
MDS Sciex API 4000
TurboIonSpray positive mode
Low calibration standard containing
2.5ng/ml each of pristinamycin lA and llA
in human NaF/K2C2O4 plasma
Transitions monitored:
Pristinamycin lA 867.5 → 134.2
Pristinamycin llA 526.3 → 355.1
I.S. (Virginiamycin) 824.6 → 134.0
Processed study sample containing
pristinamycin lA and llA
Pristinamycin antibiotic is a mixture of 2 components –
pristinamycin lA and llA
Virginiamycin used as internal standard
Pristinamycin llA Pristinamycin lA
4 © Advanced Chromatography Technologies Ltd. www.ace-hplc.com
ACE®
HPLC / UHPLC Columns
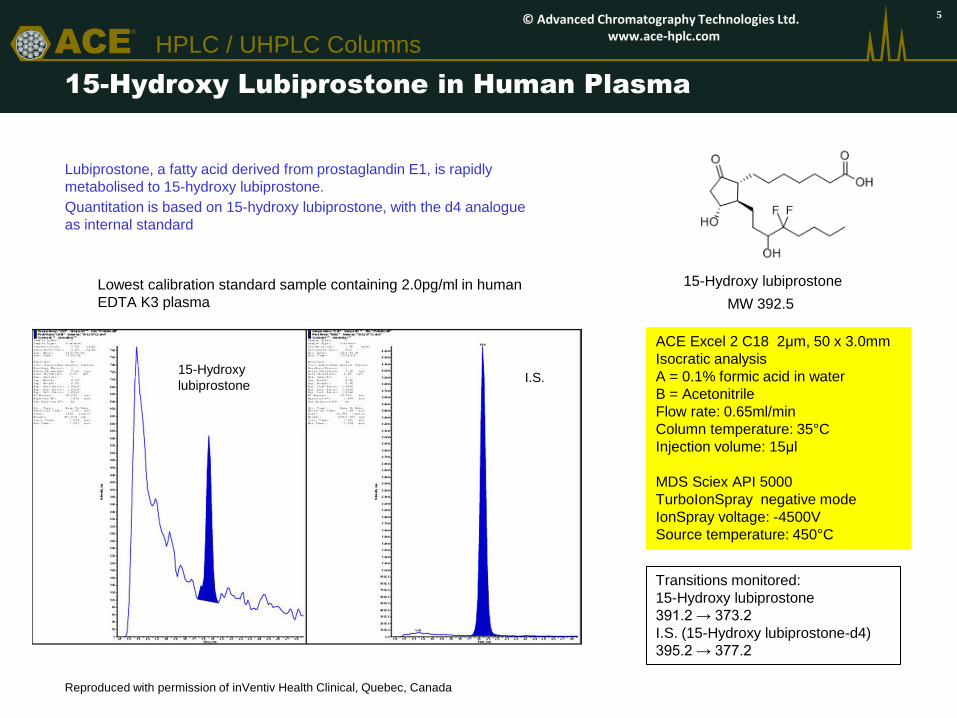
15-Hydroxy Lubiprostone in Human Plasma
ACE Excel 2 C18 2μm, 50 x 3.0mm
Isocratic analysis
A = 0.1% formic acid in water
B = Acetonitrile
Flow rate: 0.65ml/min
Column temperature: 35°C
Injection volume: 15μl
MDS Sciex API 5000
TurboIonSpray negative mode
IonSpray voltage: -4500V
Source temperature: 450°C
15-Hydroxy lubiprostone
MW 392.5
Reproduced with permission of inVentiv Health Clinical, Quebec, Canada
Lubiprostone, a fatty acid derived from prostaglandin E1, is rapidly
metabolised to 15-hydroxy lubiprostone.
Quantitation is based on 15-hydroxy lubiprostone, with the d4 analogue
as internal standard
Transitions monitored:
15-Hydroxy lubiprostone
391.2 → 373.2
I.S. (15-Hydroxy lubiprostone-d4)
395.2 → 377.2
Lowest calibration standard sample containing 2.0pg/ml in human
EDTA K3 plasma
15-Hydroxy
lubiprostone I.S.
5 © Advanced Chromatography Technologies Ltd. www.ace-hplc.com
ACE®
HPLC / UHPLC Columns
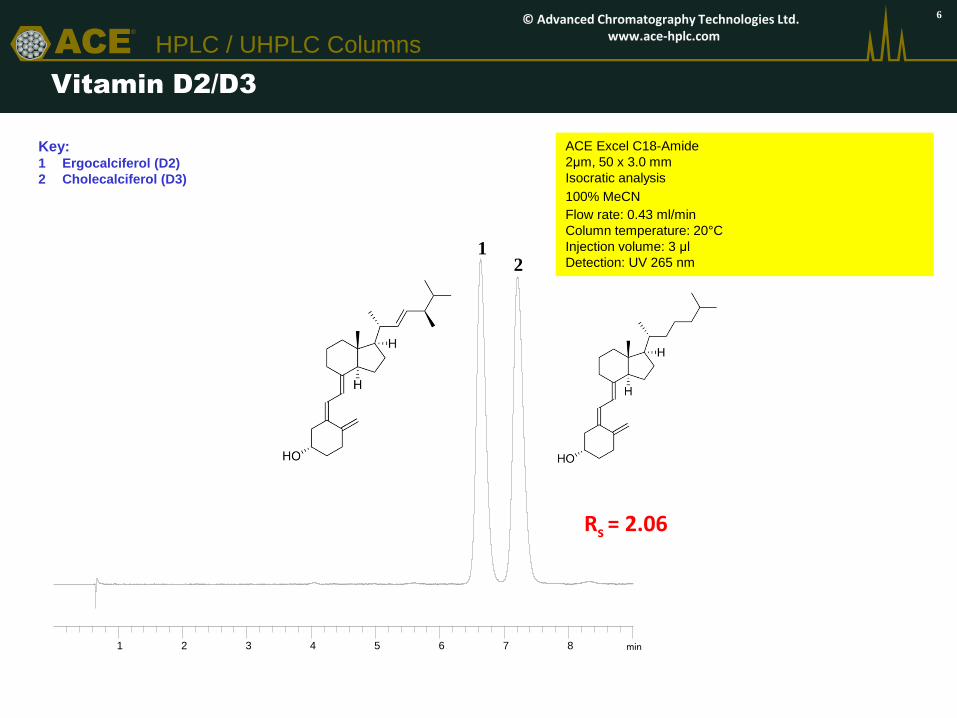
min 1 2 3 4 5 6 7 8
Rs = 2.06
Vitamin D2/D3
ACE Excel C18-Amide
2μm, 50 x 3.0 mm
Isocratic analysis
100% MeCN
Flow rate: 0.43 ml/min
Column temperature: 20°C
Injection volume: 3 μl
Detection: UV 265 nm 1
2
Key: 1 Ergocalciferol (D2)
2 Cholecalciferol (D3)
6 © Advanced Chromatography Technologies Ltd. www.ace-hplc.com
ACE®
HPLC / UHPLC Columns
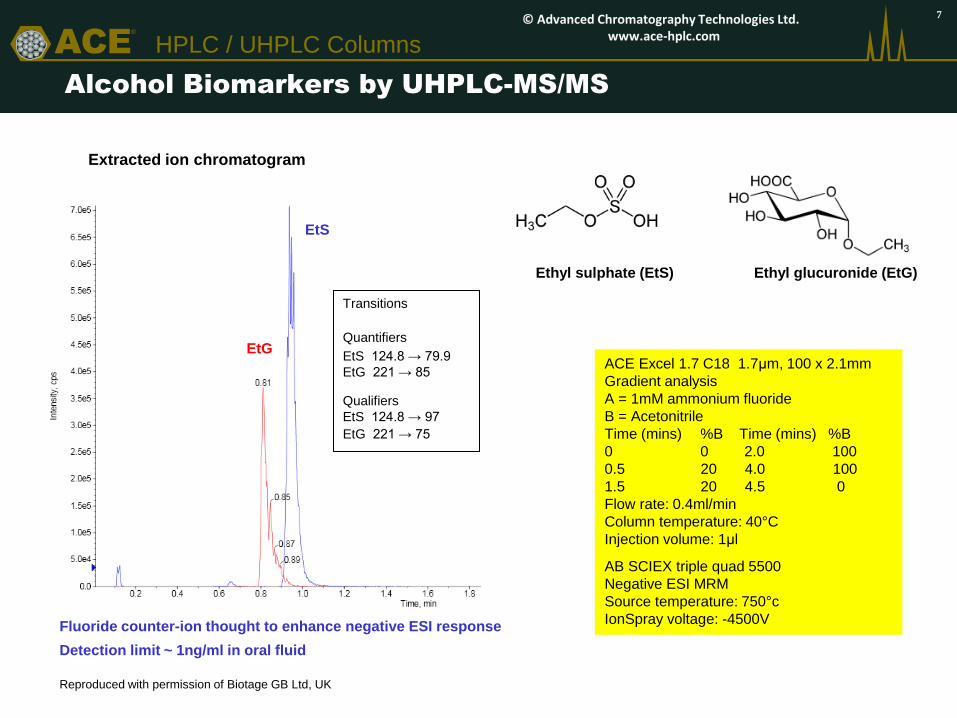
Alcohol Biomarkers by UHPLC-MS/MS
ACE Excel 1.7 C18 1.7μm, 100 x 2.1mm
Gradient analysis
A = 1mM ammonium fluoride
B = Acetonitrile
Time (mins) %B Time (mins) %B
0 0 2.0 100
0.5 20 4.0 100
1.5 20 4.5 0
Flow rate: 0.4ml/min
Column temperature: 40°C
Injection volume: 1μl
AB SCIEX triple quad 5500
Negative ESI MRM
Source temperature: 750°c
IonSpray voltage: -4500V
Reproduced with permission of Biotage GB Ltd, UK
Transitions
Quantifiers
EtS 124.8 → 79.9
EtG 221 → 85
Qualifiers
EtS 124.8 → 97
EtG 221 → 75
Extracted ion chromatogram
Ethyl sulphate (EtS) Ethyl glucuronide (EtG)
Fluoride counter-ion thought to enhance negative ESI response
Detection limit ~ 1ng/ml in oral fluid
EtG
EtS
7 © Advanced Chromatography Technologies Ltd. www.ace-hplc.com
ACE®
HPLC / UHPLC Columns
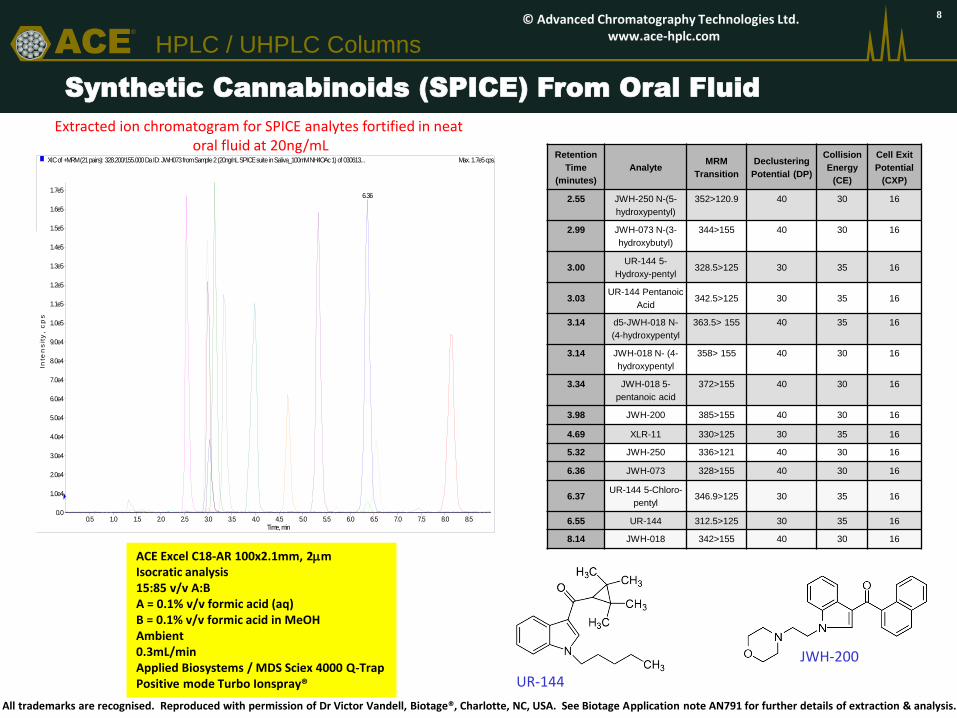
Extracted ion chromatogram for SPICE analytes fortified in neat oral fluid at 20ng/mL
Synthetic Cannabinoids (SPICE) From Oral Fluid
ACE Excel C18-AR 100x2.1mm, 2mm Isocratic analysis 15:85 v/v A:B A = 0.1% v/v formic acid (aq) B = 0.1% v/v formic acid in MeOH Ambient 0.3mL/min Applied Biosystems / MDS Sciex 4000 Q-Trap Positive mode Turbo Ionspray®
XIC of +MRM (21 pairs): 328.200/155.000 Da ID: JWH073 from Sample 2 (20ng/nL SPICE suite in Saliva_100mM NH4OAc 1) of 030613... Max. 1.7e5 cps.
0.5 1.0 1.5 2.0 2.5 3.0 3.5 4.0 4.5 5.0 5.5 6.0 6.5 7.0 7.5 8.0 8.5Time, min
0.0
1.0e4
2.0e4
3.0e4
4.0e4
5.0e4
6.0e4
7.0e4
8.0e4
9.0e4
1.0e5
1.1e5
1.2e5
1.3e5
1.4e5
1.5e5
1.6e5
1.7e5
Inte
ns
ity
, c
ps
6.36
All trademarks are recognised. Reproduced with permission of Dr Victor Vandell, Biotage®, Charlotte, NC, USA. See Biotage Application note AN791 for further details of extraction & analysis.
UR-144
JWH-200
Retention
Time
(minutes)
Analyte MRM
Transition
Declustering
Potential (DP)
Collision
Energy
(CE)
Cell Exit
Potential
(CXP)
2.55 JWH-250 N-(5-
hydroxypentyl)
352>120.9 40 30 16
2.99 JWH-073 N-(3-
hydroxybutyl)
344>155 40 30 16
3.00 UR-144 5-
Hydroxy-pentyl 328.5>125 30 35 16
3.03 UR-144 Pentanoic
Acid 342.5>125 30 35 16
3.14 d5-JWH-018 N-
(4-hydroxypentyl
363.5> 155 40 35 16
3.14 JWH-018 N- (4-
hydroxypentyl
358> 155 40 30 16
3.34 JWH-018 5-
pentanoic acid
372>155 40 30 16
3.98 JWH-200 385>155 40 30 16
4.69 XLR-11 330>125 30 35 16
5.32 JWH-250 336>121 40 30 16
6.36 JWH-073 328>155 40 30 16
6.37 UR-144 5-Chloro-
pentyl 346.9>125 30 35 16
6.55 UR-144 312.5>125 30 35 16
8.14 JWH-018 342>155 40 30 16
8 © Advanced Chromatography Technologies Ltd. www.ace-hplc.com
ACE®
HPLC / UHPLC Columns
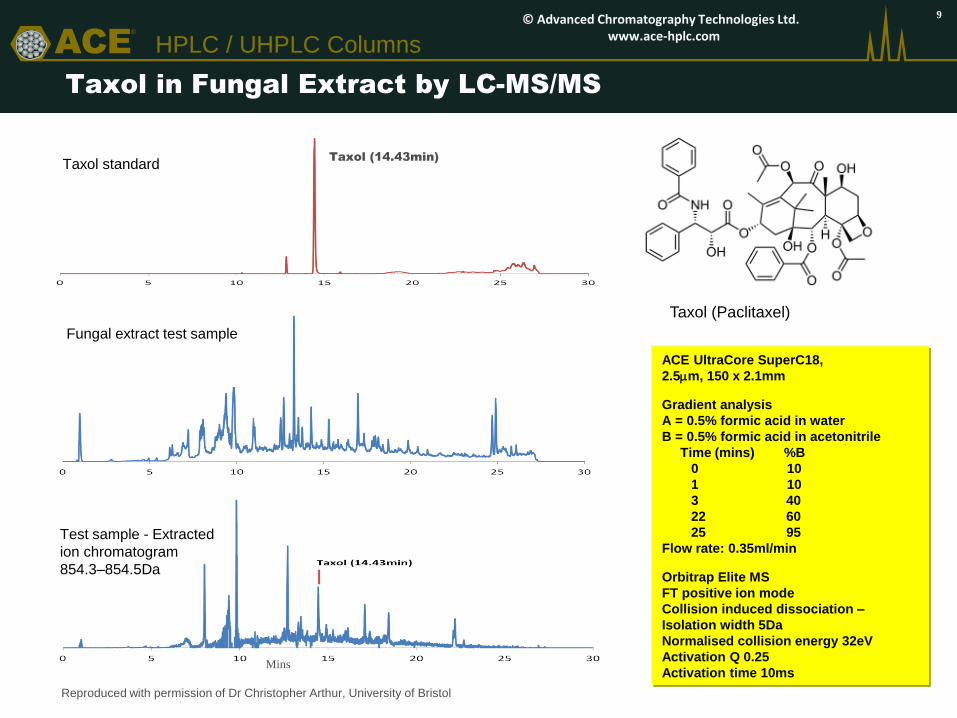
Taxol in Fungal Extract by LC-MS/MS
Taxol (14.43min)
ACE UltraCore SuperC18,
2.5mm, 150 x 2.1mm
Gradient analysis
A = 0.5% formic acid in water
B = 0.5% formic acid in acetonitrile
Time (mins) %B
0 10
1 10
3 40
22 60
25 95
Flow rate: 0.35ml/min
Orbitrap Elite MS
FT positive ion mode
Collision induced dissociation –
Isolation width 5Da
Normalised collision energy 32eV
Activation Q 0.25
Activation time 10ms
Reproduced with permission of Dr Christopher Arthur, University of Bristol
Taxol (Paclitaxel)
Fungal extract test sample
Taxol standard
Test sample - Extracted
ion chromatogram
854.3–854.5Da
Mins
9 © Advanced Chromatography Technologies Ltd. www.ace-hplc.com
ACE®
HPLC / UHPLC Columns
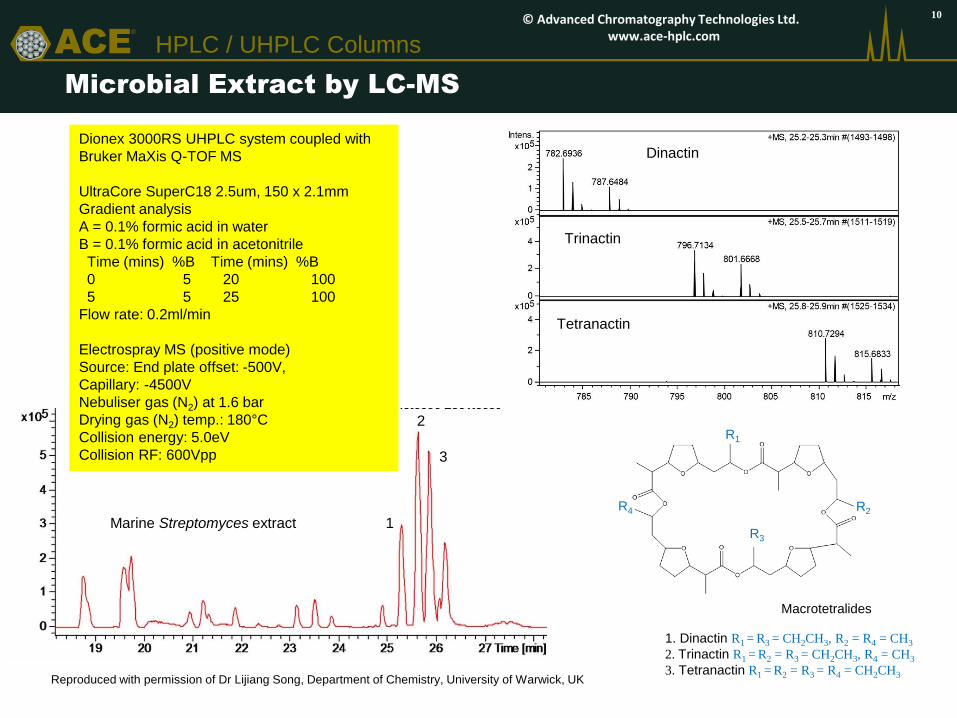
Microbial Extract by LC-MS
Reproduced with permission of Dr Lijiang Song, Department of Chemistry, University of Warwick, UK
Dionex 3000RS UHPLC system coupled with
Bruker MaXis Q-TOF MS
UltraCore SuperC18 2.5um, 150 x 2.1mm
Gradient analysis
A = 0.1% formic acid in water
B = 0.1% formic acid in acetonitrile
Time (mins) %B Time (mins) %B
0 5 20 100
5 5 25 100
Flow rate: 0.2ml/min
Electrospray MS (positive mode)
Source: End plate offset: -500V,
Capillary: -4500V
Nebuliser gas (N2) at 1.6 bar
Drying gas (N2) temp.: 180°C
Collision energy: 5.0eV
Collision RF: 600Vpp
1. Dinactin R1 = R3 = CH2CH3, R2 = R4 = CH3
2. Trinactin R1 = R2 = R3 = CH2CH3, R4 = CH3
3. Tetranactin R1 = R2 = R3 = R4 = CH2CH3
R1
R2
R3
R4
Macrotetralides
1
2
3
Dinactin
Tetranactin
Trinactin
Marine Streptomyces extract
10 © Advanced Chromatography Technologies Ltd. www.ace-hplc.com
ACE®
HPLC / UHPLC Columns
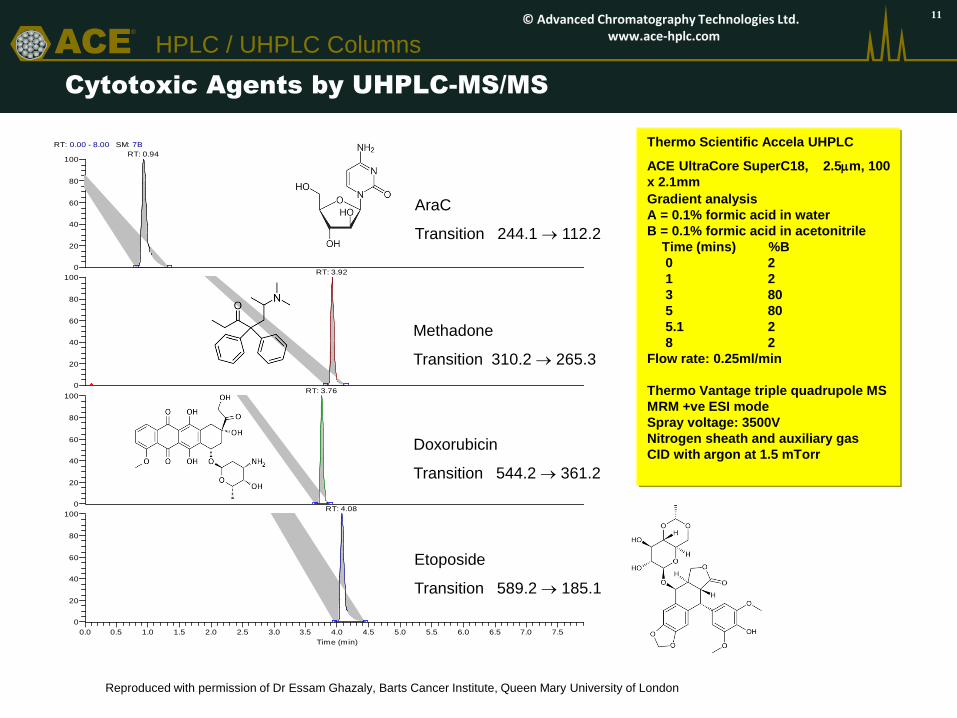
Cytotoxic Agents by UHPLC-MS/MS
RT: 0.00 - 8.00 SM: 7B
0.0 0.5 1.0 1.5 2.0 2.5 3.0 3.5 4.0 4.5 5.0 5.5 6.0 6.5 7.0 7.5 8.0
Time (min)
0
20
40
60
80
100
0
20
40
60
80
100
0
20
40
60
80
100
Re
lativ
e A
bu
nd
an
ce
0
20
40
60
80
100RT: 0.94
RT: 3.92
RT: 3.76
RT: 4.08
NL: 3.12E8
TIC F: + p ESI SRM
ms2 244.089
[111.899-112.399]
MS
Rachel_seq00181
NL: 2.40E8
TIC F: + p ESI SRM
ms2 310.212
[265.259-265.309]
MS
Rachel_seq00181
NL: 1.94E8
TIC F: + p ESI SRM
ms2 544.155
[360.933-361.433,
396.969-397.469]
MS
Rachel_seq00181
NL: 3.95E7
TIC F: + p ESI SRM
ms2 589.159
[184.891-185.391,
228.896-229.396]
MS
Rachel_seq00181
Reproduced with permission of Dr Essam Ghazaly, Barts Cancer Institute, Queen Mary University of London
Thermo Scientific Accela UHPLC
ACE UltraCore SuperC18, 2.5mm, 100
x 2.1mm
Gradient analysis
A = 0.1% formic acid in water
B = 0.1% formic acid in acetonitrile
Time (mins) %B
0 2
1 2
3 80
5 80
5.1 2
8 2
Flow rate: 0.25ml/min
Thermo Vantage triple quadrupole MS
MRM +ve ESI mode
Spray voltage: 3500V
Nitrogen sheath and auxiliary gas
CID with argon at 1.5 mTorr
AraC
Transition 244.1 112.2
Methadone
Transition 310.2 265.3
Doxorubicin
Transition 544.2 361.2
Etoposide
Transition 589.2 185.1
11 © Advanced Chromatography Technologies Ltd. www.ace-hplc.com
ACE®
HPLC / UHPLC Columns
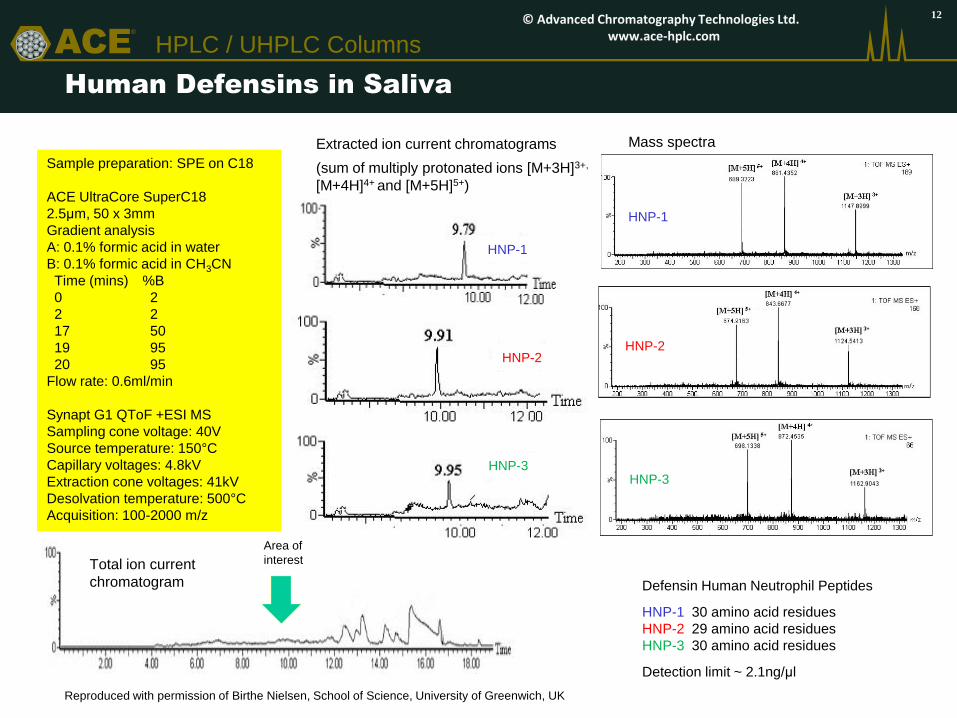
Human Defensins in Saliva
Reproduced with permission of Birthe Nielsen, School of Science, University of Greenwich, UK
Extracted ion current chromatograms
(sum of multiply protonated ions [M+3H]3+,
[M+4H]4+ and [M+5H]5+)
Mass spectra
Sample preparation: SPE on C18
ACE UltraCore SuperC18
2.5μm, 50 x 3mm
Gradient analysis
A: 0.1% formic acid in water
B: 0.1% formic acid in CH3CN
Time (mins) %B
0 2
2 2
17 50
19 95
20 95
Flow rate: 0.6ml/min
Synapt G1 QToF +ESI MS
Sampling cone voltage: 40V
Source temperature: 150°C
Capillary voltages: 4.8kV
Extraction cone voltages: 41kV
Desolvation temperature: 500°C
Acquisition: 100-2000 m/z
Total ion current
chromatogram Defensin Human Neutrophil Peptides
HNP-1 30 amino acid residues
HNP-2 29 amino acid residues
HNP-3 30 amino acid residues
Detection limit ~ 2.1ng/μl
Area of
interest
HNP-1
HNP-3
HNP-2
HNP-3
HNP-1
HNP-2
12 © Advanced Chromatography Technologies Ltd. www.ace-hplc.com
ACE®
HPLC / UHPLC Columns
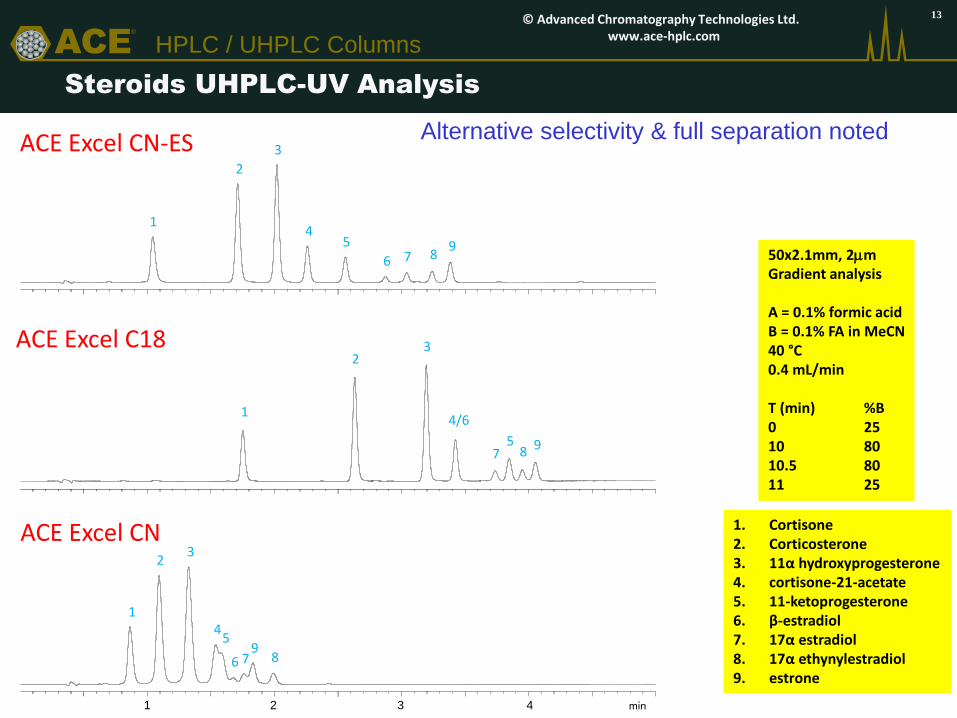
Steroids UHPLC-UV Analysis
1. Cortisone 2. Corticosterone 3. 11α hydroxyprogesterone 4. cortisone-21-acetate 5. 11-ketoprogesterone 6. β-estradiol 7. 17α estradiol 8. 17α ethynylestradiol 9. estrone
ACE Excel CN-ES
50x2.1mm, 2mm Gradient analysis A = 0.1% formic acid B = 0.1% FA in MeCN 40 °C 0.4 mL/min T (min) %B 0 25 10 80 10.5 80 11 25
Alternative selectivity & full separation noted
13
1
2
3
4
8 9 5
7 6
ACE Excel CN
1
2 3
4
8 9
5
7 6
ACE Excel C18
min 1 2 3 4
1
2 3
4/6
8 9 5
7
© Advanced Chromatography Technologies Ltd. www.ace-hplc.com
ACE®
HPLC / UHPLC Columns
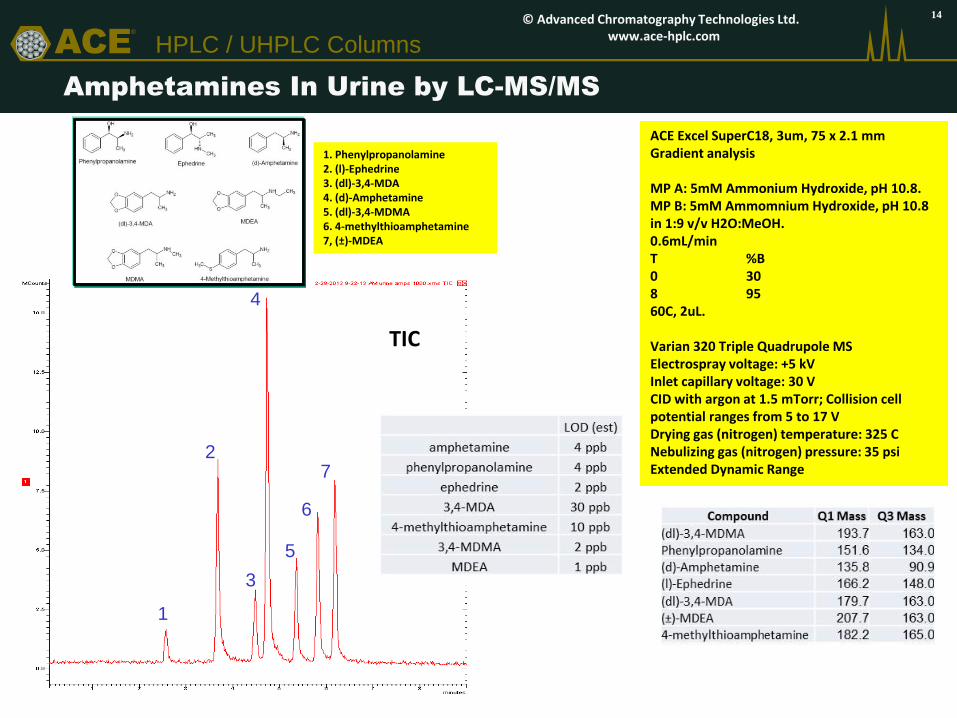
Amphetamines In Urine by LC-MS/MS
TIC
1
2
3
4
5
6
7
ACE Excel SuperC18, 3um, 75 x 2.1 mm Gradient analysis MP A: 5mM Ammonium Hydroxide, pH 10.8. MP B: 5mM Ammomnium Hydroxide, pH 10.8 in 1:9 v/v H2O:MeOH. 0.6mL/min T %B 0 30 8 95 60C, 2uL. Varian 320 Triple Quadrupole MS Electrospray voltage: +5 kV Inlet capillary voltage: 30 V CID with argon at 1.5 mTorr; Collision cell potential ranges from 5 to 17 V Drying gas (nitrogen) temperature: 325 C Nebulizing gas (nitrogen) pressure: 35 psi Extended Dynamic Range
1. Phenylpropanolamine 2. (l)-Ephedrine 3. (dl)-3,4-MDA 4. (d)-Amphetamine 5. (dl)-3,4-MDMA 6. 4-methylthioamphetamine 7, (±)-MDEA
14 © Advanced Chromatography Technologies Ltd. www.ace-hplc.com
ACE®
HPLC / UHPLC Columns
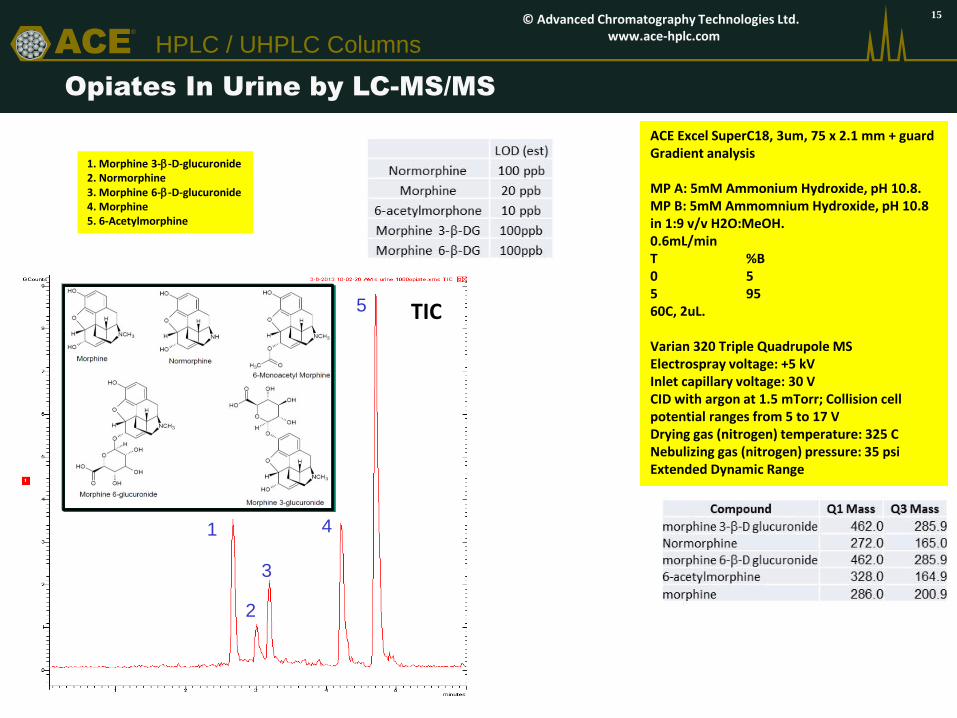
Opiates In Urine by LC-MS/MS
ACE Excel SuperC18, 3um, 75 x 2.1 mm + guard Gradient analysis MP A: 5mM Ammonium Hydroxide, pH 10.8. MP B: 5mM Ammomnium Hydroxide, pH 10.8 in 1:9 v/v H2O:MeOH. 0.6mL/min T %B 0 5 5 95 60C, 2uL. Varian 320 Triple Quadrupole MS Electrospray voltage: +5 kV Inlet capillary voltage: 30 V CID with argon at 1.5 mTorr; Collision cell potential ranges from 5 to 17 V Drying gas (nitrogen) temperature: 325 C Nebulizing gas (nitrogen) pressure: 35 psi Extended Dynamic Range
TIC
1. Morphine 3-b-D-glucuronide 2. Normorphine 3. Morphine 6-b-D-glucuronide 4. Morphine 5. 6-Acetylmorphine
1
2
3
4
5
15 © Advanced Chromatography Technologies Ltd. www.ace-hplc.com
ACE®
HPLC / UHPLC Columns
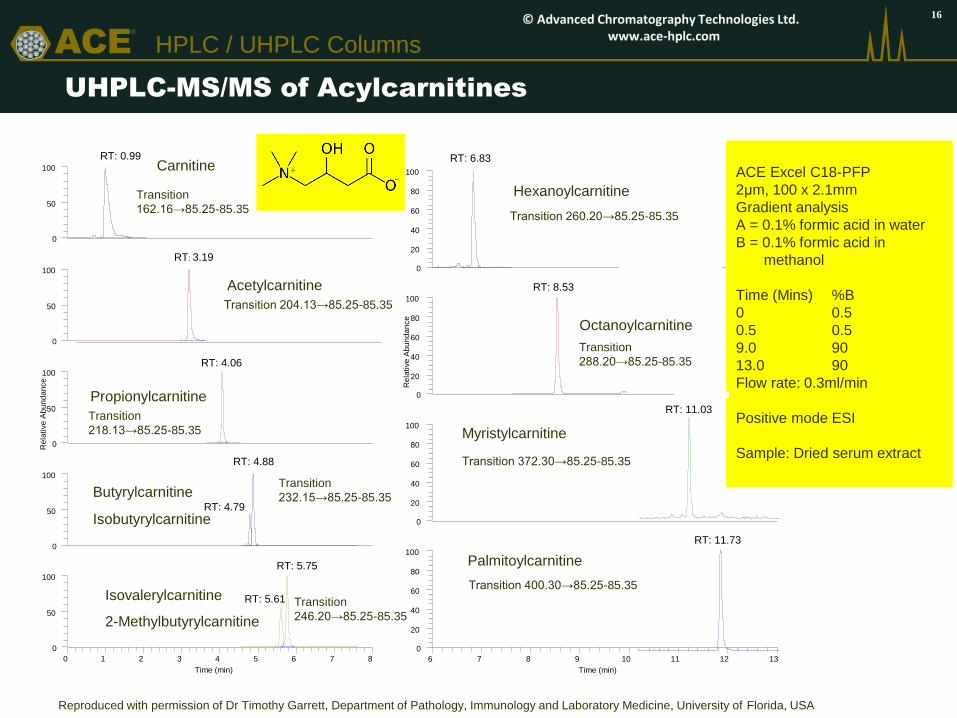
UHPLC-MS/MS of Acylcarnitines
0 1 2 3 4 5 6 7 8
Time (min)
0
50
100
0
50
100
0
50
100
Rela
tive
Ab
un
da
nce
0
50
100
0
50
100
RT: 0.99
RT: 3.19
RT: 4.06
RT: 4.88
RT: 4.79
RT: 5.75
RT: 5.61
:
6 7 8 9 10 11 12 13
Time (min)
0
20
40
60
80
100
0
20
40
60
80
100
0
20
40
60
80
100
Rela
tive
Ab
un
da
nce
0
20
40
60
80
100
RT: 6.83 Carnitine
Propionylcarnitine
ACE Excel C18-PFP
2μm, 100 x 2.1mm
Gradient analysis
A = 0.1% formic acid in water
B = 0.1% formic acid in
methanol
Time (Mins) %B
0 0.5
0.5 0.5
9.0 90
13.0 90
Flow rate: 0.3ml/min
Positive mode ESI
Sample: Dried serum extract
RT: 8.53
RT: 11.03
RT: 11.73
Myristylcarnitine
Palmitoylcarnitine
Hexanoylcarnitine
Isovalerylcarnitine
2-Methylbutyrylcarnitine
Transition
218.13→85.25-85.35
Acetylcarnitine
Transition 204.13→85.25-85.35
Transition
288.20→85.25-85.35
Transition 260.20→85.25-85.35
Transition
246.20→85.25-85.35
Transition 400.30→85.25-85.35
Transition 372.30→85.25-85.35
Octanoylcarnitine
Reproduced with permission of Dr Timothy Garrett, Department of Pathology, Immunology and Laboratory Medicine, University of Florida, USA
Butyrylcarnitine
Isobutyrylcarnitine
Transition
232.15→85.25-85.35
Transition
162.16→85.25-85.35
16 © Advanced Chromatography Technologies Ltd. www.ace-hplc.com
ACE®
HPLC / UHPLC Columns
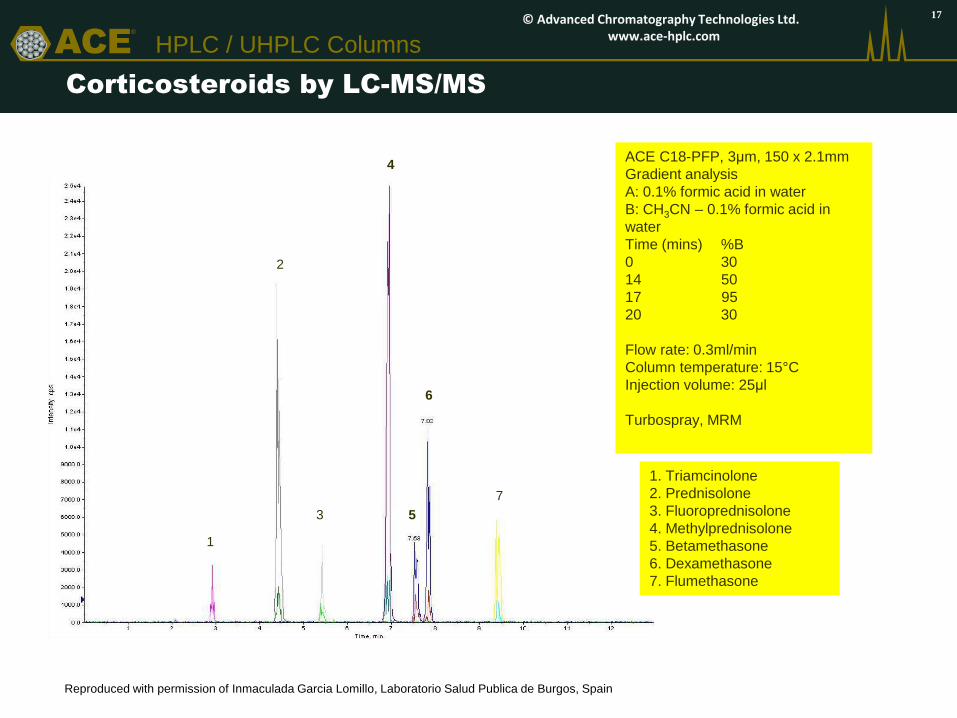
Corticosteroids by LC-MS/MS
1. Triamcinolone
2. Prednisolone
3. Fluoroprednisolone
4. Methylprednisolone
5. Betamethasone
6. Dexamethasone
7. Flumethasone
ACE C18-PFP, 3μm, 150 x 2.1mm
Gradient analysis
A: 0.1% formic acid in water
B: CH3CN – 0.1% formic acid in
water
Time (mins) %B
0 30
14 50
17 95
20 30
Flow rate: 0.3ml/min
Column temperature: 15°C
Injection volume: 25μl
Turbospray, MRM
1
4
3
2
7
6
5
Reproduced with permission of Inmaculada Garcia Lomillo, Laboratorio Salud Publica de Burgos, Spain
17 © Advanced Chromatography Technologies Ltd. www.ace-hplc.com
ACE®
HPLC / UHPLC Columns
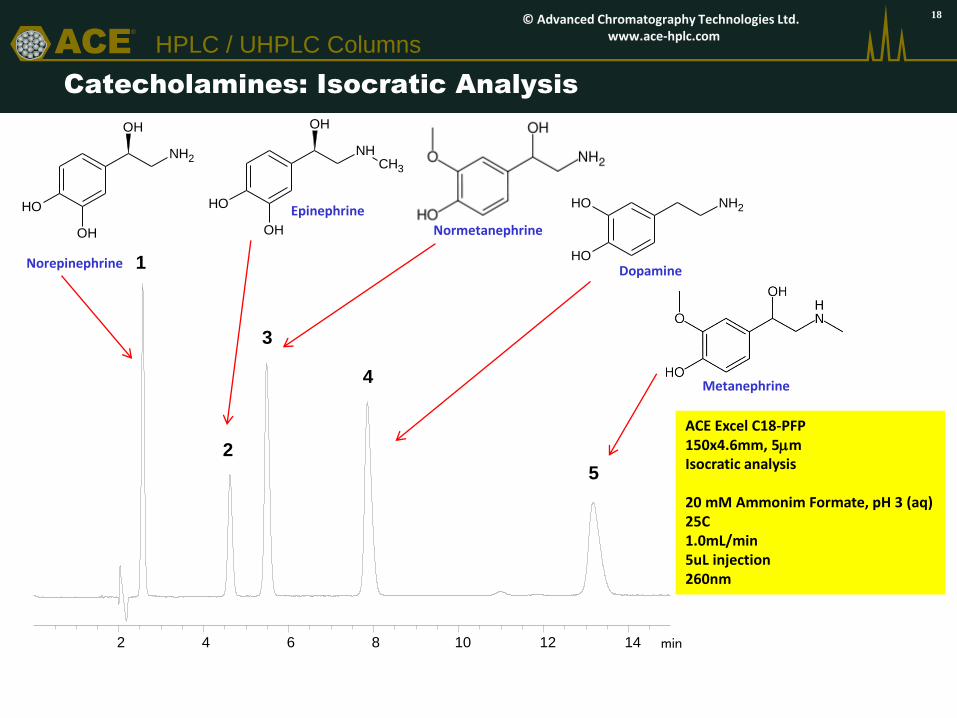
Catecholamines: Isocratic Analysis
ACE Excel C18-PFP 150x4.6mm, 5mm Isocratic analysis 20 mM Ammonim Formate, pH 3 (aq) 25C 1.0mL/min 5uL injection 260nm
18 © Advanced Chromatography Technologies Ltd. www.ace-hplc.com
OH
OH
NH
OH
CH3
OH
OH
NH2
OH
Norepinephrine
Epinephrine
Normetanephrine
OH
NH2OH
Dopamine
Metanephrine
min 2 4 6 8 10 12 14
1
2
3
4
5
ACE®
HPLC / UHPLC Columns
OH
OH
NH
OH
CH3
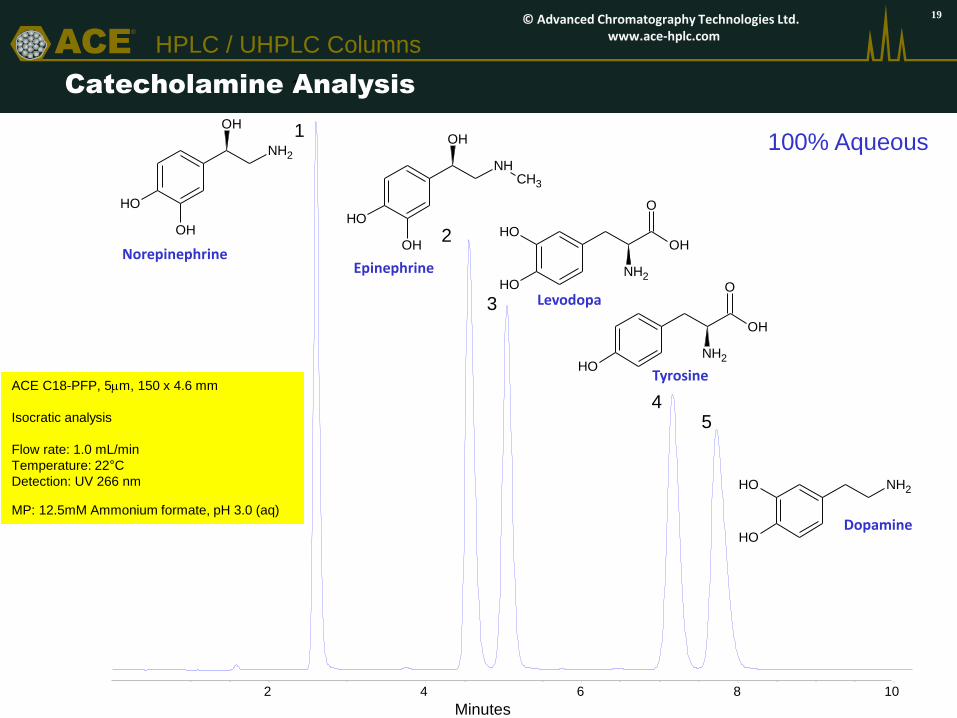
ACE C18-PFP, 5mm, 150 x 4.6 mm
Isocratic analysis
Flow rate: 1.0 mL/min
Temperature: 22°C
Detection: UV 266 nm
MP: 12.5mM Ammonium formate, pH 3.0 (aq)
2 4 6 8 10
1
3
2
4 5
Minutes
OH
OH
NH2
OH
OH
OH
OH
O
NH2
OH
OH
O
NH2
OH
NH2OH
Catecholamine Analysis
1 100% Aqueous
Norepinephrine Epinephrine
Levodopa
Tyrosine
Dopamine
19 © Advanced Chromatography Technologies Ltd. www.ace-hplc.com
ACE®
HPLC / UHPLC Columns
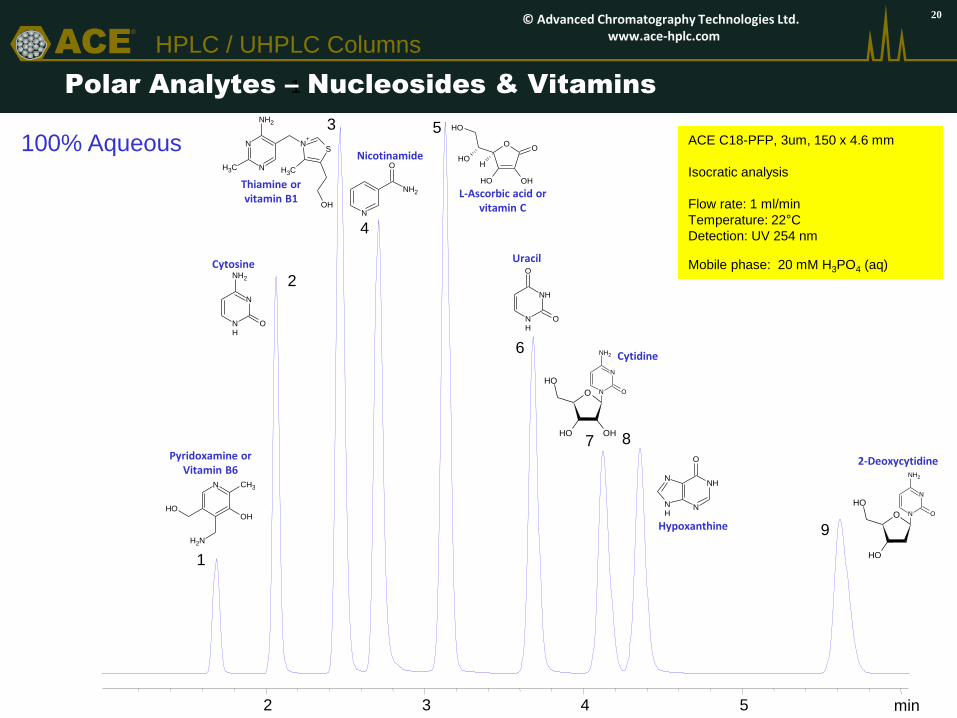
1 Polar Analytes – Nucleosides & Vitamins
ACE C18-PFP, 3um, 150 x 4.6 mm
Isocratic analysis
Flow rate: 1 ml/min
Temperature: 22°C
Detection: UV 254 nm
Mobile phase: 20 mM H3PO4 (aq)
min 2 3 4 5
1
2
3
4
5
6
7 8
9
100% Aqueous
N CH3
OH
NH2
OH
Pyridoxamine or Vitamin B6
N
NH2
NH
O
Cytosine
N
N N+
S
CH3CH3
NH2
OH
Thiamine or vitamin B1
N
NH2
ONicotinamide
OO
OHOH
OH
OHH
L-Ascorbic acid or vitamin C
NH
NH
O
O
Uracil
N
N
NH2
OO
OHOH
OH
Cytidine
NH
N
N
NH
O
Hypoxanthine
N
N
NH2
OO
OH
OH
2-Deoxycytidine
20 © Advanced Chromatography Technologies Ltd. www.ace-hplc.com
ACE®
HPLC / UHPLC Columns
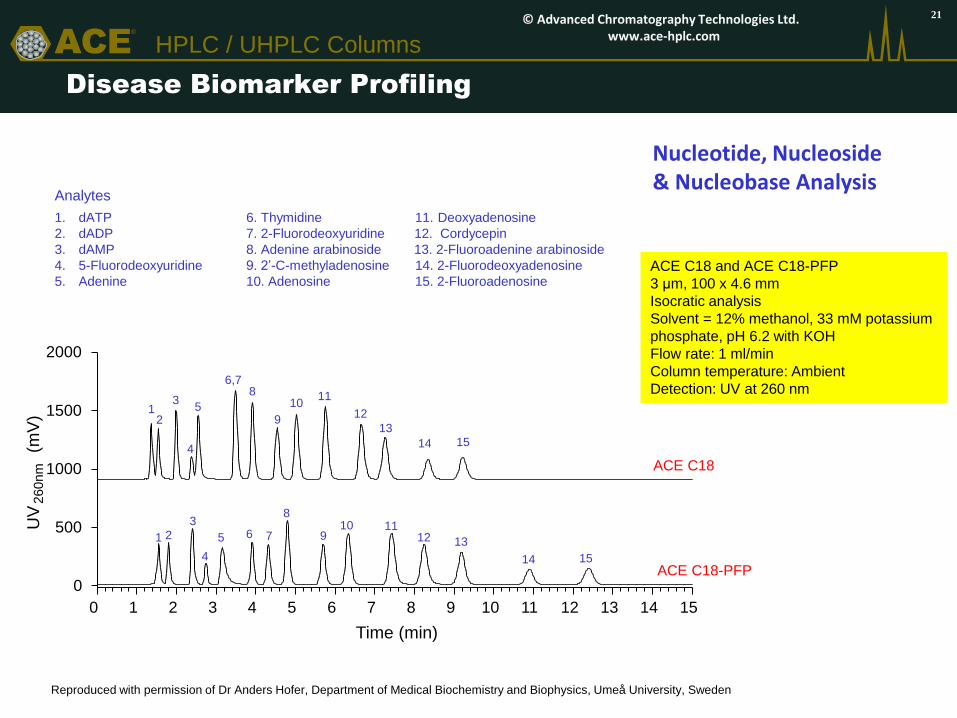
Disease Biomarker Profiling
Reproduced with permission of Dr Anders Hofer, Department of Medical Biochemistry and Biophysics, Umeå University, Sweden
ACE C18 and ACE C18-PFP
3 μm, 100 x 4.6 mm
Isocratic analysis
Solvent = 12% methanol, 33 mM potassium
phosphate, pH 6.2 with KOH
Flow rate: 1 ml/min
Column temperature: Ambient
Detection: UV at 260 nm
Analytes
1. dATP 6. Thymidine 11. Deoxyadenosine
2. dADP 7. 2-Fluorodeoxyuridine 12. Cordycepin
3. dAMP 8. Adenine arabinoside 13. 2-Fluoroadenine arabinoside
4. 5-Fluorodeoxyuridine 9. 2’-C-methyladenosine 14. 2-Fluorodeoxyadenosine
5. Adenine 10. Adenosine 15. 2-Fluoroadenosine
0 1 2 3 4 5 6 7 8 9 10 11 12 13 14 15
0
500
1000
1500
2000
1
1
2
2
3
3
5
5
8
8
6,7
12
7 6
4
11
9
10
13
4
16 17
Time (min)
UV
260nm
(m
V)
ACE C18
ACE C18-PFP 15 14
11
13 12
15
10 9
14
21
Nucleotide, Nucleoside & Nucleobase Analysis
© Advanced Chromatography Technologies Ltd. www.ace-hplc.com
ACE®
HPLC / UHPLC Columns
0 1 2 3 4 5 6 7 8 9
0
500
1000
1500
2000
dA
dA
dT
dT
dI
dI
dG
dG
dU
dU
dC
dC
ACE C18
ACE C18-PFP
Time (min)
UV
260nm
(
mV
)
0 1 2 3 4 5 6 7 8
0
500
1000
1500
2000
ACE C18
ACE C18-PFP
Ado
Ado
Guo
Guo
Urd
Urd
Cyd
Cyd
Time (min)
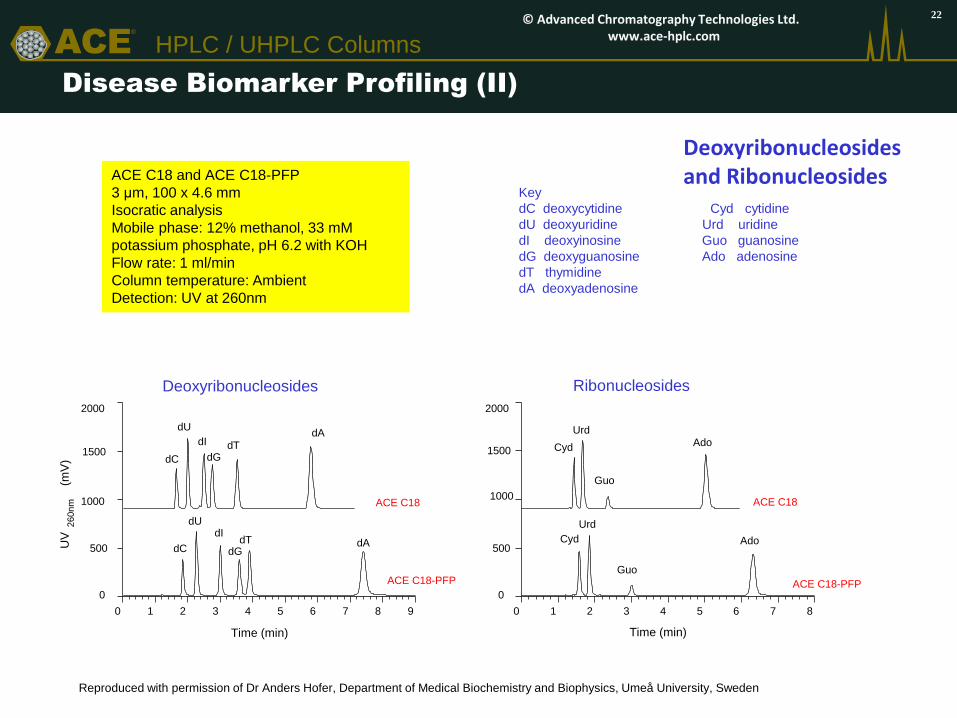
Disease Biomarker Profiling (II)
Reproduced with permission of Dr Anders Hofer, Department of Medical Biochemistry and Biophysics, Umeå University, Sweden
Deoxyribonucleosides Ribonucleosides
ACE C18 and ACE C18-PFP
3 μm, 100 x 4.6 mm
Isocratic analysis
Mobile phase: 12% methanol, 33 mM
potassium phosphate, pH 6.2 with KOH
Flow rate: 1 ml/min
Column temperature: Ambient
Detection: UV at 260nm
Key
dC deoxycytidine Cyd cytidine
dU deoxyuridine Urd uridine
dI deoxyinosine Guo guanosine
dG deoxyguanosine Ado adenosine
dT thymidine
dA deoxyadenosine
22
Deoxyribonucleosides and Ribonucleosides
© Advanced Chromatography Technologies Ltd. www.ace-hplc.com
ACE®
HPLC / UHPLC Columns
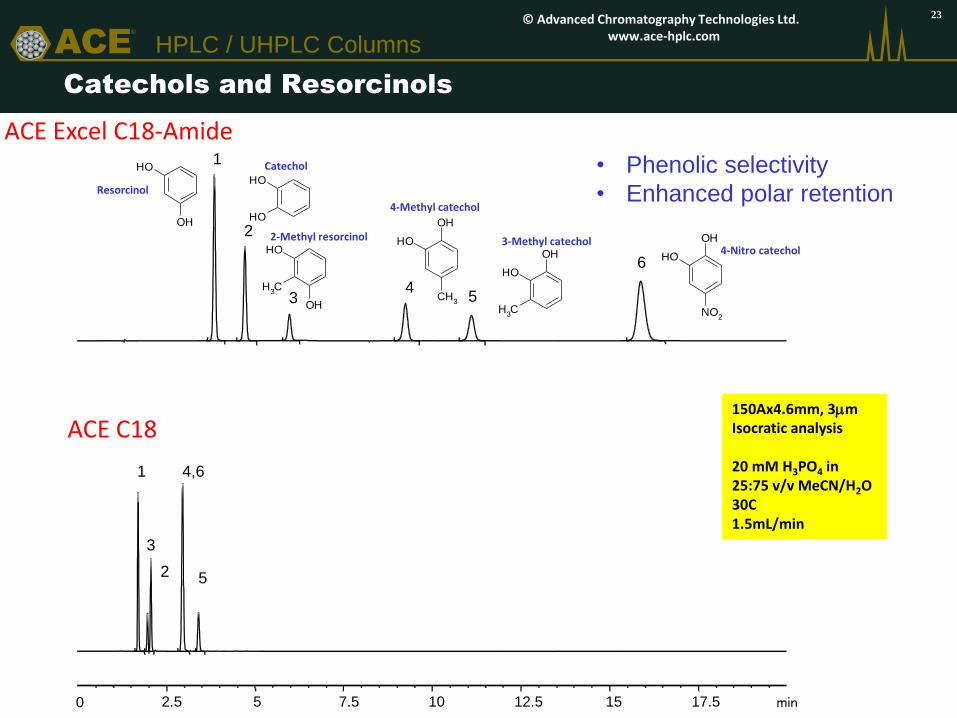
Catechols and Resorcinols
OH
OH
OH
OH
OH
OH
CH3
OH
CH3
OH
OH
OH
CH3
OH
OH
NO2
1
2
3 4
5
6
min 2.5 5 7.5 10 12.5 15 17.5
1
3
2
4,6
5
0
ACE C18 150Ax4.6mm, 3mm Isocratic analysis 20 mM H3PO4 in 25:75 v/v MeCN/H2O 30C 1.5mL/min
• Phenolic selectivity
• Enhanced polar retention
ACE Excel C18-Amide
Resorcinol
Catechol
2-Methyl resorcinol
4-Methyl catechol
3-Methyl catechol 4-Nitro catechol
23 © Advanced Chromatography Technologies Ltd. www.ace-hplc.com
ACE®
HPLC / UHPLC Columns
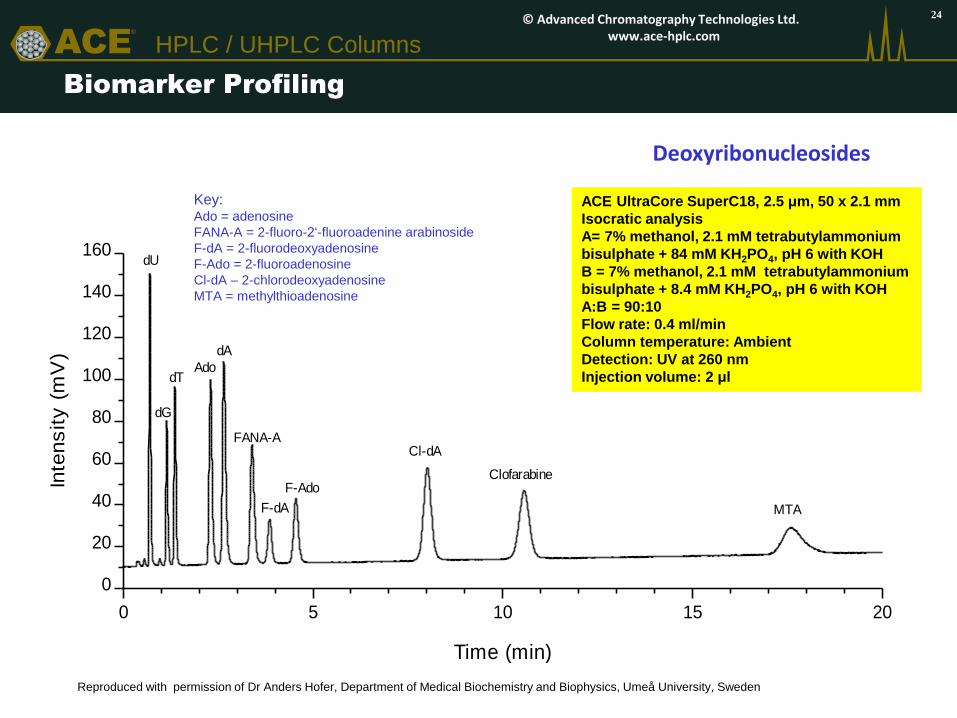
Biomarker Profiling
0 5 10 15 20
0
20
40
60
80
100
120
140
160
MTA
Clofarabine
Cl-dA
F-dA
F-Ado
dU
dG
dT
dA
Ado
FANA-A
Time (min)
Inte
ns
ity
(m
V)
ACE UltraCore SuperC18, 2.5 μm, 50 x 2.1 mm
Isocratic analysis
A= 7% methanol, 2.1 mM tetrabutylammonium
bisulphate + 84 mM KH2PO4, pH 6 with KOH
B = 7% methanol, 2.1 mM tetrabutylammonium
bisulphate + 8.4 mM KH2PO4, pH 6 with KOH
A:B = 90:10
Flow rate: 0.4 ml/min
Column temperature: Ambient
Detection: UV at 260 nm
Injection volume: 2 μl
Key: Ado = adenosine
FANA-A = 2-fluoro-2‘-fluoroadenine arabinoside
F-dA = 2-fluorodeoxyadenosine
F-Ado = 2-fluoroadenosine
Cl-dA – 2-chlorodeoxyadenosine
MTA = methylthioadenosine
Reproduced with permission of Dr Anders Hofer, Department of Medical Biochemistry and Biophysics, Umeå University, Sweden
24
Deoxyribonucleosides
© Advanced Chromatography Technologies Ltd. www.ace-hplc.com
ACE®
HPLC / UHPLC Columns
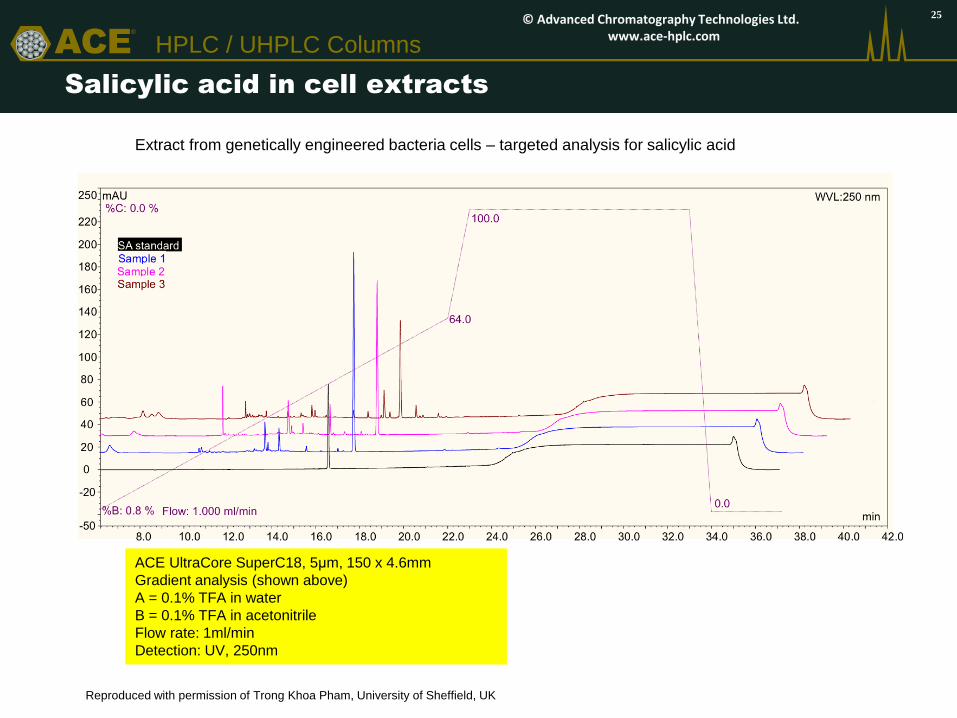
Salicylic acid in cell extracts
Extract from genetically engineered bacteria cells – targeted analysis for salicylic acid
Reproduced with permission of Trong Khoa Pham, University of Sheffield, UK
ACE UltraCore SuperC18, 5μm, 150 x 4.6mm
Gradient analysis (shown above)
A = 0.1% TFA in water
B = 0.1% TFA in acetonitrile
Flow rate: 1ml/min
Detection: UV, 250nm
© Advanced Chromatography Technologies Ltd. www.ace-hplc.com
25
ACE®
HPLC / UHPLC Columns
min 0 5 10 15 20 25 30
mAU
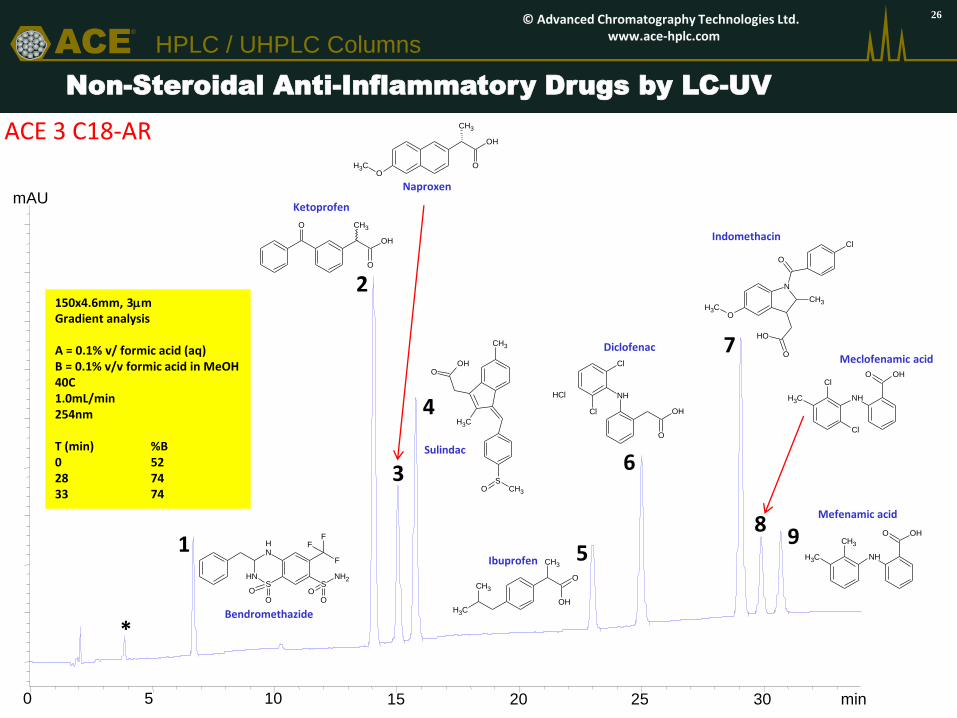
ACE 3 C18-AR
150x4.6mm, 3mm Gradient analysis A = 0.1% v/ formic acid (aq) B = 0.1% v/v formic acid in MeOH 40C 1.0mL/min 254nm T (min) %B 0 52 28 74 33 74
Non-Steroidal Anti-Inflammatory Drugs by LC-UV
1
2
4
3
5
6
7
8 9
*
NH
SNH
F
FF
S
O
NH2
OO O
Bendromethazide
OH
O
CH3O
Ketoprofen
OCH3
OH
O
CH3
Naproxen
CH3
OOH
CH3
SO CH3
Sulindac
CH3
CH3
CH3
OH
O
Ibuprofen
Cl
Cl
NH
OH
O
ClH
Diclofenac
N
OCH3
CH3
O
Cl
O
OH
Indomethacin
CH3
Cl
Cl
NH
OHO
Meclofenamic acid
CH3
CH3
NH
OHO
Mefenamic acid
26 © Advanced Chromatography Technologies Ltd. www.ace-hplc.com