
-pinene and limonene SOA yields - ACP
70
ACPD 8, 15595–15664, 2008 α-pinene and limonene SOA yields H. Saathoff et al. Title Page Abstract Introduction Conclusions References Tables Figures Back Close Full Screen / Esc Printer-friendly Version Interactive Discussion Atmos. Chem. Phys. Discuss., 8, 15595–15664, 2008 www.atmos-chem-phys-discuss.net/8/15595/2008/ © Author(s) 2008. This work is distributed under the Creative Commons Attribution 3.0 License. Atmospheric Chemistry and Physics Discussions This discussion paper is/has been under review for the journal Atmospheric Chemistry and Physics (ACP). Please refer to the corresponding final paper in ACP if available. Temperature dependence of yields of secondary organic aerosols from the ozonolysis of α -pinene and limonene H. Saathoff 1 , K.-H. Naumann 1 , O. M ¨ ohler 1 , ˚ A. M. Jonsson 2 , M. Hallquist 2 , A. Kiendler-Scharr 3 , Th. F. Mentel 3 , R. Tillmann 3 , and U. Schurath 1 1 Institute for Meteorology and Climate Research, Forschungszentrum Karlsruhe, Hermann-von-Helmholtz-Platz 1, 76344 Eggenstein-Leopoldshafen, Germany 2 Dept. of Chemistry, Atmospheric Science, Univ. of Gothenburg 412 96 G¨ oteborg, Sweden 3 Institute of Chemistry and Dynamics of the Geosphere 2, Forschungszentrum J ¨ ulich, 52425 J ¨ ulich, Germany Received: 15 July 2008 – Accepted: 16 July 2008 – Published: 15 August 2008 Correspondence to: H. Saathoff (harald.saathoff@imk.fzk.de) Published by Copernicus Publications on behalf of the European Geosciences Union. 15595
Transcript of -pinene and limonene SOA yields - ACP
ACPD8, 15595–15664, 2008
α-pinene andlimonene SOA yields
H. Saathoff et al.
Title Page
Abstract Introduction
Conclusions References
Tables Figures
J I
J I
Back Close
Full Screen / Esc
Printer-friendly Version
Interactive Discussion
Atmos. Chem. Phys. Discuss., 8, 15595–15664, 2008www.atmos-chem-phys-discuss.net/8/15595/2008/© Author(s) 2008. This work is distributed underthe Creative Commons Attribution 3.0 License.
AtmosphericChemistry
and PhysicsDiscussions
This discussion paper is/has been under review for the journal Atmospheric Chemistryand Physics (ACP). Please refer to the corresponding final paper in ACP if available.
Temperature dependence of yields ofsecondary organic aerosols from theozonolysis of α-pinene and limoneneH. Saathoff1, K.-H. Naumann1, O. Mohler1, A. M. Jonsson2, M. Hallquist2,A. Kiendler-Scharr3, Th. F. Mentel3, R. Tillmann3, and U. Schurath1
1Institute for Meteorology and Climate Research, Forschungszentrum Karlsruhe,Hermann-von-Helmholtz-Platz 1, 76344 Eggenstein-Leopoldshafen, Germany2Dept. of Chemistry, Atmospheric Science, Univ. of Gothenburg 412 96 Goteborg, Sweden3Institute of Chemistry and Dynamics of the Geosphere 2, Forschungszentrum Julich,52425 Julich, Germany
Received: 15 July 2008 – Accepted: 16 July 2008 – Published: 15 August 2008
Correspondence to: H. Saathoff ([email protected])
Published by Copernicus Publications on behalf of the European Geosciences Union.
15595
ACPD8, 15595–15664, 2008
α-pinene andlimonene SOA yields
H. Saathoff et al.
Title Page
Abstract Introduction
Conclusions References
Tables Figures
J I
J I
Back Close
Full Screen / Esc
Printer-friendly Version
Interactive Discussion
Abstract
Secondary organic aerosol (SOA) formation has been investigated as a function oftemperature and humidity for the ozone-initiated reaction of the two monoterpenesα-pinene (243–313 K) and limonene (253–313 K) using the 84.5 m3 aerosol chamberAIDA. This paper gives an overview of the measurements done and presents parame-5
ters specifically useful for aerosol yield calculations. The ozonolysis reaction, selectedoxidation products and subsequent aerosol formation were followed using several an-alytical techniques for both gas and condensed phase characterisation. The effectivedensities of the SOA were determined by comparing mass and volume size distribu-tions to (1.25±0.10) g cm−3 for α-pinene and (1.3±0.2) g cm−3 for limonene. The de-10
tailed aerosol dynamics code COSIMA-SOA proved to be essential for a comprehen-sive evaluation of the experimental results and for providing parameterisations directlyapplicable within atmospheric models. The COSIMA-assisted analysis succeeded toreproduce the observed time evolutions of SOA total mass, number and size distribu-tions by adjusting the following properties of two oxidation product proxies: individual15
yield parameters (αi ), partitioning coefficients (Ki ), vapour pressures (pi ) and effec-tive accommodation coefficients (γi ). For these properties temperature dependenceswere derived and parameterised. Vapour pressures and partitioning coefficients fol-lowed classical Clausius-Clapeyron temperature dependences. From this relationshipenthalpies of vaporisation were derived for the two more and less volatile product prox-20
ies of α-pinene: (59±8) kJ mol−1 and (24±9) kJ mol−1, and limonene: (55±14) kJ mol−1
and (25±12) kJ mol−1. The more volatile proxy components had a notably low enthalpyof vaporisation while the less volatile proxy components gave enthalpies of vaporisationcomparable with those of typical products from α-pinene oxidation, e.g. pinonaldehydeand pinonic acid.25
15596
ACPD8, 15595–15664, 2008
α-pinene andlimonene SOA yields
H. Saathoff et al.
Title Page
Abstract Introduction
Conclusions References
Tables Figures
J I
J I
Back Close
Full Screen / Esc
Printer-friendly Version
Interactive Discussion
1 Introduction
Biogenic sources dominate the global emissions of volatile organic compounds into theatmosphere. The annual emissions of biogenic volatile organic compounds (BVOC)without methane are estimated to range from 491 to 1150 Tg carbon, up to an orderof magnitude more than the estimated emissions from anthropogenic sources (Muller,5
1992; Guenther et al., 1995). Almost half of the BVOC mass emitted is isoprene andabout 11% are monoterpenes of which the highest fractions are α-pinene (25%) andlimonene (16%) (Kanakidou et al., 2005). Although isoprene is the most abundantBVOC its contribution to the formation of SOA has still a high uncertainty with esti-mated global annual aerosol masses ranging from 10 to 120 Tg (Matsunaga et al.,10
2005). The ozonolysis of monoterpenes is supposed to be one major source of sec-ondary organic aerosol (SOA) (Griffin et al., 1999b). The importance of monoterpeneoxidation to ambient SOA is further emphasised by observations of typical oxidationproducts from α-pinene oxidation e.g. pinonaldehyde, pinic and pinonic acids in ambi-ent aerosol (Calogirou et al., 1999; Yu et al., 1999b; Plewka et al., 2006; Cahill et al.,15
2006). Global transport models predict a substantial chemical production of organicaerosol in the free troposphere (Tsigaridis et al., 2005) and project an even higherfraction of SOA from oxidation of monoterpenes in future scenarios (Tsigaridis andKanakidou, 2007). However, the formulation of SOA formation and chemical composi-tion in these models needs to be improved. Recent field measurements demonstrate20
that SOA is a dominant fraction of aerosol mass in the free troposphere and that the-oretical estimations of SOA masses may be 1–2 orders of magnitude too low (Healdet al., 2005). Consequently, there have been a number of laboratory studies focusingon SOA yields, i.e. the mass of SOA produced per mass of reacted precursor. Thesedepend mainly on the organic precursor molecules and on the oxidants initiating the25
degradation (OH, O3, NO3). However, it has also been shown that other factors in-fluence the SOA yield, i.e. the mass of organic aerosol that can serve as solvent forsemivolatile organic compounds (Pankow, 1994; Odum et al., 1996), the acidity of and
15597
ACPD8, 15595–15664, 2008
α-pinene andlimonene SOA yields
H. Saathoff et al.
Title Page
Abstract Introduction
Conclusions References
Tables Figures
J I
J I
Back Close
Full Screen / Esc
Printer-friendly Version
Interactive Discussion
chemical reactions in the particulate phase (Jang et al., 2003; Gao et al., 2004; Iinumaet al., 2004; Kalberer et al., 2004), the humidity (Bonn et al., 2002; Jonsson et al.,2006), and the temperature that controls the phase equilibrium of the semivolatile or-ganics and also influences the reaction pathways leading to condensable molecules(Sheehan and Bowman, 2001; Takekawa et al., 2003; Jenkin, 2004; Offenberg et al.,5
2006; Pathak et al., 2007b; Johnson and Marston, 2008). There has been a consid-erable amount of work on aerosol yields from the ozonolyis of α-pinene or limonenenear room temperature (290–303 K), e.g. Hoffmann et al. (1997); Griffin et al. (1999a);Hoppel et al. (2001); Cocker et al. (2001); Berndt et al. (2003); Iinuma et al. (2004,2007); Presto and Donahue (2006); Northcross and Jang (2007); Pathak et al. (2007a);10
Johnson and Marston (2008); Shilling et al. (2008). Studies covering more extendedtemperature ranges are less abundant (Sheehan and Bowman, 2001; Takekawa et al.,2003; Offenberg et al., 2006; Pathak et al., 2007b). Obviously, temperature depen-dences are important in describing SOA formation under tropospheric conditions and– when properly evaluated – can improve our understanding of the physical and chem-15
ical mechanisms involved in the ozonolysis of monoterpenes. Experiments in largeenvironmental chambers covering a large temperature range are particularly suitedto derive parameterisations which are valid under real world conditions (Griffin et al.,2005; Simpson et al., 2007). The most common way of parameterising SOA data isbased on a two product mass partitioning model (Pankow, 1994; Odum et al., 1996;20
Griffin et al., 1999a). However, it has been shown that this type of parameterisationnot always gives unique and simple representations (Pathak et al., 2007a). For thatpurpose an option is to also use information from measured aerosol size distributionsto put further constrains on the parameters included in the models (Naumann, 20081).
This paper presents investigations on the yield of SOA material from the ozonol-25
ysis of α-pinene and limonene under simulated tropospheric conditions in the largeaerosol chamber AIDA (Saathoff et al., 2003) on time scales of up to 36 h and at tem-
1Naumann, K. H.: COSIMA-SOA – a model to simulate formation and dynamics of sec-ondary organic aerosol, J. Aerosol Sci., in preparation, 2008.
15598
ACPD8, 15595–15664, 2008
α-pinene andlimonene SOA yields
H. Saathoff et al.
Title Page
Abstract Introduction
Conclusions References
Tables Figures
J I
J I
Back Close
Full Screen / Esc
Printer-friendly Version
Interactive Discussion
peratures between 243 and 313 K. The data were obtained during three measurementcampaigns at the AIDA simulation chamber during October/November 2003 (SOA03),March 2005 (SOA05), and February 2006 (SOA06). The campaigns in 2005 and 2006were accomplished in an on-site collaboration between Forschungszentrum Karlsruhe,Forschungszentrum Julich, Leibniz Institute for Tropospheric Research Leipzig, and5
the University of Gothenburg. In order to evaluate the data and parameterise physi-cal aerosol properties a dynamic SOA model was developed and applied (Naumann,20081).
2 Experimental
The AIDA aerosol and cloud chamber of Forschungszentrum Karlsruhe (Saathoff et10
al., 2003) was used to investigate the formation of secondary organic aerosol (SOA)at a pressure of about 1000 hPa, temperatures between 243 and 313 K, and relativehumidities with respect to water between 0.02 and 78%. A typical experiment was per-formed with an excess concentration of ozone and step-wise addition of the organicreactant. Secondary organic aerosol (SOA) particles were generated by reacting (1S)-15
(-)-α-pinene (99%, Aldrich) and (S)-(-)-limonene (>97%, Merck) with ozone in the dark.The simulation chamber (Fig. 1) has a total volume of 84.5 m3, an upright cylindricalshape with a total surface area of 103 m2, and a cross sectional area of 12.6 m2. Be-fore each experiment the AIDA chamber was evacuated to typically 1 Pa total pres-sure, flushed two times with 10 hPa of synthetic air and filled to atmospheric pressure20
(∼1000 hPa) with humidified or dry synthetic air (low hydrocarbon grade, Basi). Toinhibit interference by OH radicals that are formed during the ozonolysis, 500 ppm ofcyclohexane (99.5%, Merck) was added as radical scavenger. In most experimentsozone was first filled into the chamber to measure the level of background particleformation before the terpenes were added. These particles were formed typically 15–25
20 min after the addition of ozone in varying number concentrations but with negligiblemass concentrations. Ozone was generated by a silent discharge generator (Semozon
15599
ACPD8, 15595–15664, 2008
α-pinene andlimonene SOA yields
H. Saathoff et al.
Title Page
Abstract Introduction
Conclusions References
Tables Figures
J I
J I
Back Close
Full Screen / Esc
Printer-friendly Version
Interactive Discussion
030.2, Sorbios) in mixing ratios of about 3% in pure oxygen and added to the cham-ber either directly or after dilution in a 1 l glass bulb with a flow of 5 SLM synthetic air.Defined amounts of the terpenes were added by evaporating 2–4 hPa into 1 and 2 lglass bulbs, diluting them with synthetic air, and flushing the contents into the chamberwith 10 SLM synthetic air for 3 min. In most experiments the terpenes were added in5
subsequent steps with increasing amounts to the excess of ozone. The next portion ofthe terpene was introduced into the chamber after the previously added amount hadbeen consumed. In this way the organic aerosol mass concentrations reached rela-tively stable values before the next portion was added. The experiments were donewithout special seed aerosol particles and therefore new particles were formed after10
the first addition of the terpene to the excess of ozone. The amount of ozone in thechamber was chosen to achieve >95% oxidation of the terpenes within about 2 h, butavoiding substantial new particle formation after the initial nucleation. Especially forlimonene and for the coldest temperatures, it was not always possible to avoid newparticle formation after the first addition, but the dominant mass fraction always con-15
densed on the pre-existing organic aerosol. The ozone was replenished typically oneor two times during the experiments to maintain the concentration levels required. Dueto its excellent temperature control and large size, the AIDA chamber enabled us tomake experiments at temperatures between 243 and 313 K and on time scales of up to36 h. A mixing fan in the chamber was running during all experiments providing typical20
95% mixing times of 3 min. The initial terpene concentrations, humidity ranges, andaverage temperatures are summarised in Tables A1 and A2. To investigate the roleof the OH scavenger, in two experiments 2-butanol (99.5%, Merck) was used insteadof cyclohexane and three experiments were done without radical scavenger. For ex-periments with α-pinene the temperature was varied between 313 and 243 K and for25
experiments with limonene between 313 and 253 K. In most experiments the humiditywas chosen to be close to or for practical reasons just a little below typical atmosphericconditions. In order to investigate the impact of water on the SOA yields the watermixing ratios were reduced to only a few ppm in some experiments.
15600
ACPD8, 15595–15664, 2008
α-pinene andlimonene SOA yields
H. Saathoff et al.
Title Page
Abstract Introduction
Conclusions References
Tables Figures
J I
J I
Back Close
Full Screen / Esc
Printer-friendly Version
Interactive Discussion
The typical instrumentation for SOA experiments and a schematic of the AIDA cham-ber are shown in Fig. 1. The dilution tracer SF6, ozone and α-pinene were measured byFTIR long path (254 m) absorption spectroscopy (IFS66/v, Bruker). Ozone was mea-sured simultaneously with an ozone monitor (O3-41M, Environment) connected to thechamber via a Teflon tube. Water concentrations were measured with a frost point mir-5
ror hygrometer (373LX, MBW) and in situ by absorption spectroscopy using a tuneablediode laser at 1370 nm. During the campaigns in 2005 and 2006 α-pinene, limonene,pinonaldehyde, and cylohexanone were measured with a proton transfer mass spec-trometer (PTR-MS, Ionicon). The PTR-MS was sampling from the AIDA chamber viaa stainless steel tube (4 mm inner diameter) through a Teflon filter (PTFE, 0.2µm pore10
size, Satorius) in the thermostated housing which could also be bypassed. The fil-ter removed aerosol particles from the sample flow to avoid possible evaporation ofaerosol particles in the inlet of the PTR-MS. The PTR-MS measurements were takenwith a time resolution of 5 min. The accuracies (1σ-error of the sensitivities) for thedetection of α-pinene, limonene, pinonaldehyde, and cylohexanone were ±6%, ±6%,15
±20%, and ±5%, respectively, during the 2005 experiments and ±4%, ±6%, ±22%,±5% for the 2006 experiments.
Particle number concentrations were measured with condensation particle counters(CPC 3022A and CPC 3025A, TSI) outside the thermostated housing via stainlesssteel tubes extending 35 cm into the AIDA chamber. The absolute uncertainty of the20
number concentrations was estimated to ±20% by comparison of the different CPCswith each other and with an electrometer (3068, TSI). Size distributions were obtainedusing two mobility particle sizers (DMA 3071 & CPC 3010, TSI), one outside (SMPS)and one inside the thermostated housing (DMPS). Typical time intervals for size distri-bution measurements inside the thermostated housing were 25 min (DMPS) and out-25
side 6 min (SMPS). Volume size distributions were normalised to the total number con-centrations and integrated to obtain particle volume concentrations. The uncertaintyof the particle volume concentrations obtained this way was estimated to ±30% takinginto account the uncertainty in the total number concentrations and the relative impor-
15601
ACPD8, 15595–15664, 2008
α-pinene andlimonene SOA yields
H. Saathoff et al.
Title Page
Abstract Introduction
Conclusions References
Tables Figures
J I
J I
Back Close
Full Screen / Esc
Printer-friendly Version
Interactive Discussion
tance of the larger particles. The particle mass and composition was measured with anaerosol mass spectrometer (Q-AMS, Aerodyne) connected via a stainless steel tubeto the simulation chamber. The sampling tube was kept at AIDA temperature up to theinlet valve of the AMS. AMS measurements were taken with a time resolution of 5 min.Comparison of mass size distributions (AMS) with volume size distributions (DMA) was5
used for SOA density evaluation. Changes in particle volatility were measured with avolatility tandem differential mobility analyser (VTDMA). This instrument and the mainresults of the volatility measurements are described in a recent publication (Jonsson etal., 2007). SOA particles were also collected on Teflon filters (PTFE, 47 mm diameter,0.2µm pore size, Satorius) via stainless steel tubes. Before the filter annular denuders10
coated with vacuum grease (Apiezon L) were used to remove gaseous organics. Thefilters were extracted with 6 ml of methanol and analysed by e.g. CE-MS. Details of theanalysis method can be found elsewhere (Iinuma et al., 2004). If not stated otherwiseuncertainties reported in this paper correspond to values of two sigma.
3 Modelling15
In order to provide a flexible framework for the detailed analysis of the experimentsoutlined above, the sectional aerosol behaviour code COSIMA (Naumann, 2003) hasbeen extended to simulate the formation and dynamics of secondary organic aerosolsystems in chambers (Naumann, 20081). The physical aerosol processes treated inCOSIMA-SOA include particle diffusion to the walls and sedimentational deposition,20
coagulation, condensation and evaporation, wall losses of trace gases and dilution ef-fects due to sampling. The chamber wall is assumed to act as an irreversible sink forparticles and trace gases. Transport of trace gas molecules to and away from the par-ticle surface is modelled kinetically under consideration of the Kelvin effect. Therefore,non-equilibrium situations, e.g. due to transport limitations, are properly accounted for.25
Dahneke’s approach was employed to interpolate between the continuum and freemolecular regimes (Dahneke, 1983). Since the current version of the model does not
15602
ACPD8, 15595–15664, 2008
α-pinene andlimonene SOA yields
H. Saathoff et al.
Title Page
Abstract Introduction
Conclusions References
Tables Figures
J I
J I
Back Close
Full Screen / Esc
Printer-friendly Version
Interactive Discussion
explicitly account for nucleation, simulations are initialised with a measured size distri-bution or by feeding a well defined particle mode into the control volume over a timeinterval corresponding to the experimental observation of new particle formation.
Detailed reaction schemes for the gas phase oxidation of α-pinene and limoneneover the whole range of temperatures between 243 and 313 K are not available.5
COSIMA-SOA so far simply assumes the formation of a certain number of effectivereaction products from a given set of precursors. There is no principal limitation re-garding the number of educts and products considered in the model. For each producti partitioning into the condensed phase the following properties have to be specified:molar mass MWi , mass stoichiometric yield αi , bulk vapour pressure p0
i , mass density10
ρi , surface tension σi , gas phase diffusivity Di , effective accommodation coefficient γi ,and a rate constant ki for its first order wall loss. Thermodynamically the condensedphase is treated as an ideal organic mixture since any extrapolation of e.g. activity pre-diction schemes like UNIFAC (Fredenslund et al., 1977) down to temperatures as lowas 243 K is associated with great uncertainties. While the chemical composition may15
vary with particle size, all particles within a given size bin are assumed to be equallycomposed.
The temperature dependent rate coefficients for the ozonolysis of α-pinene weretaken from the work of Atkinson (Atkinson et al., 1982; Atkinson, 1997). For the simu-lations of the limonene ozonolysis the rate coefficient and corresponding temperature20
dependence reported by Khamaganov and Hites (2001) was used. Based on this, thetime evolutions of the reactant and gaseous product concentrations as well as parti-cle size distribution, mass and number concentrations were calculated and comparedto the respective experimental results. This intercomparison allowed to establish theminimum number of effective product compounds required to reproduce the measured25
data within the experimental uncertainty and to determine the properties of the reactionproducts partitioning into the condensed phase.
While the kinetic modelling of product partitioning between gas and particulate phaseallows to account for non-equilibrium behaviour, it may significantly increase the numer-
15603
ACPD8, 15595–15664, 2008
α-pinene andlimonene SOA yields
H. Saathoff et al.
Title Page
Abstract Introduction
Conclusions References
Tables Figures
J I
J I
Back Close
Full Screen / Esc
Printer-friendly Version
Interactive Discussion
ical effort to be dealt with during the simulation runs. Therefore, a large amount of workstill relies on the assumption that in the course of SOA formation equilibrium is rapidlyestablished between the gas and the condensed phase. A very popular and convenientconcept has been devised by Pankow, see e.g. Seinfeld and Pankow (2003). In thisK-α approach the aerosol yield Y =Mo/∆MTerpene is given by5
Y =∑i
Yi = M0
∑i
αiKi
1 + KiM0(1)
where M0 represents the particle mass concentration produced from the reacted frac-tion ∆MTerpene of the total precursor mass concentration MTerpene and Ki denotes theequilibrium gas phase/particle partitioning coefficient of component i . The fact thatcomplex chemical processes – from the initial terpene oxidation step to the formation10
of condensable products – determine the yields of the individual product masses Mi isaccounted for by defining mass based stoichiometric yield coefficients αi ,
αi ·∆MTerpene = Mi and Mi = M li +Mg
i and Y ·∆MTerpene =∑
M li (2)
where M li and Mg
i denote the mass concentrations of component i in the particle andin the gas phase, respectively. Assuming ideal mixing, the temperature dependence of15
Ki can be represented by Eq. (3):
Ki =M l
i
Mgi ·M0
=10−6 · R · T〈MWO〉 · p0
i
=10−6 · R · T〈MWO〉 · B0
i
exp
(∆H0
i
RT
)[m3µg−1
](3)
Here R stands for the gas constant, T for the absolute temperature, and <MWo> for theaverage molar weight of the condensed matter. Further, B0
i denotes the preexponentialconstant in the Clausius-Clapeyron type expression for p0
i and ∆H0i is the enthalpy of20
vaporisation of component i . The description of αi as function of T requires detailedknowledge about the important temperature dependent steps in the degradation mech-anism which are still uncertain. The analysis of the temperature dependence of thesecoefficients will therefore remain beyond the scope of this paper.
15604
ACPD8, 15595–15664, 2008
α-pinene andlimonene SOA yields
H. Saathoff et al.
Title Page
Abstract Introduction
Conclusions References
Tables Figures
J I
J I
Back Close
Full Screen / Esc
Printer-friendly Version
Interactive Discussion
A potential drawback of the K-α approach associated with the neglect of non-equilibrium processes could arise from the size dependence of the vapour pressureof small particles due to the Kelvin effect. During the early stages of chamber ex-periments on SOA formation, for example, constant Ki values will definitively proveinadequate to describe the observed aerosol dynamics except for cases where seed5
aerosol is used to suppress new particle formation. Furthermore, product vapour pres-sures determined by fitting Eqs. (1) and (2) to measured Y vs. M0 data series will showa tendency towards overestimation. However, chamber studies focussing merely onaerosol yield and mass concentration may not be severely affected by the Kelvin ef-fect since the contribution of the small particle fraction to the overall mass of an aged10
aerosol is often negligible.
4 Results and discussion
All experiments with α-pinene and limonene considered in this paper are listed inTables A1 and A2, respectively. They include temperature, relative humidity, initialmonoterpene concentrations, corresponding peak concentrations of the particle mass,15
as well as SOA yields obtained for each time interval following the addition of terpene.The yields presented in Tables A1 and A2 were calculated using the parameterisa-tions derived from the COSIMA-assisted evaluation of the measurements as describedin detail below. Because significant amounts of newly formed condensable oxidationproducts were lost directly from the gas phase to the walls of the AIDA chamber, an20
effect which cannot be corrected for by straightforward procedures, it proved impos-sible to conduct an analogous analysis within the framework of the K-α approach forcomparison (cf. Sect. 4.1.1).
15605
ACPD8, 15595–15664, 2008
α-pinene andlimonene SOA yields
H. Saathoff et al.
Title Page
Abstract Introduction
Conclusions References
Tables Figures
J I
J I
Back Close
Full Screen / Esc
Printer-friendly Version
Interactive Discussion
4.1 SOA from α-pinene ozonolysis
The formation of SOA from the ozonolysis of α-pinene was investigated in the tem-perature range 243–313 K, for total organic aerosol mass concentrations ranging upto 820µg m−3, for water mixing ratios ranging from a few ppm to several 104 ppm,and with and without the radical scavengers cyclohexane and 2-butanol. The typical5
behaviour of the measured trace gas and particle concentrations is shown for one ex-periment at 303 K and for one at 243 K in Fig. 2 including a comparison with modelresults. The α-pinene concentrations rapidly decrease after addition to the excess ofozone. Since the time resolution of the α-pinene measurements is about 5 min themodel fit to data is initialised with the absolute amount of α-pinene added to the cham-10
ber. The kinetics of the α-pinene + ozone reaction was reproduced without significantdiscrepancies by extrapolating the temperature dependence of rate coefficients fromthe literature (Atkinson et al., 1982; Atkinson, 1997). A more thorough analysis ofthe low temperature kinetics of the α-pinene + ozone reaction will be given elsewhere(Tillmann et al., 2008b2).15
With respect to the particulate phase our analysis revealed that the assumption ofonly two effective reaction products (proxies) is sufficient to reproduce the experimentalresults well within their errors for all conditions considered in our study. In the followingproduct 1 will represent a compound with low volatility which can act as a solvent for asemivolatile product 2. For α-pinene the aerosol mass concentrations were calculated20
from experimental size distributions using a SOA material density of (1.25±0.1) g cm−3
as determined by comparing the size distributions measured with the AMS and SMPSinstruments (cf. Sect. 4.1.2.). The central plots in Fig. 2 show the observed and simu-lated time evolution of the particle number and mass concentrations as well as the pre-dicted mass concentrations of the two effective SOA forming reaction products of the25
2Tillmann, R., Saathoff, H., Brauers, T., Kiendler-Scharr, A., and Mentel, T. F.: Rate con-stants for the gas phase ozonolysis of α-pinene in the temperature range of 243–303 K, Phys.Chem. Chem. Phys., submitted, 2008b.
15606
ACPD8, 15595–15664, 2008
α-pinene andlimonene SOA yields
H. Saathoff et al.
Title Page
Abstract Introduction
Conclusions References
Tables Figures
J I
J I
Back Close
Full Screen / Esc
Printer-friendly Version
Interactive Discussion
α-pinene oxidation. In Fig. 3 measured size distributions (colour coded) are comparedwith modelled isolines of the corresponding number concentrations on a logarithmicscale. At 303 K nucleation only occurred after the first addition of the α-pinene to anexcess of ozone. At lower temperatures new particles were also formed in subsequentadditions. However, the dominant mass fraction always resulted from condensation5
onto SOA particles which had been formed after the first addition of α-pinene.At and above 303 K the initial growth rate of the SOA mass is comparable to the
decay rate of the α-pinene mass. Hence, the ozonolysis is the rate limiting step forthe SOA formation under these conditions. With decreasing temperature, however, theinitial rate of SOA mass formation gradually slows down compared to the decay of the10
precursor mass concentration. At 243 K the degradation of α-pinene proceeds approx-imately two times faster than the creation of condensed material. Although diffusionof condensable species from the gas phase to the surface of the particles becomesslower with decreasing temperature, the model analysis indicates that this effect can-not explain the observed retardation of SOA formation. More likely intermediate reac-15
tion products become more stable at lower temperatures, thus retarding the formationof condensable compounds. Furthermore, the predominant reaction pathways con-tributing to the SOA yield may differ from the kinetics at elevated temperatures. SinceCOSIMA-SOA does not contain a detailed chemistry module, the easiest way to ac-count for this effect is to artificially decrease the effective accommodation coefficients20
γi , thereby formally transforming the chemical delay into a pseudo transport limitation.As a consequence of this measure the γi are decreasing with decreasing temperaturein contrast to most observations and should not be regarded as physically meaningfulparameters (cf. Sect. 4.1.3). Please note, however, that the observed delay in SOA for-mation compared to the depletion of the precursor under cold conditions could prove a25
serious obstacle regarding the unambiguous interpretation of online measurements ofdMSOA/dMTerpene with respect to low temperature yields.
15607
ACPD8, 15595–15664, 2008
α-pinene andlimonene SOA yields
H. Saathoff et al.
Title Page
Abstract Introduction
Conclusions References
Tables Figures
J I
J I
Back Close
Full Screen / Esc
Printer-friendly Version
Interactive Discussion
4.1.1 Wall losses in the simulation chamber
In the course of the experiments trace gases and particles are inevitably lost to the alu-minium walls of the AIDA simulation chamber. This sink must be carefully accountedfor to allow a quantitative determination of SOA yields (Kroll et al., 2007). The formal-ism implemented into COSIMA to calculate size and temperature dependent diffusional5
and sedimentational particle wall loss rates is presented elsewhere (Naumann, 2003).It has been extensively validated against experimental results for compact and fractal-like particles (Bunz and Dlugi, 1991; Naumann, 2003; Wentzel et al., 2003). Ozonewall loss rates are most reliably determined by inspecting the decrease of the O3 con-centration in the absence of other reactants. However, in order to match the measured10
time evolution of the O3 concentration as close as possible, first order loss rate con-stants were fitted individually for each time interval initiated by adding α-pinene orozone into the chamber. The initial wall loss rate constant for ozone decreased from(3.9±2.1)×10−5 s−1 at 303 K (average over seven experiments) to (5.2±3.2)×10−6 s−1
at 243 K (average over four experiments). During one experiment the value always de-15
creased due to the passivation of the chamber walls for ozone loss. The observed min-imum was (2.4±1.3)×10−5 s−1 at 303 K (average over seven experiments) and rangedfrom effectively zero to 2.0×10⁻⁶ s−1 at 243 K. Generally, there is a tendency towardsreduced O3 wall losses for dry conditions compared to humid ones.
In comparison to the ozone case, quantifying the losses of the low and semivolatile20
oxidation products of α-pinene from the gas phase to the chamber wall is more com-plex. By adding the organic precursor to an excess of ozone, supersaturation of con-densable species is rapidly established in the gas phase, leading to a fast partitioninginto the particulate phase as manifested by the corresponding increase in SOA massconcentration (cf. Fig. 2). However, irreversible wall losses of semivolatile and, to a25
smaller extent, low volatile oxidation products always counteract the condensation pro-cess, eventually leading to evaporation of SOA material once the precursor has beensufficiently depleted. The corresponding decay of SOA mass concentration is most
15608
ACPD8, 15595–15664, 2008
α-pinene andlimonene SOA yields
H. Saathoff et al.
Title Page
Abstract Introduction
Conclusions References
Tables Figures
J I
J I
Back Close
Full Screen / Esc
Printer-friendly Version
Interactive Discussion
pronounced during time intervals initiated by adding large amounts of α-pinene intothe chamber. The calculated decay of airborne mass and the related decrease in par-ticle size proved to be quite sensitive to the wall loss rate coefficient of product 2. Thevalues thus determined for k2 ranged from 1.0×10⁻⁴ s−1 to 7.0×10⁻⁴ s−1 for differentexperiments. Due to the much lower vapour pressure of product 1 the effect of k1 on5
the time evolution of mass concentration and particle size is less pronounced, espe-cially at low temperatures. The model analysis revealed, however, that the simulatedevaporational loss rate of small particles and thus the calculated number concentra-tion also responds to significant changes of k1. Therefore, by considering mass andnumber concentrations as well as size distributions simultaneously it proved possible10
to obtain reasonable estimates for k1 ranging from 1×10⁻⁴ s−1 to 3×10⁻⁴ s−1. It shouldbe noted that neither k1 nor k2 showed a significant dependence on temperature.
The findings outlined above indicate that considerable amounts of condensable ma-terial are lost from the gas phase to the chamber wall in the course of an experiment.The bottom graphs in Fig. 2 display the computed time evolution of the SOA mass con-15
centration together with those of the integrated wall losses from gas and particulatephase, respectively, the latter being converted to units of mass per volume in order tofacilitate the comparison. At 303 K the amount of material lost from the gas phase is ofthe same order of magnitude as the observed SOA concentration. The associated lossterm is clearly dominated by the semivolatile product 2, reflecting both its higher vapour20
pressure and its larger yield coefficient. Modelling the 243 K scenario the simulationpredicts – except for the time interval following the first addition of α-pinene – a muchsmaller relative loss of condensable products from the gas phase to the wall which,however, still comprises a significant part of the total product yield. Again, the majorportion of the gas phase wall loss is attributed to product 2. For all experiments the25
calculated loss of particulate mass to the chamber walls turns out to be comparativelysmall. The contribution of this loss term to the mass balance is always much less thanthe uncertainty of the experimental airborne mass concentration as determined fromthe SMPS measurements. For a given amount of precursor it increases on an absolute
15609
ACPD8, 15595–15664, 2008
α-pinene andlimonene SOA yields
H. Saathoff et al.
Title Page
Abstract Introduction
Conclusions References
Tables Figures
J I
J I
Back Close
Full Screen / Esc
Printer-friendly Version
Interactive Discussion
scale with decreasing temperature due to the higher mass yields and the formation oflarger particles. Regarding the cases considered in Fig. 2 the diffusional and sedimen-tational particle wall loss rates increase roughly three and six times, respectively, goingfrom 303 K to 243 K.
Due to the large wall loss rate coefficients of the gaseous oxidation products in the5
AIDA chamber the transport rates of condensable matter from the gas phase to theparticle surface and to the wall become comparable by order of magnitude. As a re-sult, newly formed condensable material may be lost directly to the wall without everhaving partitioned into the SOA phase. Consequently, it proves very difficult to correctthe SOA yields determined by analysing the time evolution of the particulate mass con-10
centration for wall losses and evaporation effects in a straightforward manner. Pathaket al. (2007b) fitted a first order expression to the observed time evolution of the aerosolmass M(t) using measurements where more than 90% of the initial α-pinene had re-acted. The produced SOA was then calculated according to
SOA(t) = M(t) + k∫ t0M(t)dt −MS (4)15
with k representing the first order loss rate constant and MS the mass of pre-existingaerosol at time t=0, respectively. Other studies applied bi-exponential fits to the mea-sured M(t)-data, thereby representing both SOA formation and SOA losses by firstorder rate laws. These procedures rely on the assumption that only losses from theparticulate phase need to be accounted for. However, for the AIDA experiments pre-20
sented in this paper the presupposition of negligible gas phase wall losses of low andsemi-volatile organic species is definitely not fulfilled. The same could be true for otherchambers as well. Please note, however, that the aerosol mass wall losses reportedby Pathak et al. (2007b) (10 m3 Teflon reactor, k=0.07 to 0.48 h−1) are roughly 20 to200 times higher than in AIDA at comparable temperatures. If wall losses of condens-25
able products from the gas phase are much smaller in Teflon bags compared to ourestimates then particle removal could indeed be the most relevant loss process in SOAwork conducted similarly to the experiments described by Pathak et al. (2007b). In our
15610
ACPD8, 15595–15664, 2008
α-pinene andlimonene SOA yields
H. Saathoff et al.
Title Page
Abstract Introduction
Conclusions References
Tables Figures
J I
J I
Back Close
Full Screen / Esc
Printer-friendly Version
Interactive Discussion
case, the detailed process model analysis of SOA experiments, although much morecomplex, allows accounting for all relevant loss processes without suffering from thelimitations mentioned above. Consequently, knowing the gas phase and particle walllosses as function of time, the evolution of the total SOA yield is then readily evaluated.
4.1.2 Density of the organic aerosol from α-pinene ozonolysis5
Effective densities of the SOA were derived from comparisons of the mass distributionand volume distribution of the aerosol measured with an aerosol mass spectrometer(AMS) and an SMPS, respectively. While the AMS measures mass distribution versusvacuum aerodynamic diameter, the SMPS measures size distribution versus mobil-ity diameter. The SMPS size distribution can be converted into a volume distribution10
versus mobility diameter. The two diameters are related via:
ρeff =dva
dmρ0 (5)
where ρeff is the effective density, dva the vacuum aerodynamic diameter, dm the mobil-ity equivalent diameter and ρ0 is unit density (DeCarlo et al., 2004). When determiningthe effective density the following approach was used. Each volume and mass distribu-15
tion was fitted with a log normal distribution. An interpolation was used to account forthe different time resolutions of the two instruments. The mode diameters of the fitteddistributions were taken as dva and dm, respectively, to determine ρeff from Eq. (5).The method has been proven successful to better than ±10% (Bahreini et al., 2005).Figure 4 shows the effective densities of SOA formed by ozonolysis of α-pinene dur-20
ing four different experiments performed at different temperatures and at humid con-ditions. In the humid experiments no temperature dependence of the effective SOAdensity can be observed. All densities agree within the errors and show an averageSOA density of (1.25±0.10) g cm−3. This value is somewhat higher than the density of(1.04±0.09) g cm−3 (Wirtz and Martin-Reviejo, 2003) determined by combining SMPS25
and microbalance (TEOM) data at 299 K. It agrees well with densities obtained in other15611
ACPD8, 15595–15664, 2008
α-pinene andlimonene SOA yields
H. Saathoff et al.
Title Page
Abstract Introduction
Conclusions References
Tables Figures
J I
J I
Back Close
Full Screen / Esc
Printer-friendly Version
Interactive Discussion
experiments combining AMS and SMPS data, 1.19 g cm−3 (Bahreini et al., 2005) ,1.30 g cm−3 (Alfarra et al., 2006), and 1.23 g cm−3 reported by Shilling et al. (2008)for SOA mass concentrations above about 15µg m−3 but it is lower than the valueof ∼1.5 g cm−3 given by Kostenidou et al. (2007) that was also obtained from SMPS-AMS at 293 K. Under dry conditions a larger variability of the effective densities was5
observed. Possibly this could be due to shape factors being in effect in the absenceof water. However, shape factors significantly different from unity are not supportedby the model analysis of the aerosol dynamics. Since no independent determinationof the shape factor was possible in these experiments, the same average density of(1.25±0.10) g cm−3 was applied for the dry experiments as for the humid experiments.10
No significant change with time in the effective density of the SOA was observed forexperiments conducted during 24 h (SOA05-1).
4.1.3 Parameters of the two effective SOA forming products (proxies)
In the following the parameterisation optimised to reproduce the experimental resultswithin the framework of a two product model approach will be presented and discussed.15
The results of the COSIMA-assisted analysis regarding the mass stoichiometric yieldcoefficients αi , the partitioning coefficients Ki , the bulk vapour pressures p0
i , and theeffective accommodation coefficients γi are summarised in Tables 1a and 1b. Someexperiments listed in Table A1 were omitted in Tables 1a and 1b because the databasewas insufficient for an independent detailed model analysis. For example, the evalu-20
ation of single step experiments at low SOA mass concentrations often suffered fromambiguous quantification of the wall losses of condensable species. Not all parame-ters could be determined by fitting simulated time evolutions of particle size distribution,mass and number concentration to measured ones. The molar masses MW i , the sur-face tensions σi , and the gas phase diffusivities Di of the condensable product species25
had to be specified beforehand as outlined below.For all experiments molar masses for products 1 and 2 were taken as 186 g mol−1
15612
ACPD8, 15595–15664, 2008
α-pinene andlimonene SOA yields
H. Saathoff et al.
Title Page
Abstract Introduction
Conclusions References
Tables Figures
J I
J I
Back Close
Full Screen / Esc
Printer-friendly Version
Interactive Discussion
and 168 g mol−1, respectively. These values correspond to typical monomeric oxidationproducts of α-pinene like pinic acid and pinonaldehyde, respectively (Yu et al., 1999a;Jenkin, 2004). Using higher values as typical for dimers or trimers would result in re-duced molecular transport rates from the gas phase to the particle surface. However,the SOA yields predicted by COSIMA depend only weakly on the choice of these pa-5
rameters. Applying higher molar masses would lead to reduced molar yields in orderto retain the mass yield factors αi . These were fixed independently by matching thecalculated aerosol particle mass concentrations cM (t) to the respective observed ones.
The surface tensions of the two product proxies determine the magnitude of theKelvin effect which mainly affects the evaporation rates of small particles and therefore10
manifests itself in the time evolution of the particle number concentration cN . A param-eter analysis revealed that cN is both sensitive to variations of bulk vapour pressuresp0i and surface tensions σi . However, similar to the experiences reported by Bilde and
Pandis (Bilde and Pandis, 2001) we could not obtain reasonable results for the temper-ature dependence of σ1 and σ2 by fitting them to our experimental data simultaneously15
with the vapour pressures. Therefore we decided to conduct our simulations assum-ing constant surface tensions. For pinic acid a surface tension has been estimatedtheoretically to 34.22 dyn cm−1 (Cai and Griffin, 2005) and to (110±90) dyn cm−1 (Kochet al., 2000) from experimental data. Since product 1 exhibits a much lower vapourpressure than pinic acid (as will be discussed below), we consider it reasonable to20
apply an accordingly adjusted value for σ1. The value of σ1=80 dyn cm−1 adopted inour model runs resulted in good agreement between measured and calculated aerosolproperties. The value of 30 dyn cm−1 used for product 2 lies well within the range of20–40 dyn cm−1 typically observed for pure saturated organic liquids (Bilde and Pan-dis, 2001). For the gas phase diffusion coefficients of products 1 and 2 values in-25
creasing from 0.040 cm2 s−1 at 243 K to 0.056 cm2 s−1 at 313 K were calculated fromthe Lennard-Jones parameters provided by Bilde and Pandis (2001) using the correla-tion given in Poling et al. (2000).
The choice of the effective accommodation coefficients γi significantly affects particle
15613
ACPD8, 15595–15664, 2008
α-pinene andlimonene SOA yields
H. Saathoff et al.
Title Page
Abstract Introduction
Conclusions References
Tables Figures
J I
J I
Back Close
Full Screen / Esc
Printer-friendly Version
Interactive Discussion
growth kinetics and thus the predicted time evolutions of aerosol particle mass concen-tration and size distribution. Simulating their outdoor smog chamber experiments onthe photooxidation of m-xylene in the presence of NOx, Bowman et al. (1997) esti-mated γ to have a value between 0.1 and 1, with γ=0.2 resulting in a good fit to theirexperimental observations. This value has subsequently been adopted in other stud-5
ies, but many workers still prefer the limiting value 1.0. Considering product 1, wefind good agreement between measurements and simulations using γ1=0.19–0.30 fortemperatures T≥283 K (cf. Fig. 3b) in accordance with Bowman et al. (1997), whilesignificantly larger γ1 values resulted in overestimating the particle growth rate. Re-garding product 2, optimum simulation results were obtained with γ2=1.0 for T≥303 K.10
For temperatures around and below 253 K it proved necessary to reduce γ1 to 0.1. Amuch more pronounced temperature dependence was found for γ2 which decreasedto 0.01–0.03 for T=243 K. Of course, from a purely physical point of view one wouldexpect accommodation coefficients to increase with decreasing temperature. Here,however, the observed temperature dependencies of γ1 and γ2 are mainly reflecting15
the chemically induced low temperature retardation of SOA formation in relation to theconsumption of α-pinene as already outlined in Sect. 4.1. Therefore, in the context ofthis paper γ1 and γ2 have to be considered as effective quantities without well definedphysical meaning. The temperature dependent effective accommodation coefficientslisted in Table 1b should thus be useful with model approaches that do not attempt20
to consider resistances in the SOA formation channels within a more or less detailedchemical reaction scheme beyond the primary terpene oxidation step. Figure 5 showsthe temperature dependences of the vapour pressures (p1; p2) of the two effectiveSOA forming ozonolysis products (proxies) of α-pinene. Figure 6 shows the mass stoi-chiometric yields of the two effective SOA forming products (α1; α2) and the partitioning25
coefficients (K1; K2) as a function of temperature. The mass stoichiometric yield coeffi-cient α2 is increasing from about 0.2 above 300 K and approaching unity around 250 K.α2 shows much stronger temperature dependence than α1 and a different functionaldependence. The temperature dependence for α1 can be approximated with a linear
15614
ACPD8, 15595–15664, 2008
α-pinene andlimonene SOA yields
H. Saathoff et al.
Title Page
Abstract Introduction
Conclusions References
Tables Figures
J I
J I
Back Close
Full Screen / Esc
Printer-friendly Version
Interactive Discussion
fit while for α2 an almost exponential behaviour can be fitted. The physical meaningbehind this is however not established. The following parameterisations of the massstoichiometric yield coefficients (αi ) were derived from the individual experiments forthe temperature range between 243 and 313 K and for humid conditions:
α1 = (0.715 ± 0.138) − (0.0020 ± 0.0005) × T (6)5
α2 = (1200 ± 400) × exp(−T/(35 ± 2)) (7)
The sum of α1 and α2 may approach a maximum value of 1.25 at 243 K if we assumean average molar mass for the SOA of 171 g mol−1, i.e. a SOA composition of 17%product 1 with 186 g mol−1 and of 83% product 2 with 168 g mol−1. Please note that at243 K the SOA yield is at its theoretical limit and the exponential fit exceeds this limit10
by about 10%. However, considering estimated uncertainties of about ±30% for themass stoichiometric yield coefficients a further interpretation is not reasonable. Thevalue obtained in this work for α1=0.11 at 302 K is significantly lower than the value ofα1=0.239 reported by Cocker et al. (2001) but their value of α2=0.169 agrees withinthe uncertainties with our value of α2=0.22. Empirical fitting to a range of measured15
data led to values of α1=0.08 and α2=0.42 for 310 K (Svendby et al., 2008). Figures 5and 6b show that the temperature dependence of the vapour pressures and the cor-responding partitioning coefficients follows typical Clausius-Clapeyron behaviour. Thefollowing parameterisations of the vapour pressures (pi ) were derived from the individ-ual experiments for the temperature range 243–313 K and for humid conditions:20
lnp1[bar] = (0.79 ± 1.85) − (7234 ± 520)/T (8)
lnp2[bar] = −(9.32 ± 1.90) − (2875 ± 533)/T (9)
The partitioning coefficients of ideal mixtures are directly related to the vapour pres-sures via Raoult’s law (see Eq. 3). This is confirmed by the close agreement betweenthe corresponding slopes in Figs. 5 and 6b, but with opposite signs. The correspond-25
ing parameterisations of the partitioning coefficients (Ki ) for the temperature range15615
ACPD8, 15595–15664, 2008
α-pinene andlimonene SOA yields
H. Saathoff et al.
Title Page
Abstract Introduction
Conclusions References
Tables Figures
J I
J I
Back Close
Full Screen / Esc
Printer-friendly Version
Interactive Discussion
between 243 and 313 K and for humid conditions assuming negligible Kelvin effect areas follows:
lnK1[m3 µg−1]=−(28.7 ± 1.6) + ln T + (7098 ± 476)/T (10)
lnK2[m3 µg−1]=−(19.4 ± 1.2) + ln T + (2970 ± 545)/T (11)
The uncertainties estimated for p1 and K1 are ±50% for 313–273 K and ±100% for5
temperatures below this range. The uncertainties estimated for p2 and K2 are ±50%for 313–243 K. The values calculated in this work for K1=1.67 and K2=0.021 at 302 Kare significantly higher than the values of K1=0.056 and K2=0.0019 reported by Cockeret al. (2001). Empirical fitting to a range of measured data led to values of K1=0.5 andK2=0.005 for 310 K (Svendby et al., 2008) which are closer to the results from this10
work but still significantly lower. However, please note that such a direct comparisoncould prove inconclusive e.g. due to the explicit consideration of the Kelvin effect andnon-equilibrium behaviour in our analysis. Besides, there may be additional causes forthese differences that cannot be identified in a straightforward manner.
The vapour pressures extracted in the temperature range 243–313 K for the less and15
more volatile component range from 2.5×10⁻¹⁴ to 1.5×10⁻¹⁰ and 7×10⁻¹⁰ to 8.5×10⁻⁹
bar, respectively. At 303 K the vapour pressures of the less and more volatile SOAforming compounds are within the same order of magnitude and comparable to vapourpressures at 296 K of pinic acid (3.2×10⁻¹⁰ bar), cis-pinonic acid (7×10⁻¹⁰ bar) andtrans-norpinic acid (1.3×10⁻⁹ bar) (Bilde and Pandis, 2001), but well below the vapour20
pressures of the semivolatile compound pinonaldehyde. The vapour pressure of pinon-aldehyde was measured to be 5.1×10⁻⁵ bar at 298 K and 7×10⁻⁶ bar at 243 K (Hal-lquist et al., 1997) but a recent analysis resulted in lower values of 10−7 to 10−9 bar at303 K (Tillmann et al., 2008a3). Consequently, either of the two effective SOA forming
3Tillmann, R., Kiendler-Scharr, A., Mentel, T., Jonsson, A. M., Hallquist, M., Iinuma, Y.,and Saathoff, H.: Water and Temperature Dependence of Pinonaldehyde and OH yields fromOzonolyis of a-pinene, Atmos. Chem. Phys. Discuss., in preparation, 2008a.
15616
ACPD8, 15595–15664, 2008
α-pinene andlimonene SOA yields
H. Saathoff et al.
Title Page
Abstract Introduction
Conclusions References
Tables Figures
J I
J I
Back Close
Full Screen / Esc
Printer-friendly Version
Interactive Discussion
products may represent the product class of acid or diacid products while it is unreal-istic to compare with the much more volatile compounds with only carbonyl functionalgroups (Capouet and Muller, 2006). However, this is rather speculative, especiallysince several more oxidised or dimeric/oligomeric compounds have been proposed tobe involved in SOA formation (Kalberer et al., 2004; Hamilton et al., 2008).5
The value of (24±9) kJ mol−1 determined here for the effective evaporation en-thalpy of the more volatile SOA component (proxy) in the two product model is muchlower than the evaporation enthalpies of typical products produced in oxidation ofα-pinene e.g. pinonaldehyde (75.5±5.6) kJ mol−1 (Hallquist et al., 1997), pinic acid(109±21) kJ mol−1 (Bilde and Pandis, 2001), trans-norpinic acid, (42±51) kJ mol−1
10
(Bilde and Pandis, 2001), and straight chain C3-C9 diacids 91–184 kJ mol−1 (Bildeet al., 2003; Chattopadhyay and Ziemann, 2005). The value is also lower than effectiveevaporation enthalpies of about 33–43 kJ mol−1 determined for SOA from the photoox-idation of α-pinene (Offenberg et al., 2006), values of 42–104 kJ mol−1 as estimatedby Sheehan and Bowman (2001), and a value of 38 kJ mol−1 obtained by analysis of15
datasets from 7 different groups (Svendby et al., 2008). One possible reason for the lowvalue of the effective evaporation enthalpy determined in this paper is that the compo-sition of the group of compounds represented by proxy 2 is changing with temperature.Using the PTR-MS measurements we could indeed observe an increasing partitioningof pinonaldehyde into the condensed phase with decreasing temperature and hence a20
larger contribution to the semivolatile SOA fraction (Tillmann et al., 2008a3). Includingpinonaldehyde in our model analysis with the molar yields determined by Tillmann etal. (2008a)3 but relying on the vapour pressure parameterisation derived by Hallquistet al. (1997) leads to a stronger temperature dependence of the vapour pressure ofthe remaining effective semivolatile SOA component as reflected by an increase of the25
evaporation enthalpy to about 34 kJ mol−1. While closer to the expected range thisvalue is still low. On the other hand, applying the vapour pressure recently estimatedby Tillmann et al. (2008a)3, which is about two to three orders of magnitude smallerthan the value reported by Hallquist et al. (1997), the results are almost consistent with
15617
ACPD8, 15595–15664, 2008
α-pinene andlimonene SOA yields
H. Saathoff et al.
Title Page
Abstract Introduction
Conclusions References
Tables Figures
J I
J I
Back Close
Full Screen / Esc
Printer-friendly Version
Interactive Discussion
the two product approach. However, since the vapour pressure of pinonaldehyde stillseems to have substantial uncertainty this compound was not included explicitly intothe model analysis presented in this paper. Clearly, the value of (59±8) kJ mol−1 de-termined here for the evaporation enthalpy of the less volatile SOA component in thetwo product model is more in line with the evaporation enthalpies of the typical com-5
pounds from α-pinene oxidation. In conclusion, the vapour pressures and evaporationenthalpies derived in this work for the two SOA forming proxy components are in linewith real compound properties with the exception of the low evaporation enthalpy ofthe more volatile component.
4.1.4 Aerosol yields as function of aerosol mass and temperature10
Using the empirical correlations (6), (7), (10), and (11) fitted to the αi and Ki of thetwo effective SOA forming products of the α-pinene oxidation, Eq. (1) can be appliedto calculate SOA yields for temperatures in the range between 243 and 313 K assum-ing equilibrium conditions and negligible Kelvin effect. In cases where small particlescontribute significantly to the SOA mass concentration Eq. (1) will provide an upper15
limit for the true yield. Figure 7 shows these calculated yields over the SOA massconcentration range from 1 and 1000µg m−3 in comparison with yields determined byusing the parameters representative of individual experiments and selected data fromthe literature. From several previous studies on α-pinene ozonolysis, e.g. Hoffmannet al. (1997); Griffin et al. (1999a); Gao et al. (2004); Iinuma et al. (2004); Presto20
and Donahue (2006); Song et al. (2007) the data by Cocker et al. (2001), Pathak etal. (2007b), and Shilling et al. (2008) were selected for comparison over the extendedtemperature, concentration and humidity ranges in our study. All data shown in Fig. 7were normalised to a density of 1.25 g cm−3 for comparison. In order to keep this com-parison as general as possible we do not account for the potential influence of the25
Kelvin effect which depends strongly on the specific conditions of the scenario underconsideration, e.g. the particle size distribution. Please note, that we did not correct theorganic aerosol mass for its water content. This seems to be reasonable since AMS
15618
ACPD8, 15595–15664, 2008
α-pinene andlimonene SOA yields
H. Saathoff et al.
Title Page
Abstract Introduction
Conclusions References
Tables Figures
J I
J I
Back Close
Full Screen / Esc
Printer-friendly Version
Interactive Discussion
measurements show average water to SOA mass ratios ranging from 0.06 (303 K) to0.03 (253 K) for humid conditions and close to zero for dry conditions (Tillmann et al.,2008a3). The approximation MO≈MO+H2O should therefore be valid especially for thelower temperatures investigated. The yields determined by Cocker et al. (2001) andPathak et al. (2007b) are in general agreement with the results obtained in this work5
but show a little stronger dependence on the organic particle mass concentration. Theresults of Pathak et al. (2007b) show a weaker temperature dependence compared tothis work. The SOA yields obtained at 298 K for concentrations 1–40µg m−3 by Shillinget al. (2008) are about 50% higher. The deviation between parameterisation and indi-vidual yields visible in Fig. 7 especially for the lowest and highest temperatures reflects10
the uncertainties of the yield determination. The parameterisation has also been usedto construct a temperature dependence plot at constant organic aerosol mass concen-tration (10µg m−3), see Fig. 8.
4.1.5 Role of humidity and OH scavenger
During this work a substantial impact of the humidity on the SOA yields from α-pinene15
ozonolysis was only observed for the lowest temperatures investigated. The SOAyields for experiments under very dry conditions at 253 K are significantly lower thancorresponding humid experiments (Fig. 7). This observation can’t be explained bywater uptake of the SOA for the experiments at higher relative humidities. The AMSshows water contents of the SOA particles of 2–3 wt% for temperatures between 25320
and 243 K under humid conditions and essentially zero for the dry cases. For highertemperatures water contents of the SOA particles are below 3–6 wt% (Tillmann et al.,2008a3). The observed differences in SOA yields for low temperatures are therefore notdue to water uptake but more likely due to the influence of water on the gas phase ox-idation pathways. This is supported by the observation of substantially reduced yields25
for pinonaldehyde at dry conditions (Tillmann et al., 2008a3). The insignificant influ-ence of humidity at 243 K may be explained by the small difference in absolute watervapour concentrations between the dry and humid experiment. The present result of
15619
ACPD8, 15595–15664, 2008
α-pinene andlimonene SOA yields
H. Saathoff et al.
Title Page
Abstract Introduction
Conclusions References
Tables Figures
J I
J I
Back Close
Full Screen / Esc
Printer-friendly Version
Interactive Discussion
an insignificant water effect at 303 K is in contrast to the pronounced positive watereffect observed using a flow reactor (Jonsson et al., 2006). The two systems are, how-ever, rather different where the flow reactor study is done at low concentrations, using2-butanol as OH scavenger and a much shorter residence time (270 s). In addition,results from a smog chamber study done at room temperature showed a positive ef-5
fect of water at low reactant concentrations while an insignificant water dependencewas observed at high reactant concentrations (Bonn et al., 2002). The effect of waterobserved at low temperatures is in line with observations in a flow reactor where apositive effect has been observed (Jonsson et al., 2008b). Since the water effect islarger at lower temperatures where the difference in absolute water concentrations is10
smaller, a physical uptake by SOA seems more likely than an impact of water vapouron chemical kinetics. However, as has been pointed out above, AMS measurementsindicate that the physical uptake was minor for all conditions. When it comes to waterinfluencing the chemical composition of SOA this was further supported by volatilitymeasurements of the aerosol as shown in a previous publication for the experiments at15
253 K (Jonsson et al., 2007) and by PTR-MS-measurements of the water dependentpartitioning of pinonaldehyde into the particulate phase (Tillmann et al., 2008a3).
It was suggested that the use of different OH scavengers can affect the ozonolysismechanism and thereby the SOA yield (Jenkin, 2004; Keywood et al., 2004; Dochertyet al., 2005). As can be seen from the data in Table A1 and Fig. 9 the SOA yields in the20
presence of cyclohexane or 2-butanol as radical scavengers are the same within theirerror limits, with slightly higher yields in the presence of 2-butanol. For experimentswithout OH scavenger the effect was pronounced and the SOA yield was higher bya factor of about 2. The effects at 303 K thus resemble previous observations for α-pinene and other endocyclic terpenes (Keywood et al., 2004; Docherty et al., 2005;25
Iinuma et al., 2005; Jonsson et al., 2008a4). At 243 K the influence of the scavenger
4Jonsson, A. M., Hallquist, M., and Ljungstrom, E.: Influence of OH scavenger on the WaterEffect on Secondary Organic Aerosol Formation from Ozonolysis of Limonene, ∆3-Carene andα-Pinene, Envirion. Sci. Technol., submitted, 2008a.
15620
ACPD8, 15595–15664, 2008
α-pinene andlimonene SOA yields
H. Saathoff et al.
Title Page
Abstract Introduction
Conclusions References
Tables Figures
J I
J I
Back Close
Full Screen / Esc
Printer-friendly Version
Interactive Discussion
shows the same trend but the differences in SOA yield, especially compared to the casewithout scavenger, seem to be smaller at low temperatures (Jonsson et al., 2008b)although Tillmann et al. (2008a)3 provide clear evidence that OH radicals are formedin the ozonolysis reaction of α-pinene even at the lowest temperatures.
4.2 SOA from limonene ozonolysis5
The formation of SOA from the ozonolysis of limonene was investigated in the tem-perature range 253–313 K, for total organic aerosol mass concentrations ranging upto about 740µg m−3, and for water mixing ratios ranging from a few ppm to several104 ppm. The typical behaviour of the measured trace gas and particle concentra-tions as shown in Figs. 10 and 11 is comparable to those observed for α-pinene. The10
limonene concentrations rapidly decrease after addition to the excess of ozone. Thekinetics of the limonene + ozone reaction was reproduced without significant discrep-ancies extrapolating the temperature dependence of the rate coefficients from the lit-erature (Khamaganov and Hites, 2001). In contrast to the experiments with α-pineneparticle nucleation occurred already for lower ozone to limonene ratios. At 303 K signif-15
icant new particle formation occurred only at the first addition of limonene whereas at253 K new particles were also formed in all subsequent steps. However, the dominantmass fraction always condensed on those particles which had formed in the first step.The limonene data were analysed in the same way as described for α-pinene usingthe COSIMA-SOA model. The wall loss correction for the limonene experiments did20
not show significant differences compared to the α-pinene experiments. The results onSOA from limonene are described and summarised below with respect to the density,physical parameters derived for the two components and the corresponding aerosolyields.
15621
ACPD8, 15595–15664, 2008
α-pinene andlimonene SOA yields
H. Saathoff et al.
Title Page
Abstract Introduction
Conclusions References
Tables Figures
J I
J I
Back Close
Full Screen / Esc
Printer-friendly Version
Interactive Discussion
4.2.1 Density of the organic aerosol from limonene ozonolysis
The scatter in effective densities is larger in the case of SOA from limonene than forSOA from α-pinene. No simple relation was found between effective density and tem-perature. Taking into account the larger scatter in comparison with the densities derivedfor SOA from α-pinene an average density of (1.3±0.2) g cm−3 was chosen for the data5
evaluation in this paper. This is in agreement with a value of (1.3±0.09) g cm−3 (Wirtzand Martin-Reviejo, 2003) which was obtained by combining SMPS and TEOM data at299 K but lower than the value of (1.56±0.1) g cm−3 (Kostenidou et al., 2007) obtainedby combining AMS and SMPS data at 288 K. The effective density of limonene SOAexhibits a dependence on elapsed time which is correlated with a change in the frac-10
tional abundance of m/z=44 in the aerosol mass spectral patterns. Typically m/z=44 isconsidered a marker for the oxidized fraction of the organic aerosol OOA (Zhang et al.,2005). Mass spectral properties of the SOA and its relation to chemical and physicalproperties will be discussed in more detail in a separate paper.
4.2.2 Parameters of two effective SOA forming products15
Using the COSIMA-SOA model the parameters for two effective components were ob-tained by fitting the model to the trace gas and particle concentrations as well as thesize distributions. Tables 2a and 2b summarise the parameters determined for the dif-ferent experiments with limonene. The experimental conditions and calculated yieldsare summarised in Table A2. Not all experiments listed in Table A2 provided a database20
sufficient for a detailed model analysis. In the model analysis the same values as forthe experiments with α-pinene were used for surface tension, diffusion coefficients andmolecular mass of the two components. Also for limonene the values of the effectiveaccommodation coefficient for the more volatile component are low at low temperature(∼253 K) which again is emphasising the slower oxidation kinetics at this tempera-25
ture. Figure 12 shows the temperature dependence of the vapour pressures (p1; p2)of the two effective SOA forming products of the ozonolysis of limonene while Fig. 13
15622
ACPD8, 15595–15664, 2008
α-pinene andlimonene SOA yields
H. Saathoff et al.
Title Page
Abstract Introduction
Conclusions References
Tables Figures
J I
J I
Back Close
Full Screen / Esc
Printer-friendly Version
Interactive Discussion
shows the yields of the two effective SOA forming products (α1; α2) and the partition-ing coefficients (K1; K2). In contrast to the α-pinene case the mass stoichiometric yieldcoefficient of the non-volatile component in the two product model has a positive tem-perature dependence. The coefficient of the volatile component increases from about0.4 up to 1 with the temperature decreasing from 313 to 253 K. For limonene the de-5
pendencies are approximately linear in the studied temperature range for both effectiveSOA components. Note however, that α2 appears to be humidity dependent at lowtemperatures. The parameterisations of the mass stoichiometric yield coefficients (αi )derived from the individual experiments are valid for the temperature range 253–313 Kand for humid conditions:10
α1 = −(0.395 ± 0.203) + (0.0019 ± 0.0007) × T (12)
α2 = (3.53 ± 1.32) − (0.010 ± 0.004) × T (13)
The uncertainties for α1 are estimated to ±60% for 273–253 K and ±30% for temper-atures above. The uncertainties for α2 are estimated to ±30% for 313–253 K. Thevapour pressures for the two effective SOA forming products are given in Table 2b15
and the resulting temperature dependence is shown by the Clausius-Clapeyron plotin Fig. 12. The following parameterisations of the vapour pressures (pi ) were derivedfrom the individual experiments for the temperature range 253–313 K and for humidconditions:
lnp1[bar] = −(1.6 ± 2.9) − (6613 ± 831)/T (14)20
lnp2[bar] = −(9.2 ± 2.5) − (3013 ± 715)/T (15)
These equations provide vapour pressures in the temperature range 253–313 K forthe less and more volatile component ranging from 8.5×10⁻¹³ to 1.4×10⁻¹⁰ bar and7×10−10 to 7×10⁻⁹ bar, respectively. The following parameterisations of the partitioning
15623
ACPD8, 15595–15664, 2008
α-pinene andlimonene SOA yields
H. Saathoff et al.
Title Page
Abstract Introduction
Conclusions References
Tables Figures
J I
J I
Back Close
Full Screen / Esc
Printer-friendly Version
Interactive Discussion
coefficients (Ki ) were derived from the individual experiments for the temperature range253–313 K and for humid conditions:
lnK1[m3 µg−1]=−(26.7 ± 2.2) + ln T + (6580 ± 732)/T (16)
lnK2[m3 µg−1]=−(20.0 ± 2.2) + ln T + (3240 ± 643)/T (17)
The uncertainties estimated for p1 and K1 are ±50% for 313–273 K and ±100% for tem-5
peratures below. The uncertainties estimated for p2 and K2 are ±50% for 313–253 K.Combining Eqs. (1), (12), (13), (16), (17) allows to calculate average SOA yields forthe limonene ozonolysis under humid conditions in the given temperature range. InTable A2 yield values calculated this way are compared to values calculated usingEq. (1) and the stoichiometric and partitioning coefficients obtained for the individual10
experiments (Table 2a). The value of (25±12) kJ mol−1 determined here for the ef-fective evaporation enthalpy of the volatile SOA component in the two product modelis comparable to the evaporation enthalpy for the corresponding α-pinene componentand also much lower than the evaporation enthalpies of reference compounds as dis-cussed for α-pinene. In addition, the evaporation enthalpy of the low volatility SOA15
component in the two product model of (55±14) kJ mol−1 resembles the evaporationenthalpy of (59±8) kJ mol−1 for the low volatility SOA component of α-pinene.
4.2.3 Aerosol yields as function of aerosol mass and temperature
Using the functions fitted to the parameters of the two effective SOA forming productsof the limonene ozonolysis Eq. (1) can be used to calculate SOA yields for tempera-20
tures in the range between 253 and 313 K and for organic aerosol masses between1 and 1000µg m−3. We assume furthermore that the SOA from limonene does notinclude significant amounts of water in agreement with results of AMS measurementsshowing that the water content of the SOA is 6 wt% or lower. Figures 14 and 15 showthe average and individual yields of SOA from limonene for selected temperatures as25
function of the organic aerosol mass concentration, and as function of temperature for15624
ACPD8, 15595–15664, 2008
α-pinene andlimonene SOA yields
H. Saathoff et al.
Title Page
Abstract Introduction
Conclusions References
Tables Figures
J I
J I
Back Close
Full Screen / Esc
Printer-friendly Version
Interactive Discussion
a fixed aerosol mass concentration of 10 µg m−3, respectively. The water dependenceof SOA production for ozonolysis of limonene resembles that of α-pinene. Again asignificant positive water effect was observed for 253 K but no significant influence for293 K. This is in agreement with the results of Bonn et al. (2002) who did not find anyeffect of added water on the SOA yield of limonene at room temperature.5
4.3 Comparison of parameters for SOA from α-pinene and limonene ozonolysis
SOA yields are generally higher for limonene compared to α-pinene near room tem-perature (cf. Fig. 15). Due to the stronger temperature dependence of SOA yields fromα-pinene the yield values reach similar levels for both terpenes at about 250 K. It shouldbe noted that limonene has two double bonds that can react with ozone. Indeed, het-10
erogeneous oxidation of an unsaturated product has been proposed to be involved inSOA formation from limonene (Zhang et al., 2006). The water dependences of theSOA yields from ozonolysis of limonene and α-pinene are very similar showing a sig-nificant positive water effect for the lowest temperatures but no significant influence forroom temperature.15
5 Conclusions
This work provides a substantial amount of new data on the temperature dependenceof aerosol yields from the ozonolysis of α-pinene (243–313 K) and limonene (252–313),as well as other important physico-chemical properties of the SOAs and their precur-sors. It confirms earlier studies demonstrating that SOA yields Y , defined by Eq. (1)20
in Sect. 3, depend on organic aerosol mass concentration and inversely on tempera-ture. The experimental range is, however, extended to significantly lower temperatureswhere the SOA yields are found to approach their theoretical upper bounds. It wasalso demonstrated that the SOA yield from α-pinene which is a poor SOA precursornear room temperature has stronger temperature dependence than limonene which25
15625
ACPD8, 15595–15664, 2008
α-pinene andlimonene SOA yields
H. Saathoff et al.
Title Page
Abstract Introduction
Conclusions References
Tables Figures
J I
J I
Back Close
Full Screen / Esc
Printer-friendly Version
Interactive Discussion
produces significant amounts of SOA already at room temperature and above. TheSOA yields increase by up to a factor of ∼5 to 10 for α-pinene and by a factor of ∼2.5for limonene from 313 to 243 K and 313 to 253 K, respectively. The experimental datawere evaluated extensively using the COSIMA-SOA model. By using a two condens-able product approach for either terpene, selected parameters were extracted for every5
experiment, i.e. individual yield parameters (αi ), vapour pressures (pi ), partitioning co-efficients (Ki ), and effective accommodation coefficients (γi ). This work thus providesparameterised temperature dependencies of those values that can easily be applied tocalculate SOA formation by the ozonolysis of these terpenes under tropospheric con-ditions. We emphasize, however, that the empirical expressions are only valid within10
the error limits of the experimental data and should not be extrapolated beyond thegiven ranges of experimental conditions. Please note that the Kelvin effect, althoughoften negligible with respect to predicted SOA yields and airborne mass concentra-tions, may strongly influence the evolutions of particle number concentration and sizedistribution, the latter both being relevant when considering e.g. aerosol optical proper-15
ties or particle-cloud interactions. Furthermore, the densities of both SOA types weredetermined by combining AMS and SMPS measurements. For α-pinene the effectivedensity scattered around a constant value under all conditions and an average densityof (1.25±0.1) g cm−3 was obtained. For limonene the density measurements showedconsiderably more scatter and a value of (1.3±0.2) g cm−3 was used for the evaluation20
process.The parameters derived in this work for the two condensable product proxies were
compared to observations of selected pure compounds known to be produced in theoxidation of terpenes. It was demonstrated that the derived vapour pressures pi arein line with typical vapour pressures of individual low volatile oxidation products of ter-25
penes even though some values were considerably lower than any vapour pressuremeasured so far for SOA components. However, this is not unexpected since someorganic compounds with extremely low vapour pressures would be challenging to iden-tify in ambient SOA. Using volatility measurements of the integrated SOA Jonsson et
15626
ACPD8, 15595–15664, 2008
α-pinene andlimonene SOA yields
H. Saathoff et al.
Title Page
Abstract Introduction
Conclusions References
Tables Figures
J I
J I
Back Close
Full Screen / Esc
Printer-friendly Version
Interactive Discussion
al. (2007) could demonstrate that at least a few % of the SOA mass are non-volatile, i.e.did not evaporate when exposed to 583 K in a VTDMA. Our results imply that humidityhas a significant influence on SOA yields for temperatures as low as 253 K but not nearroom temperature. Pertinent mechanistic and kinetic considerations and part of the gasphase analysis are presented elsewhere (Tillmann et al., 2008a3). Regarding aerosol5
formation kinetics, some relatively low effective accommodation coefficients extractedin the present work imply the involvement of rate limiting steps in the formation of thecondensable SOA precursors at low temperatures, also manifested as a time delay inSOA formation in relation to terpene consumption.
The data presented here render a solid basis for the parameterisation of SOA forma-10
tion from the ozonolysis of α-pinene and limonene in regional as well as global aerosolpredicting models. They may also serve as a starting point for further investigationsinto SOA formation mechanisms including both chemical and physical aspects.
Acknowledgements. This work was supported by the ESF programme INTROP, Interdisci-plinary Tropospheric Research: from the Laboratory to Global Change and the European Net-15
work of Excellence ACCENT. We thank the AIDA team of Research Centre Karlsruhe for theeffective support during the measurement campaigns. M. Hallquist and A. M. Jonsson acknowl-edge support by the Swedish Foundation for Strategic Environmental Research MISTRA andFormas under contract 214-2006-1204.
References20
Alfarra, M. R., Paulsen, D., Gysel, M., Garforth, A. A., Dommen, J., Prevot, A. S. H., Worsnop,D. R., Baltensperger, U., and Coe, H.: A mass spectrometric study of secondary organicaerosols formed from the photooxidation of anthropogenic and biogenic precursors in a re-action chamber, Atmos. Chem. Phys., 6, 5279–5293, 2006,http://www.atmos-chem-phys.net/6/5279/2006/.25
Atkinson, R., Winer, A. M., and Pitts Jr., J. N.: Rate constants for the gas-phase reactions of O3with the natural hydrocarbons isoprene and alpha-pinene and beta-pinene, Atmos. Environ.,16, 1017–1020, 1982.
15627
ACPD8, 15595–15664, 2008
α-pinene andlimonene SOA yields
H. Saathoff et al.
Title Page
Abstract Introduction
Conclusions References
Tables Figures
J I
J I
Back Close
Full Screen / Esc
Printer-friendly Version
Interactive Discussion
Atkinson, R.: Gas-phase tropospheric chemistry of volatile organic compounds 1. Alkanes andalkenes, J. Phys. Chem. Ref. Data, 26, 215–290, 1997.
Bahreini, R., Keywood, M. D., Ng, N. L., Varutbangkul, V., Gao, S., Flagan, R. C., Seinfeld,J. H., Worsnop, D. R., and Jimenez, J. L.: Measurements of secondary organic aerosolfrom oxidation of cycloalkenes, terpenes, and m-xylene using an Aerodyne aerosol mass5
spectrometer, Environ. Sci. Technol., 39, 5674–5688, 2005.Berndt, T., Boge, O., and Stratmann, F.: Gas-phase ozonolysis of alpha-pinene: gaseous
products and particle formation, Atmos. Environ., 37, 3933–3945, 2003.Bilde, M. and Pandis, S. N.: Evaporation rates and vapor pressures of individual aerosol
species formed in the atmospheric oxidation of alpha- and beta-pinene, Environ. Sci. Tech-10
nol., 35, 3344–3349, 2001.Bilde, M., Svenningsson, B., Monster, J., and Rosenorn, T.: Even-odd alternation of evaporation
rates and vapor pressures of C3-C9 dicarboxylic acid aerosols, Environ. Sci. Technol., 37,1371–1378, 2003.
Bonn, B., Schuster, G., and Moortgat, G. K.: Influence of water vapor on the process of new par-15
ticle formation during monoterpene ozonolysis, J. Phys. Chem. A, 106, 2869–2881, 2002.Bowman, F. M., Odum, J. R., Seinfeld, J. H., and Pandis, S. N.: Mathematical model for gas-
particle partitioning of secondary organic aerosols, Atmos. Environ., 31, 3921–3931, 1997.Bunz, H. and Dlugi, R.: Numerical-Studies on the Behavior of Aerosols in Smog Chambers, J.
Aerosol Sci., 22, 441–465, 1991.20
Cahill, T. M., Seaman, V. Y., Charles, M. J., Holzinger, R., and Goldstein, A. H.: Sec-ondary organic aerosols formed from oxidation of biogenic volatile organic compoundsin the Sierra Nevada Mountains of California, J. Geophys. Res.-Atmos., 111, D16312,doi:10.1029/2006JD007178, 2006.
Cai, X. Y. and Griffin, R. J.: Theoretical modeling of the size-dependent influence of surface25
tension on the absorptive partitioning of semi-volatile organic compounds, J. Atmos. Chem.,50, 139–158, 2005.
Calogirou, A., Larsen, B. R., and Kotzias, D.: Gas-phase terpene oxidation products: a review,Atmos. Environ., 33, 1423–1439, 1999.
Capouet, M. and Muller, J. F.: A group contribution method for estimating the vapour pressures30
of α-pinene oxidation products, Atmos. Chem. Phys., 6, 1455–1467, 2006,http://www.atmos-chem-phys.net/6/1455/2006/.
Chattopadhyay, S. and Ziemann, P. J.: Vapor pressures of substituted and unsubstituted mono-
15628
ACPD8, 15595–15664, 2008
α-pinene andlimonene SOA yields
H. Saathoff et al.
Title Page
Abstract Introduction
Conclusions References
Tables Figures
J I
J I
Back Close
Full Screen / Esc
Printer-friendly Version
Interactive Discussion
carboxylic and dicarboxylic acids measured using an improved thermal desorption particlebeam mass spectrometry method, Aerosol Sci. Technol., 39, 1085–1100, 2005.
Cocker, D. R., Clegg, S. L., Flagan, R. C., and Seinfeld, J. H.: The effect of water on gas-particle partitioning of secondary organic aerosol. Part I: alpha-pinene/ozone system, Atmos.Environ., 35, 6049–6072, 2001.5
Dahneke, B.: Simple Kinetic Theory of Brownian Diffusion in Vapors and Aerosols, Theory ofDispersed Multiphase Flow, edited by: Meyer, R. E., Academic Press, New York, 97–133pp., 1983.
DeCarlo, P. F., Slowik, J. G., Worsnop, D. R., Davidovits, P., and Jimenez, J. L.: Particle mor-phology and density characterization by combined mobility and aerodynamic diameter mea-10
surements. Part 1: Theory, Aerosol Sci. Technol., 38, 1185–1205, 2004.Docherty, K. S., Wu, W., Lim, Y. B., and Ziemann, P. J.: Contributions of organic peroxides to
secondary aerosol formed from reactions of monoterpenes with O-3, Environ. Sci. Technol.,39, 4049–4059, 2005.
Fredenslund, A., Gmehling, J., and Rasmussen, P.: Vapor-Liquid Equilibria Using UNIFAC: A15
Group-Contribution Method, Elsevier Scientific Publishing, New York, 1977.Gao, S., Ng, N. L., Keywood, M., Varutbangkul, V., Bahreini, R., Nenes, A., He, J. W., Yoo, K.
Y., Beauchamp, J. L., Hodyss, R. P., Flagan, R. C., and Seinfeld, J. H.: Particle phase acidityand oligomer formation in secondary organic aerosol, Environ. Sci. Technol., 38, 6582–6589,2004.20
Griffin, R. J., Cocker, D. R., Flagan, R. C., and Seinfeld, J. H.: Organic aerosol formation fromthe oxidation of biogenic hydrocarbons, J. Geophys. Res.-Atmos., 104, 3555–3567, 1999a.
Griffin, R. J., Cocker, D. R., Seinfeld, J. H., and Dabdub, D.: Estimate of global atmosphericorganic aerosol from oxidation of biogenic hydrocarbons, Geophys. Res. Lett., 26, 2721–2724, 1999b.25
Griffin, R. J., Dabdub, D., and Seinfeld, J. H.: Development and initial evaluation of a dynamicspecies-resolved model for gas phase chemistry and size-resolved gas/particle partition-ing associated with secondary organic aerosol formation, J. Geophys. Res.-Atmos., 110,D05304, doi:10.1029/2004JD005219, 2005.
Guenther, A., Hewitt, C. N., Erickson, D., Fall, R., Geron, C., Graedel, T., Harley, P., Klinger,30
L., Lerdau, M., Mckay, W. A., Pierce, T., Scholes, B., Steinbrecher, R., Tallamraju, R., Taylor,J., and Zimmerman, P.: A Global-Model of Natural Volatile Organic-Compound Emissions, J.Geophys. Res.-Atmos., 100, 8873–8892, 1995.
15629
ACPD8, 15595–15664, 2008
α-pinene andlimonene SOA yields
H. Saathoff et al.
Title Page
Abstract Introduction
Conclusions References
Tables Figures
J I
J I
Back Close
Full Screen / Esc
Printer-friendly Version
Interactive Discussion
Hallquist, M., Wangberg, I., and Ljungstrom, E.: Atmospheric fate of carbonyl oxidation prod-ucts originating from alpha-pinene and Delta(3)-carene: Determination of rate of reactionwith OH and NO3 radicals, UV absorption cross sections, and vapor pressures, Environ. Sci.Technol., 31, 3166–3172, 1997.
Hamilton, J. F., Lewis, A. C., Carey, T. J., and Wenger, J. C.: Characterization of polar com-5
pounds and oligomers in secondary organic aerosol using liquid chromatography coupled tomass spectrometry, Anal. Chem., 80, 474–480, 2008.
Heald, C. L., Jacob, D. J., Park, R. J., Russell, L. M., Huebert, B. J., Seinfeld, J. H., Liao, H., andWeber, R. J.: A large organic aerosol source in the free troposphere missing from currentmodels, Geophys. Res. Lett., 32, L18809, doi:10.1029/2005GL023831, 2005.10
Hoffmann, T., Odum, J. R., Bowman, F., Collins, D., Klockow, D., Flagan, R. C., and Seinfeld,J. H.: Formation of organic aerosols from the oxidation of biogenic hydrocarbons, J. Atmos.Chem., 26, 189–222, 1997.
Hoppel, W., Fitzgerald, J., Frick, G., Caffrey, P., Pasternack, L., Hegg, D., Gao, S., Leaitch, R.,Shantz, N., Cantrell, C., Albrechcinski, T., Ambrusko, J., and Sullivan, W.: Particle formation15
and growth from ozonolysis of alpha-pinene, J. Geophys. Res.-Atmos., 106, 27 603–27 618,2001.
Iinuma, Y., Boge, O., Gnauk, T., and Herrmann, H.: Aerosol-chamber study of the alpha-pinene/O-3 reaction: influence of particle acidity on aerosol yields and products, Atmos.Environ., 38, 761–773, 2004.20
Iinuma, Y., Boge, O., Miao, Y., Sierau, B., Gnauk, T., and Herrmann, H.: Laboratory studies onsecondary organic aerosol formation from terpenes, Faraday Discuss., 130, 279–294, 2005.
Iinuma, Y., Muller, C., Boge, O., Gnauk, T., and Herrmann, H.: The formation of organic sulfateesters in the limonene ozonolysis secondary organic aerosol (SOA) under acidic conditions,Atmos. Environ., 41, 5571–5583, 2007.25
Jang, M. S., Carroll, B., Chandramouli, B., and Kamens, R. M.: Particle growth by acid-catalyzed heterogeneous reactions of organic carbonyls on preexisting aerosols, Environ.Sci. Technol., 37, 3828–3837, 2003.
Jenkin, M. E.: Modelling the formation and composition of secondary organic aerosol fromalpha- and beta-pinene ozonolysis using MCM v3, Atmos. Chem. Phys., 4, 1741–1757,30
2004,http://www.atmos-chem-phys.net/4/1741/2004/.
Johnson, D. and Marston, G.: The gas-phase ozonolysis of unsaturated volatile organic com-
15630
ACPD8, 15595–15664, 2008
α-pinene andlimonene SOA yields
H. Saathoff et al.
Title Page
Abstract Introduction
Conclusions References
Tables Figures
J I
J I
Back Close
Full Screen / Esc
Printer-friendly Version
Interactive Discussion
pounds in the troposphere, Chem. Soc. Rev., 37, 699–716, doi:10.1039/b704260b, 2008.Jonsson, A. M., Hallquist, M., and Saathoff, H.: Volatility of secondary organic aerosols from
the ozone initiated oxidation of alpha-pinene and limonene, J. Aerosol Sci., 38, 843–852,2007.
Jonsson, A. M., Hallquist, M., and Ljungstrom, E.: Impact of humidity on the ozone initiated5
oxidation of limonene, Delta(3)-carene, and alpha-pinene, Environ. Sci. Technol., 40, 188–194, 2006.
Jonsson, A. M., Hallquist, M., and Ljungstrom, E.: The effect of temperature and water onsecondary organic aerosol formation from ozonolysis of limonene, ∆3-carene and α-pinene,Atmos. Chem. Phys. Discuss., 8, 9323–9346, 2008b,10
http://www.atmos-chem-phys-discuss.net/8/9323/2008/.Kalberer, M., Paulsen, D., Sax, M., Steinbacher, M., Dommen, J., Prevot, A. S. H., Fisseha, R.,
Weingartner, E., Frankevich, V., Zenobi, R., and Baltensperger, U.: Identification of polymersas major components of atmospheric organic aerosols, Science, 303, 1659–1662, 2004.
Kanakidou, M., Seinfeld, J. H., Pandis, S. N., Barnes, I., Dentener, F. J., Facchini, M. C., Van15
Dingenen, R., Ervens, B., Nenes, A., Nielsen, C. J., Swietlicki, E., Putaud, J. P., Balkanski,Y., Fuzzi, S., Horth, J., Moortgat, G. K., Winterhalter, R., Myhre, C. E. L., Tsigaridis, K.,Vignati, E., Stephanou, E. G., and Wilson, J.: Organic aerosol and global climate modelling:a review, Atmos. Chem. Phys., 5, 1053–1123, 2005,http://www.atmos-chem-phys.net/5/1053/2005/.20
Keywood, M. D., Kroll, J. H., Varutbangkul, V., Bahreini, R., Flagan, R. C., and Seinfeld, J. H.:Secondary organic aerosol formation from cyclohexene ozonolysis: Effect of OH scavengerand the role of radical chemistry, Environ. Sci. Technol., 38, 3343–3350, 2004.
Khamaganov, V. G. and Hites, R. A.: Rate constants for the gas-phase reactions of ozonewith isoprene, alpha- and beta-pinene, and limonene as a function of temperature, J. Phys.25
Chem. A, 105, 815–822, 2001.Koch, S., Winterhalter, R., Uherek, E., Kolloff, A., Neeb, P., and Moortgat, G. K.: Formation
of new particles in the gas-phase ozonolysis of monoterpenes, Atmos. Environ., 34, 4031–4042, 2000.
Kostenidou, E., Pathak, R. K., and Pandis, S. N.: An Algorithm for the Calculation of Secondary30
Organic Aerosol Density Combining AMS and SMPS Data, Aerosol Sci. Technol., 41, 1002–1010, 2007.
Kroll, J. H., Chan, A. W. H., Ng, N. L., Flagan, R. C., and Seinfeld, J. H.: Reactions of
15631
ACPD8, 15595–15664, 2008
α-pinene andlimonene SOA yields
H. Saathoff et al.
Title Page
Abstract Introduction
Conclusions References
Tables Figures
J I
J I
Back Close
Full Screen / Esc
Printer-friendly Version
Interactive Discussion
semivolatile organics and their effects on secondary organic aerosol formation, Environ. Sci.Technol., 41, 3545–3550, 2007.
Matsunaga, S. N., Wiedinmyer, C., Guenther, A. B., Orlando, J. J., Karl, T., Toohey, D. W.,Greenberg, J. P., and Kajii, Y.: Isoprene oxidation products are a significant atmosphericaerosol component, Atmos. Chem. Phys. Discuss., 5, 11 143–11 156, 2005.5
Muller, J. F.: Geographical-Distribution and Seasonal-Variation of Surface Emissions and De-position Velocities of Atmospheric Trace Gases, J. Geophys. Res.-Atmos., 97, 3787–3804,1992.
Naumann, K. H.: COSIMA – a computer program simulating the dynamics of fractal aerosols,J. Aerosol Sci, 34, 1371–1397, 2003.10
Northcross, A. L. and Jang, M.: Heterogeneous SOA yield from ozonolysis of monoterpenes inthe presence of inorganic acid, Atmos. Environ., 41, 1483–1493, 2007.
Odum, J. R., Hoffmann, T., Bowman, F., Collins, D., Flagan, R. C., and Seinfeld, J. H.:Gas/particle partitioning and secondary organic aerosol yields, Environ. Sci. Technol., 30,2580–2585, 1996.15
Offenberg, J. H., Kleindienst, T. E., Jaoui, M., Lewandowski, M., and Edney, E. O.:Thermal properties of secondary organic aerosols, Geophys. Res. Lett., 33, L03816,doi:10.1029/2005GL024623, 2006.
Pankow, J. F.: An Absorption-Model of the Gas Aerosol Partitioning Involved in the Formationof Secondary Organic Aerosol, Atmos. Environ., 28, 189–193, 1994.20
Pathak, R. K., Presto, A. A., Lane, T. E., Stanier, C. O., Donahue, N. M., and Pandis, S. N.:Ozonolysis of alpha-pinene: parameterization of secondary organic aerosol mass fraction,Atmos. Chem. Phys., 7, 3811–3821, 2007a,http://www.atmos-chem-phys.net/7/3811/2007/.
Pathak, R. K., Stanier, C. O., Donahue, N. M., and Pandis, S. N.: Ozonolysis of alpha-pinene at25
atmospherically relevant concentrations: Temperature dependence of aerosol mass fractions(yields), J. Geophys. Res.-Atmos., 112, D03201, doi:10.1029/2006JD007436, 2007b.
Plewka, A., Gnauk, T., Bruggemann, E., and Herrmann, H.: Biogenic contributions to the chem-ical composition of airborne particles in a coniferous forest in Germany, Atmos. Environ., 40,S103–S115, 2006.30
Poling, B. E., Prausnitz, J. M., and O’Connell, J. P.: The Properties of Gases and Liquids,McGraw-Hill, New York 2000.
Presto, A. A. and Donahue, N. M.: Investigation of alpha-pinene plus ozone secondary organic
15632
ACPD8, 15595–15664, 2008
α-pinene andlimonene SOA yields
H. Saathoff et al.
Title Page
Abstract Introduction
Conclusions References
Tables Figures
J I
J I
Back Close
Full Screen / Esc
Printer-friendly Version
Interactive Discussion
aerosol formation at low total aerosol mass, Environ. Sci. Technol., 40, 3536–3543, 2006.Saathoff, H., Moehler, O., Schurath, U., Kamm, S., Dippel, B., and Mihelcic, D.: The AIDA soot
aerosol characterisation campaign 1999, J. Aerosol Sci., 34, 1277–1296, 2003.Seinfeld, J. H. and Pankow, J. F.: Organic atmospheric particulate material, Ann. Rev. Phys.
Chem., 54, 121–140, 2003.5
Sheehan, P. E. and Bowman, F. M.: Estimated effects of temperature on secondary organicaerosol concentrations, Environ. Sci. Technol., 35, 2129–2135, 2001.
Shilling, J. E., Chen, Q., King, S. M., Rosenoern, T., Kroll, J. H., Worsnop, D. R., McKinney, K.A., and Martin, S. T.: Particle mass yield in secondary organic aerosol formed by the darkozonolysis of α-pinene, Atmos. Chem. Phys., 8, 2073–2088, 2008,10
http://www.atmos-chem-phys.net/8/2073/2008/.Simpson, D., Yttri, K. E., Klimont, Z., Kupiainen, K., Caseiro, A., Gelencser, A., Pio, C.,
Puxbaum, H., and Legrand, M.: Modeling carbonaceous aerosol over Europe: Analysisof the CARBOSOL and EMEP EC/OC campaigns, J. Geophys. Res.-Atmos., 112, D23S14,doi:10.1029/2006JD008158, 2007.15
Song, C., Zaveri, R. A., Alexander, M. L., Thornton, J. A., Madronich, S., Ortega, J. V., Zelenyuk,A., Yu, X. Y., Laskin, A., and Maughan, D. A.: Effect of hydrophobic primary organic aerosolson secondary organic aerosol formation from ozonolysis of alpha-pinene, Geophys. Res.Lett., 34, L20803, doi:10.1029/2007GL030720, 2007.
Svendby, T. M., Lazaridis, M., and Torseth, K.: Temperature dependent secondary organic20
aerosol formation from terpenes and aromatics, J. Atmos. Chem., 59, 25–46, 2008.Takekawa, H., Minoura, H., and Yamazaki, S.: Temperature dependence of secondary or-
ganic aerosol formation by photo-oxidation of hydrocarbons, Atmos. Environ., 37, 3413–3424, 2003.
Tsigaridis, K., Lathiere, J., Kanakidou, M., and Hauglustaine, D. A.: Naturally driven variability25
in the global secondary organic aerosol over a decade, Atmos. Chem. Phys., 5, 1891–1904,2005,http://www.atmos-chem-phys.net/5/1891/2005/.
Tsigaridis, K. and Kanakidou, M.: Secondary organic aerosol importance in the future atmo-sphere, Atmos. Environ., 41, 4682–4692, 2007.30
Wentzel, M., Gorzawski, H., Naumann, K. H., Saathoff, H., and Weinbruch, S.: Transmissionelectron microscopical and aerosol dynamical characterization of soot aerosols, J. AerosolSci., 34, 1347–1370, 2003.
15633
ACPD8, 15595–15664, 2008
α-pinene andlimonene SOA yields
H. Saathoff et al.
Title Page
Abstract Introduction
Conclusions References
Tables Figures
J I
J I
Back Close
Full Screen / Esc
Printer-friendly Version
Interactive Discussion
Wirtz, K. and Martin-Reviejo, M.: Density of secondary organic aerosols, J. Aerosol Sci., 34,S223–S224, 2003.
Yu, J. Z., Cocker, D. R., Griffin, R. J., Flagan, R. C., and Seinfeld, J. H.: Gas-phase ozoneoxidation of monoterpenes: Gaseous and particulate products, J. Atmos. Chem., 34, 207–258, 1999a.5
Yu, J. Z., Griffin, R. J., Cocker, D. R., Flagan, R. C., Seinfeld, J. H., and Blanchard, P.: Obser-vation of gaseous and particulate products of monoterpene oxidation in forest atmospheres,Geophys. Res. Lett., 26, 1145–1148, 1999b.
Zhang, J. Y., Hartz, K. E. H., Pandis, S. N., and Donahue, N. M.: Secondary organic aerosol for-mation from limonene ozonolysis: Homogeneous and heterogeneous influences as a func-10
tion of NOx, J. Phys. Chem. A, 110, 11 053–11 063, 2006.Zhang, Q., Alfarra, M. R., Worsnop, D. R., Allan, J. D., Coe, H., Canagaratna, M. R., and
Jimenez, J. L.: Deconvolution and quantification of hydrocarbon-like and oxygenated organicaerosols based on aerosol mass spectrometry, Environ. Sci. Technol., 39, 4938–4952, 2005.
15634
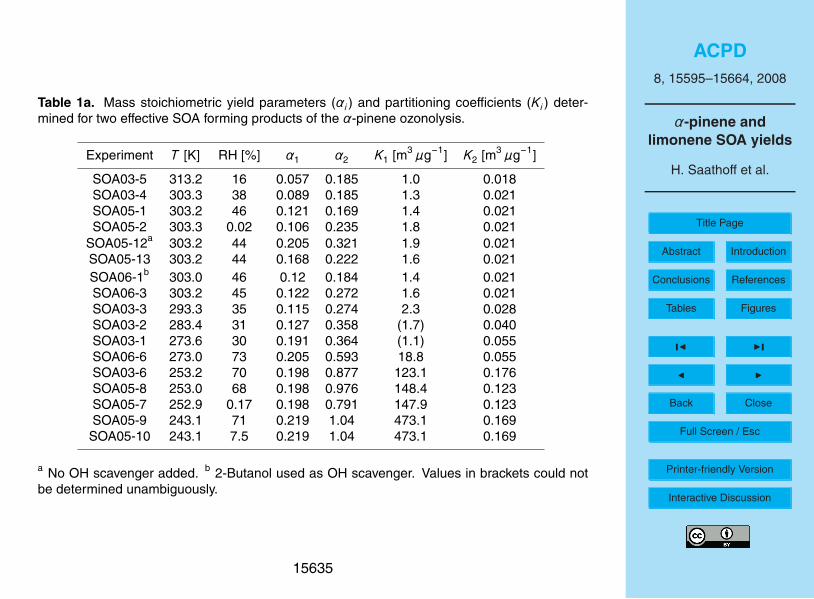
ACPD8, 15595–15664, 2008
α-pinene andlimonene SOA yields
H. Saathoff et al.
Title Page
Abstract Introduction
Conclusions References
Tables Figures
J I
J I
Back Close
Full Screen / Esc
Printer-friendly Version
Interactive Discussion
Table 1a. Mass stoichiometric yield parameters (αi ) and partitioning coefficients (Ki ) deter-mined for two effective SOA forming products of the α-pinene ozonolysis.
Experiment T [K] RH [%] α1 α2 K1 [m3 µg−1] K2 [m3 µg−1]
SOA03-5 313.2 16 0.057 0.185 1.0 0.018SOA03-4 303.3 38 0.089 0.185 1.3 0.021SOA05-1 303.2 46 0.121 0.169 1.4 0.021SOA05-2 303.3 0.02 0.106 0.235 1.8 0.021
SOA05-12a 303.2 44 0.205 0.321 1.9 0.021SOA05-13 303.2 44 0.168 0.222 1.6 0.021SOA06-1b 303.0 46 0.12 0.184 1.4 0.021SOA06-3 303.2 45 0.122 0.272 1.6 0.021SOA03-3 293.3 35 0.115 0.274 2.3 0.028SOA03-2 283.4 31 0.127 0.358 (1.7) 0.040SOA03-1 273.6 30 0.191 0.364 (1.1) 0.055SOA06-6 273.0 73 0.205 0.593 18.8 0.055SOA03-6 253.2 70 0.198 0.877 123.1 0.176SOA05-8 253.0 68 0.198 0.976 148.4 0.123SOA05-7 252.9 0.17 0.198 0.791 147.9 0.123SOA05-9 243.1 71 0.219 1.04 473.1 0.169SOA05-10 243.1 7.5 0.219 1.04 473.1 0.169
a No OH scavenger added. b 2-Butanol used as OH scavenger. Values in brackets could notbe determined unambiguously.
15635
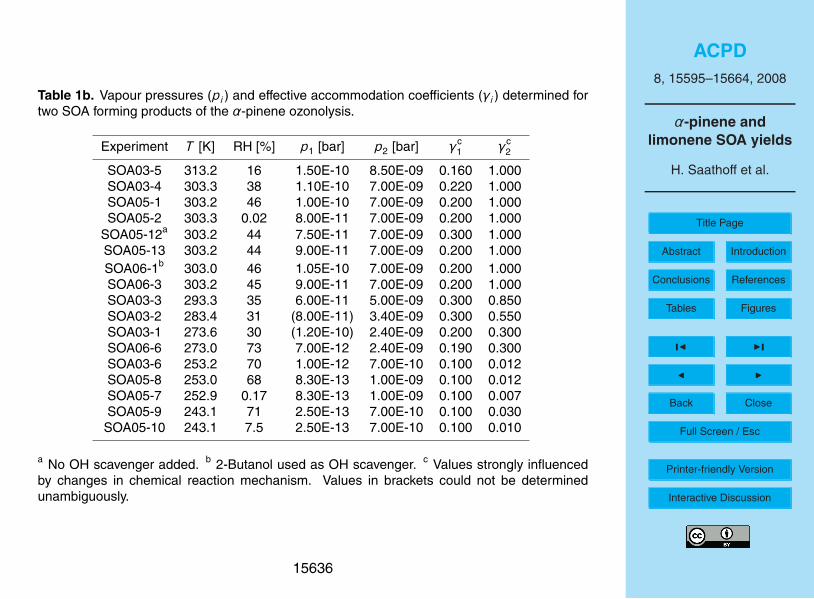
ACPD8, 15595–15664, 2008
α-pinene andlimonene SOA yields
H. Saathoff et al.
Title Page
Abstract Introduction
Conclusions References
Tables Figures
J I
J I
Back Close
Full Screen / Esc
Printer-friendly Version
Interactive Discussion
Table 1b. Vapour pressures (pi ) and effective accommodation coefficients (γi ) determined fortwo SOA forming products of the α-pinene ozonolysis.
Experiment T [K] RH [%] p1 [bar] p2 [bar] γc1 γc
2
SOA03-5 313.2 16 1.50E-10 8.50E-09 0.160 1.000SOA03-4 303.3 38 1.10E-10 7.00E-09 0.220 1.000SOA05-1 303.2 46 1.00E-10 7.00E-09 0.200 1.000SOA05-2 303.3 0.02 8.00E-11 7.00E-09 0.200 1.000
SOA05-12a 303.2 44 7.50E-11 7.00E-09 0.300 1.000SOA05-13 303.2 44 9.00E-11 7.00E-09 0.200 1.000SOA06-1b 303.0 46 1.05E-10 7.00E-09 0.200 1.000SOA06-3 303.2 45 9.00E-11 7.00E-09 0.200 1.000SOA03-3 293.3 35 6.00E-11 5.00E-09 0.300 0.850SOA03-2 283.4 31 (8.00E-11) 3.40E-09 0.300 0.550SOA03-1 273.6 30 (1.20E-10) 2.40E-09 0.200 0.300SOA06-6 273.0 73 7.00E-12 2.40E-09 0.190 0.300SOA03-6 253.2 70 1.00E-12 7.00E-10 0.100 0.012SOA05-8 253.0 68 8.30E-13 1.00E-09 0.100 0.012SOA05-7 252.9 0.17 8.30E-13 1.00E-09 0.100 0.007SOA05-9 243.1 71 2.50E-13 7.00E-10 0.100 0.030SOA05-10 243.1 7.5 2.50E-13 7.00E-10 0.100 0.010
a No OH scavenger added. b 2-Butanol used as OH scavenger. c Values strongly influencedby changes in chemical reaction mechanism. Values in brackets could not be determinedunambiguously.
15636
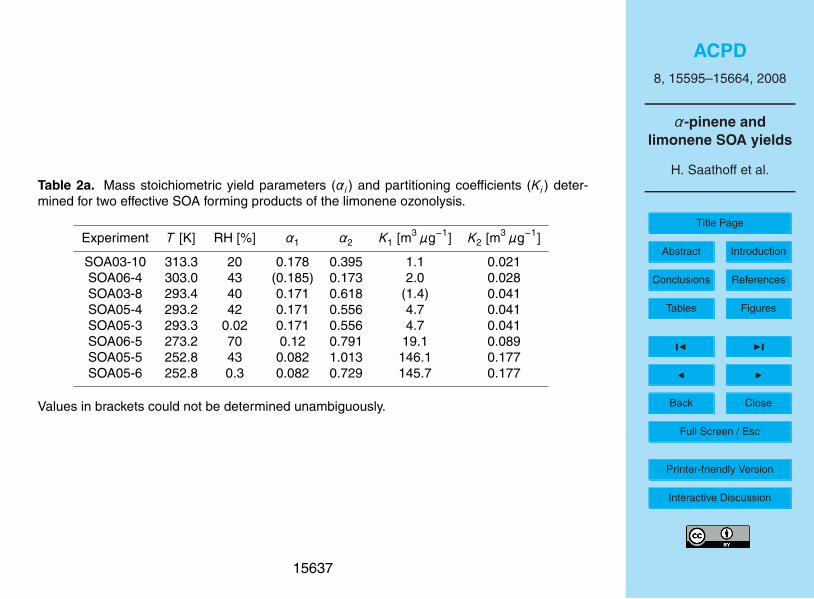
ACPD8, 15595–15664, 2008
α-pinene andlimonene SOA yields
H. Saathoff et al.
Title Page
Abstract Introduction
Conclusions References
Tables Figures
J I
J I
Back Close
Full Screen / Esc
Printer-friendly Version
Interactive Discussion
Table 2a. Mass stoichiometric yield parameters (αi ) and partitioning coefficients (Ki ) deter-mined for two effective SOA forming products of the limonene ozonolysis.
Experiment T [K] RH [%] α1 α2 K1 [m3 µg−1] K2 [m3 µg−1]
SOA03-10 313.3 20 0.178 0.395 1.1 0.021SOA06-4 303.0 43 (0.185) 0.173 2.0 0.028SOA03-8 293.4 40 0.171 0.618 (1.4) 0.041SOA05-4 293.2 42 0.171 0.556 4.7 0.041SOA05-3 293.3 0.02 0.171 0.556 4.7 0.041SOA06-5 273.2 70 0.12 0.791 19.1 0.089SOA05-5 252.8 43 0.082 1.013 146.1 0.177SOA05-6 252.8 0.3 0.082 0.729 145.7 0.177
Values in brackets could not be determined unambiguously.
15637
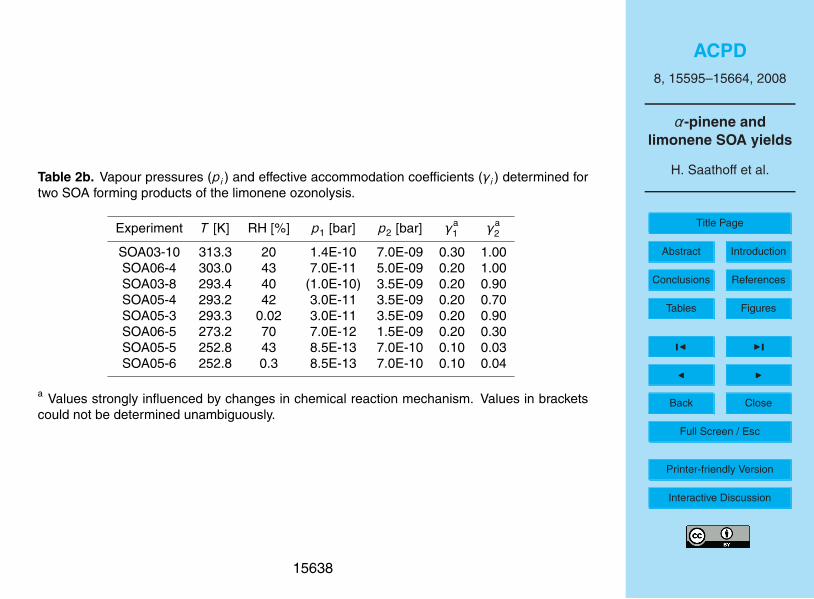
ACPD8, 15595–15664, 2008
α-pinene andlimonene SOA yields
H. Saathoff et al.
Title Page
Abstract Introduction
Conclusions References
Tables Figures
J I
J I
Back Close
Full Screen / Esc
Printer-friendly Version
Interactive Discussion
Table 2b. Vapour pressures (pi ) and effective accommodation coefficients (γi ) determined fortwo SOA forming products of the limonene ozonolysis.
Experiment T [K] RH [%] p1 [bar] p2 [bar] γa1 γa
2
SOA03-10 313.3 20 1.4E-10 7.0E-09 0.30 1.00SOA06-4 303.0 43 7.0E-11 5.0E-09 0.20 1.00SOA03-8 293.4 40 (1.0E-10) 3.5E-09 0.20 0.90SOA05-4 293.2 42 3.0E-11 3.5E-09 0.20 0.70SOA05-3 293.3 0.02 3.0E-11 3.5E-09 0.20 0.90SOA06-5 273.2 70 7.0E-12 1.5E-09 0.20 0.30SOA05-5 252.8 43 8.5E-13 7.0E-10 0.10 0.03SOA05-6 252.8 0.3 8.5E-13 7.0E-10 0.10 0.04
a Values strongly influenced by changes in chemical reaction mechanism. Values in bracketscould not be determined unambiguously.
15638
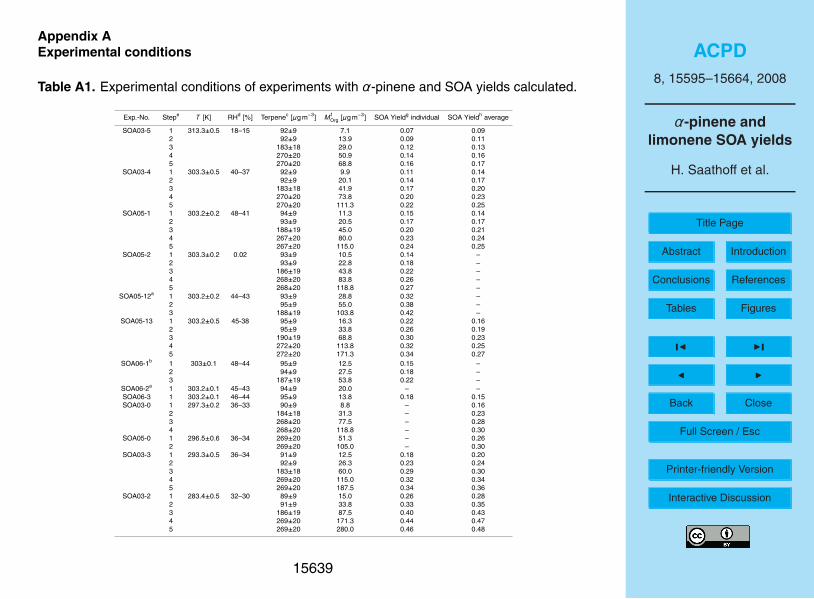
ACPD8, 15595–15664, 2008
α-pinene andlimonene SOA yields
H. Saathoff et al.
Title Page
Abstract Introduction
Conclusions References
Tables Figures
J I
J I
Back Close
Full Screen / Esc
Printer-friendly Version
Interactive Discussion
Appendix AExperimental conditions
Table A1. Experimental conditions of experiments with α-pinene and SOA yields calculated.
Exp.-No. Stepe T [K] RHd [%] Terpenec [µg m−3] M fOrg [µg m−3] SOA Yieldg individual SOA Yieldh average
SOA03-5 1 313.3±0.5 18–15 92±9 7.1 0.07 0.092 92±9 13.9 0.09 0.113 183±18 29.0 0.12 0.134 270±20 50.9 0.14 0.165 270±20 68.8 0.16 0.17
SOA03-4 1 303.3±0.5 40–37 92±9 9.9 0.11 0.142 92±9 20.1 0.14 0.173 183±18 41.9 0.17 0.204 270±20 73.8 0.20 0.235 270±20 111.3 0.22 0.25
SOA05-1 1 303.2±0.2 48–41 94±9 11.3 0.15 0.142 93±9 20.5 0.17 0.173 188±19 45.0 0.20 0.214 267±20 80.0 0.23 0.245 267±20 115.0 0.24 0.25
SOA05-2 1 303.3±0.2 0.02 93±9 10.5 0.14 –2 93±9 22.8 0.18 –3 186±19 43.8 0.22 –4 268±20 83.8 0.26 –5 268±20 118.8 0.27 –
SOA05-12a 1 303.2±0.2 44–43 93±9 28.8 0.32 –2 95±9 55.0 0.38 –3 188±19 103.8 0.42 –
SOA05-13 1 303.2±0.5 45-38 95±9 16.3 0.22 0.162 95±9 33.8 0.26 0.193 190±19 68.8 0.30 0.234 272±20 113.8 0.32 0.255 272±20 171.3 0.34 0.27
SOA06-1b 1 303±0.1 48–44 95±9 12.5 0.15 –2 94±9 27.5 0.18 –3 187±19 53.8 0.22 –
SOA06-2a 1 303.2±0.1 45–43 94±9 20.0 – –SOA06-3 1 303.2±0.1 46–44 95±9 13.8 0.18 0.15SOA03-0 1 297.3±0.2 36–33 90±9 8.8 – 0.16
2 184±18 31.3 – 0.233 268±20 77.5 – 0.284 268±20 118.8 – 0.30
SOA05-0 1 296.5±0.6 36–34 269±20 51.3 – 0.262 269±20 105.0 – 0.30
SOA03-3 1 293.3±0.5 36–34 91±9 12.5 0.18 0.202 92±9 26.3 0.23 0.243 183±18 60.0 0.29 0.304 269±20 115.0 0.32 0.345 269±20 187.5 0.34 0.36
SOA03-2 1 283.4±0.5 32–30 89±9 15.0 0.26 0.282 91±9 33.8 0.33 0.353 186±19 87.5 0.40 0.434 269±20 171.3 0.44 0.475 269±20 280.0 0.46 0.48
15639
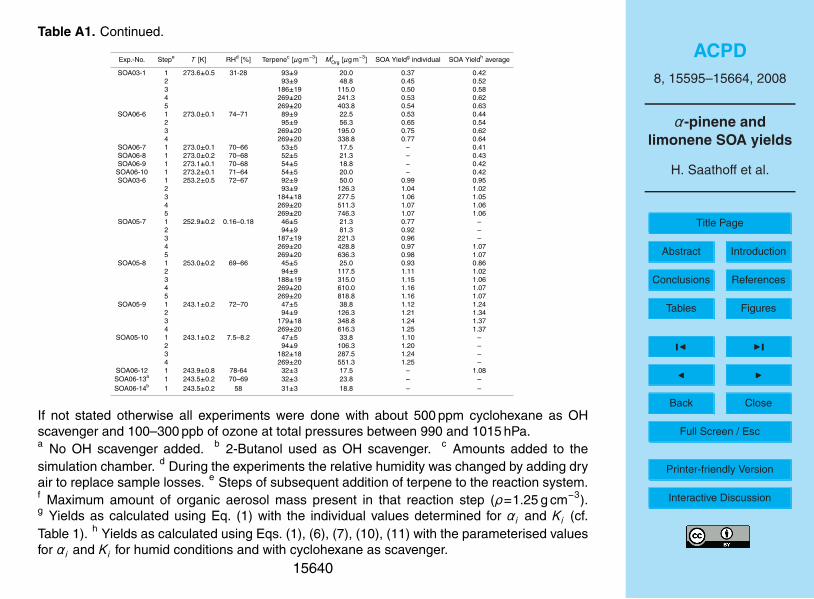
ACPD8, 15595–15664, 2008
α-pinene andlimonene SOA yields
H. Saathoff et al.
Title Page
Abstract Introduction
Conclusions References
Tables Figures
J I
J I
Back Close
Full Screen / Esc
Printer-friendly Version
Interactive Discussion
Table A1. Continued.
Exp.-No. Stepe T [K] RHd [%] Terpenec [µg m−3] M fOrg [µg m−3] SOA Yieldg individual SOA Yieldh average
SOA03-1 1 273.6±0.5 31-28 93±9 20.0 0.37 0.422 93±9 48.8 0.45 0.523 186±19 115.0 0.50 0.584 269±20 241.3 0.53 0.625 269±20 403.8 0.54 0.63
SOA06-6 1 273.0±0.1 74–71 89±9 22.5 0.53 0.442 95±9 56.3 0.65 0.543 269±20 195.0 0.75 0.624 269±20 338.8 0.77 0.64
SOA06-7 1 273.0±0.1 70–66 53±5 17.5 – 0.41SOA06-8 1 273.0±0.2 70–68 52±5 21.3 – 0.43SOA06-9 1 273.1±0.1 70–68 54±5 18.8 – 0.42SOA06-10 1 273.2±0.1 71–64 54±5 20.0 – 0.42SOA03-6 1 253.2±0.5 72–67 92±9 50.0 0.99 0.95
2 93±9 126.3 1.04 1.023 184±18 277.5 1.06 1.054 269±20 511.3 1.07 1.065 269±20 746.3 1.07 1.06
SOA05-7 1 252.9±0.2 0.16–0.18 46±5 21.3 0.77 –2 94±9 81.3 0.92 –3 187±19 221.3 0.96 –4 269±20 428.8 0.97 1.075 269±20 636.3 0.98 1.07
SOA05-8 1 253.0±0.2 69–66 45±5 25.0 0.93 0.862 94±9 117.5 1.11 1.023 188±19 315.0 1.15 1.064 269±20 610.0 1.16 1.075 269±20 818.8 1.16 1.07
SOA05-9 1 243.1±0.2 72–70 47±5 38.8 1.12 1.242 94±9 126.3 1.21 1.343 179±18 348.8 1.24 1.374 269±20 616.3 1.25 1.37
SOA05-10 1 243.1±0.2 7.5–8.2 47±5 33.8 1.10 –2 94±9 106.3 1.20 –3 182±18 287.5 1.24 –4 269±20 551.3 1.25 –
SOA06-12 1 243.9±0.8 78-64 32±3 17.5 – 1.08SOA06-13a 1 243.5±0.2 70–69 32±3 23.8 – –SOA06-14b 1 243.5±0.2 58 31±3 18.8 – –
If not stated otherwise all experiments were done with about 500 ppm cyclohexane as OHscavenger and 100–300 ppb of ozone at total pressures between 990 and 1015 hPa.a No OH scavenger added. b 2-Butanol used as OH scavenger. c Amounts added to thesimulation chamber. d During the experiments the relative humidity was changed by adding dryair to replace sample losses. e Steps of subsequent addition of terpene to the reaction system.f Maximum amount of organic aerosol mass present in that reaction step (ρ=1.25 g cm−3).g Yields as calculated using Eq. (1) with the individual values determined for αi and Ki (cf.Table 1). h Yields as calculated using Eqs. (1), (6), (7), (10), (11) with the parameterised valuesfor αi and Ki for humid conditions and with cyclohexane as scavenger.
15640
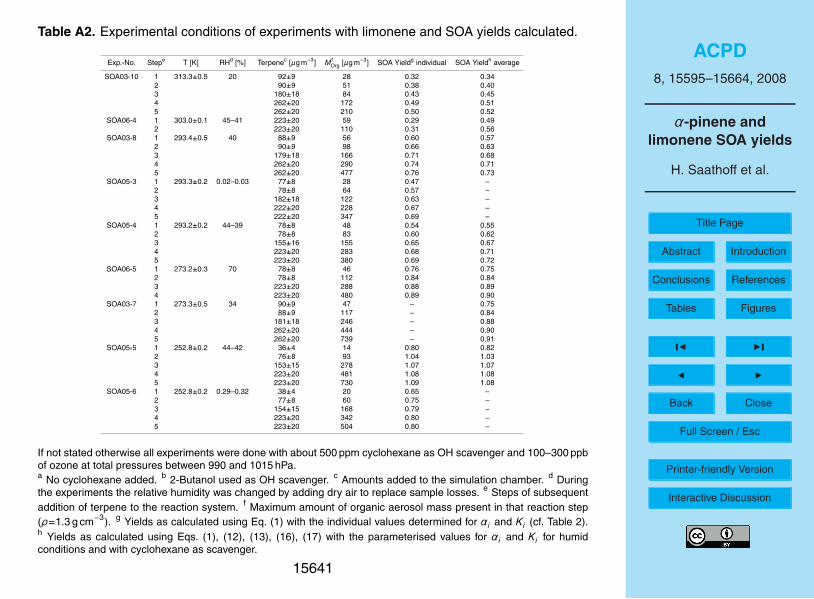
ACPD8, 15595–15664, 2008
α-pinene andlimonene SOA yields
H. Saathoff et al.
Title Page
Abstract Introduction
Conclusions References
Tables Figures
J I
J I
Back Close
Full Screen / Esc
Printer-friendly Version
Interactive Discussion
Table A2. Experimental conditions of experiments with limonene and SOA yields calculated.
Exp.-No. Stepe T [K] RHd [%] Terpenec [µg m−3] M fOrg [µg m−3] SOA Yieldg individual SOA Yieldh average
SOA03-10 1 313.3±0.5 20 92±9 28 0.32 0.342 90±9 51 0.38 0.403 180±18 84 0.43 0.454 262±20 172 0.49 0.515 262±20 210 0.50 0.52
SOA06-4 1 303.0±0.1 45–41 223±20 59 0.29 0.492 223±20 110 0.31 0.56
SOA03-8 1 293.4±0.5 40 88±9 56 0.60 0.572 90±9 98 0.66 0.633 179±18 166 0.71 0.684 262±20 290 0.74 0.715 262±20 477 0.76 0.73
SOA05-3 1 293.3±0.2 0.02–0.03 77±8 28 0.47 –2 78±8 64 0.57 –3 182±18 122 0.63 –4 222±20 228 0.67 –5 222±20 347 0.69 –
SOA05-4 1 293.2±0.2 44–39 78±8 48 0.54 0.552 78±8 83 0.60 0.623 155±16 155 0.65 0.674 223±20 283 0.68 0.715 223±20 380 0.69 0.72
SOA06-5 1 273.2±0.3 70 78±8 46 0.76 0.752 78±8 112 0.84 0.843 223±20 288 0.88 0.894 223±20 480 0.89 0.90
SOA03-7 1 273.3±0.5 34 90±9 47 – 0.752 88±9 117 – 0.843 181±18 246 – 0.884 262±20 444 – 0.905 262±20 739 – 0.91
SOA05-5 1 252.8±0.2 44–42 36±4 14 0.80 0.822 76±8 93 1.04 1.033 153±15 278 1.07 1.074 223±20 481 1.08 1.085 223±20 730 1.09 1.08
SOA05-6 1 252.8±0.2 0.29–0.32 38±4 20 0.65 –2 77±8 60 0.75 –3 154±15 168 0.79 –4 223±20 342 0.80 –5 223±20 504 0.80 –
If not stated otherwise all experiments were done with about 500 ppm cyclohexane as OH scavenger and 100–300 ppbof ozone at total pressures between 990 and 1015 hPa.a No cyclohexane added. b 2-Butanol used as OH scavenger. c Amounts added to the simulation chamber. d Duringthe experiments the relative humidity was changed by adding dry air to replace sample losses. e Steps of subsequentaddition of terpene to the reaction system. f Maximum amount of organic aerosol mass present in that reaction step(ρ=1.3 g cm−3). g Yields as calculated using Eq. (1) with the individual values determined for αi and Ki (cf. Table 2).h Yields as calculated using Eqs. (1), (12), (13), (16), (17) with the parameterised values for αi and Ki for humidconditions and with cyclohexane as scavenger.
15641
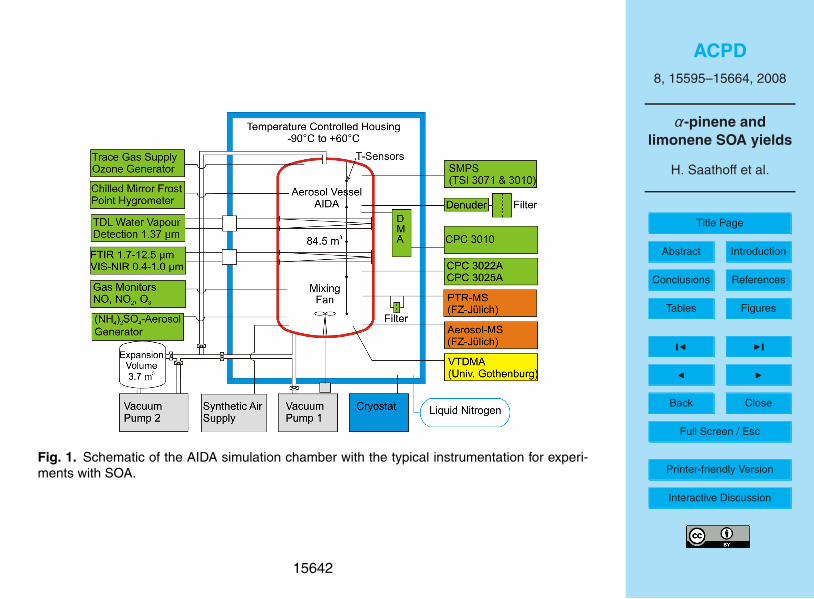
ACPD8, 15595–15664, 2008
α-pinene andlimonene SOA yields
H. Saathoff et al.
Title Page
Abstract Introduction
Conclusions References
Tables Figures
J I
J I
Back Close
Full Screen / Esc
Printer-friendly Version
Interactive Discussion
Fig. 1. Schematic of the AIDA simulation chamber with the typical instrumentation for experi-ments with SOA.
15642
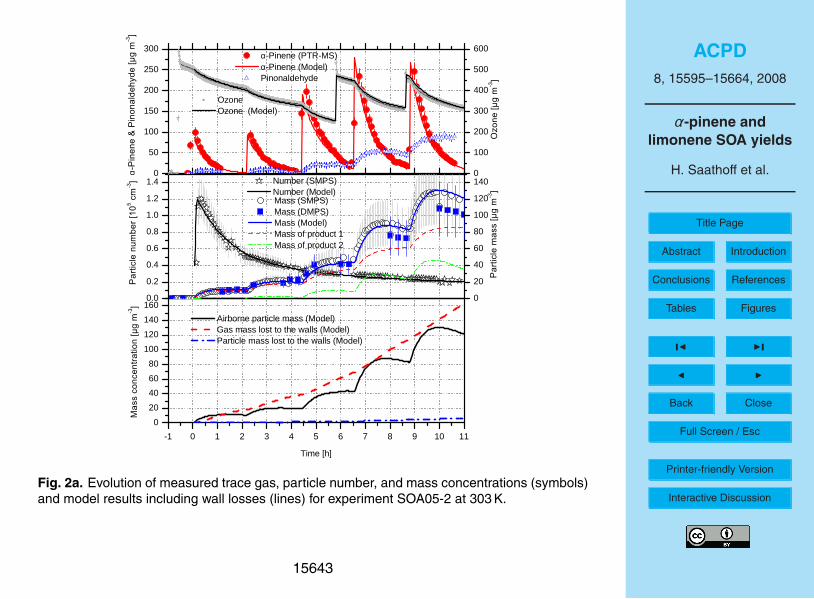
ACPD8, 15595–15664, 2008
α-pinene andlimonene SOA yields
H. Saathoff et al.
Title Page
Abstract Introduction
Conclusions References
Tables Figures
J I
J I
Back Close
Full Screen / Esc
Printer-friendly Version
Interactive Discussion
0 . 00 . 20 . 40 . 60 . 81 . 01 . 21 . 4
02 04 06 08 01 0 01 2 01 4 0
- 1 0 1 2 3 4 5 6 7 8 9 1 0 1 10
2 04 06 08 0
1 0 01 2 01 4 01 6 0
05 0
1 0 01 5 02 0 02 5 03 0 0
01 0 02 0 03 0 04 0 05 0 06 0 0
N u m b e r ( S M P S ) N u m b e r ( M o d e l )
����
�����
�����
���� ��
��� �
M a s s ( S M P S ) M a s s ( D M P S ) M a s s ( M o d e l ) M a s s o f p r o d u c t 1 M a s s o f p r o d u c t 2
����
����
�����
����� �
A i r b o r n e p a r t i c l e m a s s ( M o d e l ) G a s m a s s l o s t t o t h e w a l l s ( M o d e l ) P a r t i c l e m a s s l o s t t o t h e w a l l s ( M o d e l )
� ��
�����
����
������
����
�� �
T i m e [ h ]
α- P i n e n e ( P T R - M S ) α- P i n e n e ( M o d e l ) P i n o n a l d e h y d e
���
�����
����
����
�����
����
�� �
O z o n e O z o n e ( M o d e l )
���
�����
���� �
Fig. 2a. Evolution of measured trace gas, particle number, and mass concentrations (symbols)and model results including wall losses (lines) for experiment SOA05-2 at 303 K.
15643
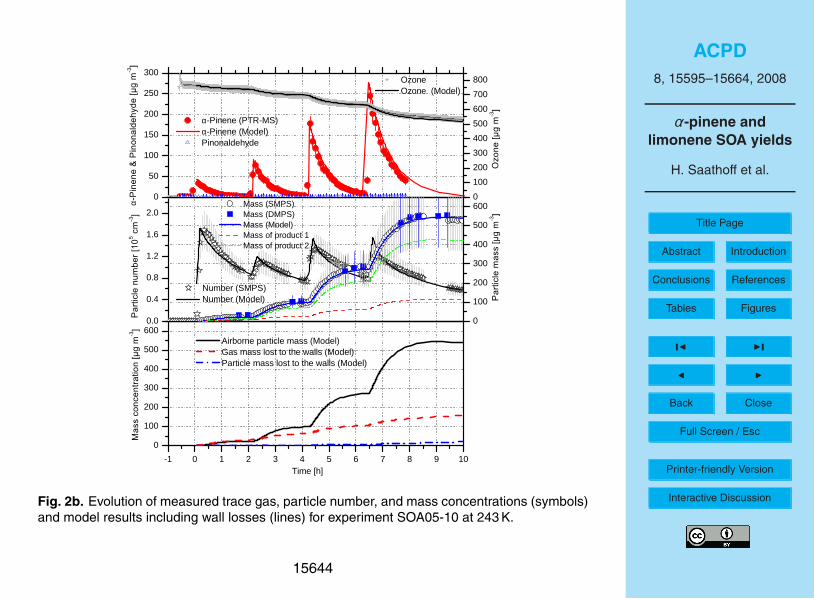
ACPD8, 15595–15664, 2008
α-pinene andlimonene SOA yields
H. Saathoff et al.
Title Page
Abstract Introduction
Conclusions References
Tables Figures
J I
J I
Back Close
Full Screen / Esc
Printer-friendly Version
Interactive Discussion
0 . 00 . 40 . 81 . 21 . 62 . 0
01 0 02 0 03 0 04 0 05 0 06 0 0
- 1 0 1 2 3 4 5 6 7 8 9 1 00
1 0 02 0 03 0 04 0 05 0 06 0 0
05 0
1 0 01 5 02 0 02 5 03 0 0
01 0 02 0 03 0 04 0 05 0 06 0 07 0 08 0 0
N u m b e r ( S M P S ) N u m b e r ( M o d e l )
����
�����
�����
���� ��
��� �
M a s s ( S M P S ) M a s s ( D M P S ) M a s s ( M o d e l ) M a s s o f p r o d u c t 1 M a s s o f p r o d u c t 2
����
����
�����
����� �
�
A i r b o r n e p a r t i c l e m a s s ( M o d e l ) G a s m a s s l o s t t o t h e w a l l s ( M o d e l ) P a r t i c l e m a s s l o s t t o t h e w a l l s ( M o d e l )
� ��
�����
����
������
����
�� �
T i m e [ h ]
α- P i n e n e ( P T R - M S ) α- P i n e n e ( M o d e l ) P i n o n a l d e h y d e
���
�����
����
����
�����
����
�� �
O z o n e O z o n e ( M o d e l )
���
�����
���� �
Fig. 2b. Evolution of measured trace gas, particle number, and mass concentrations (symbols)and model results including wall losses (lines) for experiment SOA05-10 at 243 K.
15644
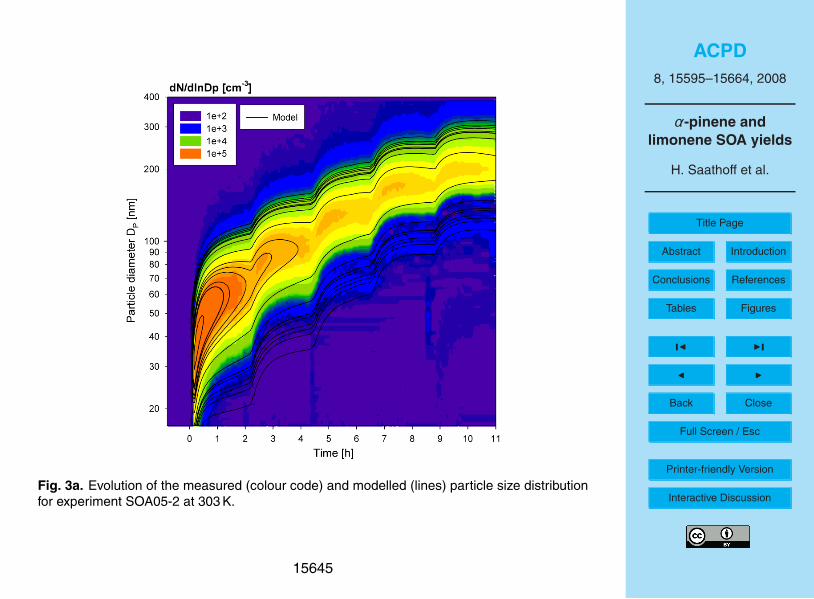
ACPD8, 15595–15664, 2008
α-pinene andlimonene SOA yields
H. Saathoff et al.
Title Page
Abstract Introduction
Conclusions References
Tables Figures
J I
J I
Back Close
Full Screen / Esc
Printer-friendly Version
Interactive DiscussionFig. 3a. Evolution of the measured (colour code) and modelled (lines) particle size distributionfor experiment SOA05-2 at 303 K.
15645
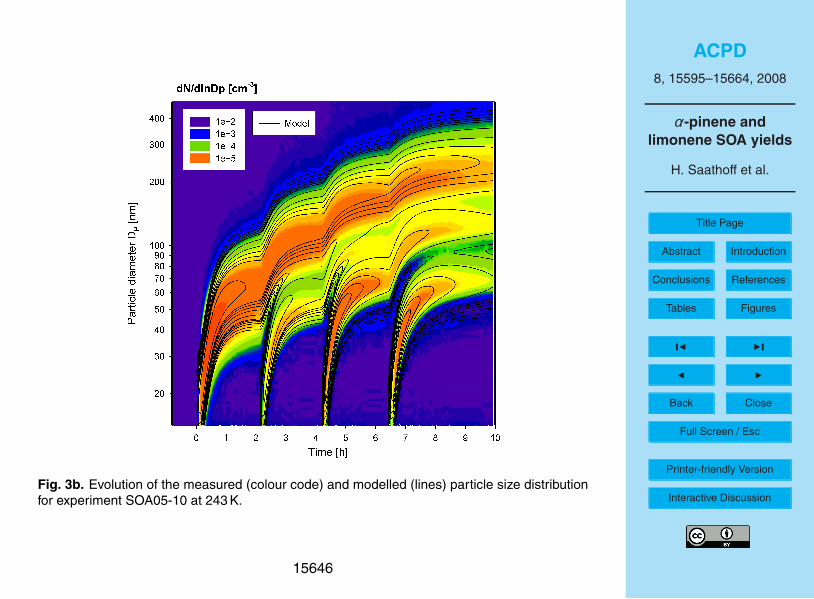
ACPD8, 15595–15664, 2008
α-pinene andlimonene SOA yields
H. Saathoff et al.
Title Page
Abstract Introduction
Conclusions References
Tables Figures
J I
J I
Back Close
Full Screen / Esc
Printer-friendly Version
Interactive DiscussionFig. 3b. Evolution of the measured (colour code) and modelled (lines) particle size distributionfor experiment SOA05-10 at 243 K.
15646
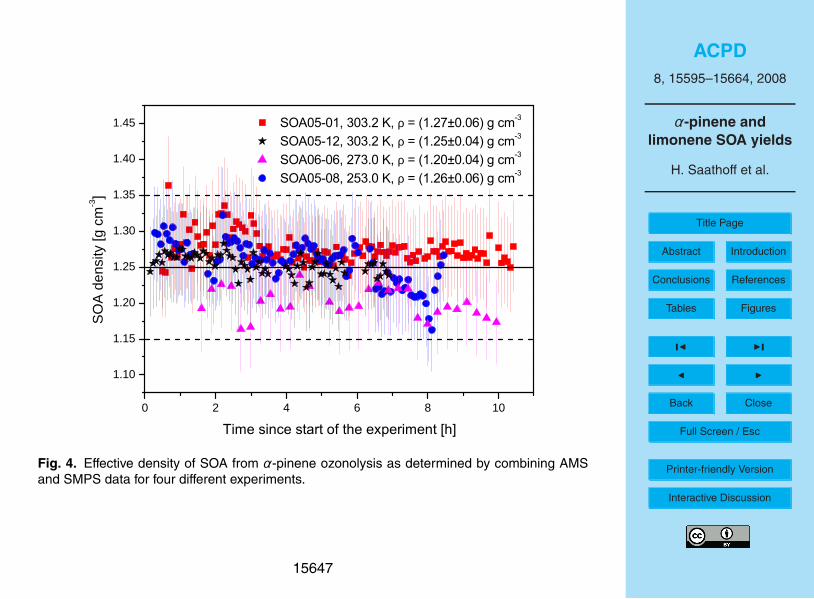
ACPD8, 15595–15664, 2008
α-pinene andlimonene SOA yields
H. Saathoff et al.
Title Page
Abstract Introduction
Conclusions References
Tables Figures
J I
J I
Back Close
Full Screen / Esc
Printer-friendly Version
Interactive Discussion
0 2 4 6 8 1 0
1 . 1 0
1 . 1 5
1 . 2 0
1 . 2 5
1 . 3 0
1 . 3 5
1 . 4 0
1 . 4 5
�
����������������������'��� �������
���������������������'�����������
����� �� ��������������'�����������
���������������������� '��� �������
SOA d
ensity
[g cm
-3 ]
�����$� ���$%�#%�!��%����&"�#��� %����Fig. 4. Effective density of SOA from α-pinene ozonolysis as determined by combining AMSand SMPS data for four different experiments.
15647
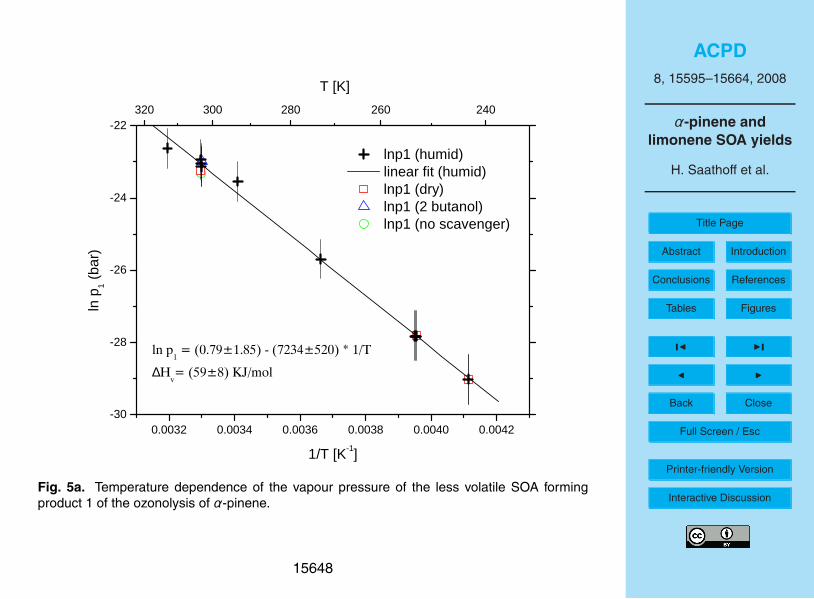
ACPD8, 15595–15664, 2008
α-pinene andlimonene SOA yields
H. Saathoff et al.
Title Page
Abstract Introduction
Conclusions References
Tables Figures
J I
J I
Back Close
Full Screen / Esc
Printer-friendly Version
Interactive Discussion
0 . 0 0 3 2 0 . 0 0 3 4 0 . 0 0 3 6 0 . 0 0 3 8 0 . 0 0 4 0 0 . 0 0 4 2- 3 0
- 2 8
- 2 6
- 2 4
- 2 23 2 0 3 0 0 2 8 0 2 6 0 2 4 0
l n p 1 ( h u m i d ) l i n e a r f i t ( h u m i d ) l n p 1 ( d r y ) l n p 1 ( 2 b u t a n o l ) l n p 1 ( n o s c a v e n g e r )
ln p 1 (b
ar)
1 / T [ K - 1 ]
��������������� ��������� �������∆����� �����������
T [ K ]
Fig. 5a. Temperature dependence of the vapour pressure of the less volatile SOA formingproduct 1 of the ozonolysis of α-pinene.
15648
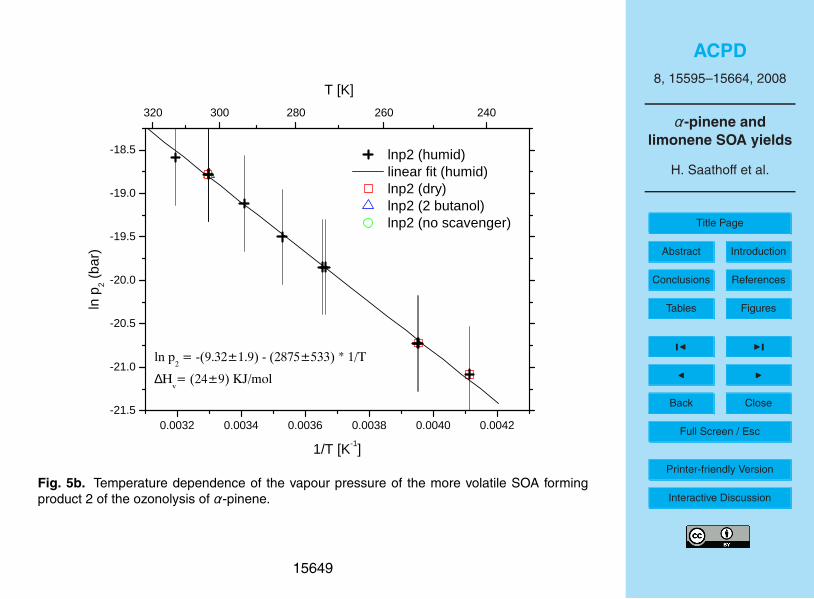
ACPD8, 15595–15664, 2008
α-pinene andlimonene SOA yields
H. Saathoff et al.
Title Page
Abstract Introduction
Conclusions References
Tables Figures
J I
J I
Back Close
Full Screen / Esc
Printer-friendly Version
Interactive Discussion
0 . 0 0 3 2 0 . 0 0 3 4 0 . 0 0 3 6 0 . 0 0 3 8 0 . 0 0 4 0 0 . 0 0 4 2- 2 1 . 5
- 2 1 . 0
- 2 0 . 5
- 2 0 . 0
- 1 9 . 5
- 1 9 . 0
- 1 8 . 5
3 2 0 3 0 0 2 8 0 2 6 0 2 4 0
l n p 2 ( h u m i d ) l i n e a r f i t ( h u m i d ) l n p 2 ( d r y ) l n p 2 ( 2 b u t a n o l ) l n p 2 ( n o s c a v e n g e r )
ln p 2 (b
ar)
1 / T [ K - 1 ]
��������������������� ����������∆����������������
T [ K ]
Fig. 5b. Temperature dependence of the vapour pressure of the more volatile SOA formingproduct 2 of the ozonolysis of α-pinene.
15649
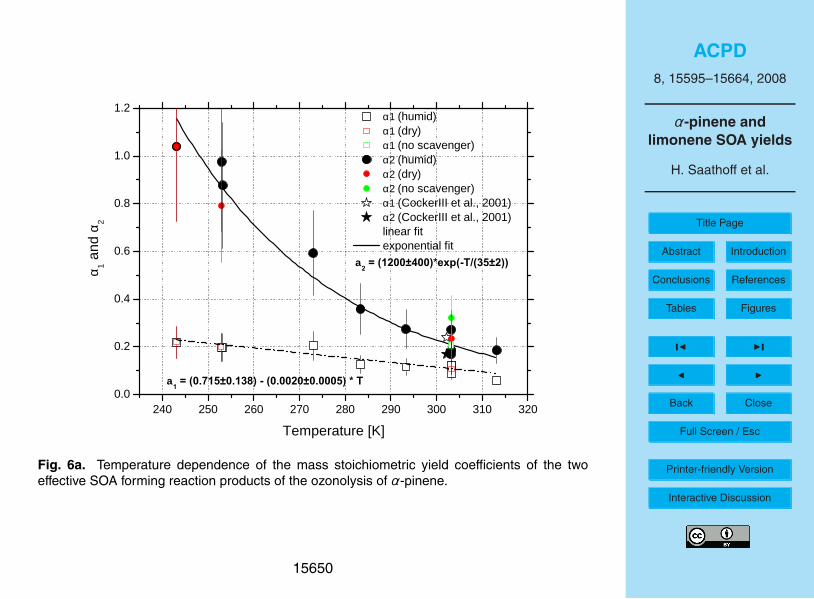
ACPD8, 15595–15664, 2008
α-pinene andlimonene SOA yields
H. Saathoff et al.
Title Page
Abstract Introduction
Conclusions References
Tables Figures
J I
J I
Back Close
Full Screen / Esc
Printer-friendly Version
Interactive Discussion
2 4 0 2 5 0 2 6 0 2 7 0 2 8 0 2 9 0 3 0 0 3 1 0 3 2 00 . 0
0 . 2
0 . 4
0 . 6
0 . 8
1 . 0
1 . 2
α1 ( h u m i d ) α1 ( d r y ) α1 ( n o s c a v e n g e r ) α2 ( h u m i d ) α2 ( d r y ) α2 ( n o s c a v e n g e r ) α1 ( C o c k e r I I I e t a l . , 2 0 0 1 ) α2 ( C o c k e r I I I e t a l . , 2 0 0 1 ) l i n e a r f i t e x p o n e n t i a l f i t
α 1 and α
2
T e m p e r a t u r e [ K ]
a ������� ��������������������� �����
a ��������������������� ���
Fig. 6a. Temperature dependence of the mass stoichiometric yield coefficients of the twoeffective SOA forming reaction products of the ozonolysis of α-pinene.
15650
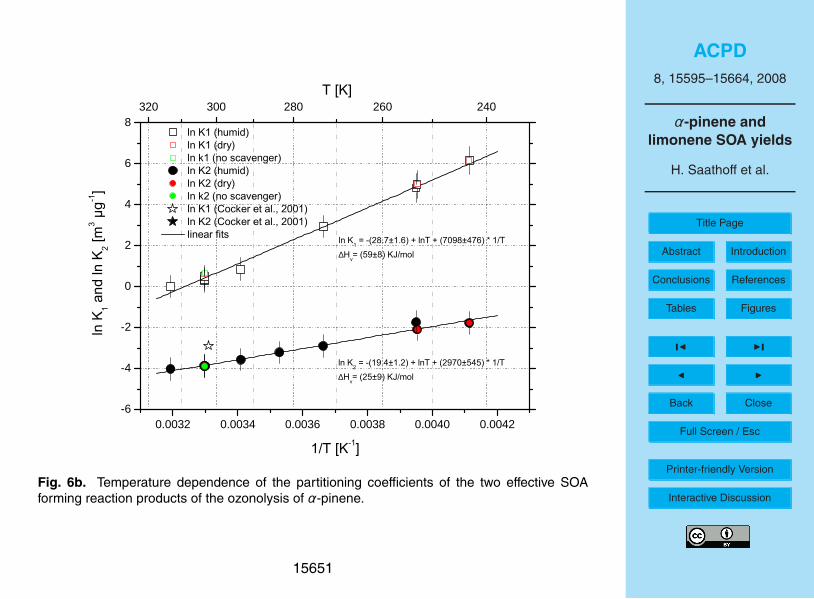
ACPD8, 15595–15664, 2008
α-pinene andlimonene SOA yields
H. Saathoff et al.
Title Page
Abstract Introduction
Conclusions References
Tables Figures
J I
J I
Back Close
Full Screen / Esc
Printer-friendly Version
Interactive Discussion
0 . 0 0 3 2 0 . 0 0 3 4 0 . 0 0 3 6 0 . 0 0 3 8 0 . 0 0 4 0 0 . 0 0 4 2- 6
- 4
- 2
0
2
4
6
83 2 0 3 0 0 2 8 0 2 6 0 2 4 0
�
�$&�����!+%"���$&������(-��$&�#���&'�)��,�& �(��$&�����!+%"���$&������(-��$&�#���&'�)��,�& �(��$&������'�#�(��*��$�������$&������'�#�(��*��$�������$"&��(��"*)
���� ��
���
������
� ����� �
��������
$&������������.�������$&��������. ��������∆�,�����.�����%'$
$&����������� .�������$&��������.� �������∆�,�����.�����%'$
������
Fig. 6b. Temperature dependence of the partitioning coefficients of the two effective SOAforming reaction products of the ozonolysis of α-pinene.
15651
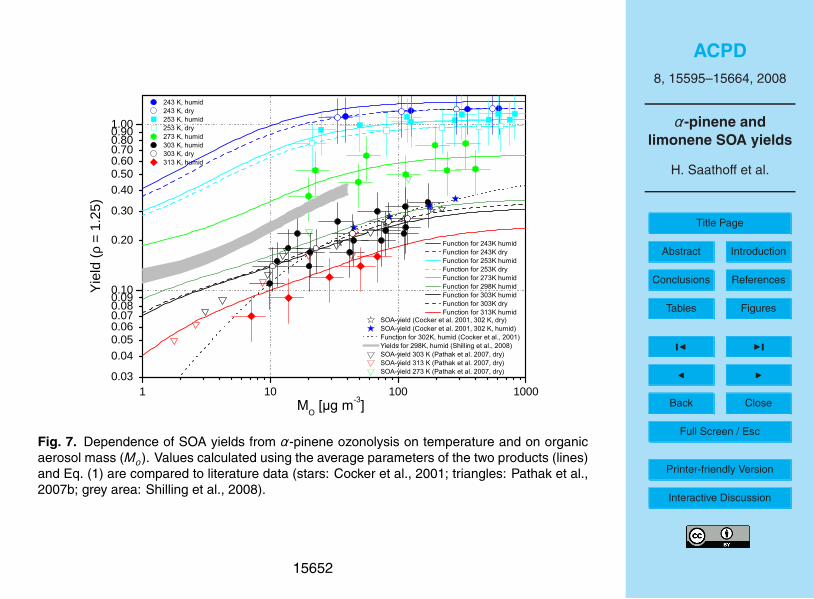
ACPD8, 15595–15664, 2008
α-pinene andlimonene SOA yields
H. Saathoff et al.
Title Page
Abstract Introduction
Conclusions References
Tables Figures
J I
J I
Back Close
Full Screen / Esc
Printer-friendly Version
Interactive Discussion
1 1 0 1 0 0 1 0 0 00 . 0 30 . 0 40 . 0 50 . 0 60 . 0 70 . 0 80 . 0 90 . 1 0
0 . 2 0
0 . 3 00 . 4 00 . 5 00 . 6 00 . 7 00 . 8 00 . 9 01 . 0 0
������!+%"��������(,������!+%"��������(,� ����!+%"�������!+%"��������(,������!+%"�
�����,"�$����'�#�(��*��$�������������(,������,"�$����'�#�(��*��$������������!+%"����+&�*"'&��'(�����!+%"����'�#�(��*��$���������"�$�)��'(������!+%"����!"$$"& ��*��$������������,"�$���������*!�#��*��$���� ���(,������,"�$���������*!�#��*��$���� ���(,������,"�$�� ������*!�#��*��$���� ���(,�
�
��+&�*"'&��'(����!+%"���+&�*"'&��'(�����(,��+&�*"'&��'(����!+%"���+&�*"'&��'(�����(,��+&�*"'&��'(� ��!+%"���+&�*"'&��'(�����!+%"���+&�*"'&��'(����!+%"���+&�*"'&��'(�����(,��+&�*"'&��'(����!+%"�
Yield
(ρ = 1
.25)
����- �%��
Fig. 7. Dependence of SOA yields from α-pinene ozonolysis on temperature and on organicaerosol mass (Mo). Values calculated using the average parameters of the two products (lines)and Eq. (1) are compared to literature data (stars: Cocker et al., 2001; triangles: Pathak et al.,2007b; grey area: Shilling et al., 2008).
15652
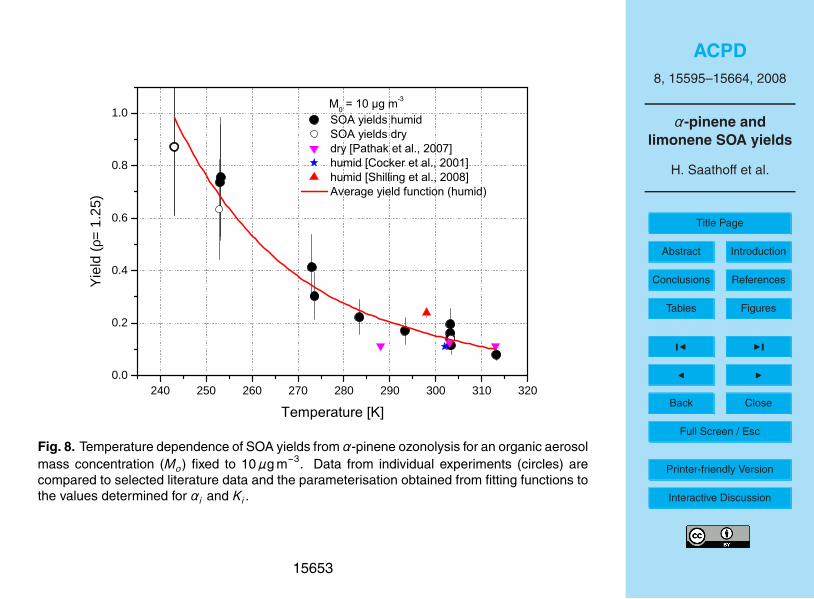
ACPD8, 15595–15664, 2008
α-pinene andlimonene SOA yields
H. Saathoff et al.
Title Page
Abstract Introduction
Conclusions References
Tables Figures
J I
J I
Back Close
Full Screen / Esc
Printer-friendly Version
Interactive Discussion
2 4 0 2 5 0 2 6 0 2 7 0 2 8 0 2 9 0 3 0 0 3 1 0 3 2 00 . 0
0 . 2
0 . 4
0 . 6
0 . 8
1 . 0
�
�����+��!�'��)"�������+��!�'��&+��&+����(�� ��(��!���������)"�����$� �&��(��!���������)"�������!!�#���(��!���������*�&����+��!���)#�(�$#���)"���
Yield
(ρ= 1.
25)
��"%�&�()&�����
��� ����,��"�
Fig. 8. Temperature dependence of SOA yields from α-pinene ozonolysis for an organic aerosolmass concentration (Mo) fixed to 10µg m−3. Data from individual experiments (circles) arecompared to selected literature data and the parameterisation obtained from fitting functions tothe values determined for αi and Ki .
15653
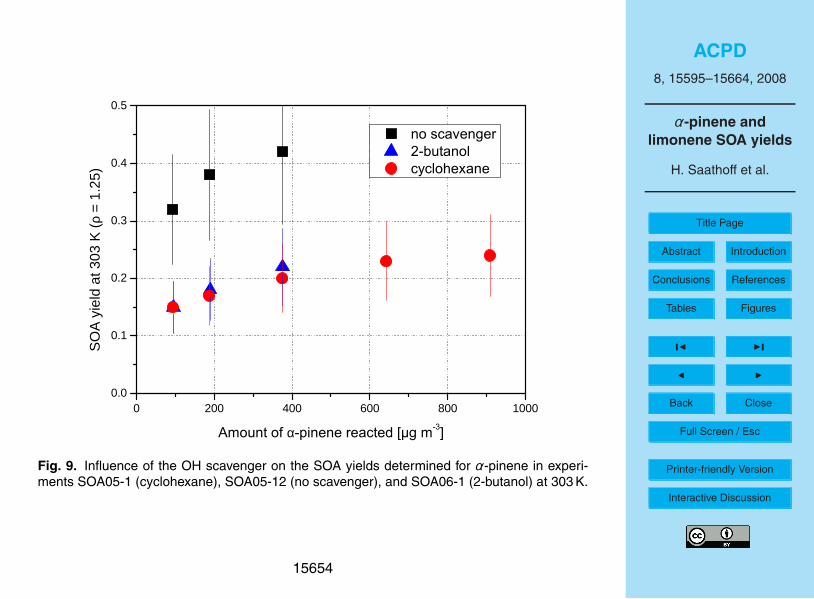
ACPD8, 15595–15664, 2008
α-pinene andlimonene SOA yields
H. Saathoff et al.
Title Page
Abstract Introduction
Conclusions References
Tables Figures
J I
J I
Back Close
Full Screen / Esc
Printer-friendly Version
Interactive Discussion
0 2 0 0 4 0 0 6 0 0 8 0 0 1 0 0 00 . 0
0 . 1
0 . 2
0 . 3
0 . 4
0 . 5�
�������������������������������
SOA y
ield at
303 K
(ρ =
1.25)
�������� �α�����������������������Fig. 9. Influence of the OH scavenger on the SOA yields determined for α-pinene in experi-ments SOA05-1 (cyclohexane), SOA05-12 (no scavenger), and SOA06-1 (2-butanol) at 303 K.
15654
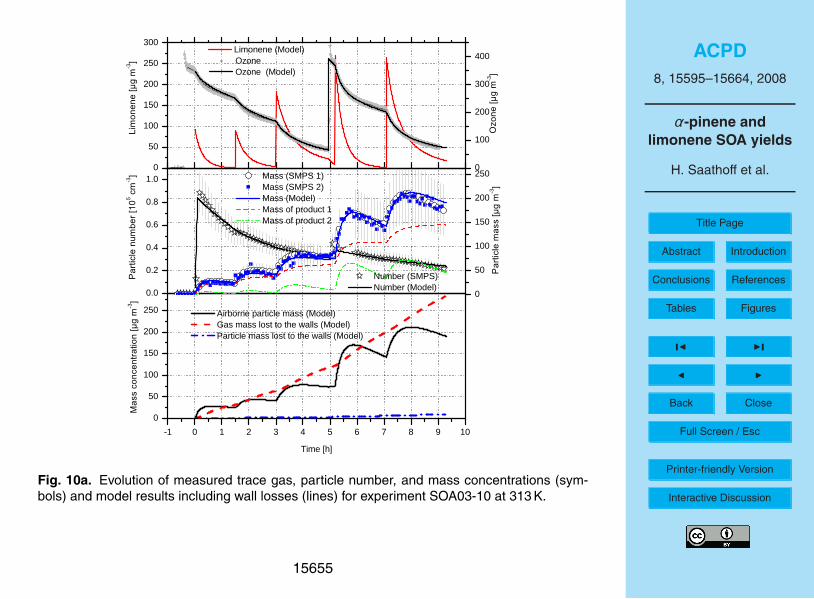
ACPD8, 15595–15664, 2008
α-pinene andlimonene SOA yields
H. Saathoff et al.
Title Page
Abstract Introduction
Conclusions References
Tables Figures
J I
J I
Back Close
Full Screen / Esc
Printer-friendly Version
Interactive Discussion
0 . 0
0 . 2
0 . 4
0 . 6
0 . 8
1 . 0
0
5 0
1 0 0
1 5 0
2 0 0
2 5 0
- 1 0 1 2 3 4 5 6 7 8 9 1 00
5 01 0 01 5 02 0 02 5 0
05 0
1 0 01 5 02 0 02 5 03 0 0
0
1 0 0
2 0 0
3 0 0
4 0 0
N u m b e r ( S M P S ) N u m b e r ( M o d e l )
����
�����
�����
���� ��
��� � M a s s ( S M P S 1 ) M a s s ( S M P S 2 ) M a s s ( M o d e l ) M a s s o f p r o d u c t 1 M a s s o f p r o d u c t 2
����
����
�����
����� �
A i r b o r n e p a r t i c l e m a s s ( M o d e l ) G a s m a s s l o s t t o t h e w a l l s ( M o d e l ) P a r t i c l e m a s s l o s t t o t h e w a l l s ( M o d e l )
� ��
�����
����
������
����
�� �
T i m e [ h ]
L i m o n e n e ( M o d e l )
�����
�����
����
�� � O z o n e O z o n e ( M o d e l )
���
�����
���� �
Fig. 10a. Evolution of measured trace gas, particle number, and mass concentrations (sym-bols) and model results including wall losses (lines) for experiment SOA03-10 at 313 K.
15655
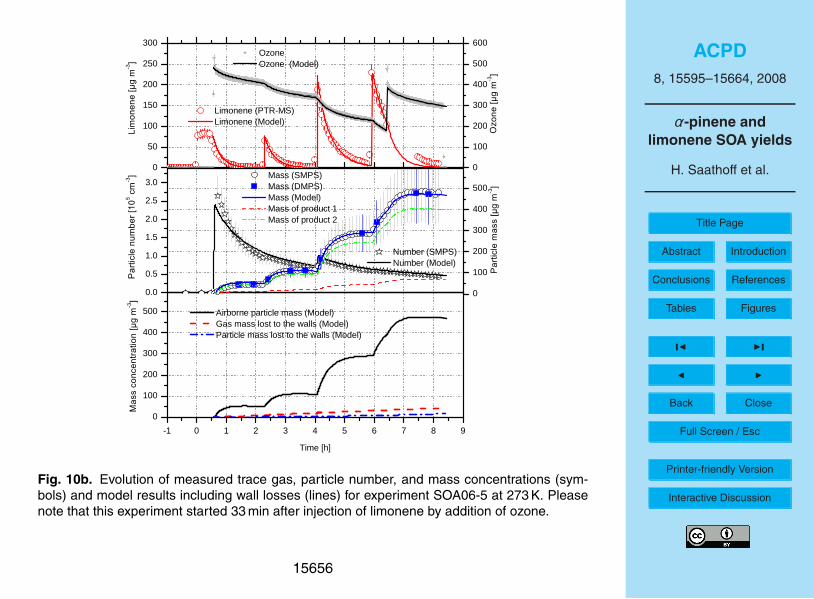
ACPD8, 15595–15664, 2008
α-pinene andlimonene SOA yields
H. Saathoff et al.
Title Page
Abstract Introduction
Conclusions References
Tables Figures
J I
J I
Back Close
Full Screen / Esc
Printer-friendly Version
Interactive Discussion
0 . 00 . 51 . 01 . 52 . 02 . 53 . 0
01 0 02 0 03 0 04 0 05 0 0
- 1 0 1 2 3 4 5 6 7 8 90
1 0 02 0 03 0 04 0 05 0 0
05 0
1 0 01 5 02 0 02 5 03 0 0
01 0 02 0 03 0 04 0 05 0 06 0 0
N u m b e r ( S M P S ) N u m b e r ( M o d e l )
����
�����
�����
���� ��
��� � M a s s ( S M P S ) M a s s ( D M P S ) M a s s ( M o d e l ) M a s s o f p r o d u c t 1 M a s s o f p r o d u c t 2
����
����
�����
����� �
A i r b o r n e p a r t i c l e m a s s ( M o d e l ) G a s m a s s l o s t t o t h e w a l l s ( M o d e l ) P a r t i c l e m a s s l o s t t o t h e w a l l s ( M o d e l )
� ��
�����
����
������
����
�� �
T i m e [ h ]
L i m o n e n e ( P T R - M S ) L i m o n e n e ( M o d e l )
�����
�����
����
�� �
O z o n e O z o n e ( M o d e l )
���
�����
���� �
Fig. 10b. Evolution of measured trace gas, particle number, and mass concentrations (sym-bols) and model results including wall losses (lines) for experiment SOA06-5 at 273 K. Pleasenote that this experiment started 33 min after injection of limonene by addition of ozone.
15656
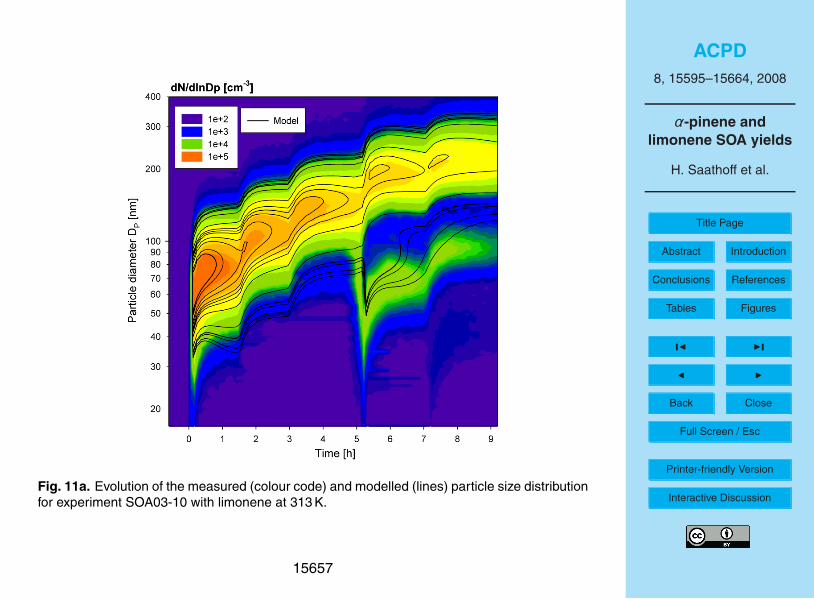
ACPD8, 15595–15664, 2008
α-pinene andlimonene SOA yields
H. Saathoff et al.
Title Page
Abstract Introduction
Conclusions References
Tables Figures
J I
J I
Back Close
Full Screen / Esc
Printer-friendly Version
Interactive DiscussionFig. 11a. Evolution of the measured (colour code) and modelled (lines) particle size distributionfor experiment SOA03-10 with limonene at 313 K.
15657
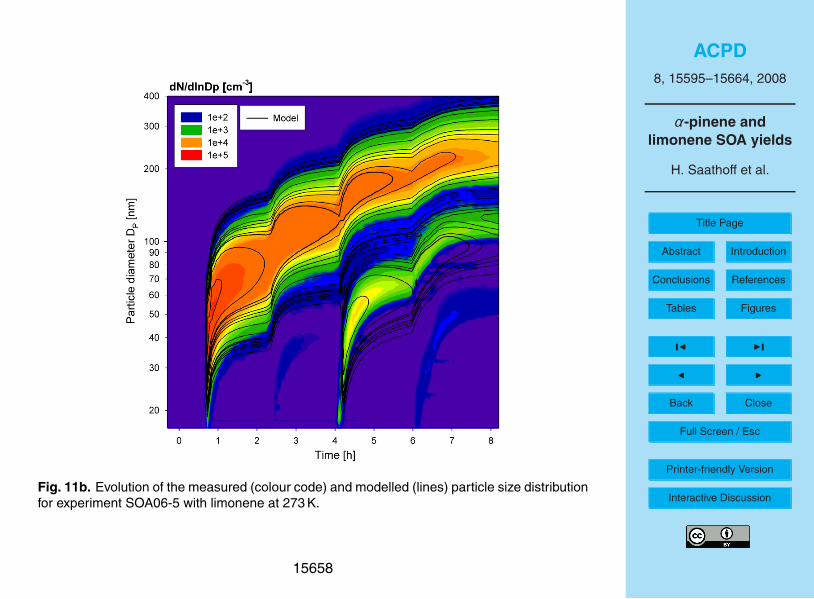
ACPD8, 15595–15664, 2008
α-pinene andlimonene SOA yields
H. Saathoff et al.
Title Page
Abstract Introduction
Conclusions References
Tables Figures
J I
J I
Back Close
Full Screen / Esc
Printer-friendly Version
Interactive DiscussionFig. 11b. Evolution of the measured (colour code) and modelled (lines) particle size distributionfor experiment SOA06-5 with limonene at 273 K.
15658
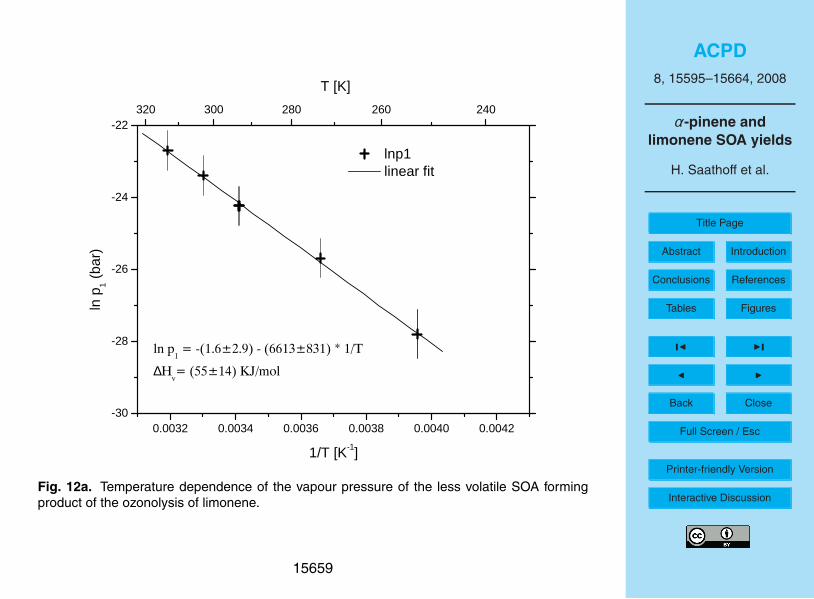
ACPD8, 15595–15664, 2008
α-pinene andlimonene SOA yields
H. Saathoff et al.
Title Page
Abstract Introduction
Conclusions References
Tables Figures
J I
J I
Back Close
Full Screen / Esc
Printer-friendly Version
Interactive Discussion
0 . 0 0 3 2 0 . 0 0 3 4 0 . 0 0 3 6 0 . 0 0 3 8 0 . 0 0 4 0 0 . 0 0 4 2- 3 0
- 2 8
- 2 6
- 2 4
- 2 23 2 0 3 0 0 2 8 0 2 6 0 2 4 0
l n p 1 l i n e a r f i t
ln p 1 (b
ar)
1 / T [ K - 1 ]
������������ �������� �����������∆������������������
T [ K ]
Fig. 12a. Temperature dependence of the vapour pressure of the less volatile SOA formingproduct of the ozonolysis of limonene.
15659
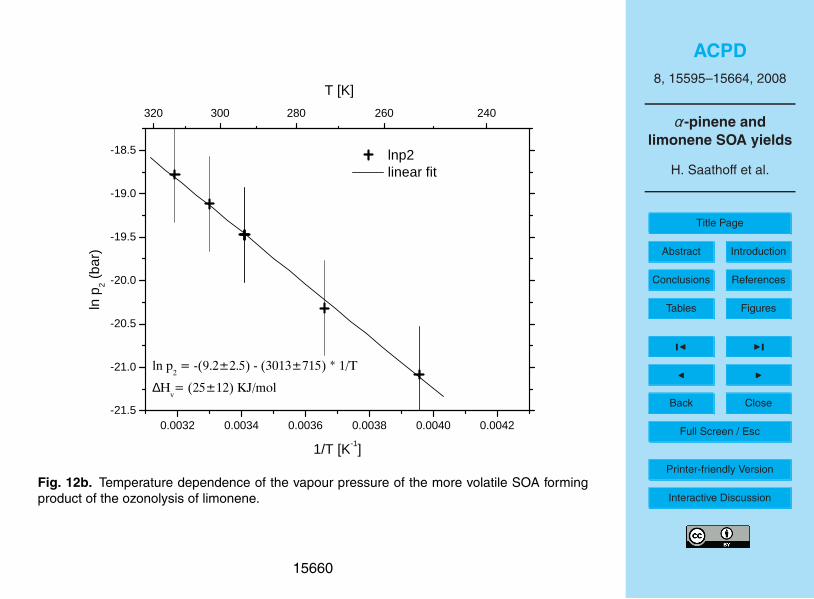
ACPD8, 15595–15664, 2008
α-pinene andlimonene SOA yields
H. Saathoff et al.
Title Page
Abstract Introduction
Conclusions References
Tables Figures
J I
J I
Back Close
Full Screen / Esc
Printer-friendly Version
Interactive Discussion
0 . 0 0 3 2 0 . 0 0 3 4 0 . 0 0 3 6 0 . 0 0 3 8 0 . 0 0 4 0 0 . 0 0 4 2- 2 1 . 5
- 2 1 . 0
- 2 0 . 5
- 2 0 . 0
- 1 9 . 5
- 1 9 . 0
- 1 8 . 5
3 2 0 3 0 0 2 8 0 2 6 0 2 4 0
l n p 2 l i n e a r f i t
ln p 2 (b
ar)
1 / T [ K - 1 ]
����������������������� �������∆���������������
T [ K ]
Fig. 12b. Temperature dependence of the vapour pressure of the more volatile SOA formingproduct of the ozonolysis of limonene.
15660
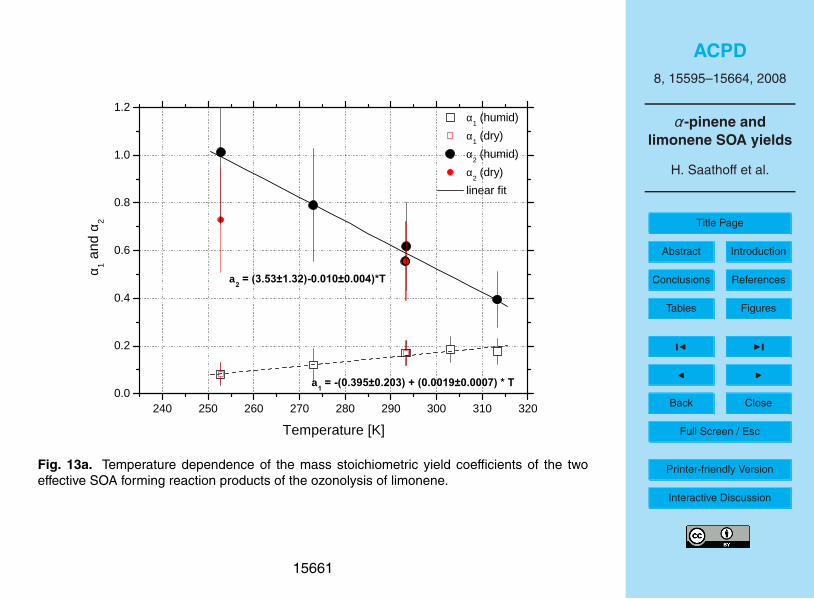
ACPD8, 15595–15664, 2008
α-pinene andlimonene SOA yields
H. Saathoff et al.
Title Page
Abstract Introduction
Conclusions References
Tables Figures
J I
J I
Back Close
Full Screen / Esc
Printer-friendly Version
Interactive Discussion
2 4 0 2 5 0 2 6 0 2 7 0 2 8 0 2 9 0 3 0 0 3 1 0 3 2 00 . 0
0 . 2
0 . 4
0 . 6
0 . 8
1 . 0
1 . 2
α1 ( h u m i d ) α1 ( d r y ) α2 ( h u m i d ) α2 ( d r y ) l i n e a r f i t
α 1 and α
2
T e m p e r a t u r e [ K ]
a ��������� ���������������������������
a ������ �������������������
Fig. 13a. Temperature dependence of the mass stoichiometric yield coefficients of the twoeffective SOA forming reaction products of the ozonolysis of limonene.
15661
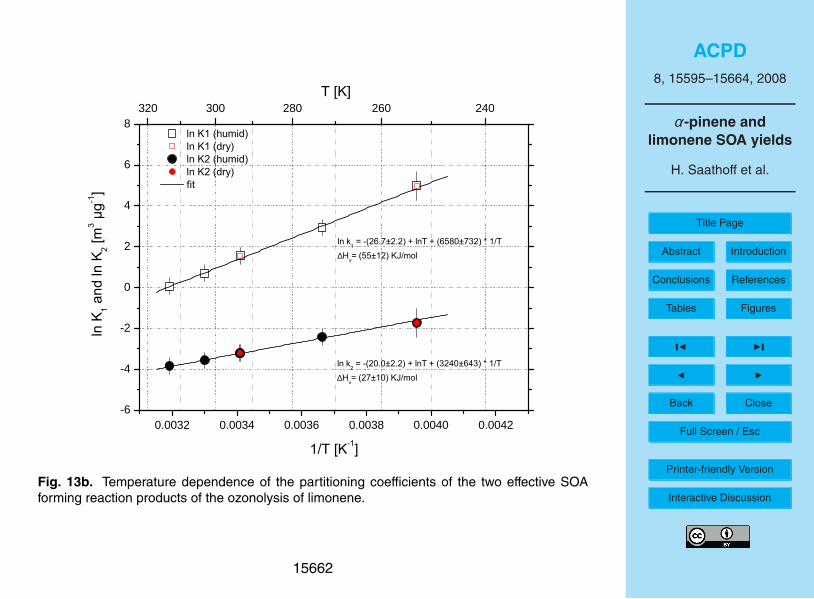
ACPD8, 15595–15664, 2008
α-pinene andlimonene SOA yields
H. Saathoff et al.
Title Page
Abstract Introduction
Conclusions References
Tables Figures
J I
J I
Back Close
Full Screen / Esc
Printer-friendly Version
Interactive Discussion
0 . 0 0 3 2 0 . 0 0 3 4 0 . 0 0 3 6 0 . 0 0 3 8 0 . 0 0 4 0 0 . 0 0 4 2- 6
- 4
- 2
0
2
4
6
83 2 0 3 0 0 2 8 0 2 6 0 2 4 0
�
�� �����$������ �����"&��� ������$������ ������"&����#
���� ��
���
������
� ����� �
�������
� �����������'�������� ��������'���������∆�%�����'�������!�
� ����������'�������� ������� '� �������∆�%�����'������!�
������
Fig. 13b. Temperature dependence of the partitioning coefficients of the two effective SOAforming reaction products of the ozonolysis of limonene.
15662
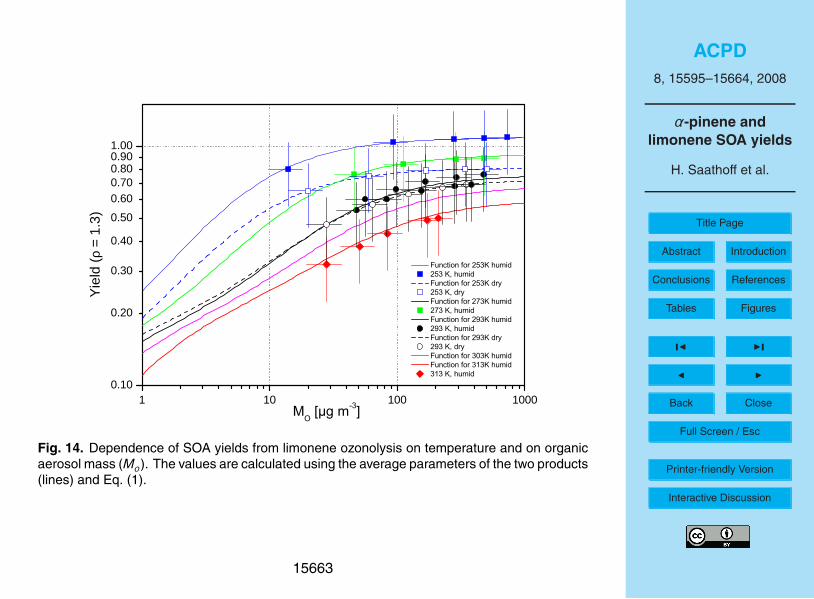
ACPD8, 15595–15664, 2008
α-pinene andlimonene SOA yields
H. Saathoff et al.
Title Page
Abstract Introduction
Conclusions References
Tables Figures
J I
J I
Back Close
Full Screen / Esc
Printer-friendly Version
Interactive Discussion
1 1 0 1 0 0 1 0 0 00 . 1 0
0 . 2 0
0 . 3 0
0 . 4 00 . 5 00 . 6 00 . 7 00 . 8 00 . 9 01 . 0 0
�
����������������������������������������������������������������������������������������������������������������������������������������������������������������������������������������������������������������������������������������
Yield
(ρ = 1
.3)
����������
Fig. 14. Dependence of SOA yields from limonene ozonolysis on temperature and on organicaerosol mass (Mo). The values are calculated using the average parameters of the two products(lines) and Eq. (1).
15663
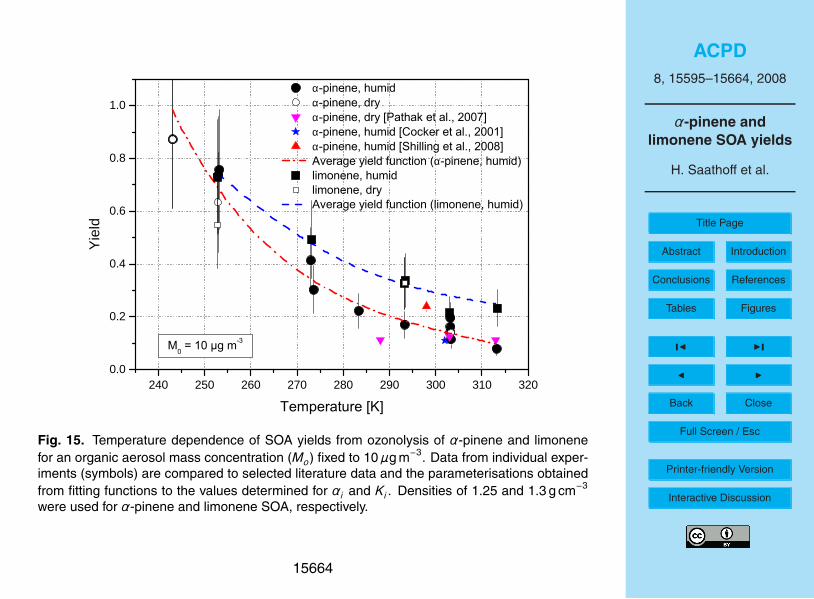
ACPD8, 15595–15664, 2008
α-pinene andlimonene SOA yields
H. Saathoff et al.
Title Page
Abstract Introduction
Conclusions References
Tables Figures
J I
J I
Back Close
Full Screen / Esc
Printer-friendly Version
Interactive Discussion
2 4 0 2 5 0 2 6 0 2 7 0 2 8 0 2 9 0 3 0 0 3 1 0 3 2 00 . 0
0 . 2
0 . 4
0 . 6
0 . 8
1 . 0
�
�α�$�"�"����'!���α�$�"�"����%)�α�$�"�"����%)����&�����&�� ��������α�$�"�"����'!�����#���%��&�� ��������α�$�"�"����'!������� �"���&�� �����������(�%����)�� ���'"�&�#"��α�$�"�"����'!���� �!#"�"����'!��� �!#"�"����%)��(�%����)�� ���'"�&�#"�� �!#"�"����'!���
Yield
��!$�%�&'%�����
��� ����*��!�
Fig. 15. Temperature dependence of SOA yields from ozonolysis of α-pinene and limonenefor an organic aerosol mass concentration (Mo) fixed to 10µg m−3. Data from individual exper-iments (symbols) are compared to selected literature data and the parameterisations obtainedfrom fitting functions to the values determined for αi and Ki . Densities of 1.25 and 1.3 g cm−3
were used for α-pinene and limonene SOA, respectively.
15664


![Product sheet extended€¦ · LTS - Load Transfer Switch [Accessories for ACP Automatic Control Panel] The Load Transfer Switch (LTS) panel operates the power supply changeover between](https://static.fdocument.org/doc/165x107/604baa402bd4a154a6763b39/product-sheet-extended-lts-load-transfer-switch-accessories-for-acp-automatic.jpg)


![GSW670P - adeltd.co.uk · LTS - Load Transfer Switch [Accessories for ACP Automatic Control Panel] The Load Transfer Switch (LTS) panel operates the power supply changeover between](https://static.fdocument.org/doc/165x107/604ba8e6b01bc235557c4ce1/gsw670p-lts-load-transfer-switch-accessories-for-acp-automatic-control-panel.jpg)