Phase-plate cryo-EM structure of a class B GPCR–G · PDF filemodifications had no effect...
18
00 MONTH 2017 | VOL 000 | NATURE | 1 ARTICLE doi:10.1038/nature22327 Phase-plate cryo-EM structure of a class B GPCR–G-protein complex Yi-Lynn Liang 1 *, Maryam Khoshouei 2 *, Mazdak Radjainia 3 †*, Yan Zhang 4 *, Alisa Glukhova 1 , Jeffrey Tarrasch 4 , David M. Thal 1 , Sebastian G. B. Furness 1 , George Christopoulos 1 , Thomas Coudrat 1 , Radostin Danev 2 , Wolfgang Baumeister 2 , Laurence J. Miller 5 , Arthur Christopoulos 1 , Brian K. Kobilka 6 , Denise Wootten 1 , Georgios Skiniotis 4 & Patrick M. Sexton 1 G-protein-coupled receptors (GPCRs) are the most abundant cell- surface receptor proteins, important for virtually all physiological processes. As major targets for treatment of disease, understanding GPCR structure and how this relates to their function is critically important for optimal exploitation of their therapeutic potential 1 . GPCRs allosterically transmit extracellular signals to the inside of cells by forming complexes with transducers, such as G proteins or arrestins 2 . To date, crystal structures of around 40 inactive class A GPCRs (of more than 800 encoded in the human genome) have been solved, with most being engineered to improve stability in detergents and/or crystal packing 3 . Far fewer agonist-bound GPCR structures have been determined, and only one in complex with a full heterotrimeric Gαβγ protein 4 . Transmembrane domain structures of class B GPCRs have been especially refractory to crystallization and are currently limited to two inactive state structures 5–7 , with no reported full-length class B GPCR structures, to our knowledge. Class B GPCRs bind physiologically and clinically important peptide hormones and are attractive targets for treatment of major chronic diseases 8 . These receptors have a large extracellular N-terminal domain (ECD) that is important for peptide binding. Multiple structures of the ECD fragments bound to short peptides have been reported 9 , but these do not inform on how bound peptides bind the receptor core for activation. The calcitonin receptor (CTR), a class B GPCR, is a thera- peutic target for the treatment of a range of bone diseases, with salmon calcitonin and human calcitonin approved for clinical use 10 . Single-particle cryo-electron microscopy (cryo-EM) provides a method to obtain high-resolution protein structure information with- out the need for crystallization. Notwithstanding the recent advances in electron detectors and cryo-EM data analysis, successful application of this technology for proteins/complexes smaller than 200 kDa remains challenging owing to the inherent low contrast that limits accurate alignment of projections to derive high resolution 11,12 . The recently introduced approach of using a Volta phase plate for data acquisition with increased contrast sidesteps many trade-offs that hamper struc- ture determination of small proteins by cryo-EM 13–15 . In the current study, we used Volta phase plates to image particles of an approximately 150 kDa complex comprising an unmodified CTR bound to a peptide agonist in complex with a heterotrimeric G s protein. This enabled us to obtain the first near-atomic-resolution structure of an activated GPCR using cryo-EM. Structure determination To enable efficient expression and purification, the CTR was modified to replace the native signal peptide with haemagglutinin (HA), followed by a Flag epitope for affinity purification and an HRV 3C cleavage site, while the C terminus was modified by the addition of an HRV 3C cleavage site and histidine affinity tag (Extended Data Fig. 1). These modifications had no effect on receptor pharmacology (Extended Data Fig. 2). To form an active, G-protein-coupled complex, the CTR was co- expressed with Gα s , His–Gβ 1 , and Gγ 2 in HighFive insect cells and stimulated with an excess of the high-affinity agonist, salmon calcitonin (sCT) that has a very slow off-rate 16,17 . The complex was solubilized in MNG/cholesteryl hemisuccinate and purified using an anti-Flag antibody affinity column and size-exclusion chromatography (SEC) (Extended Data Fig. 3). Further complex stabilization was achieved with the addition of a camelid antibody, Nb35, which binds at the Gα s –Gβ interface and was used in the determination of the β 2 adrenergic receptor (β 2 AR)–G s heterotrimer structure 4 . Addition of purified Nb35 to insect cell membranes expressing CTR, Gα s and βγ before purifica- tion produced a monodispersed complex by SEC that remained stable at 4 °C for at least 5 days; however, as noted for the β 2 AR–G s complex, the G s heterotrimer could no longer bind to GTPγS (Extended Data Figs 2e and 3e). We recorded images of frozen-hydrated sCT–CTR–G s complex using Volta phase-plate cryo-EM, obtaining particle projections with high Class B G-protein-coupled receptors are major targets for the treatment of chronic diseases, such as osteoporosis, diabetes and obesity. Here we report the structure of a full-length class B receptor, the calcitonin receptor, in complex with peptide ligand and heterotrimeric Gα s βγ protein determined by Volta phase-plate single-particle cryo-electron microscopy. The peptide agonist engages the receptor by binding to an extended hydrophobic pocket facilitated by the large outward movement of the extracellular ends of transmembrane helices 6 and 7. This conformation is accompanied by a 60° kink in helix 6 and a large outward movement of the intracellular end of this helix, opening the bundle to accommodate interactions with the α5-helix of Gα s . Also observed is an extended intracellular helix 8 that contributes to both receptor stability and functional G-protein coupling via an interaction with the Gβ subunit. This structure provides a new framework for understanding G-protein-coupled receptor function. 1 Drug Discovery Biology and Department of Pharmacology, Monash Institute of Pharmaceutical Sciences, Monash University, Parkville, 3052 Victoria, Australia. 2 Department of Molecular Structural Biology, Max Planck Institute of Biochemistry, 82152 Martinsried, Germany. 3 Department of Biochemistry and Molecular Biology, Monash University, Clayton, 3800 Victoria, Australia. 4 Life Sciences Institute and Department of Biological Chemistry, University of Michigan Medical School, Ann Arbor, Michigan 48109-2216, USA. 5 Department of Molecular Pharmacology and Experimental Therapeutics, Mayo Clinic, Scottsdale, Arizona 85259, USA. 6 Department of Molecular and Cellular Physiology, Stanford University School of Medicine, Stanford, California 94305, USA. †Present address: FEI, 5651 GG Eindhoven, The Netherlands. *These authors contributed equally to this work. © 2017 Macmillan Publishers Limited, part of Springer Nature. All rights reserved.
Transcript of Phase-plate cryo-EM structure of a class B GPCR–G · PDF filemodifications had no effect...
0 0 M O N T H 2 0 1 7 | V O L 0 0 0 | N A T U R E | 1
ARTICLEdoi:10.1038/nature22327
Phase-plate cryo-EM structure of a class B GPCR–G-protein complexYi-Lynn Liang1*, Maryam Khoshouei2*, Mazdak Radjainia3†*, Yan Zhang4*, Alisa Glukhova1, Jeffrey Tarrasch4, David M. Thal1, Sebastian G. B. Furness1, George Christopoulos1, Thomas Coudrat1, Radostin Danev2, Wolfgang Baumeister2, Laurence J. Miller5, Arthur Christopoulos1, Brian K. Kobilka6, Denise Wootten1, Georgios Skiniotis4 & Patrick M. Sexton1
G-protein-coupled receptors (GPCRs) are the most abundant cell- surface receptor proteins, important for virtually all physiological processes. As major targets for treatment of disease, understanding GPCR structure and how this relates to their function is critically important for optimal exploitation of their therapeutic potential1. GPCRs allosterically transmit extracellular signals to the inside of cells by forming complexes with transducers, such as G proteins or arrestins2. To date, crystal structures of around 40 inactive class A GPCRs (of more than 800 encoded in the human genome) have been solved, with most being engineered to improve stability in detergents and/or crystal packing3. Far fewer agonist-bound GPCR structures have been determined, and only one in complex with a full heterotrimeric Gα β γ protein4. Transmembrane domain structures of class B GPCRs have been especially refractory to crystallization and are currently limited to two inactive state structures5–7, with no reported full-length class B GPCR structures, to our knowledge.
Class B GPCRs bind physiologically and clinically important peptide hormones and are attractive targets for treatment of major chronic diseases8. These receptors have a large extracellular N-terminal domain (ECD) that is important for peptide binding. Multiple structures of the ECD fragments bound to short peptides have been reported9, but these do not inform on how bound peptides bind the receptor core for activation. The calcitonin receptor (CTR), a class B GPCR, is a thera-peutic target for the treatment of a range of bone diseases, with salmon calcitonin and human calcitonin approved for clinical use10.
Single-particle cryo-electron microscopy (cryo-EM) provides a method to obtain high-resolution protein structure information with-out the need for crystallization. Notwithstanding the recent advances in electron detectors and cryo-EM data analysis, successful application of this technology for proteins/complexes smaller than 200 kDa remains challenging owing to the inherent low contrast that limits accurate alignment of projections to derive high resolution11,12. The recently introduced approach of using a Volta phase plate for data acquisition
with increased contrast sidesteps many trade-offs that hamper struc-ture determination of small proteins by cryo-EM13–15. In the current study, we used Volta phase plates to image particles of an approximately 150 kDa complex comprising an unmodified CTR bound to a peptide agonist in complex with a heterotrimeric Gs protein. This enabled us to obtain the first near-atomic-resolution structure of an activated GPCR using cryo-EM.
Structure determinationTo enable efficient expression and purification, the CTR was modified to replace the native signal peptide with haemagglutinin (HA), followed by a Flag epitope for affinity purification and an HRV 3C cleavage site, while the C terminus was modified by the addition of an HRV 3C cleavage site and histidine affinity tag (Extended Data Fig. 1). These modifications had no effect on receptor pharmacology (Extended Data Fig. 2).
To form an active, G-protein-coupled complex, the CTR was co- expressed with Gα s, His–Gβ 1, and Gγ 2 in HighFive insect cells and stimulated with an excess of the high-affinity agonist, salmon calcitonin (sCT) that has a very slow off-rate16,17. The complex was solubilized in MNG/cholesteryl hemisuccinate and purified using an anti-Flag antibody affinity column and size-exclusion chromatography (SEC) (Extended Data Fig. 3). Further complex stabilization was achieved with the addition of a camelid antibody, Nb35, which binds at the Gα s–Gβ interface and was used in the determination of the β 2 adrenergic receptor (β 2AR)–Gs heterotrimer structure4. Addition of purified Nb35 to insect cell membranes expressing CTR, Gα s and β γ before purifica-tion produced a monodispersed complex by SEC that remained stable at 4 °C for at least 5 days; however, as noted for the β 2AR–Gs complex, the Gs heterotrimer could no longer bind to GTPγ S (Extended Data Figs 2e and 3e).
We recorded images of frozen-hydrated sCT–CTR–Gs complex using Volta phase-plate cryo-EM, obtaining particle projections with high
Class B G-protein-coupled receptors are major targets for the treatment of chronic diseases, such as osteoporosis, diabetes and obesity. Here we report the structure of a full-length class B receptor, the calcitonin receptor, in complex with peptide ligand and heterotrimeric Gαsβγ protein determined by Volta phase-plate single-particle cryo-electron microscopy. The peptide agonist engages the receptor by binding to an extended hydrophobic pocket facilitated by the large outward movement of the extracellular ends of transmembrane helices 6 and 7. This conformation is accompanied by a 60° kink in helix 6 and a large outward movement of the intracellular end of this helix, opening the bundle to accommodate interactions with the α5-helix of Gαs. Also observed is an extended intracellular helix 8 that contributes to both receptor stability and functional G-protein coupling via an interaction with the Gβ subunit. This structure provides a new framework for understanding G-protein-coupled receptor function.
1Drug Discovery Biology and Department of Pharmacology, Monash Institute of Pharmaceutical Sciences, Monash University, Parkville, 3052 Victoria, Australia. 2Department of Molecular Structural Biology, Max Planck Institute of Biochemistry, 82152 Martinsried, Germany. 3Department of Biochemistry and Molecular Biology, Monash University, Clayton, 3800 Victoria, Australia. 4Life Sciences Institute and Department of Biological Chemistry, University of Michigan Medical School, Ann Arbor, Michigan 48109-2216, USA. 5Department of Molecular Pharmacology and Experimental Therapeutics, Mayo Clinic, Scottsdale, Arizona 85259, USA. 6Department of Molecular and Cellular Physiology, Stanford University School of Medicine, Stanford, California 94305, USA. †Present address: FEI, 5651 GG Eindhoven, The Netherlands.* These authors contributed equally to this work.
© 2017 Macmillan Publishers Limited, part of Springer Nature. All rights reserved.
2 | N A T U R E | V O L 0 0 0 | 0 0 M O N T H 2 0 1 7
ARTICLERESEARCH
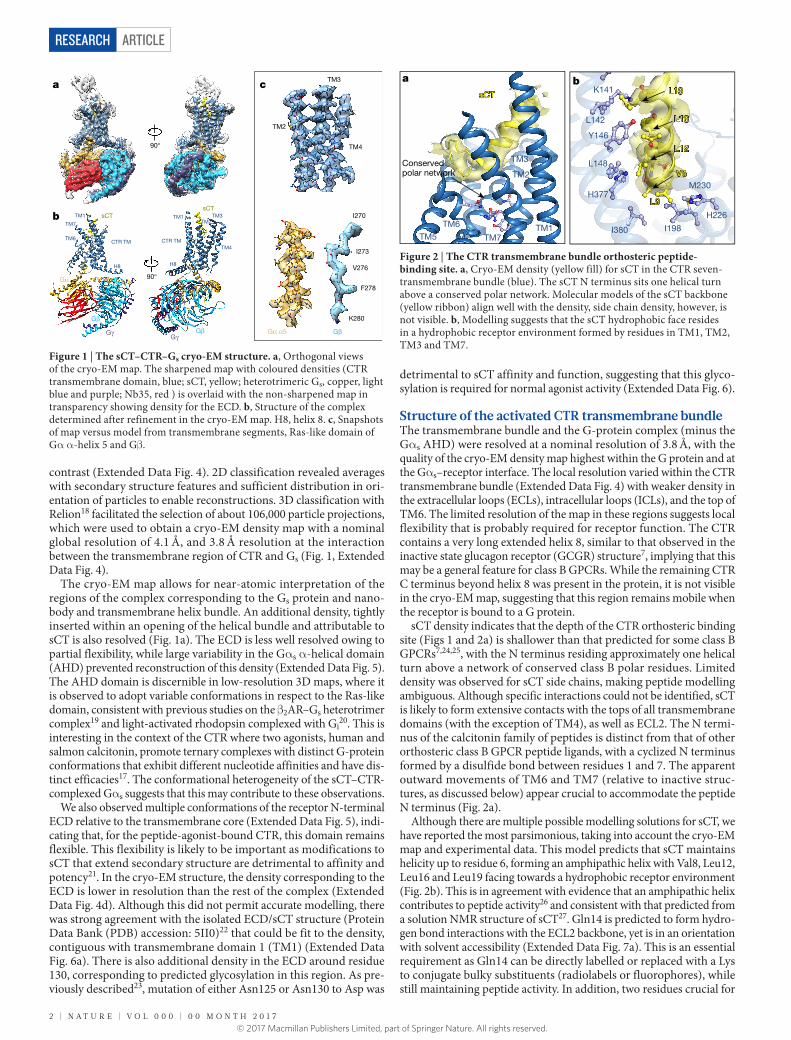
contrast (Extended Data Fig. 4). 2D classification revealed averages with secondary structure features and sufficient distribution in ori-entation of particles to enable reconstructions. 3D classification with Relion18 facilitated the selection of about 106,000 particle projections, which were used to obtain a cryo-EM density map with a nomi nal global resolution of 4.1 Å, and 3.8 Å resolution at the interaction between the transmembrane region of CTR and Gs (Fig. 1, Extended Data Fig. 4).
The cryo-EM map allows for near-atomic interpretation of the regions of the complex corresponding to the Gs protein and nano-body and transmembrane helix bundle. An additional density, tightly inserted within an opening of the helical bundle and attributable to sCT is also resolved (Fig. 1a). The ECD is less well resolved owing to partial flexibility, while large variability in the Gα s α -helical domain (AHD) prevented reconstruction of this density (Extended Data Fig. 5). The AHD domain is discernible in low-resolution 3D maps, where it is observed to adopt variable conformations in respect to the Ras-like domain, consistent with previous studies on the β 2AR–Gs heterotrimer complex19 and light-activated rhodopsin complexed with Gi
20. This is interesting in the context of the CTR where two agonists, human and salmon calcitonin, promote ternary complexes with distinct G-protein conformations that exhibit different nucleotide affinities and have dis-tinct efficacies17. The conformational heterogeneity of the sCT–CTR-complexed Gα s suggests that this may contribute to these observations.
We also observed multiple conformations of the receptor N-terminal ECD relative to the transmembrane core (Extended Data Fig. 5), indi-cating that, for the peptide-agonist-bound CTR, this domain remains flexible. This flexibility is likely to be important as modifications to sCT that extend secondary structure are detrimental to affinity and potency21. In the cryo-EM structure, the density corresponding to the ECD is lower in resolution than the rest of the complex (Extended Data Fig. 4d). Although this did not permit accurate modelling, there was strong agreement with the isolated ECD/sCT structure (Protein Data Bank (PDB) accession: 5II0)22 that could be fit to the density, contiguous with transmembrane domain 1 (TM1) (Extended Data Fig. 6a). There is also additional density in the ECD around residue 130, corresponding to predicted glycosylation in this region. As pre-viously described23, mutation of either Asn125 or Asn130 to Asp was
detrimental to sCT affinity and function, suggesting that this glyco-sylation is required for normal agonist activity (Extended Data Fig. 6).
Structure of the activated CTR transmembrane bundleThe transmembrane bundle and the G-protein complex (minus the Gα s AHD) were resolved at a nominal resolution of 3.8 Å, with the quality of the cryo-EM density map highest within the G protein and at the Gα s–receptor interface. The local resolution varied within the CTR transmembrane bundle (Extended Data Fig. 4) with weaker density in the extracellular loops (ECLs), intracellular loops (ICLs), and the top of TM6. The limited resolution of the map in these regions suggests local flexibility that is probably required for receptor function. The CTR contains a very long extended helix 8, similar to that observed in the inactive state glucagon receptor (GCGR) structure7, implying that this may be a general feature for class B GPCRs. While the remaining CTR C terminus beyond helix 8 was present in the protein, it is not visible in the cryo-EM map, suggesting that this region remains mobile when the receptor is bound to a G protein.
sCT density indicates that the depth of the CTR orthosteric binding site (Figs 1 and 2a) is shallower than that predicted for some class B GPCRs7,24,25, with the N terminus residing approximately one helical turn above a network of conserved class B polar residues. Limited density was observed for sCT side chains, making peptide modelling ambiguous. Although specific interactions could not be identified, sCT is likely to form extensive contacts with the tops of all transmembrane domains (with the exception of TM4), as well as ECL2. The N termi-nus of the calcitonin family of peptides is distinct from that of other orthosteric class B GPCR peptide ligands, with a cyclized N terminus formed by a disulfide bond between residues 1 and 7. The apparent outward movements of TM6 and TM7 (relative to inactive struc-tures, as discussed below) appear crucial to accommodate the peptide N terminus (Fig. 2a).
Although there are multiple possible modelling solutions for sCT, we have reported the most parsimonious, taking into account the cryo-EM map and experimental data. This model predicts that sCT maintains helicity up to residue 6, forming an amphipathic helix with Val8, Leu12, Leu16 and Leu19 facing towards a hydrophobic receptor environment (Fig. 2b). This is in agreement with evidence that an amphipathic helix contributes to peptide activity26 and consistent with that predicted from a solution NMR structure of sCT27. Gln14 is predicted to form hydro-gen bond interactions with the ECL2 backbone, yet is in an orientation with solvent accessibility (Extended Data Fig. 7a). This is an essential requirement as Gln14 can be directly labelled or replaced with a Lys to conjugate bulky substituents (radiolabels or fluorophores), while still maintaining peptide activity. In addition, two residues crucial for
TM6
TM7
TM1
H8
TM4
TM1TM2
TM3
CTR TM CTR TM
H8
a
b
c
TM2
TM3
TM4
I270
I273
V276
F278
K280
Gα α5
sCTsCT
Gα
Gβ
Gβ
GβGγGγ
90°
90°
Figure 1 | The sCT–CTR–Gs cryo-EM structure. a, Orthogonal views of the cryo-EM map. The sharpened map with coloured densities (CTR transmembrane domain, blue; sCT, yellow; heterotrimeric Gs, copper, light blue and purple; Nb35, red ) is overlaid with the non-sharpened map in transparency showing density for the ECD. b, Structure of the complex determined after refinement in the cryo-EM map. H8, helix 8. c, Snapshots of map versus model from transmembrane segments, Ras-like domain of Gα α -helix 5 and Gβ .
a
TM7TM1TM6
Conserved polar network
TM5
TM3
TM2
bK141
Y146
L148
H377
I198
H226
L142
I380
M230
sCT L19
L16
L12
V8
L9
Figure 2 | The CTR transmembrane bundle orthosteric peptide-binding site. a, Cryo-EM density (yellow fill) for sCT in the CTR seven-transmembrane bundle (blue). The sCT N terminus sits one helical turn above a conserved polar network. Molecular models of the sCT backbone (yellow ribbon) align well with the density, side chain density, however, is not visible. b, Modelling suggests that the sCT hydrophobic face resides in a hydrophobic receptor environment formed by residues in TM1, TM2, TM3 and TM7.
© 2017 Macmillan Publishers Limited, part of Springer Nature. All rights reserved.
0 0 M O N T H 2 0 1 7 | V O L 0 0 0 | N A T U R E | 3
ARTICLE RESEARCH
agonist activity, Ser5 and Thr6, are predicted to interact with TM5, potentially forming polar interactions with His3025.40b (superscript indicates class B GPCR numbering29) (Extended Data Fig. 7b). This model is supported by mutation of His3025.40b to Ala that reduced sCT potency in cAMP production and ERK1/2 phosphorylation, consistent with reduced sCT affinity (Extended Data Fig. 7c). The first three resi-dues in sCT make minimal receptor contacts in this model, consistent with experimental data showing that these residues can be removed without altering peptide activity28.
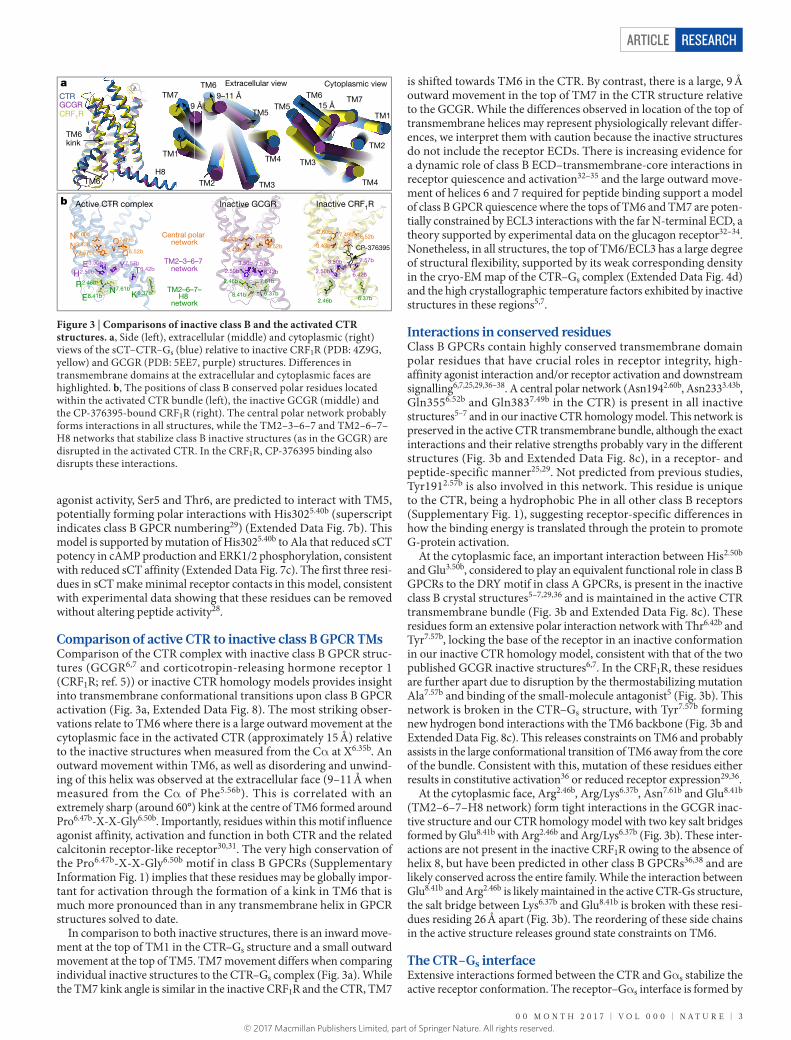
Comparison of active CTR to inactive class B GPCR TMsComparison of the CTR complex with inactive class B GPCR struc-tures (GCGR6,7 and corticotropin-releasing hormone receptor 1 (CRF1R; ref. 5)) or inactive CTR homology models provides insight into transmembrane conformational transitions upon class B GPCR activation (Fig. 3a, Extended Data Fig. 8). The most striking obser-vations relate to TM6 where there is a large outward movement at the cytoplasmic face in the activated CTR (approximately 15 Å) relative to the inactive structures when measured from the Cα at X6.35b. An outward movement within TM6, as well as disordering and unwind-ing of this helix was observed at the extracellular face (9–11 Å when measured from the Cα of Phe5.56b). This is correlated with an extremely sharp (around 60°) kink at the centre of TM6 formed around Pro6.47b-X-X-Gly6.50b. Importantly, residues within this motif influence agonist affinity, activation and function in both CTR and the related calcitonin receptor-like receptor30,31. The very high conservation of the Pro6.47b-X-X-Gly6.50b motif in class B GPCRs (Supplementary Information Fig. 1) implies that these residues may be globally impor-tant for activation through the formation of a kink in TM6 that is much more pronounced than in any transmembrane helix in GPCR structures solved to date.
In comparison to both inactive structures, there is an inward move-ment at the top of TM1 in the CTR–Gs structure and a small outward movement at the top of TM5. TM7 movement differs when comparing individual inactive structures to the CTR–Gs complex (Fig. 3a). While the TM7 kink angle is similar in the inactive CRF1R and the CTR, TM7
is shifted towards TM6 in the CTR. By contrast, there is a large, 9 Å outward movement in the top of TM7 in the CTR structure relative to the GCGR. While the differences observed in location of the top of transmembrane helices may represent physiologically relevant differ-ences, we interpret them with caution because the inactive structures do not include the receptor ECDs. There is increasing evidence for a dynamic role of class B ECD–transmembrane-core interactions in receptor quiescence and activation32–35 and the large outward move-ment of helices 6 and 7 required for peptide binding support a model of class B GPCR quiescence where the tops of TM6 and TM7 are poten-tially constrained by ECL3 interactions with the far N-terminal ECD, a theory supported by experimental data on the glucagon receptor32–34. Nonetheless, in all structures, the top of TM6/ECL3 has a large degree of structural flexibility, supported by its weak corresponding density in the cryo-EM map of the CTR–Gs complex (Extended Data Fig. 4d) and the high crystallographic temperature factors exhibited by inactive structures in these regions5,7.
Interactions in conserved residuesClass B GPCRs contain highly conserved transmembrane domain polar residues that have crucial roles in receptor integrity, high- affinity agonist interaction and/or receptor activation and downstream signalling6,7,25,29,36–38. A central polar network (Asn1942.60b, Asn2333.43b, Gln3556.52b and Gln3837.49b in the CTR) is present in all inactive structures5–7 and in our inactive CTR homology model. This network is preserved in the active CTR transmembrane bundle, although the exact interactions and their relative strengths probably vary in the different structures (Fig. 3b and Extended Data Fig. 8c), in a receptor- and peptide-specific manner25,29. Not predicted from previous studies, Tyr1912.57b is also involved in this network. This residue is unique to the CTR, being a hydrophobic Phe in all other class B receptors (Supplementary Fig. 1), suggesting receptor-specific differences in how the binding energy is translated through the protein to promote G-protein activation.
At the cytoplasmic face, an important interaction between His2.50b and Glu3.50b, considered to play an equivalent functional role in class B GPCRs to the DRY motif in class A GPCRs, is present in the inactive class B crystal structures5–7,29,36 and is maintained in the active CTR transmembrane bundle (Fig. 3b and Extended Data Fig. 8c). These residues form an extensive polar interaction network with Thr6.42b and Tyr7.57b, locking the base of the receptor in an inactive conformation in our inactive CTR homology model, consistent with that of the two published GCGR inactive structures6,7. In the CRF1R, these residues are further apart due to disruption by the thermostabilizing mutation Ala7.57b and binding of the small-molecule antagonist5 (Fig. 3b). This network is broken in the CTR–Gs structure, with Tyr7.57b forming new hydrogen bond interactions with the TM6 backbone (Fig. 3b and Extended Data Fig. 8c). This releases constraints on TM6 and probably assists in the large conformational transition of TM6 away from the core of the bundle. Consistent with this, mutation of these residues either results in constitutive activation36 or reduced receptor expression29,36.
At the cytoplasmic face, Arg2.46b, Arg/Lys6.37b, Asn7.61b and Glu8.41b (TM2–6–7–H8 network) form tight interactions in the GCGR inac-tive structure and our CTR homology model with two key salt bridges formed by Glu8.41b with Arg2.46b and Arg/Lys6.37b (Fig. 3b). These inter-actions are not present in the inactive CRF1R owing to the absence of helix 8, but have been predicted in other class B GPCRs36,38 and are likely conserved across the entire family. While the interaction between Glu8.41b and Arg2.46b is likely maintained in the active CTR-Gs structure, the salt bridge between Lys6.37b and Glu8.41b is broken with these resi-dues residing 26 Å apart (Fig. 3b). The reordering of these side chains in the active structure releases ground state constraints on TM6.
The CTR–Gs interfaceExtensive interactions formed between the CTR and Gα s stabilize the active receptor conformation. The receptor–Gα s interface is formed by
N2.60b
N3.43b
Y2.57b Q6.52b
Q7.49b
H2.50b T6.42bY7.57bE3.50b
R2.46b
E8.41b K6.37bN7.61b
CP-376395
2.60b
3.43b
7.49b 6.52b
2.50b6.42b
7.57b3.50b
2.46b 6.37b
2.60b
3.43b
7.49b
6.52b
2.50b 6.42b7.57b3.50b
2.46b
8.41b 6.37b
7.61b
TM6TM7
TM1
TM2 TM3
TM4
TM5
TM6 TM7
TM1
TM2
TM3
TM4
TM5
TM6H8
Central polar network
TM2–3–6–7 network
TM2–6–7–H8
network
6 42
7750b
a
b
TM6kink
9–11 Å9 Å 15 Å
Active CTR complex Inactive GCGR Inactive CRF1R
CTRGCGR
Cytoplasmic viewExtracellular view
CRF1R
Figure 3 | Comparisons of inactive class B and the activated CTR structures. a, Side (left), extracellular (middle) and cytoplasmic (right) views of the sCT–CTR–Gs (blue) relative to inactive CRF1R (PDB: 4Z9G, yellow) and GCGR (PDB: 5EE7, purple) structures. Differences in transmembrane domains at the extracellular and cytoplasmic faces are highlighted. b, The positions of class B conserved polar residues located within the activated CTR bundle (left), the inactive GCGR (middle) and the CP-376395-bound CRF1R (right). The central polar network probably forms interactions in all structures, while the TM2–3–6–7 and TM2–6–7–H8 networks that stabilize class B inactive structures (as in the GCGR) are disrupted in the activated CTR. In the CRF1R, CP-376395 binding also disrupts these interactions.
© 2017 Macmillan Publishers Limited, part of Springer Nature. All rights reserved.
4 | N A T U R E | V O L 0 0 0 | 0 0 M O N T H 2 0 1 7
ARTICLERESEARCH
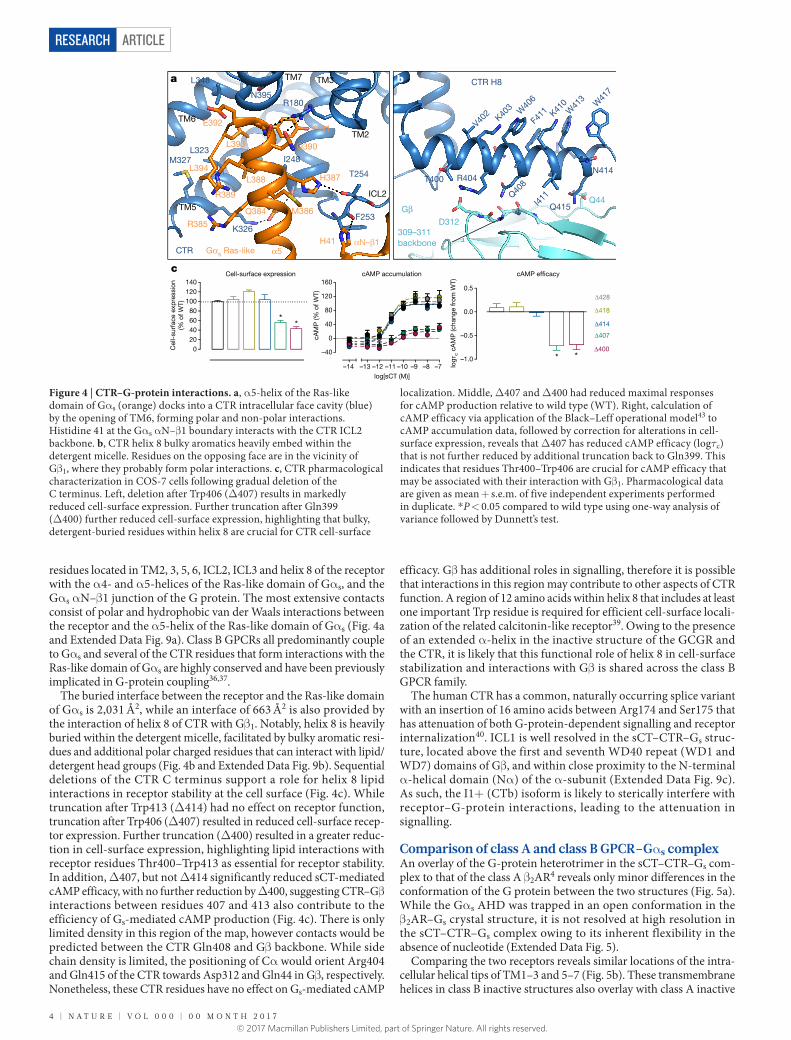
residues located in TM2, 3, 5, 6, ICL2, ICL3 and helix 8 of the receptor with the α 4- and α 5-helices of the Ras-like domain of Gα s, and the Gα s α N–β 1 junction of the G protein. The most extensive contacts consist of polar and hydrophobic van der Waals interactions between the receptor and the α 5-helix of the Ras-like domain of Gα s (Fig. 4a and Extended Data Fig. 9a). Class B GPCRs all predominantly couple to Gα s and several of the CTR residues that form interactions with the Ras-like domain of Gα s are highly conserved and have been previously implicated in G-protein coupling36,37.
The buried interface between the receptor and the Ras-like domain of Gα s is 2,031 Å2, while an interface of 663 Å2 is also provided by the interaction of helix 8 of CTR with Gβ 1. Notably, helix 8 is heavily buried within the detergent micelle, facilitated by bulky aromatic resi-dues and additional polar charged residues that can interact with lipid/detergent head groups (Fig. 4b and Extended Data Fig. 9b). Sequential deletions of the CTR C terminus support a role for helix 8 lipid interactions in receptor stability at the cell surface (Fig. 4c). While truncation after Trp413 (Δ 414) had no effect on receptor function, truncation after Trp406 (Δ 407) resulted in reduced cell-surface recep-tor expression. Further truncation (Δ 400) resulted in a greater reduc-tion in cell-surface expression, highlighting lipid interactions with receptor residues Thr400–Trp413 as essential for receptor stability. In addition, Δ 407, but not Δ 414 significantly reduced sCT-mediated cAMP efficacy, with no further reduction by Δ 400, suggesting CTR–Gβ interactions between residues 407 and 413 also contribute to the efficiency of Gs-mediated cAMP production (Fig. 4c). There is only limited density in this region of the map, however contacts would be predicted between the CTR Gln408 and Gβ backbone. While side chain density is limited, the positioning of Cα would orient Arg404 and Gln415 of the CTR towards Asp312 and Gln44 in Gβ , respectively. Nonetheless, these CTR residues have no effect on Gs-mediated cAMP
efficacy. Gβ has additional roles in signalling, therefore it is possible that interactions in this region may contribute to other aspects of CTR function. A region of 12 amino acids within helix 8 that includes at least one important Trp residue is required for efficient cell-surface locali-zation of the related calcitonin-like receptor39. Owing to the presence of an extended α -helix in the inactive structure of the GCGR and the CTR, it is likely that this functional role of helix 8 in cell-surface stabilization and interactions with Gβ is shared across the class B GPCR family.
The human CTR has a common, naturally occurring splice variant with an insertion of 16 amino acids between Arg174 and Ser175 that has attenuation of both G-protein-dependent signalling and receptor internalization40. ICL1 is well resolved in the sCT–CTR–Gs struc-ture, located above the first and seventh WD40 repeat (WD1 and WD7) domains of Gβ , and within close proximity to the N-terminal α -helical domain (Nα ) of the α -subunit (Extended Data Fig. 9c). As such, the I1+ (CTb) isoform is likely to sterically interfere with receptor–G-protein interactions, leading to the attenuation in signalling.
Comparison of class A and class B GPCR–Gα s complexAn overlay of the G-protein heterotrimer in the sCT–CTR–Gs com-plex to that of the class A β 2AR4 reveals only minor differences in the conformation of the G protein between the two structures (Fig. 5a). While the Gα s AHD was trapped in an open conformation in the β 2AR–Gs crystal structure, it is not resolved at high resolution in the sCT–CTR–Gs complex owing to its inherent flexibility in the absence of nucleotide (Extended Data Fig. 5).
Comparing the two receptors reveals similar locations of the intra-cellular helical tips of TM1–3 and 5–7 (Fig. 5b). These transmembrane helices in class B inactive structures also overlay with class A inactive
a b
c
020406080
100120140
Cel
l-su
rfac
e ex
pre
ssio
n(%
of W
T)
**
–14 –13 –12 –11 –10 –9 –8 –7
–40
0
40
80
120
160
log[sCT (M)]
cAM
P (%
of W
T)
–1.0
–0.5
0.0
0.5
log
c cA
MP
(cha
nge
from
WT)
* *
Cell-surface expression cAMP accumulation cAMP ef�cacy
N414
Q415
T400 R404
Q408
I411
V402 K40
3 W40
6
F411 K41
0W
413 W
417
D312
Q44
309–311 backbone
Gβ
CTR H8
F253
T254
L348
N395R180
L323M327
K326
I248
α5CTR Gαs Ras-like
E392
L393
L394
Q384
R385
R389
L388
Y391
Q390
H387
M386
H41 αN–β1
TM2
ICL2
TM3
TM6
TM5
TM7
Δ428
Δ418
Δ414
Δ400
Δ407
Figure 4 | CTR–G-protein interactions. a, α 5-helix of the Ras-like domain of Gα s (orange) docks into a CTR intracellular face cavity (blue) by the opening of TM6, forming polar and non-polar interactions. Histidine 41 at the Gα s α N–β 1 boundary interacts with the CTR ICL2 backbone. b, CTR helix 8 bulky aromatics heavily embed within the detergent micelle. Residues on the opposing face are in the vicinity of Gβ 1, where they probably form polar interactions. c, CTR pharmacological characterization in COS-7 cells following gradual deletion of the C terminus. Left, deletion after Trp406 (Δ 407) results in markedly reduced cell-surface expression. Further truncation after Gln399 (Δ 400) further reduced cell-surface expression, highlighting that bulky, detergent-buried residues within helix 8 are crucial for CTR cell-surface
localization. Middle, Δ 407 and Δ 400 had reduced maximal responses for cAMP production relative to wild type (WT). Right, calculation of cAMP efficacy via application of the Black–Leff operational model43 to cAMP accumulation data, followed by correction for alterations in cell-surface expression, reveals that Δ 407 has reduced cAMP efficacy (logτc) that is not further reduced by additional truncation back to Gln399. This indicates that residues Thr400–Trp406 are crucial for cAMP efficacy that may be associated with their interaction with Gβ 1. Pharmacological data are given as mean + s.e.m. of five independent experiments performed in duplicate. * P < 0.05 compared to wild type using one-way analysis of variance followed by Dunnett’s test.
© 2017 Macmillan Publishers Limited, part of Springer Nature. All rights reserved.
0 0 M O N T H 2 0 1 7 | V O L 0 0 0 | N A T U R E | 5
ARTICLE RESEARCH
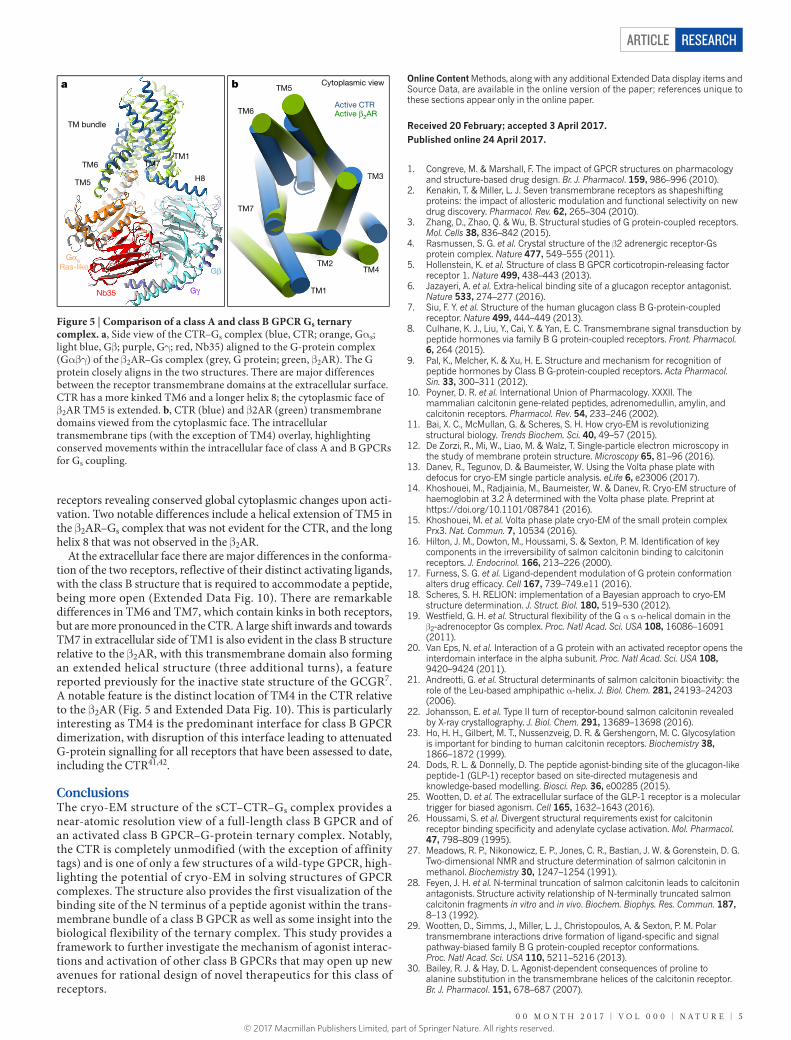
receptors revealing conserved global cytoplasmic changes upon acti-vation. Two notable differences include a helical extension of TM5 in the β 2AR–Gs complex that was not evident for the CTR, and the long helix 8 that was not observed in the β 2AR.
At the extracellular face there are major differences in the conforma-tion of the two receptors, reflective of their distinct activating ligands, with the class B structure that is required to accommodate a peptide, being more open (Extended Data Fig. 10). There are remarkable differences in TM6 and TM7, which contain kinks in both receptors, but are more pronounced in the CTR. A large shift inwards and towards TM7 in extracellular side of TM1 is also evident in the class B structure relative to the β 2AR, with this transmembrane domain also forming an extended helical structure (three additional turns), a feature reported previously for the inactive state structure of the GCGR7. A notable feature is the distinct location of TM4 in the CTR relative to the β 2AR (Fig. 5 and Extended Data Fig. 10). This is particularly interesting as TM4 is the predominant interface for class B GPCR dimerization, with disruption of this interface leading to attenuated G-protein signalling for all receptors that have been assessed to date, including the CTR41,42.
ConclusionsThe cryo-EM structure of the sCT–CTR–Gs complex provides a near-atomic resolution view of a full-length class B GPCR and of an activated class B GPCR–G-protein ternary complex. Notably, the CTR is completely unmodified (with the exception of affinity tags) and is one of only a few structures of a wild-type GPCR, high-lighting the potential of cryo-EM in solving structures of GPCR complexes. The structure also provides the first visualization of the binding site of the N terminus of a peptide agonist within the trans-membrane bundle of a class B GPCR as well as some insight into the biological flexibility of the ternary complex. This study provides a framework to further investigate the mechanism of agonist interac-tions and activation of other class B GPCRs that may open up new avenues for rational design of novel therapeutics for this class of receptors.
Online Content Methods, along with any additional Extended Data display items and Source Data, are available in the online version of the paper; references unique to these sections appear only in the online paper.
Received 20 February; accepted 3 April 2017.
Published online 24 April 2017.
1. Congreve, M. & Marshall, F. The impact of GPCR structures on pharmacology and structure-based drug design. Br. J. Pharmacol. 159, 986–996 (2010).
2. Kenakin, T. & Miller, L. J. Seven transmembrane receptors as shapeshifting proteins: the impact of allosteric modulation and functional selectivity on new drug discovery. Pharmacol. Rev. 62, 265–304 (2010).
3. Zhang, D., Zhao, Q. & Wu, B. Structural studies of G protein-coupled receptors. Mol. Cells 38, 836–842 (2015).
4. Rasmussen, S. G. et al. Crystal structure of the β 2 adrenergic receptor-Gs protein complex. Nature 477, 549–555 (2011).
5. Hollenstein, K. et al. Structure of class B GPCR corticotropin-releasing factor receptor 1. Nature 499, 438–443 (2013).
6. Jazayeri, A. et al. Extra-helical binding site of a glucagon receptor antagonist. Nature 533, 274–277 (2016).
7. Siu, F. Y. et al. Structure of the human glucagon class B G-protein-coupled receptor. Nature 499, 444–449 (2013).
8. Culhane, K. J., Liu, Y., Cai, Y. & Yan, E. C. Transmembrane signal transduction by peptide hormones via family B G protein-coupled receptors. Front. Pharmacol. 6, 264 (2015).
9. Pal, K., Melcher, K. & Xu, H. E. Structure and mechanism for recognition of peptide hormones by Class B G-protein-coupled receptors. Acta Pharmacol. Sin. 33, 300–311 (2012).
10. Poyner, D. R. et al. International Union of Pharmacology. XXXII. The mammalian calcitonin gene-related peptides, adrenomedullin, amylin, and calcitonin receptors. Pharmacol. Rev. 54, 233–246 (2002).
11. Bai, X. C., McMullan, G. & Scheres, S. H. How cryo-EM is revolutionizing structural biology. Trends Biochem. Sci. 40, 49–57 (2015).
12. De Zorzi, R., Mi, W., Liao, M. & Walz, T. Single-particle electron microscopy in the study of membrane protein structure. Microscopy 65, 81–96 (2016).
13. Danev, R., Tegunov, D. & Baumeister, W. Using the Volta phase plate with defocus for cryo-EM single particle analysis. eLife 6, e23006 (2017).
14. Khoshouei, M., Radjainia, M., Baumeister, W. & Danev, R. Cryo-EM structure of haemoglobin at 3.2 Å determined with the Volta phase plate. Preprint at https://doi.org/10.1101/087841 (2016).
15. Khoshouei, M. et al. Volta phase plate cryo-EM of the small protein complex Prx3. Nat. Commun. 7, 10534 (2016).
16. Hilton, J. M., Dowton, M., Houssami, S. & Sexton, P. M. Identification of key components in the irreversibility of salmon calcitonin binding to calcitonin receptors. J. Endocrinol. 166, 213–226 (2000).
17. Furness, S. G. et al. Ligand-dependent modulation of G protein conformation alters drug efficacy. Cell 167, 739–749.e11 (2016).
18. Scheres, S. H. RELION: implementation of a Bayesian approach to cryo-EM structure determination. J. Struct. Biol. 180, 519–530 (2012).
19. Westfield, G. H. et al. Structural flexibility of the G α s α -helical domain in the β 2-adrenoceptor Gs complex. Proc. Natl Acad. Sci. USA 108, 16086–16091 (2011).
20. Van Eps, N. et al. Interaction of a G protein with an activated receptor opens the interdomain interface in the alpha subunit. Proc. Natl Acad. Sci. USA 108, 9420–9424 (2011).
21. Andreotti, G. et al. Structural determinants of salmon calcitonin bioactivity: the role of the Leu-based amphipathic α -helix. J. Biol. Chem. 281, 24193–24203 (2006).
22. Johansson, E. et al. Type II turn of receptor-bound salmon calcitonin revealed by X-ray crystallography. J. Biol. Chem. 291, 13689–13698 (2016).
23. Ho, H. H., Gilbert, M. T., Nussenzveig, D. R. & Gershengorn, M. C. Glycosylation is important for binding to human calcitonin receptors. Biochemistry 38, 1866–1872 (1999).
24. Dods, R. L. & Donnelly, D. The peptide agonist-binding site of the glucagon-like peptide-1 (GLP-1) receptor based on site-directed mutagenesis and knowledge-based modelling. Biosci. Rep. 36, e00285 (2015).
25. Wootten, D. et al. The extracellular surface of the GLP-1 receptor is a molecular trigger for biased agonism. Cell 165, 1632–1643 (2016).
26. Houssami, S. et al. Divergent structural requirements exist for calcitonin receptor binding specificity and adenylate cyclase activation. Mol. Pharmacol. 47, 798–809 (1995).
27. Meadows, R. P., Nikonowicz, E. P., Jones, C. R., Bastian, J. W. & Gorenstein, D. G. Two-dimensional NMR and structure determination of salmon calcitonin in methanol. Biochemistry 30, 1247–1254 (1991).
28. Feyen, J. H. et al. N-terminal truncation of salmon calcitonin leads to calcitonin antagonists. Structure activity relationship of N-terminally truncated salmon calcitonin fragments in vitro and in vivo. Biochem. Biophys. Res. Commun. 187, 8–13 (1992).
29. Wootten, D., Simms, J., Miller, L. J., Christopoulos, A. & Sexton, P. M. Polar transmembrane interactions drive formation of ligand-specific and signal pathway-biased family B G protein-coupled receptor conformations. Proc. Natl Acad. Sci. USA 110, 5211–5216 (2013).
30. Bailey, R. J. & Hay, D. L. Agonist-dependent consequences of proline to alanine substitution in the transmembrane helices of the calcitonin receptor. Br. J. Pharmacol. 151, 678–687 (2007).
TM1
TM2TM4
TM3
TM5
TM6
TM7
H8
TM1
TM5
TM6
TM bundle
a b
Gαs Ras-like Gβ
GγNb35
TM7
Active CTR Active β2AR
Cytoplasmic view
Figure 5 | Comparison of a class A and class B GPCR Gs ternary complex. a, Side view of the CTR–Gs complex (blue, CTR; orange, Gα s; light blue, Gβ ; purple, Gγ ; red, Nb35) aligned to the G-protein complex (Gαβγ) of the β 2AR–Gs complex (grey, G protein; green, β 2AR). The G protein closely aligns in the two structures. There are major differences between the receptor transmembrane domains at the extracellular surface. CTR has a more kinked TM6 and a longer helix 8; the cytoplasmic face of β 2AR TM5 is extended. b, CTR (blue) and β 2AR (green) transmembrane domains viewed from the cytoplasmic face. The intracellular transmembrane tips (with the exception of TM4) overlay, highlighting conserved movements within the intracellular face of class A and B GPCRs for Gs coupling.
© 2017 Macmillan Publishers Limited, part of Springer Nature. All rights reserved.
6 | N A T U R E | V O L 0 0 0 | 0 0 M O N T H 2 0 1 7
ARTICLERESEARCH
31. Conner, A. C. et al. A key role for transmembrane prolines in calcitonin receptor-like receptor agonist binding and signalling: implications for family B G-protein-coupled receptors. Mol. Pharmacol. 67, 20–31 (2005).
32. Koth, C. M. et al. Molecular basis for negative regulation of the glucagon receptor. Proc. Natl Acad. Sci. USA 109, 14393–14398 (2012).
33. Mukund, S. et al. Inhibitory mechanism of an allosteric antibody targeting the glucagon receptor. J. Biol. Chem. 288, 36168–36178 (2013).
34. Yin, Y. et al. An intrinsic agonist mechanism for activation of glucagon-like peptide-1 receptor by its extracellular domain. Cell Discov. 2, 16042 (2016).
35. Zhao, L. H. et al. Differential requirement of the extracellular domain in activation of class B G protein-coupled receptors. J. Biol. Chem. 291, 15119–15130 (2016).
36. Vohra, S. et al. Similarity between class A and class B G-protein-coupled receptors exemplified through calcitonin gene-related peptide receptor modelling and mutagenesis studies. J. R. Soc. Interface 10, 20120846 (2012).
37. Wootten, D. et al. A hydrogen-bonded polar network in the core of the glucagon-like peptide-1 receptor is a fulcrum for biased agonism: lessons from class B crystal structures. Mol. Pharmacol. 89, 335–347 (2016).
38. Wootten, D. et al. Key interactions by conserved polar amino acids located at the transmembrane helical boundaries in Class B GPCRs modulate activation, effector specificity and biased signalling in the glucagon-like peptide-1 receptor. Biochem. Pharmacol. 118, 68–87 (2016).
39. Conner, M. et al. Functional and biophysical analysis of the C-terminus of the CGRP-receptor; a family B GPCR. Biochemistry 47, 8434–8444 (2008).
40. Furness, S. G., Wootten, D., Christopoulos, A. & Sexton, P. M. Consequences of splice variation on Secretin family G protein-coupled receptor function. Br. J. Pharmacol. 166, 98–109 (2012).
41. Harikumar, K. G., Ball, A. M., Sexton, P. M. & Miller, L. J. Importance of lipid-exposed residues in transmembrane segment four for family B calcitonin receptor homo-dimerization. Regul. Pept. 164, 113–119 (2010).
42. Harikumar, K. G. et al. Glucagon-like peptide-1 receptor dimerization differentially regulates agonist signaling but does not affect small molecule allostery. Proc. Natl Acad. Sci. USA 109, 18607–18612 (2012).
43. Black, J. W. & Leff, P. Operational models of pharmacological agonism. Proc. R. Soc. Lond. B Biol. Sci. 220, 141–162 (1983).
Supplementary Information is available in the online version of the paper.
Acknowledgements This work was funded by the National Health and Medical Research Council of Australia (NHMRC) (grant numbers 1055134, 1061044 and 1120919) and NIH grants DK090165, NS092695. P.M.S. and A.C. are NHMRC Principal and Senior Principal Research Fellows, respectively. D.W. is a NHMRC Career Development Fellow. Computational studies were partially supported by Melbourne Bioinformatics at the University of Melbourne,
grant number VR0024. Negative-stain imaging and cryo-EM screening was performed at the Monash Ramaciotti Centre for Cryo-Electron Microscopy. The GPCRdb (http://gpcrdb.org) was used for generation of initial alignments of human class B GPCR sequences. The authors thank the late M. Azria for 100 mg of sCT, used in initial work.
Author Contributions Y.-L.L. developed the expression and purification strategy (with D.M.T., S.G.B.F., B.K.K., D.W., G.S. and P.M.S.), performed virus production, insect cell expression, purification, complex stability, negative-stain EM, data acquisition/analysis, prepared samples for cryo-EM and assisted with manuscript preparation. M.K. performed phase-plate imaging, data collection, EM data processing and analysis and assisted with manuscript preparation. M.R. assisted with negative-stain analysis and conception of cryo-imaging by Volta phase plate, performed cryo-sample preparation, preliminary screening imaging and analysis and assisted with manuscript preparation. Y.Z. calculated the cryo-EM map, performed model building and refinement, and contributed to manuscript preparation. A.G. performed GTPγ S and radioligand binding, model building and refinement and contributed to manuscript preparation. J.T. assisted in negative-stain EM screening. D.M.T. contributed to purification strategy, model refinement and manuscript preparation. S.G.B.F. provided project strategy and protein purification advice, assisted data interpretation and manuscript preparation. G.C. performed cloning for baculovirus expression. T.C. performed homology modelling, assisted with model refinement and manuscript preparation. R.D. developed Volta phase-plate cryo-EM data acquisition strategy and wrote automation scripts. W.B. organized and managed the Volta phase plate development project. L.J.M. provided insights into class B GPCRs, assisted with data interpretation and reviewed the manuscript. A.C. assisted with data interpretation and manuscript preparation. B.K.K. provided advice on CTR–Gs complex formation and purification. D.W. was responsible for overall project strategy and management (along with P.M.S.) and performed pharmacological characterization, interpreted data and wrote the manuscript. G.S. provided feedback to guide cryo-EM, oversaw EM data processing, structure determination and refinement, data interpretation and manuscript writing. P.M.S. was responsible for overall project strategy and management, data interpretation and writing the manuscript.
Author Information Reprints and permissions information is available at www.nature.com/reprints. The authors declare no competing financial interests. Readers are welcome to comment on the online version of the paper. Publisher’s note: Springer Nature remains neutral with regard to jurisdictional claims in published maps and institutional affiliations. Correspondence and requests for materials should be addressed to P.S. ([email protected]), D.W. ([email protected]) or G.S. ([email protected]).
Reviewer Information Nature thanks J. Standfuss and the other anonymous reviewer(s) for their contribution to the peer review of this work.
© 2017 Macmillan Publishers Limited, part of Springer Nature. All rights reserved.
ARTICLE RESEARCH
METHODSNo statistical methods were used to predetermine sample size. The experiments were not randomized and the investigators were not blinded to allocation during experiments and outcome assessment.Constructs. Wild-type human calcitonin receptor (CTR) was modified to include an N-terminal Flag tag epitope and a C-terminal 8× histidine tag, both tags are removable by 3C protease cleavage (Extended Data Fig. 1). These constructs were generated in both mammalian and insect cell expression vectors.Insect cell expression. CTR, human Gα s short, His6-tagged human Gβ 1 and Gγ 2 were expressed in HighFive insect cells (Thermo Fisher Scientific) using baculovirus. Cell cultures were grown in ESF 921 serum-free media (Expression System) to a density of 4 million cells per ml and then infected with three separate baculovirus at a ratio of 1:2:2 for hCTR, Gα s and Gβ 1γ 2. Cultures were grown at 27 °C and harvested by centrifugation 45 h post infection.Complex purification. Cells were suspended in 20 mM HEPES pH 7.4, 50 mM NaCl, 2 mM MgCl2 supplemented with cOmplete Protease Inhibitor Cocktail tablets (Roche). Complex formation was initiated by addition of 1 μ M salmon calcitonin, Nb35–His (10 μ g ml−1) and Apyrase (25 mU ml−1, NEB); the suspen-sion was incubated for 1 h at room temperature. Membranes were collected by centrifugation at 30,000g for 30 min, and solubilized by 0.5% (w/v) lauryl maltose neopentyl glycol (LMNG, Anatrace) supplemented with 0.03% (w/v) cholesteryl hemisuccinate (CHS, Anatrace) for 2 h at 4 °C in the presence of 100 nM salmon calcitonin and Apyrase (25 mU ml−1, NEB). Insoluble material was removed by centrifugation at 30, 000g for 30 min and the solubilized complex was immobilised by batch binding to M1 anti-Flag affinity resin in the presence of 3 mM CaCl2. The resin was packed into a glass column and washed with 20 column volumes of 20 mM HEPES pH 7.4, 100 mM NaCl, 2 mM MgCl2, 3 mM CaCl2, 100 nM sCT, 0.01% (w/v) MNG and 0.006% (w/v) CHS before bound material was eluted in buffer containing 5 mM EGTA and 0.1 mg ml−1 Flag peptide. The complex was then concentrated using an Amicon Ultra Centrifugal Filter (MWCO 100 kDa) and subjected to size-exclusion chromatography on a Superdex 200 Increase 10/300 column (GE Healthcare) pre-equilibrated with 20 mM HEPES pH 7.4, 100 mM NaCl, 2 mM MgCl2, 100 nM sCT, 0.01% (w/v) MNG and 0.006% (w/v) CHS to separate complex from contaminants. Eluted fractions consisting of receptor and G-protein complex were pooled and concentrated. Final yield of purified complex was approximately 0.5 mg l−1 insect cell culture.
The stability of the CTR–Gs heterotrimer complex at 4 °C was monitored by analytical SEC. SEC-purified complex was incubated on ice and 50 μ g was applied onto Superose 6 Increase 10/300 GL column at 24 h interval for a total period of 5 days. Protein was detected by measuring absorbance at 280 nm with a fluorescence detector (RF-10AXL, Shimadzu).SDS–PAGE and western blot analysis. Samples collected from each purification step were analysed by SDS–PAGE and western blot. For SDS–PAGE, precast gra-dient TGX gels (Bio-Rad) were used. Gels were either stained by Instant Blue (Expedeon) or immediately transferred to PVDF membrane (Bio-Rad) at 100 V for 1 h. The proteins on the PVDF membrane were probed with two primary antibodies, rabbit anti-Gs C-18 antibody (cat. no. sc-383, Santa Cruz) against Gα s subunit and mouse penta-His antibody (cat. no. 34660, QIAGEN) against His tags. The membrane was washed and incubated with secondary antibodies, 680RD goat anti-mouse and 800CW goat anti-rabbit (LI-COR). Bands were imaged using an infrared imaging system (LI-COR Odyssey Imaging System).Specimen preparation and data acquisition. Concentrated sample from Superdex 200 Increase 10/300 GL column was loaded onto a Superose 6 Increase 10/300 GL column (GE Healthcare). Eluted fractions were used to prepare specimens for EM imaging using conventional negative-staining protocol44. Negative-stained samples were imaged at room temperature with a Tecnai T12 (FEI) electron microscope operated at 120 kV. Images were recorded at magnification of 57,000× and a defo-cus value of − 1 μ m on a Gatan US4000 CCM camera. All images were binned to 2 × 2 pixels to obtain a pixel size of 4.16 Å.
For cryo-EM, purified CTR–Gs heterotrimer complex was diluted to 0.3 mg ml−1 with 20 mM HEPES pH 7.4, 100 mM NaCl, 2 mM MgCl2, 100 nM sCT. Vitrified specimen was prepared by applying 5 μ l of protein complexes onto a glow-discharged 300 mesh copper Quantifoil R1.2/1.3 grid (Quantifoil Micro Tools), plunge-frozen in liquid ethane cooled by liquid nitrogen inside a Vitrobot Mark IV (FEI) with blotting time of 3 s and draining time of 0.5 s. Cryo-EM imag-ing was performed on a Titan Krios microscope operated at 300 kV (FEI) equipped with a Gatan Quantum energy filter, a Gatan K2 Summit direct electron camera (Gatan) and a Volta phase plate (FEI). A total of 2,780 recordings were taken in EFTEM nanoprobe mode, with 50 μ m C2 aperture, at a calibrated magnification of 47,170 corresponding to a magnified pixel size of 1.06 Å. Each movie comprises 50 sub frames with a total dose of 50 e− per Å2, exposure time between 11 and 13.75 s and a dose rate between 4 and 5 e− per pixel per second on the detector.
Data acquisition was done using SerialEM software45 and custom macros for auto-mated single particle data acquisition with Volta phase plate at − 500 nm defocus14.Image processing and 3D reconstructions. Image processing and three- dimensional reconstructions were performed as previously described46. Dose fractionated image stacks were subjected to beam-induced motion correction, globally and locally, by MotionCor247. A sum of all frames, filtered according to exposure dose, in each image stack was used for further processing. CTF parameters for each micrograph were determined by CTFFIND448.
Particle selection, two-dimensional classification and three-dimensional classification were performed on a binned data set with a pixel size of 2.12 Å using RELION2. Semi-automated selected 1,213,995 particle projections were subjected to reference-free two-dimensional classification to discard false-positive particles or particles categorized in poorly defined classes, resulting in 426,001 projections for further processing. An ab initio map generated by VIPER49 was used as initial reference model for maximum-likelihood-based three-dimensional classification. One stable class with detailed features accounting for 106,838 particles was then subjected to focused refinement with a soft mask including receptor and Gs protein and excluding the α -helical domain, produced the final map with global nominal resolution of 4.1 Å, and nominal resolution of 3.8 Å in the seven-transmembrane and G-protein region.
Reported resolutions are based on the gold-standard Fourier shell correlation (FSC) using the 0.143 criterion. All density maps were corrected for the modulation transfer function (MTF) of the K2 summit direct detector and then sharpened by applying temperature factor that was estimated using post-processing in RELION18. Local resolution was determined using ResMap with half-reconstructions as input maps.Model building. The initial template of hCTR was derived from a homology based predicted model calculated by I-TASSER50. Models of sCT and Gs heterotrimer were adopted from the NMR structure (PDB: 2GLH) and β 2AR–Gs crystal struc-ture (PDB: 3SN6), respectively. All models were visualized and docked into the density in Chimera51, followed by manual adjustment and real-space refinement using COOT52. Sequence assignment was guided by bulky residues such as Phe, Tyr, Trp and Arg. The final model was subjected to global refinement and mini-mization in real space using the module phenix.real_space_refine in PHENIX53. Owing to lower local resolution for the peptide, its model was omitted from the deposited structure. Model overfitting was evaluated through its refinement against one cryo-EM half map. FSC curves were calculated between the resulting model and the half map used for refinement as well as between the resulting model and the other half map for cross-validation (Extended Data Fig. 4). The final refinement statistics are provided in Supplementary Table 1.Inactive homology model of hCTR. The glucagon receptor (GCGR) 4L6R X-ray structure7 was used as the template for the CTR homology model. A GCGR/CTR sequence alignment of the seven transmembrane domains and helix 8 was performed using the GPCRdb server54. This alignment was modified by closing the gap at the extracellular end of TM5 and adding residues to CTR and GCGR from their respective gene sequences to complete the alignments at the cytoplasmic end of TM5 and TM6, respectively. We used ICM (Molsoft) to remove all atoms in the 4L6R template not present in this modified GCGR sequence, and generated a CTR homology model based on the modified sequence alignment. An ICM global optimization procedure was performed using Monte Carlo conformational space sampling of side chains with hydrogen bond optimization.Insect cell membrane preparations for radioligand and [35S]GTPγS binding. The CTR complex (CTR, Gα s and Gβ 1γ 2) or CTR alone were expressed in insect HighFive cells (Expression Systems) with the same virus ratios used for the CTR complex preparation for cryo-EM. Cells were harvested approximately 42 h after the viral infection. For crude membrane preparations cells were resuspended in membrane buffer (20 mM HEPES 7.4, 50 mM NaCl, 2 mM MgCl2, with protease inhibitors and benzonase), dounced 20 times followed by centrifugation (10 min, 350g, 4 °C). The pellet was again resuspended in membrane buffer, dounced and clarified by centrifugation at low g. Membranes were pelleted by centrifugation (1 h, 40,000g, 4 °C), resuspended in the membrane buffer and sonicated. The protein concentration was determined using Bradford reagent (Bio-Rad).Radioligand competition binding experiments on CTR expressed in insect cells. Radioligand binding was performed in 20 mM HEPES pH 7.4; 100 mM NaCl; 10 mM MgCl2; 0.1% BSA. First, membranes (1–2 μ g per sample) were incubated with different concentrations of sCT and Nb35 (7 μ g per sample, where applicable) for 1 h at 22 °C. Then [125I]sCT(8–32) (truncated sCT antagonist) was added to a final concentration of approximately 50 pM [125I]sCT(8–32) (precise concentrations in each experiment were determined by γ counting) followed by 1 h incubation at 30 °C. Membranes were harvested on UniFilter GF/C (Whatman) plates using Filtermate 196 harvester (Packard), extensively washed with ice-cold NaCl, dried and dissolved in 40 μ l of MicroScint-O scintillation cocktail (Packard) and counted
© 2017 Macmillan Publishers Limited, part of Springer Nature. All rights reserved.
ARTICLERESEARCH
using a MicroBeta LumiJET counter (PerkinElmer). Non-specific binding was measured in the presence of 1 μ M of sCT(8–32). Curves were fitted to one- or two-site competition binding equations in Prism 6.0 (GraphPad). Data from each experiment were normalized to the response of membranes prepared from cells expressing all the components of the CTR complex (CTR, Gα s and Gβ 1γ 2) in the absence of sCT (100%).[35S]GTPγS binding on CTR expressed in insect cells. Measurement of [35S]GTPγ S incorporation was performed in 20 mM HEPES pH 7.4; 100 mM NaCl; 10 mM MgCl2; 1 mM EDTA; 0.1% BSA; 30 μ g ml−1 saponin. First, membranes (50 μ g per sample) were pre-incubated with 5 μ M GDP and increasing concentra-tions of sCT for 30 min at 22 °C. For experiments investigating the effects of Nb35, indicated amounts of Nb35 were also added at this step. Reactions were started by the addition of [35S]GTPγ S and ATP to final concentrations of 300 pM and 50 μ M, respectively. After 1 h incubation at 30 °C, the reaction was terminated by harvesting the membranes on Whatman UniFilter GF/C plates using Filtermate 196 harvester (Packard). Membranes were extensively washed with ice-cold 50 mM Tris pH 7.6, 10 mM MgCl2, 100 mM NaCl, dried, dissolved in 40 μ l of MicroScint-O scintillation cocktail (Packard) and counted using a MicroBeta LumiJET counter (PerkinElmer). Data from each experiment were normalized to the response of membranes prepared from cells expressing all the components of the CTR complex (CTR, Gα s and Gβ 1γ 2) in the presence of 1 μ M sCT (100%).Generation of mutant receptors and C-terminal deletion constructs in mamma-lian cell vectors. Mutagenesis and C-terminal deletions were generated in a c-Myc epitope-tagged receptor that displays the same pharmacological properties as the wild-type receptor and the construct used for purification studies. The desired mutations were introduced into the CTR in the pEF5/FRT/V5-DEST destination vector (Invitrogen) using oligonucleotides for site-directed mutagenesis purchased from GeneWorks (Hindmarsh) and the QuikChange site-directed mutagenesis kit (Stratagene). C-terminal deletions were generated using primers designed to amplify the CTR from the N terminus to the various points within the C terminus via standard PCR methods. PCR products were purified using a Qiagen gel puri-fication kit following the manufacturer’s protocol. The primers for PCR contained sequences that incorporated sites into the PCR products for recombination into the destination vector pEF5/FRT/V5-DEST via Gateway technology. Sequences of receptor clones were confirmed by automated sequencing at the Australian Genome Research Facility.Mammalian cell expression. COS-7 or 3T3 FlpIn cells (Invitrogen) were cultured in Dulbecco’s Modified Eagle’s Medium (DMEM) (Invitrogen) supplemented with 10% v/v fetal bovine serum (FBS) (Thermo Electron Corporation) at 37 °C and 95% O2/5% CO2 in a humidified incubator. Cells were routinely tested for mycoplasma contamination. Cells were transiently transfected, using polyethylenimine (PEI). DNA and PEI diluted in 150 mM NaCl were combined in a 1:6 ratio and incubated for 15 min, added to cell suspension and the cells plated.Mammalian whole-cell binding experiments. Transfected COS-7 cells were seeded at a density of 3 × 10⁴ cells per well into 96-well culture plates and incubated for 48 h at 37 °C in 5% CO2, and radioligand binding carried out as previously described55. For each cell line in all experiments, total binding was defined by 0.05 nM [125I]sCT(8–32) alone, and non-specific binding was defined by co-incubation with 1 μ M sCT(8–32). For analysis, data are normalized to the specific binding for each individual experiment.
Mammalian cAMP assays. Transfected COS-7 or 3T3-FlpIn cells were seeded at a density of 3 × 10⁴ cells per well into 96-well culture plates and incubated for 48 h at 37 °C in 5% CO2, and cAMP detection carried out as previously described56. All values were converted to concentration of cAMP using a cAMP standard curve performed in parallel, and data were subsequently normalized to the response of 100 μ M forskolin in each cell line.Mammalian ERK1/2 phosphorylation assays. Transfected 3T3-FlpIn cells were seeded at a density of 3 × 10⁴ cells per well into 96-well culture plates and incubated for 48 h at 37 °C in 5% CO2, and pERK1/2 assays were carried out using Alphascreen technology as previously described55,56. FBS was used as a positive control. Data were subsequently normalized to the response of 100 10% FBS in each cell line.Statistics. Where required, statistics for mutational studies were performed using one-way analysis of variance followed by Dunnett’s test using wild-type receptors as the control (P < 0.05). Sample sizes were based on those routinely used for mutational studies and determination of alterations in cell signalling.Data availability. All relevant data are available from the authors and/or are included with the manuscript or Supplementary Information. Atomic coordinates and the cryo-EM density map have been deposited in the Protein Data Bank under accession number 5UZ7 and the Electron Microscopy Data Bank under accession number EMD-8623.
44. Peisley, A. & Skiniotis, G. 2D projection analysis of GPCR complexes by negative stain electron microscopy. Methods Mol. Biol. 1335, 29–38 (2015).
45. Mastronarde, D. N. Automated electron microscope tomography using robust prediction of specimen movements. J. Struct. Biol. 152, 36–51 (2005).
46. Shalev-Benami, M. et al. 2.8-Å cryo-EM structure of the large ribosomal subunit from the eukaryotic parasite Leishmania. Cell Reports 16, 288–294 (2016).
47. Zheng, S., Palovcak, E., Armache, J. P., Cheng, Y. & Agard, D. Anisotropic correction of beam-induced motion for improved single-particle electron cryo-microscopy. Preprint at https://doi.org/10.1101/061960 (2016).
48. Rohou, A. & Grigorieff, N. CTFFIND4: Fast and accurate defocus estimation from electron micrographs. J. Struct. Biol. 192, 216–221 (2015).
49. Penczek, P. A., Grassucci, R. A. & Frank, J. The ribosome at improved resolution: new techniques for merging and orientation refinement in 3D cryo-electron microscopy of biological particles. Ultramicroscopy 53, 251–270 (1994).
50. Yang, J. & Zhang, Y. Protein structure and function prediction using I-TASSER. Curr. Protoc. Bioinformatics 52, 1–15 (2015).
51. Pettersen, E. F. et al. UCSF Chimera--a visualization system for exploratory research and analysis. J. Comput. Chem. 25, 1605–1612 (2004).
52. Emsley, P. & Cowtan, K. Coot: model-building tools for molecular graphics. Acta Crystallogr. D Biol. Crystallogr. 60, 2126–2132 (2004).
53. Adams, P. D. et al. PHENIX: a comprehensive Python-based system for macromolecular structure solution. Acta Crystallogr. D Biol. Crystallogr. 66, 213–221 (2010).
54. Munk, C. et al. GPCRdb: the G protein-coupled receptor database - an introduction. Br. J. Pharmacol. 173, 2195–2207 (2016).
55. Koole, C. et al. Polymorphism and ligand dependent changes in human glucagon-like peptide-1 receptor (GLP-1R) function: allosteric rescue of loss of function mutation. Mol. Pharmacol. 80, 486–497 (2011).
56. Koole, C. et al. Allosteric ligands of the glucagon-like peptide 1 receptor (GLP-1R) differentially modulate endogenous and exogenous peptide responses in a pathway-selective manner: implications for drug screening. Mol. Pharmacol. 78, 456–465 (2010).
© 2017 Macmillan Publishers Limited, part of Springer Nature. All rights reserved.
ARTICLE RESEARCH
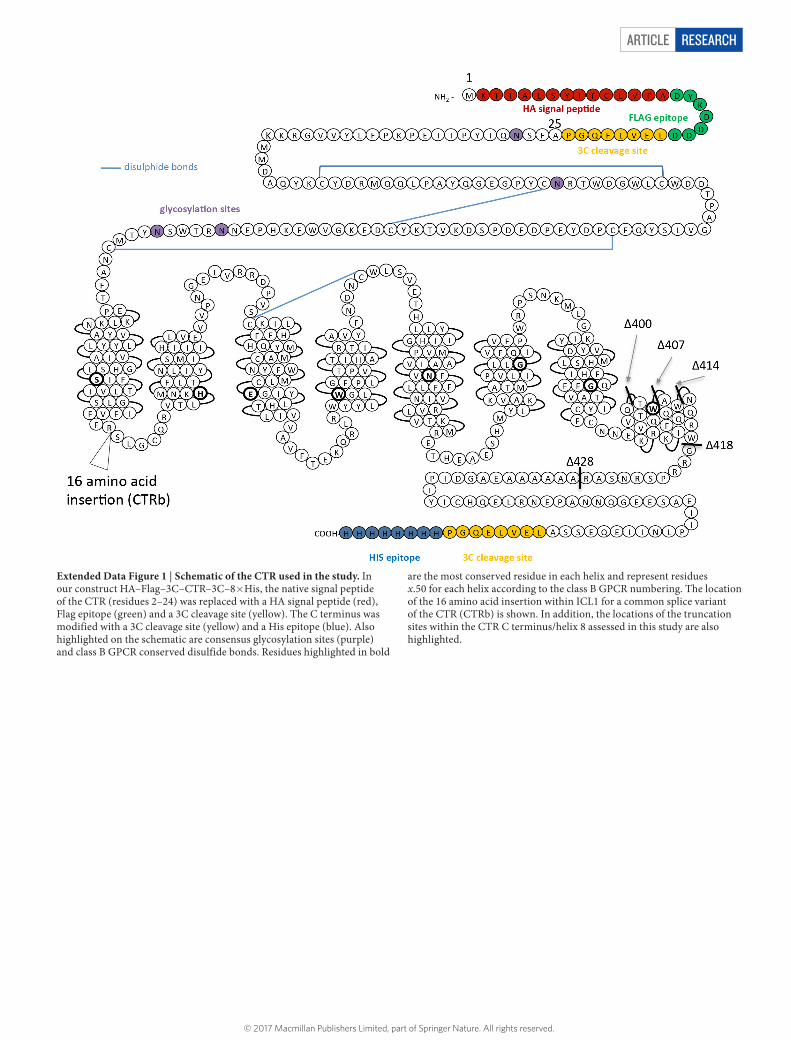
Extended Data Figure 1 | Schematic of the CTR used in the study. In our construct HA–Flag–3C–CTR–3C–8× His, the native signal peptide of the CTR (residues 2–24) was replaced with a HA signal peptide (red), Flag epitope (green) and a 3C cleavage site (yellow). The C terminus was modified with a 3C cleavage site (yellow) and a His epitope (blue). Also highlighted on the schematic are consensus glycosylation sites (purple) and class B GPCR conserved disulfide bonds. Residues highlighted in bold
are the most conserved residue in each helix and represent residues x.50 for each helix according to the class B GPCR numbering. The location of the 16 amino acid insertion within ICL1 for a common splice variant of the CTR (CTRb) is shown. In addition, the locations of the truncation sites within the CTR C terminus/helix 8 assessed in this study are also highlighted.
© 2017 Macmillan Publishers Limited, part of Springer Nature. All rights reserved.
ARTICLERESEARCH
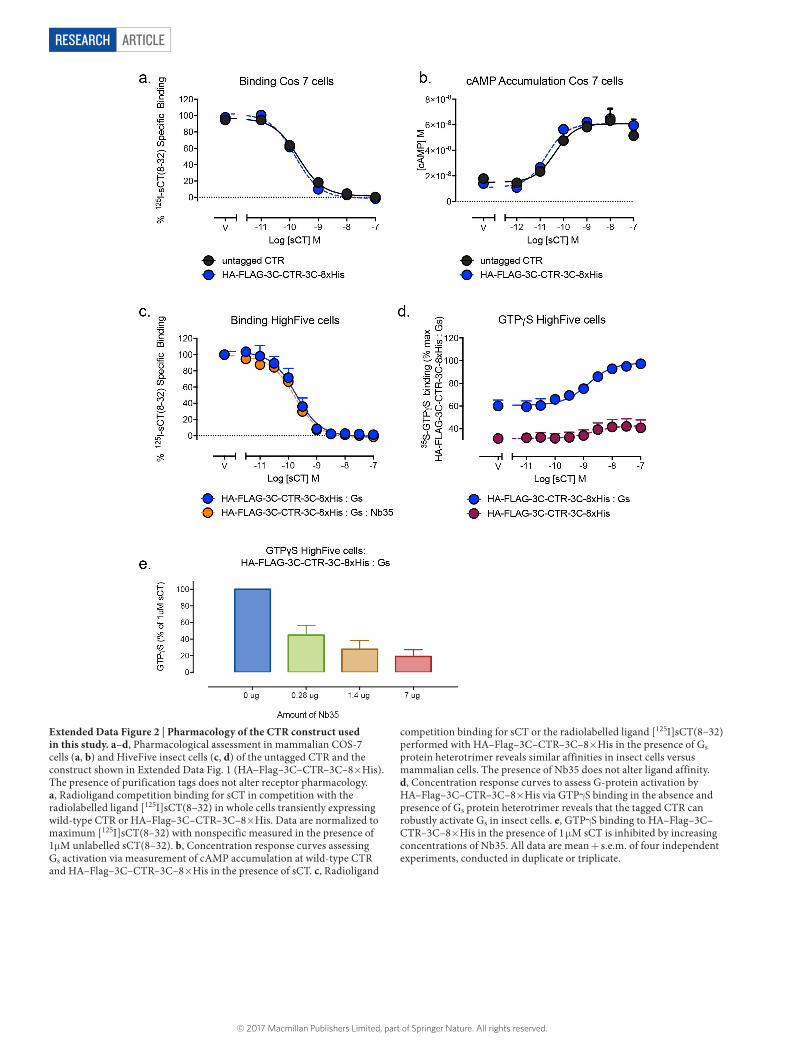
Extended Data Figure 2 | Pharmacology of the CTR construct used in this study. a–d, Pharmacological assessment in mammalian COS-7 cells (a, b) and HiveFive insect cells (c, d) of the untagged CTR and the construct shown in Extended Data Fig. 1 (HA–Flag–3C–CTR–3C–8× His). The presence of purification tags does not alter receptor pharmacology. a, Radioligand competition binding for sCT in competition with the radiolabelled ligand [125I]sCT(8–32) in whole cells transiently expressing wild-type CTR or HA–Flag–3C–CTR–3C–8× His. Data are normalized to maximum [125I]sCT(8–32) with nonspecific measured in the presence of 1μ M unlabelled sCT(8–32). b, Concentration response curves assessing Gs activation via measurement of cAMP accumulation at wild-type CTR and HA–Flag–3C–CTR–3C–8× His in the presence of sCT. c, Radioligand
competition binding for sCT or the radiolabelled ligand [125I]sCT(8–32) performed with HA–Flag–3C–CTR–3C–8× His in the presence of Gs protein heterotrimer reveals similar affinities in insect cells versus mammalian cells. The presence of Nb35 does not alter ligand affinity. d, Concentration response curves to assess G-protein activation by HA–Flag–3C–CTR–3C–8× His via GTPγ S binding in the absence and presence of Gs protein heterotrimer reveals that the tagged CTR can robustly activate Gs in insect cells. e, GTPγ S binding to HA–Flag–3C–CTR–3C–8× His in the presence of 1 μ M sCT is inhibited by increasing concentrations of Nb35. All data are mean + s.e.m. of four independent experiments, conducted in duplicate or triplicate.
© 2017 Macmillan Publishers Limited, part of Springer Nature. All rights reserved.
ARTICLE RESEARCH
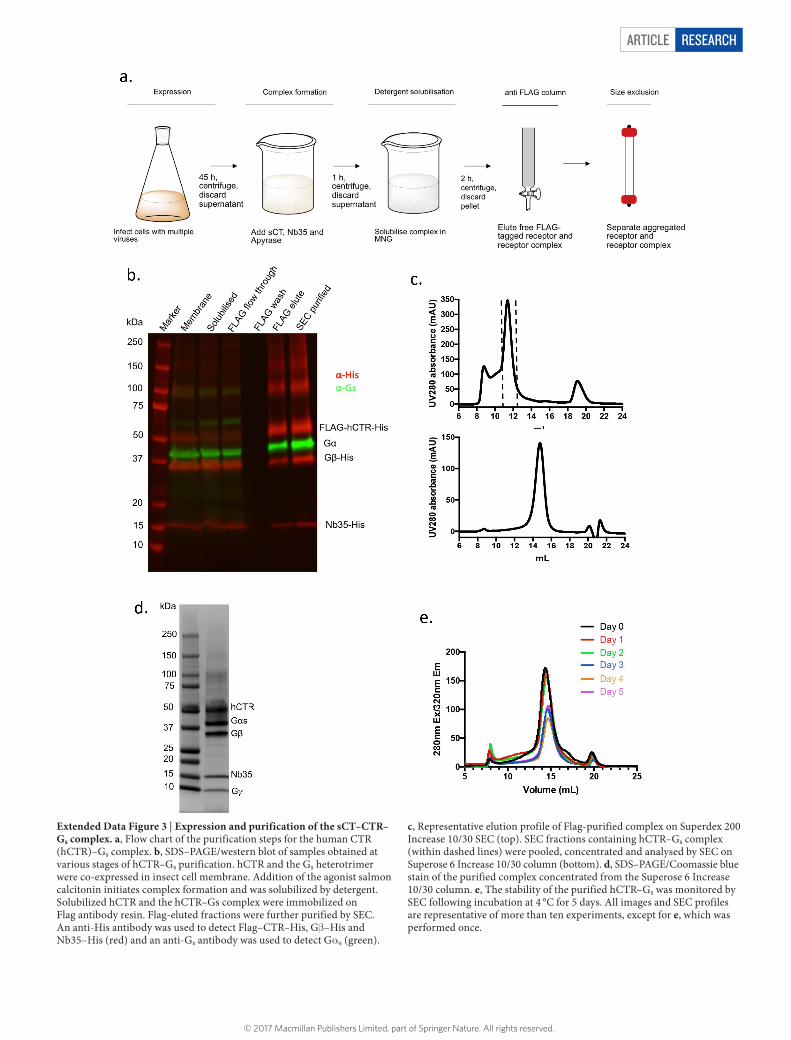
Extended Data Figure 3 | Expression and purification of the sCT–CTR–Gs complex. a, Flow chart of the purification steps for the human CTR (hCTR)–Gs complex. b, SDS–PAGE/western blot of samples obtained at various stages of hCTR–Gs purification. hCTR and the Gs heterotrimer were co-expressed in insect cell membrane. Addition of the agonist salmon calcitonin initiates complex formation and was solubilized by detergent. Solubilized hCTR and the hCTR–Gs complex were immobilized on Flag antibody resin. Flag-eluted fractions were further purified by SEC. An anti-His antibody was used to detect Flag–CTR–His, Gβ –His and Nb35–His (red) and an anti-Gs antibody was used to detect Gα s (green).
c, Representative elution profile of Flag-purified complex on Superdex 200 Increase 10/30 SEC (top). SEC fractions containing hCTR–Gs complex (within dashed lines) were pooled, concentrated and analysed by SEC on Superose 6 Increase 10/30 column (bottom). d, SDS–PAGE/Coomassie blue stain of the purified complex concentrated from the Superose 6 Increase 10/30 column. e, The stability of the purified hCTR–Gs was monitored by SEC following incubation at 4 °C for 5 days. All images and SEC profiles are representative of more than ten experiments, except for e, which was performed once.
© 2017 Macmillan Publishers Limited, part of Springer Nature. All rights reserved.
ARTICLERESEARCH
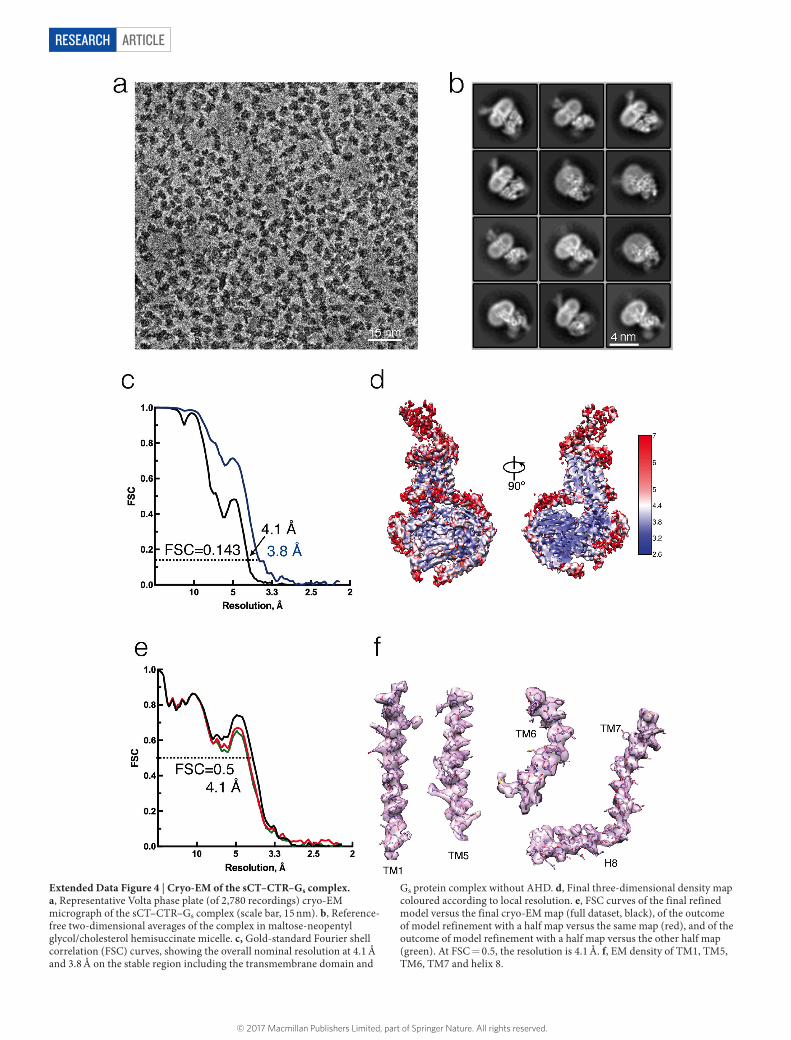
Extended Data Figure 4 | Cryo-EM of the sCT–CTR–Gs complex. a, Representative Volta phase plate (of 2,780 recordings) cryo-EM micrograph of the sCT–CTR–Gs complex (scale bar, 15 nm). b, Reference-free two-dimensional averages of the complex in maltose-neopentyl glycol/cholesterol hemisuccinate micelle. c, Gold-standard Fourier shell correlation (FSC) curves, showing the overall nominal resolution at 4.1 Å and 3.8 Å on the stable region including the transmembrane domain and
Gs protein complex without AHD. d, Final three-dimensional density map coloured according to local resolution. e, FSC curves of the final refined model versus the final cryo-EM map (full dataset, black), of the outcome of model refinement with a half map versus the same map (red), and of the outcome of model refinement with a half map versus the other half map (green). At FSC = 0.5, the resolution is 4.1 Å. f, EM density of TM1, TM5, TM6, TM7 and helix 8.
© 2017 Macmillan Publishers Limited, part of Springer Nature. All rights reserved.
ARTICLE RESEARCH
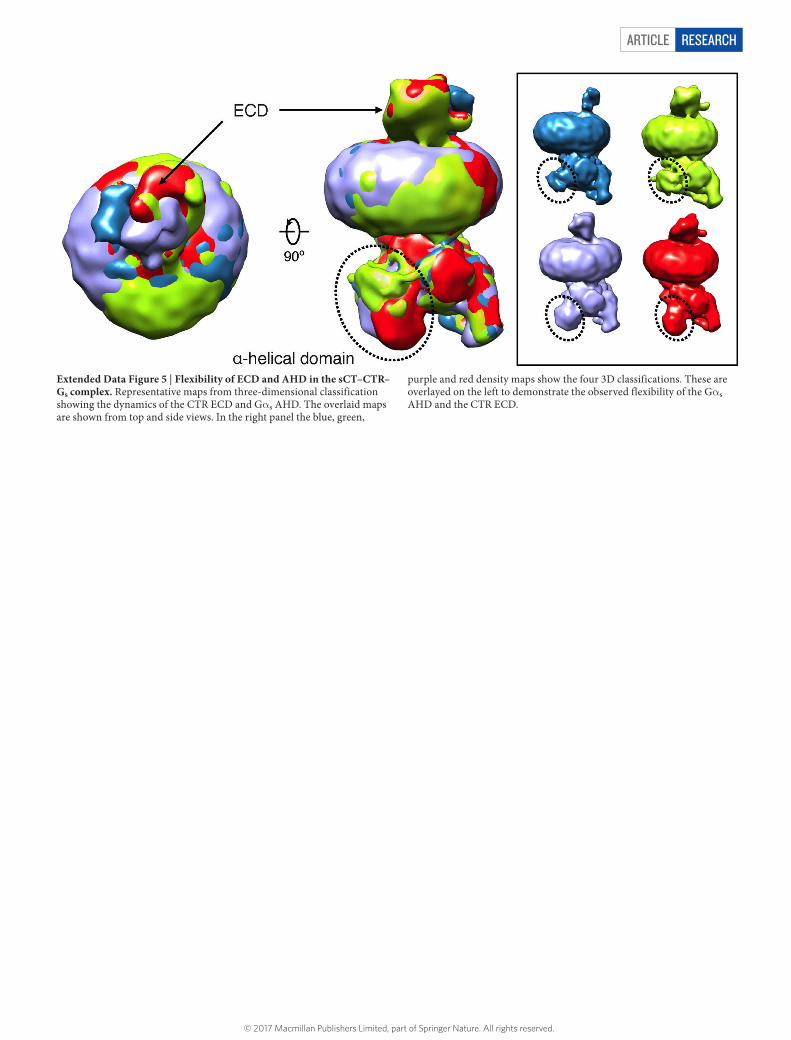
Extended Data Figure 5 | Flexibility of ECD and AHD in the sCT–CTR–Gs complex. Representative maps from three-dimensional classification showing the dynamics of the CTR ECD and Gα s AHD. The overlaid maps are shown from top and side views. In the right panel the blue, green,
purple and red density maps show the four 3D classifications. These are overlayed on the left to demonstrate the observed flexibility of the Gα s AHD and the CTR ECD.
© 2017 Macmillan Publishers Limited, part of Springer Nature. All rights reserved.
ARTICLERESEARCH
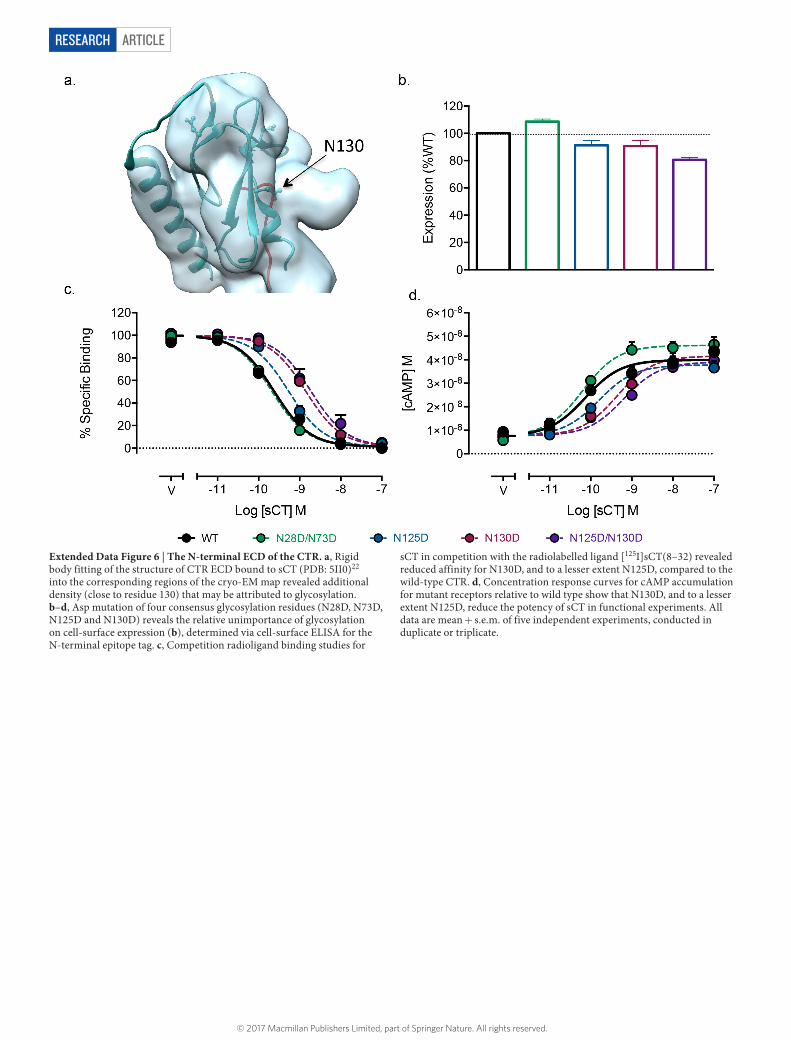
Extended Data Figure 6 | The N-terminal ECD of the CTR. a, Rigid body fitting of the structure of CTR ECD bound to sCT (PDB: 5II0)22 into the corresponding regions of the cryo-EM map revealed additional density (close to residue 130) that may be attributed to glycosylation. b–d, Asp mutation of four consensus glycosylation residues (N28D, N73D, N125D and N130D) reveals the relative unimportance of glycosylation on cell-surface expression (b), determined via cell-surface ELISA for the N-terminal epitope tag. c, Competition radioligand binding studies for
sCT in competition with the radiolabelled ligand [125I]sCT(8–32) revealed reduced affinity for N130D, and to a lesser extent N125D, compared to the wild-type CTR. d, Concentration response curves for cAMP accumulation for mutant receptors relative to wild type show that N130D, and to a lesser extent N125D, reduce the potency of sCT in functional experiments. All data are mean + s.e.m. of five independent experiments, conducted in duplicate or triplicate.
© 2017 Macmillan Publishers Limited, part of Springer Nature. All rights reserved.
ARTICLE RESEARCH
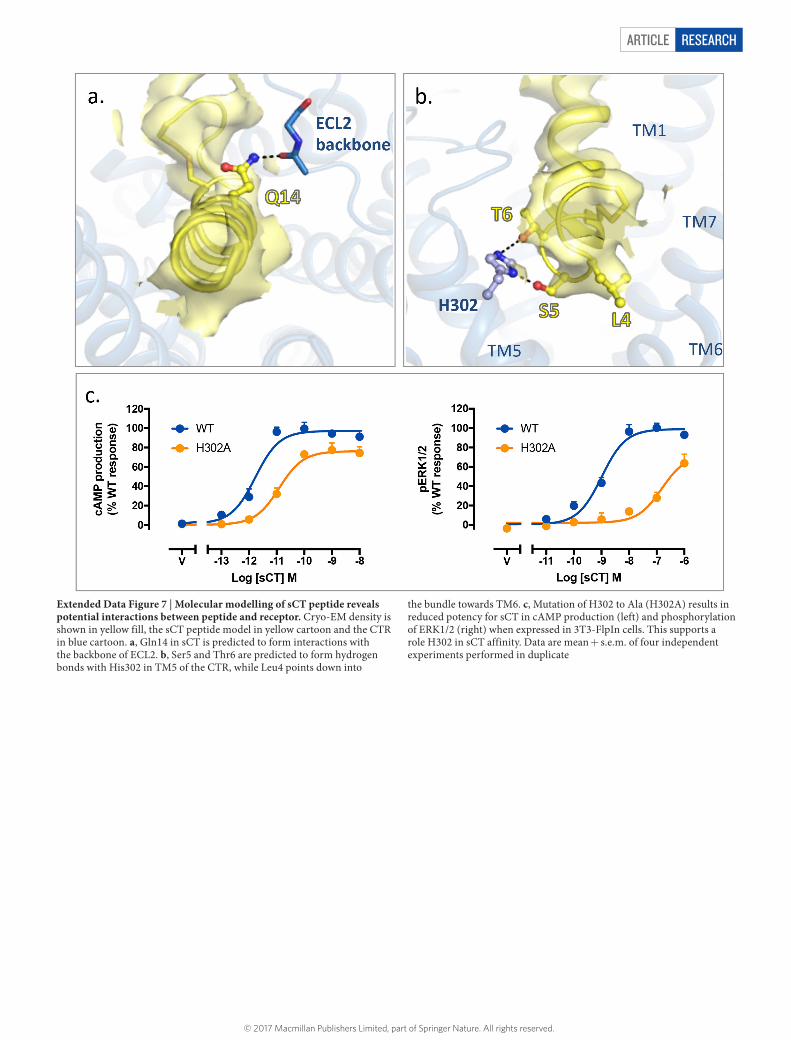
Extended Data Figure 7 | Molecular modelling of sCT peptide reveals potential interactions between peptide and receptor. Cryo-EM density is shown in yellow fill, the sCT peptide model in yellow cartoon and the CTR in blue cartoon. a, Gln14 in sCT is predicted to form interactions with the backbone of ECL2. b, Ser5 and Thr6 are predicted to form hydrogen bonds with His302 in TM5 of the CTR, while Leu4 points down into
the bundle towards TM6. c, Mutation of H302 to Ala (H302A) results in reduced potency for sCT in cAMP production (left) and phosphorylation of ERK1/2 (right) when expressed in 3T3-FlpIn cells. This supports a role H302 in sCT affinity. Data are mean + s.e.m. of four independent experiments performed in duplicate
© 2017 Macmillan Publishers Limited, part of Springer Nature. All rights reserved.
ARTICLERESEARCH
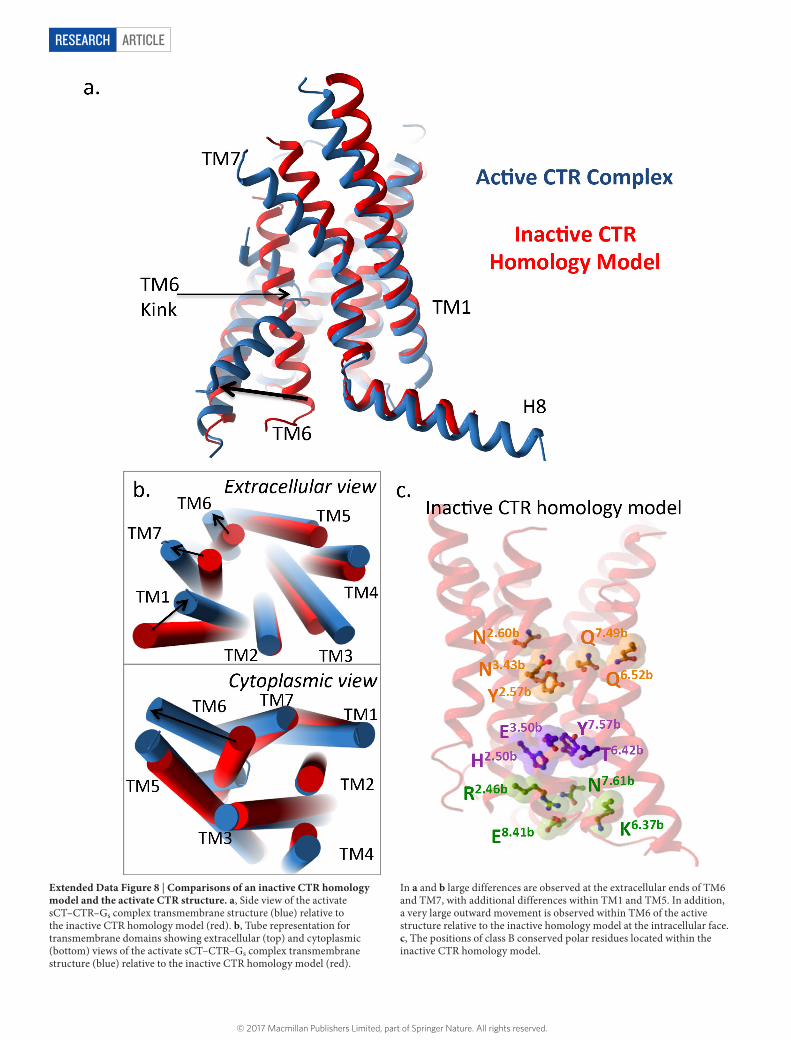
Extended Data Figure 8 | Comparisons of an inactive CTR homology model and the activate CTR structure. a, Side view of the activate sCT–CTR–Gs complex transmembrane structure (blue) relative to the inactive CTR homology model (red). b, Tube representation for transmembrane domains showing extracellular (top) and cytoplasmic (bottom) views of the activate sCT–CTR–Gs complex transmembrane structure (blue) relative to the inactive CTR homology model (red).
In a and b large differences are observed at the extracellular ends of TM6 and TM7, with additional differences within TM1 and TM5. In addition, a very large outward movement is observed within TM6 of the active structure relative to the inactive homology model at the intracellular face. c, The positions of class B conserved polar residues located within the inactive CTR homology model.
© 2017 Macmillan Publishers Limited, part of Springer Nature. All rights reserved.
ARTICLE RESEARCH
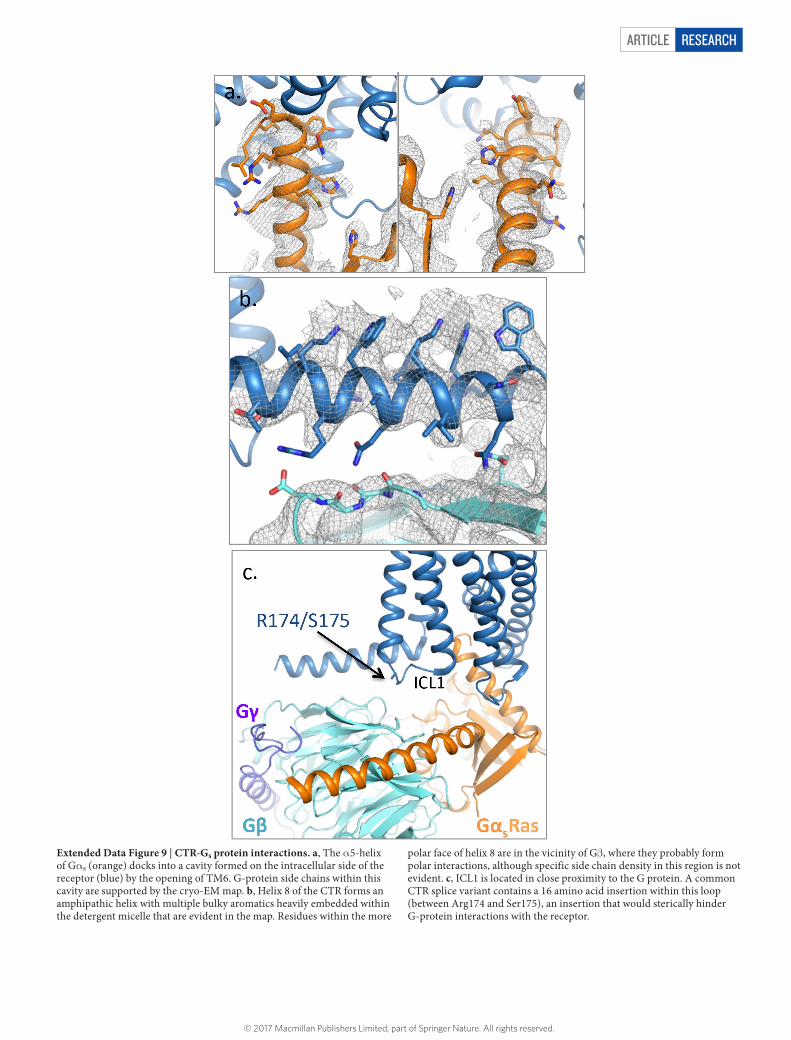
Extended Data Figure 9 | CTR-Gs protein interactions. a, The α 5-helix of Gα s (orange) docks into a cavity formed on the intracellular side of the receptor (blue) by the opening of TM6. G-protein side chains within this cavity are supported by the cryo-EM map. b, Helix 8 of the CTR forms an amphipathic helix with multiple bulky aromatics heavily embedded within the detergent micelle that are evident in the map. Residues within the more
polar face of helix 8 are in the vicinity of Gβ , where they probably form polar interactions, although specific side chain density in this region is not evident. c, ICL1 is located in close proximity to the G protein. A common CTR splice variant contains a 16 amino acid insertion within this loop (between Arg174 and Ser175), an insertion that would sterically hinder G-protein interactions with the receptor.
© 2017 Macmillan Publishers Limited, part of Springer Nature. All rights reserved.
ARTICLERESEARCH
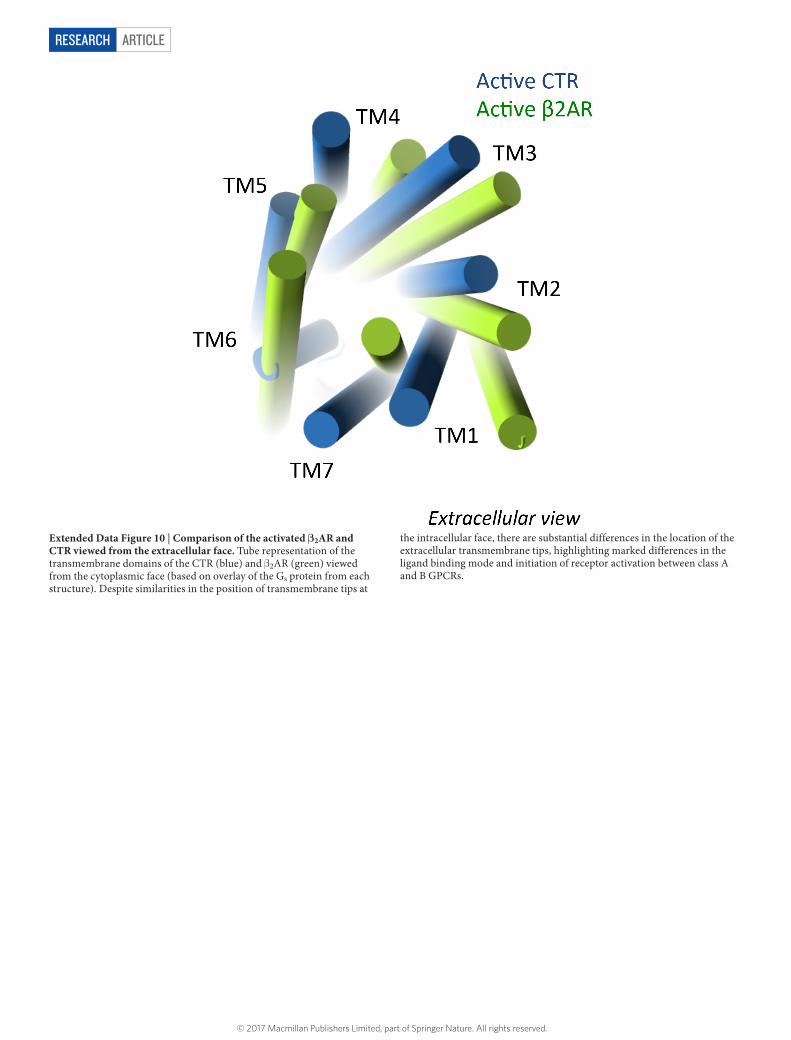
Extended Data Figure 10 | Comparison of the activated β2AR and CTR viewed from the extracellular face. Tube representation of the transmembrane domains of the CTR (blue) and β 2AR (green) viewed from the cytoplasmic face (based on overlay of the Gs protein from each structure). Despite similarities in the position of transmembrane tips at
the intracellular face, there are substantial differences in the location of the extracellular transmembrane tips, highlighting marked differences in the ligand binding mode and initiation of receptor activation between class A and B GPCRs.
© 2017 Macmillan Publishers Limited, part of Springer Nature. All rights reserved.