Personnel Management and School Productivity: Evidence ...
55
Personnel Management and School Productivity: Evidence from India * Renata Lemos † Karthik Muralidharan ‡ Daniela Scur § World Bank UC San Diego Cornell University July 8, 2021 Abstract This paper uses new data to study school management and productivity in India. We report four main results. First, management quality in public schools is low, and ∼2σ below high-income countries with comparable data. Second, private schools have higher management quality, driven by much stronger people management. Third, people management quality is correlated with both independent measures of teaching practice, as well as school productivity measured by student value added. Fourth, private school teacher pay is positively correlated with teacher effectiveness, and better- managed private schools are more likely to retain their most effective teachers. Neither pattern is seen in public schools. JEL Codes: I21, M5, O1 Keywords: school effectiveness, management practices, school leadership, TFP, teacher value added, teacher pay, public and private schools * Acknowledgements: We thank Nick Bloom, Cesi Cruz, Alex Eble, Deon Filmer, Bob Gibbons, Dan Honig, Julien Labonne, Lant Pritchett, Simon Quinn, Arman Rezaae, Abhijeet Singh, Margaret Stevens, John Van Reenen and several seminar participants at the CSAE, Empirical Management Conference, NEUDC, Oxford, and SIOE for very useful comments and suggestions. We are deeply grateful to M. Srinivasa Rao, B. Srinivasulu, S. Ramamurthy, and staff of the Azim Premji Foundation for their support in setting up and overseeing the data collection that this paper is based on. † CEPR; CEP-LSE; IGC. E-mail: [email protected]. ‡ University of California San Diego; NBER; J-PAL. E-mail: [email protected]. § Cornell University; CEPR; CEP-LSE. E-mail: [email protected].
Transcript of Personnel Management and School Productivity: Evidence ...
Personnel Management and School Productivity:Evidence from India∗
Renata Lemos† Karthik Muralidharan‡ Daniela Scur§World Bank UC San Diego Cornell University
July 8, 2021
Abstract
This paper uses new data to study school management and productivity in India.We report four main results. First, management quality in public schools is low,and ∼2σ below high-income countries with comparable data. Second, private schoolshave higher management quality, driven by much stronger people management. Third,people management quality is correlated with both independent measures of teachingpractice, as well as school productivity measured by student value added. Fourth,private school teacher pay is positively correlated with teacher effectiveness, and better-managed private schools are more likely to retain their most effective teachers. Neitherpattern is seen in public schools.
JEL Codes: I21, M5, O1
Keywords: school effectiveness, management practices, school leadership, TFP, teacher valueadded, teacher pay, public and private schools
∗Acknowledgements: We thank Nick Bloom, Cesi Cruz, Alex Eble, Deon Filmer, Bob Gibbons, DanHonig, Julien Labonne, Lant Pritchett, Simon Quinn, Arman Rezaae, Abhijeet Singh, Margaret Stevens,John Van Reenen and several seminar participants at the CSAE, Empirical Management Conference,NEUDC, Oxford, and SIOE for very useful comments and suggestions. We are deeply grateful to M.Srinivasa Rao, B. Srinivasulu, S. Ramamurthy, and staff of the Azim Premji Foundation for their support insetting up and overseeing the data collection that this paper is based on.†CEPR; CEP-LSE; IGC. E-mail: [email protected].‡University of California San Diego; NBER; J-PAL. E-mail: [email protected].§Cornell University; CEPR; CEP-LSE. E-mail: [email protected].
1 Introduction
Developing countries have made impressive progress in expanding primary school enrollmentin the last couple of decades, but learning outcomes continue to be poor (World Bank; 2018).A growing body of evidence suggests that simply expanding schooling inputs may not bevery effective without also improving the productivity of how these inputs are used (Glewweand Muralidharan; 2016). One possible contributor to school productivity is the quality of itsmanagement, and there is growing interest in studying and improving school management.Yet, there is little evidence on the extent to which school management quality is correlatedwith either teaching practices or school productivity.
In this paper, we examine this question using data from two projects in India, the De-velopment World Management Survey (D-WMS) and the Andhra Pradesh School Choice(APSC) project. The D-WMS is a new measurement tool that we developed for this paperto expand on the original WMS tool (Bloom and Van Reenen; 2007) to obtain comparablebut yet more granular measures of management quality in a low-capacity setting. The APSCproject studied in Muralidharan and Sundararaman (2015) collected four years of rich paneldata on schools, students, and teachers in a representative sample of rural public and privateschools in the Indian state of Andhra Pradesh (AP).1 The combination of these two datasetsallows us to present the first detailed and comparable evidence of the types of managementpractices used in primary schools in a developing country, across the public and privatesector, and also examine how they correlate with measures of school effectiveness.
We report four main results. First, public schools in AP have low management quality.Based on a normalized cross-country comparison, we estimate that management quality inAP public schools is almost 2σ below the mean of 6 high-income countries with comparabledata.2 However, the low management quality in AP is not an outlier after adjusting forlog per-capita income. Thus, the income gradient in school management quality acrosscountries could be one reason that education systems in higher income countries add morehuman capital for each year of schooling, as shown by Schoellman (2011).
Second, within AP, private schools are much better managed with an average man-agement score that is 1.36σ higher than in AP public schools (normalized relative to thedistribution of AP public schools). Our management score can be decomposed into scores
1The original state of AP was divided into two states (AP and Telangana) on June 2, 2014. Since thisdivision took place after our data collection, we use the term “AP” to represent the original undivided state.
2School management scores for other countries were collected as part of Bloom et al. (2015), and arecomparable with the AP data because they were collected based on the same measurement scale. Weinclude only public schools from the WMS dataset in this exercise. The figure normalizes managementscores across countries since it makes cross-country comparisons.
1
on both operations and people management, and we see that the public school disadvantageis driven primarily by very low scores on people management: private schools scored nearly4.8σ higher than public schools on this index. Relative to global benchmarks, the comparablescores for AP private schools are in line with those of public school systems in Brazil, Italy,and Colombia. This suggests that the private sector in India is able to achieve measures ofmanagement quality comparable to public school systems in much richer countries.
Third, we find that school management quality (and especially people management) issignificantly correlated with independent measures of teaching quality as well as studentvalue-added. In public schools, a 1σ higher people-management score is associated with0.26σ better teacher practices and 0.34σ higher student value added. In private schools,these are 0.24σ and 0.16σ respectively. We also find that a large portion of the differences invalue-addition across public and private schools can be explained by differences in the qualityof people management (in an accounting sense, but not necessarily in a causal sense).
Fourth, we find that better management is directly correlated with personnel policies thatreward effective teaching on both the intensive (wage) and extensive (selection) margins. Inprivate schools, more effective teachers, measured by teacher value-added (TVA), receivesignificantly higher wages even after controlling for observable teacher characteristics. Ateacher who adds an extra 1σ to student learning each year on average is paid about 26%higher wages. We find no correlation between TVA and wages in public schools. Bettermanaged private schools are also more effective at selecting and retaining their most effectiveteachers, but we find no such relationship in public schools.
A key question for interpreting our results is to understand where the variation in man-agement practices comes from and what it is correlated with. We examine correlations ofmanagement practices with school, teacher, and head-teacher characteristics and do findsome meaningful relationships — especially with parental education and employment, andteacher qualifications and school size in private schools. However, we still find considerablevariation in management quality after controlling for all these characteristics, and all theresults above hold even with the residualized measure of management quality.
This residual variation most likely reflects idiosyncratic variation in school-level manage-ment practices. This is consistent with the management scores in our setting being below2.5 for most schools on the D-WMS scale, which codes management quality on a 1-5 scale.On this scale, scores below 3 reflect variation in individual practices that are not formallycodified in any school management policy. As such, the variation in management qualityin our data is best interpreted as reflecting variation in management practices employed byindividual school leaders rather than variation in formal policies.
2
Our first contribution is to the measurement of management practices in low and middleincome countries (LMICs). Specifically, this paper presents the development and first useof the enhanced measurement tool (the D-WMS) designed for low-capacity contexts. Thesurvey instruments along with detailed notes on administering and coding the surveys areincluded in Appendix B.3 We recommend the use of these tools for future research on man-agement in LMICs (wherever feasible) for three reasons. First, it allows for a more preciseand granular understanding of management practices and their relationship with productiv-ity - especially in the lower end of the distribution where management practices in LMICs areconcentrated.4 Second, the greater precision in measurement will improve power for detect-ing changes in management quality in response to interventions to improve management.5
Third, the D-WMS maintains comparability with the original WMS that has been deployedin several settings and allows cross-country comparisons of the sort shown in this paper.6
Second, we show that management quality — especially the quality of personnel man-agement — is strongly correlated with school productivity. Prior work has documented thecorrelation between school management quality and levels of test scores across secondaryschools in (primarily) OECD countries (Bloom et al.; 2015). However, differences in test-score levels across schools could reflect omitted variables such as student selectivity and maynot be a good measure of school productivity. The combination of independent measuresof teaching practices and panel data on student learning allow us to present direct evidenceon the correlation between school management quality and independent measures of schooleffectiveness and productivity.7
Third, we complement the literature on school leadership where multiple papers havestudied the impact of changes in principals and superintendents on school quality, and shownthat school leaders “matter” (Coelli and Green; 2012; Walsh and Dotter; 2020; Lavy and
3All survey materials are available on the WMS website: www.worldmanagementsurvey.org4For instance, using the WMS comparable scores, 81% of the public schools in AP would have a people-
management score of 1, which is the lowest possible score and would generate considerable floor effects inmeasurement. With the D-WMS scoring grid, only 6% of schools scored the minimum score of 1.
5For instance, using the WMS scales to study the relationship between management quality and schoolproductivity in our setting would have yielded directionally similar findings, but with larger standard errorsand more insignificant results due to the greater coarseness of the coding relative to the D-WMS.
6Since the time we developed, piloted, refined, and finalized the D-WMS tool for this project, we haveshared the D-WMS instrument and methodology with research teams in Brazil, Colombia, Haiti, Indonesia,Mexico, Mozambique, Pakistan, Tanzania and Puerto Rico.
7Several studies have found that estimates of the impact of education interventions using value-addedmethods that control for lagged test scores are comparable to those obtained from experimental studies.(e.g., Kane and Staiger; 2008; Kane et al.; 2014; Chetty et al.; 2014). Prior work in developing countries hasdocumented the correlation between intermediate outcomes of management quality (such as teacher absenceor time-on-task) and value-added (e.g., Duflo et al.; 2012; Romero et al.; 2020), but has not directly measuredmanagement practices or correlated them with school productivity.
3
Boiko; 2017; Munoz and Prem; 2020). Yet, for the most part, this literature has not con-sistently measured specific practices of school leaders. Our results showing that variation inmanagement practices measured by the D-WMS are also correlated with independent mea-sures of teacher value-added and practices suggest that differences in school productivitythat may otherwise be attributed to school “leadership” can be accounted for by specificmanagement practices. This knowledge may help in designing programs whereby schoolleaders could be coached to implement better practices and become more effective, as shownin the United States (Fryer; 2014, 2017). In contrast, the main practical implication ofsimply knowing that school leaders “matter” would be to focus on the selection margin ofidentifying effective school leaders.
Finally, we contribute to the broader literature on public-sector personnel economics(e.g. Lazear (1995); Finan et al. (2015)), and to the comparative analysis of managementin the public and private sector (Rainey and Chun; 2007). Specifically, we present (toour knowledge) the first evidence that combines measures of management quality, employeebehaviors, and productivity; with comparable data across public and private sector entitiesin any sector. This allows us to demonstrate the central role played by better personnelmanagement in explaining the greater productivity in the private sector.
2 The Indian primary school institutional context
The undivided state of Andhra Pradesh (AP) would be India’s fifth largest state, with apopulation of 85 million. At the time of this study, AP had similar averages to the restof India on measures of human development, primary school enrolment, literacy, infantmortality and teacher absence (Muralidharan and Sundararaman; 2011). In this context,public schools are owned and run by the government, and private schools are owned andrun by private individuals or organizations (including religious and charitable ones). At thetime of the study, an estimated 3.2 million children in AP attended public schools and 2.1million attended private schools (see Young Lives dataset in Woldehanna et al. (2018)).
The private schools in our study sample are not elite schools. Rather, they represent asegment of schools that are referred to as “low-cost” or “budget” private schools. These low-cost private schools have substantially lower per-student expenditure than public schools,and the vast majority of enrollment in private schools in India is accounted for by thissegment of schools (CSF; 2020). Similar trends are seen in Pakistan (Andrabi et al.; 2008).The main driver of the lower costs in these private schools is that they pay much lowerteacher salaries.
4
Public school teachers are much more likely to have formal teacher training credentials(99% vs. 34%), though these qualifications have been shown to be poor predictors of betterstudent performance (Muralidharan and Sundararaman; 2011). They are civil servants hiredby the state government on permanent contracts and are paid over 5 times the average privateschool teacher salary (Rs. 14,286 vs. 2,607 per month in data collected between 2008-2012).Decisions regarding teacher postings and transfers are typically made at the district level.While this process is often politically influenced in several Indian states,(Béteille; 2009)Andhra Pradesh had introduced a systematic and transparent process of teacher postingsand transfers since the late 1990s (Ramachandran et al.; 2016).8
Teacher effort and accountability are significantly higher in private schools. Privateschools have much lower rates of teacher absence (9% vs. 24%), and higher rates of observedactive teaching when measured by unannounced visits to schools (50% vs. 35%). They alsohave a longer school year (11 more working days) and longer school days (45 minutes longerper day). Public primary schools in our sample have an average of 68 students and 3 teachersacross grades 1-5. Private schools are substantially larger with over 300 students on averageand about 14 teachers. Private schools also have lower levels of multi-grade teaching (whereone teacher simultaneously teaches multiple grades) than public schools (24% vs 79%). 9
Though these private schools are low cost, they still charge fees, whereas public schools arefree. Thus, students attending these private schools come from relatively more advantagedbackgrounds, as measured by parental education, occupation, and assets.10
3 Data
3.1 Measuring management in low and middle-income countries(LMICs): the Development WMS (D-WMS)
The original World Management Survey (WMS) project started in 2002 and has since thencollected over 30,000 data points on the quality of management practices in establishmentsin the manufacturing, retail, education and healthcare sectors across 39 countries.11 The
8The transparent criteria used to determine teachers priority for transfer requests include length of service(or seniority), spousal job postings (for those with spouses who are also employed by the government), andduration spent in the current post.
9All figures reported in this section are based on Tables 3, 4, and 5 of Muralidharan and Sundararaman(2015). We present a comparison of key metrics in Table A1.
10In addition to being true in our sample, this is also seen in several other studies (Tooley; 2009; Muralid-haran and Kremer; 2008; Vennam et al.; 2014; Singh; 2015).
11For a review of the latest WMS public dataset, see Scur et al. (2021). For the first paper on WMSmeasurement in schools, see Bloom et al. (2015). More information on the WMS project can be found at
5
methodology involves an interview lasting approximately one hour with the senior-mostmanager at the establishment (for schools, this is the head teacher or principal). Highlytrained analysts score the manager responses on a set scale of 1 to 5 based on a commonscoring rubric. A score of 1 means there are no processes at all or very little processes inplace, while a score of 2 means there are some informal processes in place mainly adoptedby the headteacher herself (as opposed to some formal “school policy”). A score of 3 meansthere is a formal process in place, though it has weaknesses such as not being followed all thetime or properly. Scores of 4 and 5 indicate increasing levels of adherence and embeddednessof the practices such that they are part of the culture of the school.
The distribution of scores for schools in high income countries span almost the entirerange of the WMS scores, from 1 to a little above 4. LMICs (and especially schools inLMICs) have much lower scores on average, often bunching at the minimum score of 1. Tobetter capture variation in this thick bottom tail, we developed and use an enhanced measureof management quality for this paper — which we refer to as the Development WMS (D-WMS).12 The D-WMS adds granularity to the measurement of management practices, whilemaintaining comparability with the original WMS in two ways: first, it expands the numberof questions in each domain by a factor of three to separately capture the existence, use, andmonitoring of various management practices. Second, it expands the scoring grid to allow forhalf points between 1 and 5, relative to the original WMS that only allowed integer scores.Put together, it enables a six-fold increase in the granularity of measurement of managementquality. We discuss each innovation below.
3.1.1 Expansion to improve measurement of management quality
The WMS measures 20 “topics” that each include a set of questions that help the interviewergather the appropriate information to score based on a set rubric. For each topic, there arethree broad types of questions that interviewers use: first they ask about the existence of thepractice (for example, does the school even have performance indicators and which ones),then they ask about the usage of the practice (how is it implemented, how often it is used)and finally they ask about the monitoring of the practice itself (how do they keep track thatit is being understood and used effectively). In the original WMS these three factors wereembedded in each score, while in the D-WMS they are explicit and require separate scores.This approach reduces measurement error by providing a much tighter scoring rubric andwww.worldmanagementsurvey.org.
12This paper supersedes the note in Lemos and Scur (2016), which describes the protocols for implemen-tation of the D-WMS but does not validate the instrument by correlating the resulting management scoreswith independent measures of teaching practices and school productivity (which this paper does).
6
limiting the amount of judgment that interviewers need to apply in coding responses. This isespecially important for LMIC settings, where high quality interviewers may not be availableor affordable (the original WMS was coded by MBA students from leading universities).
The expansion enables a better understanding of management practices, and the gapsbetween existence and use of tools and techniques. As shown by Muralidharan and Singh(2020), public schools in India often have good policies on paper, but these are not matchedby actual practice. We found evidence of similar gaps in our field pilots, and adaptedthe survey instrument accordingly to capture distinctions between the existence and use ofvarious management practices.13 Using survey instruments that capture this distinction willbe especially useful for research on the effectiveness of management interventions in LMICs.
3.1.2 Expansion to capture greater variation across the scoring scale
The scores in low and middle income income countries in the original WMS rarely go beyond3. To capture finer variation in the lower tail, our expanded survey instrument measures thelevel of adoption of management practices on a scale of 1 to 5, in increments of 0.5 for eachof the 20 topics. In AP public schools, the distribution of the comparable WMS people-management scores would have a mode of 1. By allowing for half scores to be awarded, wecan distinguish between a school that has absolutely no practices in place (score of 1) andone that has some semblance of practices in place but that they are still rather ad-hoc (scoreof 1.5). We can also distinguish between schools that have an informal practice in place(score of 2) and a “good” informal practice in place that is almost like “formal school policy”(score of 2.5). We provide a more detailed example of the scoring of management practicesin Appendix B.
3.1.3 Building comparable scores
To build the comparable scores, we average the three sub-scores for each of the 20 topics andtake the average across these topics to construct scores for overall management, operationsmanagement, and people management.14 To build comparable metrics to the WMS, we re-cast the averages for each of the topics into the next lowest whole number. This is because
13For example, a headteacher that we visited in AP during the pilot showed us a great report card thatthey use to measure student achievement (Figure B1). When asked what they do with the report cards andthe information, they showed us a storage spot where all the data was kept safely but unfortunately also notused or even usable. This is similar to findings reported in Muralidharan and Sundararaman (2010).
14The questions and training are identical, and the information gathered that forms the basis of thescoring is consistent with WMS tools. The main contribution of the D-WMS is to enable a systematicallymore granular coding of the same information.
7
the WMS scoring guidelines are to score in a strictly increasing gradient, such that if aschool does not have processes that are good enough to reach a score of 3, then they wouldhave to be given a 2 (regardless of how close they would be to a 3). In the D-WMS grid,they would be awarded a 2.5. This means that it is simple to take each half point scoreand round down to the nearest integer and mimic the original WMS scoring methodology.For the cross-country comparisons in Figures 1 and A1 only, we use the WMS-comparablescore and normalize relative to the full global dataset. For the rest of the analysis in thispaper, we use the D-WMS scores and normalize relative to only the AP sample (since thosecomparisons are within the state).
Consistent with the broader literature based on WMS surveys, we present and analyzeboth the overall management score, and also the component scores on operations and peo-ple management. The operations-management score is based on the first 14 questions onthe D-WMS, and the people-management score is based on the last 6 questions (see Ta-bles B1 and B2 in Appendix B for the full list of 20 questions). Throughout this paper,we use the term “people management” to refer to the score obtained on the D-WMS sur-vey (consistent with the use of the term in the WMS literature), and the term “personnelmanagement” to refer to broader personnel related actions taken by school leaders.
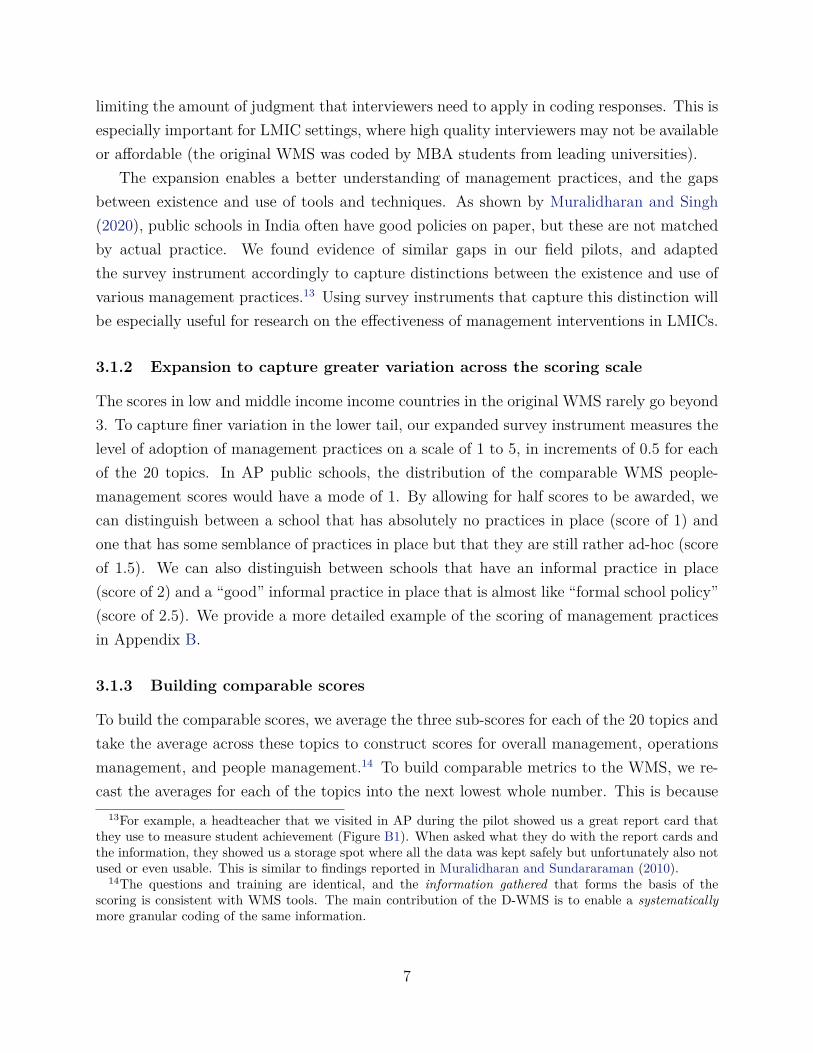
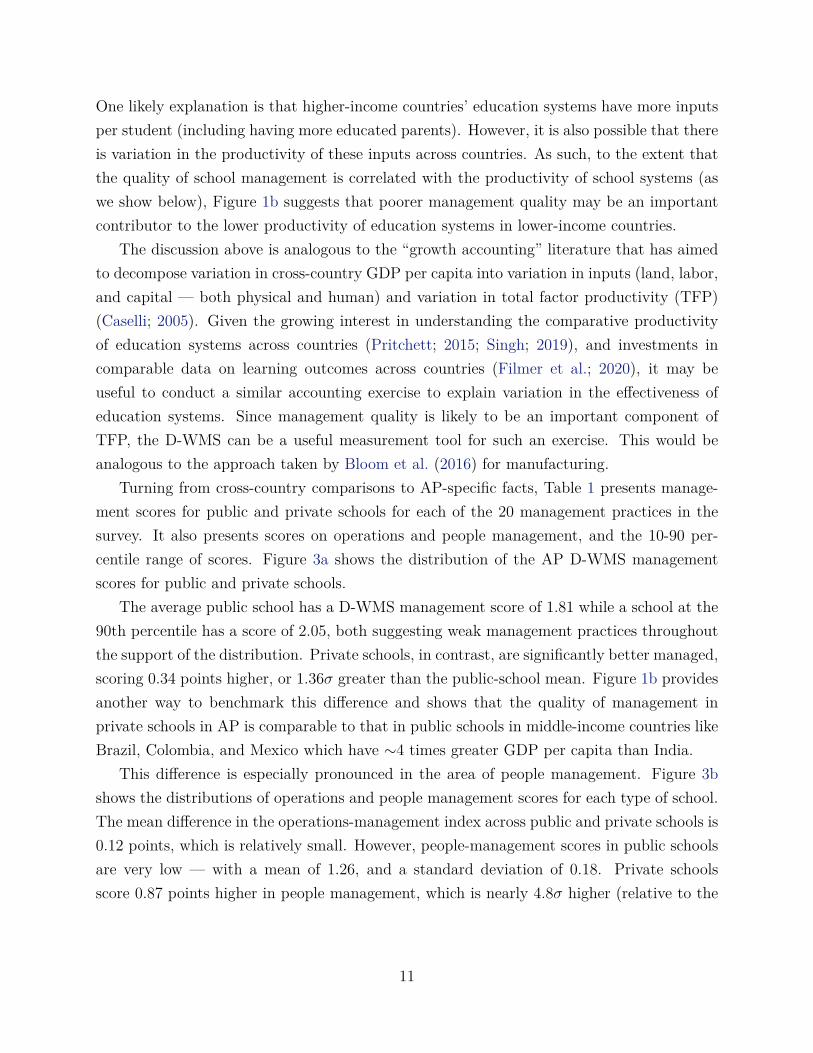
Figure 2 shows the difference between the D-WMS scores and the WMS-comparableversions of the scores. The D-WMS distribution captures a mechanical shift to the rightrelative to the WMS equivalent (due to the rounding down of scores under the WMS rubric).However, the D-WMS also captures meaningful new variation between scores of 1 and 2, and2 and 3 that change the shape of the distributions. This is seen most clearly in the distributionof people-management scores distribution in the public sector, where under WMS scoringguidelines, 80% of schools would have the lowest score of 1. In contrast, the D-WMS providesmuch more granular information with only 6% of schools having a score of exactly 1.15
We collected D-WMS data for a random sample of schools in the APSC project sam-ple from January to May 2013 through face-to-face interviews with school headteachers.Each interview lasted approximately 1.5 hours and was carried out by two enumerators —a primary interviewer and secondary note-taker — who reviewed their notes immediatelyafter the interview and scored the practices according to the scoring manual and grid. Theenumerators passed a one-week intensive D-WMS training session prior to field work.
15Note that the binning in the histogram in Figure 2 makes it appear that around 20% of schools havea score of 1 under the D-WMS as well. However, this bin includes values up to 1.1 and only 6% of schoolsscore at the actual lower bound of 1.
8
3.2 School, teacher and student data: the APSC dataset
The main school-teacher-student data from the APSC project is explained in Muralidharanand Sundararaman (2015) and spans the 4 school years of the project in AP (2008-09 to2011-12). We use several variables to build measures from this dataset: student value added,teacher value added, an index of teacher practices, teacher wages, and a measure of teacherselection and retention.
For student value added (SVA) and teacher value added (TVA), we use a panel of subject-specific test scores from tests administered by the APSC project team for Telugu (language)and Math, along with teacher assignments into these subjects. We estimate SVA by using theresiduals of a regression of the end of year test score on the previous year’s test score for eachstudent, and estimate TVA using the Chetty et al. (2014) method.16 This method yieldsa TVA estimate for each teacher and year, using information from all years and subjectstaught by each teacher.
We construct a teacher practices index using the set of questions in the teacher question-naires that related to classroom practices, along with audit data from classroom observationvisits. These were collected independent of the student tests and the D-WMS managementsurvey. We aggregated the sixteen items (fourteen self-reported practices and two audit-based measures of teacher presence and likelihood of being found teaching) into a singleindex using the Anderson (2008) method.17 A full description of each measure of teachingpractice is provided in Appendix B.4; we also present simple correlations of each teachingpractice with student value added in Figure B2.
Data on teacher wages are based on self-reports by teachers for all 4 years. Data onteacher turnover and retention is from the second year only. The APSC project collecteddata on the full roster of teachers, that tracked which teachers had moved out and whichones had transferred in, only in the first two years of the project. For each school, we identifythe highest and lowest value added teacher within the school using our measure of TVA andconstruct a measure of “good HR outcome” based on the transfer information between years1 and 2. The variable takes a value of 1 when the highest value added teacher is retainedin the school or transferred into the school, or the lowest value added teacher is transferredout of the school. It takes a value of zero otherwise.
The combined dataset of APSC-DWMS data includes 299 schools, 190 private and 109public schools. Note that we only measure management quality once in each school, at
16For a summary and discussion of this method, see Appendix B.3.17This methodology weights the impact of the included variables by the sum of their rows in the inverse
variance-covariance matrix, thereby assigning greater weight to questions that carry more “new information”.
9
the end of the study period, and assign this score to the school for all years of studentand teacher data.18 Our main analysis includes data for Telugu and Math tests for 15,305students; 12,661 from private schools and 2,665 from public schools. Overall, our samplehas 35,964 observations over four years in an unbalanced panel. There are a total of 1,171teachers in our sample; 864 in private schools and 307 in public schools.
4 Results
4.1 Management quality and global comparisons
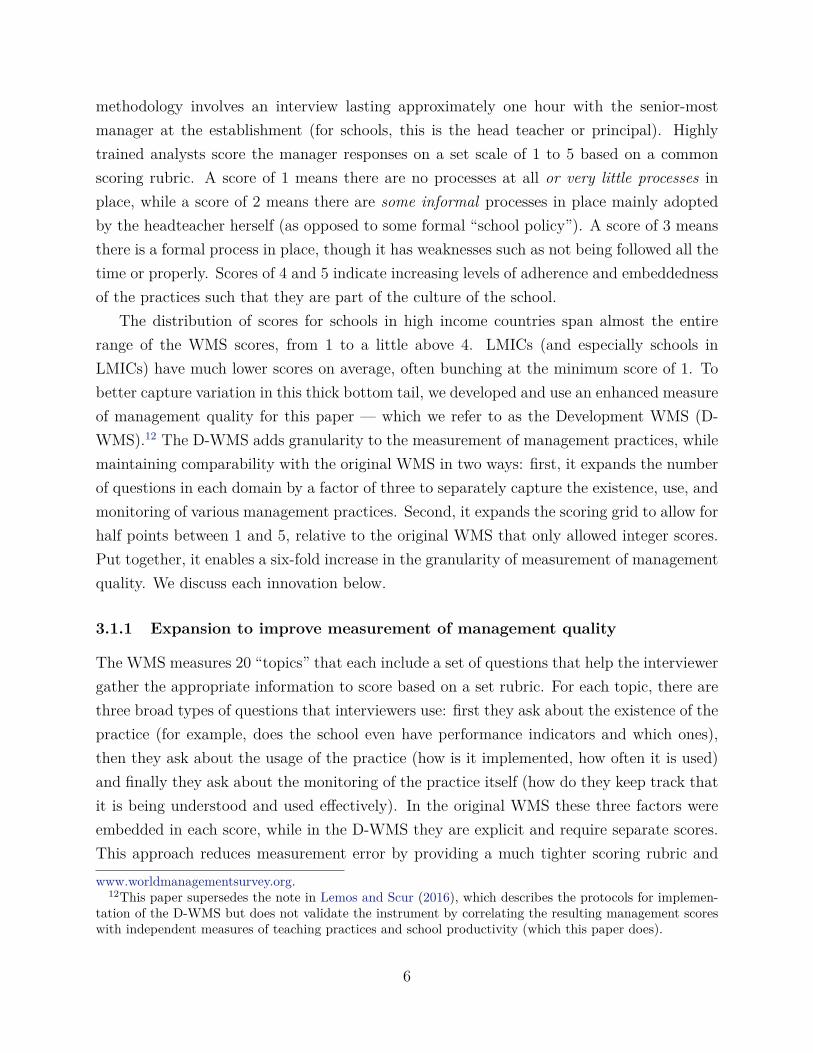
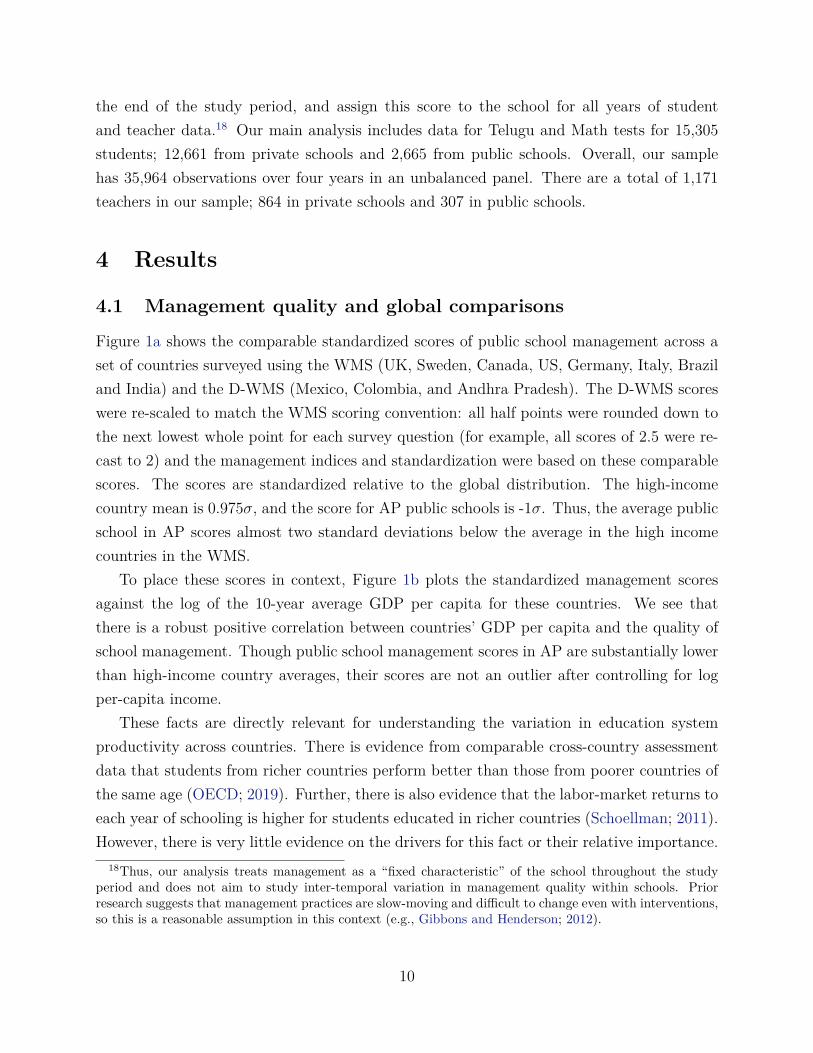
Figure 1a shows the comparable standardized scores of public school management across aset of countries surveyed using the WMS (UK, Sweden, Canada, US, Germany, Italy, Braziland India) and the D-WMS (Mexico, Colombia, and Andhra Pradesh). The D-WMS scoreswere re-scaled to match the WMS scoring convention: all half points were rounded down tothe next lowest whole point for each survey question (for example, all scores of 2.5 were re-cast to 2) and the management indices and standardization were based on these comparablescores. The scores are standardized relative to the global distribution. The high-incomecountry mean is 0.975σ, and the score for AP public schools is -1σ. Thus, the average publicschool in AP scores almost two standard deviations below the average in the high incomecountries in the WMS.
To place these scores in context, Figure 1b plots the standardized management scoresagainst the log of the 10-year average GDP per capita for these countries. We see thatthere is a robust positive correlation between countries’ GDP per capita and the quality ofschool management. Though public school management scores in AP are substantially lowerthan high-income country averages, their scores are not an outlier after controlling for logper-capita income.
These facts are directly relevant for understanding the variation in education systemproductivity across countries. There is evidence from comparable cross-country assessmentdata that students from richer countries perform better than those from poorer countries ofthe same age (OECD; 2019). Further, there is also evidence that the labor-market returns toeach year of schooling is higher for students educated in richer countries (Schoellman; 2011).However, there is very little evidence on the drivers for this fact or their relative importance.
18Thus, our analysis treats management as a “fixed characteristic” of the school throughout the studyperiod and does not aim to study inter-temporal variation in management quality within schools. Priorresearch suggests that management practices are slow-moving and difficult to change even with interventions,so this is a reasonable assumption in this context (e.g., Gibbons and Henderson; 2012).
10
One likely explanation is that higher-income countries’ education systems have more inputsper student (including having more educated parents). However, it is also possible that thereis variation in the productivity of these inputs across countries. As such, to the extent thatthe quality of school management is correlated with the productivity of school systems (aswe show below), Figure 1b suggests that poorer management quality may be an importantcontributor to the lower productivity of education systems in lower-income countries.
The discussion above is analogous to the “growth accounting” literature that has aimedto decompose variation in cross-country GDP per capita into variation in inputs (land, labor,and capital — both physical and human) and variation in total factor productivity (TFP)(Caselli; 2005). Given the growing interest in understanding the comparative productivityof education systems across countries (Pritchett; 2015; Singh; 2019), and investments incomparable data on learning outcomes across countries (Filmer et al.; 2020), it may beuseful to conduct a similar accounting exercise to explain variation in the effectiveness ofeducation systems. Since management quality is likely to be an important component ofTFP, the D-WMS can be a useful measurement tool for such an exercise. This would beanalogous to the approach taken by Bloom et al. (2016) for manufacturing.
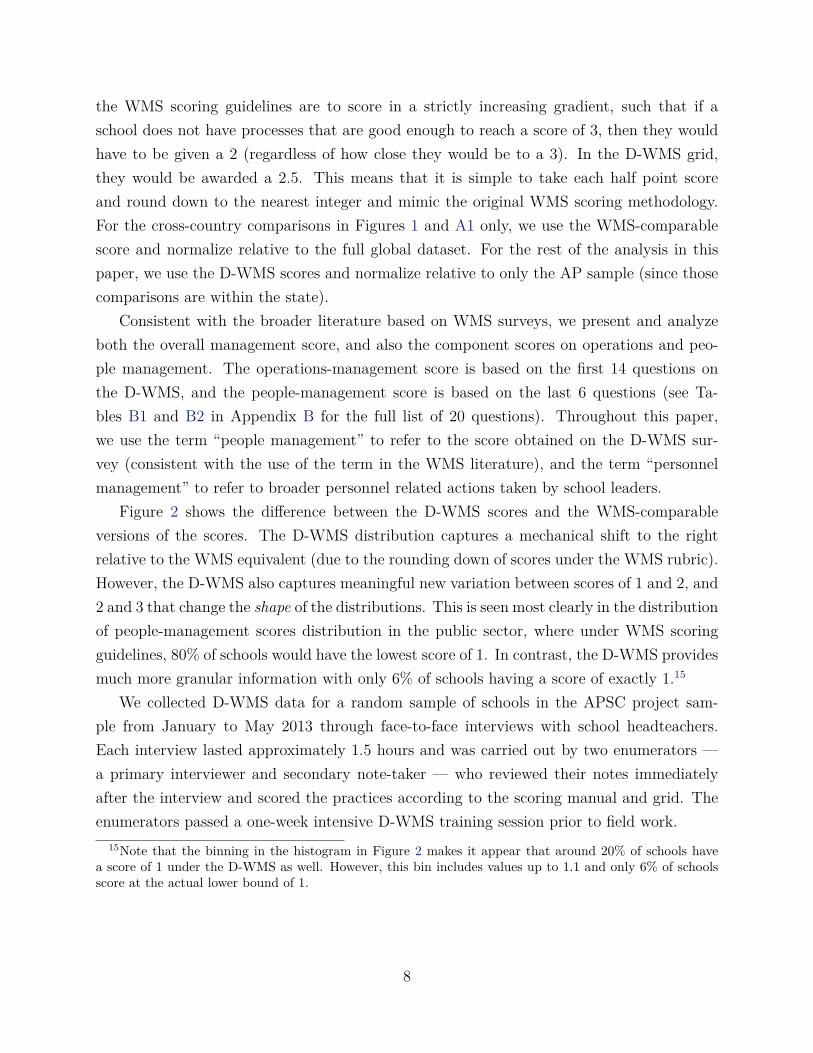
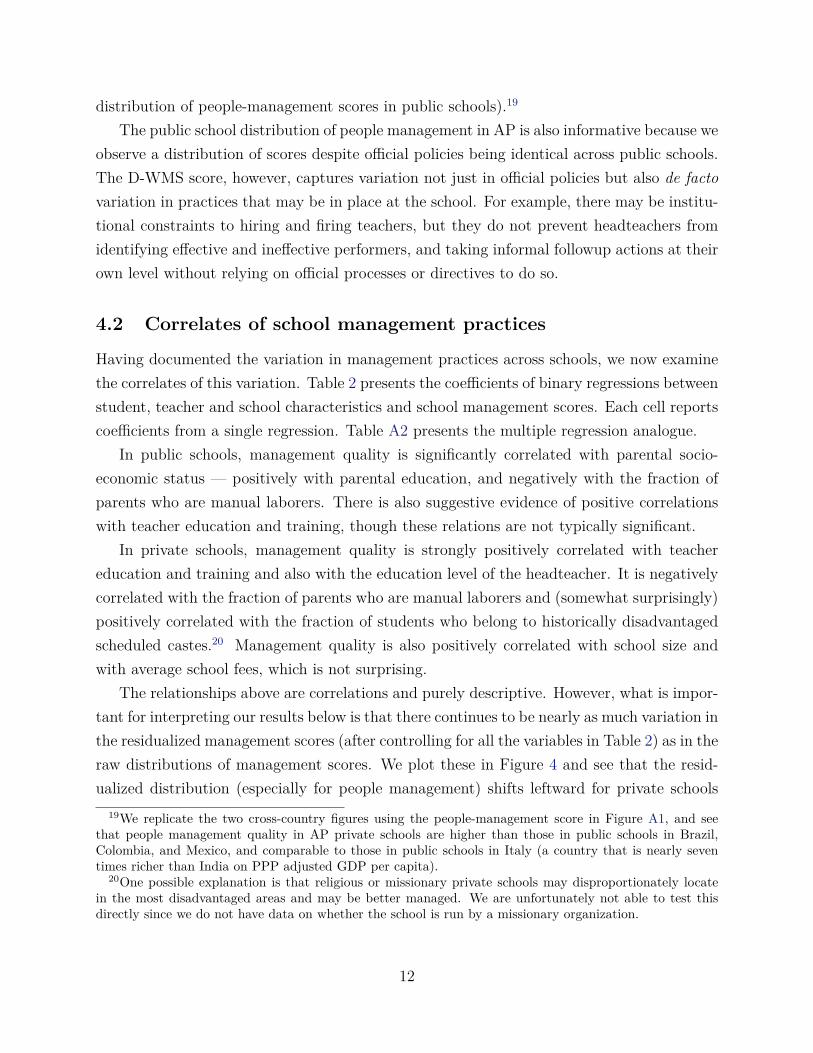
Turning from cross-country comparisons to AP-specific facts, Table 1 presents manage-ment scores for public and private schools for each of the 20 management practices in thesurvey. It also presents scores on operations and people management, and the 10-90 per-centile range of scores. Figure 3a shows the distribution of the AP D-WMS managementscores for public and private schools.
The average public school has a D-WMS management score of 1.81 while a school at the90th percentile has a score of 2.05, both suggesting weak management practices throughoutthe support of the distribution. Private schools, in contrast, are significantly better managed,scoring 0.34 points higher, or 1.36σ greater than the public-school mean. Figure 1b providesanother way to benchmark this difference and shows that the quality of management inprivate schools in AP is comparable to that in public schools in middle-income countries likeBrazil, Colombia, and Mexico which have ∼4 times greater GDP per capita than India.
This difference is especially pronounced in the area of people management. Figure 3bshows the distributions of operations and people management scores for each type of school.The mean difference in the operations-management index across public and private schools is0.12 points, which is relatively small. However, people-management scores in public schoolsare very low — with a mean of 1.26, and a standard deviation of 0.18. Private schoolsscore 0.87 points higher in people management, which is nearly 4.8σ higher (relative to the
11
distribution of people-management scores in public schools).19
The public school distribution of people management in AP is also informative because weobserve a distribution of scores despite official policies being identical across public schools.The D-WMS score, however, captures variation not just in official policies but also de factovariation in practices that may be in place at the school. For example, there may be institu-tional constraints to hiring and firing teachers, but they do not prevent headteachers fromidentifying effective and ineffective performers, and taking informal followup actions at theirown level without relying on official processes or directives to do so.
4.2 Correlates of school management practices
Having documented the variation in management practices across schools, we now examinethe correlates of this variation. Table 2 presents the coefficients of binary regressions betweenstudent, teacher and school characteristics and school management scores. Each cell reportscoefficients from a single regression. Table A2 presents the multiple regression analogue.
In public schools, management quality is significantly correlated with parental socio-economic status — positively with parental education, and negatively with the fraction ofparents who are manual laborers. There is also suggestive evidence of positive correlationswith teacher education and training, though these relations are not typically significant.
In private schools, management quality is strongly positively correlated with teachereducation and training and also with the education level of the headteacher. It is negativelycorrelated with the fraction of parents who are manual laborers and (somewhat surprisingly)positively correlated with the fraction of students who belong to historically disadvantagedscheduled castes.20 Management quality is also positively correlated with school size andwith average school fees, which is not surprising.
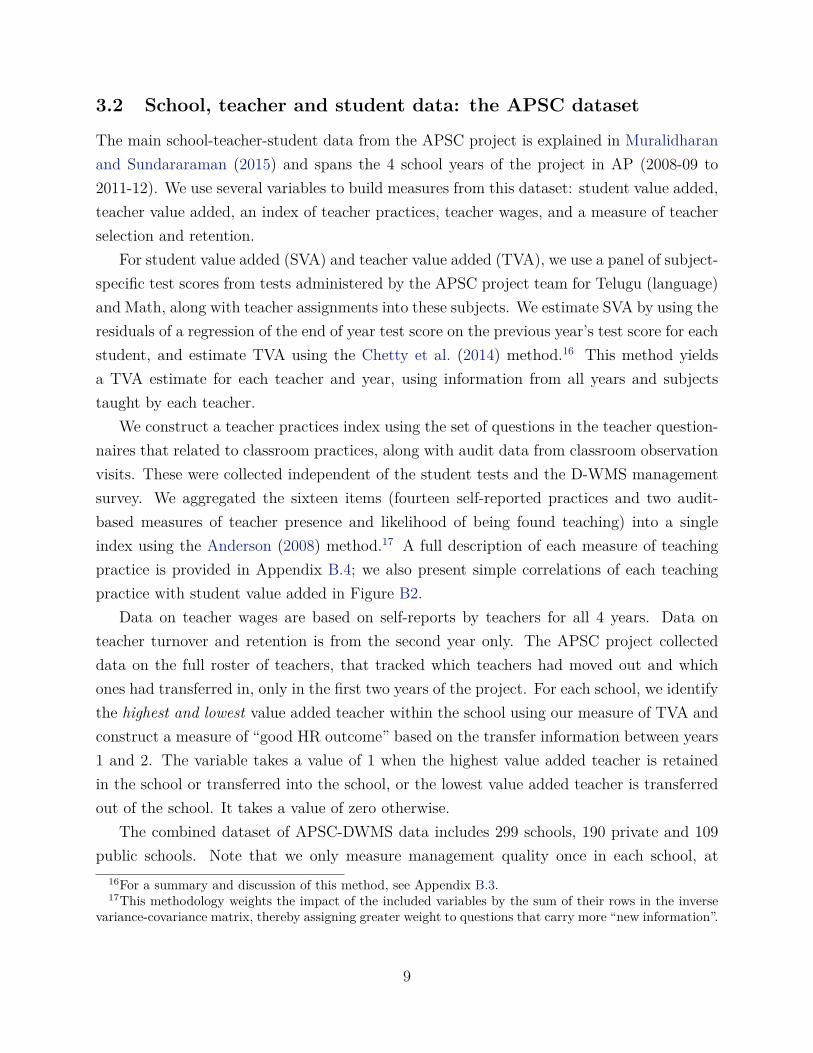
The relationships above are correlations and purely descriptive. However, what is impor-tant for interpreting our results below is that there continues to be nearly as much variation inthe residualized management scores (after controlling for all the variables in Table 2) as in theraw distributions of management scores. We plot these in Figure 4 and see that the resid-ualized distribution (especially for people management) shifts leftward for private schools
19We replicate the two cross-country figures using the people-management score in Figure A1, and seethat people management quality in AP private schools are higher than those in public schools in Brazil,Colombia, and Mexico, and comparable to those in public schools in Italy (a country that is nearly seventimes richer than India on PPP adjusted GDP per capita).
20One possible explanation is that religious or missionary private schools may disproportionately locatein the most disadvantaged areas and may be better managed. We are unfortunately not able to test thisdirectly since we do not have data on whether the school is run by a missionary organization.
12
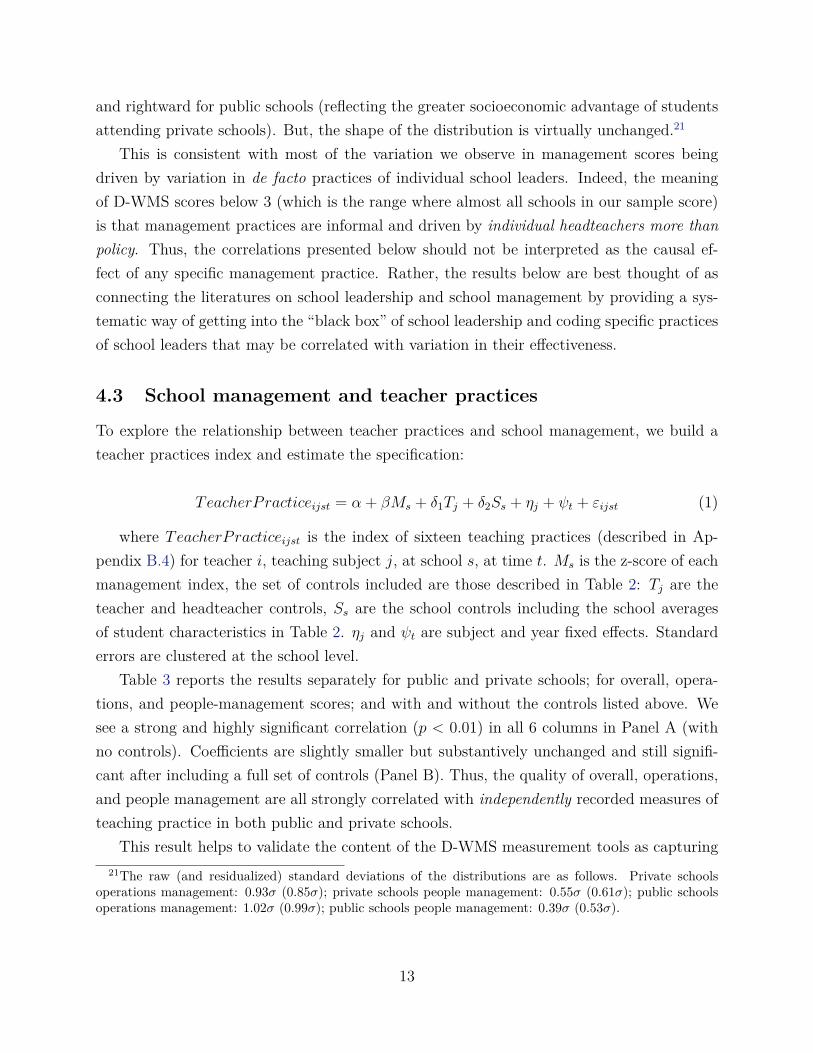
and rightward for public schools (reflecting the greater socioeconomic advantage of studentsattending private schools). But, the shape of the distribution is virtually unchanged.21
This is consistent with most of the variation we observe in management scores beingdriven by variation in de facto practices of individual school leaders. Indeed, the meaningof D-WMS scores below 3 (which is the range where almost all schools in our sample score)is that management practices are informal and driven by individual headteachers more thanpolicy. Thus, the correlations presented below should not be interpreted as the causal ef-fect of any specific management practice. Rather, the results below are best thought of asconnecting the literatures on school leadership and school management by providing a sys-tematic way of getting into the “black box” of school leadership and coding specific practicesof school leaders that may be correlated with variation in their effectiveness.
4.3 School management and teacher practices
To explore the relationship between teacher practices and school management, we build ateacher practices index and estimate the specification:
TeacherPracticeijst = α + βMs + δ1Tj + δ2Ss + ηj + ψt + εijst (1)
where TeacherPracticeijst is the index of sixteen teaching practices (described in Ap-pendix B.4) for teacher i, teaching subject j, at school s, at time t. Ms is the z-score of eachmanagement index, the set of controls included are those described in Table 2: Tj are theteacher and headteacher controls, Ss are the school controls including the school averagesof student characteristics in Table 2. ηj and ψt are subject and year fixed effects. Standarderrors are clustered at the school level.
Table 3 reports the results separately for public and private schools; for overall, opera-tions, and people-management scores; and with and without the controls listed above. Wesee a strong and highly significant correlation (p < 0.01) in all 6 columns in Panel A (withno controls). Coefficients are slightly smaller but substantively unchanged and still signifi-cant after including a full set of controls (Panel B). Thus, the quality of overall, operations,and people management are all strongly correlated with independently recorded measures ofteaching practice in both public and private schools.
This result helps to validate the content of the D-WMS measurement tools as capturing21The raw (and residualized) standard deviations of the distributions are as follows. Private schools
operations management: 0.93σ (0.85σ); private schools people management: 0.55σ (0.61σ); public schoolsoperations management: 1.02σ (0.99σ); public schools people management: 0.39σ (0.53σ).
13
elements of management quality that are able to meaningfully predict classroom teachingpractices. It is also a contribution to the management literature more broadly where it hastypically not been possible to observe (and correlate) both WMS-comparable managementscores and measures of employee behavior in their core tasks in the same data set.
4.4 School management and student value added
Next, we examine the correlations between management scores and school productivity,measured by student value added. We do so by running the following specification for publicand private schools, separately:
V alueAddedpjst = α + βMs + θ1Xp + θ2Tjs + θ3Ss + ηj + ψt + εpjst (2)
where V alueAddedpjst is the student value added for student p, subject j, at school s inyear t. Ms is the z-score of each management index. We estimate Equation 2 both with andwithout controls. The set of controls included are those described in Table 2: Xp are theindividual student controls, Tj are the teacher and headteacher controls, Ss are the schoolcontrols including the school averages of student characteristics in Table 2. ηj and ψt aresubject and year fixed effects. Standard errors are clustered at the school level.
We also estimate the relationship between management quality and student value addi-tion using a lagged test-score specification, where the outcome variable is test scores (TSpjst)in year t and we include lagged test scores on the right-hand side (TSpjs,t−1). We estimate:
TSpjst = α + βMs + θ0TSpjs,t−1 + θ1Xp + θ2Tjs + θ3Ss + ηj + ψt + εpjst (3)
Table 4 presents these results without controls (Panel A) and with the full set of controls(Panel B), and for public schools (columns 1-4) and private schools (columns 5-8). Table A4presents the results from the lagged test-score specification. Since the results are very similaracross both approaches, we present those from Equation 2 in the main tables, and Equation 3in the Appendix.22
Starting with public schools, we see a strong and significant correlation (p< 0.01) betweenall management practices (overall, operations, and people) and student value-added (SVA).However, variation in people management seems to matter much more (around 3 times more)for explaining variation in school effectiveness. We see this both by comparing columns 3 and
22We do not include a control for a student’s voucher-winning status in Equation 3 to keep the set ofcontrols consistent across public and private schools. Results are unchanged if we include this control.
14
2, and in column 4 when we include both component scores as regressors. The results arepractically unchanged when we include a full set of controls (Panel B): both magnitudes andsignificance of coefficients are very similar across Panels A and B. Results from the laggedtest-score specification are also very similar (Table A4).
While these results are based on correlations, they provide strong suggestive evidencethat better management practices — especially personnel management practices — are likelyto matter for school productivity. The value-added specification mitigates several omittedvariable concerns, and the robustness to inclusion of a wide variety of controls providesadditional reassurance on this front. Further, since official policies are identical across allpublic schools, the variation in management practices reflect de facto practices that areimplemented at the school level. Thus, the appropriate way to interpret our results is notas the causal impact of specific practices, but as getting into the “black box” of variation inschool leaders’ effectiveness by codifying their practices and identifying common patterns inthe practices of effective school leaders. In particular, school leaders who implement betterpersonnel management practices appear to be able to deliver greater value addition.
Turning to private schools (Table 4: columns 5-8), we see that the correlations are smallerand not significant between SVA and either overall or operations management scores. People-management scores are significantly correlated with SVA even in private schools (in bothcolumns 7 and 8), but the magnitude is much smaller than in the case of public schools.Results are very similar both without and with controls, and in the lagged test-score speci-fication (Table A4).
These results provide consistent evidence that the quality of personnel management seemsto matter for productivity both across public and private schools. However, one reason thatthe variation in personnel management quality may matter more in explaining variation inpublic school productivity is that the average level of personnel management is higher inprivate schools to begin with. Thus, given the very low base levels of personnel managementin public schools, the marginal returns to even modest improvements may be high. Thesame reasoning may explain why overall and operations management scores are significantlycorrelated with SVA in public schools but not in private schools.
Next, we examine the extent to which variation in student value added across public andprivate schools is correlated with management quality. We do so by pooling the student datafrom public and private schools and estimating the following equation:
V alueAddedpjst = α+ βMs + λ1PRIs + λ2SCOp + θ1Xp + θ2Tjs + θ3Ss + ηj +ψt + εpjst (4)
15
where V alueAddedpjst is the student value added for student p, subject j, at school s inyear t. Ms is the z-score of each management index. PRIs is a private school indicator, andSCOs is an indicator for whether a student was a scholarship recipient in the Muralidharanand Sundararaman (2015) AP School Choice Experiment. The set of controls included arethose described in Table 2: Xp are the student controls, Tj are the teacher and headteachercontrols, Ss are the school controls including the school averages of student characteristics.ηj and ψt are subject and year fixed effects. Standard errors are clustered at the school level.We also estimate these relationships using the lagged test-score specification below:
TSpjst = α+βMs +λ0TSpjs,t−1 +λ1PRIs +λ2SCOp +θ1Xp +θ2Tjs +θ3Ss +ηj +ψt +εpjst (5)
Results from Equation 4 are reported in Table 5. Without any controls (Panel A), wesee that the average private school appears to have an annual value added of 0.35σ higher(column 1). This is not a causal estimate. Our goal is simply to provide an accountingdecomposition of the extent to which this private school “premium” can be accounted for bystronger management practices.23 We see that including overall or operations managementscores reduce the private school premium slightly but do not meaningfully change the results(columns 2-3). However, including a control for people-management scores sharply reducesthe private school premium and renders it insignificant (columns 4-5).
Patterns of results are similar with controls (Panel B). The private school premium islarger with controls, likely reflecting the lower average teacher education, experience, andtraining in the private schools (Table A1). Thus, the pure private school productivity pre-mium may be even larger after accounting for their lower input quality. As in Panel A,including people-management scores significantly reduces the estimated private school pre-mium: the magnitude falls by more than half (columns 4-5). Taken together, the significantlygreater quality of personnel management appears to be a key driver of the private schoolpremium in this setting. We see the same results from estimating the lagged test-scorespecification in Equation 5 (Table A5).
23The significant negative coefficient on the “scholarship” variable suggests that the average voucher-winning student in the APSC study did not benefit from this private school “premium”, which is consistentwith the experimental evaluation of the voucher program that found modest to no test-score gains fromwinning a voucher to attend a private school (Muralidharan and Sundararaman; 2015). Readers are referredto that paper for a discussion of potential reasons for this result.
16
4.5 Personnel management across public and private schools
We now examine a direct measure of effective personnel management in schools — whichis the extent to which teachers are rewarded for being more productive, measured by theirvalue added. We examine this question on both the intensive margin of wages, and theextensive margin of hiring and retention. We study the relationship between teacher payand productivity using the following specification:
LnWagesjs = α+ β1Ms + β2PRIs + β3TV Ajs + β4PRIs × TV Ajs + θ1Tjs + θ2Ss + εjs (6)
where LnWagesis is the average log of wages of teacher j in school s over all years theteacher taught at each school. PRIs is an indicator for private school. TV Ais is the teachervalue added measure (estimated as in Chetty et al. (2014)), averaged across the years theteacher taught at the school. The TVA measure is normalized to have a mean of zero andstandard deviation of 1. Tj are the teacher and headteacher controls, Ss are the schoolcontrols including the school averages of student characteristics from Table 2. Standarderrors are clustered at the school level.
Results are presented in Table 6. Panel A reports the raw correlations without controls,and Panel B includes all controls listed above. Columns (1) to (3) include only public schoolteachers and Columns (4) to (6) include only private school teachers. Column (7) includesthe full sample of teachers across public and private schools.
We find no correlation between pay and productivity in public schools, with or withoutcontrols, reflecting a rigid compensation schedule that is mainly based on qualifications andseniority.24 If anything, pay and productivity appear (insignificantly) negatively correlatedin public schools. This is consistent with other studies finding evidence of lower effortamong older and more senior teachers (who are paid more).25 Unsurprisingly, there is alsono correlation between management quality and teacher pay in the public sector given thatheadteachers have no authority over teacher pay.
In contrast, teacher pay in private schools is strongly positively correlated with TVA.Without any controls, a teacher who is able to improve average student test scores by oneadditional standard deviation earns about 42% higher wages (Panel A, Column 4)). Thisrelationship is positive and significant even after including all controls listed in Table 2, and
24This is also consistent with evidence from the health sector where Das et al. (2016) show that there isno correlation between doctor pay and quality of care provided in public clinics in India.
25For instance, Kremer et al. (2005) find that older and more senior teachers in public schools in India aresignificantly more likely to be absent, and are also likely to be paid more.
17
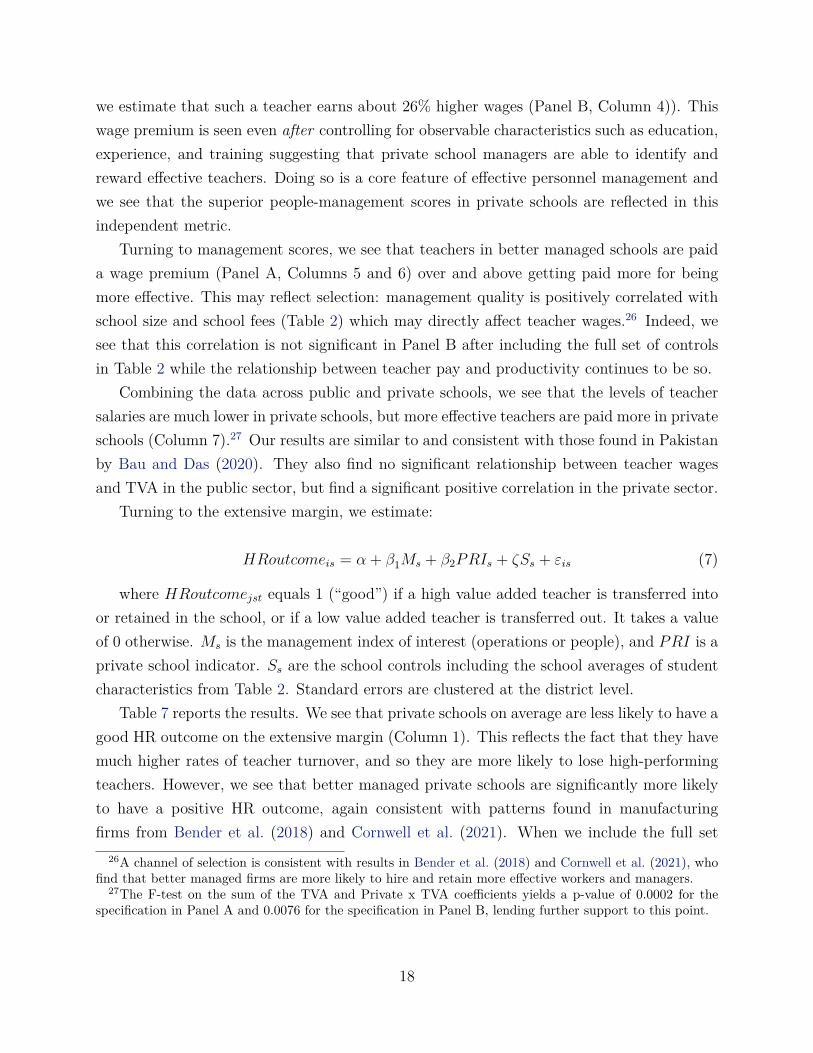
we estimate that such a teacher earns about 26% higher wages (Panel B, Column 4)). Thiswage premium is seen even after controlling for observable characteristics such as education,experience, and training suggesting that private school managers are able to identify andreward effective teachers. Doing so is a core feature of effective personnel management andwe see that the superior people-management scores in private schools are reflected in thisindependent metric.
Turning to management scores, we see that teachers in better managed schools are paida wage premium (Panel A, Columns 5 and 6) over and above getting paid more for beingmore effective. This may reflect selection: management quality is positively correlated withschool size and school fees (Table 2) which may directly affect teacher wages.26 Indeed, wesee that this correlation is not significant in Panel B after including the full set of controlsin Table 2 while the relationship between teacher pay and productivity continues to be so.
Combining the data across public and private schools, we see that the levels of teachersalaries are much lower in private schools, but more effective teachers are paid more in privateschools (Column 7).27 Our results are similar to and consistent with those found in Pakistanby Bau and Das (2020). They also find no significant relationship between teacher wagesand TVA in the public sector, but find a significant positive correlation in the private sector.
Turning to the extensive margin, we estimate:
HRoutcomeis = α + β1Ms + β2PRIs + ζSs + εis (7)
where HRoutcomejst equals 1 (“good”) if a high value added teacher is transferred intoor retained in the school, or if a low value added teacher is transferred out. It takes a valueof 0 otherwise. Ms is the management index of interest (operations or people), and PRI is aprivate school indicator. Ss are the school controls including the school averages of studentcharacteristics from Table 2. Standard errors are clustered at the district level.
Table 7 reports the results. We see that private schools on average are less likely to have agood HR outcome on the extensive margin (Column 1). This reflects the fact that they havemuch higher rates of teacher turnover, and so they are more likely to lose high-performingteachers. However, we see that better managed private schools are significantly more likelyto have a positive HR outcome, again consistent with patterns found in manufacturingfirms from Bender et al. (2018) and Cornwell et al. (2021). When we include the full set
26A channel of selection is consistent with results in Bender et al. (2018) and Cornwell et al. (2021), whofind that better managed firms are more likely to hire and retain more effective workers and managers.
27The F-test on the sum of the TVA and Private x TVA coefficients yields a p-value of 0.0002 for thespecification in Panel A and 0.0076 for the specification in Panel B, lending further support to this point.
18
of controls, only the people-management score is significant, consistent with the outcomevariable being more relevant to personnel management. There is no meaningful correlationbetween management quality and teacher selection or retention in public schools.
Note that detailed teacher roster data (including on transfers and new entrants) wascollected only in the first 2 years of the APSC project and so our HR outcomes are definedusing only the second-year teacher roster. This limits the sample size and the results aboveshould therefore be treated only as suggestive. We present them for completeness since weare not aware of any prior evidence on this question. Testing for this result in larger samplesand over longer time periods is an important area for future research.
5 Discussion and Conclusion
There is a growing recognition that the quality of management practices may be an importantdeterminant of productivity differences across firms and countries (Syverson; 2011; Bloomet al.; 2014, 2016; Scur et al.; 2021). In this paper, we measure management quality of publicand private schools in a low-capacity setting; plot these against global benchmarks (with andwithout income adjustments); study the correlations between management quality and bothteacher practices and school productivity; and examine correlations between teacher payand productivity across public and private schools. We do so by developing and deploying anew measurement tool (the D-WMS) that permits both greater granularity of measurementof management practices in low capacity settings and comparability with the widely usedWMS surveys; and by combining this D-WMS data with panel data on student test scoresacross public and private schools and a rich dataset of school and teacher characteristics.
Our results strongly suggest that management quality — and especially the quality ofpersonnel management — is likely to be an important component of school productivity.Better managed schools also have better teaching practices, and add more value to studentlearning. Extrapolating from this micro-evidence using school-level variation, the plots ofmanagement scores across countries suggest that cross-country differences in school manage-ment quality may play a role in explaining the documented differences in school productivityacross countries (Schoellman; 2011; Singh; 2019).
More generally, our results contribute to a better understanding of public sector per-sonnel economics and to the comparative study of management and productivity across thepublic and private sectors. In particular, our data highlight that the quality of personnelmanagement in the public sector is especially poor and we directly show the lack of correla-
19
tion between pay and productivity for public sector workers.28 In contrast, private schoolshave much higher personnel management scores and pay more effective teachers more (evenafter controlling for several observable characteristics). Our results suggest that even modestimprovements in public school management practices at the level of school leaders may behighly effective at improving teacher effort and effectiveness.
Consistent with this view, there is considerable interest among donors, policy makers,and private organizations (both for and non profit) in designing and implementing programsto improve school management in LMICs. The belief that such interventions can be effectiveis also supported by evidence of success in the US (Fryer; 2014, 2017).
At the same time, recent evidence suggests that improving management quality in publicschools at scale in LMICs is not easy. For instance, a large-scale randomized evaluation of aflagship school quality improvement program in India found that it had no impact on eitherteaching practices or learning outcomes, despite the program design reflecting several global“best practices” (Muralidharan and Singh; 2020). Thus, much more research is needed tolearn about effective and cost-effective ways of improving school management at scale. TheD-WMS measurement tools developed for this paper can be a useful complement to suchefforts by enabling researchers to use a common and comparable scale across studies to (a)measure baseline levels of management, (b) measure improvements in management practicefrom various interventions, and (c) to experimentally study the relationship between changesin school management practices and changes in teaching practices and student outcomes.29
28These findings are consistent with a growing body of experimental evidence from developing countriesthat find that the default patterns of common across-the-board pay increases in public schools may not beeffective (de Ree et al.; 2017), and that even modest amounts of performance-linked pay in public schoolscan be highly effective (Leaver et al.; 2021; Muralidharan and Sundararaman; 2011).
29In their evaluation of an ambitious school management reform in India, Muralidharan and Singh (2020)find that the program led to changes on paper but not in practice. Thus, the additional granularity of theD-WMS — that distinguishes between the existence, use, and monitoring/follow-up of various managementpractices — may be especially relevant for studying future school management interventions in LMICs.
20
References
Anderson, M. L. (2008). Multiple inference and gender differences in the effects of early in-tervention: A reevaluation of the abecedarian, perry preschool, and early training projects,Journal of the American Statistical Association 103(484): 1481–1495.
Andrabi, T., Das, J. and Khwaja, A. I. (2008). A dime a day: The possibilities and limitsof private schooling in pakistan, Comparative Education Review 52(3): 329–355.
Bau, N. and Das, J. (2020). Teacher value added in a low-income country, American Eco-nomic Journal: Economic Policy 12(1): 62–96.
Bender, S., Bloom, N., Card, D., Van Reenen, J. and Wolter, S. (2018). Managementpractices, workforce selection, and productivity, Journal of Labor Economics 36(S1): S371–S409.
Béteille, T. (2009). Absenteeism, transfers and patronage: The political economy of teacherlabor markets in India, PhD thesis.
Bloom, N., Lemos, R., Sadun, R., Scur, D. and Van Reenen, J. (2014). The new empiricaleconomics of management, Journal of the European Economics Association 12(4): 835–876.
Bloom, N., Lemos, R., Sadun, R. and Van Reenen, J. (2015). Does management matter inschools?, The Economic Journal 125: 647–674.
Bloom, N., Sadun, R. and Van Reenen, J. (2016). Management as a technology?, WorkingPaper 22327, National Bureau of Economic Research.
Bloom, N. and Van Reenen, J. (2007). Measuring and explaining management practicesacross firms and countries, Quarterly Journal of Economics 123(4): 1351–1408.
Caselli, F. (2005). Accounting for Cross-Country Income Differences, in P. Aghion andS. Durlauf (eds), Handbook of Economic Growth, Vol. 1 of Handbook of Economic Growth,Elsevier, chapter 9, pp. 679–741.
Chetty, R., Friedman, J. and Rockoff, J. (2014). Measuring the impact of teachers I: evaluat-ing bias in teacher value-added estimates, American Economic Review 104(9): 2593–2632.
Coelli, M. and Green, D. (2012). Leadership effects: School principals and student outcomes,Economics of Education Review 31(1): 92 – 109.
21
Cornwell, C., Schmutte, I. and Scur, D. (2021). Building a productive workforce: the role ofstructured management practices, Management Science forthcoming.
CSF (2020). State of the sector report: Private schools in india, Technical report, CentralSquare Foundation.
Das, J., Holla, A., Mohpal, A. and Muralidharan, K. (2016). Quality and accountability inhealth care delivery: Audit-study evidence from primary care in india, American EconomicReview 106(12): 3765–99.
de Ree, J., Muralidharan, K., Pradhan, M. and Rogers, H. (2017). Double for Nothing?Experimental Evidence on an Unconditional Teacher Salary Increase in Indonesia, TheQuarterly Journal of Economics 133(2): 993–1039.
Duflo, E., Hanna, R. and Ryan, S. P. (2012). Incentives work: Getting teachers to come toschool, American Economic Review 102(4): 1241–78.URL: https://www.aeaweb.org/articles?id=10.1257/aer.102.4.1241
Filmer, D., Rogers, H., Angrist, N. and Sabarwal, S. (2020). Learning-adjusted years ofschooling (LAYS): Defining a new macro measure of education, Economics of EducationReview 77: 101971.
Finan, F., Olken, B. A. and Pande, R. (2015). The Personnel Economics of the State, NBERWorking Papers 21825, National Bureau of Economic Research.
Fryer, R. G. (2014). Injecting charter school best practices into traditional public schools:evidence from field experiments, Quarterly Journal of Economics 129(3): 1355–407.
Fryer, R. G. (2017). Management and student achievement: Evidence from a randomizedfield experiment, Working Paper 23437, National Bureau of Economic Research.
Gibbons, R. and Henderson, R. (2012). Relational contracts and organizational capabilities,Organization Science 23(5): 1350–1364.
Glewwe, P. and Muralidharan, K. (2016). Chapter 10 - improving education outcomesin developing countries: Evidence, knowledge gaps, and policy implications, Vol. 5 ofHandbook of the Economics of Education, Elsevier, pp. 653 – 743.
Gordon, R., Kane, T. and Staiger, D. (2006). Identifying effective teachers using performanceon the job, The Hamilton Project White Paper 2006-1, Brookings Institution.
22
Guarino, C., Reckase, M. D. and Wooldridge, J. M. (2014). Can value-added measures ofteacher performance be trusted?, Education Finance and Policy .
Kane, T. and Staiger, D. (2008). Estimating teacher impacts on student achievement: Anexperimental evaluation, Working Paper series 14607, National Bureau of Economic Re-search.
Kane, T., Staiger, D. and Bacher-Hicks, A. (2014). Validating teacher effect estimates usingchanges in teacher assignments in los angeles, NBER Working Paper series 20657, NationalBureau of Economic Research.
Kremer, M., Chaudhury, N., Hammer, J., Muralidharan, K. and Rogers, H. (2005). Teacherabsence in india: A snapshot, Journal of the European Economic Association 3(2-3): 658–67.
Lavy, V. and Boiko, A. (2017). Management quality in public education: Superintendentvalue-added, student outcomes and mechanisms, NBER Working Papers 24028, NationalBureau of Economic Research.
Lazear, E. (1995). Personnel Economics, Vol. 1, 1 edn, The MIT Press.
Leaver, C., Ozier, O., Serneels, P. and Zeitlin, A. (2021). Recruitment, effort, and retentioneffects of performance contracts for civil servants: Experimental evidence from rwandanprimary schools, American Economic Review forthcoming.
Lemos, R. and Scur, D. (2016). Developing management: An expanded evaluation tool fordeveloping countries, Technical Report 007, RISE Working Paper Series.
Munoz, P. and Prem, M. (2020). Managers’ Productivity and Labor Market: Evidence fromSchool Principals, Working papers 40, Red Investigadores de Economia.
Muralidharan, K. and Kremer, M. (2008). School Choice International, MIT Press, Cam-bridge, MA, chapter title: Public and private schools in rural india.
Muralidharan, K. and Singh, A. (2020). Improving Public Sector Management at Scale? Ex-perimental Evidence on School Governance India, NBER Working Papers 28129, NationalBureau of Economic Research, Inc.
Muralidharan, K. and Sundararaman, V. (2010). The impact of diagnostic feedback toteachers on student learning: experimental evidence from India, The Economic Journal120(546): F187–F203.
23
Muralidharan, K. and Sundararaman, V. (2011). Teacher performance pay: Experimentalevidence from India, Journal of Political Economy 119(1): 39–77.
Muralidharan, K. and Sundararaman, V. (2015). The aggregate effects of school choice:evidence from a two-stage experiment in India, The Quarterly Journal of Economics130(3): 1011–1066.
OECD (2019). PISA 2018 Results (Volume I).URL: https://www.oecd-ilibrary.org/content/publication/5f07c754-en
Pritchett, L. (2015). Creating education systems coherent for learning outcomes, WorkingPaper Series 15/005, Research on Improving Systems of Education.
Rainey, H. G. and Chun, Y. H. (2007). Public and private management compared, inE. Ferlie, L. E. L. Jr. and C. Pollitt (eds), The Oxford Handbook of Public Management,The Oxford Handbook of Public Management, Oxford University Press.
Ramachandran, V., Beteille, T., Linden, T., Dey, S., Goyal, S. and Chatterjee, P. G. (2016).Teachers in the indian education system: How we manage the teacher work force in in-dia, NUEPA Research Reports Publications Series NRRPS/001/2016, National UniversityofEducational Planning and Administration.
Rockoff, J. (2004). The impact of individual teachers on student achievement: Evidencefrom panel data, American Economic Review: Papers and Proceedings 94: 247–252.
Romero, M., Sandefur, J. and Sandholtz, W. A. (2020). Outsourcing education: Experimen-tal evidence from liberia, American Economic Review 110(2): 364–400.
Schoellman, T. (2011). Education Quality and Development Accounting, The Review ofEconomic Studies 79(1): 388–417.
Scur, D., Sadun, R., Van Reenen, J., Lemos, R. and Bloom, N. (2021). The World Man-agement Survey at 18: lessons and the way forward, Oxford Review of Economic Policy37(2): 231–258.
Singh, A. (2015). Private school effects in urban and rural india: Panel estimates at primaryand secondary school ages, Journal of Development Economics 113: 16–32.
Singh, A. (2019). Learning More with Every Year: School Year Productivity and Interna-tional Learning Divergence, Journal of the European Economic Association 18(4): 1770–1813.
24
Syverson, C. (2011). What determines productivity?, Journal of Economic Literature49(2): 326–365.
Tooley, J. (2009). The Beautiful Tree: A Personal Journey into How the World’s PoorestPeople are Educating Themselves, Penguin, New Delhi.
Vennam, U., Komanduri, A. and Duggani, U. (2014). Changing schools in andhra pradesh,Working Paper 131, Young Lives.
Walsh, E. and Dotter, D. (2020). The impact on student achievement of replacing principalsin district of columbia public schools, Education Finance and Policy 15(3): 518–542.
Woldehanna, T., Galab, S., Sanchez, A., Penny, M., Duc, L. T. and Boyden, J. (2018).Young lives: an international study of childhood poverty.
World Bank (2018). World Development Report 2018: Learning to realize education’spromise, The World Bank, Washington DC.
25
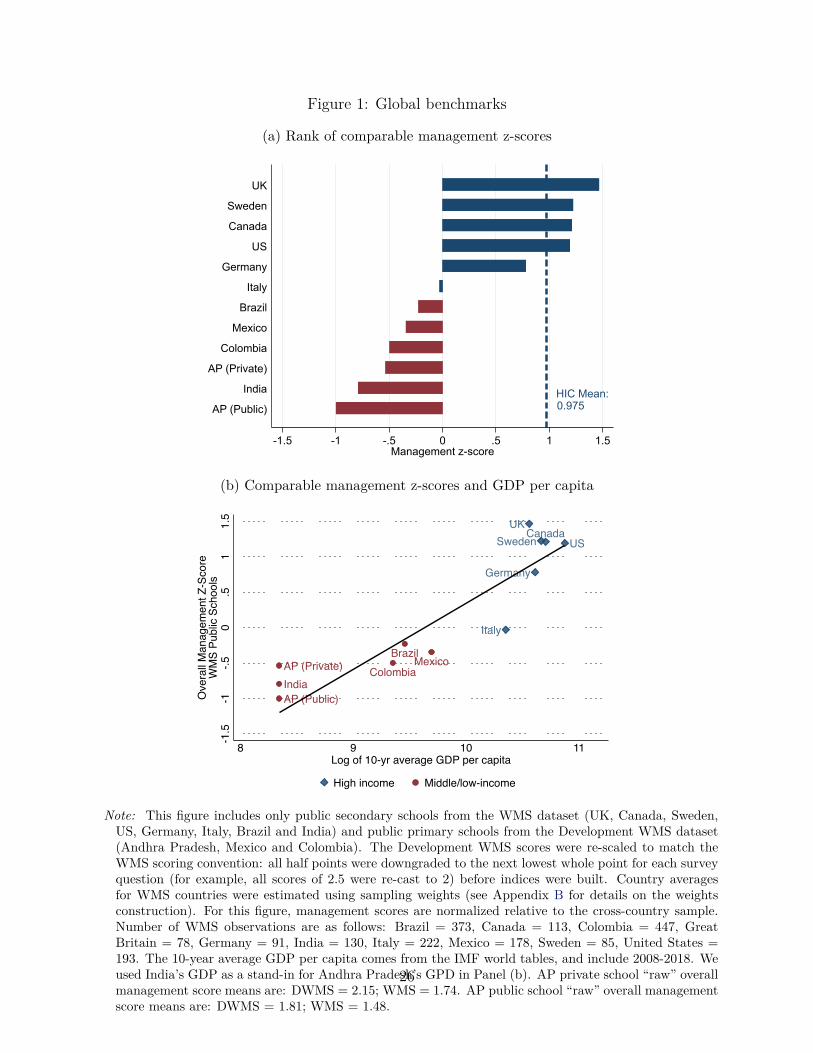
Figure 1: Global benchmarks
(a) Rank of comparable management z-scores
HIC Mean: 0.975
-1.5 -1 -.5 0 .5 1 1.5Management z-score
AP (Public)
India
AP (Private)
Colombia
Mexico
Brazil
Italy
Germany
US
Canada
Sweden
UK
(b) Comparable management z-scores and GDP per capita
Germany
Italy
SwedenUK
CanadaUS
BrazilColombia
Mexico
AP (Public)
AP (Private)India
-1.5
-1-.5
0.5
11.
5
Ove
rall M
anag
emen
t Z-S
core
WM
S Pu
blic
Scho
ols
8 9 10 11Log of 10-yr average GDP per capita
High income Middle/low-income
Note: This figure includes only public secondary schools from the WMS dataset (UK, Canada, Sweden,US, Germany, Italy, Brazil and India) and public primary schools from the Development WMS dataset(Andhra Pradesh, Mexico and Colombia). The Development WMS scores were re-scaled to match theWMS scoring convention: all half points were downgraded to the next lowest whole point for each surveyquestion (for example, all scores of 2.5 were re-cast to 2) before indices were built. Country averagesfor WMS countries were estimated using sampling weights (see Appendix B for details on the weightsconstruction). For this figure, management scores are normalized relative to the cross-country sample.Number of WMS observations are as follows: Brazil = 373, Canada = 113, Colombia = 447, GreatBritain = 78, Germany = 91, India = 130, Italy = 222, Mexico = 178, Sweden = 85, United States =193. The 10-year average GDP per capita comes from the IMF world tables, and include 2008-2018. Weused India’s GDP as a stand-in for Andhra Pradesh’s GPD in Panel (b). AP private school “raw” overallmanagement score means are: DWMS = 2.15; WMS = 1.74. AP public school “raw” overall managementscore means are: DWMS = 1.81; WMS = 1.48.
26
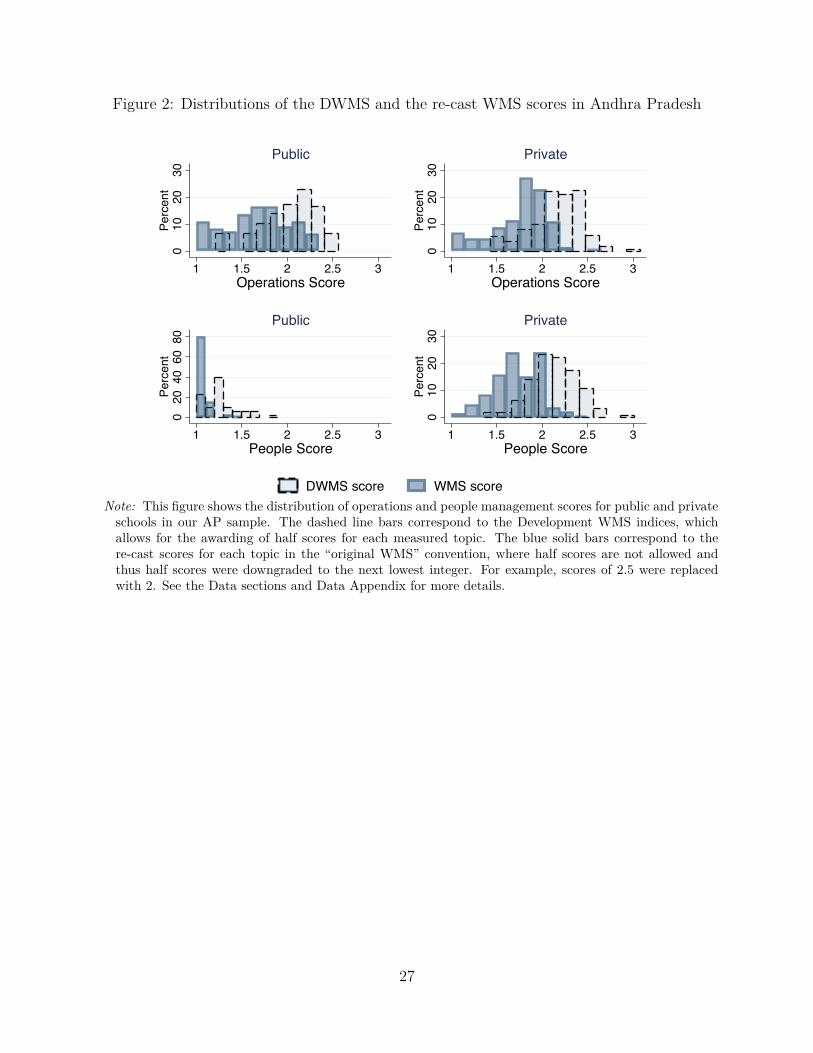
Figure 2: Distributions of the DWMS and the re-cast WMS scores in Andhra Pradesh
010
2030
Perc
ent
1 1.5 2 2.5 3Operations Score
Public
010
2030
Perc
ent
1 1.5 2 2.5 3Operations Score
Private0
2040
6080
Perc
ent
1 1.5 2 2.5 3People Score
Public
010
2030
Perc
ent
1 1.5 2 2.5 3People Score
Private
DWMS score WMS scoreNote: This figure shows the distribution of operations and people management scores for public and privateschools in our AP sample. The dashed line bars correspond to the Development WMS indices, whichallows for the awarding of half scores for each measured topic. The blue solid bars correspond to there-cast scores for each topic in the “original WMS” convention, where half scores are not allowed andthus half scores were downgraded to the next lowest integer. For example, scores of 2.5 were replacedwith 2. See the Data sections and Data Appendix for more details.
27
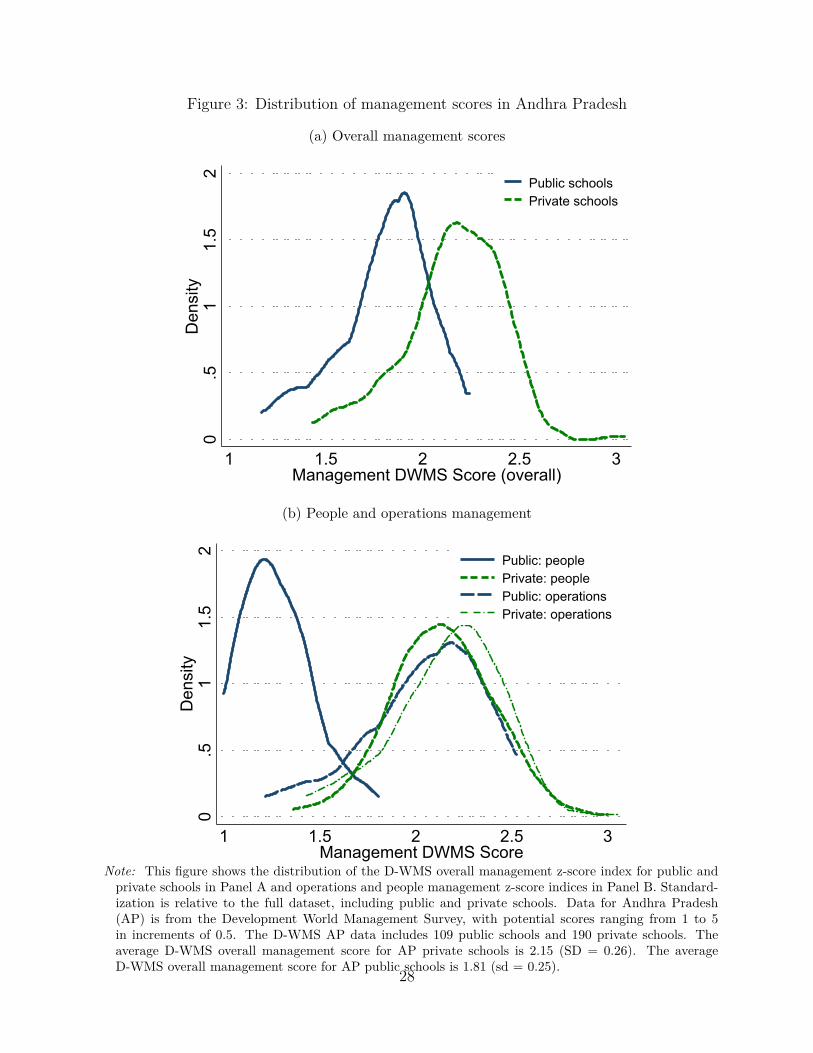
Figure 3: Distribution of management scores in Andhra Pradesh
(a) Overall management scores
0.5
11.
52
Den
sity
1 1.5 2 2.5 3Management DWMS Score (overall)
Public schoolsPrivate schools
(b) People and operations management
0.5
11.
52
Den
sity
1 1.5 2 2.5 3Management DWMS Score
Public: peoplePrivate: peoplePublic: operationsPrivate: operations
Note: This figure shows the distribution of the D-WMS overall management z-score index for public andprivate schools in Panel A and operations and people management z-score indices in Panel B. Standard-ization is relative to the full dataset, including public and private schools. Data for Andhra Pradesh(AP) is from the Development World Management Survey, with potential scores ranging from 1 to 5in increments of 0.5. The D-WMS AP data includes 109 public schools and 190 private schools. Theaverage D-WMS overall management score for AP private schools is 2.15 (SD = 0.26). The averageD-WMS overall management score for AP public schools is 1.81 (sd = 0.25).28
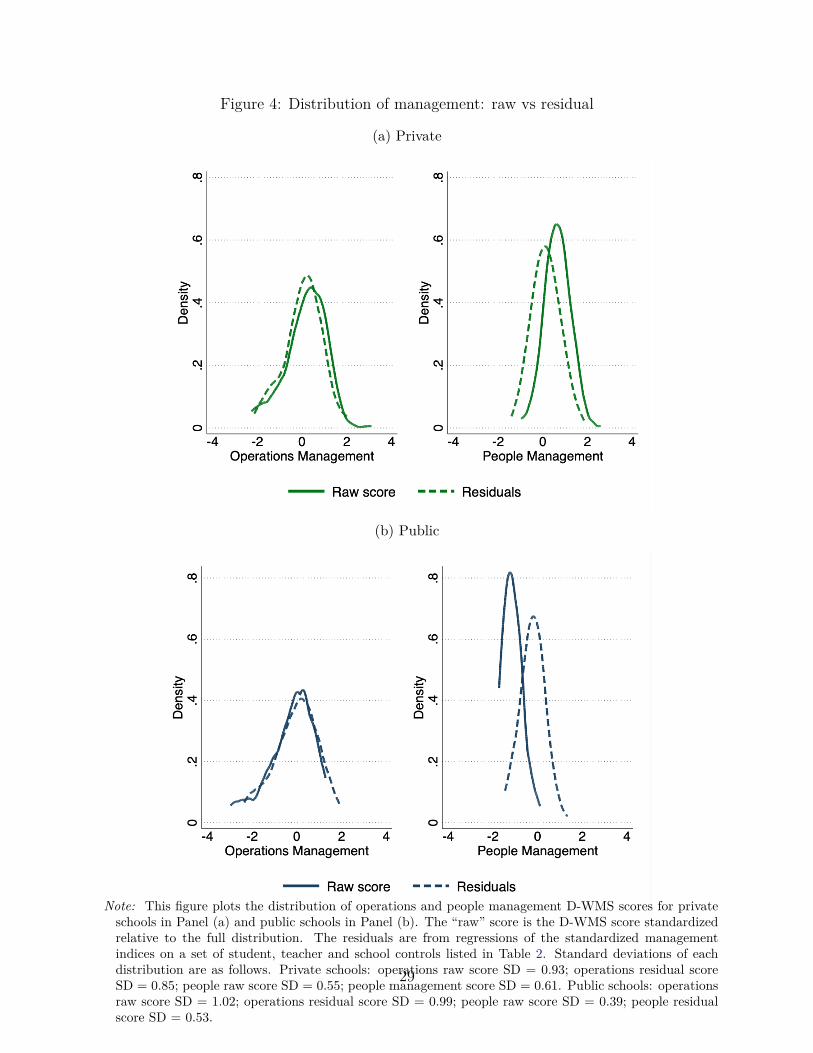
Figure 4: Distribution of management: raw vs residual
(a) Private
(b) Public
Note: This figure plots the distribution of operations and people management D-WMS scores for privateschools in Panel (a) and public schools in Panel (b). The “raw” score is the D-WMS score standardizedrelative to the full distribution. The residuals are from regressions of the standardized managementindices on a set of student, teacher and school controls listed in Table 2. Standard deviations of eachdistribution are as follows. Private schools: operations raw score SD = 0.93; operations residual scoreSD = 0.85; people raw score SD = 0.55; people management score SD = 0.61. Public schools: operationsraw score SD = 1.02; operations residual score SD = 0.99; people raw score SD = 0.39; people residualscore SD = 0.53.
29
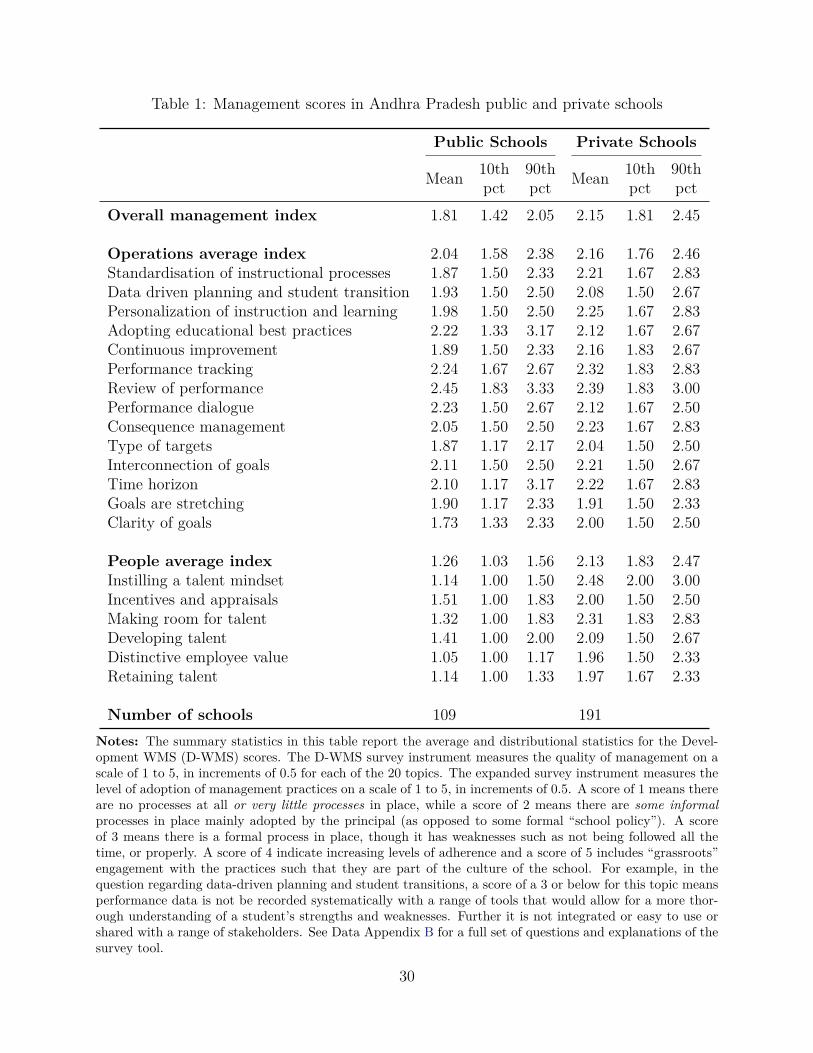
Table 1: Management scores in Andhra Pradesh public and private schools
Public Schools Private Schools
Mean 10thpct
90thpct Mean 10th
pct90thpct
Overall management index 1.81 1.42 2.05 2.15 1.81 2.45
Operations average index 2.04 1.58 2.38 2.16 1.76 2.46Standardisation of instructional processes 1.87 1.50 2.33 2.21 1.67 2.83Data driven planning and student transition 1.93 1.50 2.50 2.08 1.50 2.67Personalization of instruction and learning 1.98 1.50 2.50 2.25 1.67 2.83Adopting educational best practices 2.22 1.33 3.17 2.12 1.67 2.67Continuous improvement 1.89 1.50 2.33 2.16 1.83 2.67Performance tracking 2.24 1.67 2.67 2.32 1.83 2.83Review of performance 2.45 1.83 3.33 2.39 1.83 3.00Performance dialogue 2.23 1.50 2.67 2.12 1.67 2.50Consequence management 2.05 1.50 2.50 2.23 1.67 2.83Type of targets 1.87 1.17 2.17 2.04 1.50 2.50Interconnection of goals 2.11 1.50 2.50 2.21 1.50 2.67Time horizon 2.10 1.17 3.17 2.22 1.67 2.83Goals are stretching 1.90 1.17 2.33 1.91 1.50 2.33Clarity of goals 1.73 1.33 2.33 2.00 1.50 2.50
People average index 1.26 1.03 1.56 2.13 1.83 2.47Instilling a talent mindset 1.14 1.00 1.50 2.48 2.00 3.00Incentives and appraisals 1.51 1.00 1.83 2.00 1.50 2.50Making room for talent 1.32 1.00 1.83 2.31 1.83 2.83Developing talent 1.41 1.00 2.00 2.09 1.50 2.67Distinctive employee value 1.05 1.00 1.17 1.96 1.50 2.33Retaining talent 1.14 1.00 1.33 1.97 1.67 2.33
Number of schools 109 191Notes: The summary statistics in this table report the average and distributional statistics for the Devel-opment WMS (D-WMS) scores. The D-WMS survey instrument measures the quality of management on ascale of 1 to 5, in increments of 0.5 for each of the 20 topics. The expanded survey instrument measures thelevel of adoption of management practices on a scale of 1 to 5, in increments of 0.5. A score of 1 means thereare no processes at all or very little processes in place, while a score of 2 means there are some informalprocesses in place mainly adopted by the principal (as opposed to some formal “school policy”). A scoreof 3 means there is a formal process in place, though it has weaknesses such as not being followed all thetime, or properly. A score of 4 indicate increasing levels of adherence and a score of 5 includes “grassroots”engagement with the practices such that they are part of the culture of the school. For example, in thequestion regarding data-driven planning and student transitions, a score of a 3 or below for this topic meansperformance data is not be recorded systematically with a range of tools that would allow for a more thor-ough understanding of a student’s strengths and weaknesses. Further it is not integrated or easy to use orshared with a range of stakeholders. See Data Appendix B for a full set of questions and explanations of thesurvey tool.
30
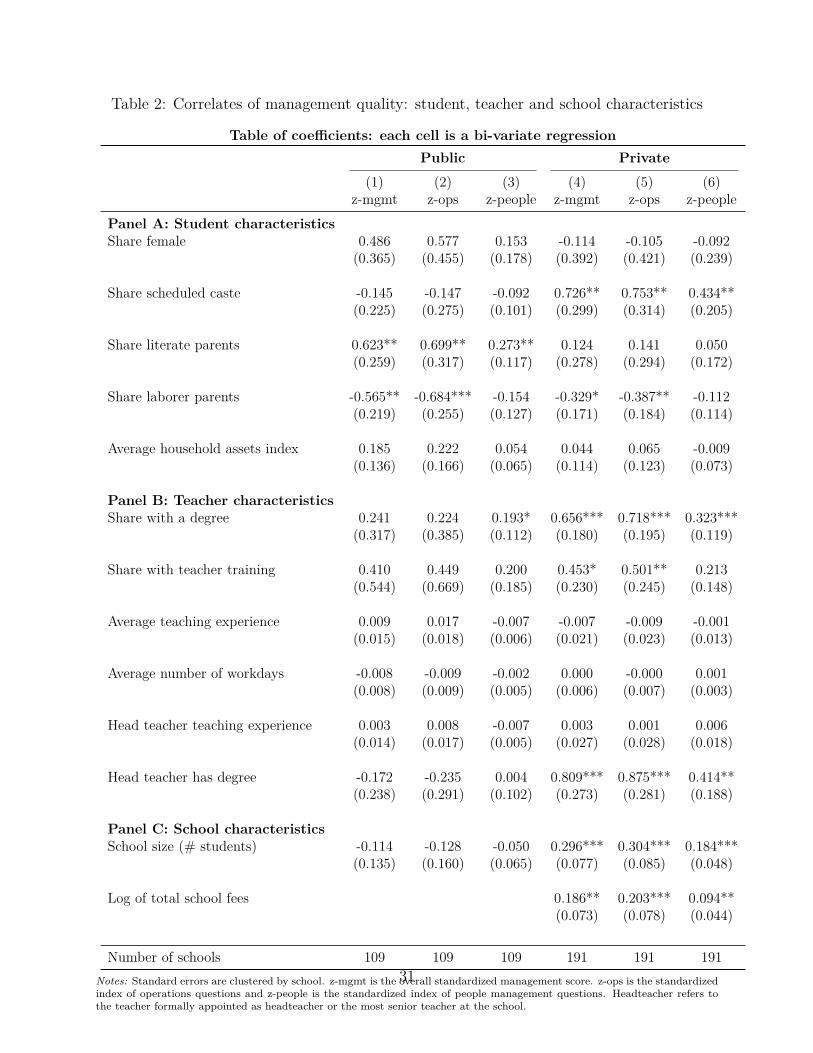
Table 2: Correlates of management quality: student, teacher and school characteristics
Table of coefficients: each cell is a bi-variate regressionPublic Private
(1) (2) (3) (4) (5) (6)z-mgmt z-ops z-people z-mgmt z-ops z-people
Panel A: Student characteristicsShare female 0.486 0.577 0.153 -0.114 -0.105 -0.092
(0.365) (0.455) (0.178) (0.392) (0.421) (0.239)
Share scheduled caste -0.145 -0.147 -0.092 0.726** 0.753** 0.434**(0.225) (0.275) (0.101) (0.299) (0.314) (0.205)
Share literate parents 0.623** 0.699** 0.273** 0.124 0.141 0.050(0.259) (0.317) (0.117) (0.278) (0.294) (0.172)
Share laborer parents -0.565** -0.684*** -0.154 -0.329* -0.387** -0.112(0.219) (0.255) (0.127) (0.171) (0.184) (0.114)
Average household assets index 0.185 0.222 0.054 0.044 0.065 -0.009(0.136) (0.166) (0.065) (0.114) (0.123) (0.073)
Panel B: Teacher characteristicsShare with a degree 0.241 0.224 0.193* 0.656*** 0.718*** 0.323***
(0.317) (0.385) (0.112) (0.180) (0.195) (0.119)
Share with teacher training 0.410 0.449 0.200 0.453* 0.501** 0.213(0.544) (0.669) (0.185) (0.230) (0.245) (0.148)
Average teaching experience 0.009 0.017 -0.007 -0.007 -0.009 -0.001(0.015) (0.018) (0.006) (0.021) (0.023) (0.013)
Average number of workdays -0.008 -0.009 -0.002 0.000 -0.000 0.001(0.008) (0.009) (0.005) (0.006) (0.007) (0.003)
Head teacher teaching experience 0.003 0.008 -0.007 0.003 0.001 0.006(0.014) (0.017) (0.005) (0.027) (0.028) (0.018)
Head teacher has degree -0.172 -0.235 0.004 0.809*** 0.875*** 0.414**(0.238) (0.291) (0.102) (0.273) (0.281) (0.188)
Panel C: School characteristicsSchool size (# students) -0.114 -0.128 -0.050 0.296*** 0.304*** 0.184***
(0.135) (0.160) (0.065) (0.077) (0.085) (0.048)
Log of total school fees 0.186** 0.203*** 0.094**(0.073) (0.078) (0.044)
Number of schools 109 109 109 191 191 191Notes: Standard errors are clustered by school. z-mgmt is the overall standardized management score. z-ops is the standardizedindex of operations questions and z-people is the standardized index of people management questions. Headteacher refers tothe teacher formally appointed as headteacher or the most senior teacher at the school.
31
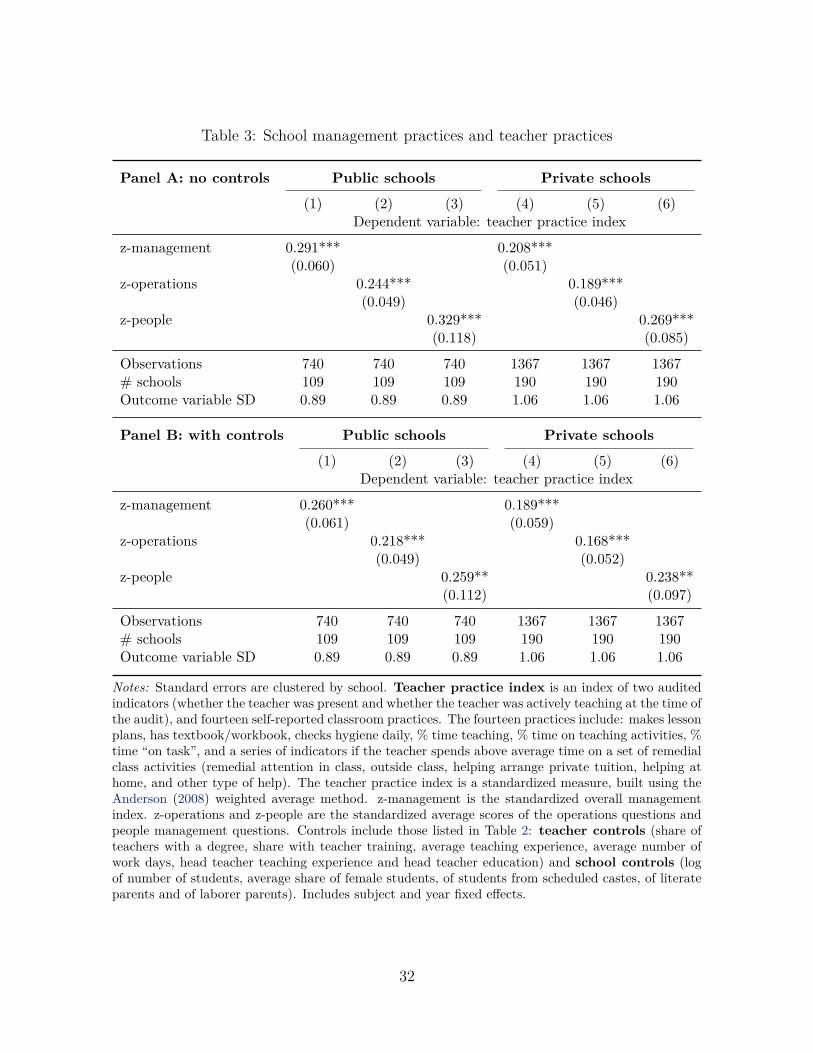
Table 3: School management practices and teacher practices
Panel A: no controls Public schools Private schools
(1) (2) (3) (4) (5) (6)Dependent variable: teacher practice index
z-management 0.291*** 0.208***(0.060) (0.051)
z-operations 0.244*** 0.189***(0.049) (0.046)
z-people 0.329*** 0.269***(0.118) (0.085)
Observations 740 740 740 1367 1367 1367# schools 109 109 109 190 190 190Outcome variable SD 0.89 0.89 0.89 1.06 1.06 1.06
Panel B: with controls Public schools Private schools
(1) (2) (3) (4) (5) (6)Dependent variable: teacher practice index
z-management 0.260*** 0.189***(0.061) (0.059)
z-operations 0.218*** 0.168***(0.049) (0.052)
z-people 0.259** 0.238**(0.112) (0.097)
Observations 740 740 740 1367 1367 1367# schools 109 109 109 190 190 190Outcome variable SD 0.89 0.89 0.89 1.06 1.06 1.06
Notes: Standard errors are clustered by school. Teacher practice index is an index of two auditedindicators (whether the teacher was present and whether the teacher was actively teaching at the time ofthe audit), and fourteen self-reported classroom practices. The fourteen practices include: makes lessonplans, has textbook/workbook, checks hygiene daily, % time teaching, % time on teaching activities, %time “on task”, and a series of indicators if the teacher spends above average time on a set of remedialclass activities (remedial attention in class, outside class, helping arrange private tuition, helping athome, and other type of help). The teacher practice index is a standardized measure, built using theAnderson (2008) weighted average method. z-management is the standardized overall managementindex. z-operations and z-people are the standardized average scores of the operations questions andpeople management questions. Controls include those listed in Table 2: teacher controls (share ofteachers with a degree, share with teacher training, average teaching experience, average number ofwork days, head teacher teaching experience and head teacher education) and school controls (logof number of students, average share of female students, of students from scheduled castes, of literateparents and of laborer parents). Includes subject and year fixed effects.
32
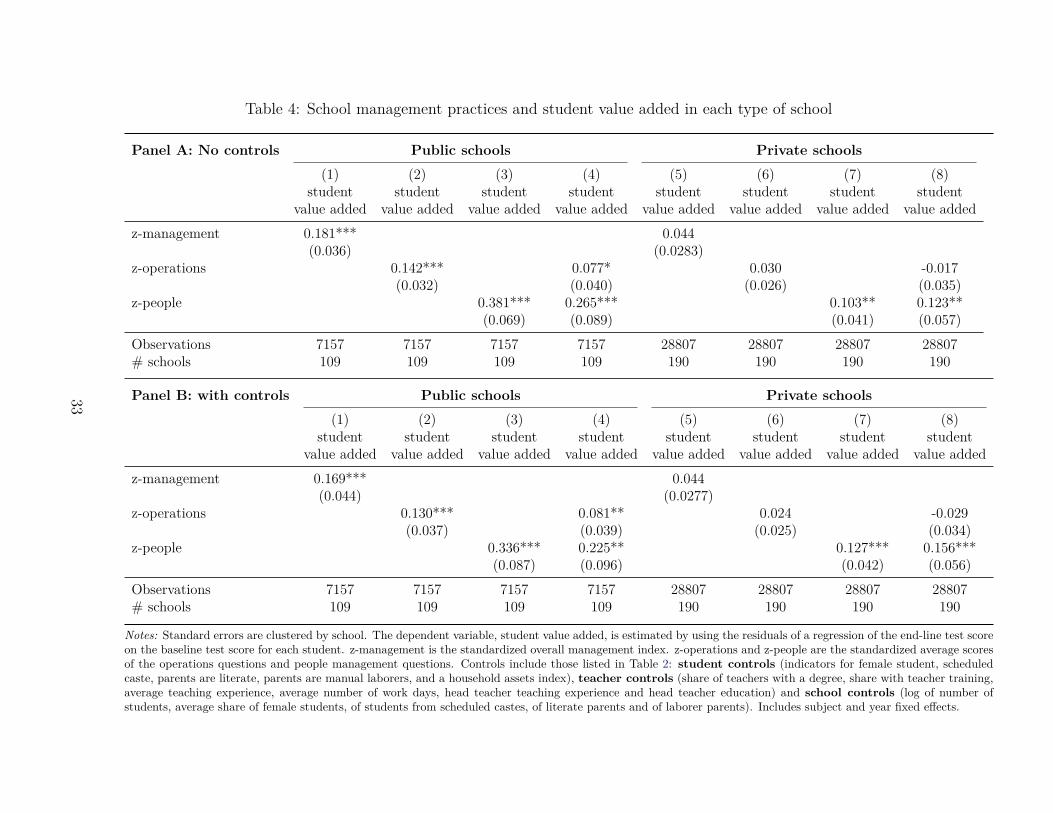
Table 4: School management practices and student value added in each type of school
Panel A: No controls Public schools Private schools
(1) (2) (3) (4) (5) (6) (7) (8)student
value addedstudent
value addedstudent
value addedstudent
value addedstudent
value addedstudent
value addedstudent
value addedstudent
value addedz-management 0.181*** 0.044
(0.036) (0.0283)z-operations 0.142*** 0.077* 0.030 -0.017
(0.032) (0.040) (0.026) (0.035)z-people 0.381*** 0.265*** 0.103** 0.123**
(0.069) (0.089) (0.041) (0.057)Observations 7157 7157 7157 7157 28807 28807 28807 28807# schools 109 109 109 109 190 190 190 190
Panel B: with controls Public schools Private schools
(1) (2) (3) (4) (5) (6) (7) (8)student
value addedstudent
value addedstudent
value addedstudent
value addedstudent
value addedstudent
value addedstudent
value addedstudent
value addedz-management 0.169*** 0.044
(0.044) (0.0277)z-operations 0.130*** 0.081** 0.024 -0.029
(0.037) (0.039) (0.025) (0.034)z-people 0.336*** 0.225** 0.127*** 0.156***
(0.087) (0.096) (0.042) (0.056)Observations 7157 7157 7157 7157 28807 28807 28807 28807# schools 109 109 109 109 190 190 190 190
Notes: Standard errors are clustered by school. The dependent variable, student value added, is estimated by using the residuals of a regression of the end-line test scoreon the baseline test score for each student. z-management is the standardized overall management index. z-operations and z-people are the standardized average scoresof the operations questions and people management questions. Controls include those listed in Table 2: student controls (indicators for female student, scheduledcaste, parents are literate, parents are manual laborers, and a household assets index), teacher controls (share of teachers with a degree, share with teacher training,average teaching experience, average number of work days, head teacher teaching experience and head teacher education) and school controls (log of number ofstudents, average share of female students, of students from scheduled castes, of literate parents and of laborer parents). Includes subject and year fixed effects.
33
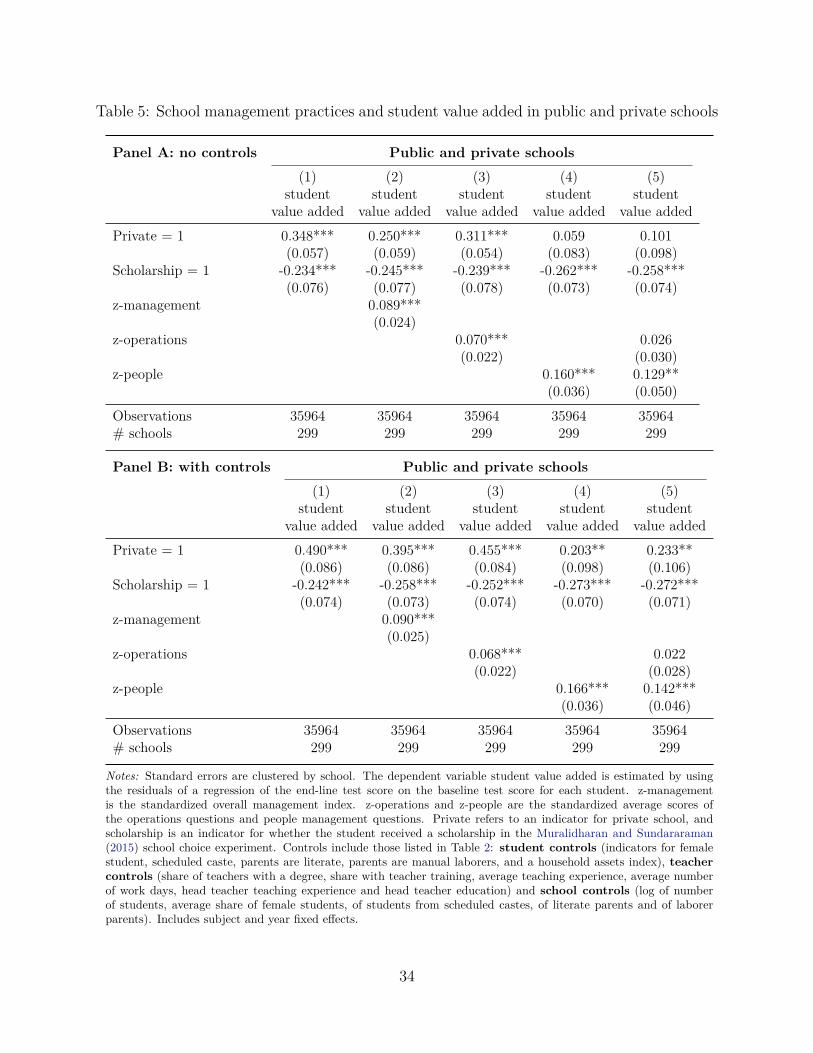
Table 5: School management practices and student value added in public and private schools
Panel A: no controls Public and private schools
(1) (2) (3) (4) (5)student
value addedstudent
value addedstudent
value addedstudent
value addedstudent
value addedPrivate = 1 0.348*** 0.250*** 0.311*** 0.059 0.101
(0.057) (0.059) (0.054) (0.083) (0.098)Scholarship = 1 -0.234*** -0.245*** -0.239*** -0.262*** -0.258***
(0.076) (0.077) (0.078) (0.073) (0.074)z-management 0.089***
(0.024)z-operations 0.070*** 0.026
(0.022) (0.030)z-people 0.160*** 0.129**
(0.036) (0.050)Observations 35964 35964 35964 35964 35964# schools 299 299 299 299 299
Panel B: with controls Public and private schools
(1) (2) (3) (4) (5)student
value addedstudent
value addedstudent
value addedstudent
value addedstudent
value addedPrivate = 1 0.490*** 0.395*** 0.455*** 0.203** 0.233**
(0.086) (0.086) (0.084) (0.098) (0.106)Scholarship = 1 -0.242*** -0.258*** -0.252*** -0.273*** -0.272***
(0.074) (0.073) (0.074) (0.070) (0.071)z-management 0.090***
(0.025)z-operations 0.068*** 0.022
(0.022) (0.028)z-people 0.166*** 0.142***
(0.036) (0.046)Observations 35964 35964 35964 35964 35964# schools 299 299 299 299 299
Notes: Standard errors are clustered by school. The dependent variable student value added is estimated by usingthe residuals of a regression of the end-line test score on the baseline test score for each student. z-managementis the standardized overall management index. z-operations and z-people are the standardized average scores ofthe operations questions and people management questions. Private refers to an indicator for private school, andscholarship is an indicator for whether the student received a scholarship in the Muralidharan and Sundararaman(2015) school choice experiment. Controls include those listed in Table 2: student controls (indicators for femalestudent, scheduled caste, parents are literate, parents are manual laborers, and a household assets index), teachercontrols (share of teachers with a degree, share with teacher training, average teaching experience, average numberof work days, head teacher teaching experience and head teacher education) and school controls (log of numberof students, average share of female students, of students from scheduled castes, of literate parents and of laborerparents). Includes subject and year fixed effects.
34
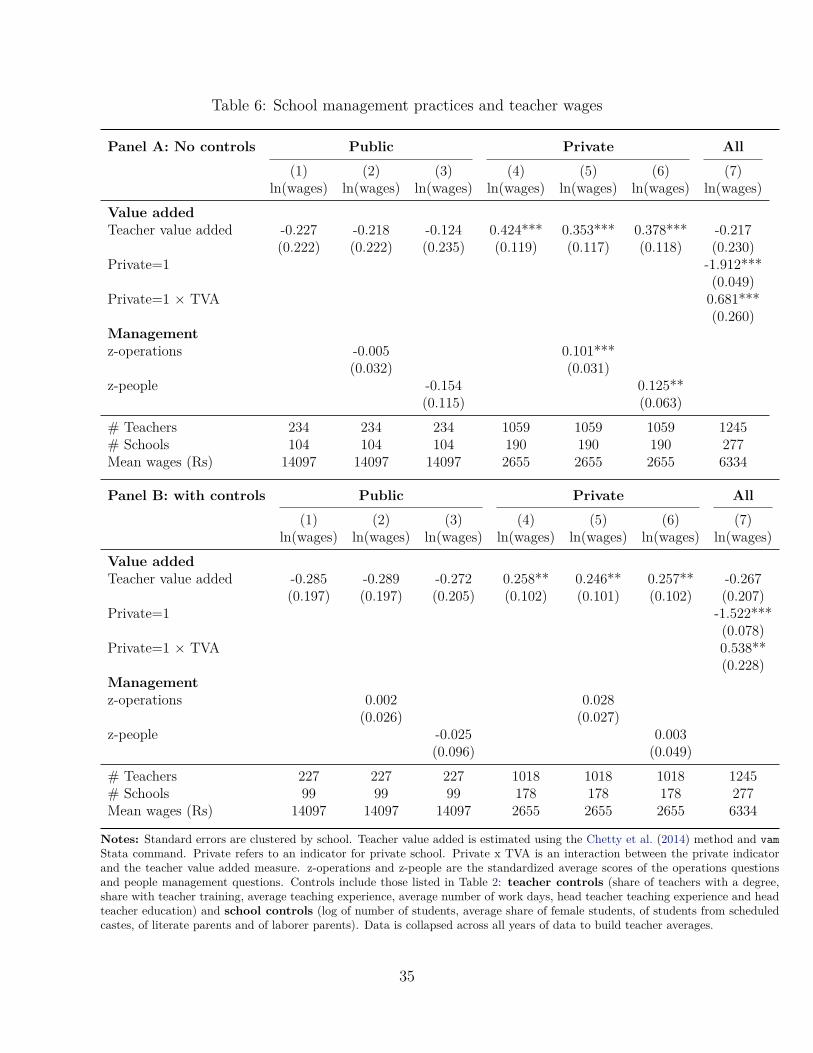
Table 6: School management practices and teacher wages
Panel A: No controls Public Private All
(1) (2) (3) (4) (5) (6) (7)ln(wages) ln(wages) ln(wages) ln(wages) ln(wages) ln(wages) ln(wages)
Value addedTeacher value added -0.227 -0.218 -0.124 0.424*** 0.353*** 0.378*** -0.217
(0.222) (0.222) (0.235) (0.119) (0.117) (0.118) (0.230)Private=1 -1.912***
(0.049)Private=1 × TVA 0.681***
(0.260)Managementz-operations -0.005 0.101***
(0.032) (0.031)z-people -0.154 0.125**
(0.115) (0.063)# Teachers 234 234 234 1059 1059 1059 1245# Schools 104 104 104 190 190 190 277Mean wages (Rs) 14097 14097 14097 2655 2655 2655 6334
Panel B: with controls Public Private All
(1) (2) (3) (4) (5) (6) (7)ln(wages) ln(wages) ln(wages) ln(wages) ln(wages) ln(wages) ln(wages)
Value addedTeacher value added -0.285 -0.289 -0.272 0.258** 0.246** 0.257** -0.267
(0.197) (0.197) (0.205) (0.102) (0.101) (0.102) (0.207)Private=1 -1.522***
(0.078)Private=1 × TVA 0.538**
(0.228)Managementz-operations 0.002 0.028
(0.026) (0.027)z-people -0.025 0.003
(0.096) (0.049)# Teachers 227 227 227 1018 1018 1018 1245# Schools 99 99 99 178 178 178 277Mean wages (Rs) 14097 14097 14097 2655 2655 2655 6334
Notes: Standard errors are clustered by school. Teacher value added is estimated using the Chetty et al. (2014) method and vamStata command. Private refers to an indicator for private school. Private x TVA is an interaction between the private indicatorand the teacher value added measure. z-operations and z-people are the standardized average scores of the operations questionsand people management questions. Controls include those listed in Table 2: teacher controls (share of teachers with a degree,share with teacher training, average teaching experience, average number of work days, head teacher teaching experience and headteacher education) and school controls (log of number of students, average share of female students, of students from scheduledcastes, of literate parents and of laborer parents). Data is collapsed across all years of data to build teacher averages.
35
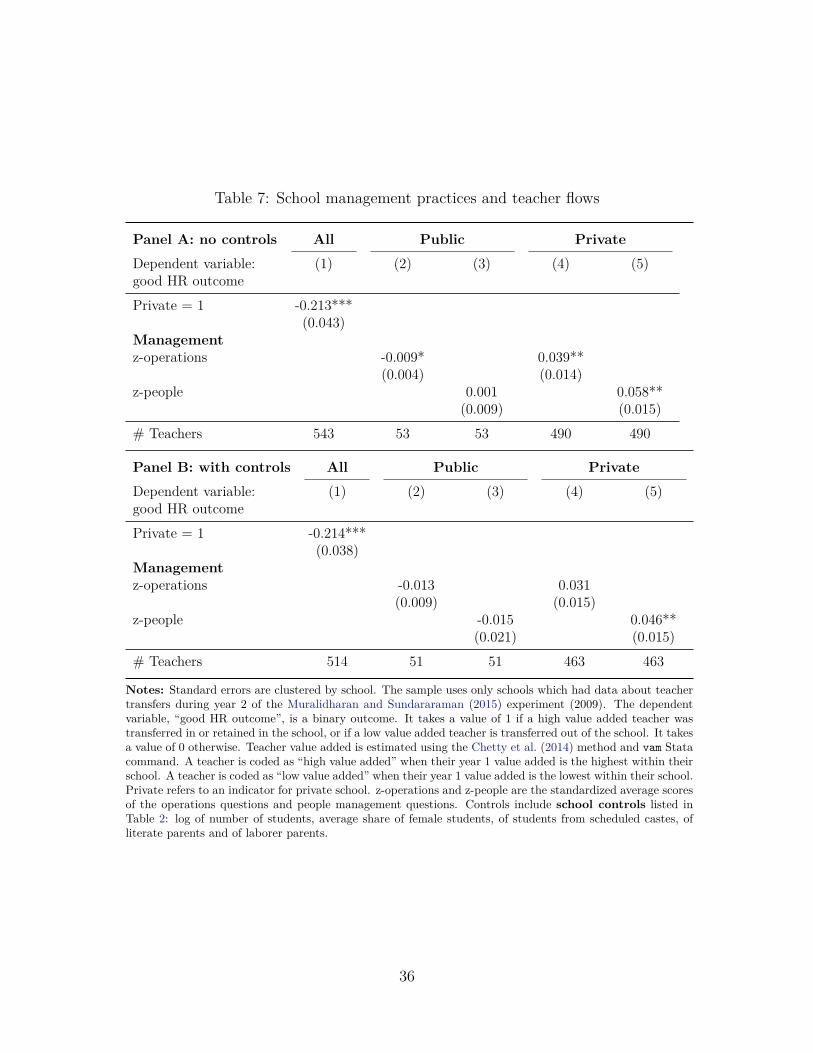
Table 7: School management practices and teacher flows
Panel A: no controls All Public Private
Dependent variable: (1) (2) (3) (4) (5)good HR outcome Transfers Transfers Transfers Transfers Transfers
Private = 1 -0.213***(0.043)
Managementz-operations -0.009* 0.039**
(0.004) (0.014)z-people 0.001 0.058**
(0.009) (0.015)# Teachers 543 53 53 490 490
Panel B: with controls All Public Private
Dependent variable: (1) (2) (3) (4) (5)good HR outcome Transfers Transfers Transfers Transfers Transfers
Private = 1 -0.214***(0.038)
Managementz-operations -0.013 0.031
(0.009) (0.015)z-people -0.015 0.046**
(0.021) (0.015)# Teachers 514 51 51 463 463
Notes: Standard errors are clustered by school. The sample uses only schools which had data about teachertransfers during year 2 of the Muralidharan and Sundararaman (2015) experiment (2009). The dependentvariable, “good HR outcome”, is a binary outcome. It takes a value of 1 if a high value added teacher wastransferred in or retained in the school, or if a low value added teacher is transferred out of the school. It takesa value of 0 otherwise. Teacher value added is estimated using the Chetty et al. (2014) method and vam Statacommand. A teacher is coded as “high value added” when their year 1 value added is the highest within theirschool. A teacher is coded as “low value added” when their year 1 value added is the lowest within their school.Private refers to an indicator for private school. z-operations and z-people are the standardized average scoresof the operations questions and people management questions. Controls include school controls listed inTable 2: log of number of students, average share of female students, of students from scheduled castes, ofliterate parents and of laborer parents.
36
ONLINE APPENDIX“Personnel Management and School Productivity: Evidence from India,”
July 8, 2021
A Additional figures and tables
App. 1
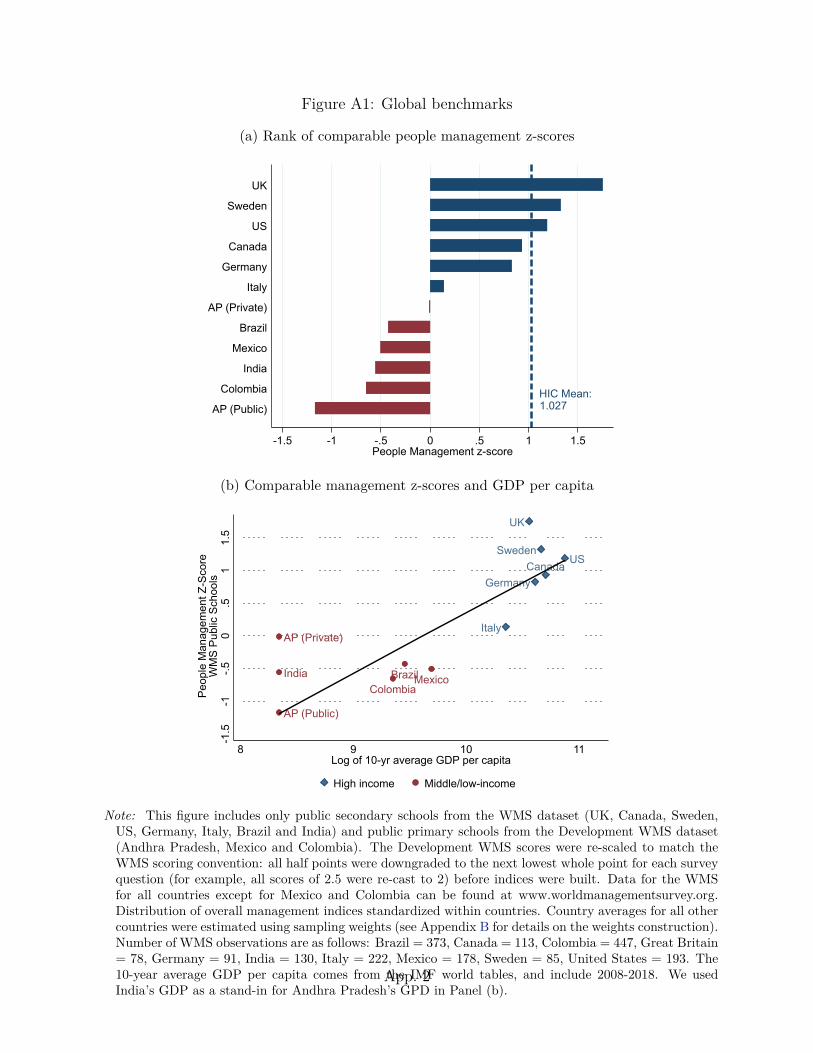
Figure A1: Global benchmarks
(a) Rank of comparable people management z-scores
HIC Mean: 1.027
-1.5 -1 -.5 0 .5 1 1.5People Management z-score
AP (Public)
Colombia
India
Mexico
Brazil
AP (Private)
Italy
Germany
Canada
US
Sweden
UK
(b) Comparable management z-scores and GDP per capita
Germany
Italy
Sweden
UK
CanadaUS
BrazilColombia
Mexico
AP (Public)
AP (Private)
India
-1.5
-1-.5
0.5
11.
5
Peo
ple
Man
agem
ent Z
-Sco
re
WM
S P
ublic
Sch
ools
8 9 10 11Log of 10-yr average GDP per capita
High income Middle/low-income
Note: This figure includes only public secondary schools from the WMS dataset (UK, Canada, Sweden,US, Germany, Italy, Brazil and India) and public primary schools from the Development WMS dataset(Andhra Pradesh, Mexico and Colombia). The Development WMS scores were re-scaled to match theWMS scoring convention: all half points were downgraded to the next lowest whole point for each surveyquestion (for example, all scores of 2.5 were re-cast to 2) before indices were built. Data for the WMSfor all countries except for Mexico and Colombia can be found at www.worldmanagementsurvey.org.Distribution of overall management indices standardized within countries. Country averages for all othercountries were estimated using sampling weights (see Appendix B for details on the weights construction).Number of WMS observations are as follows: Brazil = 373, Canada = 113, Colombia = 447, Great Britain= 78, Germany = 91, India = 130, Italy = 222, Mexico = 178, Sweden = 85, United States = 193. The10-year average GDP per capita comes from the IMF world tables, and include 2008-2018. We usedIndia’s GDP as a stand-in for Andhra Pradesh’s GPD in Panel (b).
App. 2
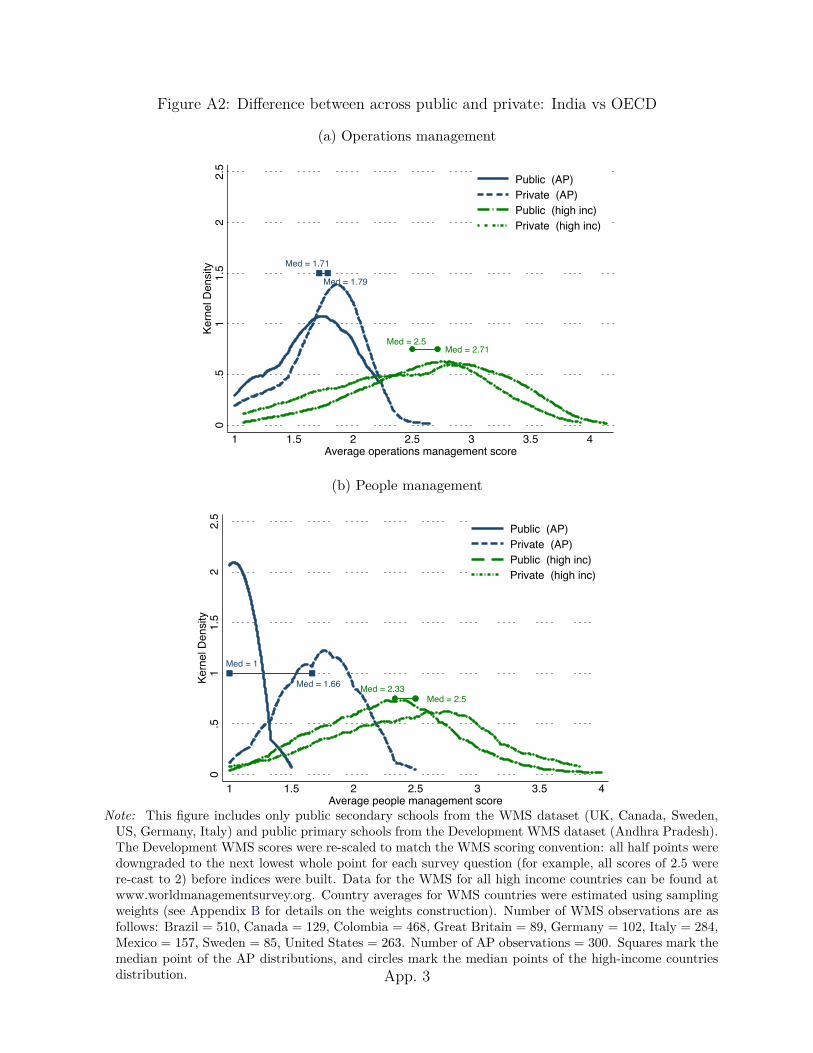
Figure A2: Difference between across public and private: India vs OECD
(a) Operations management
Med = 1.71
Med = 1.79
Med = 2.71Med = 2.5
0.5
11.
52
2.5
Kern
el D
ensi
ty
1 1.5 2 2.5 3 3.5 4Average operations management score
Public (AP)Private (AP)Public (high inc)Private (high inc)
(b) People management
Med = 1
Med = 1.66 Med = 2.33Med = 2.5
0.5
11.
52
2.5
Kern
el D
ensi
ty
1 1.5 2 2.5 3 3.5 4Average people management score
Public (AP)Private (AP)Public (high inc)Private (high inc)
Note: This figure includes only public secondary schools from the WMS dataset (UK, Canada, Sweden,US, Germany, Italy) and public primary schools from the Development WMS dataset (Andhra Pradesh).The Development WMS scores were re-scaled to match the WMS scoring convention: all half points weredowngraded to the next lowest whole point for each survey question (for example, all scores of 2.5 werere-cast to 2) before indices were built. Data for the WMS for all high income countries can be found atwww.worldmanagementsurvey.org. Country averages for WMS countries were estimated using samplingweights (see Appendix B for details on the weights construction). Number of WMS observations are asfollows: Brazil = 510, Canada = 129, Colombia = 468, Great Britain = 89, Germany = 102, Italy = 284,Mexico = 157, Sweden = 85, United States = 263. Number of AP observations = 300. Squares mark themedian point of the AP distributions, and circles mark the median points of the high-income countriesdistribution. App. 3
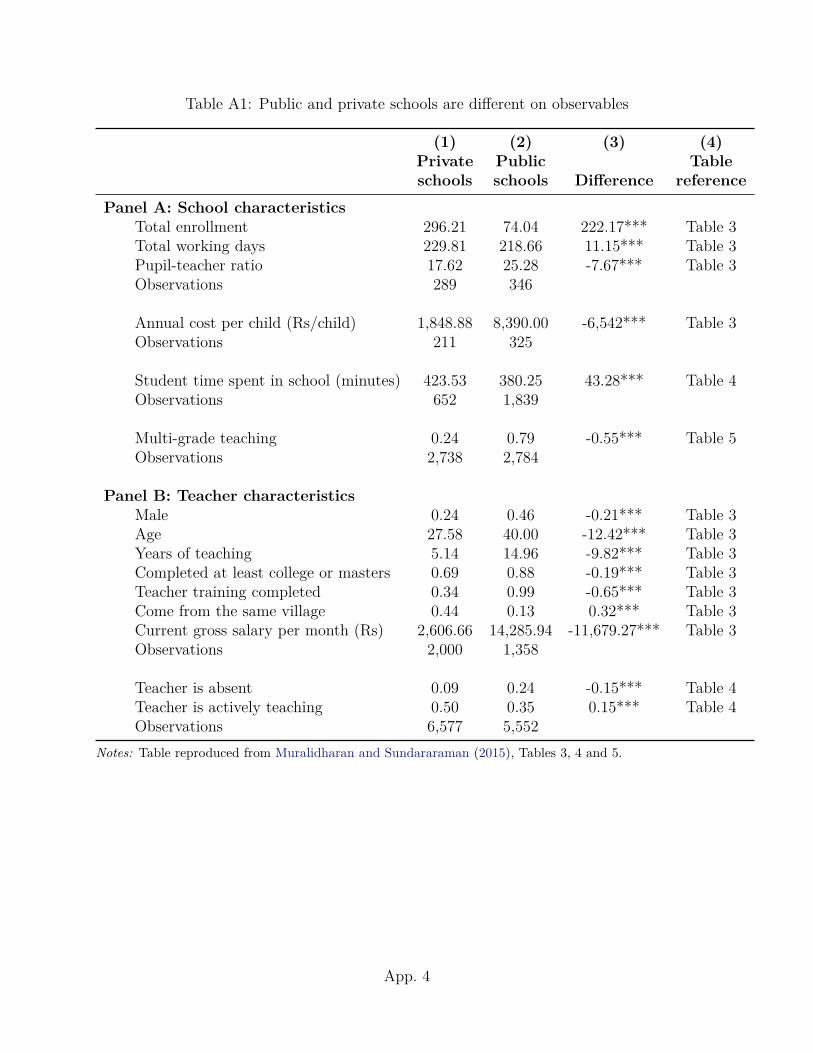
Table A1: Public and private schools are different on observables
(1) (2) (3) (4)Private Public Tableschools schools Difference reference
Panel A: School characteristicsTotal enrollment 296.21 74.04 222.17*** Table 3Total working days 229.81 218.66 11.15*** Table 3Pupil-teacher ratio 17.62 25.28 -7.67*** Table 3Observations 289 346
Annual cost per child (Rs/child) 1,848.88 8,390.00 -6,542*** Table 3Observations 211 325
Student time spent in school (minutes) 423.53 380.25 43.28*** Table 4Observations 652 1,839
Multi-grade teaching 0.24 0.79 -0.55*** Table 5Observations 2,738 2,784
Panel B: Teacher characteristicsMale 0.24 0.46 -0.21*** Table 3Age 27.58 40.00 -12.42*** Table 3Years of teaching 5.14 14.96 -9.82*** Table 3Completed at least college or masters 0.69 0.88 -0.19*** Table 3Teacher training completed 0.34 0.99 -0.65*** Table 3Come from the same village 0.44 0.13 0.32*** Table 3Current gross salary per month (Rs) 2,606.66 14,285.94 -11,679.27*** Table 3Observations 2,000 1,358
Teacher is absent 0.09 0.24 -0.15*** Table 4Teacher is actively teaching 0.50 0.35 0.15*** Table 4Observations 6,577 5,552
Notes: Table reproduced from Muralidharan and Sundararaman (2015), Tables 3, 4 and 5.
App. 4
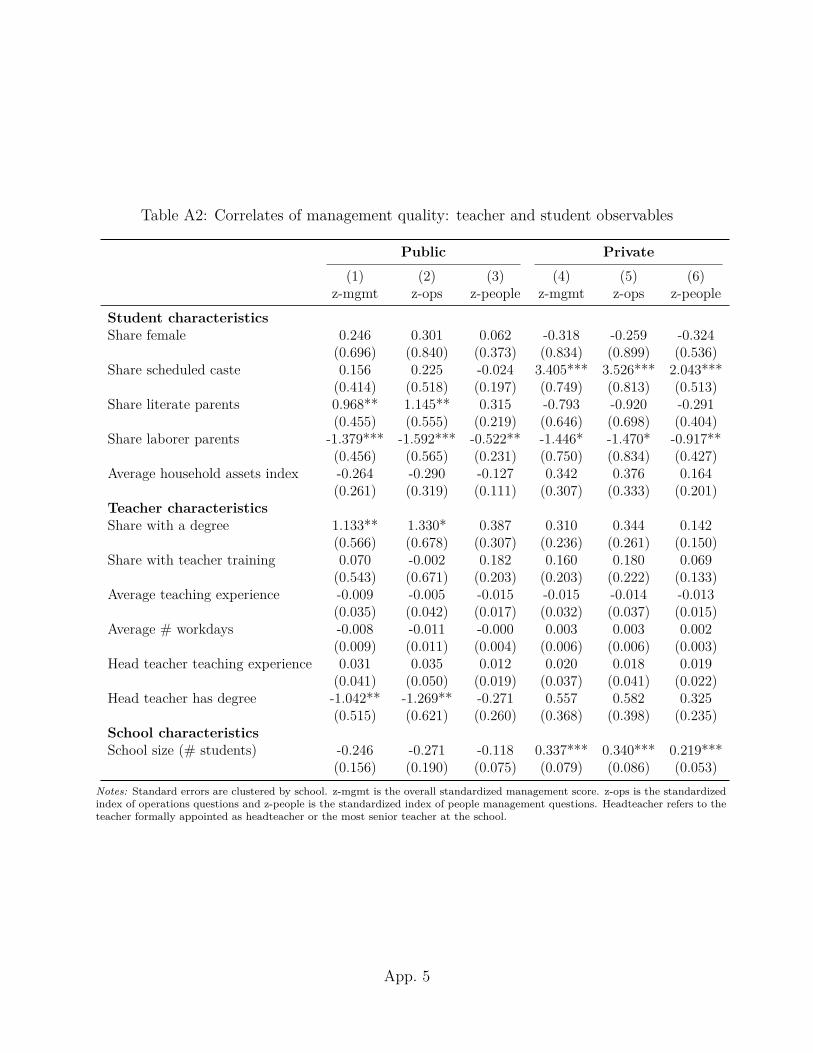
Table A2: Correlates of management quality: teacher and student observables
Public Private
(1) (2) (3) (4) (5) (6)z-mgmt z-ops z-people z-mgmt z-ops z-people
Student characteristicsShare female 0.246 0.301 0.062 -0.318 -0.259 -0.324
(0.696) (0.840) (0.373) (0.834) (0.899) (0.536)Share scheduled caste 0.156 0.225 -0.024 3.405*** 3.526*** 2.043***
(0.414) (0.518) (0.197) (0.749) (0.813) (0.513)Share literate parents 0.968** 1.145** 0.315 -0.793 -0.920 -0.291
(0.455) (0.555) (0.219) (0.646) (0.698) (0.404)Share laborer parents -1.379*** -1.592*** -0.522** -1.446* -1.470* -0.917**
(0.456) (0.565) (0.231) (0.750) (0.834) (0.427)Average household assets index -0.264 -0.290 -0.127 0.342 0.376 0.164
(0.261) (0.319) (0.111) (0.307) (0.333) (0.201)Teacher characteristicsShare with a degree 1.133** 1.330* 0.387 0.310 0.344 0.142
(0.566) (0.678) (0.307) (0.236) (0.261) (0.150)Share with teacher training 0.070 -0.002 0.182 0.160 0.180 0.069
(0.543) (0.671) (0.203) (0.203) (0.222) (0.133)Average teaching experience -0.009 -0.005 -0.015 -0.015 -0.014 -0.013
(0.035) (0.042) (0.017) (0.032) (0.037) (0.015)Average # workdays -0.008 -0.011 -0.000 0.003 0.003 0.002
(0.009) (0.011) (0.004) (0.006) (0.006) (0.003)Head teacher teaching experience 0.031 0.035 0.012 0.020 0.018 0.019
(0.041) (0.050) (0.019) (0.037) (0.041) (0.022)Head teacher has degree -1.042** -1.269** -0.271 0.557 0.582 0.325
(0.515) (0.621) (0.260) (0.368) (0.398) (0.235)School characteristicsSchool size (# students) -0.246 -0.271 -0.118 0.337*** 0.340*** 0.219***
(0.156) (0.190) (0.075) (0.079) (0.086) (0.053)Notes: Standard errors are clustered by school. z-mgmt is the overall standardized management score. z-ops is the standardizedindex of operations questions and z-people is the standardized index of people management questions. Headteacher refers to theteacher formally appointed as headteacher or the most senior teacher at the school.
App. 5
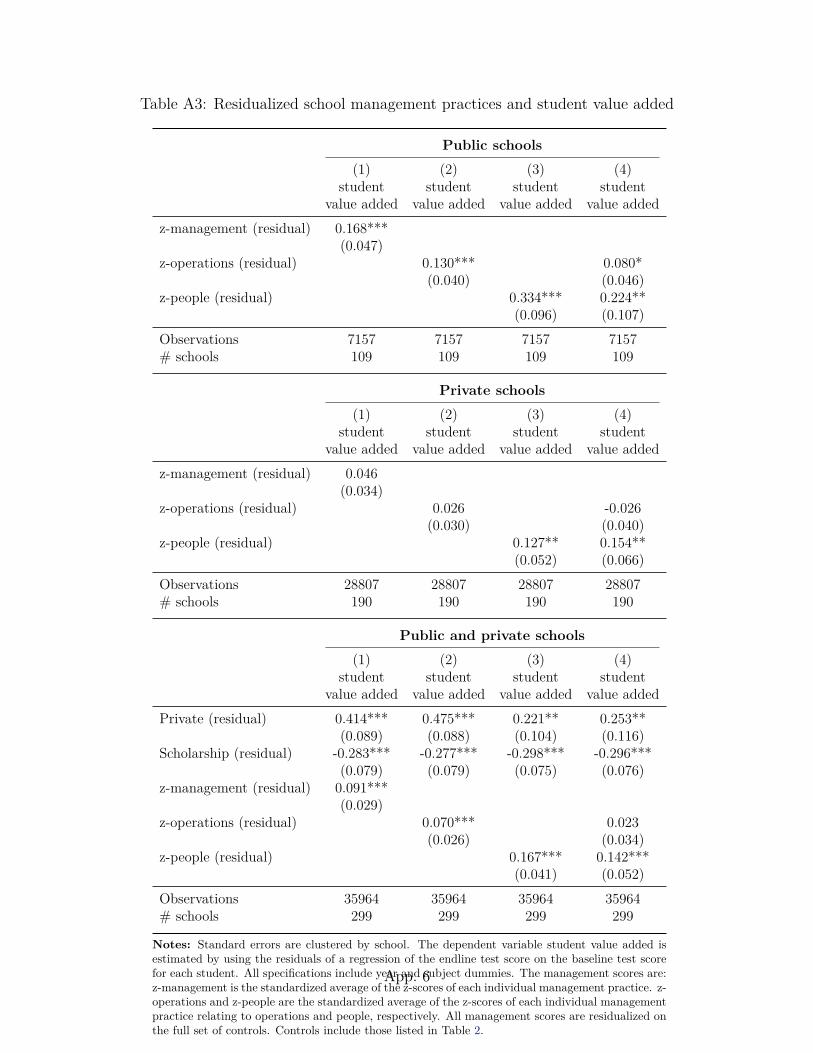
Table A3: Residualized school management practices and student value added
Public schools
(1) (2) (3) (4)student
value addedstudent
value addedstudent
value addedstudent
value addedz-management (residual) 0.168***
(0.047)z-operations (residual) 0.130*** 0.080*
(0.040) (0.046)z-people (residual) 0.334*** 0.224**
(0.096) (0.107)Observations 7157 7157 7157 7157# schools 109 109 109 109
Private schools
(1) (2) (3) (4)student
value addedstudent
value addedstudent
value addedstudent
value addedz-management (residual) 0.046
(0.034)z-operations (residual) 0.026 -0.026
(0.030) (0.040)z-people (residual) 0.127** 0.154**
(0.052) (0.066)Observations 28807 28807 28807 28807# schools 190 190 190 190
Public and private schools
(1) (2) (3) (4)student
value addedstudent
value addedstudent
value addedstudent
value addedPrivate (residual) 0.414*** 0.475*** 0.221** 0.253**
(0.089) (0.088) (0.104) (0.116)Scholarship (residual) -0.283*** -0.277*** -0.298*** -0.296***
(0.079) (0.079) (0.075) (0.076)z-management (residual) 0.091***
(0.029)z-operations (residual) 0.070*** 0.023
(0.026) (0.034)z-people (residual) 0.167*** 0.142***
(0.041) (0.052)Observations 35964 35964 35964 35964# schools 299 299 299 299
Notes: Standard errors are clustered by school. The dependent variable student value added isestimated by using the residuals of a regression of the endline test score on the baseline test scorefor each student. All specifications include year and subject dummies. The management scores are:z-management is the standardized average of the z-scores of each individual management practice. z-operations and z-people are the standardized average of the z-scores of each individual managementpractice relating to operations and people, respectively. All management scores are residualized onthe full set of controls. Controls include those listed in Table 2.
App. 6
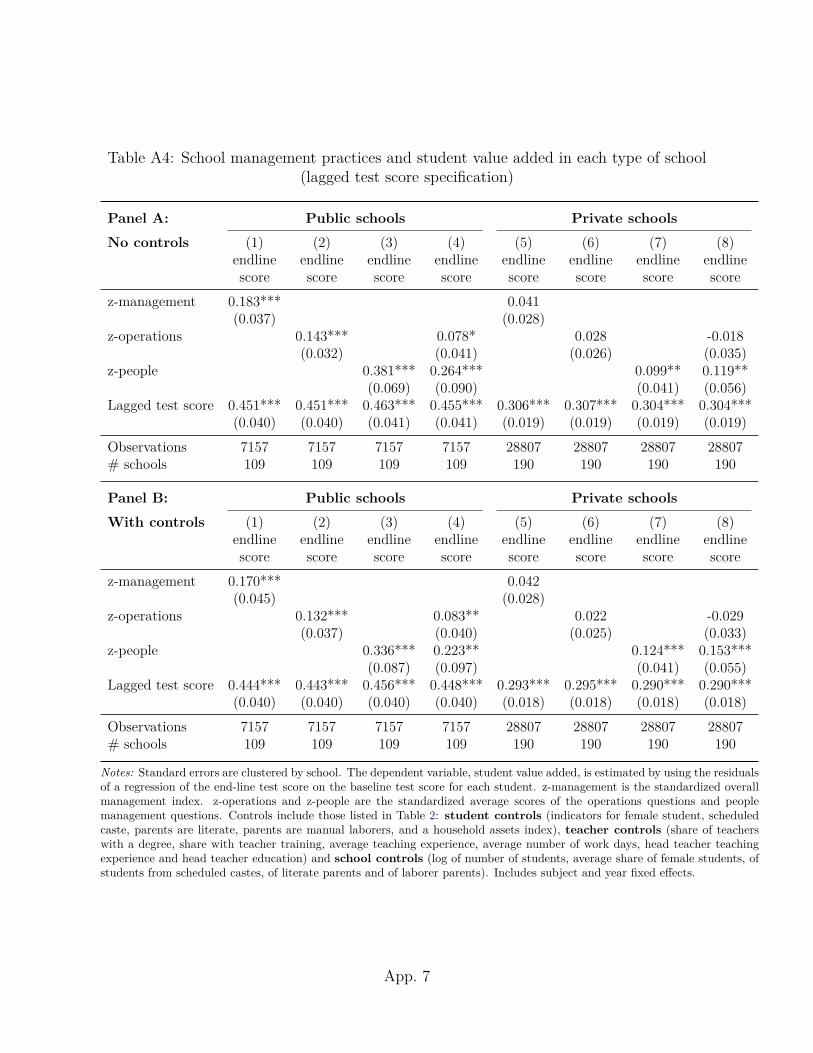
Table A4: School management practices and student value added in each type of school(lagged test score specification)
Panel A: Public schools Private schools
No controls (1) (2) (3) (4) (5) (6) (7) (8)endlinescore
endlinescore
endlinescore
endlinescore
endlinescore
endlinescore
endlinescore
endlinescore
z-management 0.183*** 0.041(0.037) (0.028)
z-operations 0.143*** 0.078* 0.028 -0.018(0.032) (0.041) (0.026) (0.035)
z-people 0.381*** 0.264*** 0.099** 0.119**(0.069) (0.090) (0.041) (0.056)
Lagged test score 0.451*** 0.451*** 0.463*** 0.455*** 0.306*** 0.307*** 0.304*** 0.304***(0.040) (0.040) (0.041) (0.041) (0.019) (0.019) (0.019) (0.019)
Observations 7157 7157 7157 7157 28807 28807 28807 28807# schools 109 109 109 109 190 190 190 190
Panel B: Public schools Private schools
With controls (1) (2) (3) (4) (5) (6) (7) (8)endlinescore
endlinescore
endlinescore
endlinescore
endlinescore
endlinescore
endlinescore
endlinescore
z-management 0.170*** 0.042(0.045) (0.028)
z-operations 0.132*** 0.083** 0.022 -0.029(0.037) (0.040) (0.025) (0.033)
z-people 0.336*** 0.223** 0.124*** 0.153***(0.087) (0.097) (0.041) (0.055)
Lagged test score 0.444*** 0.443*** 0.456*** 0.448*** 0.293*** 0.295*** 0.290*** 0.290***(0.040) (0.040) (0.040) (0.040) (0.018) (0.018) (0.018) (0.018)
Observations 7157 7157 7157 7157 28807 28807 28807 28807# schools 109 109 109 109 190 190 190 190
Notes: Standard errors are clustered by school. The dependent variable, student value added, is estimated by using the residualsof a regression of the end-line test score on the baseline test score for each student. z-management is the standardized overallmanagement index. z-operations and z-people are the standardized average scores of the operations questions and peoplemanagement questions. Controls include those listed in Table 2: student controls (indicators for female student, scheduledcaste, parents are literate, parents are manual laborers, and a household assets index), teacher controls (share of teacherswith a degree, share with teacher training, average teaching experience, average number of work days, head teacher teachingexperience and head teacher education) and school controls (log of number of students, average share of female students, ofstudents from scheduled castes, of literate parents and of laborer parents). Includes subject and year fixed effects.
App. 7
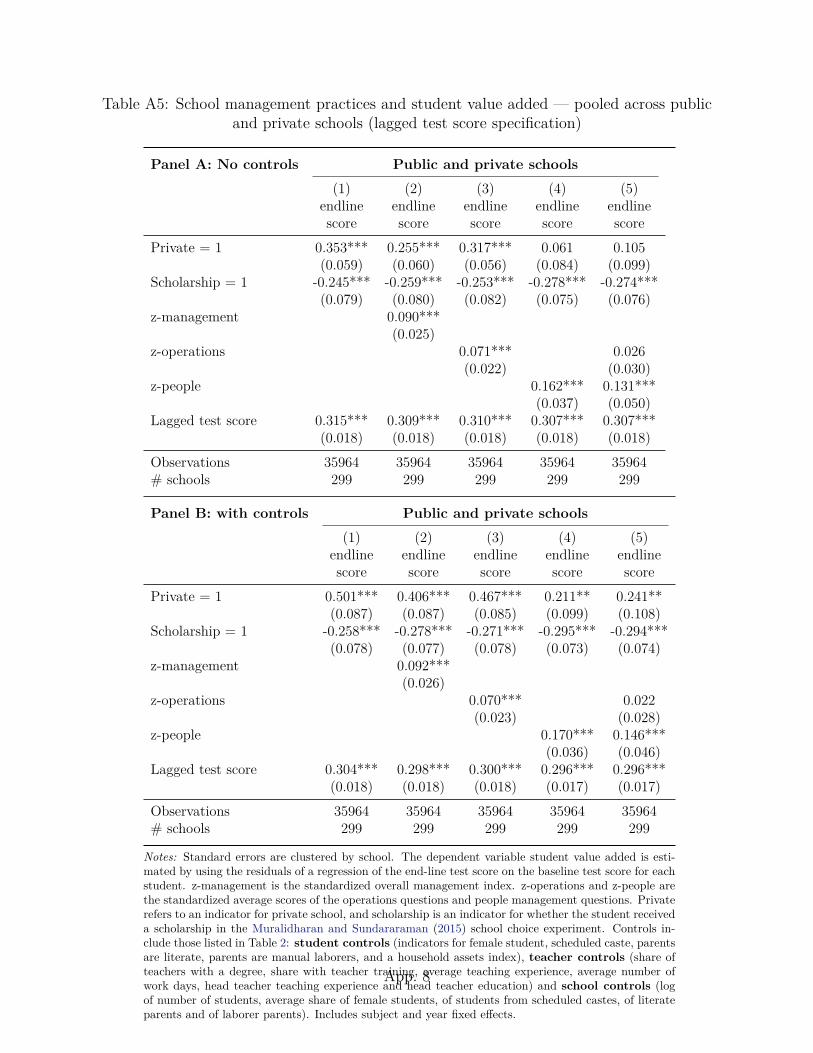
Table A5: School management practices and student value added — pooled across publicand private schools (lagged test score specification)
Panel A: No controls Public and private schools
(1) (2) (3) (4) (5)endlinescore
endlinescore
endlinescore
endlinescore
endlinescore
Private = 1 0.353*** 0.255*** 0.317*** 0.061 0.105(0.059) (0.060) (0.056) (0.084) (0.099)
Scholarship = 1 -0.245*** -0.259*** -0.253*** -0.278*** -0.274***(0.079) (0.080) (0.082) (0.075) (0.076)
z-management 0.090***(0.025)
z-operations 0.071*** 0.026(0.022) (0.030)
z-people 0.162*** 0.131***(0.037) (0.050)
Lagged test score 0.315*** 0.309*** 0.310*** 0.307*** 0.307***(0.018) (0.018) (0.018) (0.018) (0.018)
Observations 35964 35964 35964 35964 35964# schools 299 299 299 299 299
Panel B: with controls Public and private schools
(1) (2) (3) (4) (5)endlinescore
endlinescore
endlinescore
endlinescore
endlinescore
Private = 1 0.501*** 0.406*** 0.467*** 0.211** 0.241**(0.087) (0.087) (0.085) (0.099) (0.108)
Scholarship = 1 -0.258*** -0.278*** -0.271*** -0.295*** -0.294***(0.078) (0.077) (0.078) (0.073) (0.074)
z-management 0.092***(0.026)
z-operations 0.070*** 0.022(0.023) (0.028)
z-people 0.170*** 0.146***(0.036) (0.046)
Lagged test score 0.304*** 0.298*** 0.300*** 0.296*** 0.296***(0.018) (0.018) (0.018) (0.017) (0.017)
Observations 35964 35964 35964 35964 35964# schools 299 299 299 299 299
Notes: Standard errors are clustered by school. The dependent variable student value added is esti-mated by using the residuals of a regression of the end-line test score on the baseline test score for eachstudent. z-management is the standardized overall management index. z-operations and z-people arethe standardized average scores of the operations questions and people management questions. Privaterefers to an indicator for private school, and scholarship is an indicator for whether the student receiveda scholarship in the Muralidharan and Sundararaman (2015) school choice experiment. Controls in-clude those listed in Table 2: student controls (indicators for female student, scheduled caste, parentsare literate, parents are manual laborers, and a household assets index), teacher controls (share ofteachers with a degree, share with teacher training, average teaching experience, average number ofwork days, head teacher teaching experience and head teacher education) and school controls (logof number of students, average share of female students, of students from scheduled castes, of literateparents and of laborer parents). Includes subject and year fixed effects.
App. 8
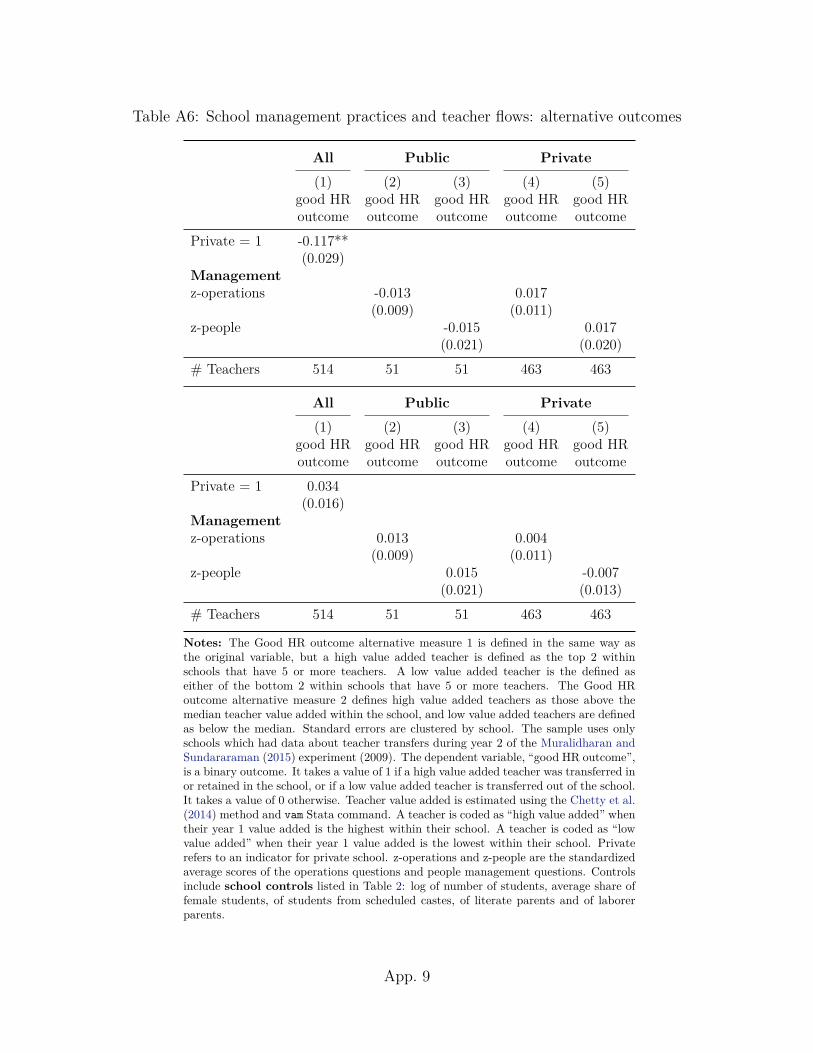
Table A6: School management practices and teacher flows: alternative outcomes
All Public Private
(1) (2) (3) (4) (5)good HRoutcome
good HRoutcome
good HRoutcome
good HRoutcome
good HRoutcome
Private = 1 -0.117**(0.029)
Managementz-operations -0.013 0.017
(0.009) (0.011)z-people -0.015 0.017
(0.021) (0.020)# Teachers 514 51 51 463 463
All Public Private
(1) (2) (3) (4) (5)good HRoutcome
good HRoutcome
good HRoutcome
good HRoutcome
good HRoutcome
Private = 1 0.034(0.016)
Managementz-operations 0.013 0.004
(0.009) (0.011)z-people 0.015 -0.007
(0.021) (0.013)# Teachers 514 51 51 463 463
Notes: The Good HR outcome alternative measure 1 is defined in the same way asthe original variable, but a high value added teacher is defined as the top 2 withinschools that have 5 or more teachers. A low value added teacher is the defined aseither of the bottom 2 within schools that have 5 or more teachers. The Good HRoutcome alternative measure 2 defines high value added teachers as those above themedian teacher value added within the school, and low value added teachers are definedas below the median. Standard errors are clustered by school. The sample uses onlyschools which had data about teacher transfers during year 2 of the Muralidharan andSundararaman (2015) experiment (2009). The dependent variable, “good HR outcome”,is a binary outcome. It takes a value of 1 if a high value added teacher was transferred inor retained in the school, or if a low value added teacher is transferred out of the school.It takes a value of 0 otherwise. Teacher value added is estimated using the Chetty et al.(2014) method and vam Stata command. A teacher is coded as “high value added” whentheir year 1 value added is the highest within their school. A teacher is coded as “lowvalue added” when their year 1 value added is the lowest within their school. Privaterefers to an indicator for private school. z-operations and z-people are the standardizedaverage scores of the operations questions and people management questions. Controlsinclude school controls listed in Table 2: log of number of students, average share offemale students, of students from scheduled castes, of literate parents and of laborerparents.
App. 9
B Data Appendix
B.1 World Management Survey sampling weightsThe World Management Survey average scores used in this paper include survey weights.These are calculated as the inverse probability of being interviewed on log of number ofstudents, public status, and population density by state, province, or NUTS 2 region as ameasure of location). Samples include both public and private schools, with the exceptionof Colombia where data is only available to public primary schools.
B.2 The Development World Management Survey methodologyIn original WMS, the survey is administered by highly trained interviewers who ask a seriesof scripted and unscripted questions until they gather all the information they need to scorethe practices. The interviewers are generally graduate students in business and economicsprograms from highly ranked institutions, and undergo a week-long intensive WMS trainingprogram. This program teaches them how to ask the WMS questions in open-ended format,and how to arrive at a score that combines the various facets of a manager’s answer into onescore. In the D-WMS, however, we remove a large portion of the discretion interviewers haveby separating the three types of questions and requiring separate scores for each sub-question.This reduces measurement error as the interviewers have an almost-checkbox style grid, andis more appropriate for settings where very high quality interviewers are not available or notfeasible due to budget constraints. Below we include all the original WMS topics and thethree factors (implementation, usage, monitoring) along with the example questions askedby the interviewers.
B.2.1 Scoring example and interpretation
We use an example to illustrate the type of information included in the interviews andcodified in the survey, and how the expansions aid in identifying bottlenecks. On the topicof data-driven student transition to higher grades, principals are asked open-ended questionssuch as “What type of information about the individual students is available to teachers atthe beginning of the academic year?” and “What do you think are the main points oftransition/promotion for students and how is this communicated to your teachers?”. Higherscores are awarded to principals who can discuss an array of data relevant in their school andcontext, and ensure the information is collected regularly, communicated to teachers well,and used to inform student transitions.
For the first factor, implementation, a school would receive a score of 1 if there is no dataavailable. A score of 1.5 means that the school has some limited information for students,and while it may be of lower quality relative to official examinations, still constitutes a betterpractice than having nothing at all. A score of a 2 means there is some data is available, suchas end-of-year examinations and teacher impressions. A score of a 3 means the schools usesa range of data, including results for quarterly, mid-year and end of-the year examinationsplus health information, teacher impressions and baseline tests. The score of 2.5 would sit
App. 10
somewhere in the middle, if the school has a range of academic and behaviour data (animprovement on simply collecting end-of-year examinations or teacher impressions) but notquite a large enough range collected over multiple instances with different instruments.
For the second factor, usage, a score of 1 means that the principal does not understandbasic transition points for students (such as progress between units). A score of 1.5 recognizesthat the principal has a personal understanding of these points but does not communicatewith teachers about these points. A score of 2 means that the principal internalizes the im-portant transition points but also communicates with teachers to build shared understanding,though very informally and infrequently. A score of 2.5 means that this communication ismore regular, albeit still informal. For a score of 3 or above, the understanding of criticaltransitions needs to be formally acknowledged and understood by the principal as well asthe main teaching staff.
For the third factor, monitoring, a score of 1 would imply teachers have no knowledge ofprior achievement, and thus cannot consider this data in critical transitions. A score of 1.5means teachers are at least given progress cards, but no real action is taken. A score of 2means teachers are made aware of past performance and there is an expectation that issuesshould be addressed, but the approach is unstructured. A score of 2.5 is awarded when thereis an informal communication structure in place to link prior teachers and inform criticaltransition moments. For a score of 3 or above, the school needs to have a process to formallyverify student outcomes at critical stages, regularly, and have a structured way to addressweaknesses.
Overall, a score of a 3 or below for this topic means performance data is not be recordedsystematically with a range of tools that would allow for a more thorough understanding ofa studentâs strengths and weaknesses. Further it is not integrated or easy to use or sharedwith a range of stakeholders. The importance of the D-WMS for measurement in our contextstems from nearly all public schools having scores below 3.
App. 11
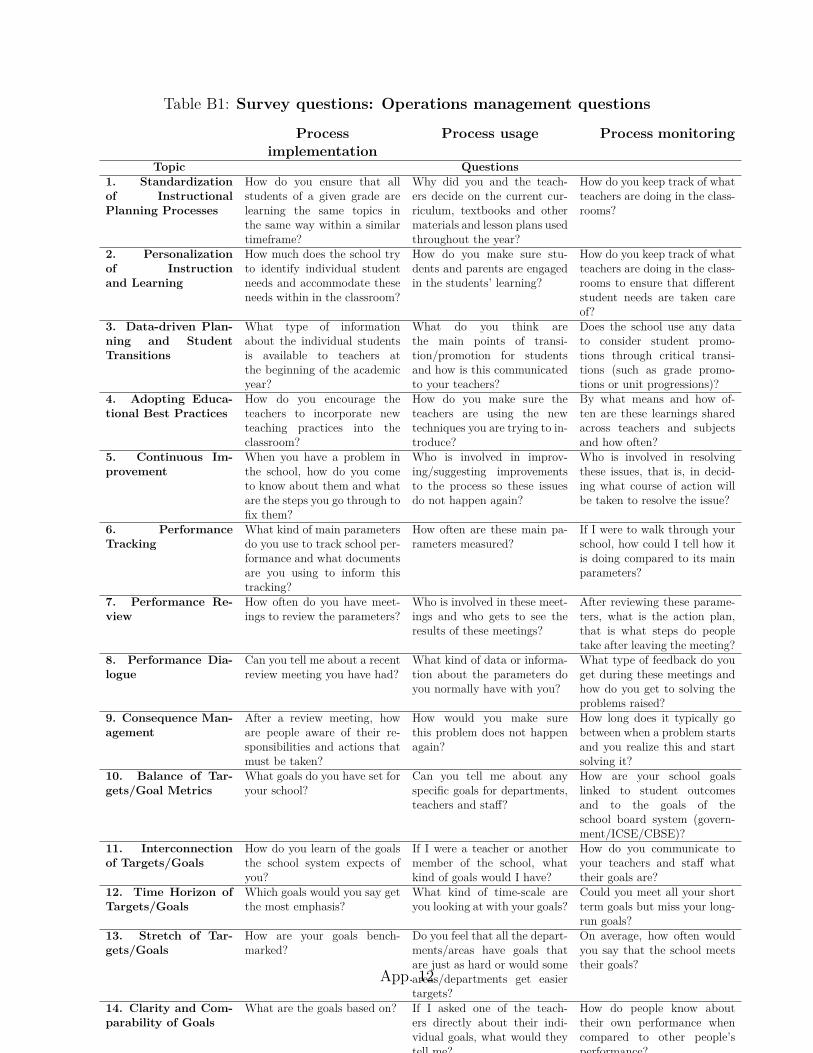
Table B1: Survey questions: Operations management questions
Processimplementation
Process usage Process monitoring
Topic Questions1. Standardizationof InstructionalPlanning Processes
How do you ensure that allstudents of a given grade arelearning the same topics inthe same way within a similartimeframe?
Why did you and the teach-ers decide on the current cur-riculum, textbooks and othermaterials and lesson plans usedthroughout the year?
How do you keep track of whatteachers are doing in the class-rooms?
2. Personalizationof Instructionand Learning
How much does the school tryto identify individual studentneeds and accommodate theseneeds within in the classroom?
How do you make sure stu-dents and parents are engagedin the students’ learning?
How do you keep track of whatteachers are doing in the class-rooms to ensure that differentstudent needs are taken careof?
3. Data-driven Plan-ning and StudentTransitions
What type of informationabout the individual studentsis available to teachers atthe beginning of the academicyear?
What do you think arethe main points of transi-tion/promotion for studentsand how is this communicatedto your teachers?
Does the school use any datato consider student promo-tions through critical transi-tions (such as grade promo-tions or unit progressions)?
4. Adopting Educa-tional Best Practices
How do you encourage theteachers to incorporate newteaching practices into theclassroom?
How do you make sure theteachers are using the newtechniques you are trying to in-troduce?
By what means and how of-ten are these learnings sharedacross teachers and subjectsand how often?
5. Continuous Im-provement
When you have a problem inthe school, how do you cometo know about them and whatare the steps you go through tofix them?
Who is involved in improv-ing/suggesting improvementsto the process so these issuesdo not happen again?
Who is involved in resolvingthese issues, that is, in decid-ing what course of action willbe taken to resolve the issue?
6. PerformanceTracking
What kind of main parametersdo you use to track school per-formance and what documentsare you using to inform thistracking?
How often are these main pa-rameters measured?
If I were to walk through yourschool, how could I tell how itis doing compared to its mainparameters?
7. Performance Re-view
How often do you have meet-ings to review the parameters?
Who is involved in these meet-ings and who gets to see theresults of these meetings?
After reviewing these parame-ters, what is the action plan,that is what steps do peopletake after leaving the meeting?
8. Performance Dia-logue
Can you tell me about a recentreview meeting you have had?
What kind of data or informa-tion about the parameters doyou normally have with you?
What type of feedback do youget during these meetings andhow do you get to solving theproblems raised?
9. Consequence Man-agement
After a review meeting, howare people aware of their re-sponsibilities and actions thatmust be taken?
How would you make surethis problem does not happenagain?
How long does it typically gobetween when a problem startsand you realize this and startsolving it?
10. Balance of Tar-gets/Goal Metrics
What goals do you have set foryour school?
Can you tell me about anyspecific goals for departments,teachers and staff?
How are your school goalslinked to student outcomesand to the goals of theschool board system (govern-ment/ICSE/CBSE)?
11. Interconnectionof Targets/Goals
How do you learn of the goalsthe school system expects ofyou?
If I were a teacher or anothermember of the school, whatkind of goals would I have?
How do you communicate toyour teachers and staff whattheir goals are?
12. Time Horizon ofTargets/Goals
Which goals would you say getthe most emphasis?
What kind of time-scale areyou looking at with your goals?
Could you meet all your shortterm goals but miss your long-run goals?
13. Stretch of Tar-gets/Goals
How are your goals bench-marked?
Do you feel that all the depart-ments/areas have goals thatare just as hard or would someareas/departments get easiertargets?
On average, how often wouldyou say that the school meetstheir goals?
14. Clarity and Com-parability of Goals
What are the goals based on? If I asked one of the teach-ers directly about their indi-vidual goals, what would theytell me?
How do people know abouttheir own performance whencompared to other people’sperformance?
App. 12
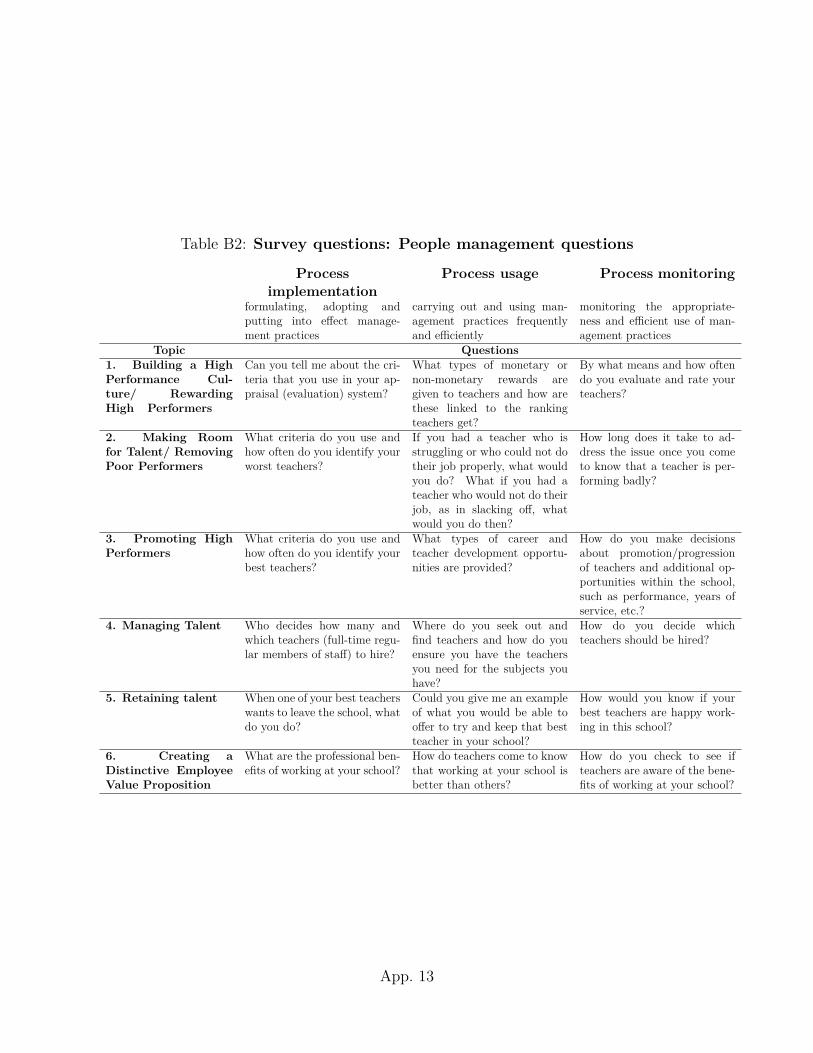
Table B2: Survey questions: People management questions
Processimplementation
Process usage Process monitoring
formulating, adopting andputting into effect manage-ment practices
carrying out and using man-agement practices frequentlyand efficiently
monitoring the appropriate-ness and efficient use of man-agement practices
Topic Questions1. Building a HighPerformance Cul-ture/ RewardingHigh Performers
Can you tell me about the cri-teria that you use in your ap-praisal (evaluation) system?
What types of monetary ornon-monetary rewards aregiven to teachers and how arethese linked to the rankingteachers get?
By what means and how oftendo you evaluate and rate yourteachers?
2. Making Roomfor Talent/ RemovingPoor Performers
What criteria do you use andhow often do you identify yourworst teachers?
If you had a teacher who isstruggling or who could not dotheir job properly, what wouldyou do? What if you had ateacher who would not do theirjob, as in slacking off, whatwould you do then?
How long does it take to ad-dress the issue once you cometo know that a teacher is per-forming badly?
3. Promoting HighPerformers
What criteria do you use andhow often do you identify yourbest teachers?
What types of career andteacher development opportu-nities are provided?
How do you make decisionsabout promotion/progressionof teachers and additional op-portunities within the school,such as performance, years ofservice, etc.?
4. Managing Talent Who decides how many andwhich teachers (full-time regu-lar members of staff) to hire?
Where do you seek out andfind teachers and how do youensure you have the teachersyou need for the subjects youhave?
How do you decide whichteachers should be hired?
5. Retaining talent When one of your best teacherswants to leave the school, whatdo you do?
Could you give me an exampleof what you would be able tooffer to try and keep that bestteacher in your school?
How would you know if yourbest teachers are happy work-ing in this school?
6. Creating aDistinctive EmployeeValue Proposition
What are the professional ben-efits of working at your school?
How do teachers come to knowthat working at your school isbetter than others?
How do you check to see ifteachers are aware of the bene-fits of working at your school?
App. 13
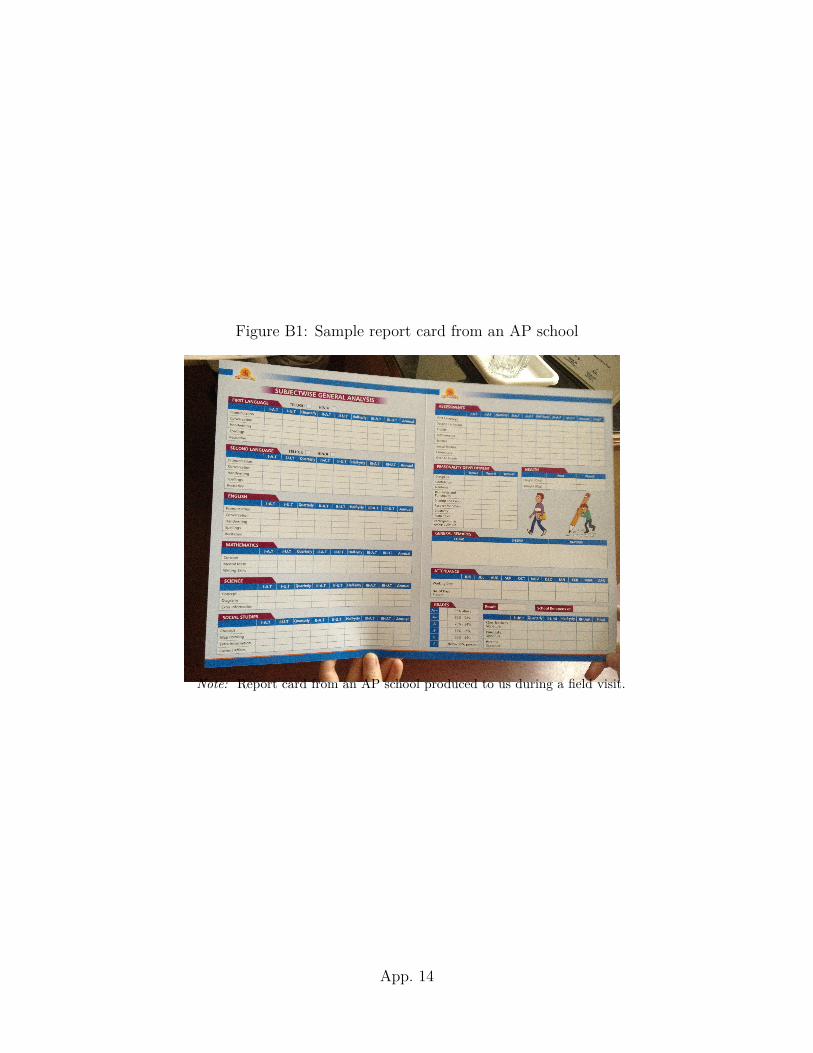
Figure B1: Sample report card from an AP school
Note: Report card from an AP school produced to us during a field visit.
App. 14
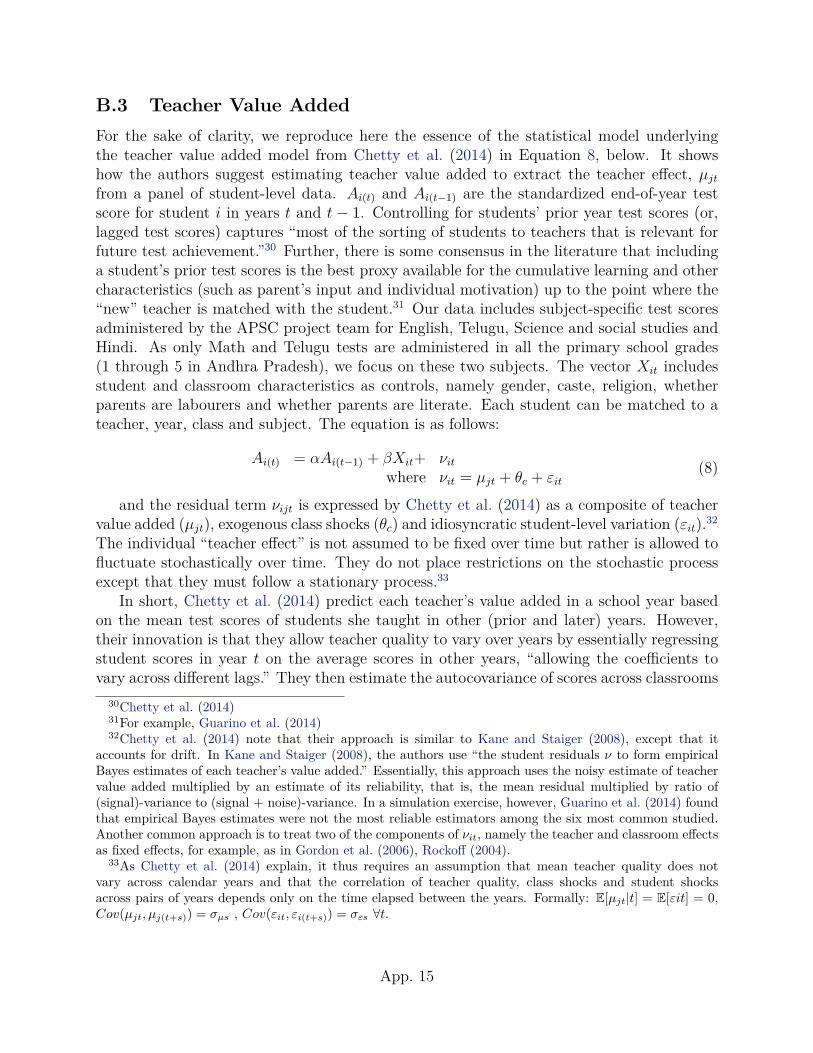
B.3 Teacher Value AddedFor the sake of clarity, we reproduce here the essence of the statistical model underlyingthe teacher value added model from Chetty et al. (2014) in Equation 8, below. It showshow the authors suggest estimating teacher value added to extract the teacher effect, µjt
from a panel of student-level data. Ai(t) and Ai(t−1) are the standardized end-of-year testscore for student i in years t and t − 1. Controlling for students’ prior year test scores (or,lagged test scores) captures “most of the sorting of students to teachers that is relevant forfuture test achievement.”30 Further, there is some consensus in the literature that includinga student’s prior test scores is the best proxy available for the cumulative learning and othercharacteristics (such as parent’s input and individual motivation) up to the point where the“new” teacher is matched with the student.31 Our data includes subject-specific test scoresadministered by the APSC project team for English, Telugu, Science and social studies andHindi. As only Math and Telugu tests are administered in all the primary school grades(1 through 5 in Andhra Pradesh), we focus on these two subjects. The vector Xit includesstudent and classroom characteristics as controls, namely gender, caste, religion, whetherparents are labourers and whether parents are literate. Each student can be matched to ateacher, year, class and subject. The equation is as follows:
Ai(t) = αAi(t−1) + βXit+ νit
where νit = µjt + θc + εit(8)
and the residual term νijt is expressed by Chetty et al. (2014) as a composite of teachervalue added (µjt), exogenous class shocks (θc) and idiosyncratic student-level variation (εit).32
The individual “teacher effect” is not assumed to be fixed over time but rather is allowed tofluctuate stochastically over time. They do not place restrictions on the stochastic processexcept that they must follow a stationary process.33
In short, Chetty et al. (2014) predict each teacher’s value added in a school year basedon the mean test scores of students she taught in other (prior and later) years. However,their innovation is that they allow teacher quality to vary over years by essentially regressingstudent scores in year t on the average scores in other years, “allowing the coefficients tovary across different lags.” They then estimate the autocovariance of scores across classrooms
30Chetty et al. (2014)31For example, Guarino et al. (2014)32Chetty et al. (2014) note that their approach is similar to Kane and Staiger (2008), except that it
accounts for drift. In Kane and Staiger (2008), the authors use “the student residuals ν to form empiricalBayes estimates of each teacher’s value added.” Essentially, this approach uses the noisy estimate of teachervalue added multiplied by an estimate of its reliability, that is, the mean residual multiplied by ratio of(signal)-variance to (signal + noise)-variance. In a simulation exercise, however, Guarino et al. (2014) foundthat empirical Bayes estimates were not the most reliable estimators among the six most common studied.Another common approach is to treat two of the components of νit, namely the teacher and classroom effectsas fixed effects, for example, as in Gordon et al. (2006), Rockoff (2004).
33As Chetty et al. (2014) explain, it thus requires an assumption that mean teacher quality does notvary across calendar years and that the correlation of teacher quality, class shocks and student shocksacross pairs of years depends only on the time elapsed between the years. Formally: E[µjt|t] = E[εit] = 0,Cov(µjt, µj(t+s)) = σµs , Cov(εit, εi(t+s)) = σεs ∀t.
App. 15
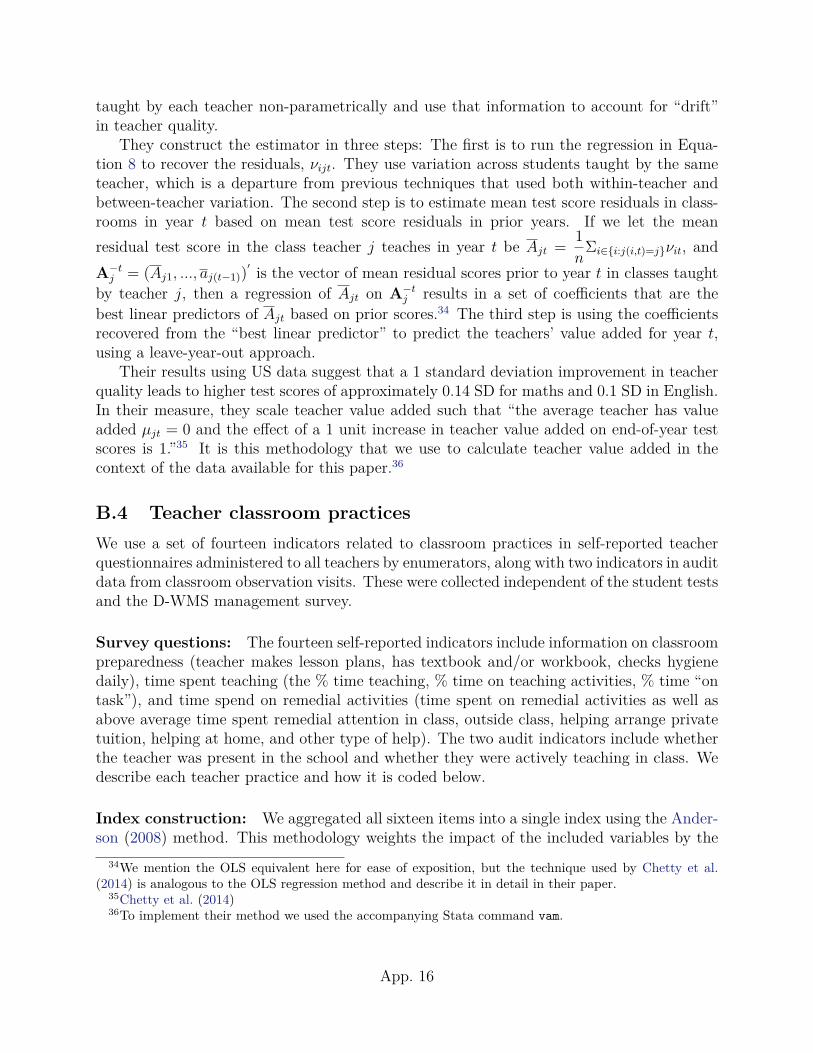
taught by each teacher non-parametrically and use that information to account for “drift”in teacher quality.
They construct the estimator in three steps: The first is to run the regression in Equa-tion 8 to recover the residuals, νijt. They use variation across students taught by the sameteacher, which is a departure from previous techniques that used both within-teacher andbetween-teacher variation. The second step is to estimate mean test score residuals in class-rooms in year t based on mean test score residuals in prior years. If we let the meanresidual test score in the class teacher j teaches in year t be Ajt = 1
nΣi∈{i:j(i,t)=j}νit, and
A−tj = (Aj1, ..., aj(t−1))
′ is the vector of mean residual scores prior to year t in classes taughtby teacher j, then a regression of Ajt on A−t
j results in a set of coefficients that are thebest linear predictors of Ajt based on prior scores.34 The third step is using the coefficientsrecovered from the “best linear predictor” to predict the teachers’ value added for year t,using a leave-year-out approach.
Their results using US data suggest that a 1 standard deviation improvement in teacherquality leads to higher test scores of approximately 0.14 SD for maths and 0.1 SD in English.In their measure, they scale teacher value added such that “the average teacher has valueadded µjt = 0 and the effect of a 1 unit increase in teacher value added on end-of-year testscores is 1.”35 It is this methodology that we use to calculate teacher value added in thecontext of the data available for this paper.36
B.4 Teacher classroom practicesWe use a set of fourteen indicators related to classroom practices in self-reported teacherquestionnaires administered to all teachers by enumerators, along with two indicators in auditdata from classroom observation visits. These were collected independent of the student testsand the D-WMS management survey.
Survey questions: The fourteen self-reported indicators include information on classroompreparedness (teacher makes lesson plans, has textbook and/or workbook, checks hygienedaily), time spent teaching (the % time teaching, % time on teaching activities, % time “ontask”), and time spend on remedial activities (time spent on remedial activities as well asabove average time spent remedial attention in class, outside class, helping arrange privatetuition, helping at home, and other type of help). The two audit indicators include whetherthe teacher was present in the school and whether they were actively teaching in class. Wedescribe each teacher practice and how it is coded below.
Index construction: We aggregated all sixteen items into a single index using the Ander-son (2008) method. This methodology weights the impact of the included variables by the
34We mention the OLS equivalent here for ease of exposition, but the technique used by Chetty et al.(2014) is analogous to the OLS regression method and describe it in detail in their paper.
35Chetty et al. (2014)36To implement their method we used the accompanying Stata command vam.
App. 16
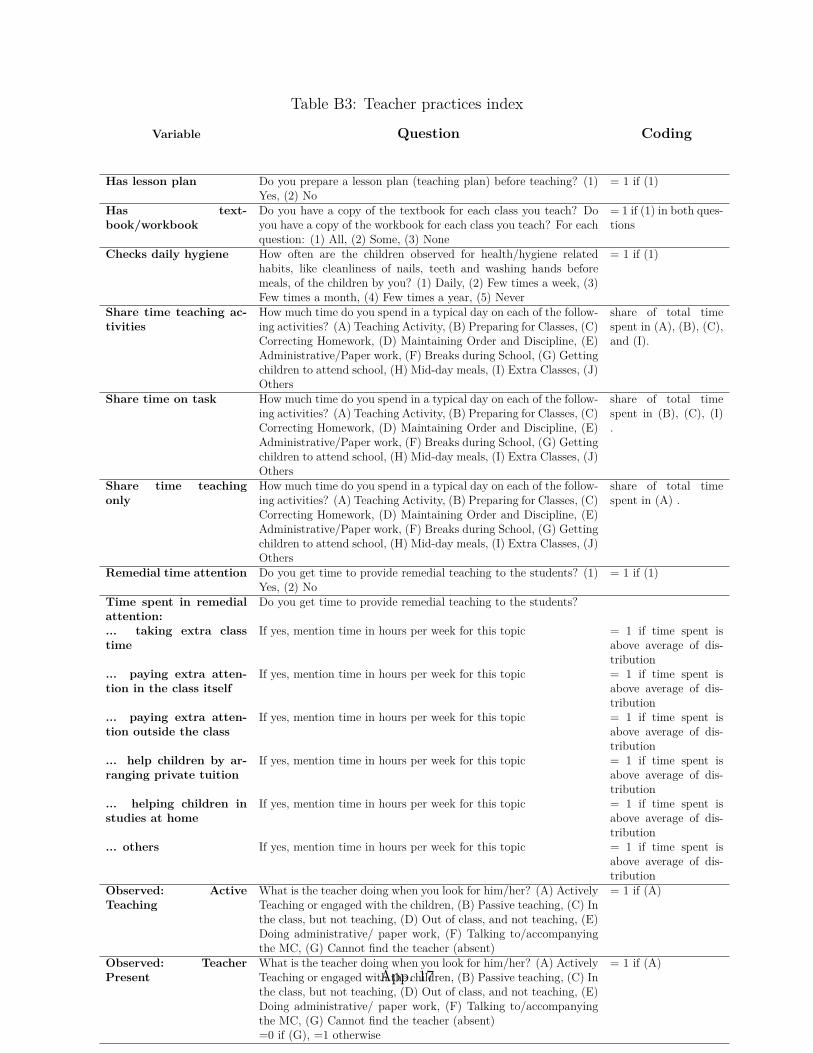
Table B3: Teacher practices index
Variable Question Coding
Has lesson plan Do you prepare a lesson plan (teaching plan) before teaching? (1)Yes, (2) No
= 1 if (1)
Has text-book/workbook
Do you have a copy of the textbook for each class you teach? Doyou have a copy of the workbook for each class you teach? For eachquestion: (1) All, (2) Some, (3) None
= 1 if (1) in both ques-tions
Checks daily hygiene How often are the children observed for health/hygiene relatedhabits, like cleanliness of nails, teeth and washing hands beforemeals, of the children by you? (1) Daily, (2) Few times a week, (3)Few times a month, (4) Few times a year, (5) Never
= 1 if (1)
Share time teaching ac-tivities
How much time do you spend in a typical day on each of the follow-ing activities? (A) Teaching Activity, (B) Preparing for Classes, (C)Correcting Homework, (D) Maintaining Order and Discipline, (E)Administrative/Paper work, (F) Breaks during School, (G) Gettingchildren to attend school, (H) Mid-day meals, (I) Extra Classes, (J)Others
share of total timespent in (A), (B), (C),and (I).
Share time on task How much time do you spend in a typical day on each of the follow-ing activities? (A) Teaching Activity, (B) Preparing for Classes, (C)Correcting Homework, (D) Maintaining Order and Discipline, (E)Administrative/Paper work, (F) Breaks during School, (G) Gettingchildren to attend school, (H) Mid-day meals, (I) Extra Classes, (J)Others
share of total timespent in (B), (C), (I).
Share time teachingonly
How much time do you spend in a typical day on each of the follow-ing activities? (A) Teaching Activity, (B) Preparing for Classes, (C)Correcting Homework, (D) Maintaining Order and Discipline, (E)Administrative/Paper work, (F) Breaks during School, (G) Gettingchildren to attend school, (H) Mid-day meals, (I) Extra Classes, (J)Others
share of total timespent in (A) .
Remedial time attention Do you get time to provide remedial teaching to the students? (1)Yes, (2) No
= 1 if (1)
Time spent in remedialattention:
Do you get time to provide remedial teaching to the students?
... taking extra classtime
If yes, mention time in hours per week for this topic = 1 if time spent isabove average of dis-tribution
... paying extra atten-tion in the class itself
If yes, mention time in hours per week for this topic = 1 if time spent isabove average of dis-tribution
... paying extra atten-tion outside the class
If yes, mention time in hours per week for this topic = 1 if time spent isabove average of dis-tribution
... help children by ar-ranging private tuition
If yes, mention time in hours per week for this topic = 1 if time spent isabove average of dis-tribution
... helping children instudies at home
If yes, mention time in hours per week for this topic = 1 if time spent isabove average of dis-tribution
... others If yes, mention time in hours per week for this topic = 1 if time spent isabove average of dis-tribution
Observed: ActiveTeaching
What is the teacher doing when you look for him/her? (A) ActivelyTeaching or engaged with the children, (B) Passive teaching, (C) Inthe class, but not teaching, (D) Out of class, and not teaching, (E)Doing administrative/ paper work, (F) Talking to/accompanyingthe MC, (G) Cannot find the teacher (absent)
= 1 if (A)
Observed: TeacherPresent
What is the teacher doing when you look for him/her? (A) ActivelyTeaching or engaged with the children, (B) Passive teaching, (C) Inthe class, but not teaching, (D) Out of class, and not teaching, (E)Doing administrative/ paper work, (F) Talking to/accompanyingthe MC, (G) Cannot find the teacher (absent)
= 1 if (A)
=0 if (G), =1 otherwise
App. 17
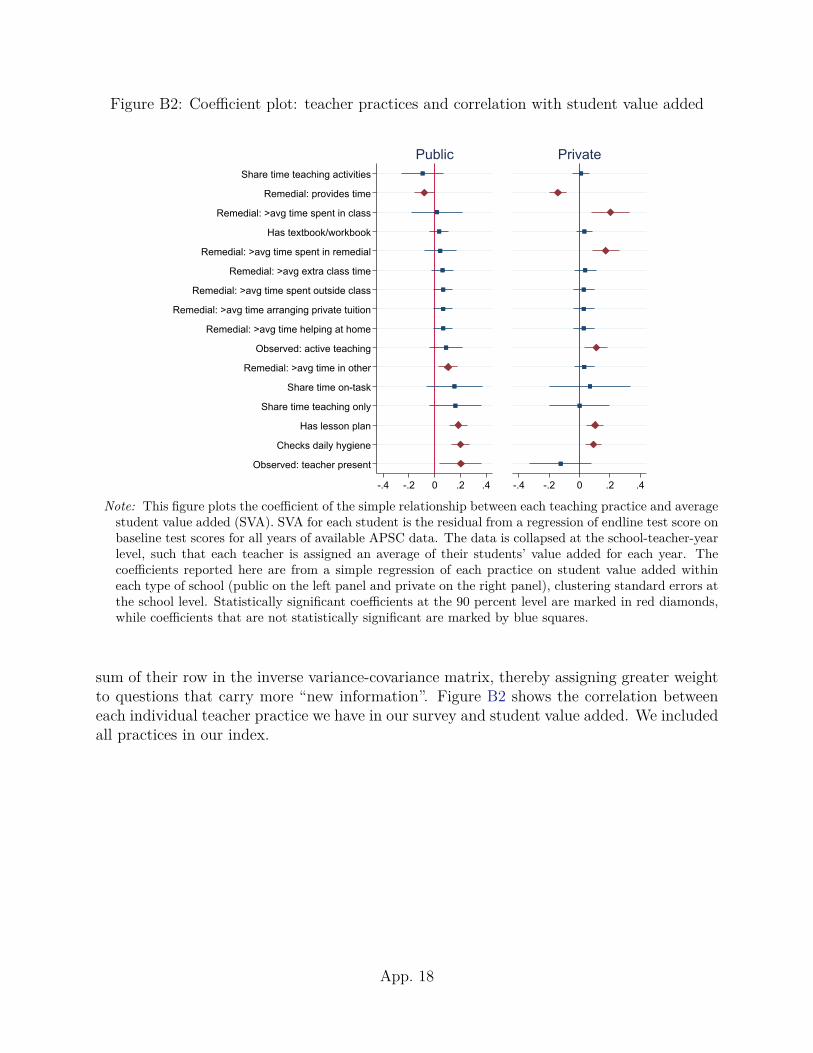
Figure B2: Coefficient plot: teacher practices and correlation with student value added
Share time teaching activities
Remedial: provides time
Remedial: >avg time spent in class
Has textbook/workbook
Remedial: >avg time spent in remedial
Remedial: >avg extra class time
Remedial: >avg time spent outside class
Remedial: >avg time arranging private tuition
Remedial: >avg time helping at home
Observed: active teaching
Remedial: >avg time in other
Share time on-task
Share time teaching only
Has lesson plan
Checks daily hygiene
Observed: teacher present
-.4 -.2 0 .2 .4
Public
-.4 -.2 0 .2 .4
Private
Note: This figure plots the coefficient of the simple relationship between each teaching practice and averagestudent value added (SVA). SVA for each student is the residual from a regression of endline test score onbaseline test scores for all years of available APSC data. The data is collapsed at the school-teacher-yearlevel, such that each teacher is assigned an average of their students’ value added for each year. Thecoefficients reported here are from a simple regression of each practice on student value added withineach type of school (public on the left panel and private on the right panel), clustering standard errors atthe school level. Statistically significant coefficients at the 90 percent level are marked in red diamonds,while coefficients that are not statistically significant are marked by blue squares.
sum of their row in the inverse variance-covariance matrix, thereby assigning greater weightto questions that carry more “new information”. Figure B2 shows the correlation betweeneach individual teacher practice we have in our survey and student value added. We includedall practices in our index.
App. 18