Performance analysis of on-demand pressurized …ewra.net/wuj/pdf/WUJ_2017_16_04.pdf · Performance...
17
Water Utility Journal 16: 39-55, 2017. © 2017 E.W. Publications Performance analysis of on-demand pressurized irrigation networks – Case study in Greece P. Stamouli 1* , N. Dercas 2 and E. Baltas 1 1 Laboratory of Hydrology and Water Resources Utilization, School of Civil Engineering, National Technical University οf Athens, 5 Iroon Polytechniou St., Zografou 15780 Athens, Greece 2 Laboratory of Agricultural Hydraulics, Department of Natural Resources Management and Agricultural Engineering, Agricultural University of Athens, 75 Iera Odos St., 11855 Athens, Greece * e-mail: [email protected] Abstract: In this paper, the implementation of performance analysis in collective pressurized irrigation networks is examined, as a means of testing for their proper operation. For this purpose, a performance analysis of an existing collective pressurized irrigation sub-network operating on demand, located in the Prefecture of Aitoloakarnania (Greece), has been carried out by applying the proposed methodology with the use of an established in analyzing the hydraulic adequacy of pressurized systems model, the model COPAM (Combined Optimization and Performance Analysis Model). This model provides a general assessment of the networks’ response to demand and moreover evaluates its local hydraulic behavior at the hydrants level. Moreover, in order to investigate the impact of a false estimation of the network’s parameters on the model results, a sensitivity analysis has been performed. Key words: irrigation networks, pressurized, on-demand operation, performance analysis, COPAM 1. INTRODUCTION Over the last decades, a wide expansion has been noticed on the use of collective pressurized irrigation networks operating on demand. This certain delivery schedule offers a greater potential profit than other types of irrigation schedules and gives a great flexibility to farmers who can manage water in the best way and according to their needs (Lamaddalena and Sagardoy, 2000). This way of delivering water within an irrigation system, imports a great uncertainty as far as the calculation of the discharges flowing into the network is concerned. For both designers and managers of the network, it is not feasible to determine the exact number and position of the hydrants operating simultaneously at a specific moment. As a result, the performance of the system cannot be determined in advance for various operational conditions. And this is due to the difference between these conditions and those defined during the designing stage, corresponding to the upstream discharge for the peak period (usually the discharge estimated with Clément’s first formula, Q Clém ) and the optimized piezometric head at the upstream piezometric head of the network, Z opt . Aged networks with low or insufficient maintenance, great volumes of consumption, water losses and unlimited interferences by the users create a variety of operational problems and increase the aforementioned uncertainty. In order to overcome these problems in an effective way and eliminate uncertainty, the managers of the networks should have a representative view of the latter based on a reasoned assessment of their operational condition, which requires a reliable simulation of their hydraulic behavior including real values of the parameters involved. The solution to this problem is offered by the development of computer-based simulation models. Based on the great capability of computers to generate randomly many situations, which can be analyzed statistically, these models can provide clear indications of the network performance under varying conditions, thus being a valuable tool in the hands of both managers and designers of the network. The process of using computer models to analyze performance capabilities and to define the
Transcript of Performance analysis of on-demand pressurized …ewra.net/wuj/pdf/WUJ_2017_16_04.pdf · Performance...
Water Utility Journal 16: 39-55, 2017. © 2017 E.W. Publications
Performance analysis of on-demand pressurized irrigation networks – Case study in Greece
P. Stamouli1*, N. Dercas2 and E. Baltas1
1 Laboratory of Hydrology and Water Resources Utilization, School of Civil Engineering, National Technical University οf Athens, 5 Iroon Polytechniou St., Zografou 15780 Athens, Greece 2 Laboratory of Agricultural Hydraulics, Department of Natural Resources Management and Agricultural Engineering, Agricultural University of Athens, 75 Iera Odos St., 11855 Athens, Greece * e-mail: [email protected]
Abstract: In this paper, the implementation of performance analysis in collective pressurized irrigation networks is examined, as a means of testing for their proper operation. For this purpose, a performance analysis of an existing collective pressurized irrigation sub-network operating on demand, located in the Prefecture of Aitoloakarnania (Greece), has been carried out by applying the proposed methodology with the use of an established in analyzing the hydraulic adequacy of pressurized systems model, the model COPAM (Combined Optimization and Performance Analysis Model). This model provides a general assessment of the networks’ response to demand and moreover evaluates its local hydraulic behavior at the hydrants level. Moreover, in order to investigate the impact of a false estimation of the network’s parameters on the model results, a sensitivity analysis has been performed.
Key words: irrigation networks, pressurized, on-demand operation, performance analysis, COPAM
1. INTRODUCTION
Over the last decades, a wide expansion has been noticed on the use of collective pressurized irrigation networks operating on demand. This certain delivery schedule offers a greater potential profit than other types of irrigation schedules and gives a great flexibility to farmers who can manage water in the best way and according to their needs (Lamaddalena and Sagardoy, 2000). This way of delivering water within an irrigation system, imports a great uncertainty as far as the calculation of the discharges flowing into the network is concerned. For both designers and managers of the network, it is not feasible to determine the exact number and position of the hydrants operating simultaneously at a specific moment. As a result, the performance of the system cannot be determined in advance for various operational conditions. And this is due to the difference between these conditions and those defined during the designing stage, corresponding to the upstream discharge for the peak period (usually the discharge estimated with Clément’s first formula, QClém) and the optimized piezometric head at the upstream piezometric head of the network, Zopt.
Aged networks with low or insufficient maintenance, great volumes of consumption, water losses and unlimited interferences by the users create a variety of operational problems and increase the aforementioned uncertainty. In order to overcome these problems in an effective way and eliminate uncertainty, the managers of the networks should have a representative view of the latter based on a reasoned assessment of their operational condition, which requires a reliable simulation of their hydraulic behavior including real values of the parameters involved.
The solution to this problem is offered by the development of computer-based simulation models. Based on the great capability of computers to generate randomly many situations, which can be analyzed statistically, these models can provide clear indications of the network performance under varying conditions, thus being a valuable tool in the hands of both managers and designers of the network.
The process of using computer models to analyze performance capabilities and to define the
40 P. Stamouli et al.
system requirements necessary to meet system design standards for pressure and/or discharge is known as irrigation systems analysis.
There are generally two approaches followed in the process of performance analysis. The first one provides general information on the network performance while the second one gives more detailed and precise information relating to the operational yield of each hydrant.
To this end, a performance analysis of an existing Greek pressurized network operating on demand has been carried out, using the model COPAM (Lamaddalena and Sagardoy, 2000) and applying the proposed methodology. Moreover, in order to investigate the impact of a false estimation of the network parameters on the model results, a sensitivity analysis has been performed.
2. METHODOLOGY
2.1 Performance analysis of collective irrigation networks operating on-demand
As already mentioned the necessity of the performance analysis of a collective irrigation network derives from the fact that the operational conditions are not stable but constantly change throughout the life of the irrigation network and differ from those that had initially been assumed during the design stage.
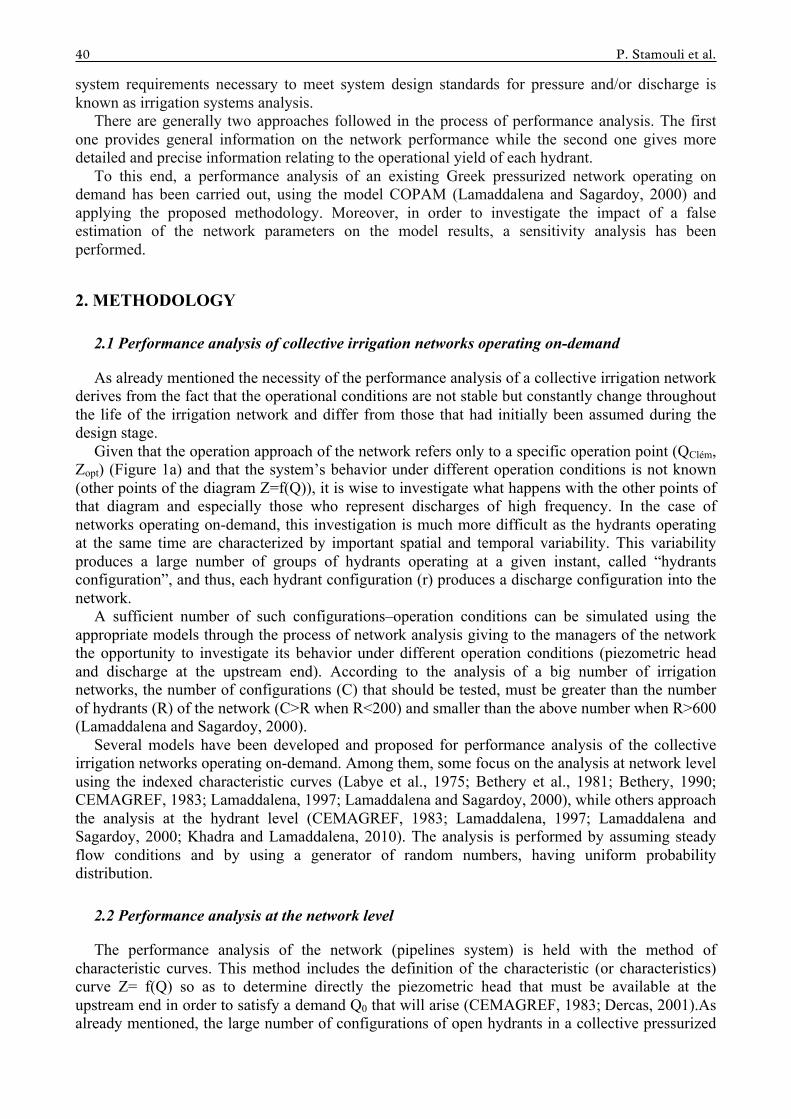
Given that the operation approach of the network refers only to a specific operation point (QClém, Zopt) (Figure 1a) and that the system’s behavior under different operation conditions is not known (other points of the diagram Z=f(Q)), it is wise to investigate what happens with the other points of that diagram and especially those who represent discharges of high frequency. In the case of networks operating on-demand, this investigation is much more difficult as the hydrants operating at the same time are characterized by important spatial and temporal variability. This variability produces a large number of groups of hydrants operating at a given instant, called “hydrants configuration”, and thus, each hydrant configuration (r) produces a discharge configuration into the network.
A sufficient number of such configurations–operation conditions can be simulated using the appropriate models through the process of network analysis giving to the managers of the network the opportunity to investigate its behavior under different operation conditions (piezometric head and discharge at the upstream end). According to the analysis of a big number of irrigation networks, the number of configurations (C) that should be tested, must be greater than the number of hydrants (R) of the network (C>R when R<200) and smaller than the above number when R>600 (Lamaddalena and Sagardoy, 2000).
Several models have been developed and proposed for performance analysis of the collective irrigation networks operating on-demand. Among them, some focus on the analysis at network level using the indexed characteristic curves (Labye et al., 1975; Bethery et al., 1981; Bethery, 1990; CEMAGREF, 1983; Lamaddalena, 1997; Lamaddalena and Sagardoy, 2000), while others approach the analysis at the hydrant level (CEMAGREF, 1983; Lamaddalena, 1997; Lamaddalena and Sagardoy, 2000; Khadra and Lamaddalena, 2010). The analysis is performed by assuming steady flow conditions and by using a generator of random numbers, having uniform probability distribution.
2.2 Performance analysis at the network level
The performance analysis of the network (pipelines system) is held with the method of characteristic curves. This method includes the definition of the characteristic (or characteristics) curve Z= f(Q) so as to determine directly the piezometric head that must be available at the upstream end in order to satisfy a demand Q0 that will arise (CEMAGREF, 1983; Dercas, 2001).As already mentioned, the large number of configurations of open hydrants in a collective pressurized
Water Utility Journal 16 (2017) 41
irrigation network operating on demand, leads to a respectively large number of characteristic curves (Z=f(Q)) which are representative of the network performance. In fact, the characteristic curves for such a network are as many as the number of all possible combinations of open hydrants during the network operation. The form of each of those curves depends on the open hydrants in the network (their quantity, position and nominal discharge)
2.2.1 Indexed characteristic curves method
The large number of configurations of open hydrants in a collective pressurized irrigation network operating on-demand leads to an equal (large) number of characteristic curves (Z=f(Q)) that are representative of the network’s performance (Figure 1b).
In order to take advantage of the information given by these curves, statistical methods are applied using only the most characteristic pairs of points (Zr.1, Qr.1) of these curves which correspond to the situation where all open hydrants of each configuration (r) deliver their nominal discharge. In particular, Za.1 is the piezometric head at the upstream end, needed when all the open hydrants of the configuration ‘a’ have their nominal discharge and Qa.1, is the corresponding discharge at the upstream end of the network. In that case, every configuration is satisfied and for all the operating hydrants (j) of each configuration (r) the following relationship is respected:
(1)
where Hj,r (m) represents the hydraulic head of the hydrant j within the configuration r, and Hmin (m) represents the minimum required head at each hydrant.
(a) (b)
Figure 1. (a) The upstream piezometric head Zopt needed when Q= QClém; (b) The characteristic curves of the network for various configurations (e.g., a, b, c) (source: CEMAGREF, 1983; Dercas, 2001).
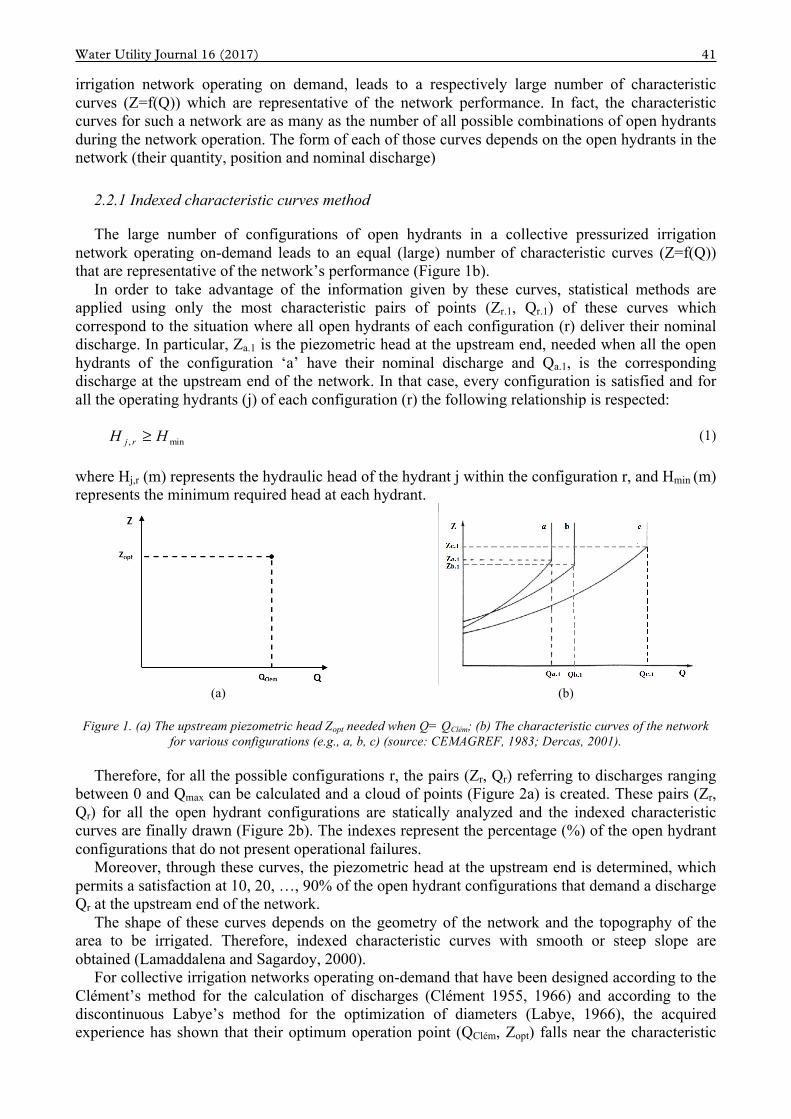
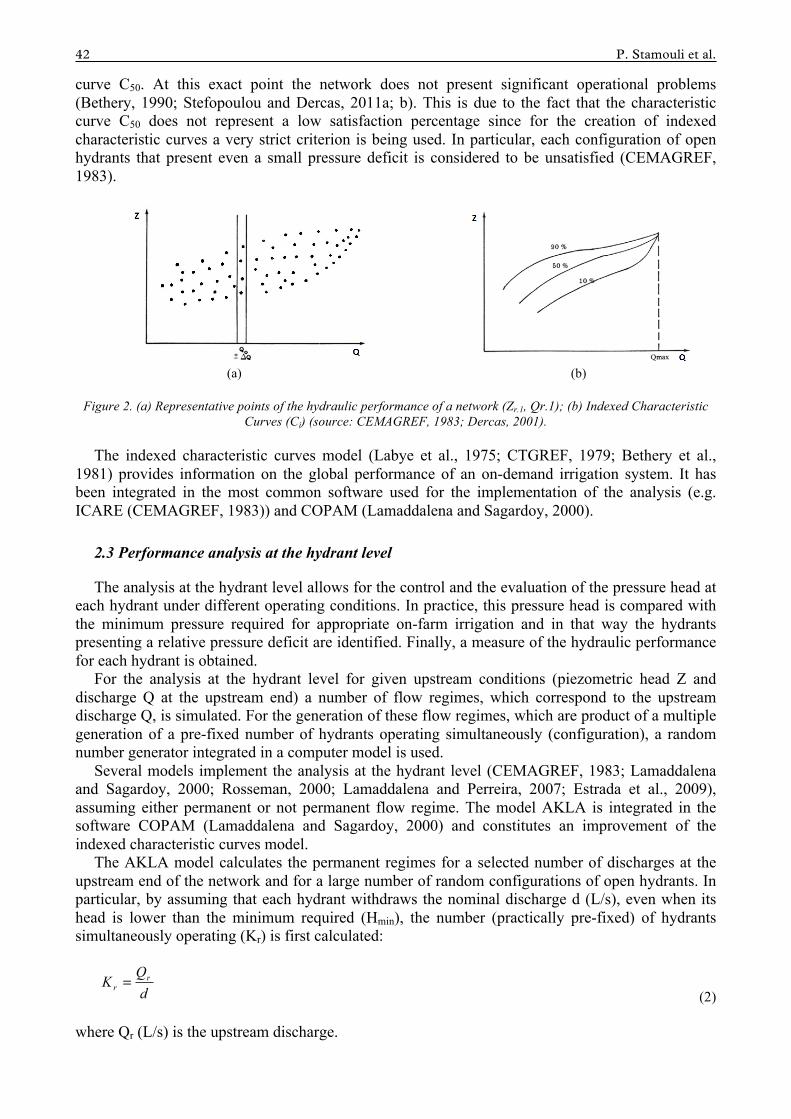
Therefore, for all the possible configurations r, the pairs (Zr, Qr) referring to discharges ranging between 0 and Qmax can be calculated and a cloud of points (Figure 2a) is created. These pairs (Zr, Qr) for all the open hydrant configurations are statically analyzed and the indexed characteristic curves are finally drawn (Figure 2b). The indexes represent the percentage (%) of the open hydrant configurations that do not present operational failures.
Moreover, through these curves, the piezometric head at the upstream end is determined, which permits a satisfaction at 10, 20, …, 90% of the open hydrant configurations that demand a discharge Qr at the upstream end of the network.
The shape of these curves depends on the geometry of the network and the topography of the area to be irrigated. Therefore, indexed characteristic curves with smooth or steep slope are obtained (Lamaddalena and Sagardoy, 2000).
For collective irrigation networks operating on-demand that have been designed according to the Clément’s method for the calculation of discharges (Clément 1955, 1966) and according to the discontinuous Labye’s method for the optimization of diameters (Labye, 1966), the acquired experience has shown that their optimum operation point (QClém, Zopt) falls near the characteristic
min, HH rj ≥
42 P. Stamouli et al.
curve C50. At this exact point the network does not present significant operational problems (Bethery, 1990; Stefopoulou and Dercas, 2011a; b). This is due to the fact that the characteristic curve C50 does not represent a low satisfaction percentage since for the creation of indexed characteristic curves a very strict criterion is being used. In particular, each configuration of open hydrants that present even a small pressure deficit is considered to be unsatisfied (CEMAGREF, 1983).
(a) (b)
Figure 2. (a) Representative points of the hydraulic performance of a network (Zr.1, Qr.1); (b) Indexed Characteristic Curves (Ci) (source: CEMAGREF, 1983; Dercas, 2001).
The indexed characteristic curves model (Labye et al., 1975; CTGREF, 1979; Bethery et al., 1981) provides information on the global performance of an on-demand irrigation system. It has been integrated in the most common software used for the implementation of the analysis (e.g. ICARE (CEMAGREF, 1983)) and COPAM (Lamaddalena and Sagardoy, 2000).
2.3 Performance analysis at the hydrant level
The analysis at the hydrant level allows for the control and the evaluation of the pressure head at each hydrant under different operating conditions. In practice, this pressure head is compared with the minimum pressure required for appropriate on-farm irrigation and in that way the hydrants presenting a relative pressure deficit are identified. Finally, a measure of the hydraulic performance for each hydrant is obtained.
For the analysis at the hydrant level for given upstream conditions (piezometric head Z and discharge Q at the upstream end) a number of flow regimes, which correspond to the upstream discharge Q, is simulated. For the generation of these flow regimes, which are product of a multiple generation of a pre-fixed number of hydrants operating simultaneously (configuration), a random number generator integrated in a computer model is used.
Several models implement the analysis at the hydrant level (CEMAGREF, 1983; Lamaddalena and Sagardoy, 2000; Rosseman, 2000; Lamaddalena and Perreira, 2007; Estrada et al., 2009), assuming either permanent or not permanent flow regime. The model AKLA is integrated in the software COPAM (Lamaddalena and Sagardoy, 2000) and constitutes an improvement of the indexed characteristic curves model.
The AKLA model calculates the permanent regimes for a selected number of discharges at the upstream end of the network and for a large number of random configurations of open hydrants. In particular, by assuming that each hydrant withdraws the nominal discharge d (L/s), even when its head is lower than the minimum required (Hmin), the number (practically pre-fixed) of hydrants simultaneously operating (Kr) is first calculated:
(2)
where Qr (L/s) is the upstream discharge.
dQK r
r =
Water Utility Journal 16 (2017) 43
It is obvious that the cumulative discharge of the totally open hydrants operating simultaneously in each configuration is equal to the fixed discharge at the upstream end of the network Qr. Later, by using a random number generator (having a uniform distribution function), the Kr hydrants operating simultaneously are randomly drawn (configuration).
Finally, the AKLA model computes the relative pressure at each hydrant which is defined as:
(3)
The head losses, hf (m), are computed using the Darcy equation:
(4)
where γ is the roughness parameter of Bazin (m0.5), D is the pipe diameter (m), Q (m3/s) is the discharge flowing in the pipe, and L (m) is the length of the pipe.
2.3.1 Reliability indicator
In terms of the analysis at the hydrant level, the Hashimoto reliability indicator is often used (Hashimoto, 1980; Hashimoto et al., 1982). This indicator allows to identify an irrigation system failure, and more particularly, defines the possibility of each hydrant to have its nominal head pressure, especially during the peak periods.
Let Xt be the random variable denoting the state of the system at time t. The possible values of Xt are shared into two sets: S, the set of all satisfactory outputs (success) and F the set of all unsatisfactory outputs (failure). At each instant t the system may fall in one of the above sets. Then, the reliability of a system is described by the probability a, where:
𝑎 = Prob 𝑋! ∈ 𝑆 (5)
Finally, the reliability of each hydrant j is calculated by the following equation:
(6)
where: Ihj,r = 1, if the hydrant j is open in the configuration r, Ihj,r = 0, if the hydrant j is closed in the configuration r, Ipj,r = 1, if the pressure head at the hydrant j, open in the configuration r, is higher than the minimum pressure head, Ipj,r = 0, if the pressure head at the hydrant j, open in the configuration r, is lower than the minimum pressure head; and C the total number of the generated configurations.
2.4 COPAM software
COPAM has been developed by FAO (Food and Agriculture Organization) and CHIEAM-Bari Institute, it operates on Windows environment (Lamaddalena and Sagardoy, 2000) and is free to users. That software simulates the network performance, and offers the capability for its analysis (at network and hydrant level) and economic optimization of its diameters. The analysis at the network level is carried out with the definition of its characteristic curves through the representative model
min
min,, H
HHH rj
rj
−=Δ
( ) LDQDhf5.0225.021000857.0 −−+= γ
∑
∑
=
== C
rrj
rj
C
rrj
j
Ih
IpIha
1,
,1
,
44 P. Stamouli et al.
(Characteristic Curves Model) whereas the analysis at the hydrant level is being achieved with the use of the incorporated model AKLA. These functions are based on the creation of random combinations of open-closed hydrants (using a generator of random numbers and taking into account the probabilities of hydrants operating) and by extending the simulation of different flow configurations within the network. More specifically, in a simulation, the probability of operation of a hydrant is compared with the random number that has been attributed in the space [0, 1]. If this number is smaller or equal to the probability, the hydrant is open, if not it remains closed.
For the computation of head losses the equation of Darcy (Eq. 4) is used.
3. CASE STUDY
3.1 Study area – network data
The irrigation network is located near the town of Agrinio in the Prefecture of Aitoloakarnania (Greece) on the northern side of the lake Trichonida. It consists of eight subnetworks, which serve a total area of 1160 ha (Ministry of Agriculture, Restructuration of irrigation networks of Parabola, 1998). The area elevations range from 18 m (at the lake shore level) to 120 m a.s.l with the slopes increasing in the northern part where they become steeper. Due to this morphology, the phenomenon of soil erosion is observed.
The performance analysis has been implemented using the model COPAM, only for one part of the network, corresponding to the subnetwork of the Zone A, which operates with the aid of the pumping station called A1 (Stamouli, 2014). The Zone elevation ranges from 18 m a.s.l to 36 m a.s.l. The underground network is equipped with PVC pipes for diameters equal to or less than 400 mm and with steel pipes for larger diameters. The absolute roughness coefficient is equal to 0.1 mm for PVC pipes and equal to 1 mm for steel pipes which are equivalent to γ=0.07 for PVC pipes and γ=0.18 for steel pipes, where γ is the roughness coefficient of Bazin used by the COPAM for the estimation of head losses. Table 1 presents the main operating data of the network.
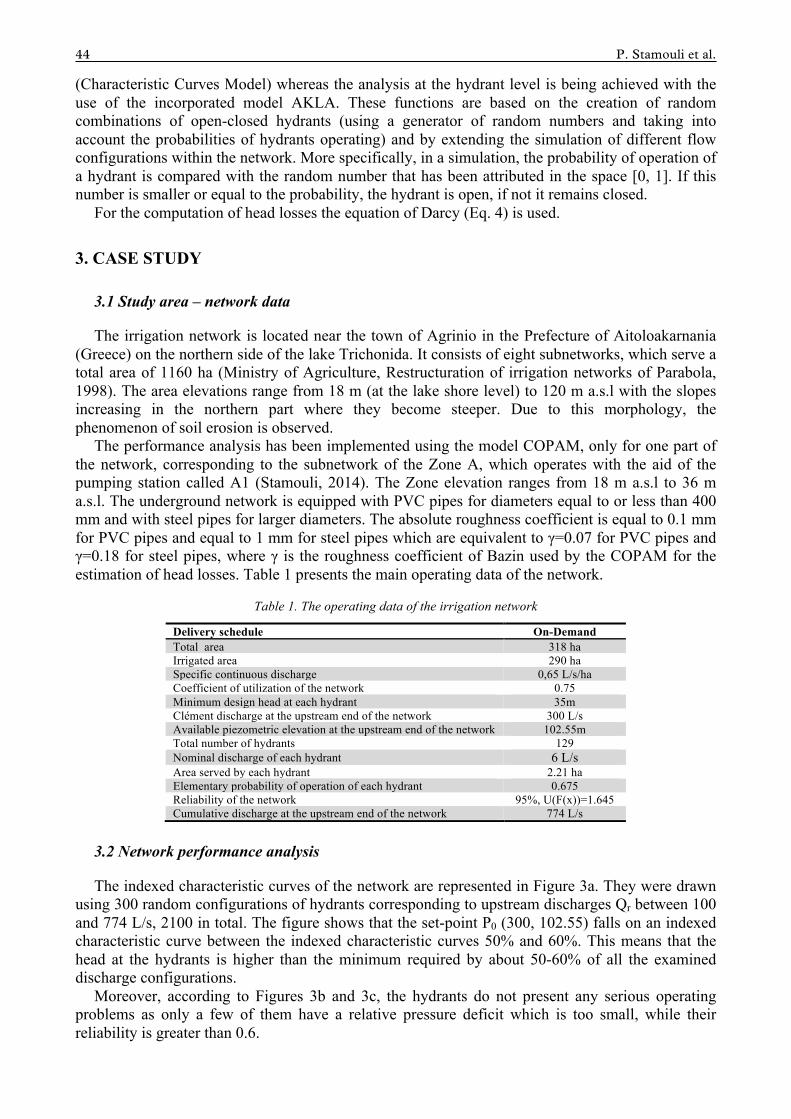
Table 1. The operating data of the irrigation network
Delivery schedule On-Demand Total area 318 ha Irrigated area 290 ha Specific continuous discharge 0,65 L/s/ha Coefficient of utilization of the network 0.75 Minimum design head at each hydrant 35m Clément discharge at the upstream end of the network 300 L/s Available piezometric elevation at the upstream end of the network 102.55m Total number of hydrants 129 Nominal discharge of each hydrant 6 L/s Area served by each hydrant 2.21 ha Elementary probability of operation of each hydrant 0.675 Reliability of the network 95%, U(F(x))=1.645 Cumulative discharge at the upstream end of the network 774 L/s
3.2 Network performance analysis
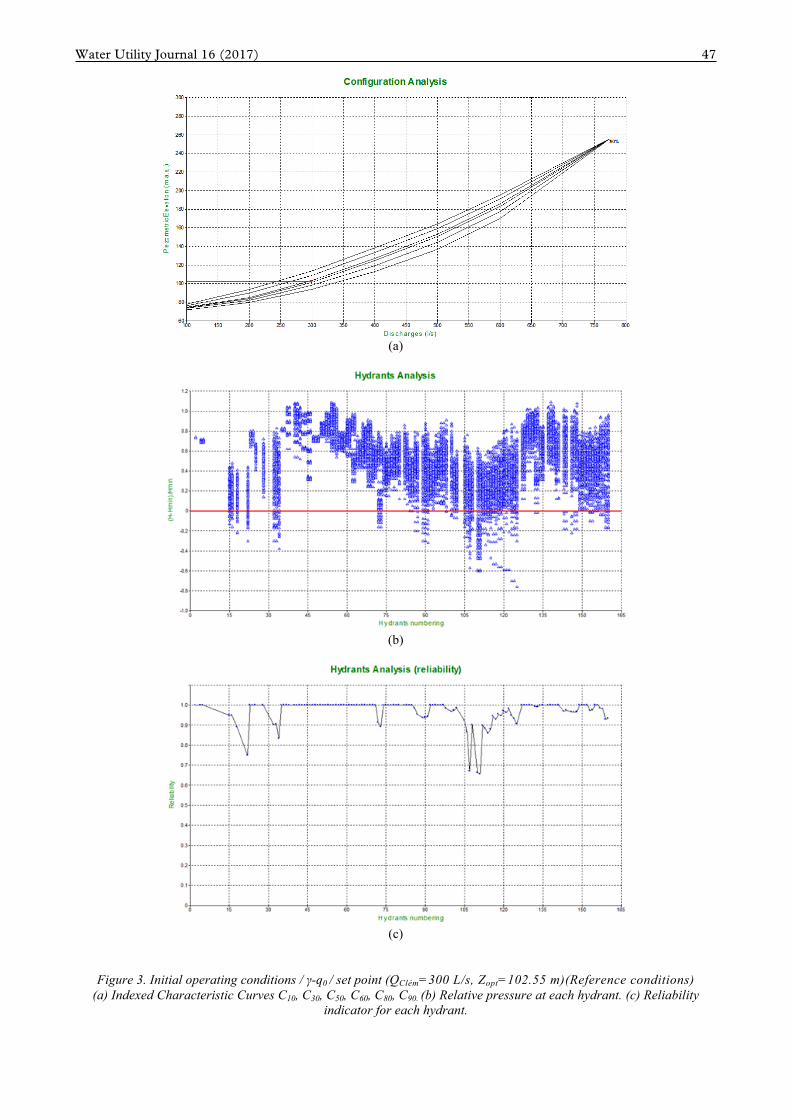
The indexed characteristic curves of the network are represented in Figure 3a. They were drawn using 300 random configurations of hydrants corresponding to upstream discharges Qr between 100 and 774 L/s, 2100 in total. The figure shows that the set-point P0 (300, 102.55) falls on an indexed characteristic curve between the indexed characteristic curves 50% and 60%. This means that the head at the hydrants is higher than the minimum required by about 50-60% of all the examined discharge configurations.
Moreover, according to Figures 3b and 3c, the hydrants do not present any serious operating problems as only a few of them have a relative pressure deficit which is too small, while their reliability is greater than 0.6.
Water Utility Journal 16 (2017) 45
3.3 Sensitivity analysis
In terms of performance analysis of a pressurized irrigation system with the use of a suitable model, it is valuable to investigate and take into account the influence of its parameters and the assumptions made for the various aspects of the system expressed through those parameters. This need can be satisfied by implementing a sensitivity analysis of the used model. This analysis will allow us to study the impact of the changes of the parameter values on the model results and to guide us about the accuracy needed when the parameters are determined during the design stage. For this purpose, a sensitivity analysis of the simulation model was carried out, using two of its basic parameters, the roughness coefficient γ and the specific continuous discharge q0.
The roughness parameter (γ) has been chosen because it is characterized by high uncertainty as far as the determination of its values in an operating network is concerned. Roughness of old pipes depends on age, pipe material, water quality in WDS and some other factors (Koppel and Vassiljev, 2009). The corrosion and deposition processes, which occur over time after the pipe installation, do not facilitate the determination of the actual roughness value.
Respectively, it has been chosen to investigate the effect of the variation of specific continuous discharge (q0) values on system performance. The value of this quantity, which in fact expresses the water requirements of the area served by the network, is theoretically considered to be one of the systems data. Nevertheless, during the life of the irrigation system, big changes of the cropping pattern occur – as compared to those envisaged during the design – resulting in water demand changes.
4. RESULTS AND DISCUSSION
4.1 Variation of the roughness parameter γ Bazin
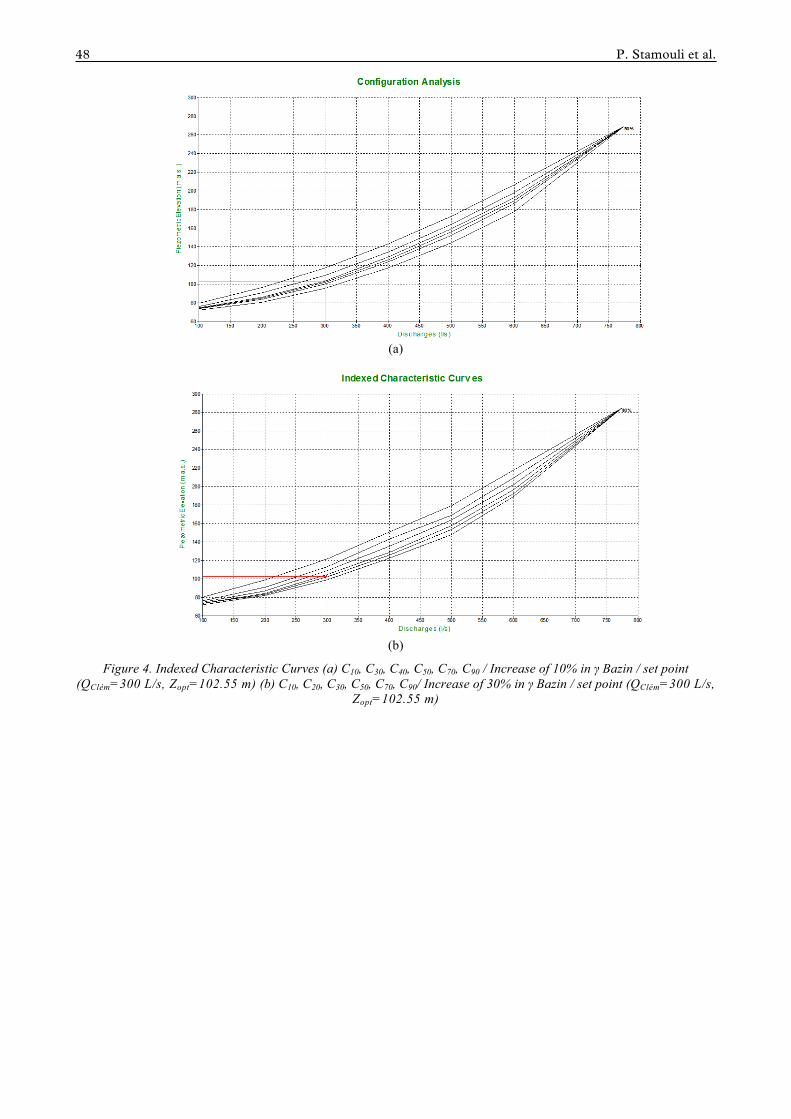
The investigation of the roughness parameter variation effect on the system performance included two distinctive cases. In the first case, we assumed that the parameter value increases by 10% for both pipe materials (γ=0.20 m0.5 for steel pipes and γ=0.08 m0.5 for PVC pipes), using as reference the values of the design study (γ=0.18 m0.5 for steel pipes and γ=0.07 m0.5 for PVC pipes). In the second case, we assumed an increase of 30% in the parameter value (γ=0.23 m0.5 for steel pipes and γ=0.09 m0.5 for PVC pipes), using the same reference values.
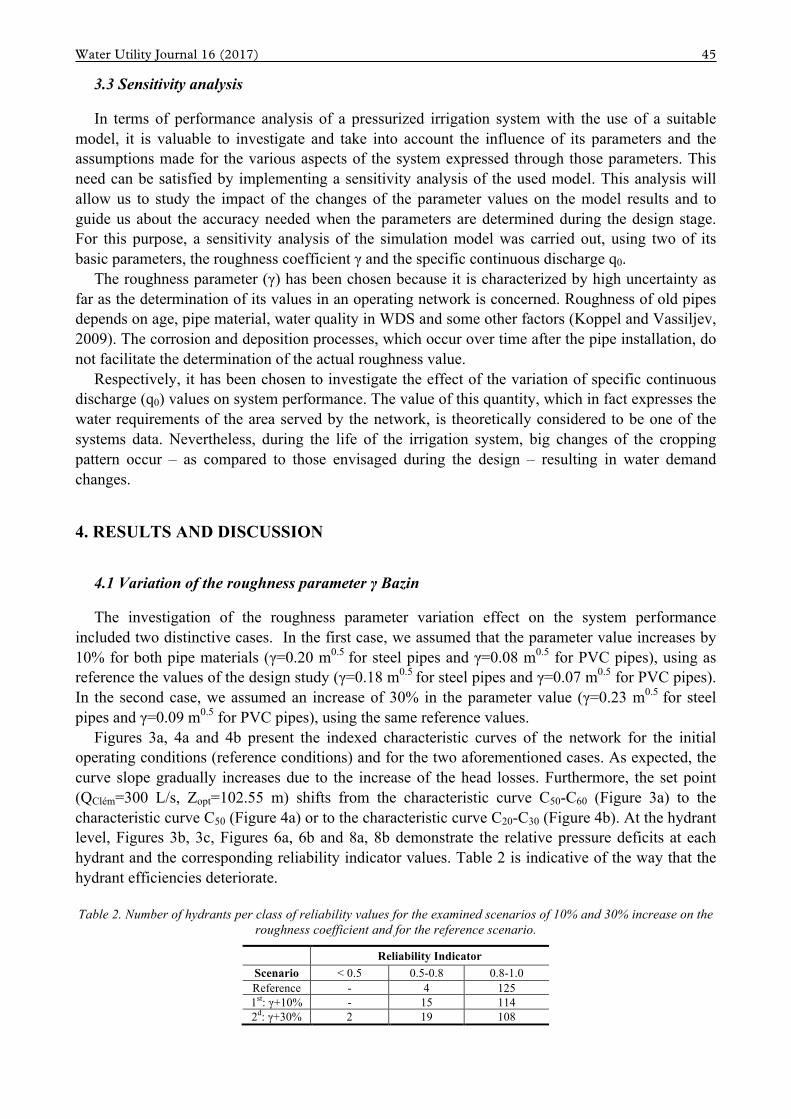
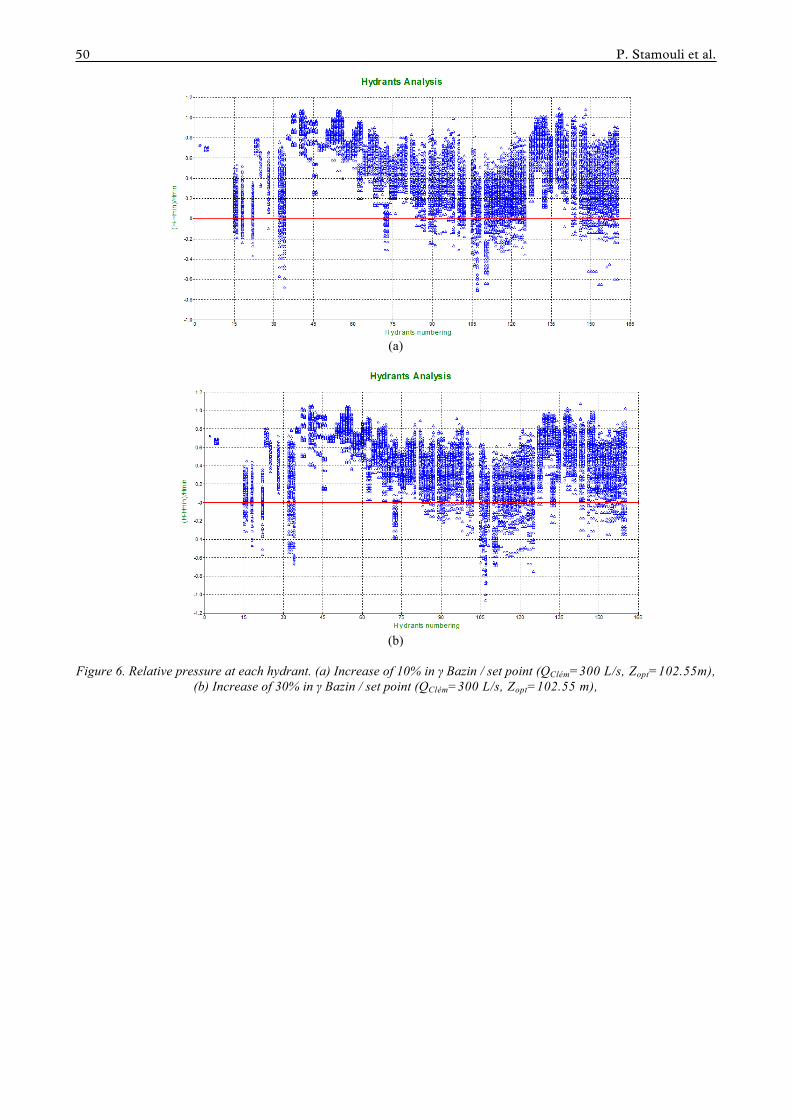
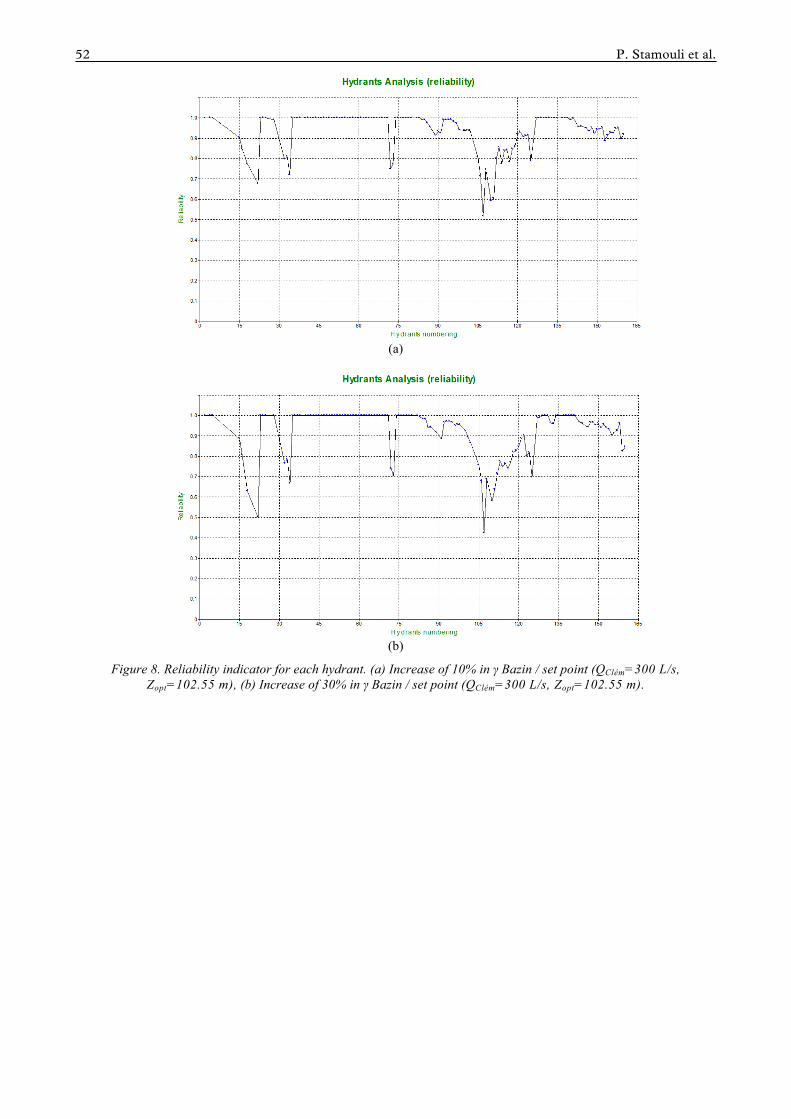
Figures 3a, 4a and 4b present the indexed characteristic curves of the network for the initial operating conditions (reference conditions) and for the two aforementioned cases. As expected, the curve slope gradually increases due to the increase of the head losses. Furthermore, the set point (QClém=300 L/s, Zopt=102.55 m) shifts from the characteristic curve C50-C60 (Figure 3a) to the characteristic curve C50 (Figure 4a) or to the characteristic curve C20-C30 (Figure 4b). At the hydrant level, Figures 3b, 3c, Figures 6a, 6b and 8a, 8b demonstrate the relative pressure deficits at each hydrant and the corresponding reliability indicator values. Table 2 is indicative of the way that the hydrant efficiencies deteriorate. Table 2. Number of hydrants per class of reliability values for the examined scenarios of 10% and 30% increase on the
roughness coefficient and for the reference scenario.
Reliability Indicator Scenario < 0.5 0.5-0.8 0.8-1.0 Reference - 4 125 1st: γ+10% - 15 114 2d: γ+30% 2 19 108
46 P. Stamouli et al.
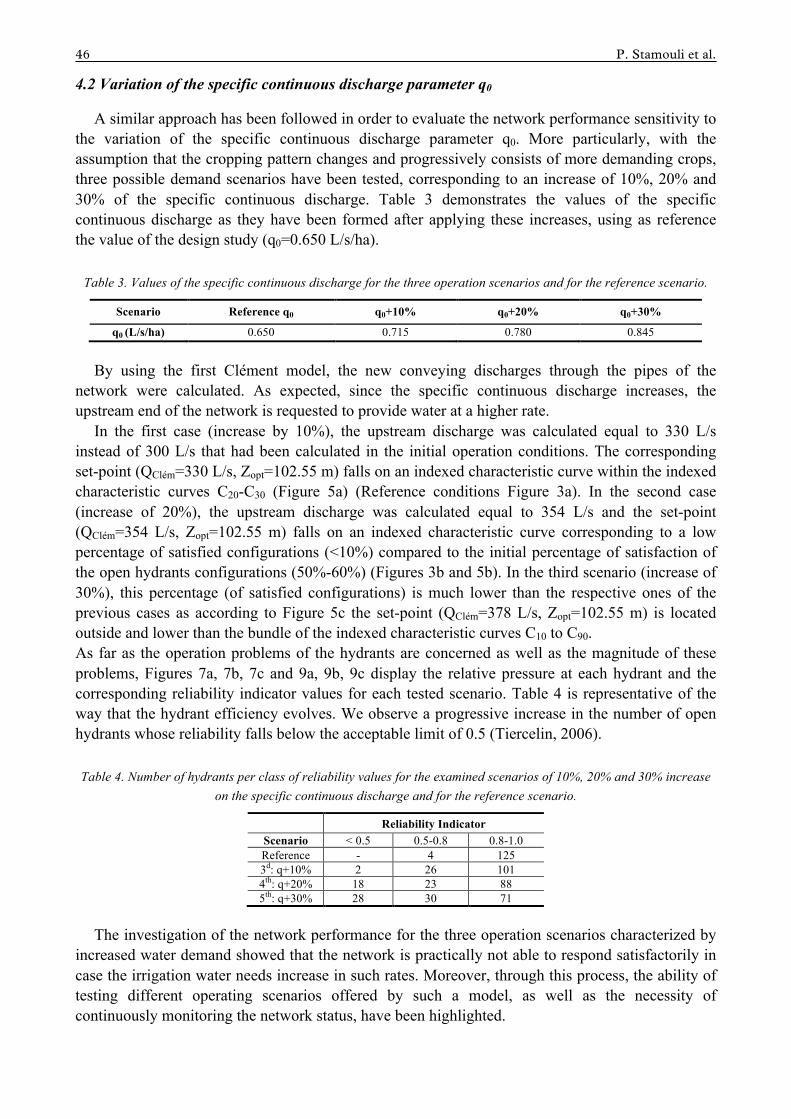
4.2 Variation of the specific continuous discharge parameter q0
A similar approach has been followed in order to evaluate the network performance sensitivity to the variation of the specific continuous discharge parameter q0. More particularly, with the assumption that the cropping pattern changes and progressively consists of more demanding crops, three possible demand scenarios have been tested, corresponding to an increase of 10%, 20% and 30% of the specific continuous discharge. Table 3 demonstrates the values of the specific continuous discharge as they have been formed after applying these increases, using as reference the value of the design study (q0=0.650 L/s/ha).
Table 3. Values of the specific continuous discharge for the three operation scenarios and for the reference scenario.
Scenario Reference q0 q0+10% q0+20% q0+30%
q0 (L/s/ha) 0.650 0.715 0.780 0.845
By using the first Clément model, the new conveying discharges through the pipes of the
network were calculated. As expected, since the specific continuous discharge increases, the upstream end of the network is requested to provide water at a higher rate.
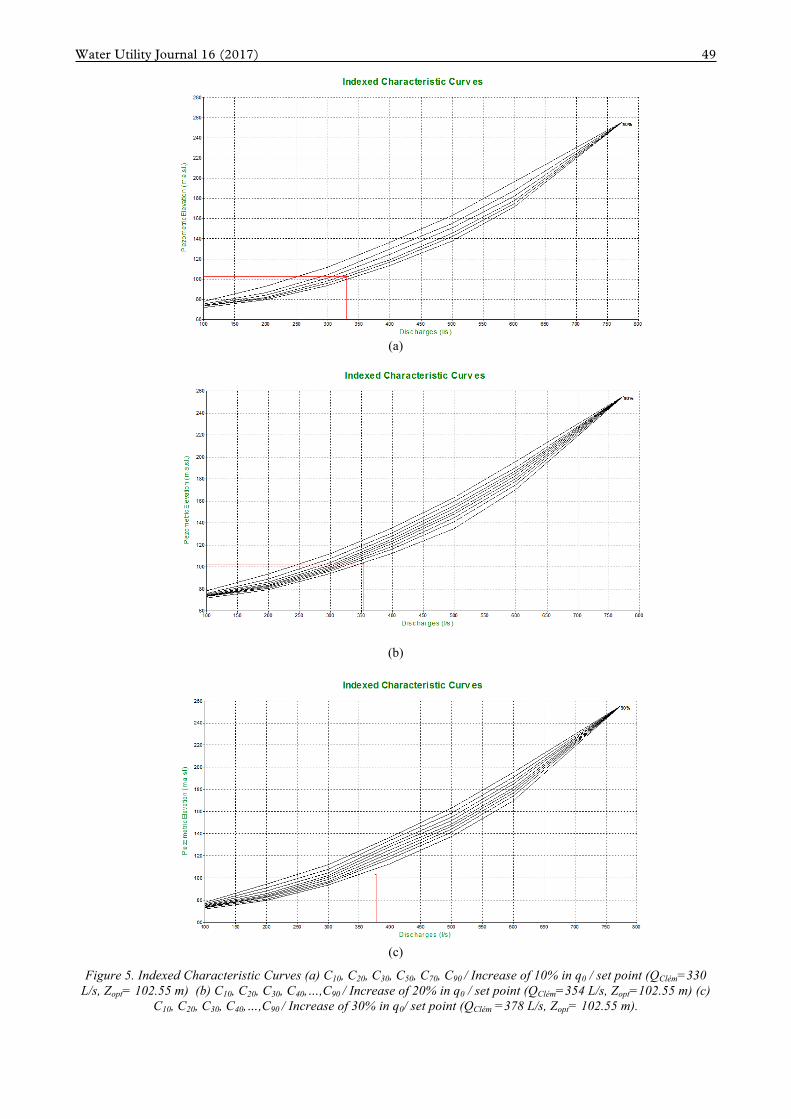
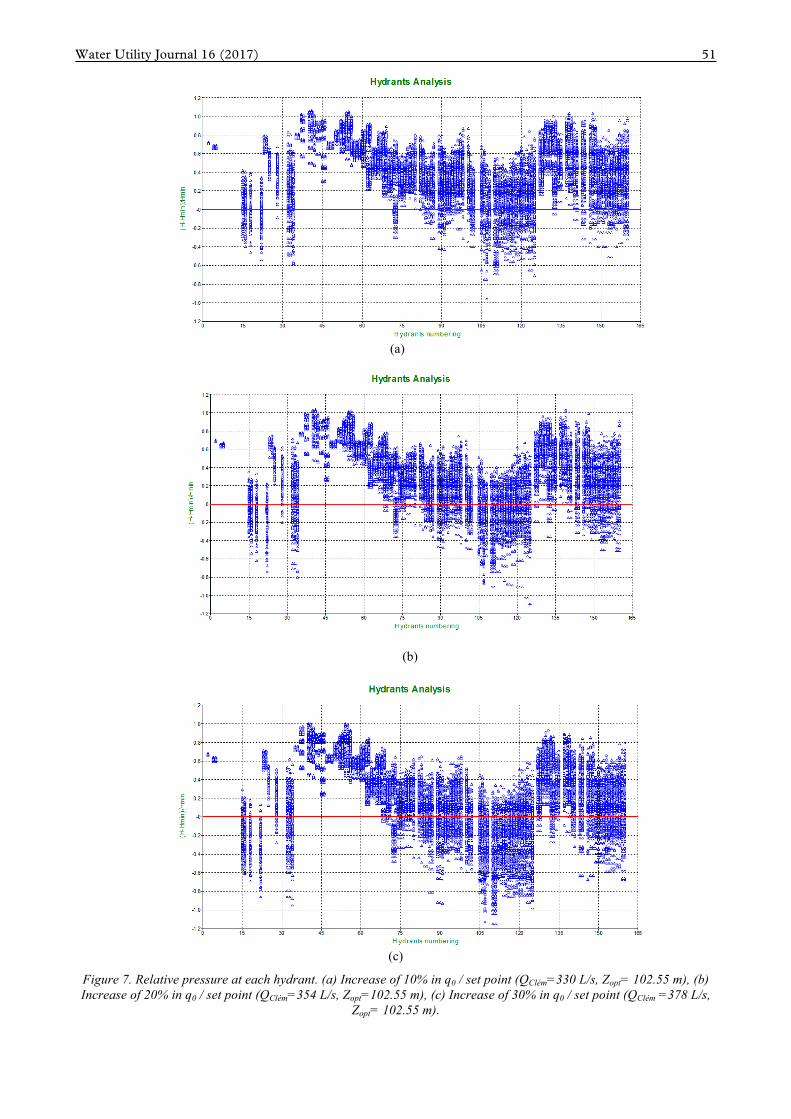
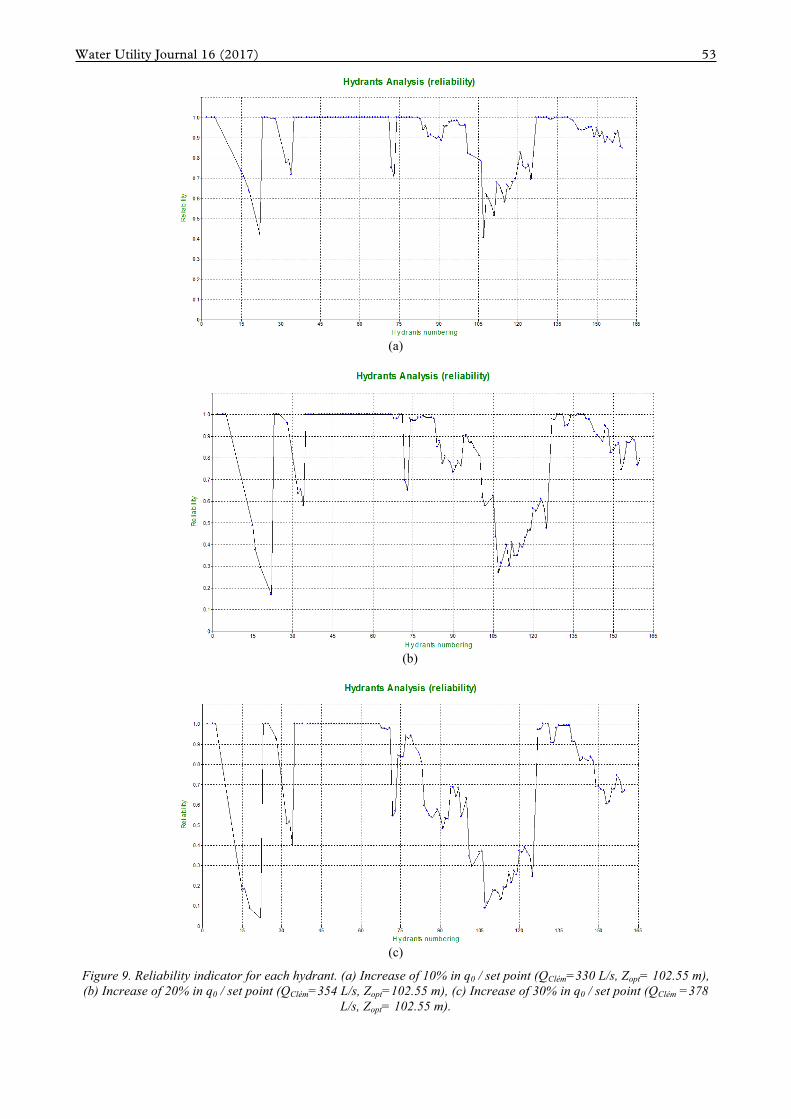
In the first case (increase by 10%), the upstream discharge was calculated equal to 330 L/s instead of 300 L/s that had been calculated in the initial operation conditions. The corresponding set-point (QClém=330 L/s, Zopt=102.55 m) falls on an indexed characteristic curve within the indexed characteristic curves C20-C30 (Figure 5a) (Reference conditions Figure 3a). In the second case (increase of 20%), the upstream discharge was calculated equal to 354 L/s and the set-point (QClém=354 L/s, Zopt=102.55 m) falls on an indexed characteristic curve corresponding to a low percentage of satisfied configurations (<10%) compared to the initial percentage of satisfaction of the open hydrants configurations (50%-60%) (Figures 3b and 5b). In the third scenario (increase of 30%), this percentage (of satisfied configurations) is much lower than the respective ones of the previous cases as according to Figure 5c the set-point (QClém=378 L/s, Zopt=102.55 m) is located outside and lower than the bundle of the indexed characteristic curves C10 to C90. As far as the operation problems of the hydrants are concerned as well as the magnitude of these problems, Figures 7a, 7b, 7c and 9a, 9b, 9c display the relative pressure at each hydrant and the corresponding reliability indicator values for each tested scenario. Table 4 is representative of the way that the hydrant efficiency evolves. We observe a progressive increase in the number of open hydrants whose reliability falls below the acceptable limit of 0.5 (Tiercelin, 2006). Table 4. Number of hydrants per class of reliability values for the examined scenarios of 10%, 20% and 30% increase
on the specific continuous discharge and for the reference scenario.
Reliability Indicator Scenario < 0.5 0.5-0.8 0.8-1.0 Reference - 4 125 3d: q+10% 2 26 101 4th: q+20% 18 23 88 5th: q+30% 28 30 71
The investigation of the network performance for the three operation scenarios characterized by
increased water demand showed that the network is practically not able to respond satisfactorily in case the irrigation water needs increase in such rates. Moreover, through this process, the ability of testing different operating scenarios offered by such a model, as well as the necessity of continuously monitoring the network status, have been highlighted.
Water Utility Journal 16 (2017) 47
(a)
(b)
(c)
Figure 3. Initial operating conditions / γ-q0 / set point (QClém=300 L/s, Zopt=102.55 m)(Reference conditions) (a) Indexed Characteristic Curves C10, C30, C50, C60, C80, C90. (b) Relative pressure at each hydrant. (c) Reliability
indicator for each hydrant.
48 P. Stamouli et al.
(a)
(b)
Figure 4. Indexed Characteristic Curves (a) C10, C30, C40, C50, C70, C90 / Increase of 10% in γ Bazin / set point (QClém=300 L/s, Zopt=102.55 m) (b) C10, C20, C30, C50, C70, C90/ Increase of 30% in γ Bazin / set point (QClém=300 L/s,
Zopt=102.55 m)
Water Utility Journal 16 (2017) 49
(a)
(b)
(c)
Figure 5. Indexed Characteristic Curves (a) C10, C20, C30, C50, C70, C90 / Increase of 10% in q0 / set point (QClém=330 L/s, Zopt= 102.55 m) (b) C10, C20, C30, C40,…,C90 / Increase of 20% in q0 / set point (QClém=354 L/s, Zopt=102.55 m) (c)
C10, C20, C30, C40,…,C90 / Increase of 30% in q0/ set point (QClém =378 L/s, Zopt= 102.55 m).
50 P. Stamouli et al.
(a)
(b)
Figure 6. Relative pressure at each hydrant. (a) Increase of 10% in γ Bazin / set point (QClém=300 L/s, Zopt=102.55m),
(b) Increase of 30% in γ Bazin / set point (QClém=300 L/s, Zopt=102.55 m),
Water Utility Journal 16 (2017) 51
(a)
(b)
(c)
Figure 7. Relative pressure at each hydrant. (a) Increase of 10% in q0 / set point (QClém=330 L/s, Zopt= 102.55 m), (b) Increase of 20% in q0 / set point (QClém=354 L/s, Zopt=102.55 m), (c) Increase of 30% in q0 / set point (QClém =378 L/s,
Zopt= 102.55 m).
52 P. Stamouli et al.
(a)
(b)
Figure 8. Reliability indicator for each hydrant. (a) Increase of 10% in γ Bazin / set point (QClém=300 L/s, Zopt=102.55 m), (b) Increase of 30% in γ Bazin / set point (QClém=300 L/s, Zopt=102.55 m).
Water Utility Journal 16 (2017) 53
(a)
(b)
(c)
Figure 9. Reliability indicator for each hydrant. (a) Increase of 10% in q0 / set point (QClém=330 L/s, Zopt= 102.55 m), (b) Increase of 20% in q0 / set point (QClém=354 L/s, Zopt=102.55 m), (c) Increase of 30% in q0 / set point (QClém =378
L/s, Zopt= 102.55 m).
54 P. Stamouli et al.
5. CONCLUSIONS
The implementation of performance analysis of an existing pressurized irrigation system operating on-demand has been examined. As concluded, the performance analysis of an irrigation system with the use of simulation models is particularly useful as it permits the identification and quantification of the operation problems in the network sections. More specifically, the indexed characteristic curves constitute a boundary for the network proper performance for a wide range of possible operation conditions, whereas the analysis at the hydrant level gives more precise information on the position of the hydrants with operation problems and the magnitude of these problems.
Furthermore, through the investigation of five different scenarios in the examined network, it was concluded that the model is particularly sensitive to the parameters γ and q0, where γ (Bazin) is the roughness coefficient used by the model for the computation of head losses and q0 is the specific continuous discharge which expresses the unit area water requirements. In this regard, for the achievement of a reliable analysis of an operating network, the existence of a monitoring system that will provide the network managers with pressure and discharge measurements is considered necessary. The constant monitoring of the system and the collection of data on operation will allow for the analysis of the performance under actual conditions, the calibration, validation and updating of existing models, as well as the formulation of new models.
ACKNOWLEDGEMENTS
An initial shorter version of the paper has been presented in Greek at the 3rd Common Conference (13th of Hellenic Hydrotechnical Association, 9th of Hellenic Committee on Water Resources Management and 1st of the Hellenic Water Association) “Integrated Water Resources Management in the New Era”, Athens, Greece, December 10-12, 2015.
REFERENCES
Bethery, J. (1990). Réseaux collectifs ramifiés sous pression, calcul et fonctionnement, Études-Cemagref, no 6. Hydraulique agricole Ed. Irstea, France, 140 p.
Bethery, J., Meunier, M. and Puech, C. (1981). Analyse des défaillances et étude du renforcement des réseaux d’irrigation par aspersion. Proc. Xie Cong CIID, 36: 297-324.
CEMAGREF. (1983). Calcul des réseaux ramifiés sous pression. No. 506. Antony, France, 138 p. Clément, R. (1955). Note sur le calcul des débits dans les canalisations d’irrigation, journées d’étude d’irrigation, Arles AFEID, 21 p. Clément, R. (1966). Calcul des débits dans les réseaux d’irrigation fonctionnant à la demande. Houille blanche 5: 553-575 CTGREF (1979). Renforcement des réseaux ramifiés d’eau sous pression. Cahier 33. Dercas, N. (2001). Models for rehabilitation and modernization of collective pressurized irrigation networks. Agricultural University
of Athens, Athens, 52 p. (in Greek) Estrada, C., González, C., Aliod, R., and Paño, J. (2009). Improved pressurized pipe network hydraulic solver for applications in
irrigation systems. J. Irrig. Drain. Eng, 135(4): 421-430. Hashimoto, T. (1980). Robustness, reliability, resiliency and vulnerability criteria for planning water resources systems. Ph.D.
Dissertation, Cornell University. Hashimoto, T., Sredomger, J.R., and Loucks, D.P. (1982). Reliability, resilience and vulnerability criteria for water resources system
performance evaluation. Water Resources Research 18(1): 14–20. Khadra, R., and Lamaddalena, N. (2010). Development of a decision support system for irrigation systems analysis. Water Resources
Management, 24: 3279-3297. Koppel, T., Vassiljev, A. (2009). Calibration of a model of an operational water distribution system containing pipes of different age.
Department of Mechanics, Tallinn University of Technology, Tallinn published by Elsevier Ltd. Labye, Y. (1966). Étude des procédés de calcul ayant pour but de rendre minimal le coût d’un réseau de distribution d’ eau sous
pression. Houille blanche 5: 577-583. Labye, Y., Lahaye, J.P., and Meunier, M. (1975). Utilization des caractéristiques indicées. Proc. Congres de la ICID, Moscou, 30 p. Lamaddalena, N. (1997). Integrated simulation modeling for design and performance analysis of on-demand pressurized irrigation
systems. PhD dissertation. Technical University of Lisbon, Lisbon. Lamaddalena, N., and Sagardoy, J.A. (2000). Performance analysis of on-demand pressurized irrigation systems, FAO & CIHEAM-
IAMB, Irrigation & Drainage paper 59, Rome, 149 p.

Water Utility Journal 16 (2017) 55
Lamaddalena, N., and Perreira, L.S. (2007). Pressure-driven modelling for the performance analysis of irrigation systems operating on demand. Agric. Water Management, 90: 36-44.
Ministry of Agriculture, General Direction of Reclamation Works and Agricultural Restructuration, Direction of Technical Studies and Constructions (1998). Restructuration of irrigation networks of Parabola, Prefecture of Aitoloakarnania, TOEB Parabola, Athens.
Rosseman, L.A. (2000). EPANET User Manual. US Environmental Protection Agency, Drinking Water Research Division, Risk Reduction Engineering Laboratory, Cincinnati.
Stamouli, P. (2014). Performance analysis of collective pressurized irrigation network. Case study, the network of Parabola, Prefecture of Aitoloakarnania, MSc Thesis, School of Civil Engineering, NTUA, Athens, 112 p.
Stefopoulou, A., and Dercas, N. (2011a). Investigation of Hydraulic Performance of Irrigation Network Kalyvion-Socha. (Prefecture of Lakonia, Greece). Proc. 7th Greek Conference of the Hellenic Society of Agriculture Engineering, Greece.
Stefopoulou, A., and Dercas, N. (2011b). Performance Analysis of Large Pressurized Irrigation Networks: Effect of Head Losses Evaluation. Proc. VI EWRA International Symposium “Water Engineering and Management in a Changing Environment”, Italy.
Tiercelin, J.R. (2006). Traité d’irrigation. Tec & Doc Lavoisier, Paris, 1011 p.