Perfect Competition 11-1 Chapter 11 Main Assumption Economists assume that the goal of firms is to...
24
Perfect Competition 11-1 Chapter 11 Main Assumption Economists assume that the goal of firms is to maximize economic profit. Max P*Q – TC =Π= TR – TC : Issue – measuring Costs Q
Transcript of Perfect Competition 11-1 Chapter 11 Main Assumption Economists assume that the goal of firms is to...
Perfect Competition
11-1
Chapter 11
Main Assumption
Economists assume that the goal of firms is to maximize economic profit.Max P*Q – TC =Π= TR – TC : Issue – measuring Costs Q
Chapter Outline
The Goal Of Profit Maximization The Four Conditions For Perfect Competition The Short-run Condition For Profit Maximization The Short-run Competitive Industry Supply• Short-run Competitive Equilibrium Producer Surplus Adjustments In The Long Run The Invisible Hand Application: The Cost Of Extraordinary Inputs The Efficiency Of Short-run Competitive
Equilibrium The Long-run Competitive Industry Supply Curve The Elasticity Of Supply Applying The Competitive Model
11-2
Profits
Firms exist to maximize economic profits and not accounting profits
Economic profit --the difference between total revenue and total cost, where total cost includes all costs—both explicit and implicit—associated with resources used by the firm.
Accounting profit --is simply total revenue less all explicit costs incurred.– does not subtract the implicit costs.
The Short-run Condition For Profit Maximization
To maximize profit the firm will choose that level of output for which the difference between total revenue and total cost is largest. 11-3
The Four Conditions For Perfect
Competition1. Firms Sell a Standardized Product
The product sold by one firm is assumed to be a perfect substitute for the product sold by any other.
2. Firms Are Price Takers This means that the individual firm treats the market price of the product as given.
3. Free Entry and Exit With Perfectly Mobile Factors of Production in the Long Run
4. Firms and Consumers Have Perfect InformationThe Short-run Condition For Profit Maximization Marginal revenue: the change in total revenue that
occurs as a result of a 1-unit change in sales. To maximize profits the firm should produce a level of
output for which marginal revenue is equal to marginal cost on the rising portion of the MC curve.
11-4
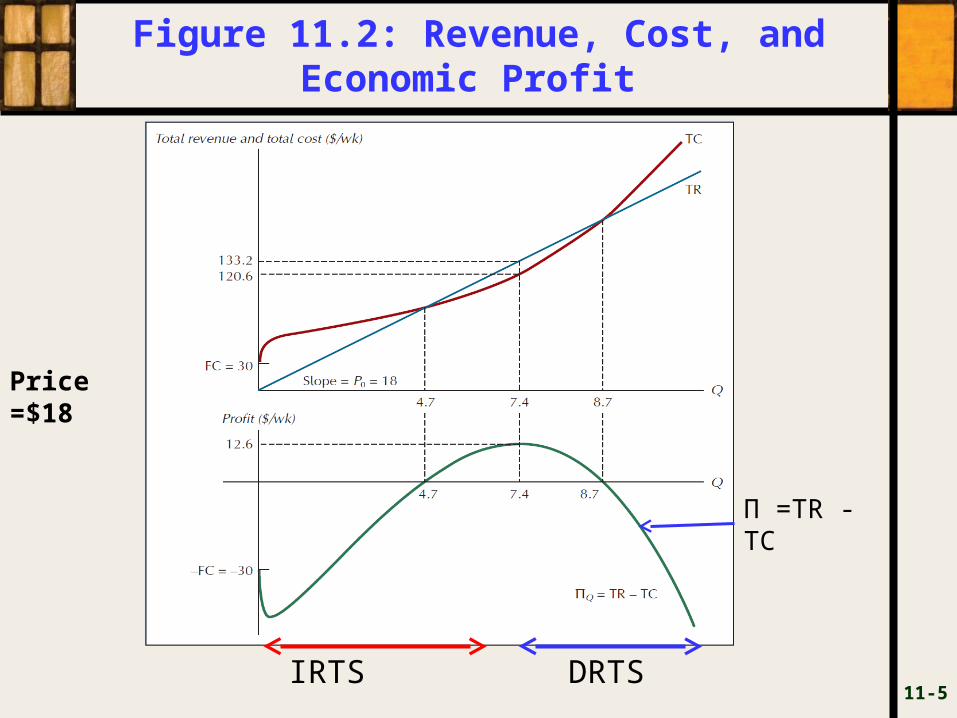
Figure 11.2: Revenue, Cost, and Economic Profit
11-5IRTS
Price =$18
DRTS
Π =TR - TC
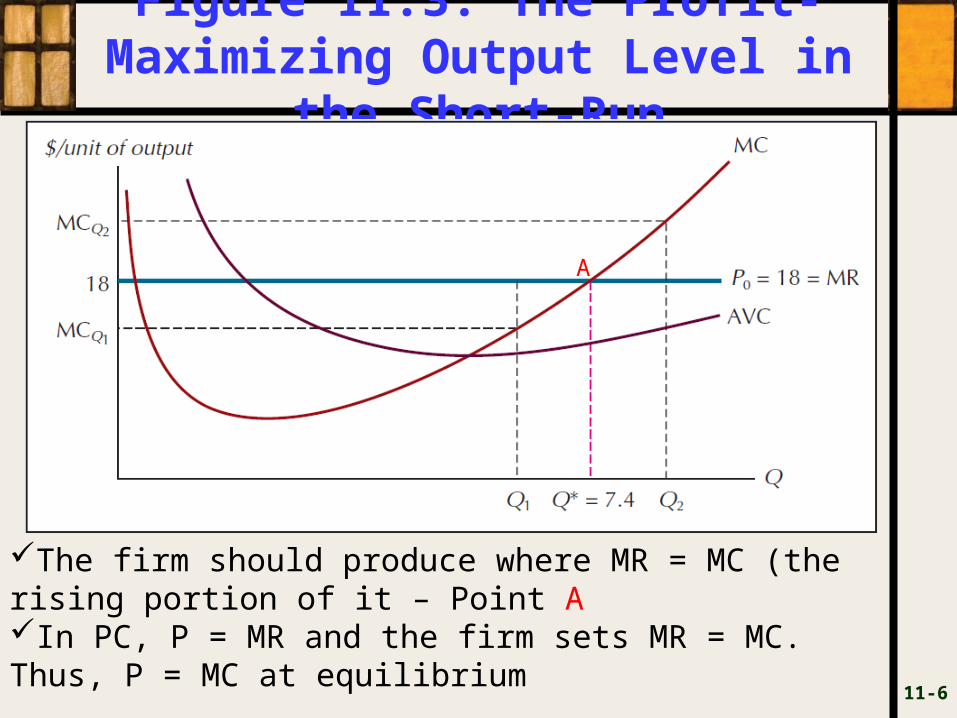
Figure 11.3: The Profit-Maximizing Output Level in
the Short-Run
11-6
The firm should produce where MR = MC (the rising portion of it – Point AIn PC, P = MR and the firm sets MR = MC. Thus, P = MC at equilibrium
A
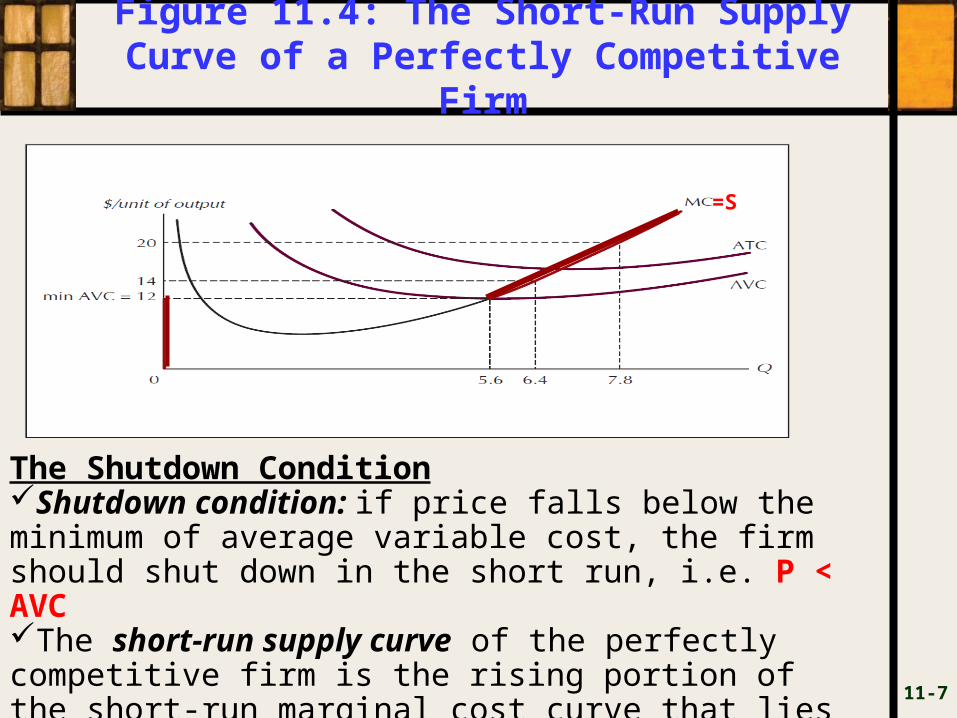
Figure 11.4: The Short-Run Supply Curve of a Perfectly Competitive
Firm
11-7
The Shutdown ConditionShutdown condition: if price falls below the minimum of average variable cost, the firm should shut down in the short run, i.e. P < AVCThe short-run supply curve of the perfectly competitive firm is the rising portion of the short-run marginal cost curve that lies above the minimum value of the average variable cost curve
=S
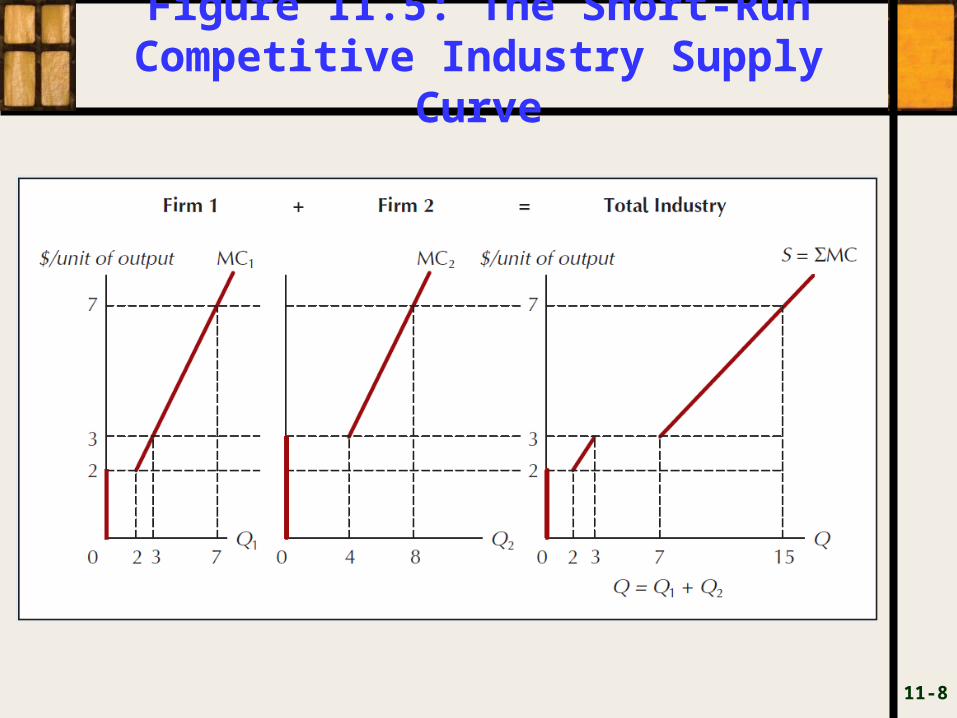
Figure 11.5: The Short-Run Competitive Industry Supply
Curve
11-8
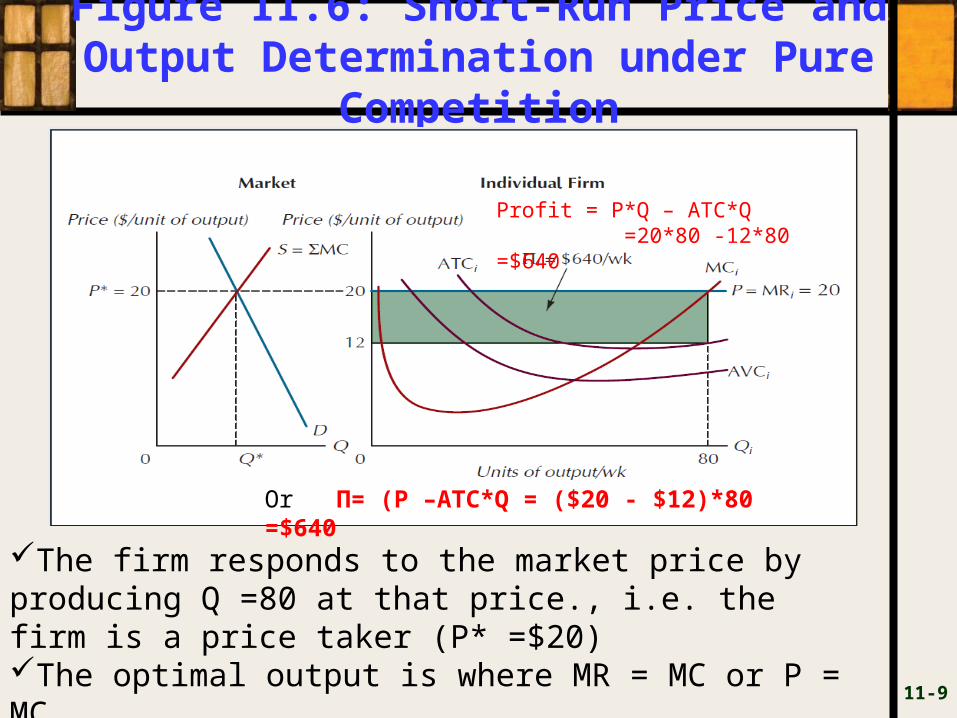
Figure 11.6: Short-Run Price and Output Determination under Pure
Competition
11-9
The firm responds to the market price by producing Q =80 at that price., i.e. the firm is a price taker (P* =$20)The optimal output is where MR = MC or P = MC
Profit = P*Q – ATC*Q =20*80 -12*80 =$640
Or Π= (P –ATC*Q = ($20 - $12)*80 =$640
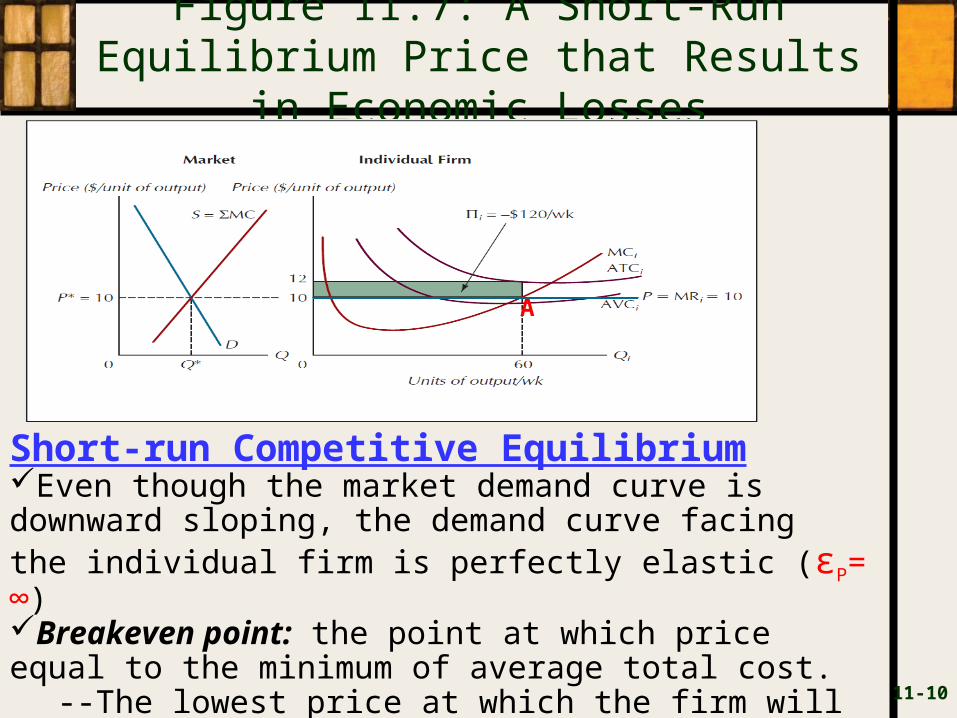
Figure 11.7: A Short-Run Equilibrium Price that Results in Economic
Losses
11-10
Short-run Competitive EquilibriumEven though the market demand curve is downward sloping, the demand curve facing the individual firm is perfectly elastic (εP= ∞)Breakeven point: the point at which price equal to the minimum of average total cost.
--The lowest price at which the firm will not suffer negative profits in the short run.
A
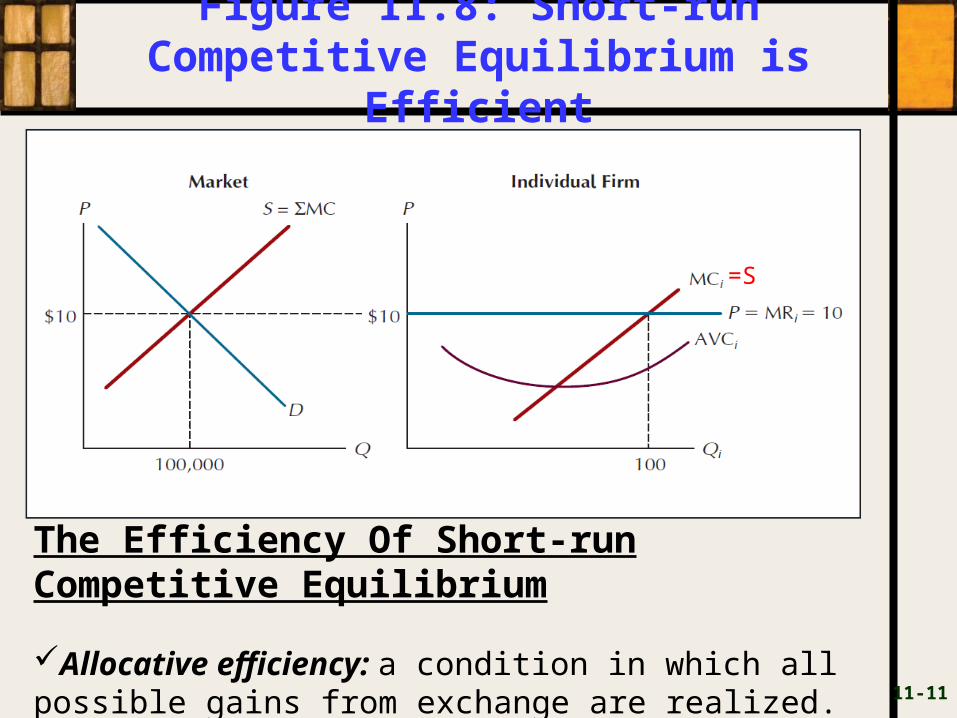
Figure 11.8: Short-run Competitive Equilibrium is
Efficient
11-11
The Efficiency Of Short-run Competitive Equilibrium
Allocative efficiency: a condition in which all possible gains from exchange are realized.
=S
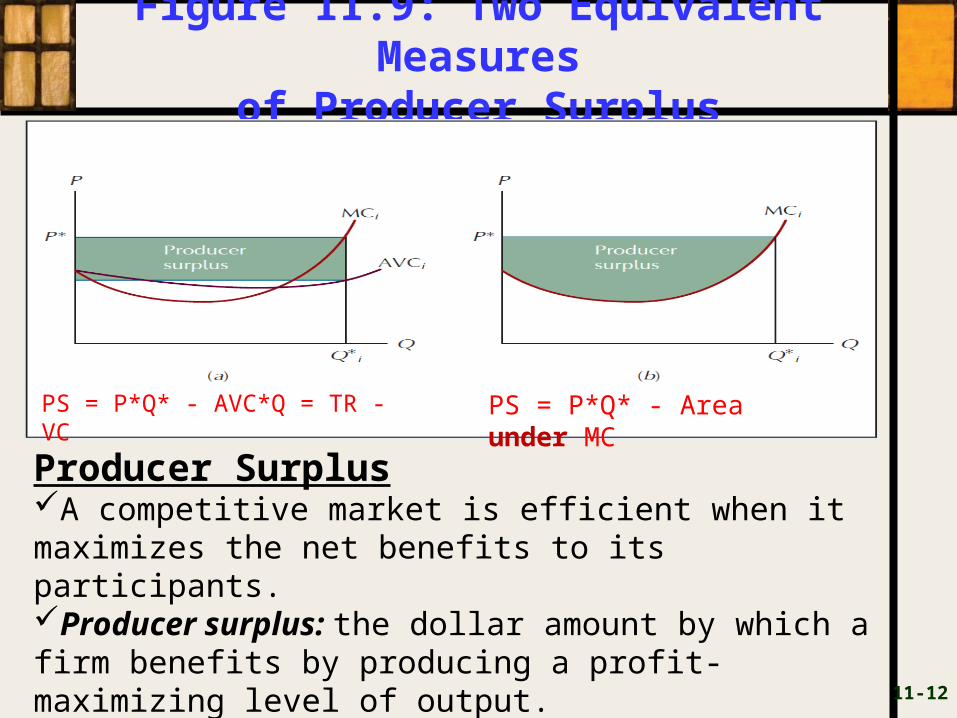
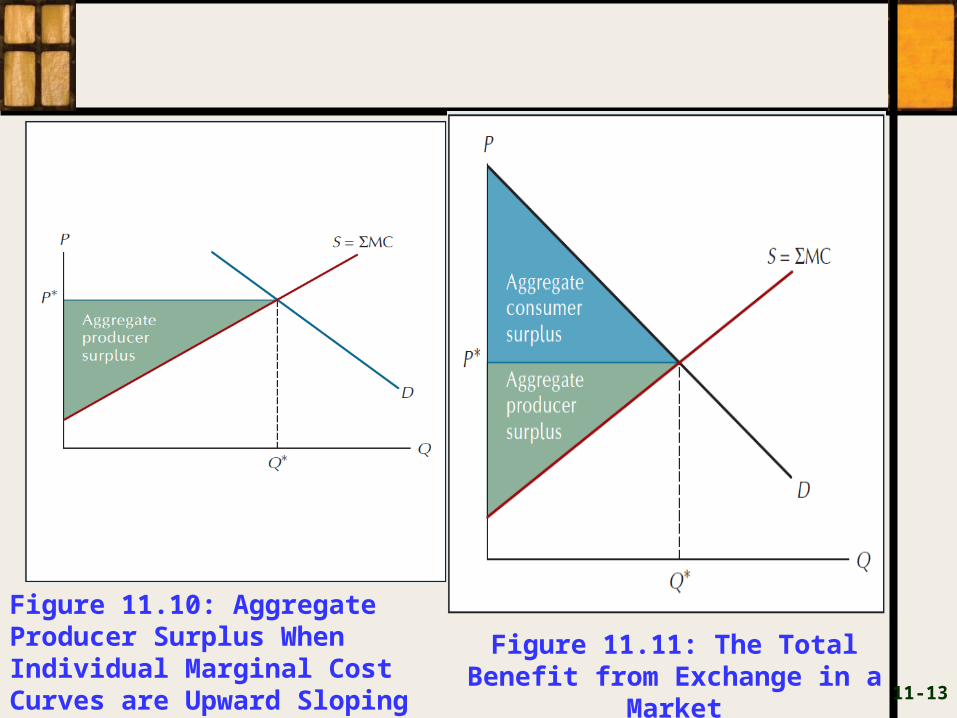
Figure 11.9: Two Equivalent Measures
of Producer Surplus
11-12
Producer SurplusA competitive market is efficient when it maximizes the net benefits to its participants.Producer surplus: the dollar amount by which a firm benefits by producing a profit-maximizing level of output.Profit = TR – TC and TC =VC+FC so PS = TR –VC = TR -(TC –FC) = TR –TC +FC
PS = P*Q* - AVC*Q = TR - VC PS = P*Q* - Area under MC
11-13
Figure 11.11: The Total Benefit from Exchange in a
Market
Figure 11.10: Aggregate Producer Surplus When Individual Marginal Cost Curves are Upward Sloping Throughout
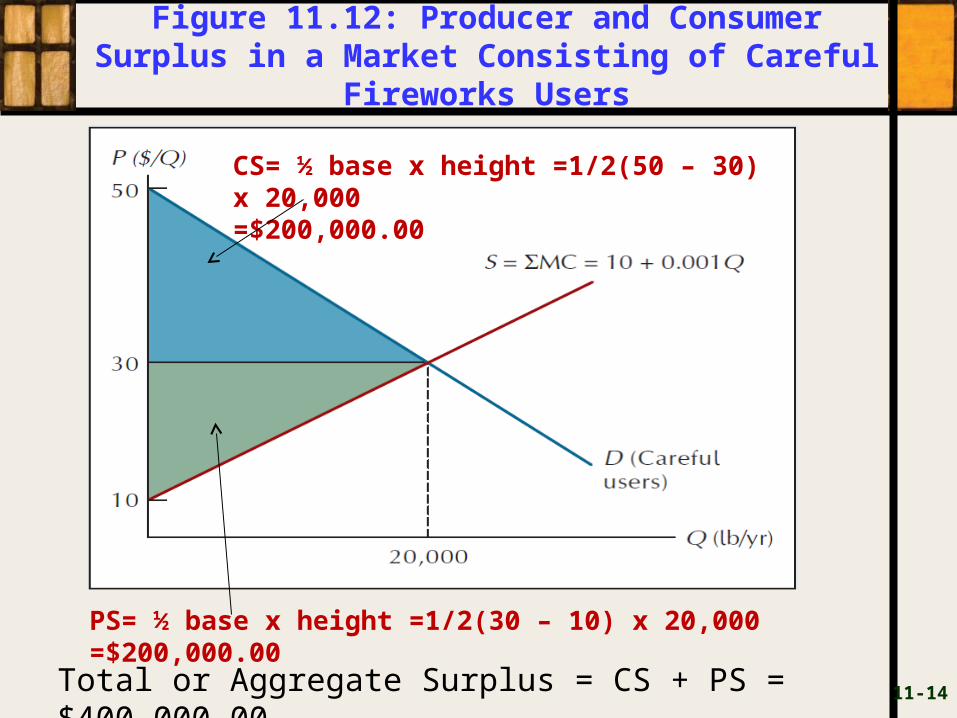
Figure 11.12: Producer and Consumer Surplus in a Market Consisting of Careful
Fireworks Users
11-14
CS= ½ base x height =1/2(50 – 30) x 20,000=$200,000.00
PS= ½ base x height =1/2(30 – 10) x 20,000 =$200,000.00
Total or Aggregate Surplus = CS + PS = $400,000.00
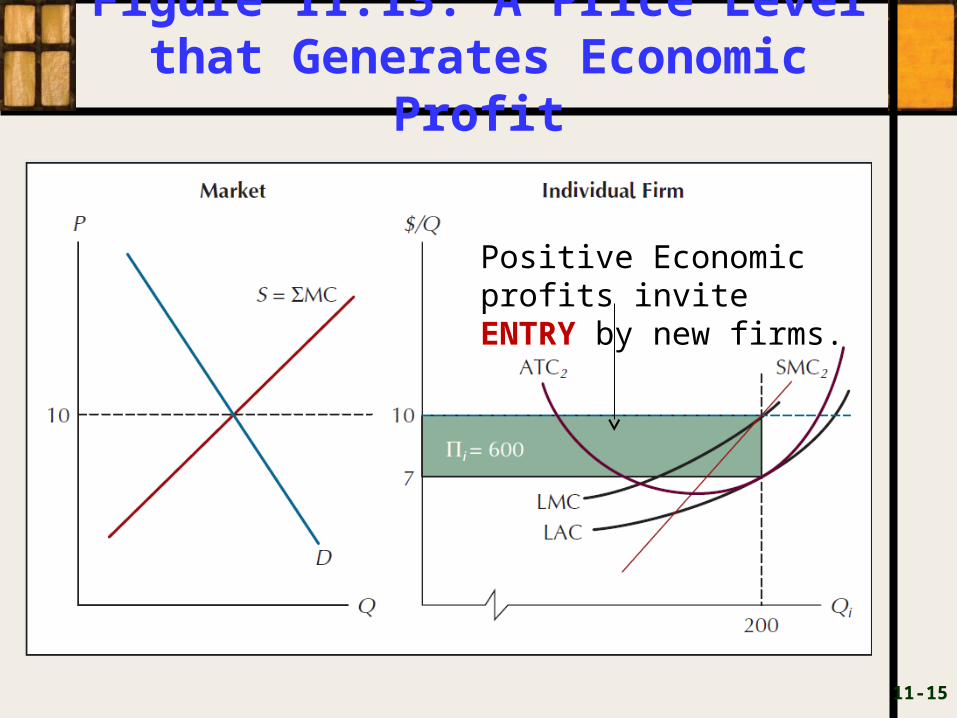
Figure 11.13: A Price Level that Generates Economic
Profit
11-15
Positive Economic profits invite ENTRY by new firms.
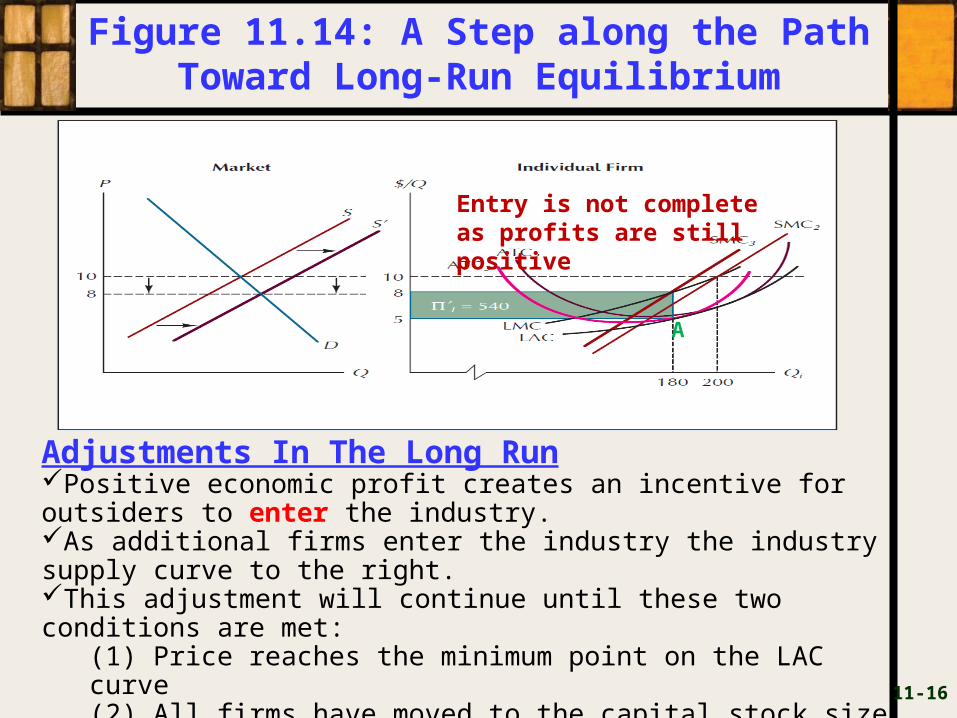
Figure 11.14: A Step along the Path Toward Long-Run Equilibrium
11-16
Adjustments In The Long RunPositive economic profit creates an incentive for outsiders to enter the industry.As additional firms enter the industry the industry supply curve to the right.This adjustment will continue until these two conditions are met:
(1) Price reaches the minimum point on the LAC curve (2) All firms have moved to the capital stock size that gives rise to a short-run average total cost curve that is tangent to the LAC curve at its minimum point. (=ATC3 is tangent to minimum LAC at Point A)
Entry is not complete as profits are still positive
A
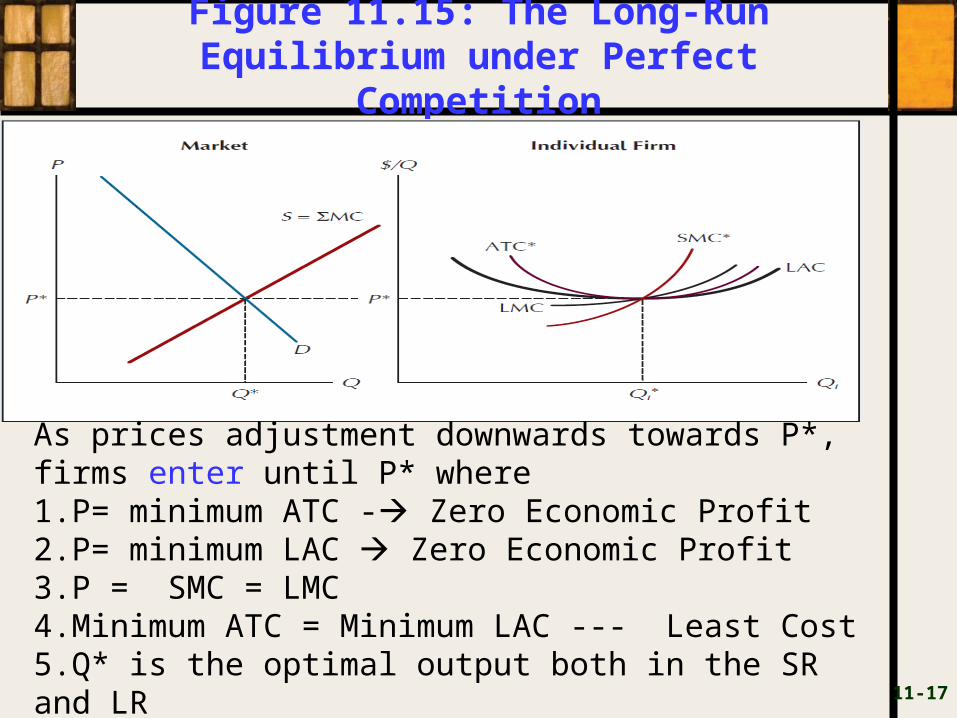
Figure 11.15: The Long-Run Equilibrium under Perfect
Competition
11-17
As prices adjustment downwards towards P*, firms enter until P* where 1.P= minimum ATC - Zero Economic Profit2.P= minimum LAC Zero Economic Profit3.P = SMC = LMC4.Minimum ATC = Minimum LAC --- Least Cost 5.Q* is the optimal output both in the SR and LRThese are the fundamental benchmark results from PC

The Invisible Hand
Why are competitive markets attractive from the perspective of society as a whole? Price is equal to Marginal Cost.
• The last unit of output consumed is worth exactly the same to the buyer as the resources required to produce it, i.e. no gouging of consumers by firms.
Price is equal to the minimum point on the long-run average cost curve, i.e. firms zero economic profits in the LR.There is no less costly way of producing the
product.All producers earn only a normal rate of profit.
• The public pays not a penny more than what it cost the firms to serve them.
11-18
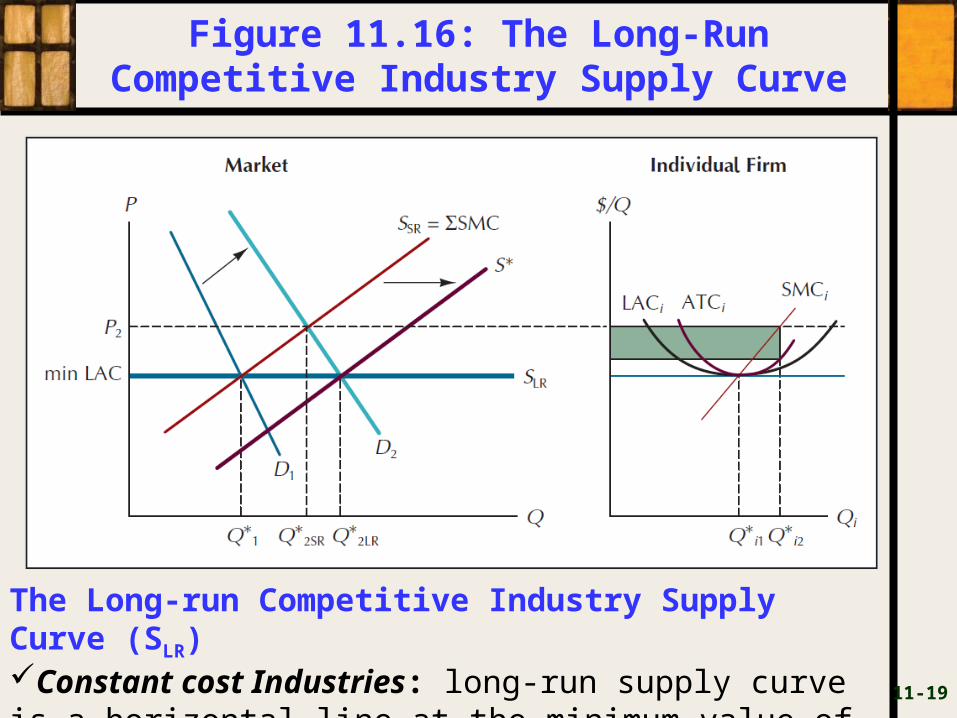
Figure 11.16: The Long-Run Competitive Industry Supply Curve
11-19
The Long-run Competitive Industry Supply Curve (SLR)Constant cost Industries: long-run supply curve is a horizontal line at the minimum value of the LAC curve.
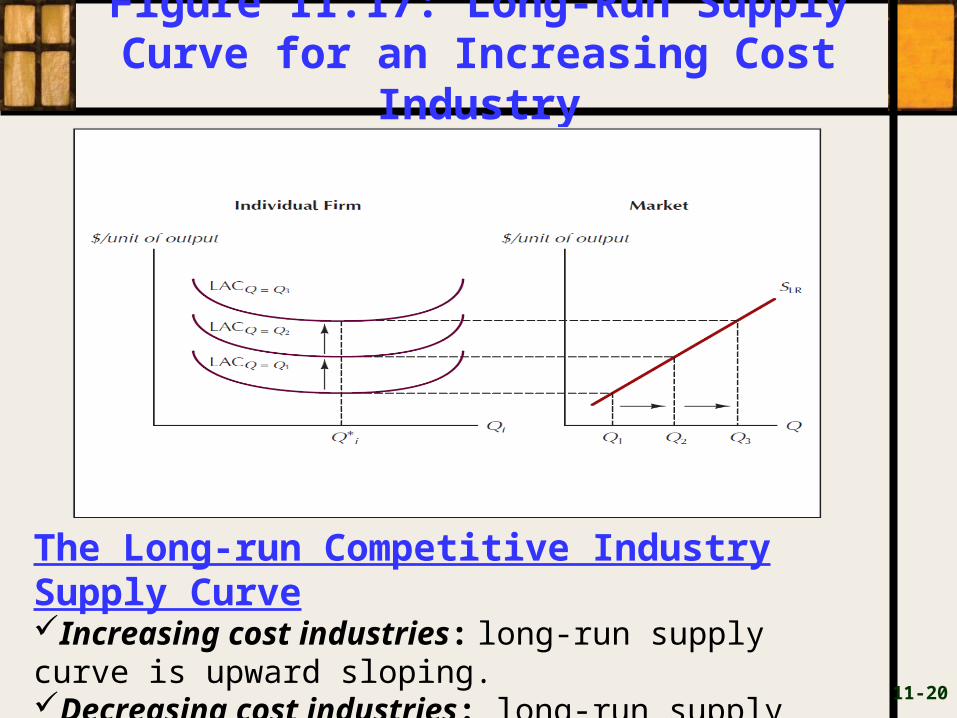
Figure 11.17: Long-Run Supply Curve for an Increasing Cost
Industry
11-20
The Long-run Competitive Industry Supply CurveIncreasing cost industries: long-run supply curve is upward sloping.Decreasing cost industries: long-run supply curve is downward-sloping.
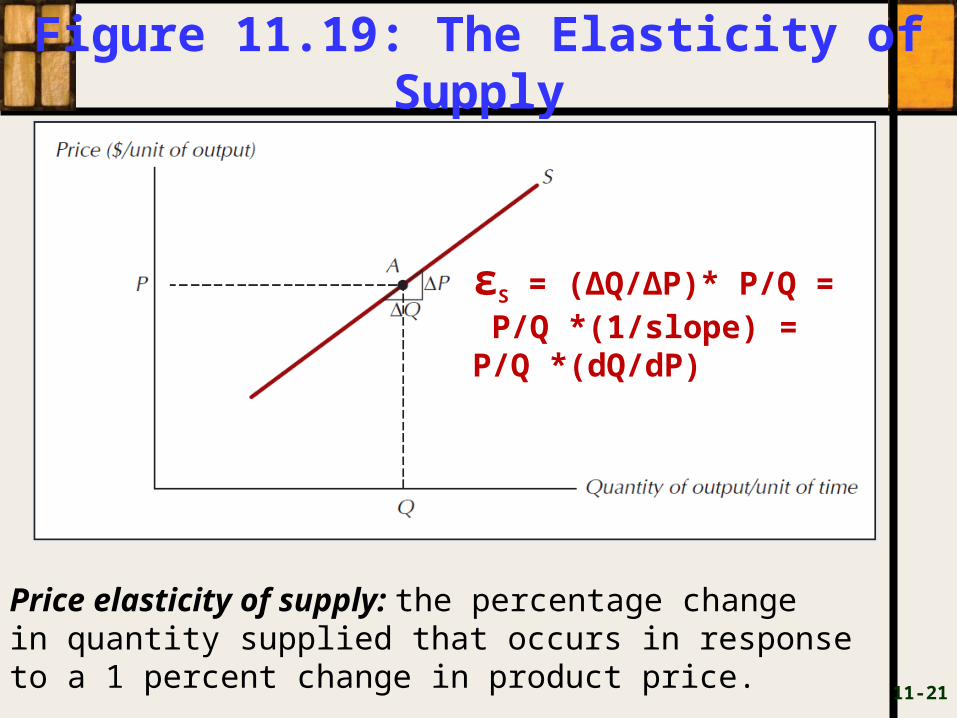
Figure 11.19: The Elasticity of Supply
11-21
Price elasticity of supply: the percentage change in quantity supplied that occurs in response to a 1 percent change in product price.
εS = (∆Q/∆P)* P/Q = P/Q *(1/slope) = P/Q *(dQ/dP)
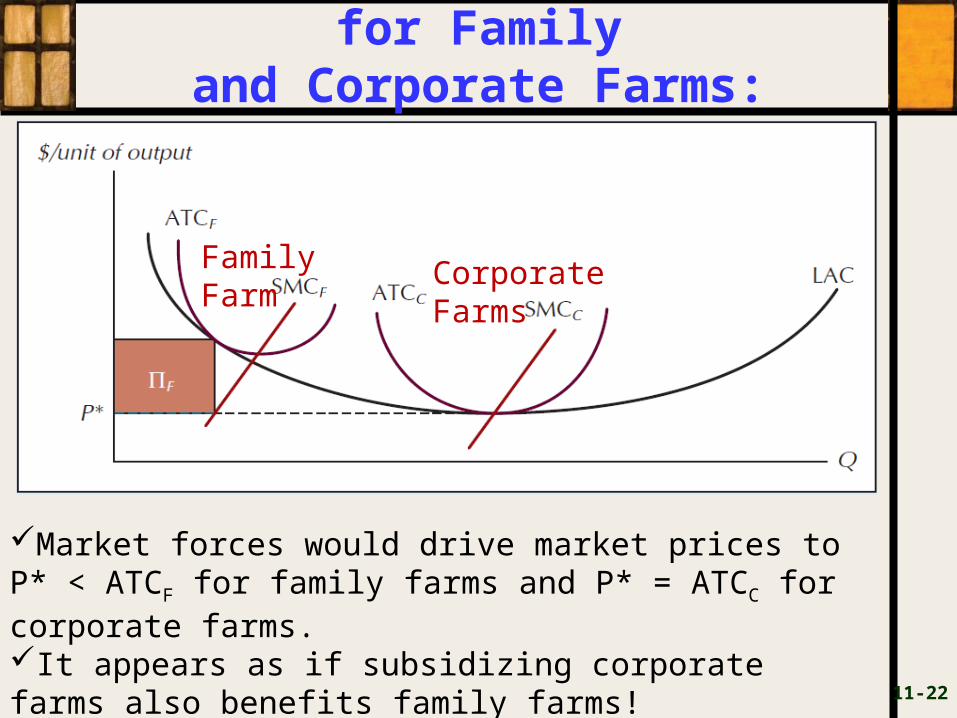
Figure 11.20: Cost Curves for Family
and Corporate Farms: Application 1
11-22
Family Farm
Corporate Farms
Market forces would drive market prices to P* < ATCF for family farms and P* = ATCC for corporate farms.It appears as if subsidizing corporate farms also benefits family farms!
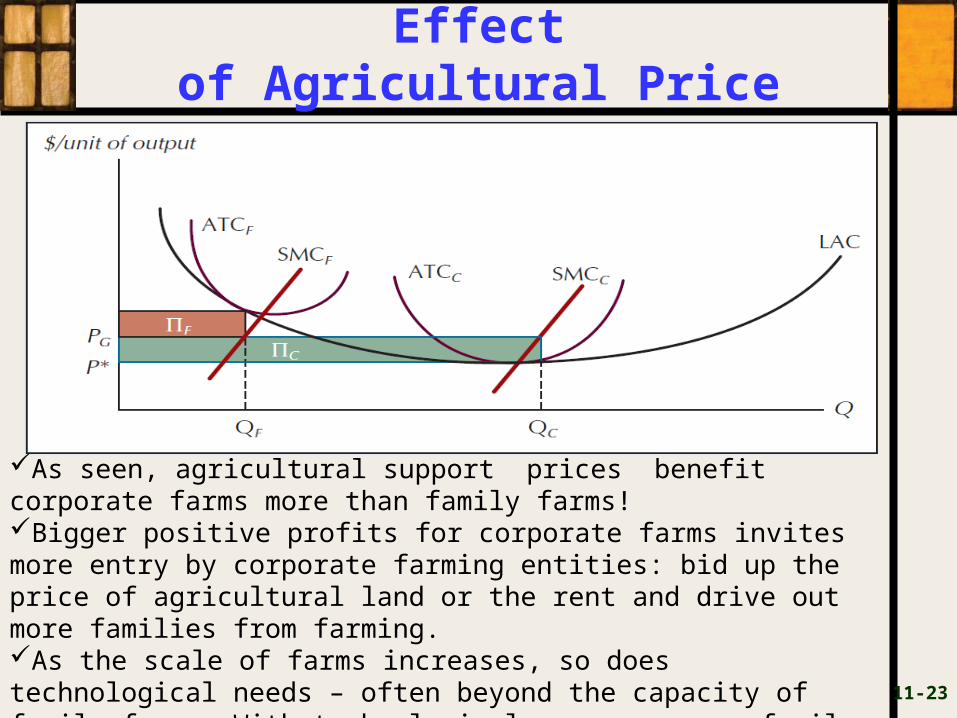
Figure 11.21: The Short-Run Effect
of Agricultural Price Supports
11-23
As seen, agricultural support prices benefit corporate farms more than family farms!Bigger positive profits for corporate farms invites more entry by corporate farming entities: bid up the price of agricultural land or the rent and drive out more families from farming.As the scale of farms increases, so does technological needs – often beyond the capacity of family farms. With technological progress more family farms will be lost to large scale agriculture.
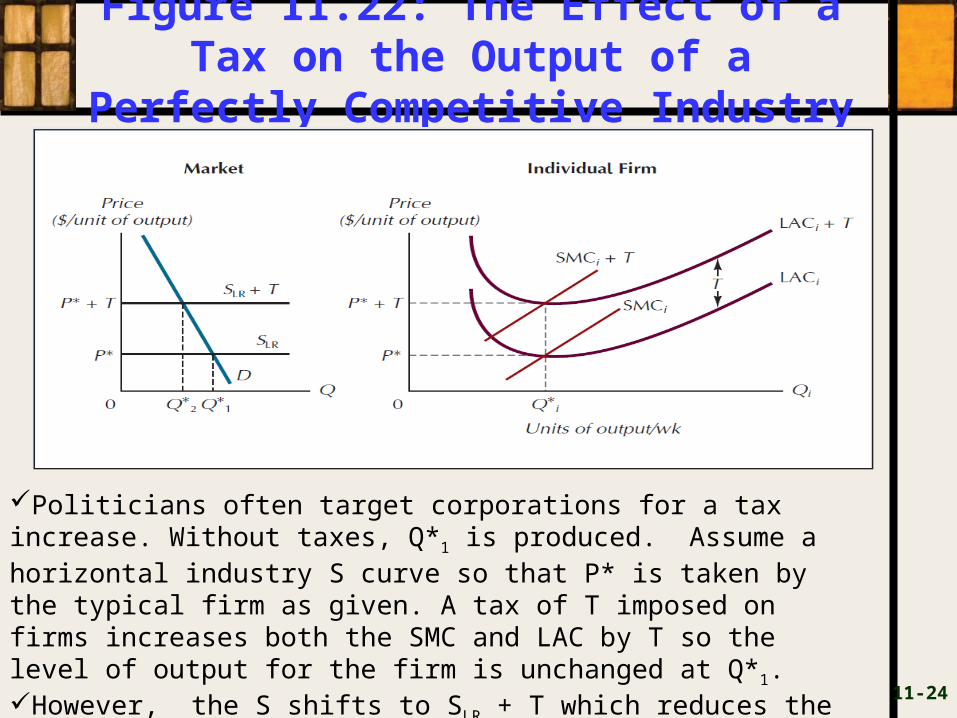
Figure 11.22: The Effect of a Tax on the Output of a Perfectly
Competitive Industry
11-24
Politicians often target corporations for a tax increase. Without taxes, Q*1 is produced. Assume a horizontal industry S curve so that P* is taken by the typical firm as given. A tax of T imposed on firms increases both the SMC and LAC by T so the level of output for the firm is unchanged at Q*1.However, the S shifts to SLR + T which reduces the industry output from Q*1 to Q*2. That is, firms have completely shifted the incidence of T to consumers!