Model Number - AllianTech spreadsheet or other application such as the VibraScout Post Processor....
24
Transcript of Model Number - AllianTech spreadsheet or other application such as the VibraScout Post Processor....
Model Number DOC NO7543A PS7543A
REV A, ECN 8845
This family also includes:
Model Input Range (g)Frequency
response (Hz)Non-Linearity
(%F.S) Max.Shock Noise Differential
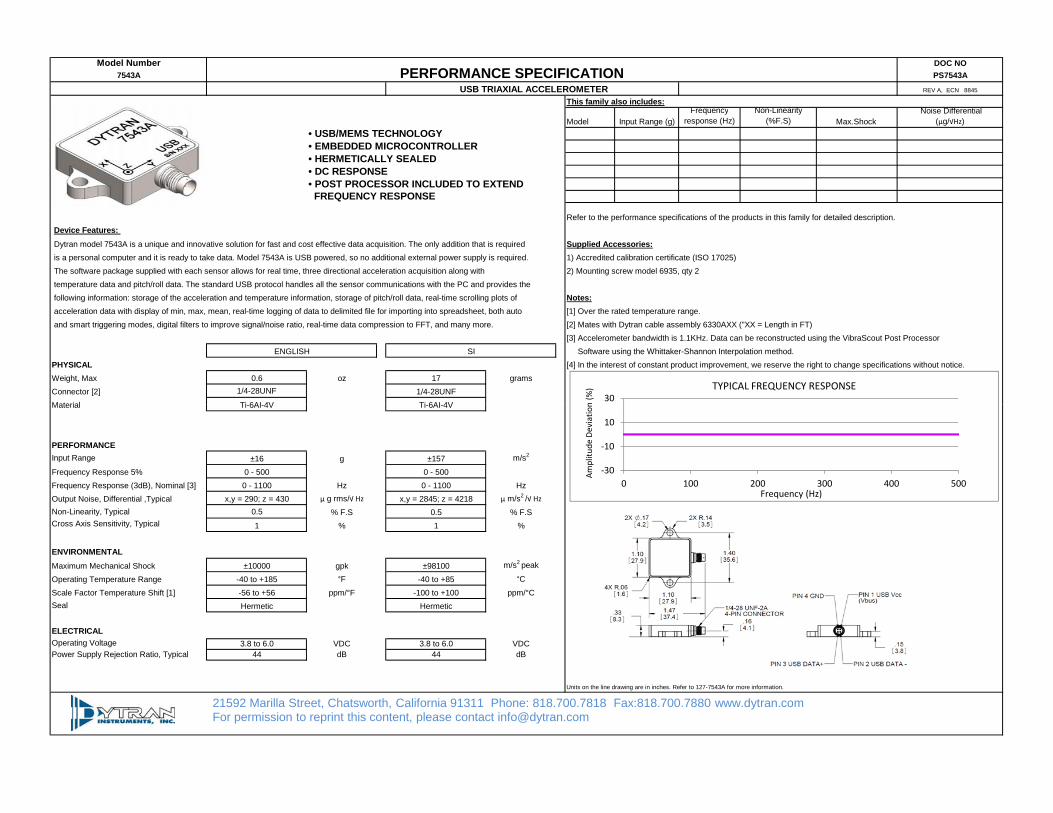
(μg/√Hz)• USB/MEMS TECHNOLOGY• EMBEDDED MICROCONTROLLER• HERMETICALLY SEALED • DC RESPONSE• POST PROCESSOR INCLUDED TO EXTEND FREQUENCY RESPONSE
Device Features: Dytran model 7543A is a unique and innovative solution for fast and cost effective data acquisition. The only addition that is required Supplied Accessories: is a personal computer and it is ready to take data. Model 7543A is USB powered, so no additional external power supply is required. 1) Accredited calibration certificate (ISO 17025) The software package supplied with each sensor allows for real time, three directional acceleration acquisition along with 2) Mounting screw model 6935, qty 2 temperature data and pitch/roll data. The standard USB protocol handles all the sensor communications with the PC and provides the following information: storage of the acceleration and temperature information, storage of pitch/roll data, real-time scrolling plots of Notes: acceleration data with display of min, max, mean, real-time logging of data to delimited file for importing into spreadsheet, both auto [1] Over the rated temperature range. and smart triggering modes, digital filters to improve signal/noise ratio, real-time data compression to FFT, and many more. [2] Mates with Dytran cable assembly 6330AXX ("XX = Length in FT)
[3] Accelerometer bandwidth is 1.1KHz. Data can be reconstructed using the VibraScout Post Processor Software using the Whittaker-Shannon Interpolation method.
PHYSICAL [4] In the interest of constant product improvement, we reserve the right to change specifications without notice.Weight, Max 0.6 oz 17 gramsConnector [2] 1/4-28UNF 1/4-28UNFMaterial Ti 6AI 4V Ti 6AI 4V
PERFORMANCE SPECIFICATION USB TRIAXIAL ACCELEROMETER
ENGLISH SI
Refer to the performance specifications of the products in this family for detailed description.
30
n (%
) TYPICAL FREQUENCY RESPONSE
Material Ti-6AI-4V Ti-6AI-4V
PERFORMANCE Input Range ±16 g ±157 m/s2
Frequency Response 5% 0 - 500 0 - 500Frequency Response (3dB), Nominal [3] 0 - 1100 Hz 0 - 1100 HzOutput Noise, Differential ,Typical x,y = 290; z = 430 μ g rms/√ Hz x,y = 2845; z = 4218 μ m/s2 /√ HzNon-Linearity, Typical 0.5 % F.S 0.5 % F.SCross Axis Sensitivity, Typical 1 % 1 %
ENVIRONMENTALMaximum Mechanical Shock ±10000 gpk ±98100 m/s2 peak
Operating Temperature Range -40 to +185 °F -40 to +85 °C
Scale Factor Temperature Shift [1] -56 to +56 ppm/°F -100 to +100 ppm/°CSeal Hermetic Hermetic
ELECTRICALOperating Voltage 3.8 to 6.0 VDC 3.8 to 6.0 VDCPower Supply Rejection Ratio, Typical 44 dB 44 dB
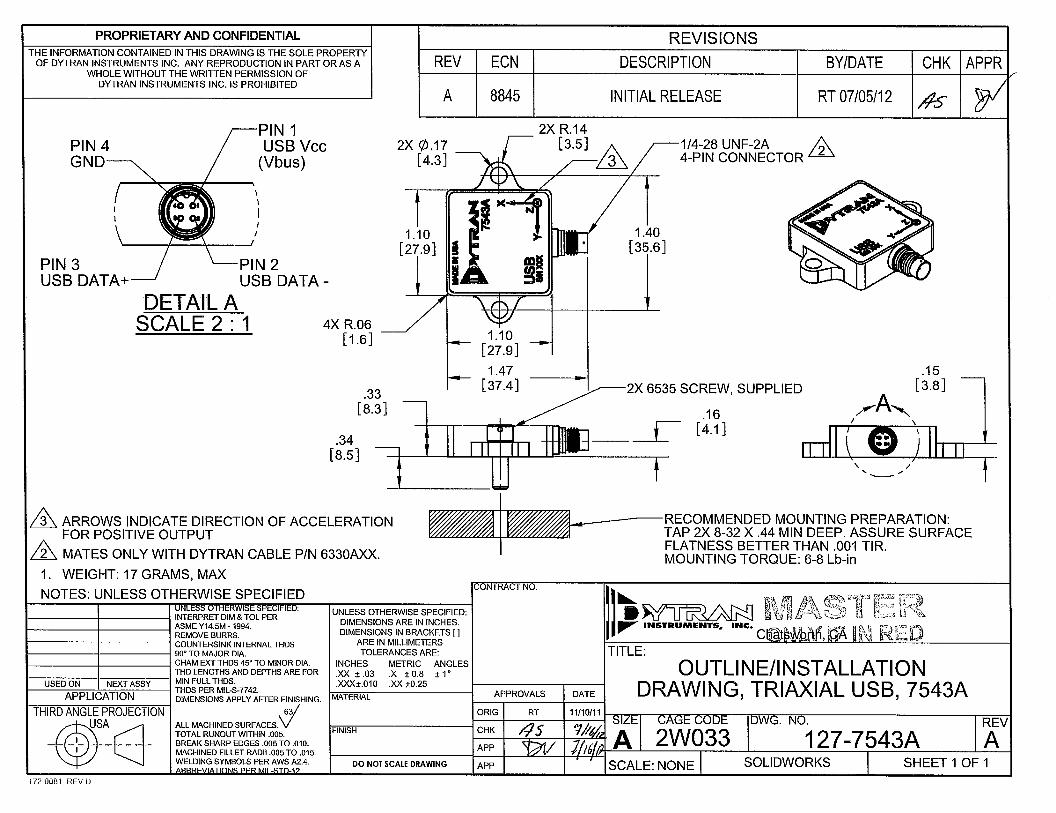
Units on the line drawing are in inches. Refer to 127-7543A for more information.
21592 Marilla Street, Chatsworth, California 91311 Phone: 818.700.7818 Fax:818.700.7880 www.dytran.com For permission to reprint this content, please contact [email protected]
‐30
‐10
10
0 100 200 300 400 500
Amplitu
de Deviatio
n
Frequency (Hz)
D y n a m i c T r a n s d u c e r s a n d S y s t e m s 2 1 5 9 2 M a r i l l a S t . • C h a t s w o r t h , C A 9 1 3 1 1 • P h o n e 8 1 8 - 7 0 0 - 7 8 1 8 w w w . d y t r a n . c o m • e - m a i l : i n f o @ d y t r a n . c o m
OG5340 REV A, 07/13/12, ECN 8482
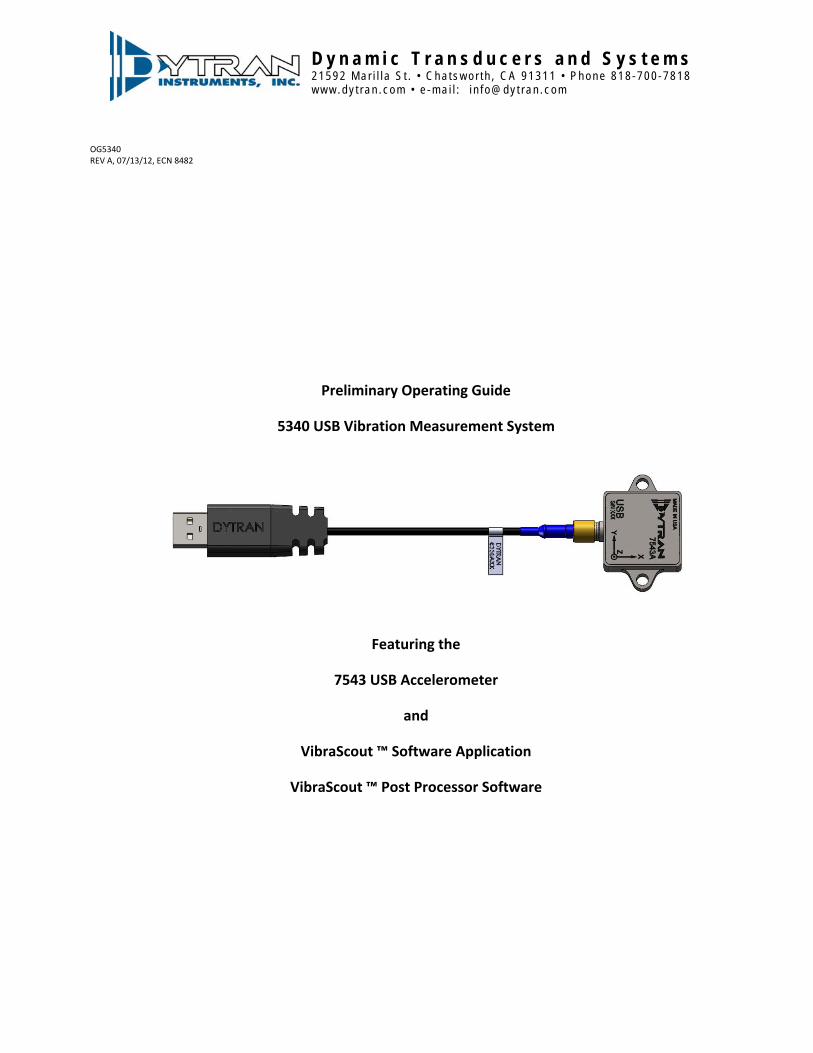
Preliminary Operating Guide
5340 USB Vibration Measurement System
Featuring the
7543 USB Accelerometer
and
VibraScout ™ Software Application
VibraScout ™ Post Processor Software
Dytran Instruments, Inc. OG5340 REV A, 07/13/12, ECN 8482
2
Contents
1 Device Features ................................................................................................................................................. 3
2 VibraScout™ Software Features ........................................................................................................................ 3
3 Acronyms used in this manual .......................................................................................................................... 4
4 Recommended Minimum System Requirements (for operation at maximum 1600 Hz BW) ........................... 4
5 Basic System Requirements .............................................................................................................................. 4
6 Installation ......................................................................................................................................................... 4
7 Starting the VibraScout ™ application .............................................................................................................. 6
8 GUI layout & Description of Software Features ................................................................................................ 7
9 Custom Applications ........................................................................................................................................ 15
10 VibraScout ™ Post Processor Software Features ............................................................................................ 15
11 Minimum System Requirements ..................................................................................................................... 15
12 Installation ....................................................................................................................................................... 15
13 Starting the VibraScout™PP application ......................................................................................................... 17
14 Software Operation ......................................................................................................................................... 17
15 Software License, Restrictions, and Disclaimer ............................................................................................... 22
Dytran Instruments, Inc. OG5340 REV A, 07/13/12, ECN 8482
3
The Dytran 7543A USB Digital Triaxial Accelerometer combines a 3‐Axis MEMS accelerometer with
a microcontroller to create an intelligent sensor.
1 DeviceFeatures‐System components:
USB 7543 Accelerometer 6330A 4‐pin to USB cable VibraScout™ Software and VibraScoutTMPP on CD
‐The 7543A is powered by a PC’s USB bus.
‐Temperature sensor.
‐Real‐time acquisition and USB transfer of acceleration (including pitch and roll) and temperature data.
‐Built‐in firmware handles USB communication and provides a number of unique features including:
Storage of device serial number
Storage of accelerometer and temperature calibration data
Additional storage available for customer information ‐ e.g. last calibration date, etc.
2 VibraScout™SoftwareFeatures‐Real‐time scrolling plots of acceleration data with display of min, max, mean
‐Plot features: zoom & pan, display of individual sample values, save to image file, printing
‐Real‐time display of pitch, roll, temperature
‐Real‐time logging of data to delimited file for importing into spreadsheet
Dytran Instruments, Inc. OG5340 REV A, 07/13/12, ECN 8482
4
‐Both auto and smart triggering modes
‐Digital filters to improve signal to noise ratio
‐Real‐time data compression
‐Fast Fourier Transform Plots of all orthogonal channels.
‐ API available as .NET dll
3 AcronymsusedinthismanualGUI‐ Graphical User Interface USB‐ Universal Serial Bus FFT‐ Fast Fourier Transform PSD‐Power Spectral Density JPG‐Joint Photographic File format ASCII‐American Standard Code for Information Interchange TDMS‐Technical Data Management Solution (Binary and ASCII file saving option for smaller file sizes with stored header information) UFF58‐ Universal File Format 58 (purely binary file format for data recording)
4 RecommendedMinimumSystemRequirements(foroperationatmaximum1600HzBW)CPU: i7 870 2.93GHz or faster RAM: 8GB OS: Windows 7 64 bit
5 BasicSystemRequirementsFree Hard Disk Space: 2 MB (not including .NET Framework 4) OS: Windows XP or Windows 7 One available USB 2.0 port
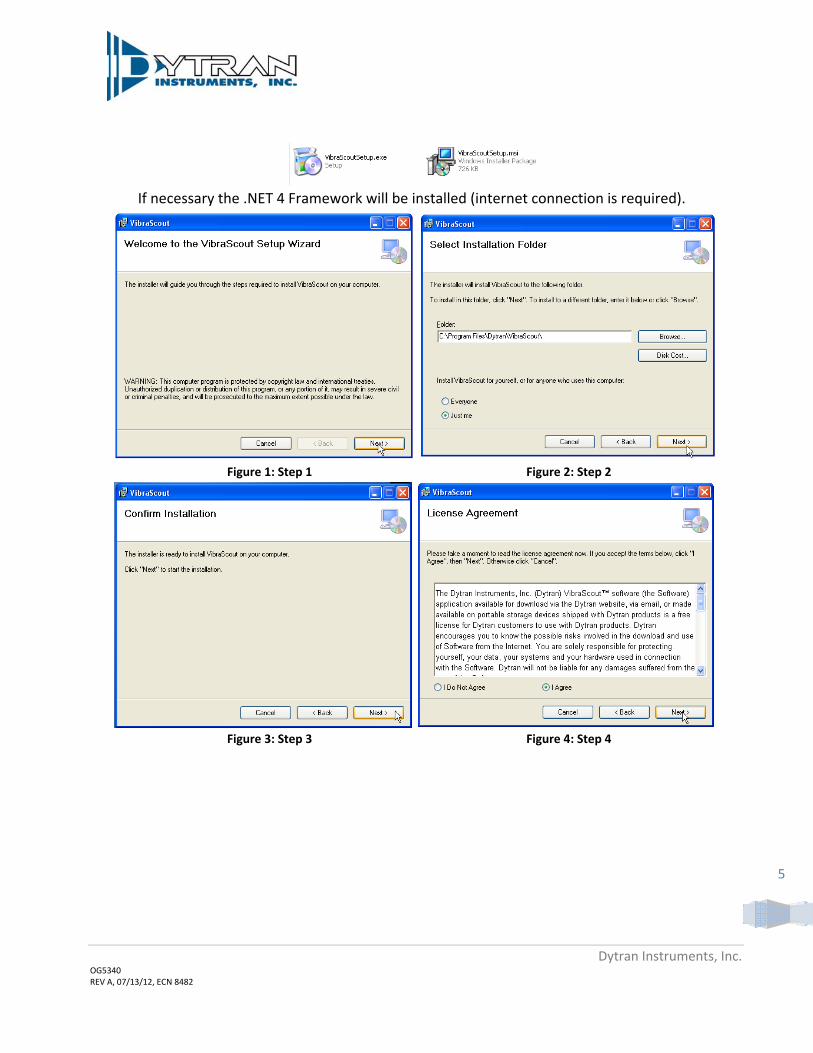
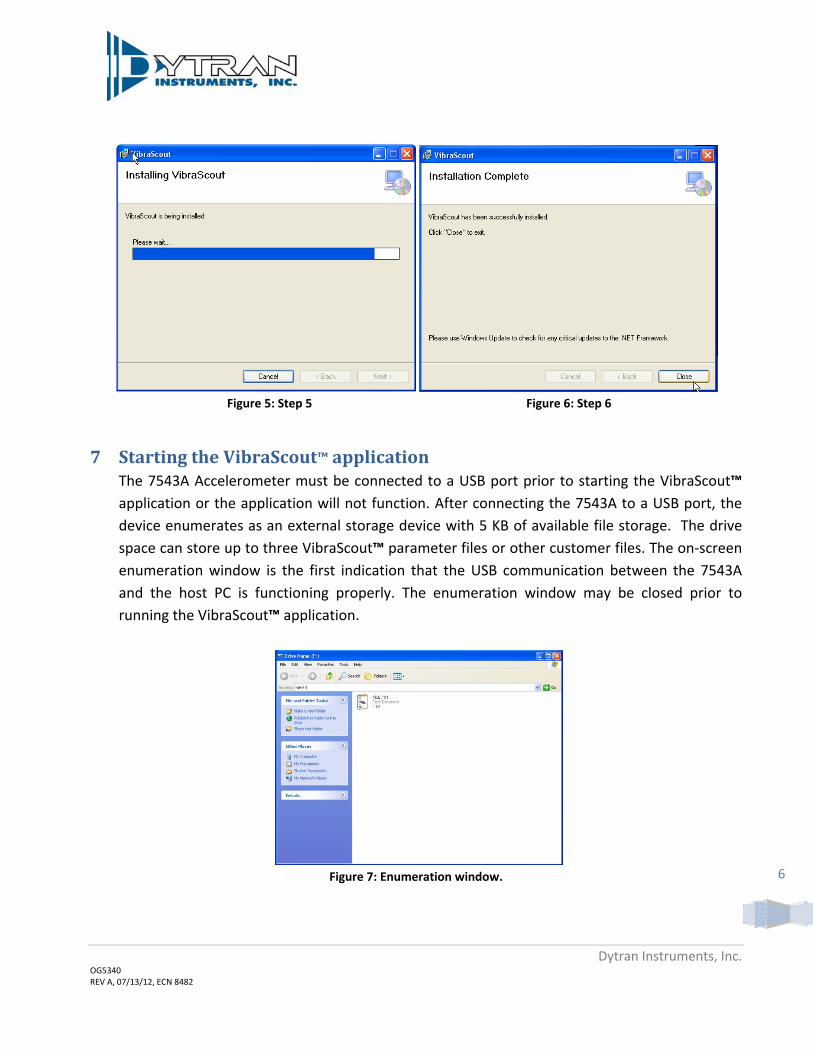
6 InstallationInsert CD into an empty CD/DVD drive. From My computer double click on CD/DVD drive. Navigate to VibraScout Acquisition Folder. Double click VibraScoutSetup.exe to run the setup file. Follow the on‐screen instructions shown below to install the VibraScout application.
Dytran Instruments, Inc. OG5340 REV A, 07/13/12, ECN 8482
5
If necessary the .NET 4 Framework will be installed (internet connection is required).
Figure 1: Step 1 Figure 2: Step 2
Figure 3: Step 3 Figure 4: Step 4
Dytran Instruments, Inc. OG5340 REV A, 07/13/12, ECN 8482
6
Figure 5: Step 5 Figure 6: Step 6
7 StartingtheVibraScout™applicationThe 7543A Accelerometer must be connected to a USB port prior to starting the VibraScout™ application or the application will not function. After connecting the 7543A to a USB port, the device enumerates as an external storage device with 5 KB of available file storage. The drive space can store up to three VibraScout™ parameter files or other customer files. The on‐screen enumeration window is the first indication that the USB communication between the 7543A and the host PC is functioning properly. The enumeration window may be closed prior to running the VibraScout™ application.
Figure 7: Enumeration window.
Dytran Instruments, Inc. OG5340 REV A, 07/13/12, ECN 8482
7
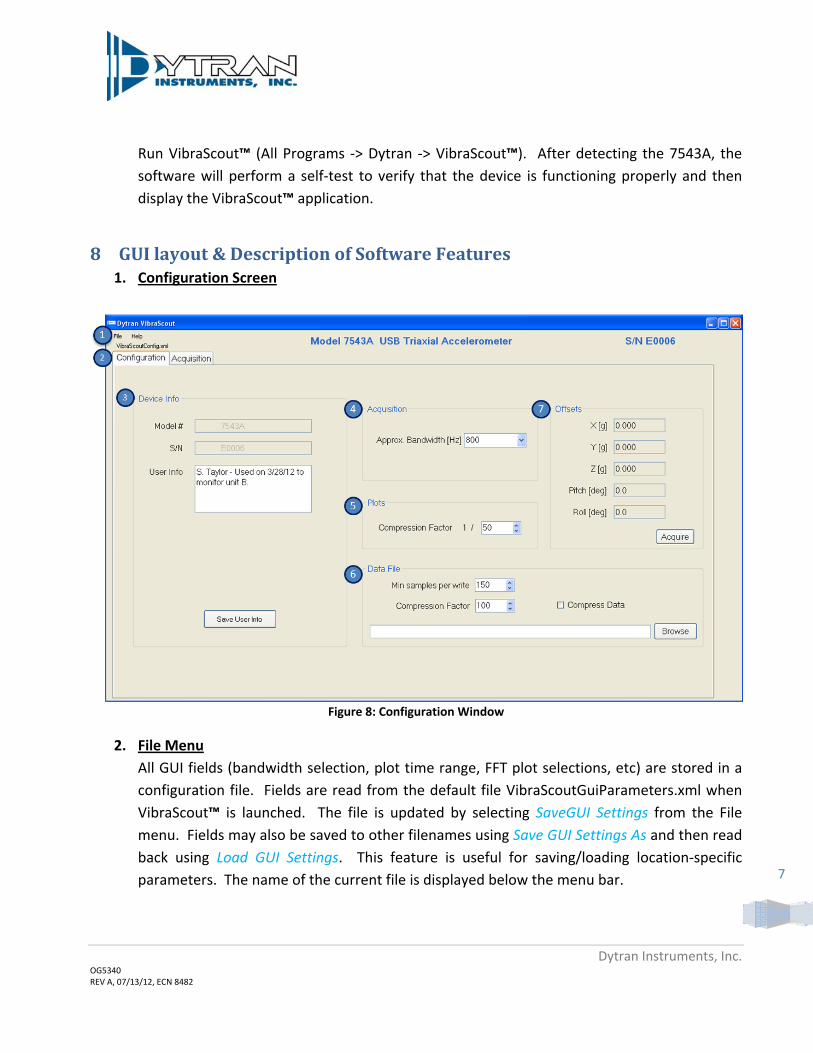
Run VibraScout™ (All Programs ‐> Dytran ‐> VibraScout™). After detecting the 7543A, the software will perform a self‐test to verify that the device is functioning properly and then display the VibraScout™ application.
8 GUIlayout&DescriptionofSoftwareFeatures1. Configuration Screen
Figure 8: Configuration Window
2. File Menu
All GUI fields (bandwidth selection, plot time range, FFT plot selections, etc) are stored in a configuration file. Fields are read from the default file VibraScoutGuiParameters.xml when VibraScout™ is launched. The file is updated by selecting SaveGUI Settings from the File menu. Fields may also be saved to other filenames using Save GUI Settings As and then read back using Load GUI Settings. This feature is useful for saving/loading location‐specific parameters. The name of the current file is displayed below the menu bar.
Dytran Instruments, Inc. OG5340 REV A, 07/13/12, ECN 8482
8
Current plot data can be exported to a selected tab‐delimited file for convenient importing in a spreadsheet or other application such as the VibraScout Post Processor. This feature provides an alternative to the data log file by allowing the user to export data after acquisition.
3. Device Info
Model # and Serial # are stored in the device EEPROM and read when the VibraScout™ application is launched. Device memory is also available to store user information. Enter up to 180 characters in the User Info field and click on Save User Info to store the information in non‐volatile memory. When VibraScout™ is launched, the information will be read from the device and appear in the User Info field.
4. Approximate Bandwidth
Select the desired bandwidth based on the application requirements. The noise level increases with bandwidth, so selecting a lower bandwidth will provide improved signal/noise at the expense of frequency response. The 7543A sample rate is equal to approximately twice the selected bandwidth, so the maximum frequency displayed in FFT plots will always equal the selected bandwidth. In cases where data overflows occur due to inadequate system resources (CPU speed, RAM), selecting a lower bandwidth will usually eliminate the overflows. See the section on the Data Integrity indicator for more information.
5. Plots Compression Factor
Plots are compressed to provide smooth scrolling. The compression algorithm performs peak detection to replace a group of values with the minimum value and maximum value from that group, so the signal extremes are always displayed. The minimum compression is based on the Plots Compression Factor selection. Additional compression is performed depending on the plot Time Range selection on the Acquisition screen. When acquisition is stopped, plots may be zoomed to display all uncompressed data. Note that FFT calculations are based on uncompressed data and are not affected by the Plots Compression Factor.
Dytran Instruments, Inc. OG5340 REV A, 07/13/12, ECN 8482
9
6. Data File Settings
Min samples per write specifies the minimum number of samples to acquire and store before each write to the data file during acquisition. Increasing this value will reduce the frequency of disk updates. Note that the value has no effect on the total number of samples written to a file during an acquisition ‐ just the number of samples written each time the disk is updated.
Checking Select Data will enable data file compression. Like the plot compression, the data file compression replaces a group of values with the minimum value and maximum value from that group so the signal extremes are always saved. Increasing the Compression Factor will reduce the size of data files. The Data File path is selected with the Browse button. Data are saved as tab‐delimited text for easy importing into a spreadsheet or other application when the Log To File box is checked in the Acquisition screen.
7. Offsets
The 7543A is calibrated at the Dytran factory along each orthogonal axis using precision fixtures and earth’s gravity. When the 7543A is placed at any random position, the Offsets Acquire button allows the values for the three acceleration axes, pitch and roll to be captured and set to zero. Therefore, relative measurements may now be made from that position. The Relative mode must be selected on the Acquisition screen so offsets will be subtracted from the respective data during acquisition.
To reset the 7543A to factory defaults, simply select the Abs radio button in the Acquisition screen.
Dytran Instruments, Inc. OG5340 REV A, 07/13/12, ECN 8482
10
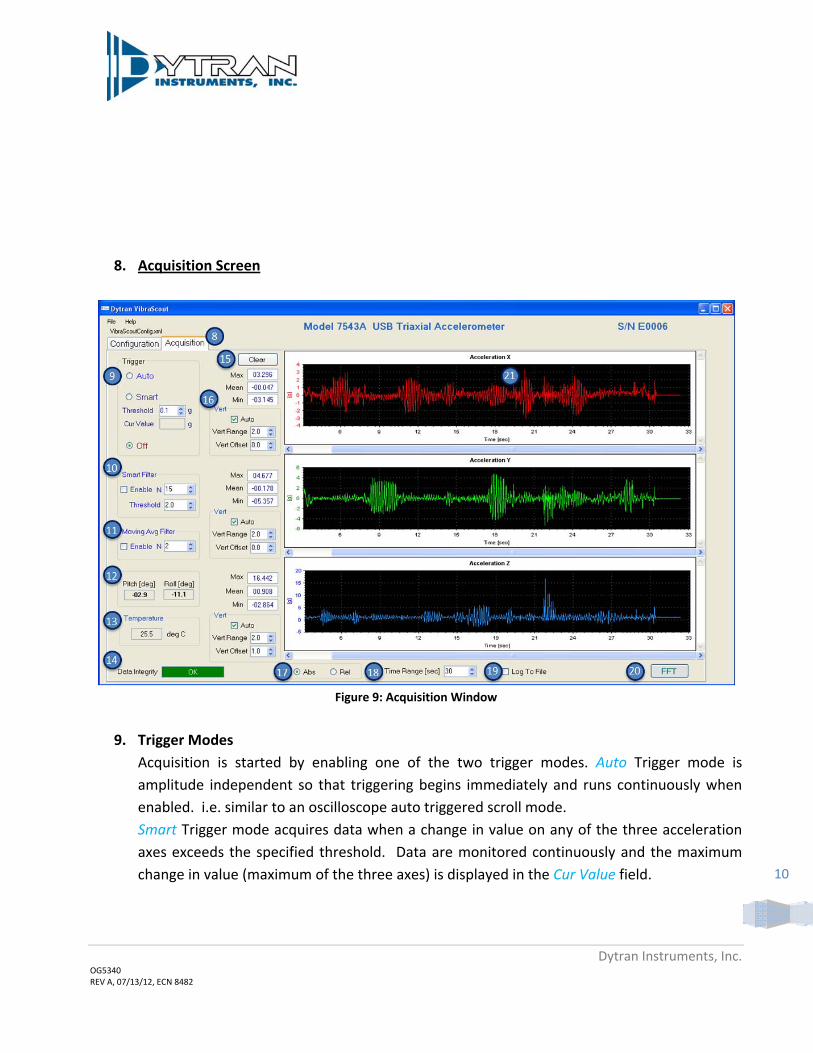
8. Acquisition Screen
Figure 9: Acquisition Window
9. Trigger Modes
Acquisition is started by enabling one of the two trigger modes. Auto Trigger mode is amplitude independent so that triggering begins immediately and runs continuously when enabled. i.e. similar to an oscilloscope auto triggered scroll mode. Smart Trigger mode acquires data when a change in value on any of the three acceleration axes exceeds the specified threshold. Data are monitored continuously and the maximum change in value (maximum of the three axes) is displayed in the Cur Value field.
Dytran Instruments, Inc. OG5340 REV A, 07/13/12, ECN 8482
11
10. Smart Filter
The smart filter performs conditional median filtering on acceleration data based on a specified threshold and window size. The filter can be very effective at reducing noise spikes, but it is inherently non‐linear so the effect on bandwidth is not well‐defined. The filter algorithm calculates the median value of a group of samples (group size specified by N); and any samples that exceed the median by a value equal to the specified Threshold * median are replaced with the median value.
11. Moving Average Filter
The Moving Avg Filter performs a continuous size N moving average on acceleration data. 12. Pitch & Roll Display
Pitch and roll values are updated continuously when the Auto or Smart Trigger is enabled.
13. Temperature Display
The temperature is measured and updated continuously when the Auto or Smart Trigger is enabled.
14. Data Integrity Indicator The Data Integrity box indicates one of three conditions: OK, Overflow, or Checksum Failure. An overflow condition occurs when system resources are inadequate to sustain data processing at the selected bandwidth. This might be due to CPU speed, insufficient free memory or cpu/memory ‐ intensive processes running concurrently with the VibraScout™ application. An overflow indicates a loss of some data samples. The condition can usually be eliminated by selecting a lower bandwidth. A Checksum Failure indicates a fault in USB communication. If this occurs, check the cable connection between the 7543A and the PC.
15. Clear Button
The Clear button clears the plots and the min, max, mean values.
16. Plot Vertical Axis Scaling Range and Offset values for each axis can be specified or Auto‐scaling can be selected to adjust the scale when an acceleration value exceeds the current range.
17. Absolute and Relative Mode
Dytran Instruments, Inc. OG5340 REV A, 07/13/12, ECN 8482
12
In Absolute mode (Abs), acceleration data are shown relative to the earth's gravitational field using the factory calibration. In Relative mode (Rel), the acceleration offsets are subtracted from the data using user selected Offset values acquired in the Configuration screen. See #7 Offsets in the Configuration section.
18. Plot Time Range
The time range of the plots is selectable. Note that 2x the selected range of data are saved and available for display by panning and zooming.
19. Log to File
Data File logging is enabled/disabled by the checkbox. The name of the data file and related parameters are first specified in the Configuration screen.
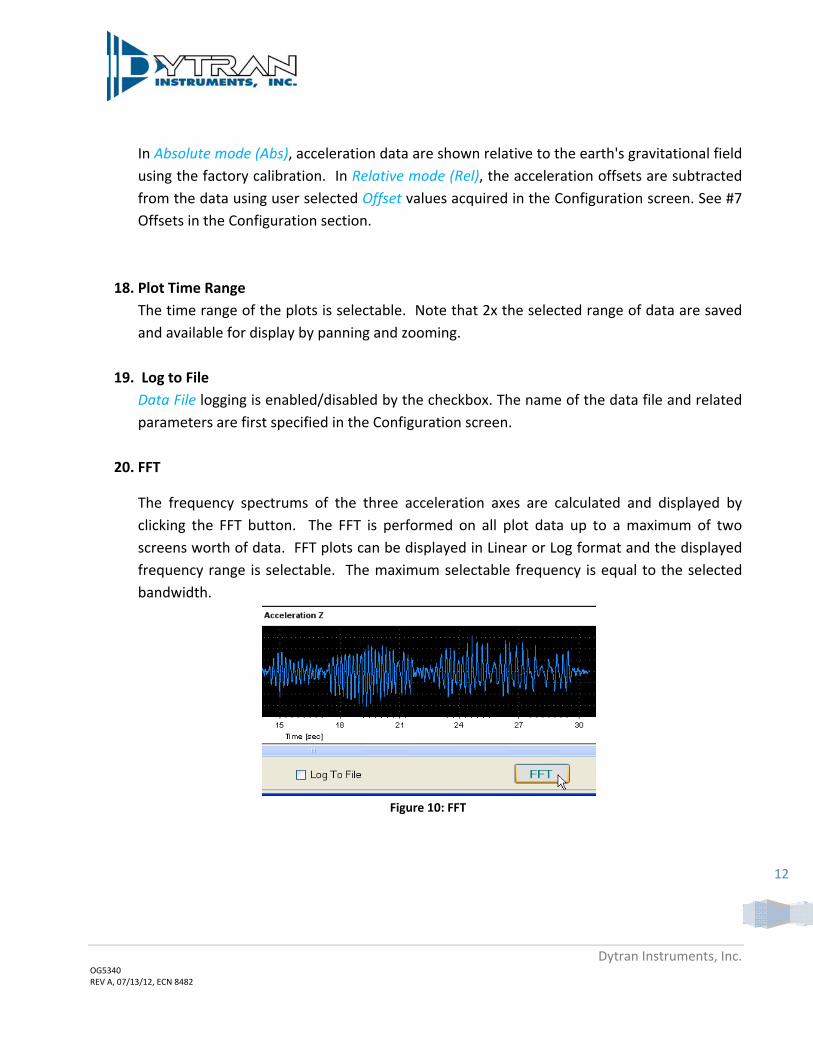
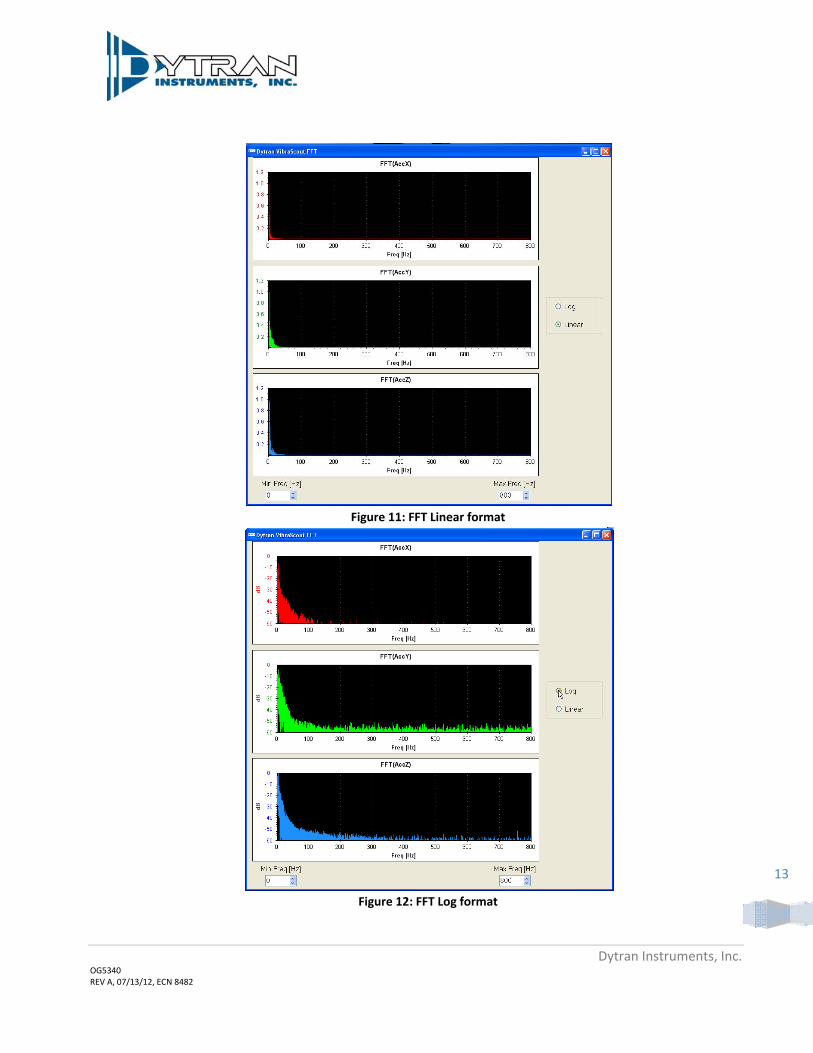
20. FFT
The frequency spectrums of the three acceleration axes are calculated and displayed by clicking the FFT button. The FFT is performed on all plot data up to a maximum of two screens worth of data. FFT plots can be displayed in Linear or Log format and the displayed frequency range is selectable. The maximum selectable frequency is equal to the selected bandwidth.
Figure 10: FFT
Dytran Instruments, Inc. OG5340 REV A, 07/13/12, ECN 8482
13
Figure 11: FFT Linear format
Figure 12: FFT Log format
Dytran Instruments, Inc. OG5340 REV A, 07/13/12, ECN 8482
14
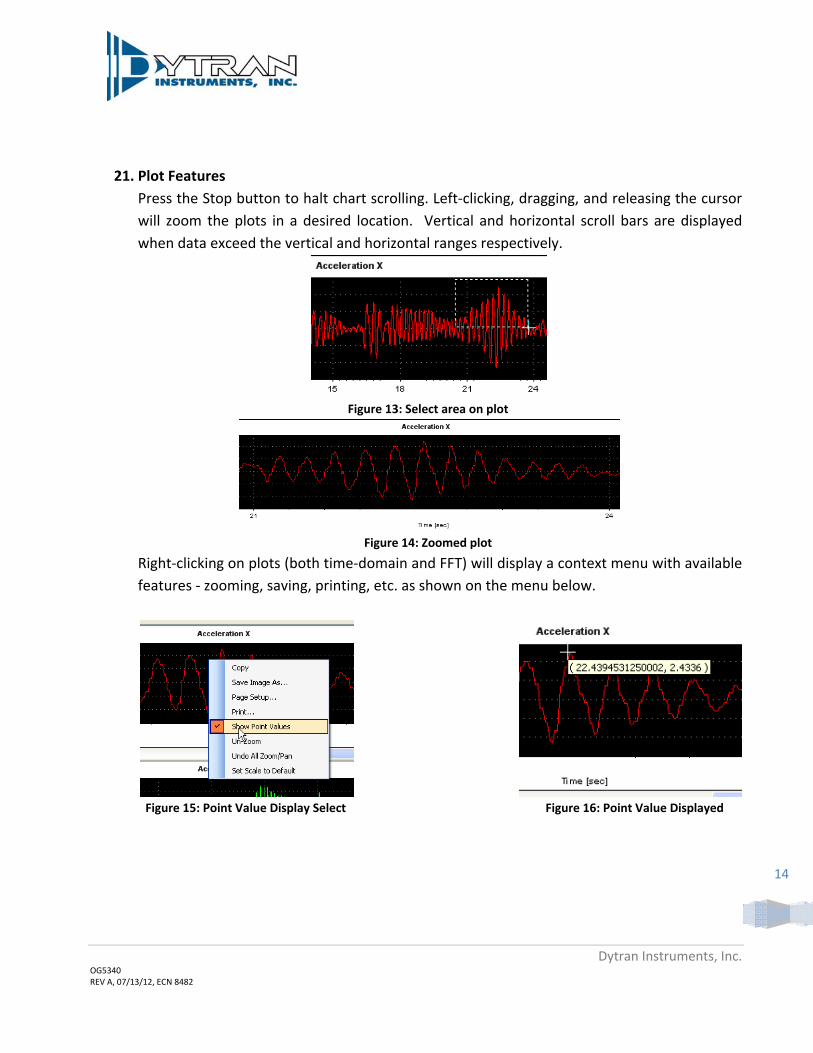
21. Plot Features Press the Stop button to halt chart scrolling. Left‐clicking, dragging, and releasing the cursor will zoom the plots in a desired location. Vertical and horizontal scroll bars are displayed when data exceed the vertical and horizontal ranges respectively.
Figure 13: Select area on plot
Figure 14: Zoomed plot
Right‐clicking on plots (both time‐domain and FFT) will display a context menu with available features ‐ zooming, saving, printing, etc. as shown on the menu below.
Figure 15: Point Value Display Select Figure 16: Point Value Displayed
Dytran Instruments, Inc. OG5340 REV A, 07/13/12, ECN 8482
15
9 CustomApplicationsAn API is available for customers who would like to build custom applications for the 7543A. The API provides support for any .NET‐compatible client application ‐ e.g. LabView, C#, etc. Please contact Dytran at [email protected] or 818‐700‐7818.
Custom application development is also available. Please contact Dytran at [email protected] or 818‐700‐7818 for more information.
10 VibraScout™PostProcessorSoftwareFeaturesVibraScout™ Post Processor software is designed to provide a user with the tools to apply non‐linear interpolation to resample raw data that are recorded with VibraScout™ software at higher frequencies to improve signal resolution. Data is valid only up to 1.5KHz after applying the post processing. This mathematical interpolation is performed using the Whittaker-Shannon interpolation technique to reproduce the recorded real signals with the proper amplitude.
Software features include:
Plot recorded data from the VibraScout™ software Zoom and select a specific timeframe of recorded data for post processing Reproduce interpolated oversampled data to provide better resolution of vibration
signals Multiple file types to export to including: ASCII, time history.JPG files, TDMS
binary files of time history data readable in Microsoft Excel, PSD and FFT plots in Joint Photographic file format.
Display of recorded average temperature
11 MinimumSystemRequirementsPersonal Computer running Windows XP/Vista/7 x86 or Windows XP/Vista/7 x64 with at least 2GB RAM or higher. 163MB of free hard disk space is required.
12 InstallationPlease contact Dytran Instruments, Inc. at (818) 700‐7818 for latest software revision. Check software revision while installing on welcome screen as in Figure 18.
Dytran Instruments, Inc. OG5340 REV A, 07/13/12, ECN 8482
16
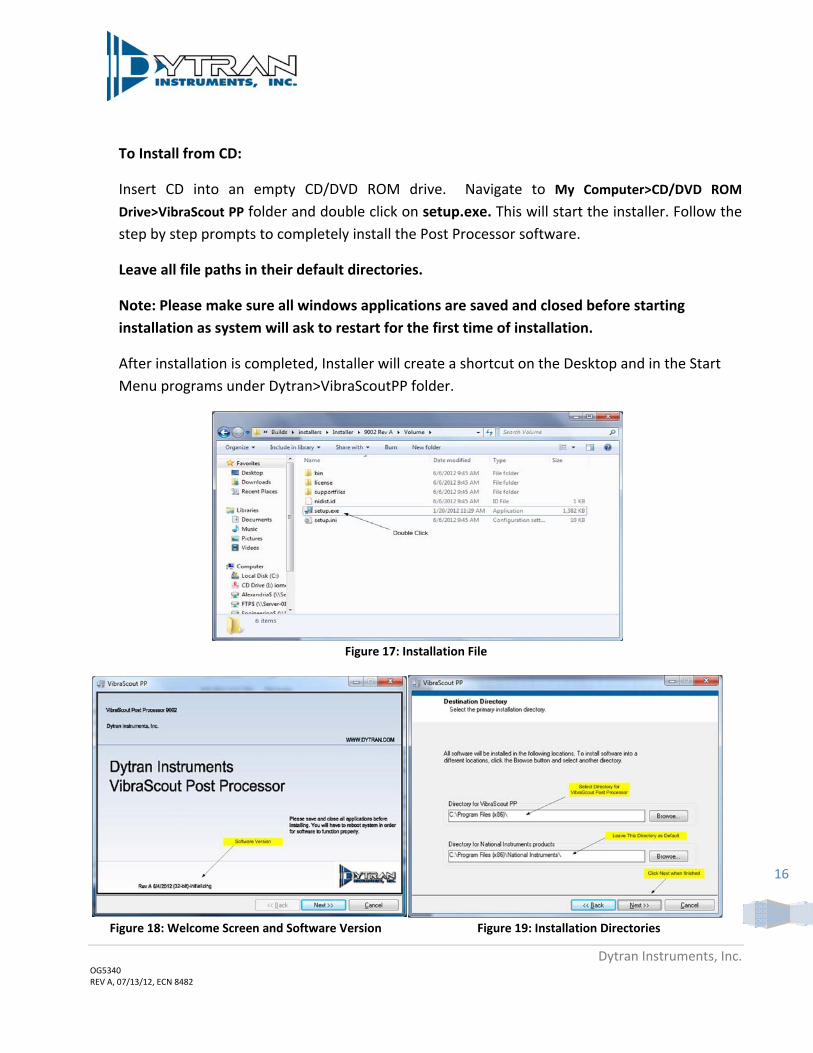
To Install from CD:
Insert CD into an empty CD/DVD ROM drive. Navigate to My Computer>CD/DVD ROM
Drive>VibraScout PP folder and double click on setup.exe. This will start the installer. Follow the step by step prompts to completely install the Post Processor software.
Leave all file paths in their default directories.
Note: Please make sure all windows applications are saved and closed before starting
installation as system will ask to restart for the first time of installation.
After installation is completed, Installer will create a shortcut on the Desktop and in the Start Menu programs under Dytran>VibraScoutPP folder.
Figure 17: Installation File
Figure 18: Welcome Screen and Software Version Figure 19: Installation Directories
Dytran Instruments, Inc. OG5340 REV A, 07/13/12, ECN 8482
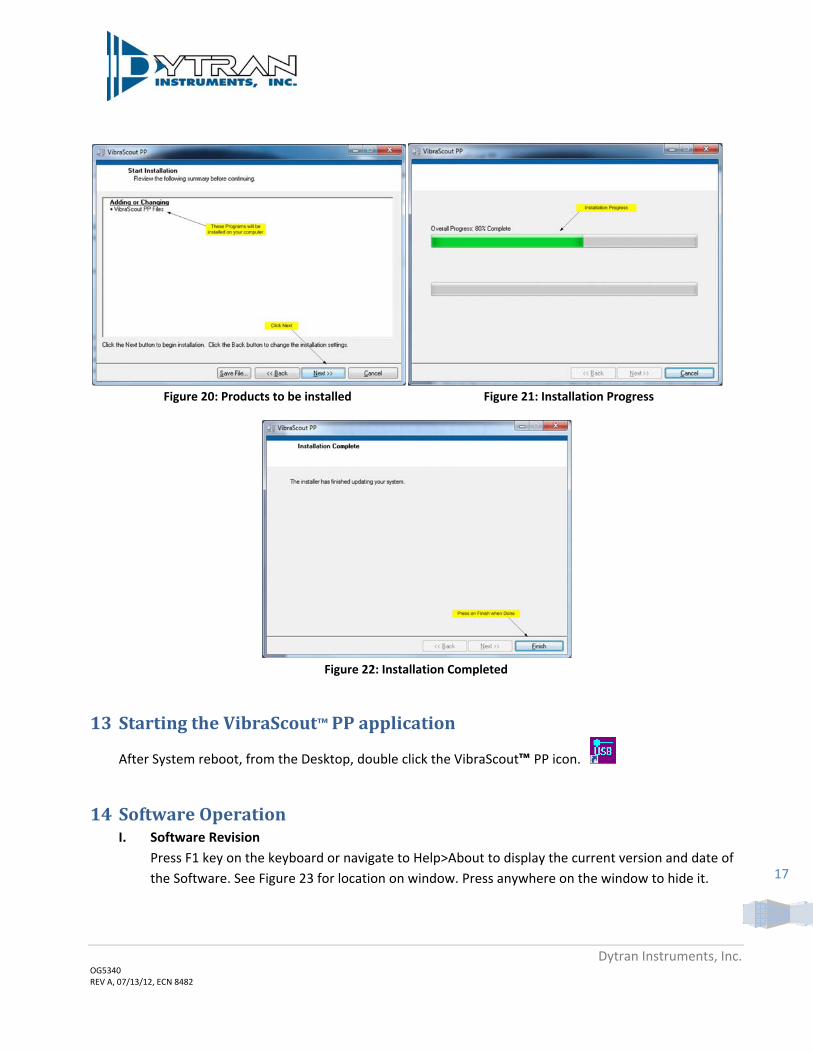
17
Figure 20: Products to be installed Figure 21: Installation Progress
Figure 22: Installation Completed
13 StartingtheVibraScout™PPapplication
After System reboot, from the Desktop, double click the VibraScout™ PP icon.
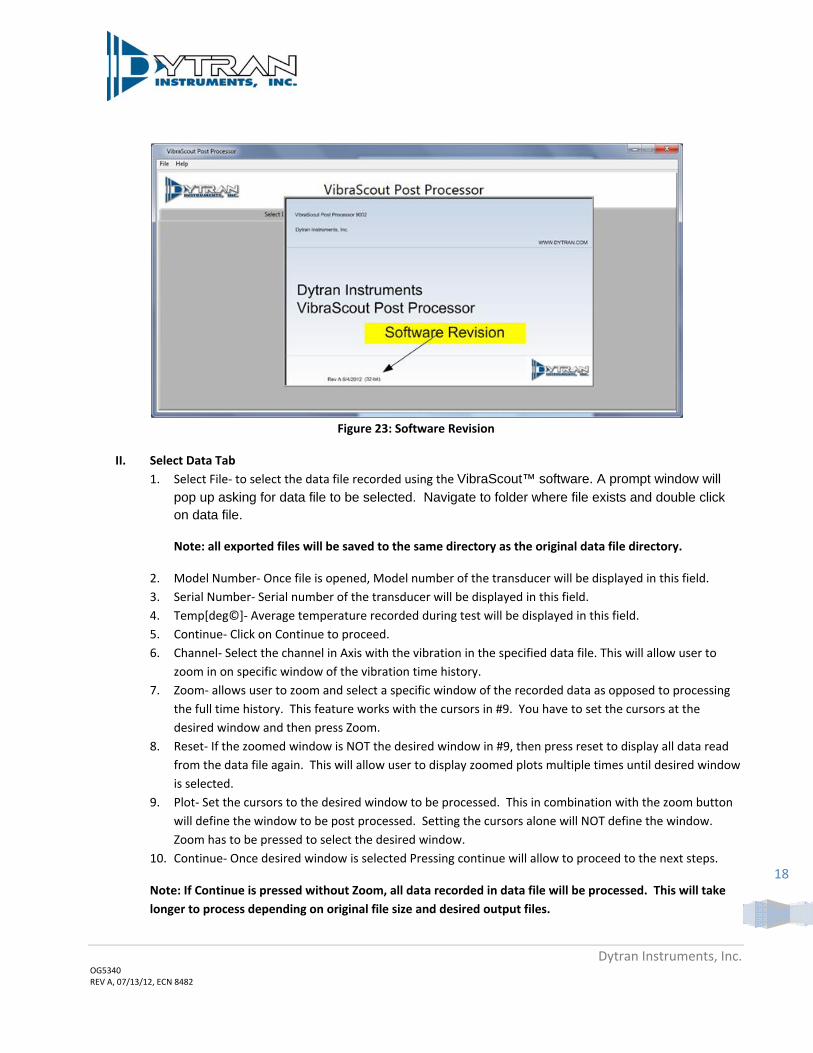
14 SoftwareOperationI. Software Revision
Press F1 key on the keyboard or navigate to Help>About to display the current version and date of the Software. See Figure 23 for location on window. Press anywhere on the window to hide it.
Dytran Instruments, Inc. OG5340 REV A, 07/13/12, ECN 8482
18
Figure 23: Software Revision
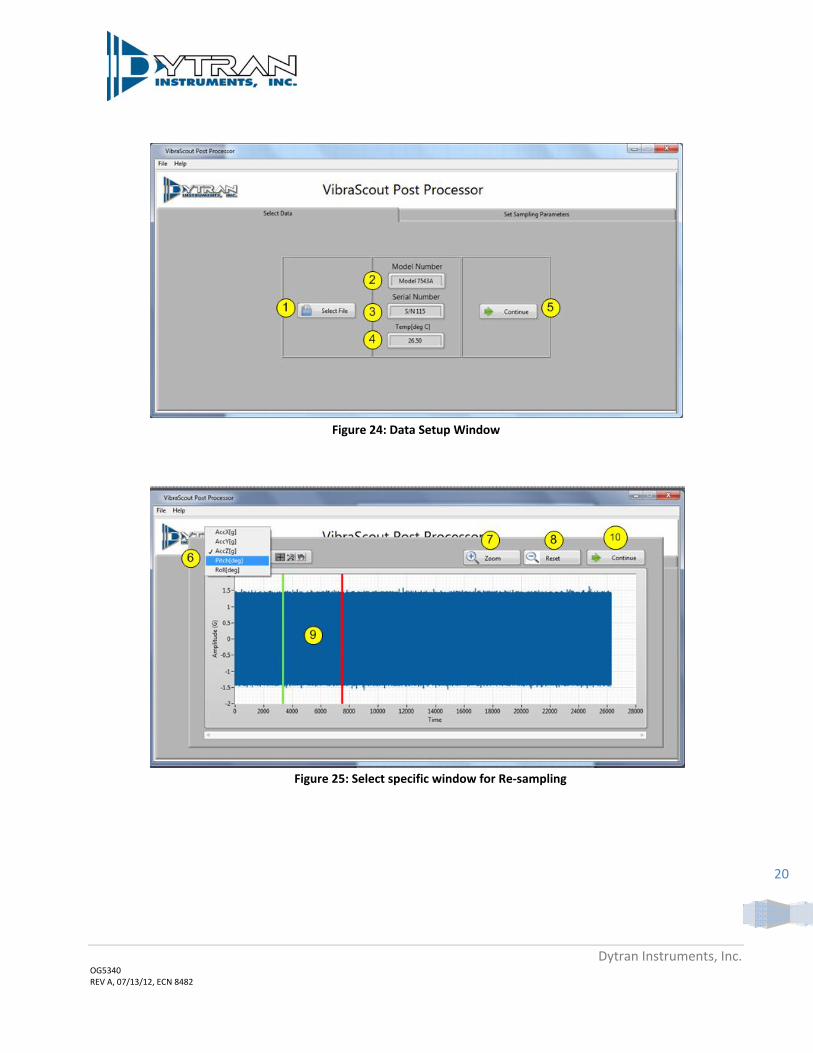
II. Select Data Tab
1. Select File‐ to select the data file recorded using the VibraScout™ software. A prompt window will pop up asking for data file to be selected. Navigate to folder where file exists and double click on data file.
Note: all exported files will be saved to the same directory as the original data file directory.
2. Model Number‐ Once file is opened, Model number of the transducer will be displayed in this field. 3. Serial Number‐ Serial number of the transducer will be displayed in this field. 4. Temp[deg©]‐ Average temperature recorded during test will be displayed in this field. 5. Continue‐ Click on Continue to proceed. 6. Channel‐ Select the channel in Axis with the vibration in the specified data file. This will allow user to
zoom in on specific window of the vibration time history. 7. Zoom‐ allows user to zoom and select a specific window of the recorded data as opposed to processing
the full time history. This feature works with the cursors in #9. You have to set the cursors at the desired window and then press Zoom.
8. Reset‐ If the zoomed window is NOT the desired window in #9, then press reset to display all data read from the data file again. This will allow user to display zoomed plots multiple times until desired window is selected.
9. Plot‐ Set the cursors to the desired window to be processed. This in combination with the zoom button will define the window to be post processed. Setting the cursors alone will NOT define the window. Zoom has to be pressed to select the desired window.
10. Continue‐ Once desired window is selected Pressing continue will allow to proceed to the next steps.
Note: If Continue is pressed without Zoom, all data recorded in data file will be processed. This will take
longer to process depending on original file size and desired output files.
Dytran Instruments, Inc. OG5340 REV A, 07/13/12, ECN 8482
19
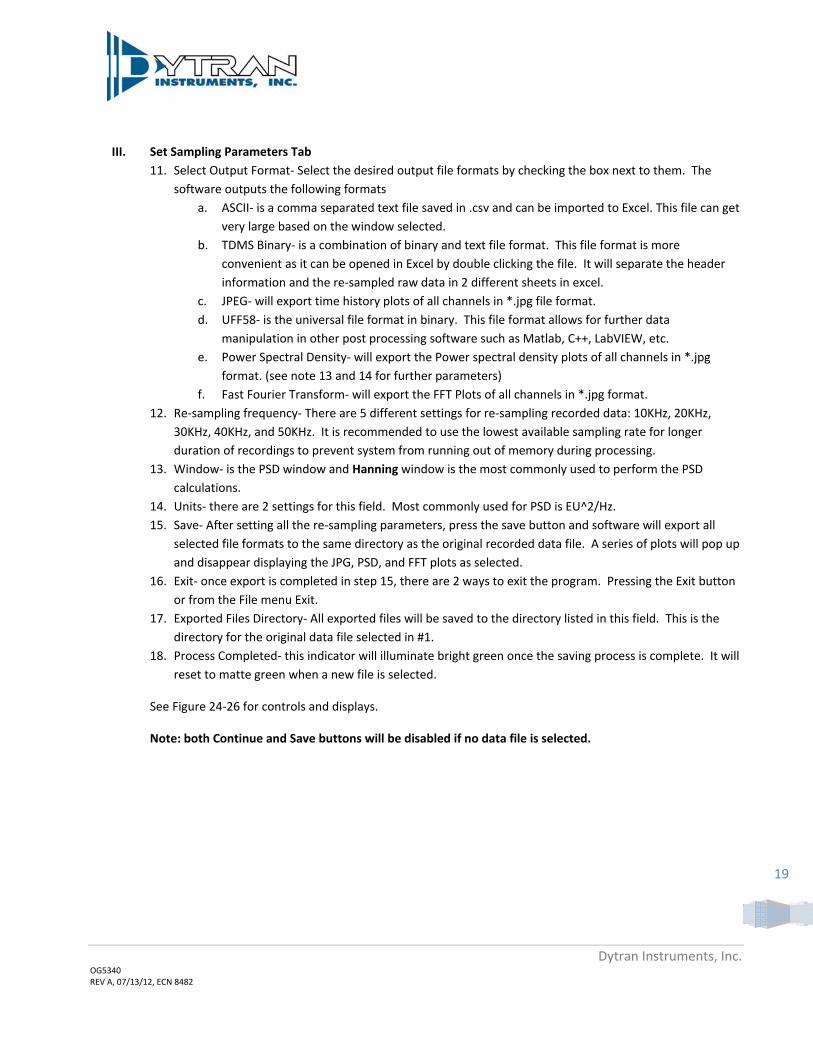
III. Set Sampling Parameters Tab
11. Select Output Format‐ Select the desired output file formats by checking the box next to them. The software outputs the following formats
a. ASCII‐ is a comma separated text file saved in .csv and can be imported to Excel. This file can get very large based on the window selected.
b. TDMS Binary‐ is a combination of binary and text file format. This file format is more convenient as it can be opened in Excel by double clicking the file. It will separate the header information and the re‐sampled raw data in 2 different sheets in excel.
c. JPEG‐ will export time history plots of all channels in *.jpg file format. d. UFF58‐ is the universal file format in binary. This file format allows for further data
manipulation in other post processing software such as Matlab, C++, LabVIEW, etc. e. Power Spectral Density‐ will export the Power spectral density plots of all channels in *.jpg
format. (see note 13 and 14 for further parameters) f. Fast Fourier Transform‐ will export the FFT Plots of all channels in *.jpg format.
12. Re‐sampling frequency‐ There are 5 different settings for re‐sampling recorded data: 10KHz, 20KHz, 30KHz, 40KHz, and 50KHz. It is recommended to use the lowest available sampling rate for longer duration of recordings to prevent system from running out of memory during processing.
13. Window‐ is the PSD window and Hanning window is the most commonly used to perform the PSD calculations.
14. Units‐ there are 2 settings for this field. Most commonly used for PSD is EU^2/Hz. 15. Save‐ After setting all the re‐sampling parameters, press the save button and software will export all
selected file formats to the same directory as the original recorded data file. A series of plots will pop up and disappear displaying the JPG, PSD, and FFT plots as selected.
16. Exit‐ once export is completed in step 15, there are 2 ways to exit the program. Pressing the Exit button or from the File menu Exit.
17. Exported Files Directory‐ All exported files will be saved to the directory listed in this field. This is the directory for the original data file selected in #1.
18. Process Completed‐ this indicator will illuminate bright green once the saving process is complete. It will reset to matte green when a new file is selected.
See Figure 24‐26 for controls and displays.
Note: both Continue and Save buttons will be disabled if no data file is selected.
Dytran Instruments, Inc. OG5340 REV A, 07/13/12, ECN 8482
20
Figure 24: Data Setup Window
Figure 25: Select specific window for Re‐sampling
Dytran Instruments, Inc. OG5340 REV A, 07/13/12, ECN 8482
21
11
12
13
14
15
16
17
18
Figure 26: Re‐sampling and output file parameters
Dytran Instruments, Inc. OG5340 REV A, 07/13/12, ECN 8482
22
15 SoftwareLicense,Restrictions,andDisclaimer
LICENSE: The Dytran Instruments, Inc. (Dytran) VibraScout™ software application (the Software) available for download via the Dytran website, via email, or made available on portable storage devices shipped with Dytran products is a free license for Dytran customers to use with Dytran products. Dytran encourages you to know the possible risks involved in the download and use of Software from the Internet. You are solely responsible for protecting yourself, your data, your systems and your hardware used in connection with the Software. Dytran will not be liable for any damages suffered from the use of the Software.
RESTRICTIONS: Neither the Software Licensee nor any Licensed User may rent or lease the Software. Neither the Software Licensee nor any Licensed User may modify, reverse engineer, decompile or disassemble the Software.
DISCLAIMER: BY USING THE SOFTWARE, YOU EXPRESSLY AGREE THAT ALL RISKS ASSOCIATED WITH THE PERFORMANCE AND QUALITY OF THE SOFTWARE IS ASSUMED SOLELY BY YOU. DYTRAN SHALL NOT BE LIABLE FOR ANY DIRECT, INDIRECT, INCIDENTAL, SPECIAL OR CONSEQUENTIAL DAMAGES ARISING OUT OF THE USE OF OR INABILITY TO USE THE SOFTWARE, EVEN IF DYTRAN HAS BEEN ADVISED OF THE POSSIBILITY OF SUCH DAMAGES.
THE SOFTWARE IS MADE AVAILABLE BY DYTRAN "AS IS" AND "WITH ALL FAULTS". DYTRAN DOES NOT MAKE ANY REPRESENTATIONS OR WARRANTIES OF ANY KIND, EITHER EXPRESS OR IMPLIED, CONCERNING THE QUALITY, SAFETY OR SUITABILITY OF THE SOFTWARE; INCLUDING WITHOUT LIMITATION ANY IMPLIED WARRANTIES OF MERCHANTABILITY, FITNESS FOR A PARTICULAR PURPOSE, OR NON-INFRINGEMENT. IN NO EVENT WILL DYTRAN BE LIABLE FOR ANY INDIRECT, PUNITIVE, SPECIAL, INCIDENTAL OR CONSEQUENTIAL DAMAGES THROUGH THE USE OF THE SOFTWARE HOWEVER THEY MAY ARISE AND EVEN IF DYTRAN HAS BEEN PREVIOUSLY ADVISED OF THE POSSIBILITY OF SUCH DAMAGES.