PALEOSALT 2008 Bivalves - VUB Rémy Mas, Fabrice Servaes, Maité Bauwens, Céline Poulain, Philippe...
25
PALEOSALT 2008 Bivalves - VUB Rémy Mas, Fabrice Servaes, Maité Bauwens, Céline Poulain, Philippe Claeys, Eddy Keppens, Frank Dehairs
-
Upload
drew-mccann -
Category
Documents
-
view
215 -
download
0
Transcript of PALEOSALT 2008 Bivalves - VUB Rémy Mas, Fabrice Servaes, Maité Bauwens, Céline Poulain, Philippe...
PALEOSALT 2008Bivalves - VUB
Rémy Mas, Fabrice Servaes, Maité Bauwens, Céline Poulain, Philippe
Claeys, Eddy Keppens, Frank Dehairs

Objectives
• Understanding impact of external controls (environmental conditions) on Trace Elements and Isotopes incorporation in bivalve shells
Aquarium experiment
• Development of the δD salinity proxy applied to organic matter in bivalve shells
In situ work : Scheldt estuary and Auray river
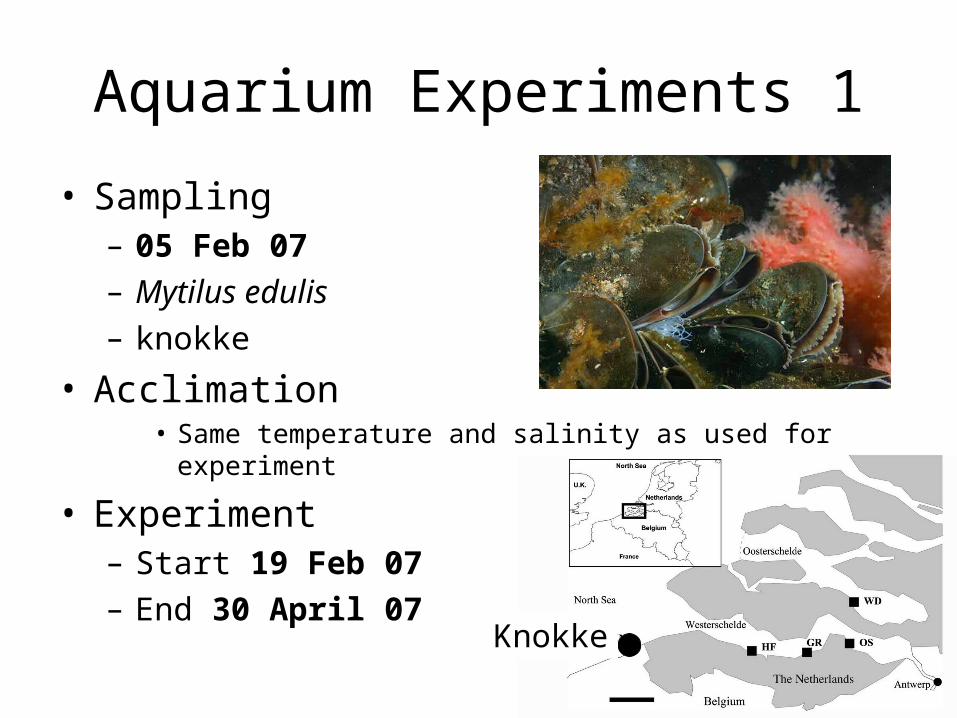
Aquarium Experiments 1
• Sampling– 05 Feb 07– Mytilus edulis– knokke
• Acclimation• Same temperature and salinity as used for
experiment
• Experiment– Start 19 Feb 07– End 30 April 07
Knokke
T1
T2
S1
S2
S1
S2
F2
F2
F1
F2
F1
F2
T1 S2 F2Adult
Juvenile
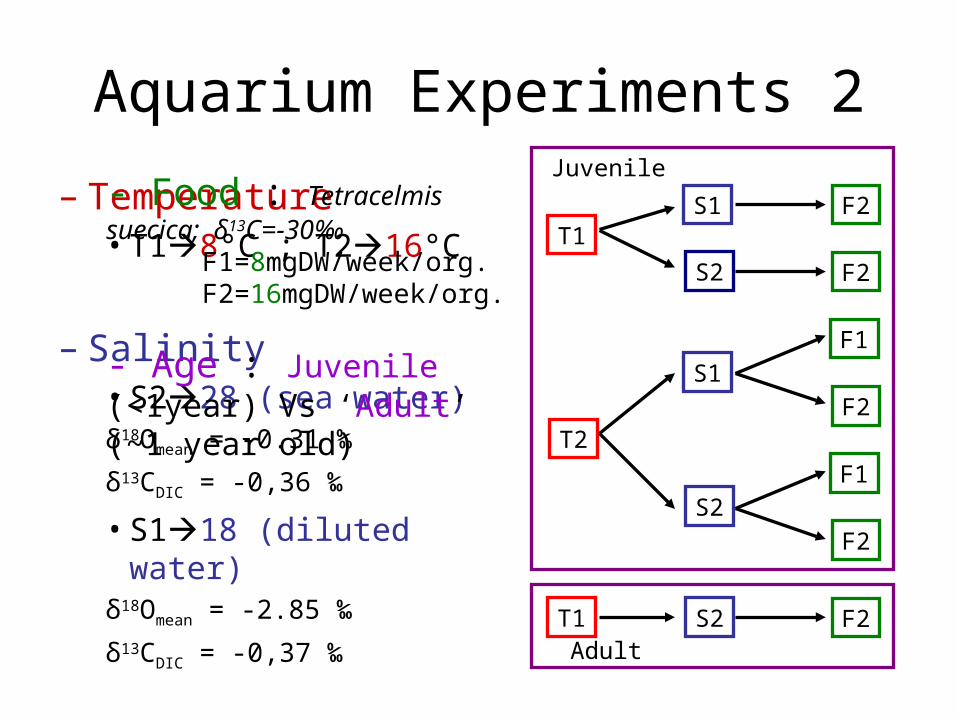
Aquarium Experiments 2
– Temperature• T18°C ; T216°C
– Salinity• S228 (sea water)δ18Omean = -0.31 ‰
δ13CDIC = -0,36 ‰
• S118 (diluted water)δ18Omean = -2.85 ‰
δ13CDIC = -0,37 ‰
- Food : Tetracelmis suecica; δ13C=-30‰
F1=8mgDW/week/org.F2=16mgDW/week/org.
- Age : Juvenile (<1year) Vs ‘Adult’ (~1 year old)

Aquarium Experiments 3• Growing (∆L of the shell)
Difference statistically very significant
Difference statistically significant
Difference statistically not significant
dL shell Student test Count Average p
Temperature
T1S1F2 Vs T2S1F2 6 10 1.53 2.230.0001
2
T1S2F2 Vs T2S2F2 8 10 2.00 2.92 3.4E-06
Salinity
T1S1F2 Vs T1S2F2 6 8 1.53 2.000.0202
7
T2S1F1 Vs T2S2F1 10 10 2.24 2.820.0005
7
T2S1F2 Vs T2S2F2 10 10 2.23 2.92 2.1E-06
FoodT2S1F2 Vs T2S1F1 10 10 2.23 2.24
0.94732
T2S2F2 Vs T2S2F1 10 10 2.92 2.820.2553
5
AgeAT1S2F2 Vs
T1S2F2 7 8 1.69 1.460.0698
5Temperature ∆L Salinity ∆L

Aquarium Experiments 4
• C isotopic composition of mussel tissues
d13C tissues Student test Count Average p
Temperature
T1S1F2 Vs T2S1F2 14 15 -22.07 -22.070.9887
7
T1S2F2 Vs T2S2F2 17 17 -21.92 -22.080.3963
3
Salinity
T1S1F2 Vs T1S2F2 14 17 -22.07 -21.920.4320
7
T2S1F1 Vs T2S2F1 14 19 -21.92 -21.930.9068
2
T2S1F2 Vs T2S2F2 15 17 -22.07 -22.080.9576
1
Food T2S1F2 Vs T2S1F1 15 14 -22.07 -21.920.1973
7
T2S2F2 Vs T2S2F1 17 19 -22.08 -21.93 0.3391
AgeAT1S2F2 Vs T1S2F2 14 17 -22.23 -21.92
0.08727
Difference statistically very significant
Difference statistically significant
Difference statistically not significant
d15N tissues Student test Count Average p
TemperatureT1S1F2 Vs T2S1F2 14 17 7.33 9.36 0.02165
T1S2F2 Vs T2S2F2 17 17 7.86 7.15 0.54666
Salinity
T1S1F2 Vs T1S2F2 14 17 7.33 7.86 0.66162
T2S1F1 Vs T2S2F1 14 19 8.94 7.19 0.13884
T2S1F2 Vs T2S2F2 17 17 9.36 7.15 0.01496
FoodT2S1F2 Vs T2S1F1 17 14 9.36 8.94 0.45873
T2S2F2 Vs T2S2F1 17 19 7.15 7.19 0.97474
Age AT1S2F2 Vs T1S2F2 14 17 9.42 7.86 0.08854
• N isotopic composition of mussel tissues

Aquarium Experiments 5
• Carbonate– Sampling with microdrilling
1cm
300μm
800μm
Drill line

T1S2F2 01
-9-8-7-6-5-4-3-2-10
0 500 1000 1500 2000 2500 3000 3500
Distance from shell extremity (um)
d13
C
-1.8
-1.3
-0.8
-0.3
0.2
0.7
1.2
1.7
d18
O d13C
d18O
T1 Test 1
-9-8-7-6-5-4-3-2-10
0 500 1000 1500 2000 2500 3000 3500
Distance from shell extremity (um)
d13
C
-1.8
-1.3
-0.8
-0.3
0.2
0.7
1.2
1.7
d18
O d13C
d18O
Adulteδ18Oss = 1.20 Tcalc= 9.5
Juvenileδ18Os =1.07
Tcalc = 10.0
T1=8°CS2=28
δ180w = -0.31
Wanamaker et al. 2007T(°C)=16.19-4.69*(δ18Os-δ18Ow)+0.17(δ18Os-δ18Ow)²
Adult
Juvenile

T2S2F2 01
-9-8-7-6-5-4-3-2-10
0 500 1000 1500 2000 2500 3000 3500
Distance from shell extremity (um)
d13
C
-1.8
-1.3
-0.8
-0.3
0.2
0.7
1.2
1.7
d18
O d13C
d18O
T2S2F1 01
-9-8-7-6-5-4-3-2-10
0 500 1000 1500 2000 2500 3000 3500
Distance from shell extremity (um)
d13
C
-1.8
-1.3
-0.8
-0.3
0.2
0.7
1.2
1.7
d18
O d13C
d18O
T2 S2 F2δ18Os = -0.23 Tcalc = 15.8
T2 S2 F1δ18Os = -0.54 Tcalc = 17.3
T2=16°CS2=28
δ18Ow = -0.31

T2S1F2 01
-9-8-7-6-5-4-3-2-10
0 500 1000 1500 2000 2500 3000 3500
Distance from shell extremity (um)
d13
C
-1.8
-1.3
-0.8
-0.3
0.2
0.7
1.2
1.7
d18
O d13C
d18O
T2 S1 F2δ18Os = -0.17 Tcalc = 4.8
T2=16°CS1=18
δ18Ow = -2.85
Problem
T2S1F1 01
-9-8-7-6-5
-4-3-2-10
0 500 1000 1500 2000 2500 3000 3500 4000
distance (um)
d13
C
-1.8
-1.3
-0.8
-0.3
0.2
0.7
1.2
1.7
d13C
d18O
T2 S1 F1δ18Os = -0.33 Tcalc = 5.5

Aquarium Experiments 6
• Trace Elements (Ba, Sr, Mg, Mn…)– New machine : laser UP193FX(Fast
excimer) Merchantec 193nm. coupled to a ICP-MS Thermo X series 2. (Summer 2008)

Scheldt & Auray 1
• Sampling
LOCMARIAQUER
BONO
1 km
10 km
KN
HFGR
OS
Mytilus edulis
Ruditapesphilippinarum
0
5
10
15
20
25
30
35
2001-04 2002-09 2004-01 2005-05 2006-10 2008-02
Time
Sal
init
y
Breskens haven landzijde
Hansweert geul
Hoedekenskerke boei 4
Terneuzen boei 20
Vlissingen boei SSVH
Wielingen
KN
HF
GR
OS
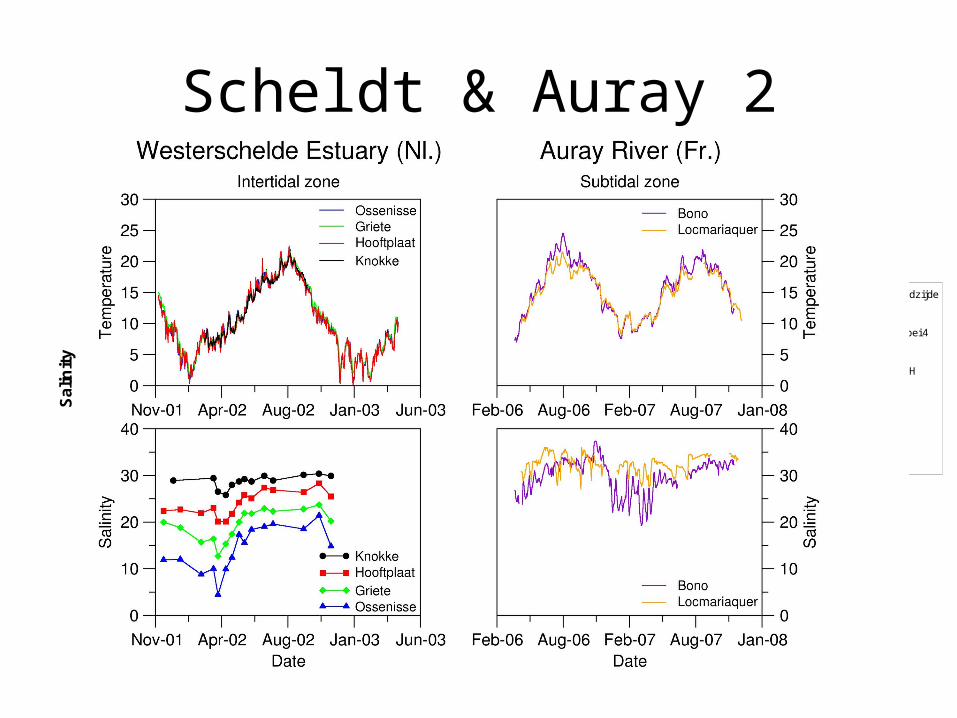
Scheldt & Auray 2

Ruditapes philippinarumShell organic matrix
Mytilus edulis Shell organic matrix
Scheldt & Auray 3
Sea
Sea
• δ13C & δ15N from bivalves– Tissues– Shell OM

Scheldt & Auray 4
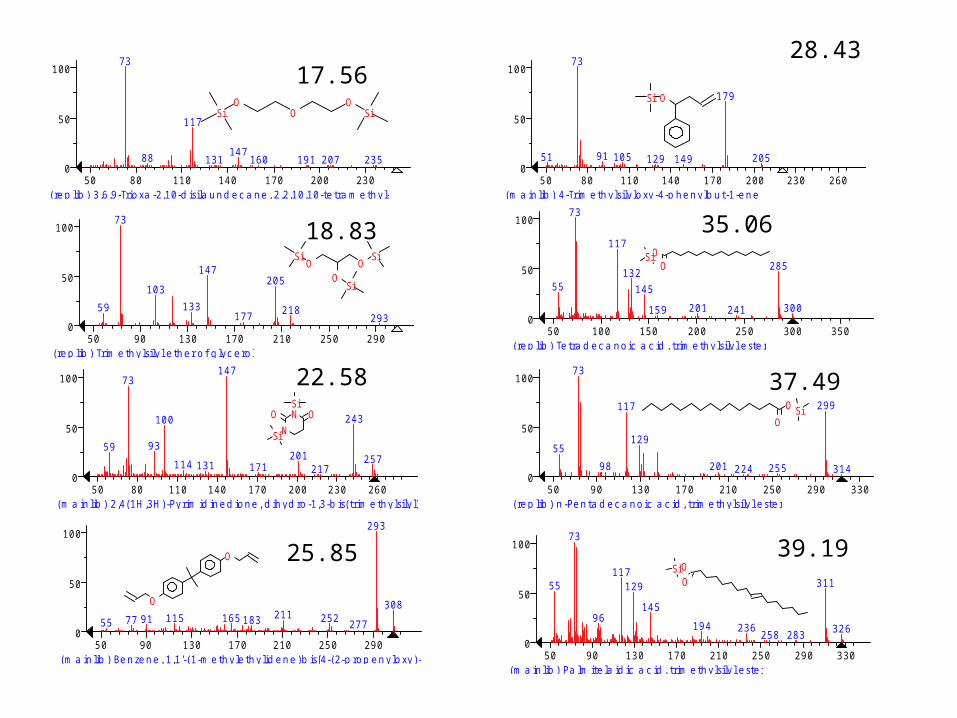
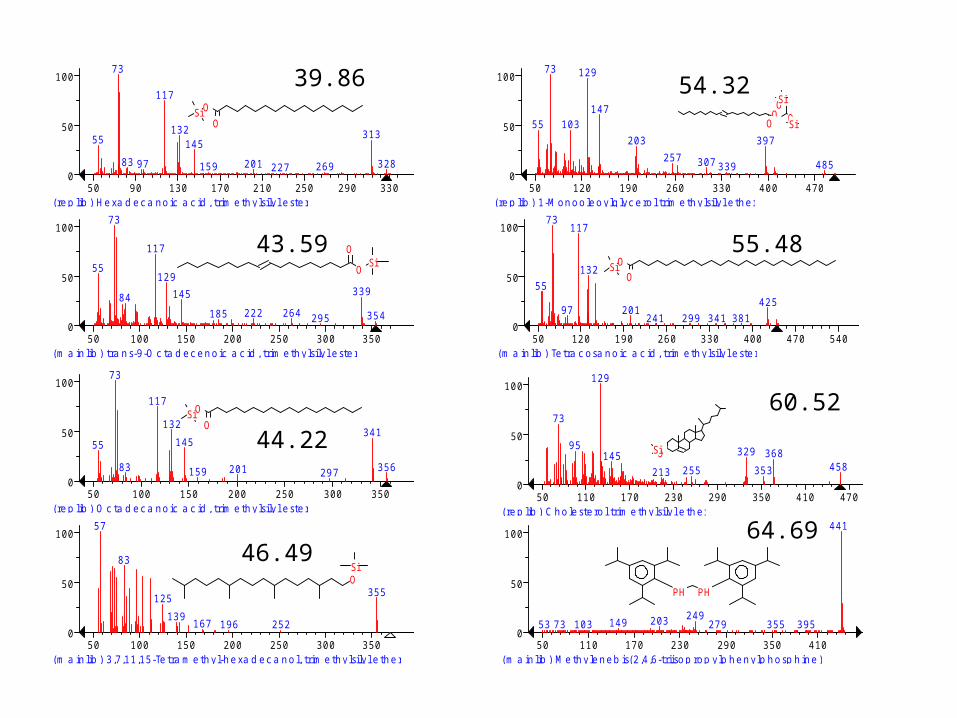
• Lipids– GC-MS
• Extraction of total lipids (modified Bligh & Dyer extraction) from bulk shell (without decarbonatation)
• Derivatization : Silylation BSTFA 60°C, 30min
• Method GC : – Column : DB-5 30m, Ø 0.25mm– 50°C (2min) 300°C (15min)
4°C/min
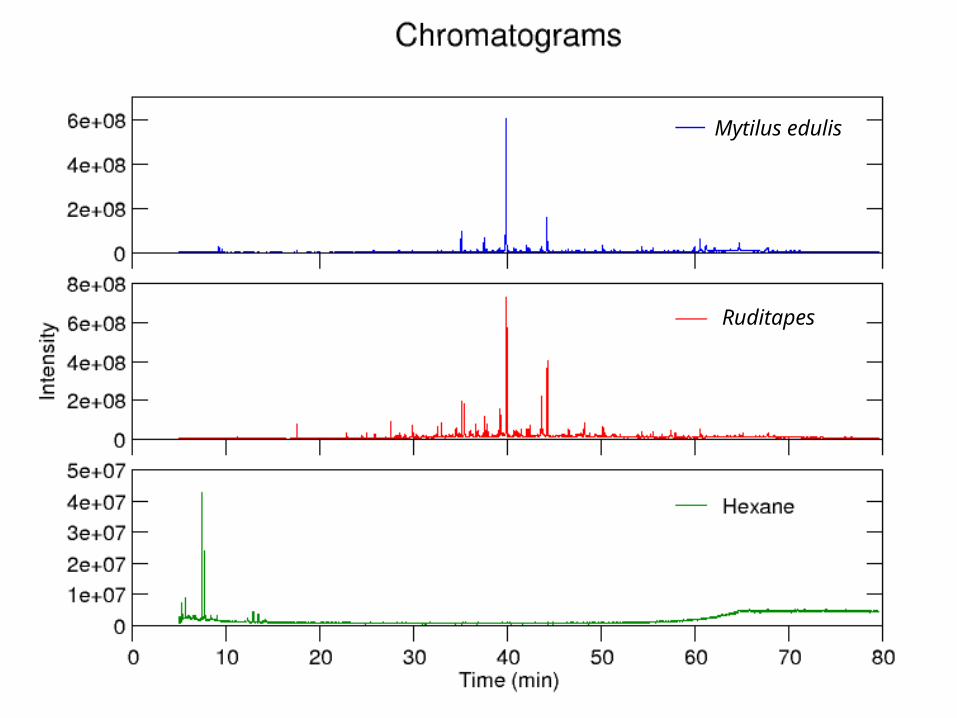
Mytilus edulis
Ruditapes

RT: 0.00 - 79.49
0 10 20 30 40 50 60 70Time (min)
0
50000000
100000000
150000000
200000000
250000000
300000000
350000000
400000000
450000000
500000000
550000000
600000000
Inte
nsi
ty
39.86
44.20
35.06
60.5164.68
50.139.22 54.30 67.729.58 34.1225.71 71.1217.537.38
NL:6.07E8TIC F: MS Me038KN
Fatty acids
Sterols
Me 038 KN
17:0
18:0
19:0
20:0
21:0
15:0
19
:1
Mytilus edulis

Scheldt & Auray 5
In the near future :• GC-MS
– Precise identification– Quantitative measurement
• GC-IRMS– δ13C measurements – Comparison of δ13C of specific
compounds with estuarine gradient

Perspectives
• Improvement of Mollusk shell Lipids extraction : Collaboration project with B. Farre; University Paris Sud; BIOCALC project; EUROCORES Program
• Deuterium analyses on specific lipidic compounds in collaboration with Dr. Stefan Schouten, Royal NIOZ

Thank you

C:\Xcalibur\...\blanc1_080606151011 6/6/2008 3:10:11 PM Me012GR
RT: 0.00 - 79.49
0 10 20 30 40 50 60 70Time (min)
0
10
20
30
40
50
60
70
80
90
100
Re
lativ
e A
bu
nd
an
ce
17.56
39.86
44.22
39.19
25.8535.06
16.289.17 64.6928.43 60.525.15 54.3212.43 18.83 67.7346.49 55.48 70.61
NL:5.88E8TIC F: MS blanc1_080606151011

R Time Intensity Formula Prob.
5.15 42855000 C8H18F3NOSi2 70.9 Acetamide, 2,2,2-trifluoro-N,N-bis(trimethylsilyl)-
9.17 58533636 C9H22OSi 29.7 Methoxydi(tert-butyl)silane
16.28 63595912 C6H14O2Si 27.2 Silanol, trimethyl-, propanoate
17.56 588324608 C10H26O3Si2 75.70 3,6,9-Trioxa-2,10-disilaundecane, 2,2,10,10-tetramethyl-
18.83 33368116 C12H32O3Si3 87.5 Trimethylsilyl ether of glycerol
22.58 31632980 C10H22N2O2Si2 70.9 2,4(1H,3H)-Pyrimidinedione, dihydro-1,3-bis(trimethylsilyl)-
25.85 101882128 C21H24O2 12 Benzene, 1,1'-(1-methylethylidene)bis[4-(2-propenyloxy)-
28.43 47217040 C13H20OSi 17.9 4-Trimethylsilyloxy-4-phenylbut-1-ene
35.06 86691232 C17H36O2Si 93.5 Tetradecanoic acid, trimethylsilyl ester
37.49 57155768 C18H38O2Si 68.5 n-Pentadecanoic acid, trimethylsilyl ester
39.19 138714112 C19H38O2Si 80 Palmitelaidic acid, trimethylsilyl ester
39.86 434806720 C19H40O2Si 94.2 Hexadecanoic acid, trimethylsilyl ester
43.59 113528232 C21H42O2Si 31 trans-9-Octadecenoic acid, trimethylsilyl ester
44.22 276898496 C21H44O2Si 94.7 Octadecanoic acid, trimethylsilyl ester
46.49 26053202 C23H50OSi 30.5 3,7,11,15-Tetramethyl-hexadecanol, trimethylsilyl ether
54.32 40401216 C27H56O4Si2 64.2 1-Monooleoylglycerol trimethylsilyl ether
55.48 16958486 C27H56O2Si 56.6 Tetracosanoic acid, trimethylsilyl ester
60.52 45148768 C30H54OSi 61.2 Cholesterol trimethylsilyl ether
64.69 51135540 C31H50P2 53.6 Methylenebis(2,4,6-triisopropylphenylphosphine)
(re p lib ) 3,6,9-Trio xa -2,10-d isila u n d e c a n e , 2,2,10,10-te tra m e th yl-50 80 110 140 170 200 230
0
50
10073
88
117
131147
160 191 207 235
OSi O
OSi
17.56
(m a in lib ) Be n ze n e , 1,1'-(1-m e th yle th ylid e n e )b is[4-(2-p ro p e n ylo xy)-50 90 130 170 210 250 290
0
50
100
55 77 91 115 165 183 211 252 277
293
308O
O 25.85
(re p lib ) n -Pe n ta d e c a n o ic a c id , trim e th ylsilyl e ste r50 90 130 170 210 250 290 330
0
50
100
55
73
98
117
129
201 224 255
299
314
O
OSi
37.49
(m a in lib ) Pa lm ite la id ic a c id , trim e th ylsilyl e ste r50 90 130 170 210 250 290 330
0
50
100
55
73
96
117129
145
194 236258 283
311
326
OSiO
39.19
(re p lib ) Te tra d e c a n o ic a c id , trim e th ylsilyl e ste r50 100 150 200 250 300 350
0
50
100
55
73
117
132
145
159 201 241
285
300
OO
Si
35.06
(m a in lib ) 4-Trim e th ylsilylo xy-4-p h e n ylb u t-1-e n e50 80 110 140 170 200 230 260
0
50
100
51
73
91 105 129 149
179
205
OSi
28.43
(m a in lib ) 2,4(1H ,3H)-Pyrim id in e d io n e , d ih yd ro -1,3-b is(trim e th ylsilyl)-50 80 110 140 170 200 230 260
0
50
100
59
73
93
100
114 131
147
171201
217
243
257
O N
N
Si
Si
O
22.58(re p lib ) Trim e th ylsilyl e th e r o f g lyc e ro l
50 90 130 170 210 250 2900
50
100
59
73
103
133
147
177
205
218293
OO
O
Si
SiSi
18.83
(m a in lib ) M e th yle n e b is(2,4,6-triiso p ro p ylp h e n ylp h o sp h in e )
50 110 170 230 290 350 4100
50
100
53 73 103 149 203 249279 355 395
441
PH PH
(re p lib ) C h o le ste ro l trim e th ylsilyl e th e r50 110 170 230 290 350 410 470
0
50
100
73
95
129
145
213 255
329
353
368458
OSi
(m a in lib ) Te tra c o sa n o ic a c id , trim e th ylsilyl e ste r50 120 190 260 330 400 470 540
0
50
100
55
73
97
117
132
201241 299 341 381
425
OO
Si
(re p lib ) 1-M o n o o le o ylg lyc e ro l trim e th ylsilyl e th e r50 120 190 260 330 400 470
0
50
100
55
73
103
129
147
203
257 307 339
397
485
OOO
Si
Si
O
(m a in lib ) 3,7,11,15-Te tra m e th yl-h e xa d e c a n o l, trim e th ylsilyl e th e r50 100 150 200 250 300 350
0
50
10057
83
125
139167 196 252
355OSi
(re p lib ) He xa d e c a n o ic a c id , trim e th ylsilyl e ste r50 90 130 170 210 250 290 330
0
50
100
55
73
83 97
117
132145
159 201 227 269
313
328
O
OSi
(m a in lib ) tra n s-9-O c ta d e c e n o ic a c id , trim e th ylsilyl e ste r50 100 150 200 250 300 350
0
50
100
55
73
84
117
129
145
185 222 264 295
339
354
O
OSi
(re p lib ) O c ta d e c a n o ic a c id , trim e th ylsilyl e ste r50 100 150 200 250 300 350
0
50
100
55
73
83
117
132
145
159 201 297
341
356
O
OSi
39.86
43.59
44.22
46.49
54.32
55.48
60.52
64.69

Aquarium Experiments• Tissue Dry Weight after the end of
the experimentSoft
Tissue Dry
Weight Student test Count Average p
Temperature
T1S1F2 Vs T2S1F2 5 824.4
223.3
80.6913
8
T1S2F2 Vs T2S2F2 8 923.0
324.5
7 0.6243
Salinity
T1S1F2 Vs T1S2F2 5 824.4
223.0
30.6847
1
T2S1F1 Vs T2S2F1 7 920.0
026.4
80.0892
8
T2S1F2 Vs T2S2F2 8 923.3
824.5
70.6598
6
FoodT2S1F2 Vs T2S1F1 8 7
23.38
20.00
0.24168
T2S2F2 Vs T2S2F1 9 924.5
726.4
80.5681
1
AgeAT1S2F2 Vs
T1S2F2 6 845.7
823.0
3 0.0001
Difference statistically very significant
Difference statistically significant
Difference statistically not significant
Differencebefore
experiment