Functional Genomic Screen Identifies Klebsiella pneumoniae ...
Analyst
PAPER
Publ
ishe
d on
15
Oct
ober
201
4. D
ownl
oade
d by
Bur
apha
Uni
vers
ity o
n 10
/12/
2020
10:
28:0
8 A
M.
View Article OnlineView Journal | View Issue
One-step polyme
aDepartment of Chemistry, Faculty of Scienc
Thailand. E-mail: [email protected]; FaxbDepartment of Chemistry, Colorado State UcDepartment of Chemistry and Center of
Faculty of Science, Mahidol University, Ban
† Electronic supplementary informa10.1039/c4an01624f
Cite this: Analyst, 2014, 139, 6580
Received 2nd September 2014Accepted 14th October 2014
DOI: 10.1039/c4an01624f
www.rsc.org/analyst
6580 | Analyst, 2014, 139, 6580–6588
r screen-printing for microfluidicpaper-based analytical device (mPAD) fabrication†
Yupaporn Sameenoi,*a Piyaporn Na Nongkai,a Souksanh Nouanthavong,a
Charles S. Henryb and Duangjai Nacaprichac
We report a simple, low-cost, one-step fabrication method for microfluidic paper-based analytical devices
(mPAD) using only polystyrene and a patterned screen. The polystyrene solution applied through the screen
penetrates through the paper, forming a three-dimensional hydrophobic barrier, defining a hydrophilic
analysis zone. The optimal polystyrene concentration and paper types were first investigated. Adjusting
polystyrene concentration allows for various types of paper to be used for successful device fabrication.
Using an optimized polystyrene concentration with Whatman#4 filter paper, a linear relationship was
found to exist between the design width and the printed width. The smallest hydrophilic channel and
hydrophobic barrier that can be obtained are 670 � 50 mm and 380 � 40 mm, respectively. High device-
to-device fabrication reproducibility was achieved yielding a relative standard deviation (%RSD) in the
range of 1.12–2.54% (n ¼ 64) of the measured diameter of the well-shaped fabricated test zones with a
designed diameter of 5 and 7 mm. To demonstrate the significance of the fabricated mPAD, distance-
based and well-based paper devices were constructed for the analysis of H2O2 and antioxidant activity,
respectively. The analysis of H2O2 in real samples using distance-based measurement with CeO2
nanoparticles as the colorimetric agent produced the same results at 95% confidence level, as those
obtained using KMnO4 titration. A proof-of-concept antioxidant activity determination based on the 2,2-
diphenyl-1-picrylhydrazyl (DPPH) assay was also demonstrated. The results verify that the polymer
screen-printing method can be used as an alternative method for mPAD fabrication.
Introduction
Microuidic paper-based analytical devices (mPADs) are anattractive alternative for chemical analysis in several areas,includingmedical diagnostics,1 clinical analysis,2–4 food testing5
and environmental monitoring,6–8 because they are inexpensive,portable, easy to use, biocompatible and can be easily disposed.mPADs are obtained by patterning hydrophilic paper withimpermeable barriers that dene ow channels and testzones.9–11 The hydrophilic cellulose ber network in the owchannel serves to be a self-priming capillary pump, allowing thewicking of solution without the need of external pumps. Unliketraditional analytical methods using cellulosic substrates, suchas litmus paper, mPADs are more efficient for complex chemicalanalysis, as well as more advanced sample pretreatmentmethods because of the ability to store reagents on the device.
e, Burapha University, Chon Buri, 20131,
: +66-38-393-494; Tel: +66-38-103-111
niversity, Fort Collins, 80523-1872, USA
Excellence for Innovation in Chemistry,
gkok, 10400, Thailand
tion (ESI) available. See DOI:
Several methods have been demonstrated for mPAD fabrica-tion, including photolithography,12 wax printing, screenprinting and dipping,13–15 cutting,16 and inkjet etching.17
Photolithography was rst reported for mPAD fabrication usingSU-8 photoresist and UV light for creating a hydrophobicbarrier.18 This method is able to produce small channels (with asize as small as 750 mm), in which the channel dimension canbe controlled by the pattern of the UV mask.12,19 Photolithog-raphy, however, has some drawbacks, including expensivefabrication instrumentation (e.g., spin coating and UV exposuresystem), complicated fabrication processes and solvent expo-sure to the hydrophilic region results in reduced paper exi-bility and increased backgrounds for certain reactions.14 Waxprinting has been the most widely used fabrication methodbecause it is simple, rapid and uses common office equip-ment.13,20 Unfortunately, the method requires a relativelyexpensive printer and a heating step that causes wax spreadingand decreases the feature resolution. Wax screen-printing ischeaper than wax printing because it requires only an inex-pensive screen and a hotplate but also suffers from the loss offeature resolution as a result of wax spreading.14 Cutting by theuse of an automated cra cutting machine provides a rapid andsimple production of mPADs without the need of organicsolvents and/or heating.21 The major disadvantages of this
This journal is © The Royal Society of Chemistry 2014
Paper Analyst
Publ
ishe
d on
15
Oct
ober
201
4. D
ownl
oade
d by
Bur
apha
Uni
vers
ity o
n 10
/12/
2020
10:
28:0
8 A
M.
View Article Online
method include cost of the cutting machine and the inability tocreate small mechanically stable structures. Inkjet etching wasperformed by rst dipping the paper into a polystyrene solutionand then printing toluene multiple times using an inkjetprinter.17 The toluene removed the polystyrene to create chan-nels. Unfortunately, the printing step reduces channel repro-ducibility because it is difficult to align the paper tenconsecutive times.
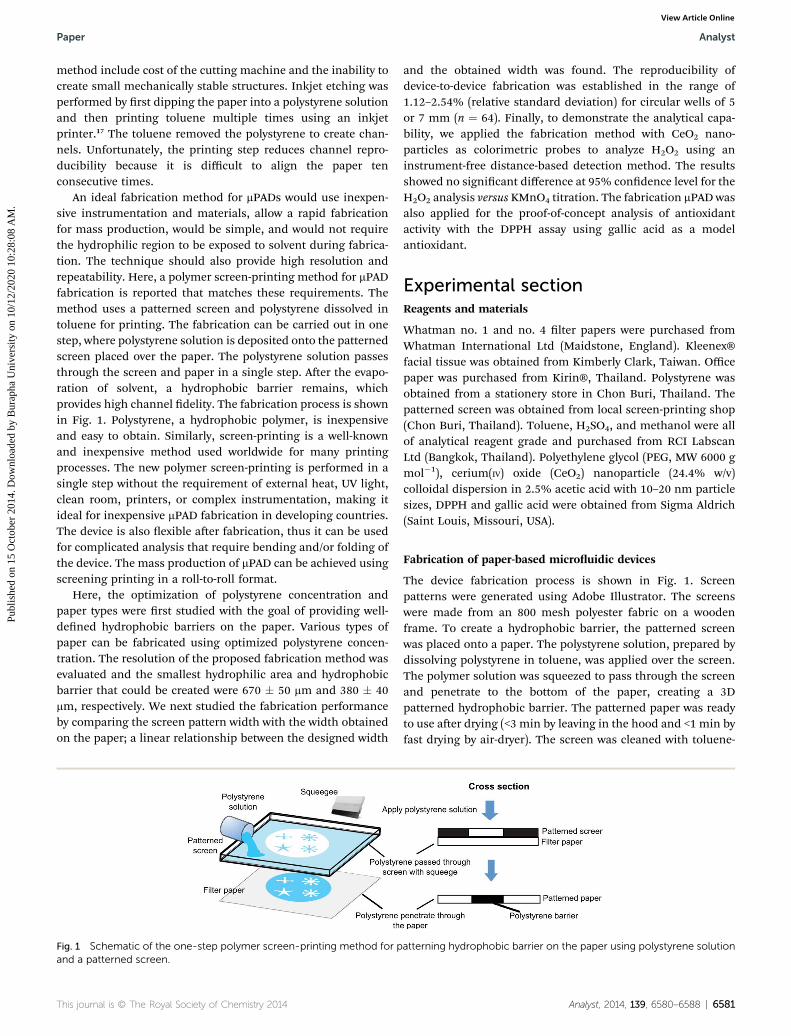
An ideal fabrication method for mPADs would use inexpen-sive instrumentation and materials, allow a rapid fabricationfor mass production, would be simple, and would not requirethe hydrophilic region to be exposed to solvent during fabrica-tion. The technique should also provide high resolution andrepeatability. Here, a polymer screen-printing method for mPADfabrication is reported that matches these requirements. Themethod uses a patterned screen and polystyrene dissolved intoluene for printing. The fabrication can be carried out in onestep, where polystyrene solution is deposited onto the patternedscreen placed over the paper. The polystyrene solution passesthrough the screen and paper in a single step. Aer the evapo-ration of solvent, a hydrophobic barrier remains, whichprovides high channel delity. The fabrication process is shownin Fig. 1. Polystyrene, a hydrophobic polymer, is inexpensiveand easy to obtain. Similarly, screen-printing is a well-knownand inexpensive method used worldwide for many printingprocesses. The new polymer screen-printing is performed in asingle step without the requirement of external heat, UV light,clean room, printers, or complex instrumentation, making itideal for inexpensive mPAD fabrication in developing countries.The device is also exible aer fabrication, thus it can be usedfor complicated analysis that require bending and/or folding ofthe device. The mass production of mPAD can be achieved usingscreening printing in a roll-to-roll format.
Here, the optimization of polystyrene concentration andpaper types were rst studied with the goal of providing well-dened hydrophobic barriers on the paper. Various types ofpaper can be fabricated using optimized polystyrene concen-tration. The resolution of the proposed fabrication method wasevaluated and the smallest hydrophilic area and hydrophobicbarrier that could be created were 670 � 50 mm and 380 � 40mm, respectively. We next studied the fabrication performanceby comparing the screen pattern width with the width obtainedon the paper; a linear relationship between the designed width
Fig. 1 Schematic of the one-step polymer screen-printing method for pand a patterned screen.
This journal is © The Royal Society of Chemistry 2014
and the obtained width was found. The reproducibility ofdevice-to-device fabrication was established in the range of1.12–2.54% (relative standard deviation) for circular wells of 5or 7 mm (n ¼ 64). Finally, to demonstrate the analytical capa-bility, we applied the fabrication method with CeO2 nano-particles as colorimetric probes to analyze H2O2 using aninstrument-free distance-based detection method. The resultsshowed no signicant difference at 95% condence level for theH2O2 analysis versus KMnO4 titration. The fabrication mPAD wasalso applied for the proof-of-concept analysis of antioxidantactivity with the DPPH assay using gallic acid as a modelantioxidant.
Experimental sectionReagents and materials
Whatman no. 1 and no. 4 lter papers were purchased fromWhatman International Ltd (Maidstone, England). Kleenex®facial tissue was obtained from Kimberly Clark, Taiwan. Officepaper was purchased from Kirin®, Thailand. Polystyrene wasobtained from a stationery store in Chon Buri, Thailand. Thepatterned screen was obtained from local screen-printing shop(Chon Buri, Thailand). Toluene, H2SO4, and methanol were allof analytical reagent grade and purchased from RCI LabscanLtd (Bangkok, Thailand). Polyethylene glycol (PEG, MW 6000 gmol�1), cerium(IV) oxide (CeO2) nanoparticle (24.4% w/v)colloidal dispersion in 2.5% acetic acid with 10–20 nm particlesizes, DPPH and gallic acid were obtained from Sigma Aldrich(Saint Louis, Missouri, USA).
Fabrication of paper-based microuidic devices
The device fabrication process is shown in Fig. 1. Screenpatterns were generated using Adobe Illustrator. The screenswere made from an 800 mesh polyester fabric on a woodenframe. To create a hydrophobic barrier, the patterned screenwas placed onto a paper. The polystyrene solution, prepared bydissolving polystyrene in toluene, was applied over the screen.The polymer solution was squeezed to pass through the screenand penetrate to the bottom of the paper, creating a 3Dpatterned hydrophobic barrier. The patterned paper was readyto use aer drying (<3 min by leaving in the hood and <1 min byfast drying by air-dryer). The screen was cleaned with toluene-
atterning hydrophobic barrier on the paper using polystyrene solution
Analyst, 2014, 139, 6580–6588 | 6581
Analyst Paper
Publ
ishe
d on
15
Oct
ober
201
4. D
ownl
oade
d by
Bur
apha
Uni
vers
ity o
n 10
/12/
2020
10:
28:0
8 A
M.
View Article Online
soaked paper towel between subsequent device fabrications. Allthe steps were performed in a fume hood. Prior to running anyassay, clear packing tape was added to the backside of thepatterned paper to prevent leaking through the paper.
Distance-based detection of H2O2 using CeO2 nanoparticles
The analysis of H2O2 was performed using the distance-baseddetection format. A thermometer-like patterned paper wasfabricated using polymer screen-printing method.22 A circularshape of 6 mm diameter was created as a sample reservoirconnected to a straight channel with a geometry of 3 mm wideand 8 cm long, which contained the reagents and served as thedetection zone. CeO2 nanoparticles were uniformly coated onthe channel part of the patterned paper (detection zone,Fig. 6A) by dipping the paper in CeO2 nanoparticle solution(3% w/v) and then allowing the paper to dry. The CeO2 nano-particles were hydrophobic, preventing wetting along thedetection channel. To permit ow, the CeO2 coated paper wasdipped in polyethylene glycol solution (10 mg mL�1 indeionized water), making the detection zone hydrophilic. 10mL of H2O2 sample was pipetted onto the sample reservoir andallowed to ow along the detection channel. A rapid changefrom colorless to yellowish-orange of CeO2 nanoparticles wasobserved on reaction with H2O2 because of the changes intheir surface properties and chemical composition.23,24
Another 10 mL of deionized water was added to the samplereservoir to elute residual H2O2, which might remain in thesample zone (schematic diagram for the analytical procedureis shown in Fig. S-1a, ESI†). The distance developed by thecolor on the detection channel was directly proportional to theamount of H2O2 in the sample and was measured using acommon ruler.
For method validation, a conventional KMnO4 titration wasused for H2O2 analysis.25 Briey, KMnO4 used as a titrant wasrst standardized with acidied sodium oxalate solution. Analiquot of H2O2 samples was acidied with H2SO4 and titratedwith KMnO4 until the end-point was reached, where the color ofKMnO4 appeared.
Antioxidant activity analysis
To further evaluate the applicability of the fabricated mPAD, thepaper was designed in a well-shaped format with a circulardiameter of 5 mm. Antioxidant analysis was based on the DPPHassay using gallic acid as a model standard antioxidant.26,27
First, 1 mL of 1.5 mM DPPH in methanol was dropped onto themPAD. Then, 1 mL gallic acid aqueous solutions at differentconcentrations were pipetted onto the well. The reaction pro-ceeded for 15 min in the dark at room temperature (�27 �C) andthe dried mPAD was obtained (schematic diagram for theanalytical procedure is shown in Fig. S-1b, ESI†). The image ofmPAD was obtained using a scanner and analyzed for violet colorintensity using ImageJ (National Institute of Health, USA). Theintensity measurement procedure is demonstrated in Fig. S-2(ESI†).
6582 | Analyst, 2014, 139, 6580–6588
Results and discussionOne-step fabrication of mPAD using polymer screen-printing
We present the use of inexpensive polystyrene as a printingmaterial for the screen-printing of hydrophobic barriers ontolter paper for the fabrication of mPADs. The fabricationmethod involves one step (Fig. 1), in which the polymer solutionpasses through the patterned screen into the paper to formhydrophobic barriers. During the printing process, the tolueneused as a solvent to dissolve polystyrene does not penetrate intothe unpatterned areas because of the viscosity of the solution(Fig. S-3, ESI†). Polystyrene is widely available and very inex-pensive. Furthermore, screen-printing is used for many appli-cations ranging from clothing to electronics. Screens can bemade from a variety of materials and can be produced in anycountry. Screen-printing has been used for the fabrication ofbiosensors and chemical sensors because it offers the advan-tages of low cost, mass production capabilities, andminiaturization.28–30
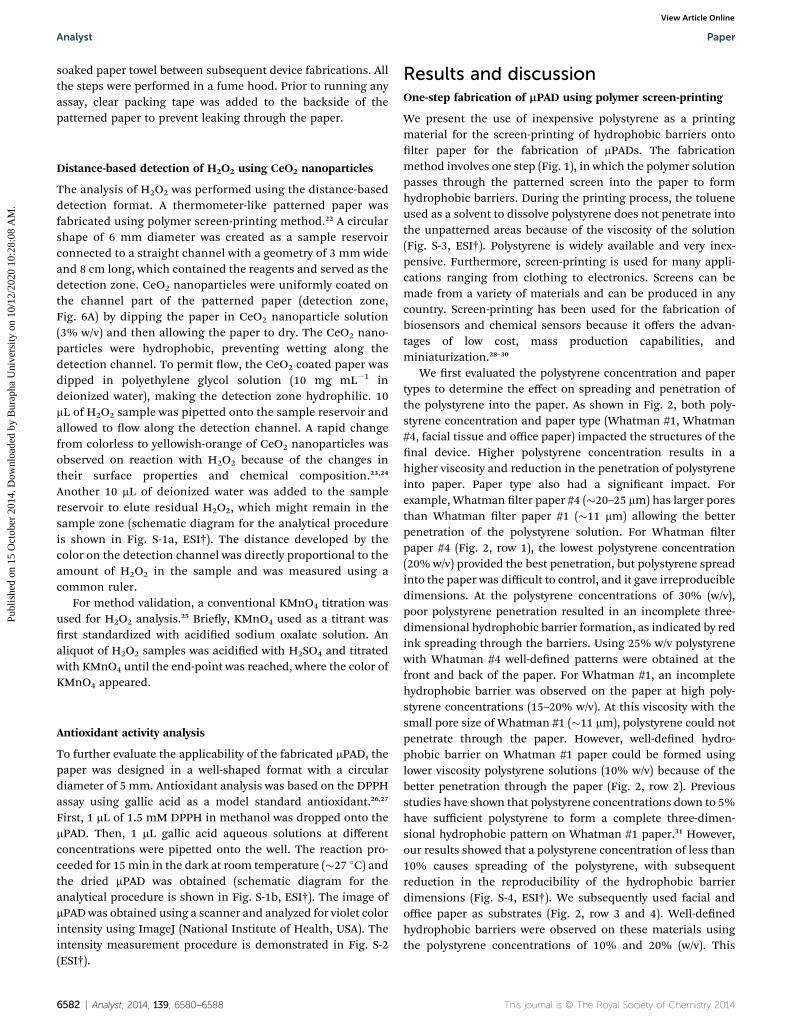
We rst evaluated the polystyrene concentration and papertypes to determine the effect on spreading and penetration ofthe polystyrene into the paper. As shown in Fig. 2, both poly-styrene concentration and paper type (Whatman #1, Whatman#4, facial tissue and office paper) impacted the structures of thenal device. Higher polystyrene concentration results in ahigher viscosity and reduction in the penetration of polystyreneinto paper. Paper type also had a signicant impact. Forexample, Whatman lter paper #4 (�20–25 mm) has larger poresthan Whatman lter paper #1 (�11 mm) allowing the betterpenetration of the polystyrene solution. For Whatman lterpaper #4 (Fig. 2, row 1), the lowest polystyrene concentration(20% w/v) provided the best penetration, but polystyrene spreadinto the paper was difficult to control, and it gave irreproducibledimensions. At the polystyrene concentrations of 30% (w/v),poor polystyrene penetration resulted in an incomplete three-dimensional hydrophobic barrier formation, as indicated by redink spreading through the barriers. Using 25% w/v polystyrenewith Whatman #4 well-dened patterns were obtained at thefront and back of the paper. For Whatman #1, an incompletehydrophobic barrier was observed on the paper at high poly-styrene concentrations (15–20% w/v). At this viscosity with thesmall pore size of Whatman #1 (�11 mm), polystyrene could notpenetrate through the paper. However, well-dened hydro-phobic barrier on Whatman #1 paper could be formed usinglower viscosity polystyrene solutions (10% w/v) because of thebetter penetration through the paper (Fig. 2, row 2). Previousstudies have shown that polystyrene concentrations down to 5%have sufficient polystyrene to form a complete three-dimen-sional hydrophobic pattern on Whatman #1 paper.31 However,our results showed that a polystyrene concentration of less than10% causes spreading of the polystyrene, with subsequentreduction in the reproducibility of the hydrophobic barrierdimensions (Fig. S-4, ESI†). We subsequently used facial andoffice paper as substrates (Fig. 2, row 3 and 4). Well-denedhydrophobic barriers were observed on these materials usingthe polystyrene concentrations of 10% and 20% (w/v). This
This journal is © The Royal Society of Chemistry 2014

Fig. 2 Final patterned paper fabricated using polymer screen-printing method with the different concentrations of polystyrene in toluene (% w/v) and different types of paper. Red food dye was added to the polymer unfilled paper to indicate the hydrophilic region.
Fig. 3 Patterned paper fabricated using polymer screen-printingmethod: (a) representative patterns on the mPADs with color in thehydrophilic zone and clear hydrophobic region, (b) hydrophobic–hydrophilic boundary imaged with a microscope (Olympus, 20�magnification), (c) a drop of dye solution (10 mL) applied on the intactfilter paper (well zones) and polymer coated region (the remainingpart).
Paper Analyst
Publ
ishe
d on
15
Oct
ober
201
4. D
ownl
oade
d by
Bur
apha
Uni
vers
ity o
n 10
/12/
2020
10:
28:0
8 A
M.
View Article Online
result demonstrates that the method is not limited to lterpaper as a substrate. By adjusting the polymer concentration,complete hydrophobic barrier was obtained using the varioustypes of paper. In comparison, the invented method offers awider compatibility with several paper substrates than theinstrument-dependent methods, such as exographicprinting,31 photolithography,12 ink-jet printing,17 and wax-printing,13 where paper with low stiffness (i.e., facial tissue)cannot be used due to the difficulty of feeding or aligning to theinstrument during the fabrication process. In the subsequentstudies, a polystyrene concentration of 25% w/v with Whatman#4 was used for mPAD fabrication.
Various mPAD patterns were constructed with well-denedhydrophobic barriers (Fig. 3). Pattern variations were made byadjusting the screen design, making the mPAD suitable for bothsingle-analyte (well format) and multi-analyte analysis (star-shaped format). In these images, clear borders were observedbetween the polymer lled and unlled regions (Fig. 3a). Thefabricated paper was further investigated using a microscope(Olympus, 20� magnication) (Fig. 3b); the investigationshowed that the dye could not penetrate into the hydrophobicregions because of the polystyrene. Hydrophobicity of the paperwas further conrmed by dropping the dye solution onto thepolymer lled region and the intact paper. Dye rapidly wettedthe hydrophilic paper region, but it was maintained as a dropon the hydrophobic region (Fig. 3c).
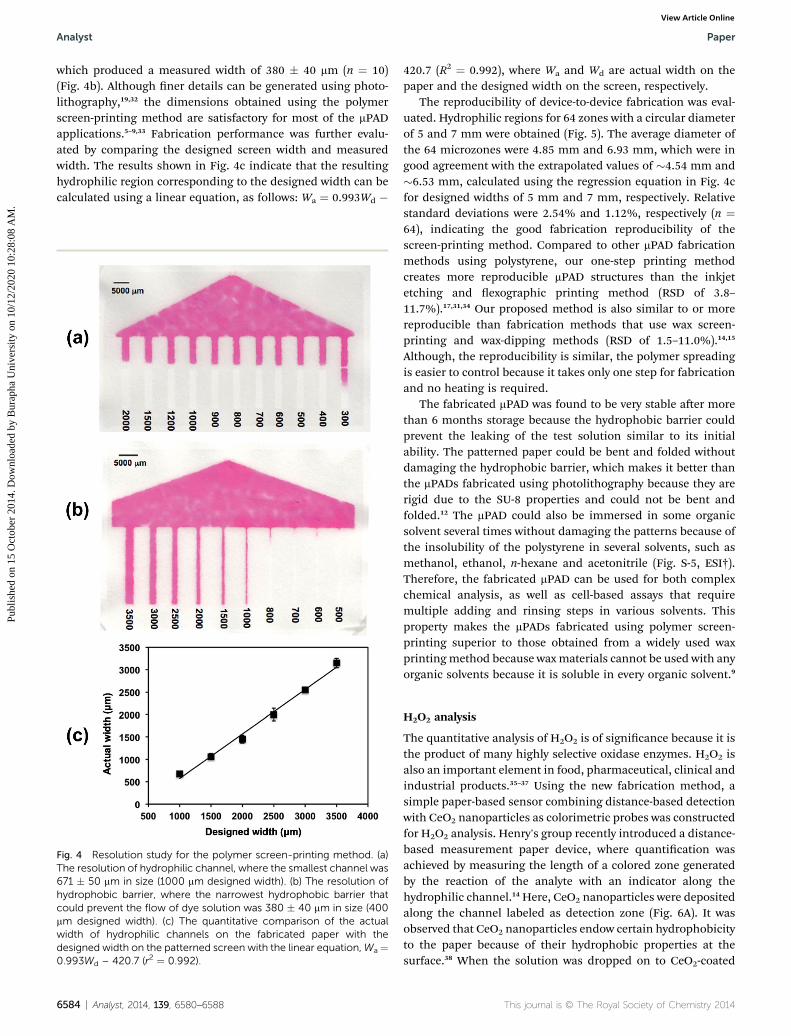
Resolution, reproducibility and stability
Pattern resolution was studied using the previously describedmethods.19 using the optimized fabrication parameters, thenarrowest hydrophilic channel that the fabrication methodcould produce had a design width of 1000 mm on the screen anda measured width of 671 � 50 mm (n ¼ 10) on the fabricated
This journal is © The Royal Society of Chemistry 2014
paper (Fig. 4a). The reduction in size relative to the screen sizecan be attributed to the spreading of the polystyrene into thepaper. Higher concentrations, and therefore the higher viscos-ities of the polystyrene solution provide better resolution and amore accurate reproduction of the screen design. The resolu-tion of hydrophobic barrier was also studied, where the nar-rowest designed barrier that could prevent the ow was 400 mm,
Analyst, 2014, 139, 6580–6588 | 6583
Analyst Paper
Publ
ishe
d on
15
Oct
ober
201
4. D
ownl
oade
d by
Bur
apha
Uni
vers
ity o
n 10
/12/
2020
10:
28:0
8 A
M.
View Article Online
which produced a measured width of 380 � 40 mm (n ¼ 10)(Fig. 4b). Although ner details can be generated using photo-lithography,19,32 the dimensions obtained using the polymerscreen-printing method are satisfactory for most of the mPADapplications.5–9,33 Fabrication performance was further evalu-ated by comparing the designed screen width and measuredwidth. The results shown in Fig. 4c indicate that the resultinghydrophilic region corresponding to the designed width can becalculated using a linear equation, as follows: Wa ¼ 0.993Wd �
Fig. 4 Resolution study for the polymer screen-printing method. (a)The resolution of hydrophilic channel, where the smallest channel was671 � 50 mm in size (1000 mm designed width). (b) The resolution ofhydrophobic barrier, where the narrowest hydrophobic barrier thatcould prevent the flow of dye solution was 380 � 40 mm in size (400mm designed width). (c) The quantitative comparison of the actualwidth of hydrophilic channels on the fabricated paper with thedesigned width on the patterned screen with the linear equation,Wa ¼0.993Wd – 420.7 (r2 ¼ 0.992).
6584 | Analyst, 2014, 139, 6580–6588
420.7 (R2 ¼ 0.992), where Wa and Wd are actual width on thepaper and the designed width on the screen, respectively.
The reproducibility of device-to-device fabrication was eval-uated. Hydrophilic regions for 64 zones with a circular diameterof 5 and 7 mm were obtained (Fig. 5). The average diameter ofthe 64 microzones were 4.85 mm and 6.93 mm, which were ingood agreement with the extrapolated values of �4.54 mm and�6.53 mm, calculated using the regression equation in Fig. 4cfor designed widths of 5 mm and 7 mm, respectively. Relativestandard deviations were 2.54% and 1.12%, respectively (n ¼64), indicating the good fabrication reproducibility of thescreen-printing method. Compared to other mPAD fabricationmethods using polystyrene, our one-step printing methodcreates more reproducible mPAD structures than the inkjetetching and exographic printing method (RSD of 3.8–11.7%).17,31,34 Our proposed method is also similar to or morereproducible than fabrication methods that use wax screen-printing and wax-dipping methods (RSD of 1.5–11.0%).14,15
Although, the reproducibility is similar, the polymer spreadingis easier to control because it takes only one step for fabricationand no heating is required.
The fabricated mPAD was found to be very stable aer morethan 6 months storage because the hydrophobic barrier couldprevent the leaking of the test solution similar to its initialability. The patterned paper could be bent and folded withoutdamaging the hydrophobic barrier, which makes it better thanthe mPADs fabricated using photolithography because they arerigid due to the SU-8 properties and could not be bent andfolded.12 The mPAD could also be immersed in some organicsolvent several times without damaging the patterns because ofthe insolubility of the polystyrene in several solvents, such asmethanol, ethanol, n-hexane and acetonitrile (Fig. S-5, ESI†).Therefore, the fabricated mPAD can be used for both complexchemical analysis, as well as cell-based assays that requiremultiple adding and rinsing steps in various solvents. Thisproperty makes the mPADs fabricated using polymer screen-printing superior to those obtained from a widely used waxprintingmethod because waxmaterials cannot be used with anyorganic solvents because it is soluble in every organic solvent.9
H2O2 analysis
The quantitative analysis of H2O2 is of signicance because it isthe product of many highly selective oxidase enzymes. H2O2 isalso an important element in food, pharmaceutical, clinical andindustrial products.35–37 Using the new fabrication method, asimple paper-based sensor combining distance-based detectionwith CeO2 nanoparticles as colorimetric probes was constructedfor H2O2 analysis. Henry's group recently introduced a distance-based measurement paper device, where quantication wasachieved by measuring the length of a colored zone generatedby the reaction of the analyte with an indicator along thehydrophilic channel.14 Here, CeO2 nanoparticles were depositedalong the channel labeled as detection zone (Fig. 6A). It wasobserved that CeO2 nanoparticles endow certain hydrophobicityto the paper because of their hydrophobic properties at thesurface.38 When the solution was dropped on to CeO2-coated
This journal is © The Royal Society of Chemistry 2014
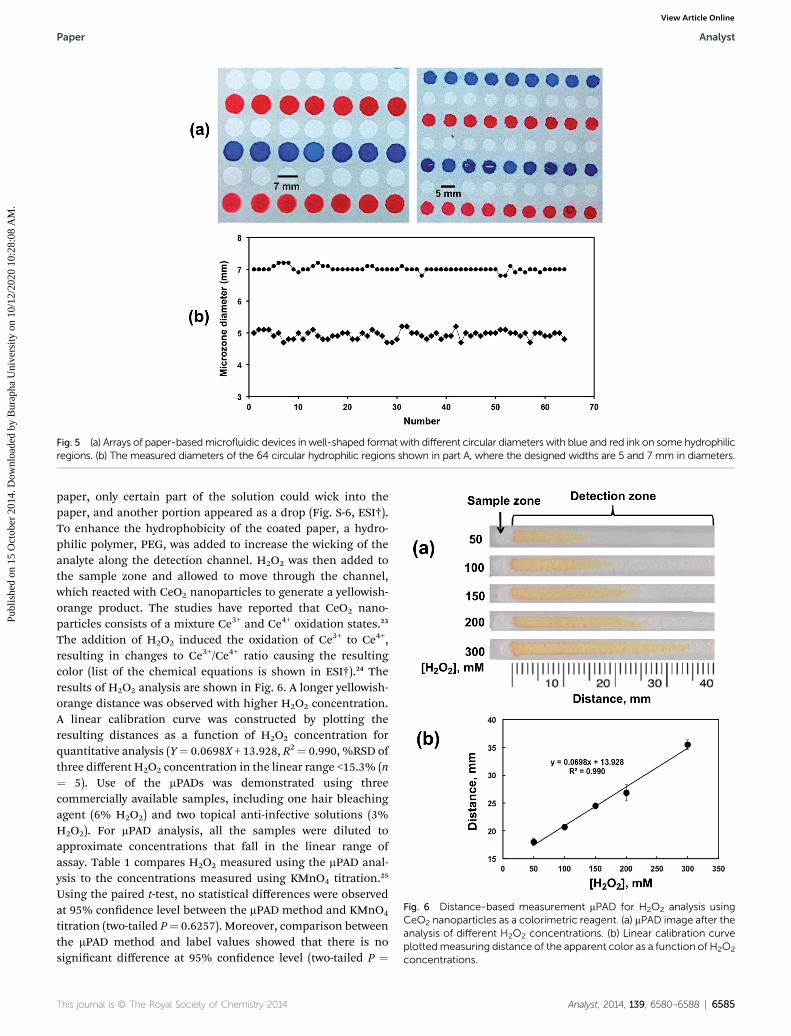
Fig. 5 (a) Arrays of paper-basedmicrofluidic devices in well-shaped format with different circular diameters with blue and red ink on some hydrophilicregions. (b) The measured diameters of the 64 circular hydrophilic regions shown in part A, where the designed widths are 5 and 7 mm in diameters.
Fig. 6 Distance-based measurement mPAD for H2O2 analysis usingCeO2 nanoparticles as a colorimetric reagent. (a) mPAD image after theanalysis of different H2O2 concentrations. (b) Linear calibration curveplottedmeasuring distance of the apparent color as a function of H2O2
concentrations.
Paper Analyst
Publ
ishe
d on
15
Oct
ober
201
4. D
ownl
oade
d by
Bur
apha
Uni
vers
ity o
n 10
/12/
2020
10:
28:0
8 A
M.
View Article Online
paper, only certain part of the solution could wick into thepaper, and another portion appeared as a drop (Fig. S-6, ESI†).To enhance the hydrophobicity of the coated paper, a hydro-philic polymer, PEG, was added to increase the wicking of theanalyte along the detection channel. H2O2 was then added tothe sample zone and allowed to move through the channel,which reacted with CeO2 nanoparticles to generate a yellowish-orange product. The studies have reported that CeO2 nano-particles consists of a mixture Ce3+ and Ce4+ oxidation states.23
The addition of H2O2 induced the oxidation of Ce3+ to Ce4+,resulting in changes to Ce3+/Ce4+ ratio causing the resultingcolor (list of the chemical equations is shown in ESI†).24 Theresults of H2O2 analysis are shown in Fig. 6. A longer yellowish-orange distance was observed with higher H2O2 concentration.A linear calibration curve was constructed by plotting theresulting distances as a function of H2O2 concentration forquantitative analysis (Y¼ 0.0698X + 13.928, R2¼ 0.990, %RSD ofthree different H2O2 concentration in the linear range <15.3% (n¼ 5). Use of the mPADs was demonstrated using threecommercially available samples, including one hair bleachingagent (6% H2O2) and two topical anti-infective solutions (3%H2O2). For mPAD analysis, all the samples were diluted toapproximate concentrations that fall in the linear range ofassay. Table 1 compares H2O2 measured using the mPAD anal-ysis to the concentrations measured using KMnO4 titration.25
Using the paired t-test, no statistical differences were observedat 95% condence level between the mPAD method and KMnO4
titration (two-tailed P¼ 0.6257). Moreover, comparison betweenthe mPAD method and label values showed that there is nosignicant difference at 95% condence level (two-tailed P ¼
This journal is © The Royal Society of Chemistry 2014 Analyst, 2014, 139, 6580–6588 | 6585
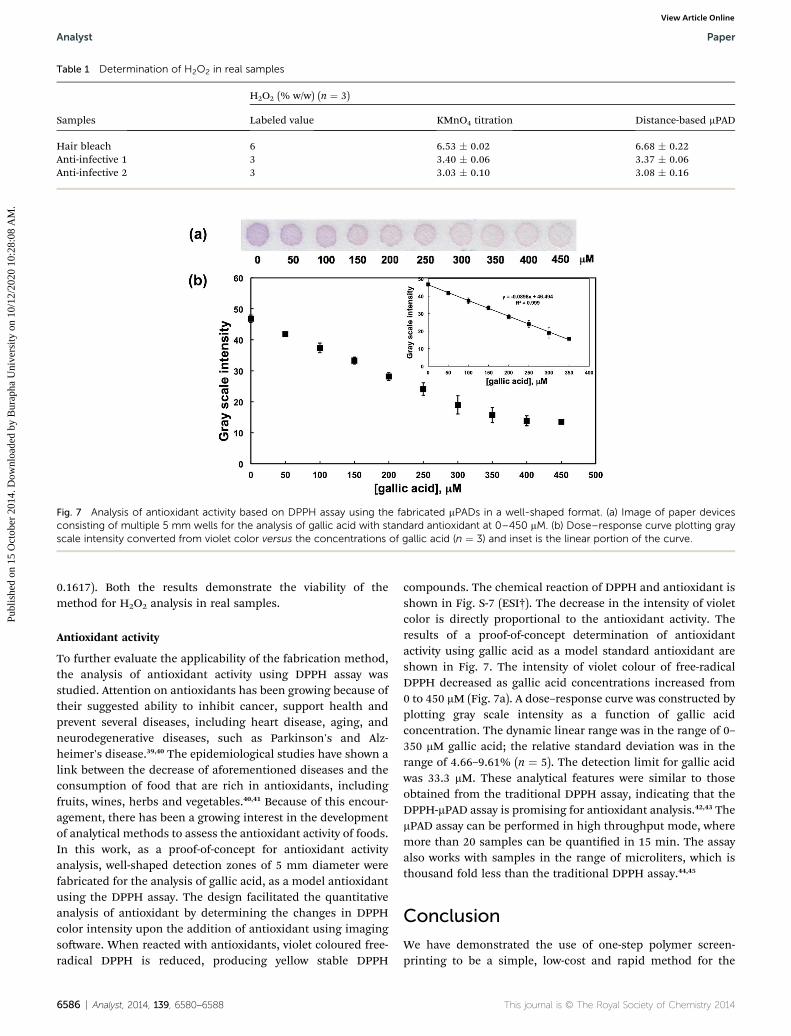
Table 1 Determination of H2O2 in real samples
Samples
H2O2 (% w/w) (n ¼ 3)
Labeled value KMnO4 titration Distance-based mPAD
Hair bleach 6 6.53 � 0.02 6.68 � 0.22Anti-infective 1 3 3.40 � 0.06 3.37 � 0.06Anti-infective 2 3 3.03 � 0.10 3.08 � 0.16
Fig. 7 Analysis of antioxidant activity based on DPPH assay using the fabricated mPADs in a well-shaped format. (a) Image of paper devicesconsisting of multiple 5 mm wells for the analysis of gallic acid with standard antioxidant at 0–450 mM. (b) Dose–response curve plotting grayscale intensity converted from violet color versus the concentrations of gallic acid (n ¼ 3) and inset is the linear portion of the curve.
Analyst Paper
Publ
ishe
d on
15
Oct
ober
201
4. D
ownl
oade
d by
Bur
apha
Uni
vers
ity o
n 10
/12/
2020
10:
28:0
8 A
M.
View Article Online
0.1617). Both the results demonstrate the viability of themethod for H2O2 analysis in real samples.
Antioxidant activity
To further evaluate the applicability of the fabrication method,the analysis of antioxidant activity using DPPH assay wasstudied. Attention on antioxidants has been growing because oftheir suggested ability to inhibit cancer, support health andprevent several diseases, including heart disease, aging, andneurodegenerative diseases, such as Parkinson's and Alz-heimer's disease.39,40 The epidemiological studies have shown alink between the decrease of aforementioned diseases and theconsumption of food that are rich in antioxidants, includingfruits, wines, herbs and vegetables.40,41 Because of this encour-agement, there has been a growing interest in the developmentof analytical methods to assess the antioxidant activity of foods.In this work, as a proof-of-concept for antioxidant activityanalysis, well-shaped detection zones of 5 mm diameter werefabricated for the analysis of gallic acid, as a model antioxidantusing the DPPH assay. The design facilitated the quantitativeanalysis of antioxidant by determining the changes in DPPHcolor intensity upon the addition of antioxidant using imagingsoware. When reacted with antioxidants, violet coloured free-radical DPPH is reduced, producing yellow stable DPPH
6586 | Analyst, 2014, 139, 6580–6588
compounds. The chemical reaction of DPPH and antioxidant isshown in Fig. S-7 (ESI†). The decrease in the intensity of violetcolor is directly proportional to the antioxidant activity. Theresults of a proof-of-concept determination of antioxidantactivity using gallic acid as a model standard antioxidant areshown in Fig. 7. The intensity of violet colour of free-radicalDPPH decreased as gallic acid concentrations increased from0 to 450 mM (Fig. 7a). A dose–response curve was constructed byplotting gray scale intensity as a function of gallic acidconcentration. The dynamic linear range was in the range of 0–350 mM gallic acid; the relative standard deviation was in therange of 4.66–9.61% (n ¼ 5). The detection limit for gallic acidwas 33.3 mM. These analytical features were similar to thoseobtained from the traditional DPPH assay, indicating that theDPPH-mPAD assay is promising for antioxidant analysis.42,43 ThemPAD assay can be performed in high throughput mode, wheremore than 20 samples can be quantied in 15 min. The assayalso works with samples in the range of microliters, which isthousand fold less than the traditional DPPH assay.44,45
Conclusion
We have demonstrated the use of one-step polymer screen-printing to be a simple, low-cost and rapid method for the
This journal is © The Royal Society of Chemistry 2014
Paper Analyst
Publ
ishe
d on
15
Oct
ober
201
4. D
ownl
oade
d by
Bur
apha
Uni
vers
ity o
n 10
/12/
2020
10:
28:0
8 A
M.
View Article Online
fabrication of mPAD. Under the optimal condition, the methodprovides well-dened hydrophobic barrier with an efficientresolution and high reproducibility without the need ofcomplicated and expensive instruments. Various mPAD formatscan be created by adjusting the screen pattern. An efficientresolution was achieved, where the smallest hydrophilicchannel and hydrophobic barrier are 671� 50 mm and 380� 40mm, respectively. Highly reproducible fabrication was obtainedfrom 64 devices with %RSD in the range of 1.12–2.54%. Theapplication of the fabricated mPAD for the chemical analysis ofreal world samples was successfully demonstrated. The mPADwith distance-based detection was used to determine H2O2
amount in real samples using CeO2 nanoparticles as colori-metric probes. No signicant difference was found at 95%condence level between the H2O2 amount obtained from themPAD and those from the conventional method. The mPAD wasfurther demonstrated for its ability to measure antioxidantactivity analysis based on DPPH assay. These demonstrationsindicated that the polymer screen-printing method is an alter-native method for mPAD fabrication, which is suitable fordeveloping countries, and amenable to further modication forcomplex chemical analysis, bio-analysis and cell-based study.
Acknowledgements
This work was supported by DPST Research Grant 013/2557from the Institute for the Promotion of Teaching Science andTechnology, Thailand and the grant from the Higher EducationResearch Promotion and National Research University Projectof Thailand, Office of the Higher Education Commission,Thailand.
References
1 S. J. Vella, P. Beattie, R. Cademartiri, A. Laromaine,A. W. Martinez, S. T. Phillips, K. A. Mirica andG. M. Whitesides, Anal. Chem., 2012, 84, 2883.
2 J. Yu, L. Ge, J. Huang, S. Wang and S. Ge, Lab Chip, 2011, 11,1286.
3 W. Dungchai, O. Chailapakul and C. S. Henry, Anal. Chem.,2009, 81, 5821.
4 W. Dungchai, O. Chailapakul and C. S. Henry, Anal. Chim.Acta, 2010, 674, 227.
5 J. C. Jokerst, J. A. Adkins, B. Bisha, M. M. Mentele,L. D. Goodridge and C. S. Henry, Anal. Chem., 2012, 84, 2900.
6 Y. Sameenoi, P. Panymeesamer, N. Supalakorn, K. Koehler,O. Chailapakul, C. S. Henry and J. Volckens, Environ. Sci.Technol., 2012, 47, 932.
7 M. M. Mentele, J. Cunningham, K. Koehler, J. Volckens andC. S. Henry, Anal. Chem., 2012, 84, 4474.
8 W. Dungchai, Y. Sameenoi, O. Chailapakul, J. Volckens andC. S. Henry, Analyst, 2013, 138, 6766.
9 A. K. Yetisen, M. S. Akram and C. R. Lowe, Lab Chip, 2013, 13,2210.
10 J. Hu, S. Wang, L. Wang, F. Li, B. Pingguan-Murphy, T. J. Luand F. Xu, Biosens. Bioelectron., 2014, 54, 585.
This journal is © The Royal Society of Chemistry 2014
11 X. Li, D. R. Ballerini and W. Shen, Biomicrouidics, 2012, 6,011301.
12 A. W. Martinez, S. T. Phillips, E. Carrilho, S. W. Thomas III,H. Sindi and G. M. Whitesides, Anal. Chem., 2008, 80, 3699.
13 E. Carrilho, A. W. Martinez and G. M. Whitesides, Anal.Chem., 2009, 81, 7091.
14 W. Dungchai, O. Chailapakul and C. S. Henry, Analyst, 2011,136, 77.
15 T. Songjaroen, W. Dungchai, O. Chailapakul andW. Laiwattanapaisal, Talanta, 2011, 85, 2587.
16 D. A. Bartholomeusz, R. W. Boutte and J. D. Andrade, J.Microelectromech. Syst., 2005, 14, 1364.
17 K. Abe, K. Suzuki and D. Citterio, Anal. Chem., 2008, 80, 6928.18 A. W. Martinez, S. T. Phillips, M. J. Butte and
G. M. Whitesides, Angew. Chem., Int. Ed., 2007, 46, 1318.19 A. W. Martinez, S. T. Phillips, B. J. Wiley, M. Gupta and
G. M. Whitesides, Lab Chip, 2008, 8, 2146.20 Y. Lu, W. Shi, L. Jiang, J. Qin and B. Lin, Electrophoresis,
2009, 30, 1497.21 E. M. Fenton, M. R. Mascarenas, G. P. Lopez and
S. S. Sibbett, ACS Appl. Mater. Interfaces, 2008, 1, 124.22 D. M. Cate, W. Dungchai, J. C. Cunningham, J. Volckens and
C. S. Henry, Lab Chip, 2013, 13, 2397.23 J. D. Gaynor, A. S. Karakoti, T. Inerbaev, S. Sanghavi,
P. Nachimuthu, V. Shutthanandan, S. Seal andS. Thevuthasan, J. Mater. Chem. B, 2013, 1, 3443.
24 M. Ornatska, E. Sharpe, D. Andreescu and S. Andreescu,Anal. Chem., 2011, 83, 4273.
25 N. V. Klassen, D. Marchington and H. C. E. McGowan, Anal.Chem., 1994, 66, 2921.
26 M. K. Roy, M. Koide, T. P. Rao, T. Okubo, Y. Ogasawara andL. R. Juneja, Int. J. Food Sci. Nutr., 2010, 61, 109.
27 K. Schlesier, M. Harwat, V. Bohm and R. Bitsch, Free RadicalRes., 2002, 36, 177.
28 M. Tudorache and C. Bala, Anal. Bioanal. Chem., 2007, 388,565.
29 J. Wang, Chem. Rev., 2008, 108, 814.30 J. P. Metters, R. O. Kadara and C. E. Banks, Analyst, 2011,
136, 1067.31 J. Olkkonen, K. Lehtinen and T. Erho, Anal. Chem., 2010, 82,
10246.32 Q. He, C. Ma, X. Hu and H. Chen, Anal. Chem., 2013, 85,
1327.33 X. Mu, L. Zhang, S. Chang, W. Cui and Z. Zheng, Anal. Chem.,
2014, 86, 5338.34 K. Abe, K. Kotera, K. Suzuki and D. Citterio, Anal. Bioanal.
Chem., 2010, 398, 885.35 S.-Q. Liu and H.-X. Ju, Anal. Biochem., 2002, 307, 110.36 Y. Xiao, H.-X. Ju and H.-Y. Chen, Anal. Chim. Acta, 1999, 391,
73.37 T. You, O. Niwa, M. Tomita and S. Hirono, Anal. Chem., 2003,
75, 2080.38 G. Azimi, R. Dhiman, H.-M. Kwon, A. T. Paxson and
K. K. Varanasi, Nat. Mater., 2013, 12, 315.39 L. H. Yao, Y. Jiang, J. Shi, F. Tomas-Barberan, N. Datta,
R. Singanusong and S. Chen, Plant Foods Hum. Nutr., 2004,59, 113.
Analyst, 2014, 139, 6580–6588 | 6587
Analyst Paper
Publ
ishe
d on
15
Oct
ober
201
4. D
ownl
oade
d by
Bur
apha
Uni
vers
ity o
n 10
/12/
2020
10:
28:0
8 A
M.
View Article Online
40 C. Kaur and H. C. Kapoor, Int. J. Food Sci. Technol., 2001, 36,703.
41 J. Sun, Y.-F. Chu, X. Wu and R. H. Liu, J. Agric. Food Chem.,2002, 50, 7449.
42 E. V. Piletska, S. S. Piletsky, M. J. Whitcombe, I. Chianellaand S. A. Piletsky, Anal. Chem., 2012, 84, 2038.
6588 | Analyst, 2014, 139, 6580–6588
43 Z. Cheng, J. Moore and L. Yu, J. Agric. Food Chem., 2006, 54,7429.
44 C. Sanchez-Moreno, J. A. Larrauri and F. Saura-Calixto, J. Sci.Food Agric., 1998, 76, 270.
45 M. Ozgen, R. N. Reese, A. Z. Tulio, J. C. Scheerens andA. R. Miller, J. Agric. Food Chem., 2006, 54, 1151.
This journal is © The Royal Society of Chemistry 2014