ns HBG1/2 *** ** HBB · HBG1 b HBB c + ∆∆ ∆∆ 10 ** ...
9
b a %HBG1/2 mRNA mock Cas9 Cas9 + gRNA-1 Cas9 + gRNA-2 **** *** Fold change HBB mRNA c mock Cas9 Cas9 + gRNA-1 Cas9 + gRNA-2 ** ns Supplementary Figure 1. Genome editing of the HBG1 and HBG2 promoters reverses the γ-to-β globin switch in HUDEP-2 cells. HUDEP-2 cells were transduced with lentivirus expressing mCherry and Cas9 ± gRNAs. mCherry + cells were purified by FACS, cultured for 3 days, then analyzed. (a) Quantification of HbA (α2β2) and HbF (α2γ2) proteins in undifferentiated HUDEP-2 cell cultures expressing Cas9 ± gRNA-1 or -2 by high performance liquid chromatography (HPLC). Shown below are indel allele frequencies, expressed as percentages of all alleles, as determined by PCR amplification and next generation sequencing using primers depicted in Supplementary Fig. 4a. Coverage for each nt position sequenced was over 97,000x. (b) Quantitative real-time PCR analysis showing %HBG1/2 (γ-globin) mRNA [γ/(γ + β)] in gene-edited and control cells. n = 3, shown as mean value ± standard error (SE). (c) HBB (β-globin) mRNA levels in genome-edited and control cells, expressed as fold change vs. mock-transduced cells. n = 3, mean value ± SE. ** P < 0.01, *** P <0.001, **** P < 0.0001 by unpaired t-test. HbF undetected HbA HbA Cas9 Cas9 + gRNA-1 retention time HbF 2.7% HbA Cas9 + gRNA-2 HbF 17.4% ~99% ~86% Indel frequency by next generation sequencing Nature Medicine: doi:10.1038/nm.4170
Transcript of ns HBG1/2 *** ** HBB · HBG1 b HBB c + ∆∆ ∆∆ 10 ** ...
b
a%
HB
G1/
2 m
RN
A
mock Cas9 Cas9 +gRNA-1
Cas9 +gRNA-2
****
***
Fol
d ch
ange
HB
B m
RN
A
c
mock Cas9 Cas9 +gRNA-1
Cas9 +gRNA-2
**
ns
Supplementary Figure 1. Genome editing of the HBG1 and HBG2 promoters reverses the γ-to-β globin switch in HUDEP-2 cells. HUDEP-2 cells were transduced with lentivirus expressing mCherry and Cas9 ± gRNAs. mCherry+ cells were purified by FACS, cultured for 3 days, then analyzed. (a) Quantification of HbA (α2β2) and HbF (α2γ2) proteins in undifferentiated HUDEP-2 cell cultures expressing Cas9 ± gRNA-1 or -2 by high performance liquid chromatography (HPLC). Shown below are indel allele frequencies, expressed as percentages of all alleles, as determined by PCR amplification and next generation sequencing using primers depicted in Supplementary Fig. 4a. Coverage for each nt position sequenced was over 97,000x. (b) Quantitative real-time PCR analysis showing %HBG1/2 (γ-globin) mRNA [γ/(γ + β)] in gene-edited and control cells. n = 3, shown as mean value ± standard error (SE). (c) HBB (β-globin) mRNA levels in genome-edited and control cells, expressed as fold change vs. mock-transduced cells. n = 3, mean value ± SE. ** P < 0.01, *** P <0.001, **** P < 0.0001 by unpaired t-test.
HbFundetected
HbA
HbA
Cas9 Cas9 + gRNA-1
retention time
HbF2.7%
HbA
Cas9 + gRNA-2
HbF17.4%
~99% ~86%Indel frequency by next generation sequencing
Nature Medicine: doi:10.1038/nm.4170
a
CD235
CD
71Cas9 Cas9 + gRNA-1
FSC
CD
45
b
c
α4-i
nteg
rin
Band3
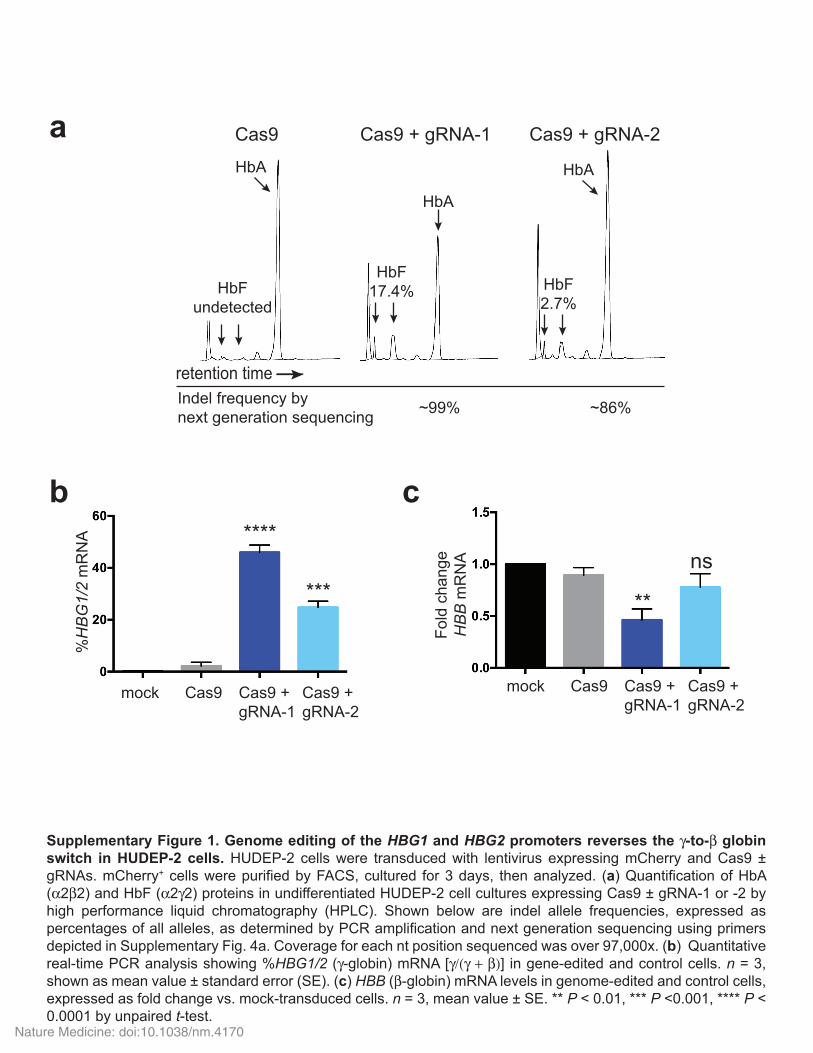
Supplementary Figure 2. Genome editing of the HBG1 and HBG2 promoters in CD34+ cells reverses the γ-to-β globin switch in erythroid progeny without altering differentiation or maturation. CD34+
hematopoietic stem and progenitor cells (HSPC) from a healthy donor were transduced with lentivirus expressing Cas9 or Cas9/gRNA-1, mCherry+ cells were FACS enriched, cultured under conditions favoring erythroid differentiation and analyzed by flow cytometry for developmental stage specific markers. The plots shown are representative of three experiments. (a) Erythroid maturation markers CD71 and CD235 on culture day 21. (b) CD45 expression on culture day 21. (c-d) α4-integrin downregulation and Band3 upregulation between d14 and d21 of erythroid maturation. Cells in gates outlined in black were isolated by FACS and analyzed by qRT-PCR for %HBG1/2 (γ-globin) mRNA in panel (e) and (f) HBB (β-globin) mRNA levels, relative to mock-transduced cells. Overall indel frequencies for three independent experiments in CD34+ cells were 56, 65, and 77%. * P <0.05, ** P < 0.01, *** P < 0.001, **** P < 0.0001 by unpaired student’s t-tests.
α4-i
nteg
rin
Band3
Cas9 Cas9 + gRNA-1
Cas9 Cas9 + gRNA-1 Cas9 Cas9 + gRNA-1d
d21
d14
d21
d21
mock Cas9 Cas9 +gRNA-1
mock Cas9 Cas9 +gRNA-1
%H
BG
1/2
mR
NA
Fold
cha
nge
HB
B m
RN
A
e f****
*
Nature Medicine: doi:10.1038/nm.4170
a
b
HbF
SS
C
SCD
Cas9
SCD
Cas9 + gRNA-1
SCD
mock
FSC
Hoechst
64.6 ± 5.6% 66.7 ± 7.3%
32.8 ± 1.8% 35.9 ± 4.6%
90.4 ± 2.0%
42.9 ± 2.5%
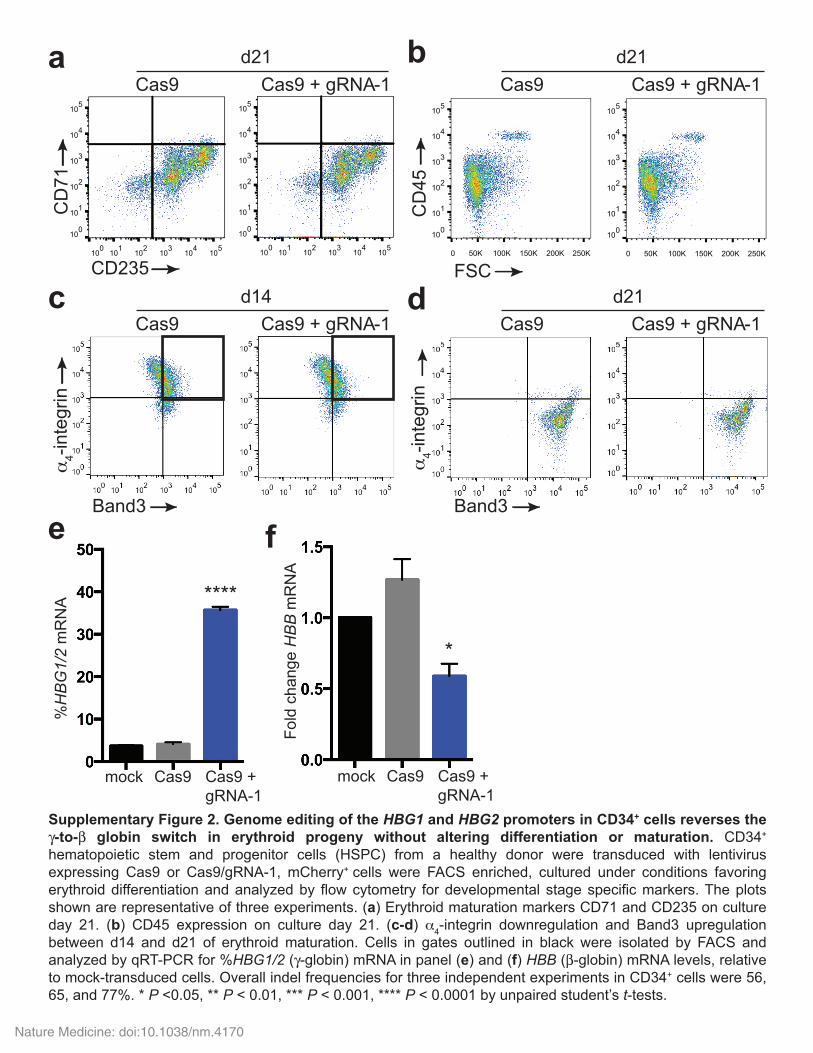
Supplementary Figure 3. Effects of Cas9 + gRNA-1 on SCD erythroblasts. Peripheral blood CD34+ cells
from three SCD patients with HbSS genotype were transduced lentivirus expressing Cas9 or Cas9/gRNA-1,
enriched by FACS for mCherry fluorescence, and cultured under conditions that favor erythroid maturation. After
21 days of culture, cells were analyzed by flow cytometry. Representative plots from three experiments are
shown with mean values ± SE. (a) Hoechst staining to distinguish nucleated erythroblasts from anucleate
reticulocytes (black boxes). (b) HbF immunostaining cells (“F-cells”, black boxes). Numbers in the flow cytometry
plots for panels (a) and (b) indicate mean ± SE for three independent experiments. Numbering below the plots
in panel (b) indicates HPLC determination of %HbF for one experiment. * P < 0.05, ns = not significant, unpaired
ns ns
*ns
%HbF:
(HPLC) 14.1% 14.2% 35.6%
Nature Medicine: doi:10.1038/nm.4170
32.8%
HbF
SS
C
CD235
SS
C
36.1%Low
High10.8%Intermed High
GCCTTGCCTTGACCAATAGCCTTGACAGCCTTGCCTTGAC-------------A
GCCTTGCCTTGA--AATAGCCTTGACAGCCTTGCCTTGA-CAATAGCCTTGACA
GCCTTGCCTTGA---ATAGCCTTGACA
GCCTTGCCTTGAcCCAATAGCCTTGACA
Allele frequency (%)
GCCTTGCCTTGA----TAGCCTTGACA
GCCTTGCCTTG-CCAATAGCCTTGACA
GCCTTG------CCAATAGCCTTGACAG-----------CCAATAGCCTTGACA
b
a
c
80.4%
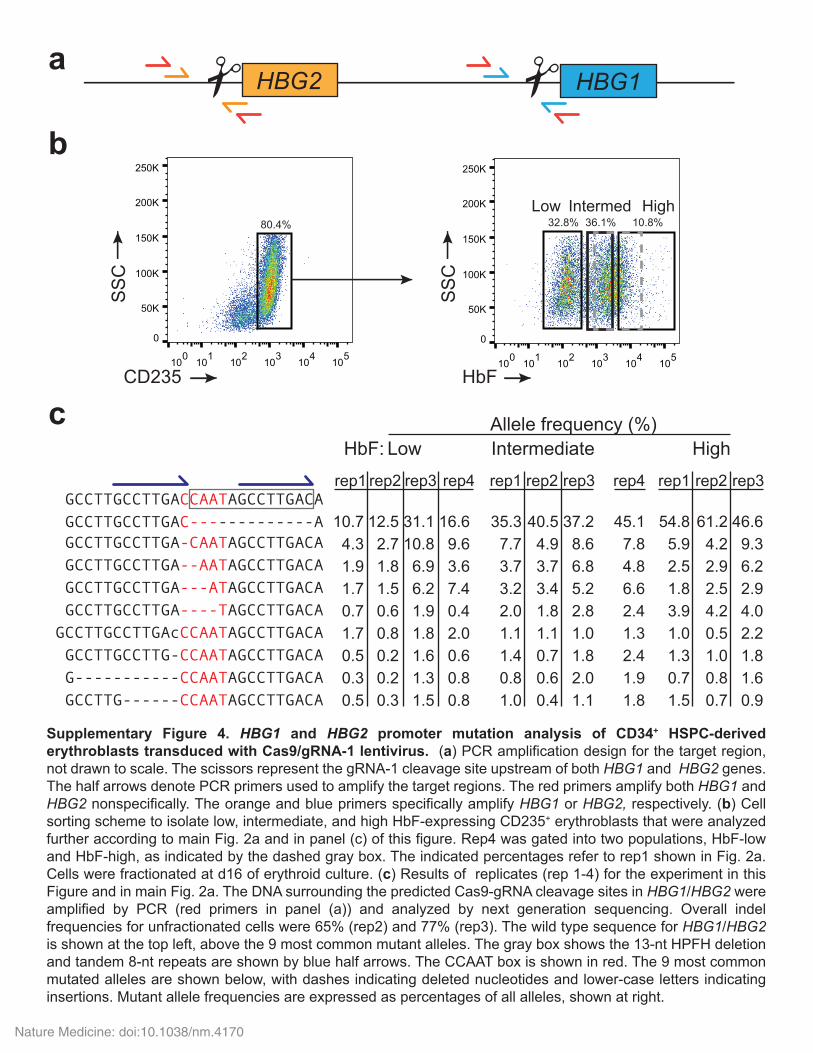
Supplementary Figure 4. HBG1 and HBG2 promoter mutation analysis of CD34+ HSPC-derived
erythroblasts transduced with Cas9/gRNA-1 lentivirus. (a) PCR amplification design for the target region, not drawn to scale. The scissors represent the gRNA-1 cleavage site upstream of both HBG1 and HBG2 genes. The half arrows denote PCR primers used to amplify the target regions. The red primers amplify both HBG1 and HBG2 nonspecifically. The orange and blue primers specifically amplify HBG1 or HBG2, respectively. (b) Cell sorting scheme to isolate low, intermediate, and high HbF-expressing CD235+ erythroblasts that were analyzed further according to main Fig. 2a and in panel (c) of this figure. Rep4 was gated into two populations, HbF-low and HbF-high, as indicated by the dashed gray box. The indicated percentages refer to rep1 shown in Fig. 2a. Cells were fractionated at d16 of erythroid culture. (c) Results of replicates (rep 1-4) for the experiment in this Figure and in main Fig. 2a. The DNA surrounding the predicted Cas9-gRNA cleavage sites in HBG1/HBG2 were amplified by PCR (red primers in panel (a)) and analyzed by next generation sequencing. Overall indel frequencies for unfractionated cells were 65% (rep2) and 77% (rep3). The wild type sequence for HBG1/HBG2 is shown at the top left, above the 9 most common mutant alleles. The gray box shows the 13-nt HPFH deletion and tandem 8-nt repeats are shown by blue half arrows. The CCAAT box is shown in red. The 9 most common mutated alleles are shown below, with dashes indicating deleted nucleotides and lower-case letters indicating insertions. Mutant allele frequencies are expressed as percentages of all alleles, shown at right.
12.5 31.1 16.62.7 10.8 9.6
1.8 6.9 3.61.5 6.2 7.40.6 1.9 0.40.8 1.8 2.00.2 1.6 0.60.2 1.3 0.80.3 1.5 0.8
40.5 37.24.9 8.63.7 6.83.4 5.21.8 2.81.1 1.00.7 1.80.6 2.00.4 1.1
61.2 46.64.2 9.32.9 6.22.5 2.94.2 4.00.5 2.21.0 1.80.8 1.60.7 0.9
Low High Intermediate HbF:
rep2 rep3 rep2 rep3 rep2 rep3
HBG2 HBG1
rep4 rep4
45.17.84.86.62.41.32.41.91.8
rep1
10.74.3
1.9 1.7 0.7 1.7
0.5 0.3 0.5
rep1
35.37.7
3.7 3.2 2.0 1.1 1.4 0.8 1.0
54.85.92.51.83.91.01.30.71.5
rep1
Nature Medicine: doi:10.1038/nm.4170
Colony
#
HBG1
mutation frequency
(%)
HBG2
mutation frequency
(%)
HBG mutation frequency
(%)
% -globin
mRNA
1 wt a: 47.3 23.6 34.1
2 b: 38.1 c: 6.7
b: 7.2 26.0 30.2
3 b: 11.2 b: 50.0 30.6 30.0
4 d: 56.1 wt 28.0 1.6
5 wt e: 13.0 6.5 11.6
6 wt f: 18.0 9.0 38.0
7 g: 22.2 f: 5.6 h: 1.8
wt
14.8 25.3
8 wt i: 16.4 8.2 21.3
9 i: 47.0 d: 10.6
d: 2.6 30.1 29.1
10 i: 6.7 f: 19.4 13.0 4.8
11 wt j: 49.3 i: 1.7
25.5 21.6
12 i: 21.9 g: 1.8
wt 11.8 13.4
13 i: 8.7 wt 4.4 4.6
14 c: 3.3 c: 11.9 i: 7.9
11.6 5.7
15 wt k: 22.7 11.4 12.5
16 f: 1.5 wt 0.8 0.5
17 i: 16.7 e: 13.0 d: 8.6
19.2 28.4
18 wt f: 51.8 25.9 3.1
19 d: 11.3 g: 12.5 k: 3.5
13.6 19.0
20 b: 28.0 i: 2.7 l: 2.2
d: 7.1 20.0 8.0
CCTTGCCTTGAC-------------AAGGCA
CCTTGCCTTGAC-AATAGCCTTGACAAGGCA CCTTGCCTTGA--AATAGCCTTGACAAGGCA CCTTGCCTTGA---ATAGCCTTGACAAGGCA
CCTTGCCTTGA----TAGCCTTGACAAGGCA
CCTTGCCTTGA--------CTTGACAAGGCA
CCTTG------------------ACAAGGCA
CCTTGCCTTGAcCCAATAGCCTTGACAAGGCA
CCTTGCCTTG-CCAATAGCCTTGACAAGGCACCTTGCCTTGtACCAATAGCCTTGACAAGGCA
TTGCCTTGAaaggCCAATAGCCTTGACAAGGCA
CCTTGCCTTGACCAATAGCCTTGACAAGGCA
a:b:c:d:e:f:g:h:i:j:k:l:m:n:o:p:q:r:s:t:u:v:
wild type:(wt)
CCTTGCCTTGA--------CTTGACAAGGCACCTTGCCTTG--------CCTTGACAAGGCACCTTGCCTTG-------GCCTTGACAAGGCA-----------CCAATAGCCTTGACAAGGCA
C------------AATAGCCTTGACAAGGCACCTTGCC------------------AAGGCA
CCTT-----------------------GGCA GAaagcaatagcCCAATAGCCTTGACAAGGCA
CCTTGCCTTGAaCCAATAGCCTTGACAAGGCACCTT-------CCAATAGCCTTGACAAGGCACCTTGCCTTGAC------------------A
%HBG1/2
mRNA
Totalmutationfrequency
(%)
Nature Medicine: doi:10.1038/nm.4170
Colony
#
HBG1
mutation frequency
(%)
HBG2
mutation frequency
(%)
HBG
mutation frequency
(%)
% -globin
mRNA
21 b: 28.5 wt 14.2 2.6
22 wt i: 33.0 d: 4.0 m: 1.8 n: 1.3
20.0 13.9
23 o: 9.4 p: 8.5 q: 2.2
p: 9.1 q: 1.2
15.2 15.1
24 j: 63.1 b: 4.1 i: 2.4 j: 1.0
35.3 37.8
25 g: 33.2 r: 1.8
f: 14.8 24.9 15.5
26 i: 4.5 wt 2.2 23.7
27 i: 18.8 s: 14.3 b: 4.1 n: 1.6
t: 33.1 b: 7.6 i: 6.7 u: 1.4
43.8 67.0
28 wt i: 23.8 n: 1.9
12.8 21.1
29 b: 1.4 i: 6.8 4.1 11.0
30 wt v: 29.7 i: 10.4
20.0 32.6
31-35 wt wt 0.0 0.2-11.0
CCTTGCCTTGAC-------------AAGGCA
CCTTGCCTTGAC-AATAGCCTTGACAAGGCA CCTTGCCTTGA--AATAGCCTTGACAAGGCA CCTTGCCTTGA---ATAGCCTTGACAAGGCA
CCTTGCCTTGA----TAGCCTTGACAAGGCA
CCTTGCCTTGA--------CTTGACAAGGCA
CCTTG------------------ACAAGGCA
CCTTGCCTTGAcCCAATAGCCTTGACAAGGCA
CCTTGCCTTG-CCAATAGCCTTGACAAGGCACCTTGCCTTGtACCAATAGCCTTGACAAGGCA
TTGCCTTGAaaggCCAATAGCCTTGACAAGGCA
CCTTGCCTTGACCAATAGCCTTGACAAGGCA
a:b:c:d:e:f:g:h:i:j:k:l:m:n:o:p:q:r:s:t:u:v:
wild type:(wt)
CCTTGCCTTGA--------CTTGACAAGGCACCTTGCCTTG--------CCTTGACAAGGCACCTTGCCTTG-------GCCTTGACAAGGCA-----------CCAATAGCCTTGACAAGGCA
C------------AATAGCCTTGACAAGGCACCTTGCC------------------AAGGCA
CCTT-----------------------GGCA GAaagcaatagcCCAATAGCCTTGACAAGGCA
CCTTGCCTTGAaCCAATAGCCTTGACAAGGCACCTT-------CCAATAGCCTTGACAAGGCACCTTGCCTTGAC------------------A
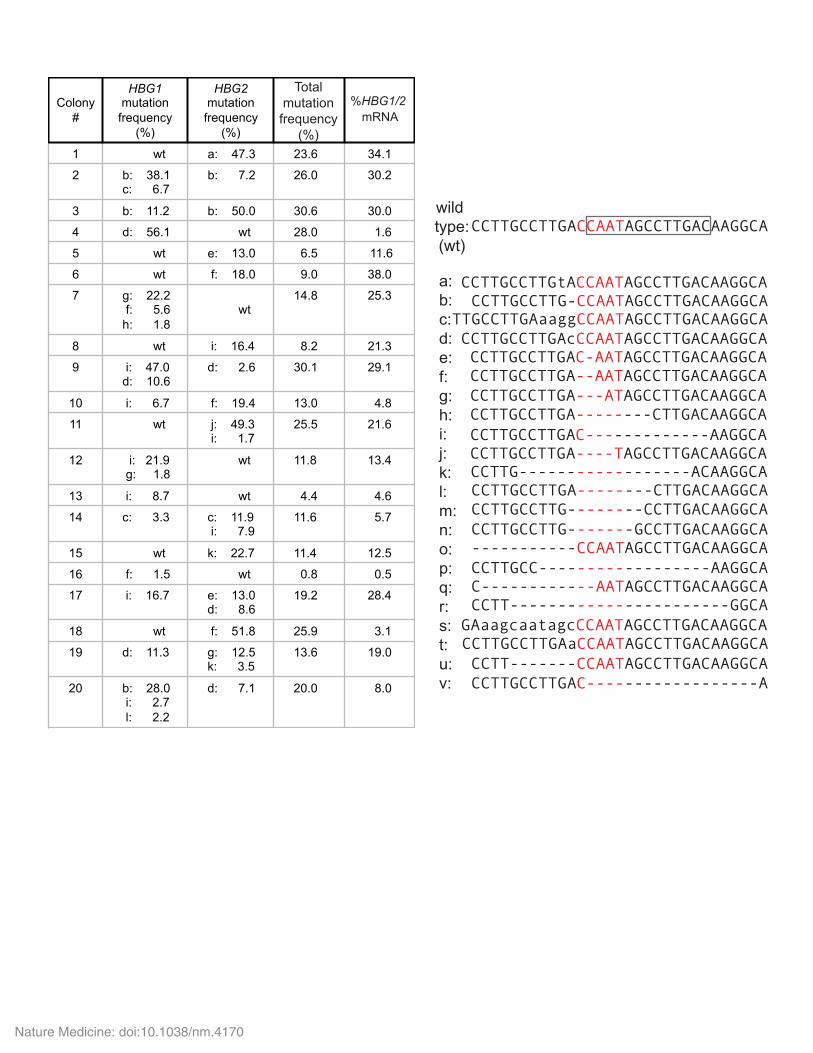
Supplementary Fig. 5. Analysis of burst forming unit-erythroid (BFU-E) colonies derived from transiently
edited CD34+ HSPCs. CD34+ HSPCs were electroporated with 10 µg gRNA-1/Cas9/GFP plasmid. GFP+ cells were enriched by FACS and cultured in methylcellulose with erythroid-promoting cytokines. Of 344 individual colonies evaluated for HBG1 and HBG2 mutations (see Supplementary Fig. 4a), we detected mutations in 30. The wild type sequence is depicted at the top right, with the 13-nt HPFH deletion boxed. Specific mutations identified in each colony are shown below the wild type sequence. Dashes denote deleted nucleotides, and lower-case denotes inserted bases. Frequencies for all detected mutations are expressed as percentages of all alleles.
%HBG1/2
mRNA
Totalmutationfrequency
(%)
Nature Medicine: doi:10.1038/nm.4170
TT--------GCCTTGACAATT-------AGCCTTGACAATT-----ATAGCCTTGACAA
HBG2 HBG1
%HbF+ cells
%HBG1/2 mRNA
TTGACCAATAGCCTTGACAATTGACCAATAGCCTTGACAA
TTGACCAATAGCCTTGACAATTGACCAATAGCCTTGACAA
Wild type
0.270.25
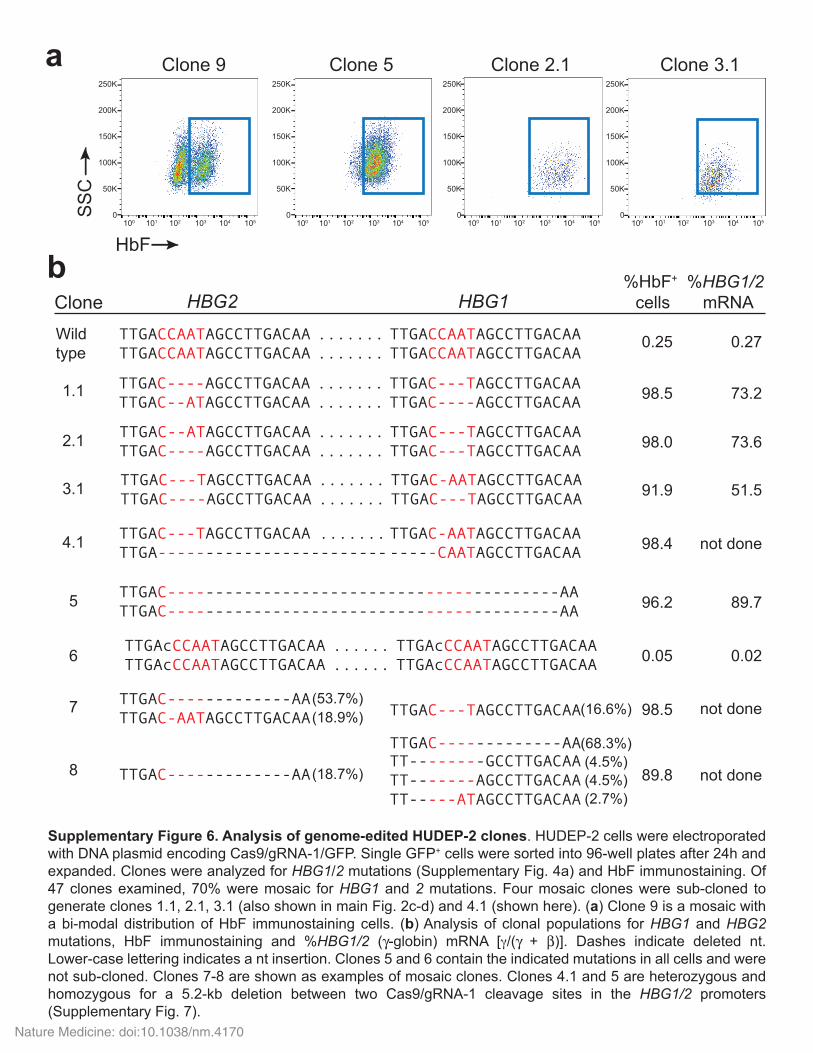
Supplementary Figure 6. Analysis of genome-edited HUDEP-2 clones. HUDEP-2 cells were electroporated with DNA plasmid encoding Cas9/gRNA-1/GFP. Single GFP+ cells were sorted into 96-well plates after 24h and expanded. Clones were analyzed for HBG1/2 mutations (Supplementary Fig. 4a) and HbF immunostaining. Of 47 clones examined, 70% were mosaic for HBG1 and 2 mutations. Four mosaic clones were sub-cloned to generate clones 1.1, 2.1, 3.1 (also shown in main Fig. 2c-d) and 4.1 (shown here). (a) Clone 9 is a mosaic with a bi-modal distribution of HbF immunostaining cells. (b) Analysis of clonal populations for HBG1 and HBG2 mutations, HbF immunostaining and %HBG1/2 (γ-globin) mRNA [γ/(γ + β)]. Dashes indicate deleted nt. Lower-case lettering indicates a nt insertion. Clones 5 and 6 contain the indicated mutations in all cells and were not sub-cloned. Clones 7-8 are shown as examples of mosaic clones. Clones 4.1 and 5 are heterozygous and homozygous for a 5.2-kb deletion between two Cas9/gRNA-1 cleavage sites in the HBG1/2 promoters (Supplementary Fig. 7).
5 TTGAC-----------------------------------------AATTGAC-----------------------------------------AA 89.796.2
4.1 TTGAC---TAGCCTTGACAATTGA------------------------
TTGAC-AATAGCCTTGACAA-----CAATAGCCTTGACAA 98.4
7 TTGAC---TAGCCTTGACAA 98.5
8 TTGAC-------------AA
TTGAC-------------AA
89.8
(16.6%)(53.7%)(18.9%)
TTGAC-------------AATTGAC-AATAGCCTTGACAA
(68.3%)(4.5%)
(18.7%) (4.5%)(2.7%)
b
a
HbF
SS
CClone 5 Clone 9
.......
.......
....... not done
not done
not done
Clone 3.1Clone 2.1
100 101 102 103 104 105 100 101 102 103 104 105 100 101 102 103 104 105 100 101 102 103 104 105
250K
200K
150K
100K
50K
0
250K
200K
150K
100K
50K
0
250K
200K
150K
100K
50K
0
250K
200K
150K
100K
50K
0
1.1
2.1
3.1
TTGAC----AGCCTTGACAATTGAC--ATAGCCTTGACAA
TTGAC--ATAGCCTTGACAATTGAC----AGCCTTGACAA
TTGAC---TAGCCTTGACAATTGAC----AGCCTTGACAA
TTGAC---TAGCCTTGACAATTGAC----AGCCTTGACAA
TTGAC---TAGCCTTGACAATTGAC---TAGCCTTGACAA
TTGAC-AATAGCCTTGACAATTGAC---TAGCCTTGACAA
73.2
73.6
51.591.9
98.5
98.0
.......
.......
.......
.......
.......
.......
6 TTGAcCCAATAGCCTTGACAATTGAcCCAATAGCCTTGACAA
TTGAcCCAATAGCCTTGACAATTGAcCCAATAGCCTTGACAA 0.020.05......
......
Clone
Nature Medicine: doi:10.1038/nm.4170
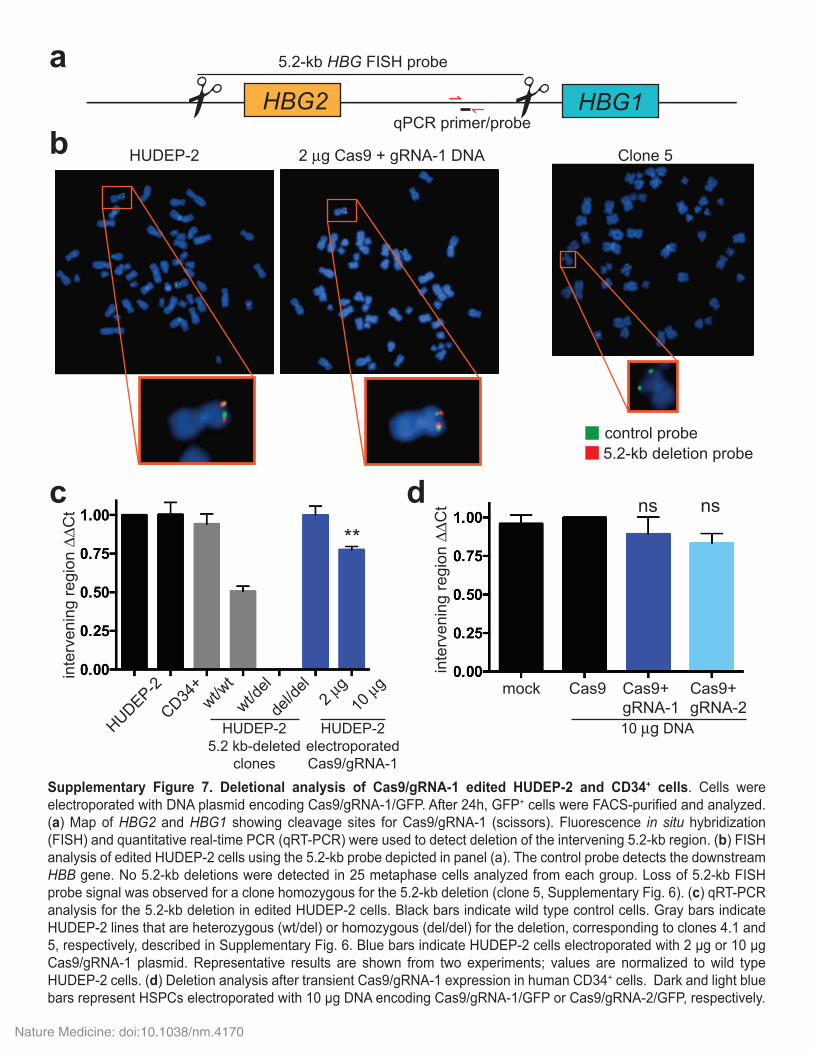
Supplementary Figure 7. Deletional analysis of Cas9/gRNA-1 edited HUDEP-2 and CD34+ cells. Cells were
electroporated with DNA plasmid encoding Cas9/gRNA-1/GFP. After 24h, GFP+ cells were FACS-purified and analyzed.
(a) Map of HBG2 and HBG1 showing cleavage sites for Cas9/gRNA-1 (scissors). Fluorescence in situ hybridization
(FISH) and quantitative real-time PCR (qRT-PCR) were used to detect deletion of the intervening 5.2-kb region. (b) FISH
analysis of edited HUDEP-2 cells using the 5.2-kb probe depicted in panel (a). The control probe detects the downstream
HBB gene. No 5.2-kb deletions were detected in 25 metaphase cells analyzed from each group. Loss of 5.2-kb FISH
probe signal was observed for a clone homozygous for the 5.2-kb deletion (clone 5, Supplementary Fig. 6). (c) qRT-PCR
analysis for the 5.2-kb deletion in edited HUDEP-2 cells. Black bars indicate wild type control cells. Gray bars indicate
HUDEP-2 lines that are heterozygous (wt/del) or homozygous (del/del) for the deletion, corresponding to clones 4.1 and
5, respectively, described in Supplementary Fig. 6. Blue bars indicate HUDEP-2 cells electroporated with 2 μg or 10 μg Cas9/gRNA-1 plasmid. Representative results are shown from two experiments; values are normalized to wild type
HUDEP-2 cells. (d) Deletion analysis after transient Cas9/gRNA-1 expression in human CD34+ cells. Dark and light blue
bars represent HSPCs electroporated with 10 μg DNA encoding Cas9/gRNA-1/GFP or Cas9/gRNA-2/GFP, respectively.
a
control probe
5.2-kb deletion probe
HUDEP-2 2 µg Cas9 + gRNA-1 DNAb
HBG2 HBG1qPCR primer/probe
5.2-kb HBG FISH probe
Clone 5
HUDEP-2
CD34+
wt/wt
wt/del
2 µg
del/d
el
10 µg
HUDEP-2
electroporated
Cas9/gRNA-1
HUDEP-2
5.2 kb-deleted
clones
inte
rvenin
g r
egio
n ∆
∆Ct
mock Cas9 Cas9+
gRNA-1
Cas9+
gRNA-2
inte
rvenin
g r
egio
n ∆
∆Ct
d
10 µg DNA
**
nsnsc
Nature Medicine: doi:10.1038/nm.4170
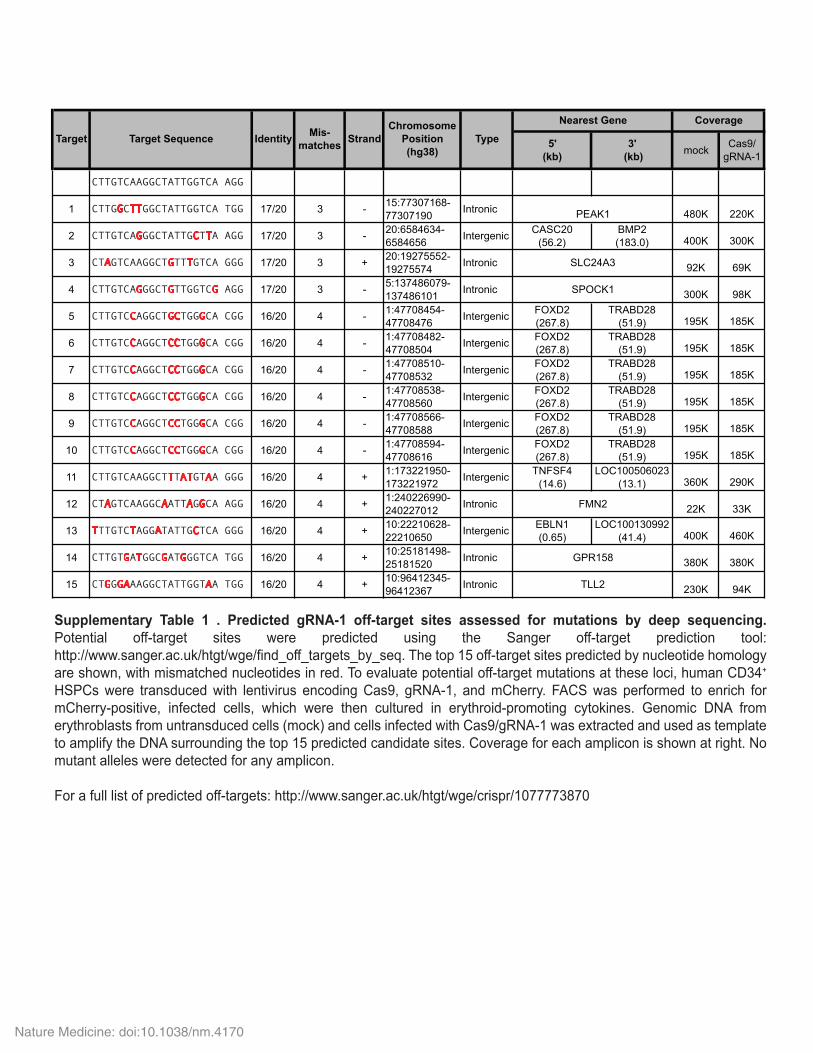
Supplementary Table 1 . Predicted gRNA-1 off-target sites assessed for mutations by deep sequencing. Potential off-target sites were predicted using the Sanger off-target prediction tool: http://www.sanger.ac.uk/htgt/wge/find_off_targets_by_seq. The top 15 off-target sites predicted by nucleotide homology are shown, with mismatched nucleotides in red. To evaluate potential off-target mutations at these loci, human CD34+ HSPCs were transduced with lentivirus encoding Cas9, gRNA-1, and mCherry. FACS was performed to enrich for mCherry-positive, infected cells, which were then cultured in erythroid-promoting cytokines. Genomic DNA from erythroblasts from untransduced cells (mock) and cells infected with Cas9/gRNA-1 was extracted and used as template to amplify the DNA surrounding the top 15 predicted candidate sites. Coverage for each amplicon is shown at right. No mutant alleles were detected for any amplicon. For a full list of predicted off-targets: http://www.sanger.ac.uk/htgt/wge/crispr/1077773870
5'(kb)
3' (kb) mock Cas9/
gRNA-1
CTTGTCAAGGCTATTGGTCA AGG
1 CTTGGCTTGGCTATTGGTCA TGG 17/20 3 - 15:77307168-77307190 Intronic 480K 220K
2 CTTGTCAGGGCTATTGCTTA AGG 17/20 3 - 20:6584634-6584656 Intergenic CASC20
(56.2)BMP2 (183.0) 400K 300K
3 CTAGTCAAGGCTGTTTGTCA GGG 17/20 3 + 20:19275552-19275574 Intronic 92K 69K
4 CTTGTCAGGGCTGTTGGTCG AGG 17/20 3 - 5:137486079-137486101 Intronic 300K 98K
5 CTTGTCCAGGCTGCTGGGCA CGG 16/20 4 - 1:47708454-47708476 Intergenic FOXD2
(267.8)TRABD28
(51.9) 195K 185K
6 CTTGTCCAGGCTCCTGGGCA CGG 16/20 4 - 1:47708482-47708504 Intergenic FOXD2
(267.8)TRABD28
(51.9) 195K 185K
7 CTTGTCCAGGCTCCTGGGCA CGG 16/20 4 - 1:47708510-47708532 Intergenic FOXD2
(267.8)TRABD28
(51.9) 195K 185K
8 CTTGTCCAGGCTCCTGGGCA CGG 16/20 4 - 1:47708538-47708560 Intergenic FOXD2
(267.8)TRABD28
(51.9) 195K 185K
9 CTTGTCCAGGCTCCTGGGCA CGG 16/20 4 - 1:47708566-47708588 Intergenic FOXD2
(267.8)TRABD28
(51.9) 195K 185K
10 CTTGTCCAGGCTCCTGGGCA CGG 16/20 4 - 1:47708594-47708616 Intergenic FOXD2
(267.8)TRABD28
(51.9) 195K 185K
11 CTTGTCAAGGCTTTATGTAA GGG 16/20 4 + 1:173221950-173221972 Intergenic TNFSF4
(14.6)LOC100506023
(13.1) 360K 290K
12 CTAGTCAAGGCAATTAGGCA AGG 16/20 4 + 1:240226990-240227012 Intronic 22K 33K
13 TTTGTCTAGGATATTGCTCA GGG 16/20 4 + 10:22210628-22210650 Intergenic EBLN1
(0.65)LOC100130992
(41.4) 400K 460K
14 CTTGTGATGGCGATGGGTCA TGG 16/20 4 + 10:25181498-25181520 Intronic 380K 380K
15 CTGGGAAAGGCTATTGGTAA TGG 16/20 4 + 10:96412345-96412367 Intronic 230K 94K
Chromosome Position (hg38)
Type
Coverage
Target Target Sequence Identity Mis-matches Strand
GPR158
TLL2
Nearest Gene
PEAK1
SLC24A3
SPOCK1
FMN2
Nature Medicine: doi:10.1038/nm.4170


![BASIC ELECTRONICS for ARDUINO 03 [Λειτουργία συμβατότητας] · LED c b c e b SW: ΔΙΑΚΟΠΤΗΣ ... ΣΕ ΗΛΕΚΤΡΟΝΙΚΟ ΚΥΚΛΩΜΑ, ΜΑ ΜΕ](https://static.fdocument.org/doc/165x107/5c74306109d3f2ba1a8bc2bd/basic-electronics-for-arduino-03-.jpg)