Non-equilibrium Solidification of ´-TRIP Steel - Department of
86
Master thesis Non-equilibrium Solidification of δ-TRIP Steel Choi, Young-Joo (崔暎珠) Computational Metallurgy Graduate Institute of Ferrous Technology Pohang University of Science and Technology 2011
Transcript of Non-equilibrium Solidification of ´-TRIP Steel - Department of
Master thesis
Non-equilibrium Solidification
of δ-TRIP Steel
Choi, Young-Joo (崔暎珠)
Computational Metallurgy
Graduate Institute of Ferrous Technology
Pohang University of Science and Technology
2011
δ-TRIP강의 비평형 응고거동
Non-equilibrium Solidification
of δ-TRIP Steel

i
MFT Choi, Young-Joo 20100955 Non-equilibrium solidification of δ-TRIP steel
Computational Metallurgy 2011 Advisor: Prof. Suh, Dong-Woo
Text in English
Abstract
The solidification kinetics of TRIP-assisted steels with high-aluminum
contents is investigated, which is characterized by the unique microstructures
containing dendritic δ-ferrite. The as-cast specimens contain higher fractions of
dendritic δ-ferrite than what expected from the equilibrium phase fraction,
probably for kinetic reason. Numerical simulations using DICTRA software and
unidirectional solidification experiment were conducted in order to analyze the
kinetic effect. However, experimentally observed ferrite fractions were higher
than simulated values. Several possible factors for the discrepancy were
discussed. Based on the fact that the simulation showed little changes with the
cooling rate while experimentally measured ferrite fraction is increased under
higher cooling rates, the accuracy of diffusivity database or the cell size set for
the simulation probably is not the reason. Also, the modification in liquid
diffusivity has little influence on the phase evolution. It seems that γ phase
formed between the liquid and δ-phase grows more into the liquid phase due to
direct solidification, resulting in considerable amount of residual δ-ferrite. The
characteristic of aluminum partition, which makes liquid phase solute-depleted,
is attributed to the preferred growth of γ phase toward liquid.
ii
Nomenclature
α Ferrite α Martensite
αB Bainitic ferrite
Dimensionless coefficient for interdendritic back-diffusion
γ Austenite γ Retained austenite
Temperature separating the α + γ and γ phase fields for a specific alloy
As , but para-equilibrium boundary
Initial alloy composition
Concentration of liquid phase
Concentration of liquid phase at the solid/liquid interface
Concentration of solid phase
Concentration of solid phase at the solid/liquid
interface
Interface temperature gradient
Distribution coefficient
Martensite start temperature
Highest temperature to strain-induced martensite
Highest temperature to stress-induced martensite
iii
Temperature at which austenite and ferrite of the same composition have the same free energy
As , but accounting for the stored energy of ferrite
L Liquidus temperature
Actual temperature given by heat flux
S Solidus temperature
Rate of interface movement bcc Body-centered cubic fcc Face-centered cubic
iv
Contents
Abstract .................................................................................. i
Nomenclature ....................................................................... ii
Contents ............................................................................... iv
Ⅰ Introduction ..................................................................... 1
Ⅱ Numerical Simulation ................................................... 33
Ⅲ Experimental ................................................................. 39
3.1. Experimental procedures ..................................................... 39
3.2. Microscopy ............................................................................ 41
Ⅳ Discussion ....................................................................... 50
4.1. Solute movements ................................................................. 56
4.2. Partition characteristics ....................................................... 64
Ⅴ Conclusion .................................................................... 70
References ........................................................................... 72
Acknowledgement .............................................................. 77
Curriculum Vitae ............................................................... 78
1
1. Introduction
As environmental concerns and issues have grown, there are concerted moves
to regulate CO2 emission. Consequently, there are many attempts to reduce
exhaust fumes from cars, because they constitute major sources of CO2 emission.
Therefore it becomes important to lighten the car body and hence reduce fuel
consumption. By applying higher strength steel with considerable ductility and
toughness, it is possible to sustain automotive safety while maintaining a
minimum weight.
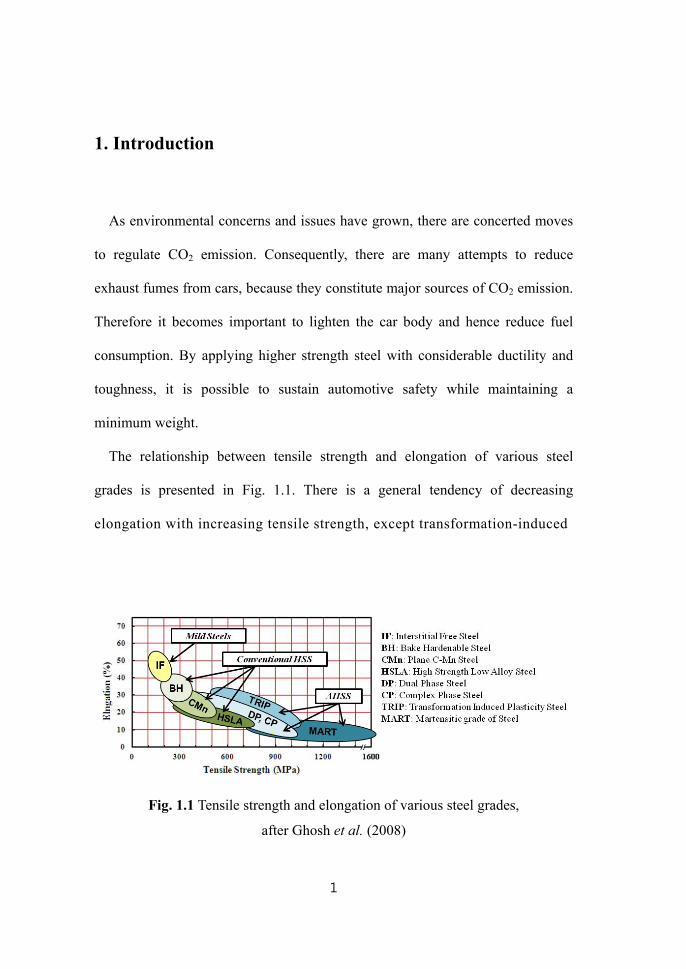
The relationship between tensile strength and elongation of various steel
grades is presented in Fig. 1.1. There is a general tendency of decreasing
elongation with increasing tensile strength, except transformation-induced
Fig. 1.1 Tensile strength and elongation of various steel grades,
after Ghosh et al. (2008)
2
plasticity (TRIP) steels which have comparatively balanced properties. These
promising properties are due partly to martensitic transformation from retained
austenite during deformation. Various types of TRIP steels have been designed
through modifying processing condition and alloying element, since it alters the
microstructure and the stability of each phase.
3
1.1 TRIP-assisted Steels
1.1.1 TRIP-assisted Steels
TRIP-assisted steels are multiphase high-strength steels which are
characterized by a large uniform elongation brought about by transformation
induced plasticity during deformation. The microstructure of TRIP-assisted steel
is comprised mainly of allotriomorphic ferrite, carbide-free bainitic ferrite and
carbon-enriched retained austenite (Yi et al., 2010).
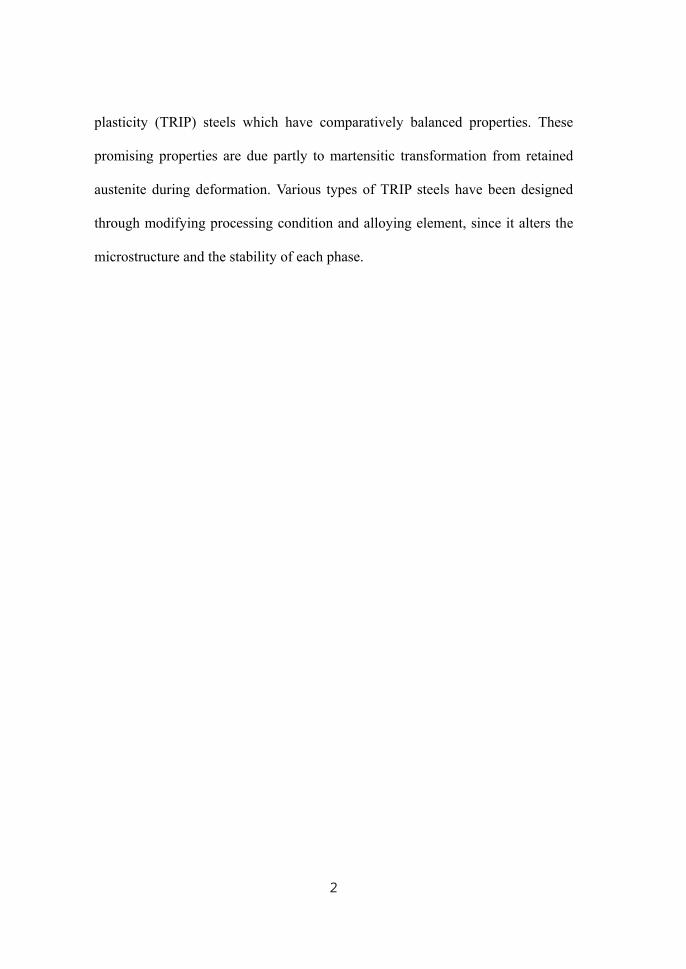
The microstructure can be developed from cold rolled ferrite and pearlite,
Fig. 1.2 Thermal cycle to obtain the TRIP steel microstructure
(De Cooman et al., 2007)

4
Fig. 1.3 Illustration of bainite reaction mechanism (Bhadeshia, 2001)
through intercritical annealing followed by austempering (De Cooman et al.,
2007). This process is shown in Fig. 1.2 and the intercritical annealing
temperature determines the volume fraction of equiaxed ferrite in TRIP steel.
During isothermal bainitic transformation, bainitic ferrite and carbon enriched
retained austenite are formed and this process determines the volume fraction and
carbon content of the retained austenite. Alternatively, hot rolled TRIP steels can
be produced by control of cooling and coiling practices, which lead to ferrite
formation followed by isothermal transformation into bainitic ferrite. The latter
5
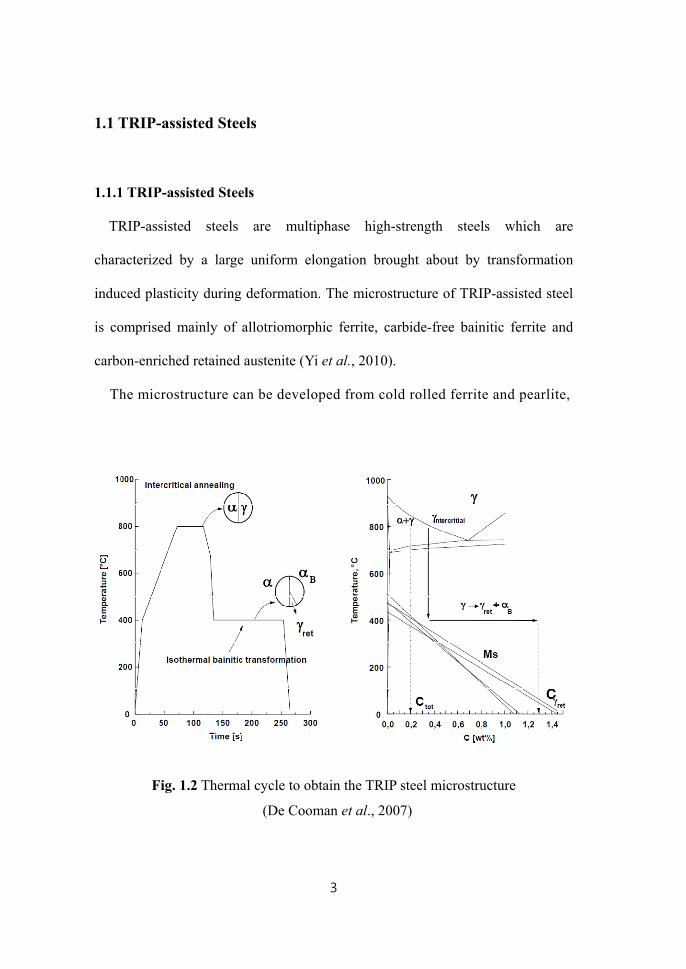
Fig. 1.4 Incomplete reaction phenomenon (Bhadeshia, 2001)
occurs at the coiling temperature and carbon-enriched retained austenite islands
are left untransformed at ambient temperature. In both of these processes, the
material is placed initially in the (α + γ) phase region generating a mixture of
ferrite and austenite (intercritical annealing), which subsequently decomposes to
bainite at a lower temperature (isothermal transformation).
The retention of austenite in TRIP-assisted steels is related closely to the
movement of carbon during the bainite transformation. Bainitic ferrite forms
firstly without diffusion but any excess carbon is soon afterwards rejected into
the residual austenite (Fig. 1.3). The generation of the next plate of bainite, which
has to grow from carbon-enriched austenite, must cease when the austenite
carbon concentration reaches the curve as shown in Fig. 1.4. This is said to
6
be “incomplete-reaction phenomenon”, since the austenite has not achieved its
equilibrium composition at the point where the reaction stops (Bhadeshia and
Honeycombe, 2006). The role of some elements which retard cementite
precipitation is thus important since it bring about carbon enrichment of the
residual austenite and, therefore, retention of austenite at room temperature. This
was confirmed experimentally by isothermal bainitic transformation in a ~1.5 wt%
silicon containing steel (Jacques et al., 1999).
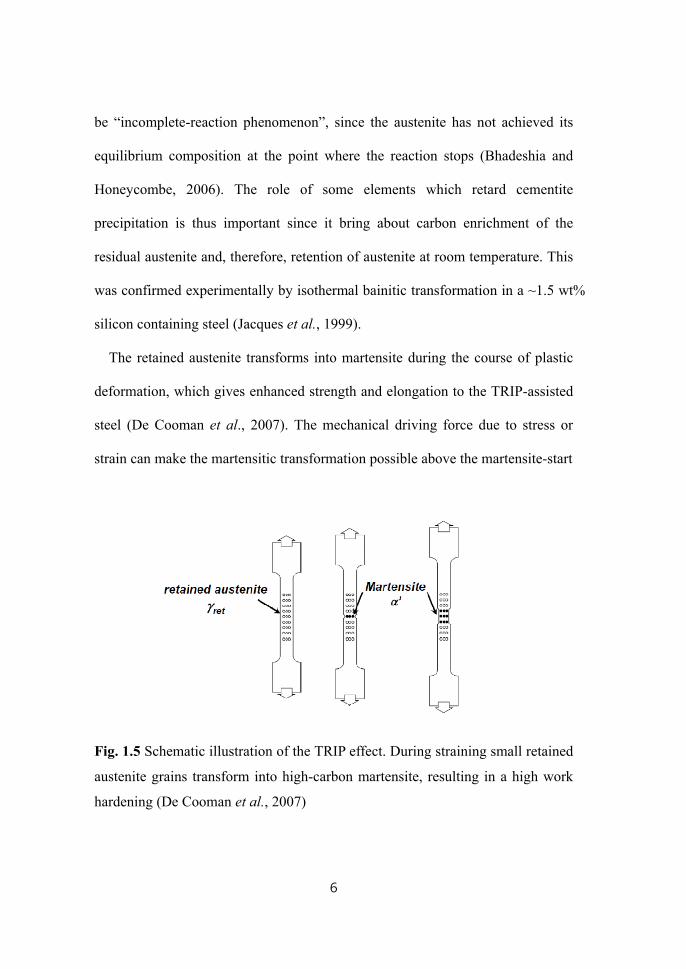
The retained austenite transforms into martensite during the course of plastic
deformation, which gives enhanced strength and elongation to the TRIP-assisted
steel (De Cooman et al., 2007). The mechanical driving force due to stress or
strain can make the martensitic transformation possible above the martensite-start
Fig. 1.5 Schematic illustration of the TRIP effect. During straining small retained
austenite grains transform into high-carbon martensite, resulting in a high work
hardening (De Cooman et al., 2007)
7
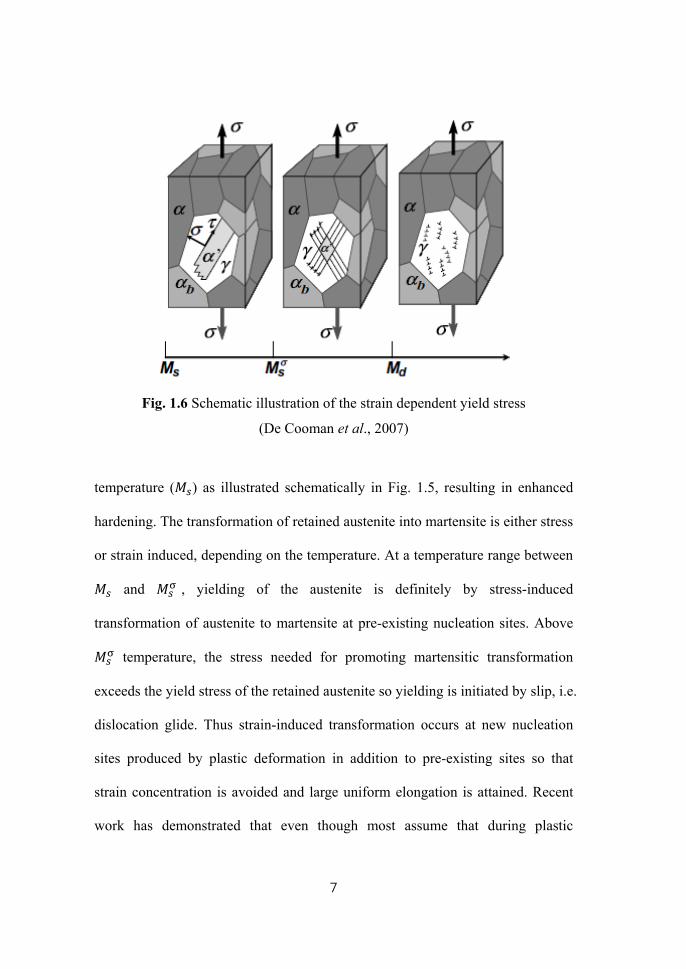
Fig. 1.6 Schematic illustration of the strain dependent yield stress
(De Cooman et al., 2007)
temperature ( ) as illustrated schematically in Fig. 1.5, resulting in enhanced
hardening. The transformation of retained austenite into martensite is either stress
or strain induced, depending on the temperature. At a temperature range between
and , yielding of the austenite is definitely by stress-induced
transformation of austenite to martensite at pre-existing nucleation sites. Above
temperature, the stress needed for promoting martensitic transformation
exceeds the yield stress of the retained austenite so yielding is initiated by slip, i.e.
dislocation glide. Thus strain-induced transformation occurs at new nucleation
sites produced by plastic deformation in addition to pre-existing sites so that
strain concentration is avoided and large uniform elongation is attained. Recent
work has demonstrated that even though most assume that during plastic
8
deformation the γ → α’ reaction is strain induced, the evidence suggests that the
major role is played by the stress that is applied in order to achieve the plastic
strain. To optimize the effect of transformation-induced plasticity, the retained
austenite stability is important since the beneficial effect will be reduced if the
retained austenite transforms at low strains or it is very resistant to strain. The
stability of retained austenite is determined by the carbon content, the size of
austenite islands, the stress state and the strength of the retained austenite (Samek
et al., 2006).
1.1.2. Alloying elements in TRIP-assisted steel
Alloying elements are added to TRIP-assisted steels for the following reasons:
- to optimize the fraction of retained austenite,
- to control cementite precipitation,
- to increase the hardness of ferrite and
- to increase the hardenability so that pearlite formation can be avoided.
The role of carbon is critical since it can diffuse quickly and enrich the
austenite. It increases the stability of austenite which can as a result be retained to
below ambient temperature. The stress or strain level at which retained austenite
begins to transform to martensite can be controlled by adjusting the carbon
content (Yi, 2010). Carbon also has a significant effect on the amount of austenite
that is retained and affects its morphology (Chen et al., 2002).
The stabilizing effect of carbon is available only if carbon is not consumed by

9
the formation of cementite, hence it is important to control the precipitation of
cementite. One of the alloying elements involved in cementite formation kinetics
is silicon. It is found that the cementite precipitation in austenite is remarkably
retarded when a small concentration of silicon is added, which can be explained
by the fact that the cementite traps the silicon as it grows when it forms under
paraequilibrium conditions. As a consequence, the free energy change of the
reaction is reduced so that the kinetics of precipitation slows down (Kozeschnik
and Bhadeshia, 2008). However, a high silicon content is detrimental to the
galvanizability of steel strips since it segregates to the surface and obstructs the
formation of an inhibition layer (Mahieu et al., 2001).
Aluminum additions also retard the rate of cementite precipitation since like
silicon, it has negligible solubility in cementite (Leslie and Rauch, 1978). There
have been several attempts to substitute silicon with aluminum since aluminum
does not segregate as a solute hence is not expected to influence the coatability
adversely (MEYER et al., 1999, MAHIEU et al., 2002). These authors found out
that aluminum substituted C – Mn – Si TRIP alloys showed good mechanical
properties, although high contents of aluminum (~1.7 wt%) is needed to suppress
effectively the pearlite formation.
Niobium is known to improve elongation and strength (HASHIMOTO et al.,
2004), when added about 0.05 wt%. Also, the multiple addition of 0.2 wt%
molybdenum with 0.05 wt% niobium results in higher tensile strength by the
large amount of fine NbMoC precipitates.

10
1.1.3. δ-TRIP steel
A combination of neural networks and genetic algorithms has been used to
design a TRIP assisted steel which has an optimum quantity of retained austenite
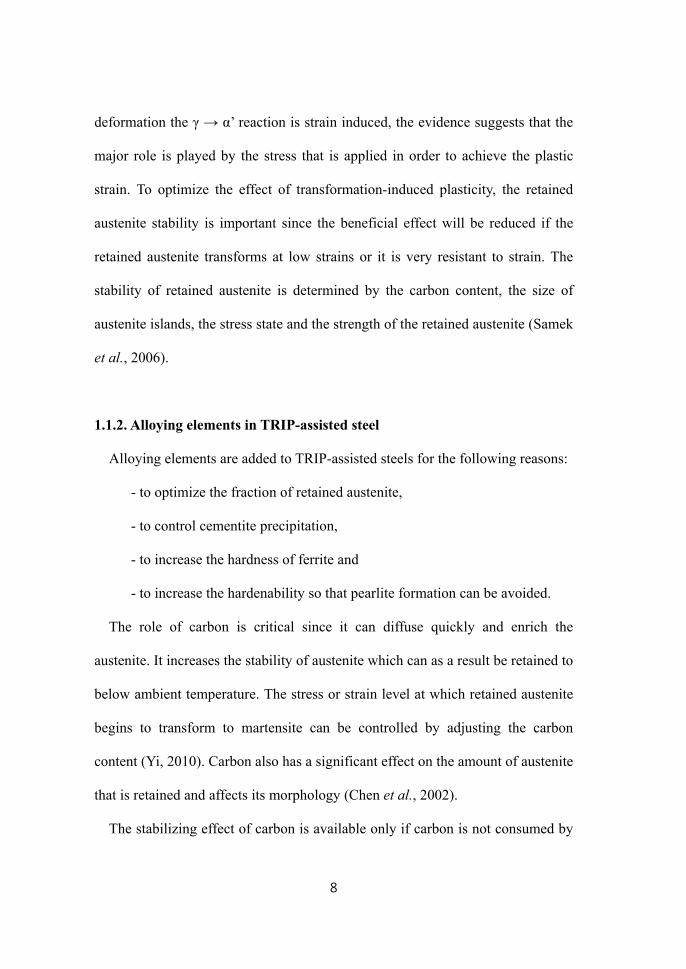
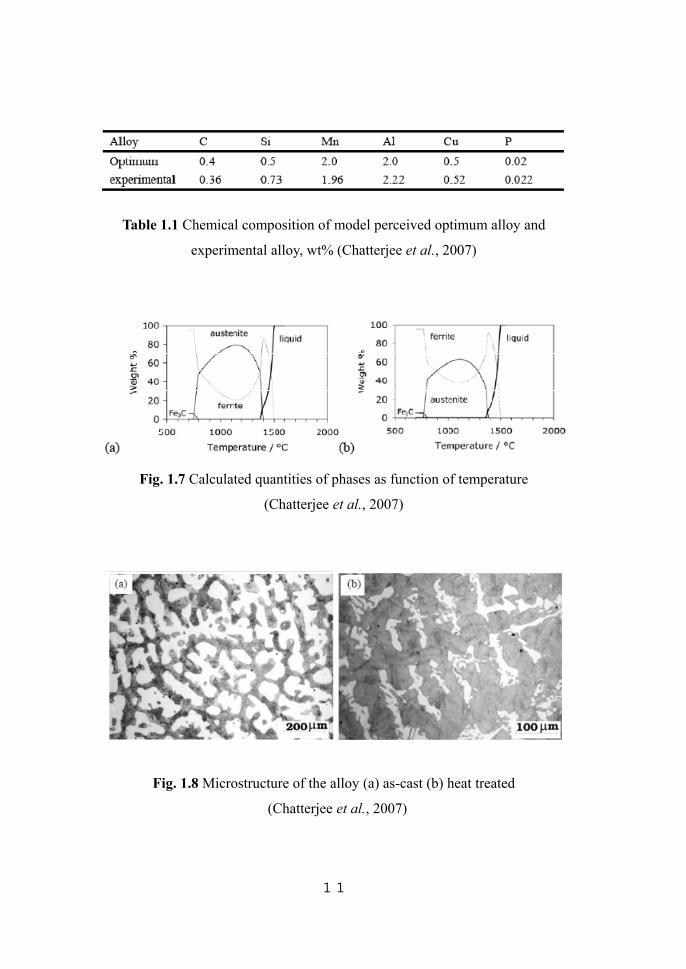
and yet minimum silicon concentration (Chatterjee et al., 2007). The composition
of steel was optimized as shown in Table 1.1 and then manufactured in an as-cast
condition. The fractions of the equilibrium phases of the alloy were calculated
using MT-DATA with the SGTE database, which is shown in Fig. 1.7. The
diagram shows that a fully austenitic state cannot be achieved at any temperature,
so that dendritic δ-ferrite would persist in the cast alloy. Fig. 1.8a shows the
novel microstructure consisting of δ-ferrite dendrites and a residual phase which
at high temperatures is austenite. The austenite evolves into a mixture of bainitic
ferrite and carbon enriched retained austenite with appropriate heat treatment, as
shown in Fig. 1.8b. In the microstructure, the stable dendritic δ-ferrites replace
the allotriomorphic ferrites found in conventional TRIP assisted alloys. It is
therefore designated as δ-TRIP steel (Chatterjee et al., 2007). The properties of
heat treated specimens exhibited a 23% total elongation and an ultimate tensile
strength of 1000 MPa.
11
Table 1.1 Chemical composition of model perceived optimum alloy and
experimental alloy, wt% (Chatterjee et al., 2007)
Fig. 1.7 Calculated quantities of phases as function of temperature
(Chatterjee et al., 2007)
Fig. 1.8 Microstructure of the alloy (a) as-cast (b) heat treated
(Chatterjee et al., 2007)

12
1.2 Solidification Kinetics
1.2.1. Solidification Microstructure
There is a variety of solidification microstructures according to the
solidification conditions and the material of interest. Almost all of the
solidification microstructures can be divided into single-phase primary crystals
and polyphase structures which evolve subsequently. The morphology of single-
phase primary crystals changes with the growth direction, temperature gradient
and growth rate. In case of polyphase structure which is also called eutectic
morphology, two or more phases grow simultaneously from the liquid. The
following discussion will be focused on the morphology and the scale of single-
phase structure since it is more related to the subject.
In a pure substance, interface instability is determined by the heat flow
direction and solid growth directions as illustrated in Fig. 1.9 (Kurz and Fisher,
1986). If the solid phase grows inward from the mold wall, the heat flow occurs
in the opposite direction of that of the solid growth, forming positive temperature
gradient. When a perturbation forms at an interface under this condition, the
temperature gradient in the liquid increases while that in the solid decreases. As a
result, more heat flows into protruding part of the perturbation and thus the
perturbation melts back, making planar interface stabilized. On the other hand, if
the free crystals grow radially into an undercooled melt, there forms negative
temperature gradient in the liquid, thus heat flow occurs in the same direction as
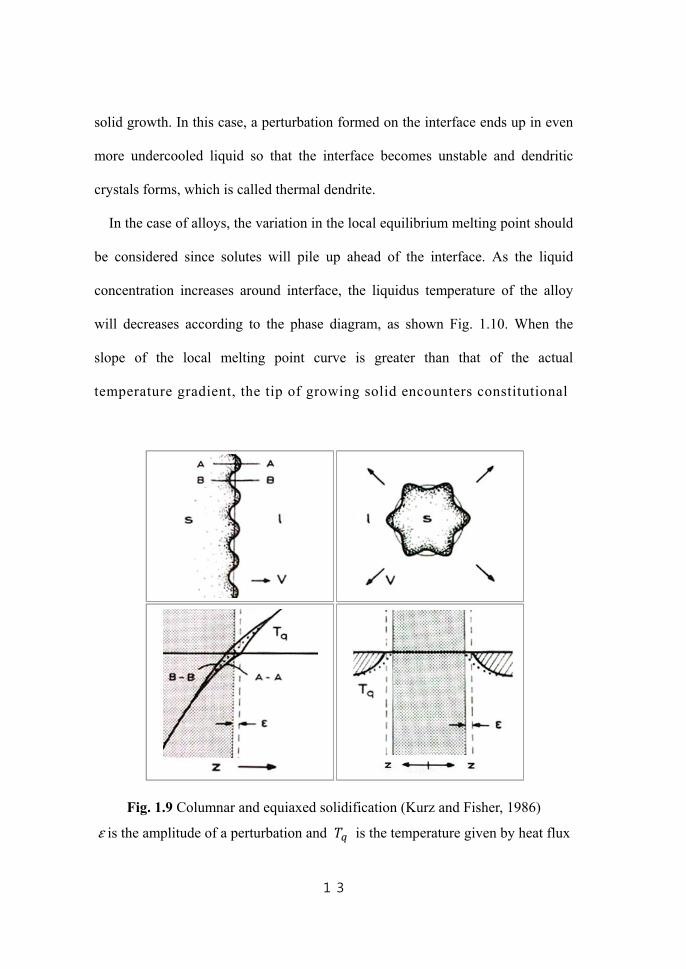
13
solid growth. In this case, a perturbation formed on the interface ends up in even
more undercooled liquid so that the interface becomes unstable and dendritic
crystals forms, which is called thermal dendrite.
In the case of alloys, the variation in the local equilibrium melting point should
be considered since solutes will pile up ahead of the interface. As the liquid
concentration increases around interface, the liquidus temperature of the alloy
will decreases according to the phase diagram, as shown Fig. 1.10. When the
slope of the local melting point curve is greater than that of the actual
temperature gradient, the tip of growing solid encounters constitutional
Fig. 1.9 Columnar and equiaxed solidification (Kurz and Fisher, 1986)
ε is the amplitude of a perturbation and is the temperature given by heat flux

14
undercooling. As a result, the interface becomes unstable and perturbations grow
up. This leads to the development of cellular structure as shown Fig. 1.11a during
directional growth of alloy. The initial cellular structures are adjusted to a more
optimum spacing according to the dissipation of piled-up solutes and heat flow.
Furthermore, the larger cells which have a slightly perturbed surface may cause
intercellular instability which might possibly lead to dendrite formation. The
dendrite growth direction is closely related to the crystal orientations due to the
anisotropy of solid/liquid interface energy and growth kinetics while the cells are
grown parallel to the heat flow direction. In the case of cubic crystals, [001] is
Fig. 1.10 Constitutional undercooling in alloys (Kurz and Fisher, 1986)
15
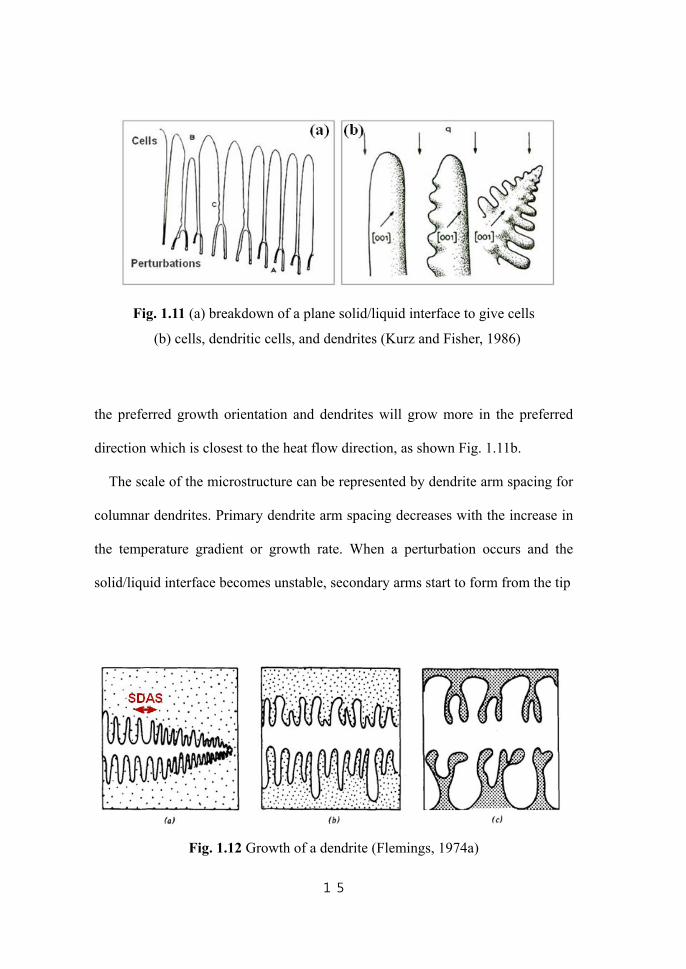
Fig. 1.11 (a) breakdown of a plane solid/liquid interface to give cells
(b) cells, dendritic cells, and dendrites (Kurz and Fisher, 1986)
the preferred growth orientation and dendrites will grow more in the preferred
direction which is closest to the heat flow direction, as shown Fig. 1.11b.
The scale of the microstructure can be represented by dendrite arm spacing for
columnar dendrites. Primary dendrite arm spacing decreases with the increase in
the temperature gradient or growth rate. When a perturbation occurs and the
solid/liquid interface becomes unstable, secondary arms start to form from the tip
Fig. 1.12 Growth of a dendrite (Flemings, 1974a)
16
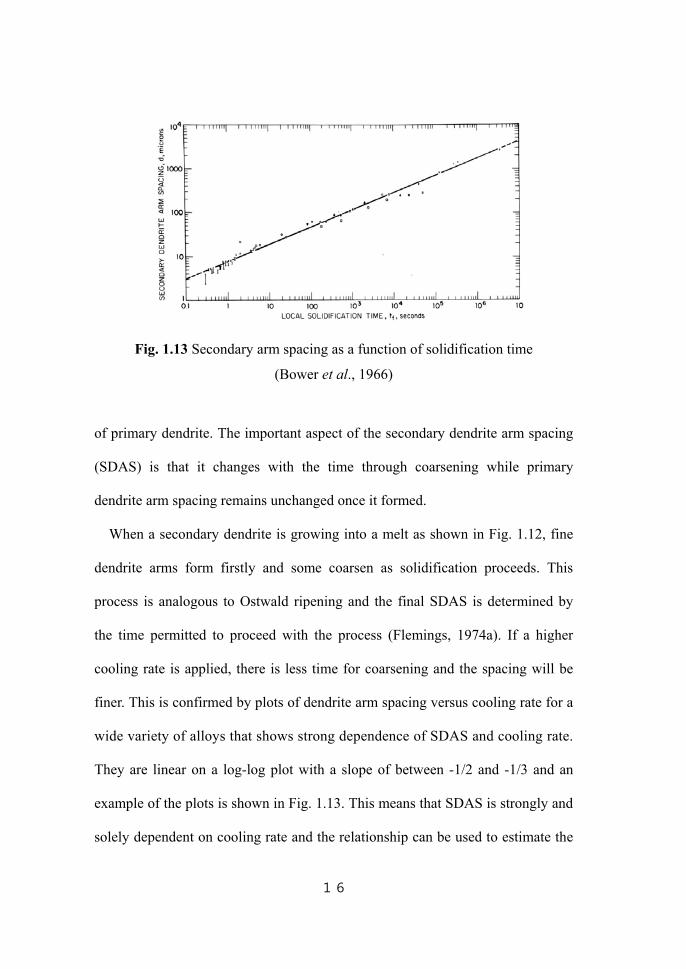
Fig. 1.13 Secondary arm spacing as a function of solidification time
(Bower et al., 1966)
of primary dendrite. The important aspect of the secondary dendrite arm spacing
(SDAS) is that it changes with the time through coarsening while primary
dendrite arm spacing remains unchanged once it formed.
When a secondary dendrite is growing into a melt as shown in Fig. 1.12, fine
dendrite arms form firstly and some coarsen as solidification proceeds. This
process is analogous to Ostwald ripening and the final SDAS is determined by
the time permitted to proceed with the process (Flemings, 1974a). If a higher
cooling rate is applied, there is less time for coarsening and the spacing will be
finer. This is confirmed by plots of dendrite arm spacing versus cooling rate for a
wide variety of alloys that shows strong dependence of SDAS and cooling rate.
They are linear on a log-log plot with a slope of between -1/2 and -1/3 and an
example of the plots is shown in Fig. 1.13. This means that SDAS is strongly and
solely dependent on cooling rate and the relationship can be used to estimate the
17
cooling rate during solidification (Flemings, 1974a).
In summary, the two major variables that determine solidification
microstructure under given composition are temperature gradient, , and growth
rate, . The scale of microstructure depends on · , which is equivalent to the
cooling rate under unidirectional heat flow. On the other hand, the morphology is
determined by / , from planar, to cellular, to dendritic growth (Kurz and
Fisher, 1986).
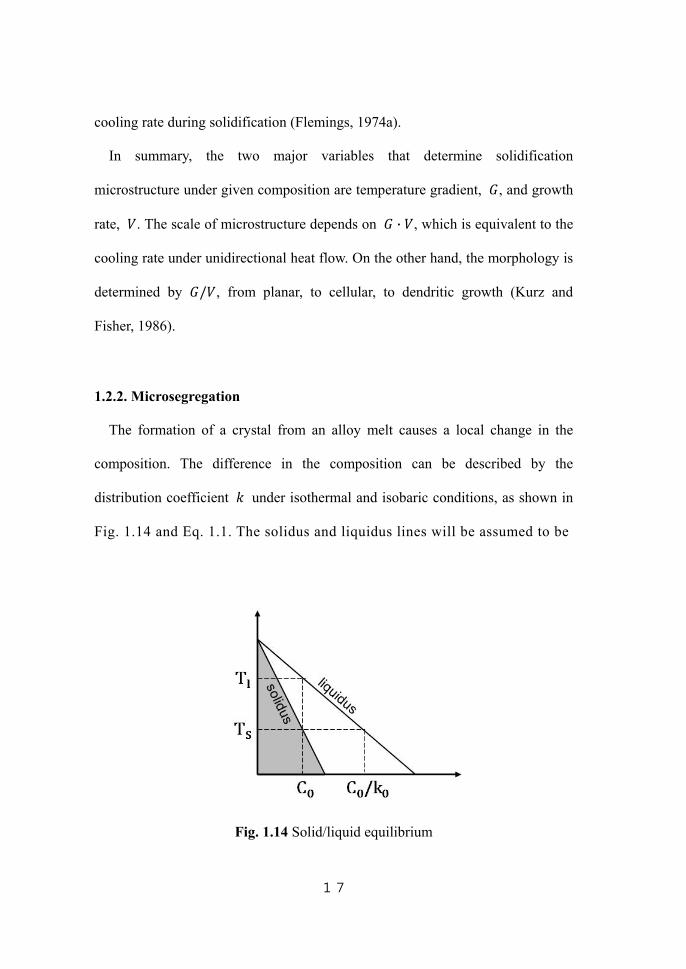
1.2.2. Microsegregation
The formation of a crystal from an alloy melt causes a local change in the
composition. The difference in the composition can be described by the
distribution coefficient under isothermal and isobaric conditions, as shown in
Fig. 1.14 and Eq. 1.1. The solidus and liquidus lines will be assumed to be
Fig. 1.14 Solid/liquid equilibrium
18
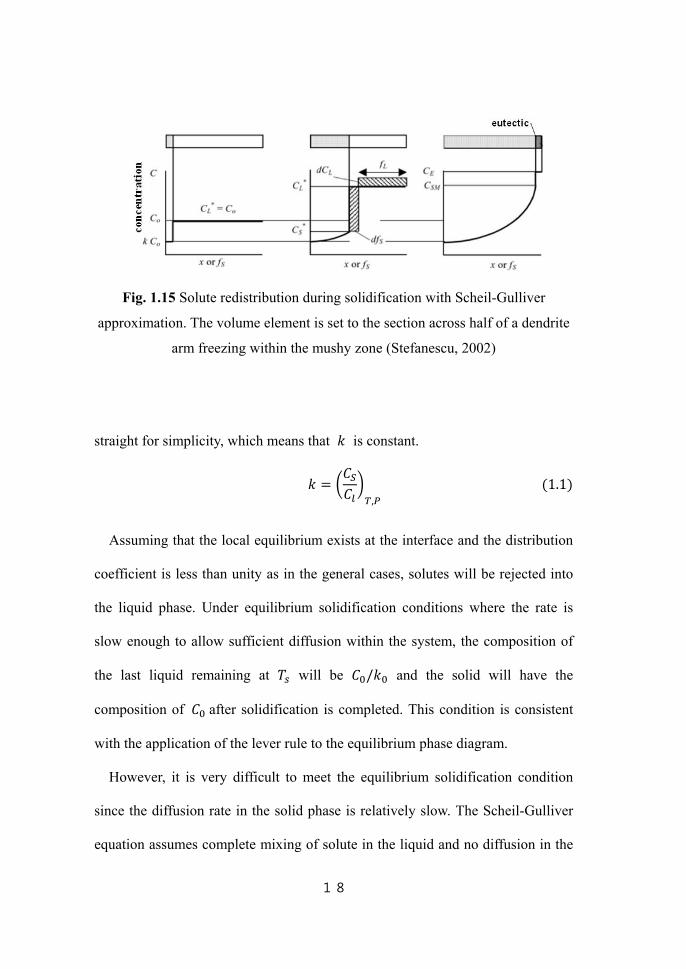
Fig. 1.15 Solute redistribution during solidification with Scheil-Gulliver
approximation. The volume element is set to the section across half of a dendrite
arm freezing within the mushy zone (Stefanescu, 2002)
straight for simplicity, which means that is constant.
, 1.1
Assuming that the local equilibrium exists at the interface and the distribution
coefficient is less than unity as in the general cases, solutes will be rejected into
the liquid phase. Under equilibrium solidification conditions where the rate is
slow enough to allow sufficient diffusion within the system, the composition of
the last liquid remaining at will be / and the solid will have the
composition of after solidification is completed. This condition is consistent
with the application of the lever rule to the equilibrium phase diagram.
However, it is very difficult to meet the equilibrium solidification condition
since the diffusion rate in the solid phase is relatively slow. The Scheil-Gulliver
equation assumes complete mixing of solute in the liquid and no diffusion in the
19
solid phase. Since solute is rejected from the growing solid into the remaining
liquid as shown in Eq. 1.2, the composition of the growing solid gradually
increases as solidification proceeds and it results in a high level of segregation at
the end of the process. The composition of each phase is given in Eq. 1.3, which
can be obtained by integrating Eq. 1.2 (Kurz and Fisher, 1986).
d 1 d 1.2
at 0
1
1.3
where is the composition in the liquid, in the solid, in the
solid at the interface and is solid fraction. The solute redistribution is
illustrated in Fig. 1.15 where is liquid fraction and is the eutectic
composition.
In the absence of complicating factors, the solute distribution is expected to lie
between the above two extremes, depending on the amount of solid state
diffusion. Brody and Flemings (1966) have presented an analysis which
quantifies the effect of solid state diffusion as illustrated in Fig. 1.16. During a
small increment of solidification of an alloy of mean composition , solute
rejected at interface diffuses into solid and liquid (Eq. 1.4),

20
Fig. 1.16 Solute redistribution during incremental freezing in a volume element
of length , considering the back-diffusion of solutes
(Clyne and Kurz, 1981)
d 1 d12
d 1.4
where the back-diffusion solute boundary layer is given by
2
1.5
in which is the solute diffusivity in the solid and is the local interface
advance velocity. With the hypothesis of a parabolic decrease in with
increasing time, the integration of the Eq. 1.4 leads to:
1 1 2 / 1.6
21
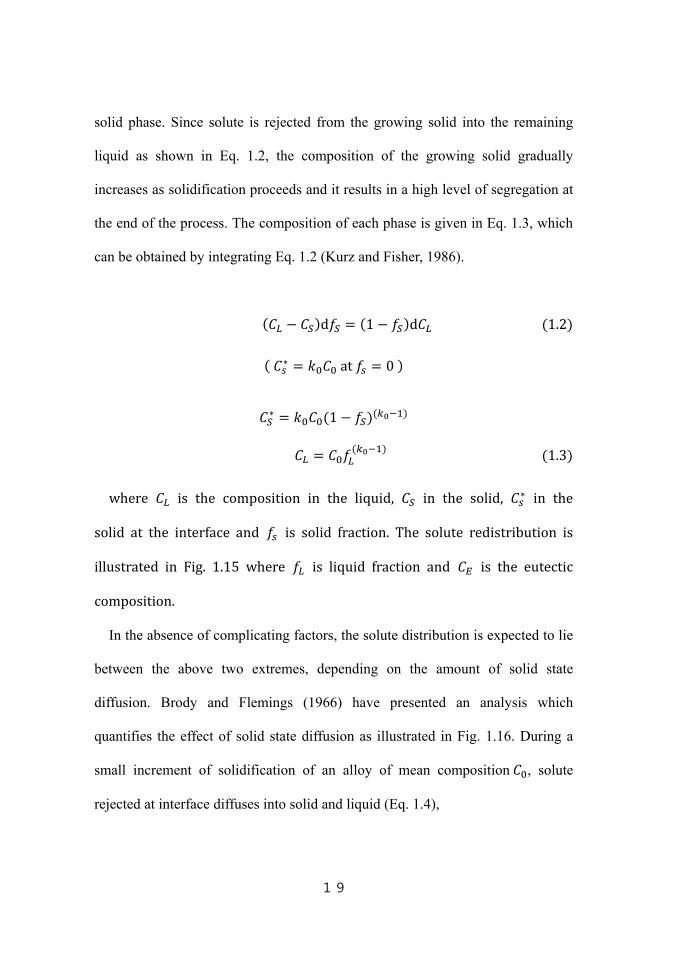
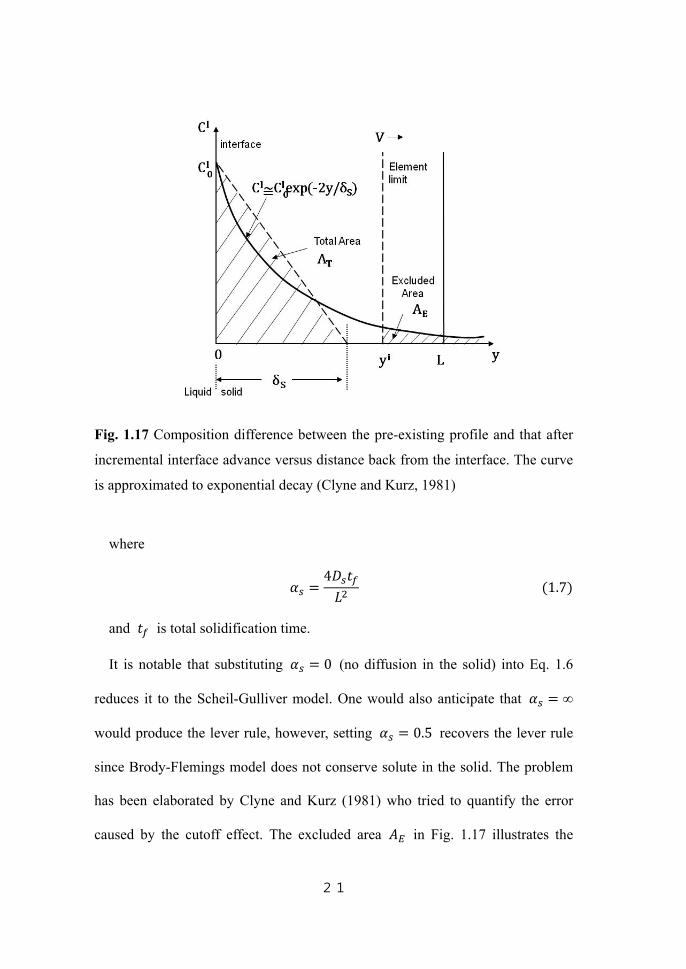
Fig. 1.17 Composition difference between the pre-existing profile and that after
incremental interface advance versus distance back from the interface. The curve
is approximated to exponential decay (Clyne and Kurz, 1981)
where
4 1.7
and is total solidification time.
It is notable that substituting 0 (no diffusion in the solid) into Eq. 1.6
reduces it to the Scheil-Gulliver model. One would also anticipate that ∞
would produce the lever rule, however, setting 0.5 recovers the lever rule
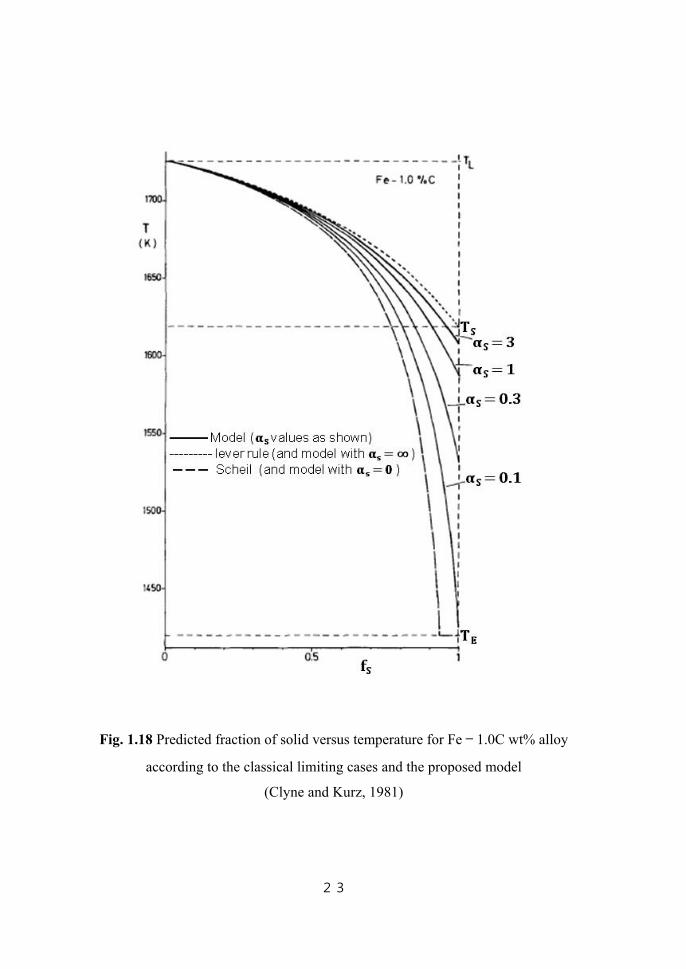
since Brody-Flemings model does not conserve solute in the solid. The problem
has been elaborated by Clyne and Kurz (1981) who tried to quantify the error
caused by the cutoff effect. The excluded area in Fig. 1.17 illustrates the
22
fraction of back diffusion solute cut off by the physical limits of the volume
element during local solidification period. They introduced the parameter
including the effect of solute cut off, which is close to the lever rule in the limit
as ∞. The fraction of solid predicted by Clyne-Kurz model is presented in
Fig. 1.18.
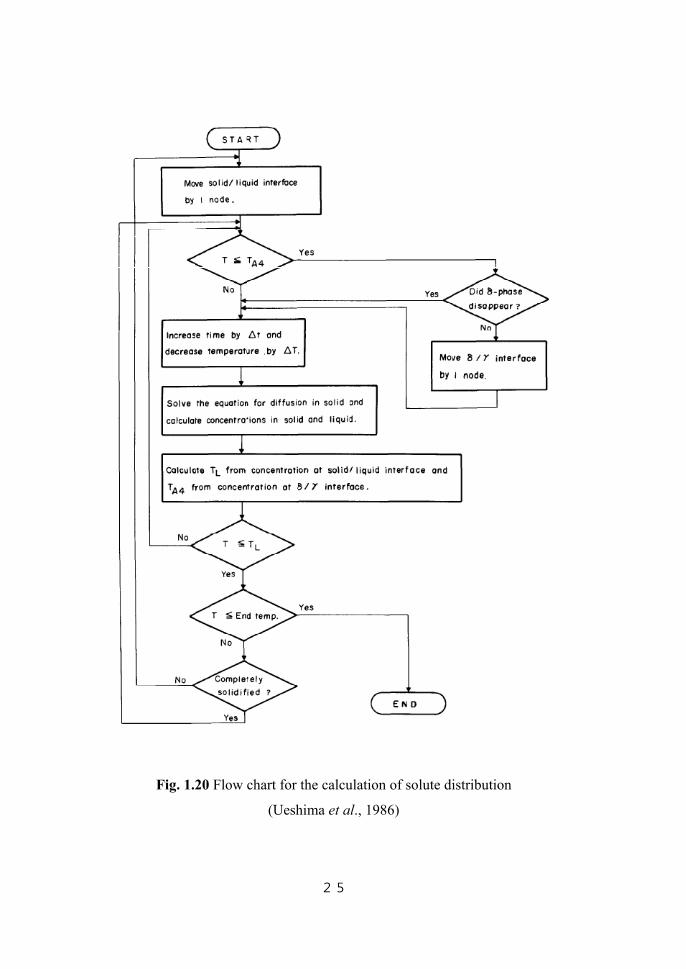
For the segregation behavior of multi-component alloys, many works have
been done using numerical method (Ueshima et al., 1986, Natsume et al., 2010,
Das et al., 1999). Although there are many different assumptions and different
geometries of volume element, the calculation is basically made by dividing the
volume element into small parts, each of which is called a node (Fig.1.19). Then
the rate of diffusion into each phase is calculated as time passes and
temperature decreases. One of the flow charts for the calculation of solute
distribution is presented in Fig. 1.20.
23
Fig. 1.18 Predicted fraction of solid versus temperature for Fe – 1.0C wt% alloy
according to the classical limiting cases and the proposed model
(Clyne and Kurz, 1981)

24
Fig. 1.19 Schematic drawing showing the longitudinal and transverse cross
sections of dendrites (left), a part of transverse cross section of dendrite (right)
(Ueshima et al., 1986)
25
Fig. 1.20 Flow chart for the calculation of solute distribution
(Ueshima et al., 1986)

26
1.2.3. Peritectic Solidification
In the peritectic transformation, liquid and solid phase react to form another
solid. Since the transformation involves reactions among three phases and terms
have been used inconsistently, it is pertinent to clarify each reaction. According
to Kerr et al. (1974), the peritectic phase transition consists of two separate
stages: the peritectic reaction followed by the peritectic transformation. The
peritectic reaction occurs when the liquid, δ-ferrite and austenite phases are in
Fig. 1.21 Definition of quantities through Eq. 1.8 to 1.10 (Stefanescu, 2002)
27
contact and the liquid and δ-ferrite react to form austenite. This reaction is rapid,
leading to the formation of a thin film of austenite along the liquid/δ-ferrite
interface which separates the liquid and δ-ferrite. Once primary δ-ferrite is
covered, peritectic transformation takes place by solid-state diffusion through the
austenite phase. The austenite phase can also be formed by direct precipitation
from the liquid, which does not depend on the presence of the primary phase (Ha
and Hunt, 2000). In general, the amount of austenite formed is assumed to
depend mainly on the peritectic transformation and direct solidification. This is
because even though the peritectic reaction is rapid, the amount of austenite
formed is a small fraction of the total.
The thickness of the peritectic layer increases with subsequent cooling by
diffusion through the γ layer, precipitation of γ directly from the liquid and δ
phase. Assuming isothermal transformation, the rate of peritectic transformation
is controlled by the diffusion rate through the layer at a temperature just below
peritectic temperature. The mass balance at the interface can be written as:
d
d· Δ 1.8
Then, for the δ/γ interface and the γ/L interface we have, respectively:
∂
∂
d
d
and L
LL L 1.9
where is the diffusion coefficient in the γ phase. All other terms are
28
defined in Fig. 1.22. Assuming that the concentration gradient through γ layer is
constant, it can be expressed as:
∂
∂
L
L
L
Δ
Substituting in the above two equation and adding the equations leads to:
d Δd
L
Δ L L
L
Δ Δ L
where L and LL
L L
Integrating:
Δ 2 L 1.10
This equation shows that the growth rate increase with the difference between
and which depends on the undercooling. Also, the growth rate is
affected by diffusivity. For interstitially dissolved elements, the diffusion rates
are high and in-situ observation in Fe-C systems demonstrated that the growth of
the thickness of the γ phase follows a parabolic law which supports the opinion
that the rate controlling phenomenon is carbon diffusion (Shibata et al., 2000).
On the other hand, the diffusion coefficient near the melting point is of the
order of 10-13 m2 s-1 for substitutional alloying elements in face-centered cubic
metals. In such a case, the growth rate will be very slow and it requires quite long

29
time for peritectic transformation to proceed. In a normal casting process, the
reaction rate will be so low that the amount of γ phase by the peritectic
transformation will be negligible in comparison with the direct solidification of γ
from the liquid.
Arai et al. (2005) observed peritectic solidification of Fe – Ni alloy with
confocal scanning laser microscope (CSLM). The rate of the thickening of γ
phase toward liquid is faster than toward δ phase and the author presumed that it
is due to the slower diffusion of nickel in δ phase and the direct solidification of γ
phase. The rate of direct solidification depends on the thermal field under which
the solidification is being carried out, which means heat transfer controls the final
stage of the peritectic solidification (McDonald and Sridhar, 2005, McDonald
and Sridhar, 2003). In some cases, the microsegregation changes the
solidification mode. The significant microsegregation of manganese in a hypo-
peritectic steel promoted a change in the solidification mode, from a hypo-
peritectic mode into a hyper-peritectic mode (Mondragón et al., 2008).
30
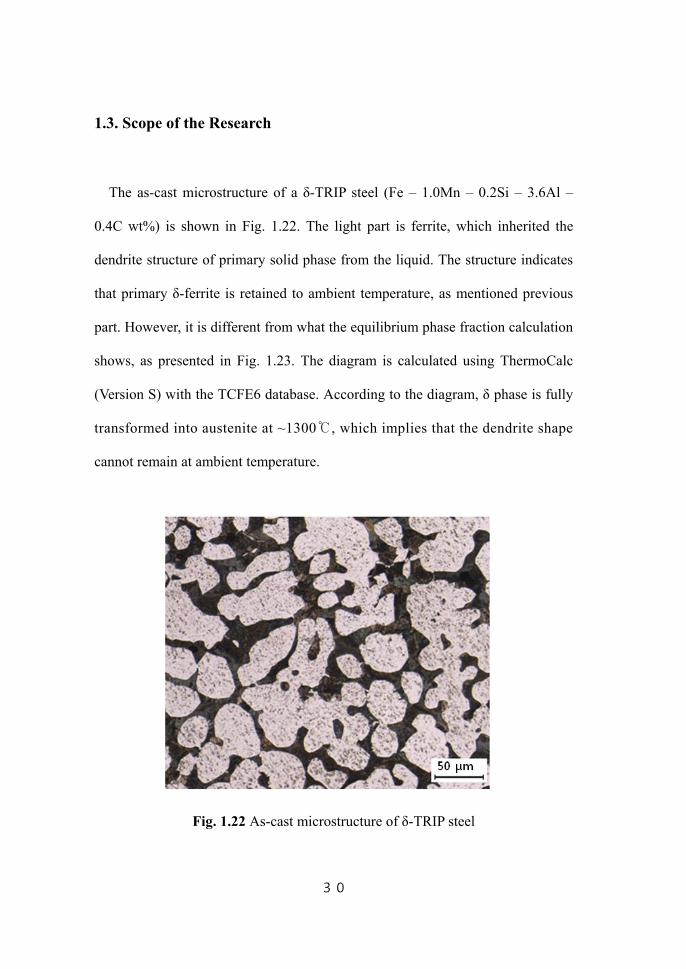
1.3. Scope of the Research
The as-cast microstructure of a δ-TRIP steel (Fe – 1.0Mn – 0.2Si – 3.6Al –
0.4C wt%) is shown in Fig. 1.22. The light part is ferrite, which inherited the
dendrite structure of primary solid phase from the liquid. The structure indicates
that primary δ-ferrite is retained to ambient temperature, as mentioned previous
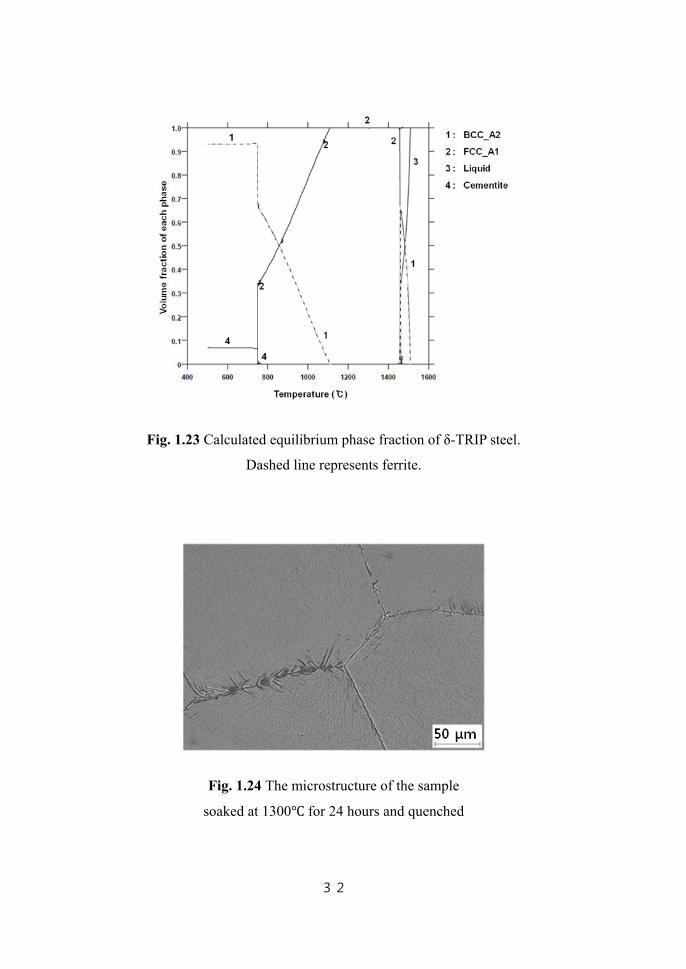
part. However, it is different from what the equilibrium phase fraction calculation
shows, as presented in Fig. 1.23. The diagram is calculated using ThermoCalc
(Version S) with the TCFE6 database. According to the diagram, δ phase is fully
transformed into austenite at ~1300℃, which implies that the dendrite shape
cannot remain at ambient temperature.
Fig. 1.22 As-cast microstructure of δ-TRIP steel

31
To confirm the validity of the calculation, a specimen of the same alloy was
soaked at 1300 for 24 h and quenched to observe the microstructure (Fig.
1.24). The soaking time is determined based on the diffusion distance of
manganese and aluminum in fcc phase of the alloy at 1300 ºC for 24 h, using Eq.
1.11. The diffusivity of aluminum and manganese in fcc phase of the alloy at the
temperature is around 4 10-13 m2 s-2 and 7 10-14 m2 s-2, respectively. The
diffusion distance for each calculated is 186 μm and 78 μm, which is greater than
the secondary dendrite arm spacing measured from as-cast specimen. Thus it is
considered sufficient to remove the microsegregation during solidification.
√ 1.11
where is length in m, is the diffusivity in m2 s-1 and t is time in s.
The microstructure is fully martensitic which was austenite at high
temperatures. This suggests that δ phase is possibly retained for kinetic reasons
and the amount of residual δ phase could be varied according to the cooling
condition. However, little has been studied about the kinetic effect although δ
phase has great influence on the stability of austenite and heat affected zone
during welding. This study, thus, will investigate the retention behavior
depending on composition and cooling condition.
32
Fig. 1.23 Calculated equilibrium phase fraction of δ-TRIP steel.
Dashed line represents ferrite.
Fig. 1.24 The microstructure of the sample
soaked at 1300 for 24 hours and quenched
33
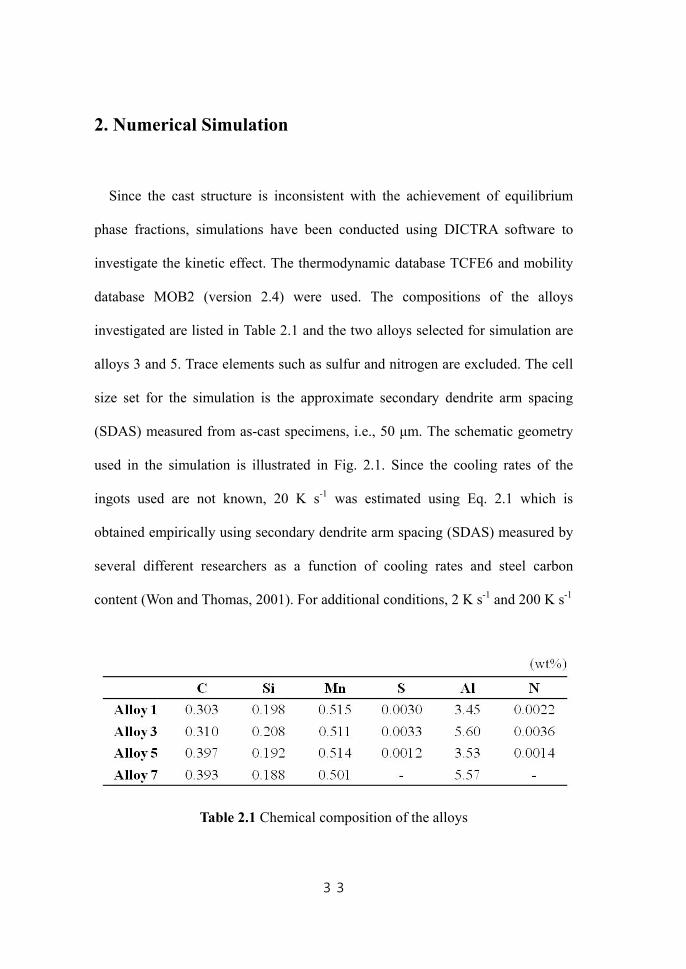
2. Numerical Simulation
Since the cast structure is inconsistent with the achievement of equilibrium
phase fractions, simulations have been conducted using DICTRA software to
investigate the kinetic effect. The thermodynamic database TCFE6 and mobility
database MOB2 (version 2.4) were used. The compositions of the alloys
investigated are listed in Table 2.1 and the two alloys selected for simulation are
alloys 3 and 5. Trace elements such as sulfur and nitrogen are excluded. The cell
size set for the simulation is the approximate secondary dendrite arm spacing
(SDAS) measured from as-cast specimens, i.e., 50 μm. The schematic geometry
used in the simulation is illustrated in Fig. 2.1. Since the cooling rates of the
ingots used are not known, 20 K s-1 was estimated using Eq. 2.1 which is
obtained empirically using secondary dendrite arm spacing (SDAS) measured by
several different researchers as a function of cooling rates and steel carbon
content (Won and Thomas, 2001). For additional conditions, 2 K s-1 and 200 K s-1
Table 2.1 Chemical composition of the alloys

34
Fig. 2.1 Schematic geometry used in the kinetic simulation.
L0: cell size for kinetic simulation, i.e. size of the unit segregation zone
are selected, expecting more δ phase under higher cooling rate.
SDAS µm 169.1 720.9 · · .
for 0 0.15
SDAS µm 143.9 · . · . . CC
for 0.15 2.1
where is the cooling rate K s‐1 and is the carbon content (wt%)
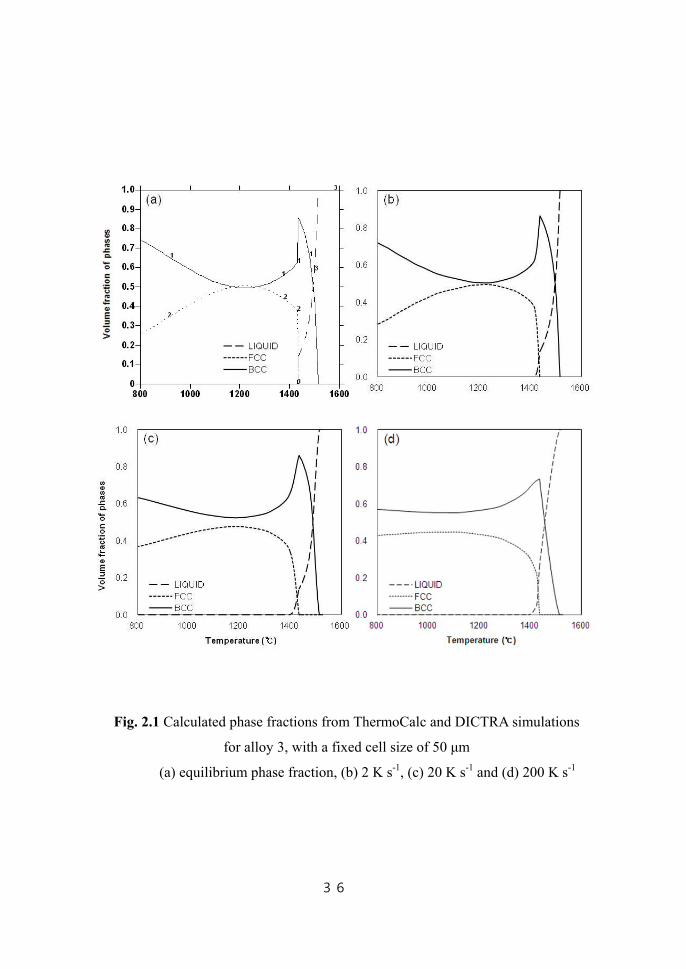
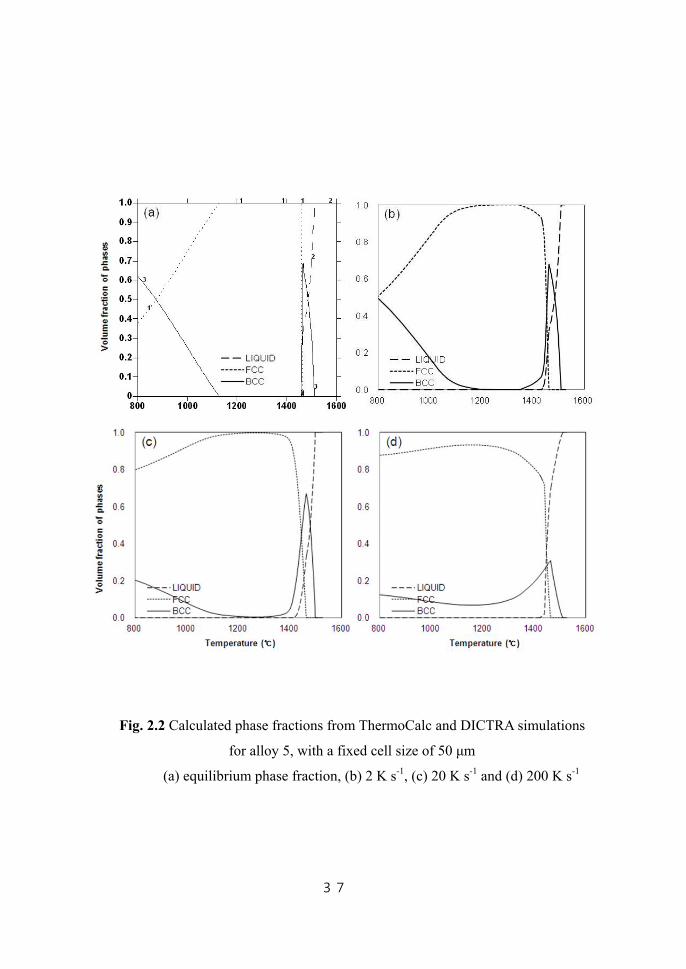
The simulation results are indicated in Figs. 2.1 and 2.2, including equilibrium
phase fraction diagrams for comparison. It is shown that the phase fractions
deviate from equilibrium values as cooling rate increases but changes in the
amount of δ phase are not as clear as expected. Instead, the γ to α phase
transformation which occurs at lower temperatures seems to be stifled by higher

35
cooling rates.
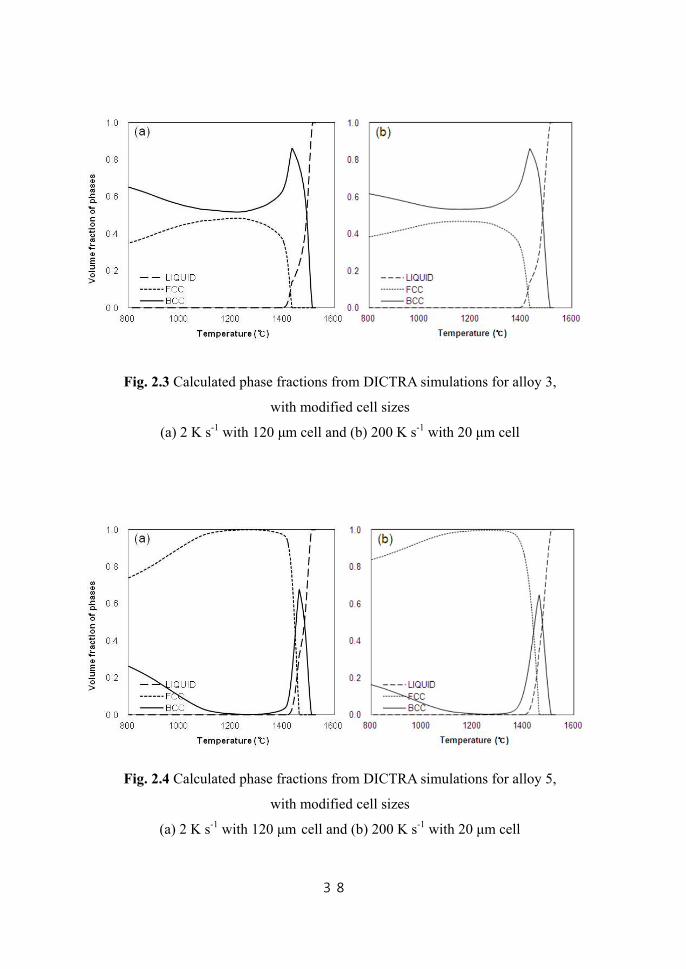
The SDAS for 2 K s-1 and 200 K s-1 were estimated based on the Eq. 2.1,
where higher cooling rate results in refinement. As shown in Figs. 2.3 and 2.4,
the kinetic effect becomes more ambiguous if the variation in SDAS with cooling
rate is taken into account even though it is more reasonable to modify the cell
size according to the cooling condition. This is contradicts to the fact that a
considerable amount of δ-ferrite exists in the as-cast specimen and implies that
the simulation cannot fully accommodate kinetic effect.
For more accurate comparison, modified simulations which incorporated the
actual cooling rate and SDAS from experimental data will be presented in the
Experimental and Discussion part.
36
Fig. 2.1 Calculated phase fractions from ThermoCalc and DICTRA simulations
for alloy 3, with a fixed cell size of 50 μm
(a) equilibrium phase fraction, (b) 2 K s-1, (c) 20 K s-1 and (d) 200 K s-1
37
Fig. 2.2 Calculated phase fractions from ThermoCalc and DICTRA simulations
for alloy 5, with a fixed cell size of 50 μm
(a) equilibrium phase fraction, (b) 2 K s-1, (c) 20 K s-1 and (d) 200 K s-1
38
Fig. 2.3 Calculated phase fractions from DICTRA simulations for alloy 3,
with modified cell sizes
(a) 2 K s-1 with 120 μm cell and (b) 200 K s-1 with 20 μm cell
Fig. 2.4 Calculated phase fractions from DICTRA simulations for alloy 5,
with modified cell sizes
(a) 2 K s-1 with 120 μm cell and (b) 200 K s-1 with 20 μm cell

39
3. Experiments
3.1. Experimental procedures
Four different alloys were fabricated in order to investigate the effect of
aluminum and carbon content on the retention of δ-ferrite. The alloys were
produced by POSCO and the manufacturing steps consisted of vacuum melting
and casting to produce a 25 kg ingot for each alloy. The compositions are shown
in Table 2.1.
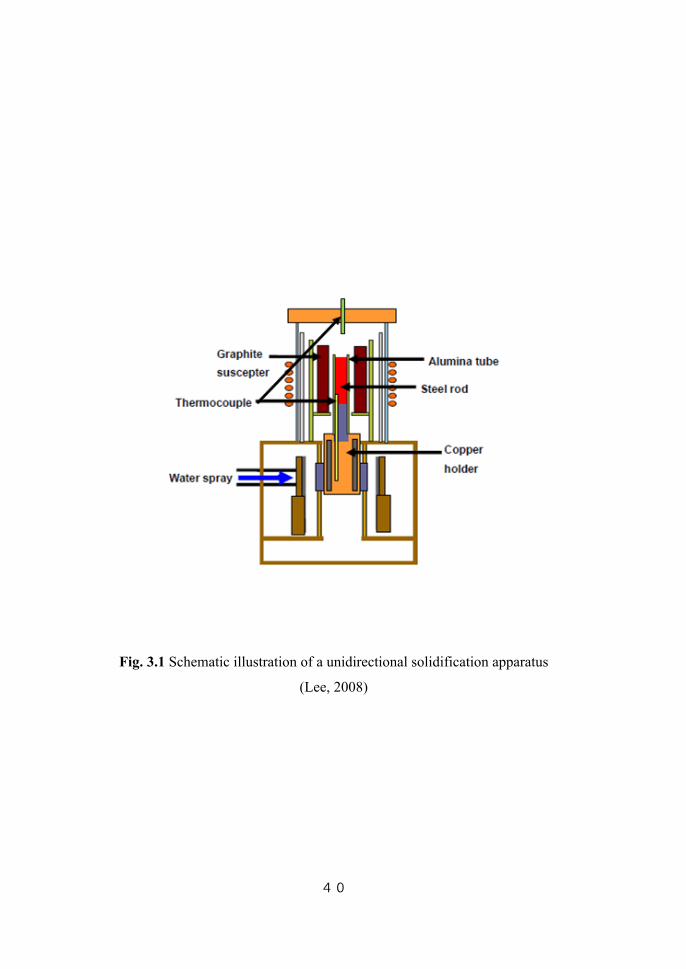
To observe the changes in the phase fraction as a function of temperature under
controlled conditions, a unidirectional solidification experiment was carried out
using the apparatus shown in Fig. 3.1. The sample is contained in an alumina
tube (298 mm in length, 10 mm outer diameter and 5.5 mm inner diameter),
which is withdrawn downward from the induction furnace to the water cooling
device below the mechanical part. The withdrawal rates were set to 30 mm m-1
and 300 mm m-1 corresponding to cooling rates which were measured to be 2.5 K
s-1 and 8.1 K s-1 respectively. The temperature profile was recorded by a separate
thermocouple for each withdrawal rate and the temperature history of the
specimen was estimated based on those data.
40
Fig. 3.1 Schematic illustration of a unidirectional solidification apparatus
(Lee, 2008)
41
3.2. Microscopy
After the solidification experiments, the solidified specimens were cut along
the longitudinal direction and microstructures of vertical section were observed.
Optical microscopy samples were prepared using standard methods and etched in
Oberhoffer’s solution (0.5 g SnCl2, 1 g CuCl2, 30 g FeCl3, 500 mL distilled water,
500 mL ethanol, 50 mL 32% HCl) for study using optical microscopy (Olympus:
BX60). The volume fractions of ferrite were measured using point counting on
optical micrographs.
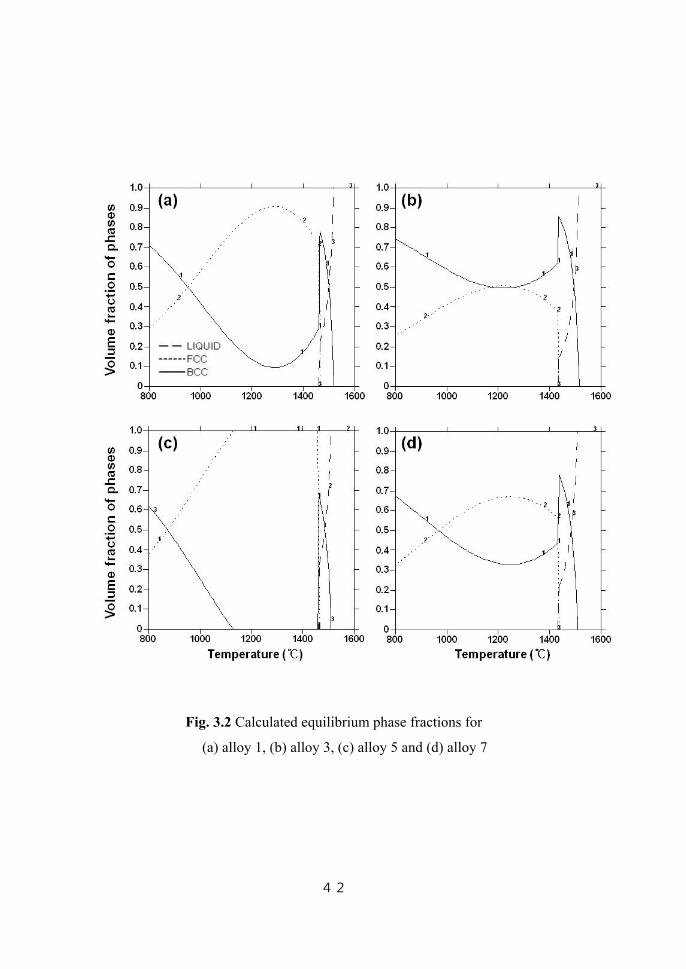
In Fig. 3.2, the equilibrium phase fractions calculated from ThermoCalc
software (version S) with TCFE6 database are presented. Fig. 3.3 shows the
microstructures of four alloys quenched from similar temperature range
(1120~1230 ºC) where according to the calculations, the austenite fraction
becomes a maximum and then starts to decrease. The ferrite fractions of the
alloys are not significantly different from each other with the exception of alloy 5
which has higher carbon and lower aluminum content. It is predictable that alloy
5 has lower ferrite fraction compared with other alloys from the calculated
equilibrium phase diagram. A notable thing is that the skeletal dendrite of the
remaining structure signifies that δ phase is not completely decomposed even for
alloy 5, which is contrary to what the equilibrium phase fraction diagram
suggests.
42
Fig. 3.2 Calculated equilibrium phase fractions for
(a) alloy 1, (b) alloy 3, (c) alloy 5 and (d) alloy 7

43
Fig. 3.3 The microstructures of specimens solidified with
high cooling rate (8.1 K s-1)
(a) alloy 1, (b) alloy 3, (c) alloy 5 and (d) alloy 7
44
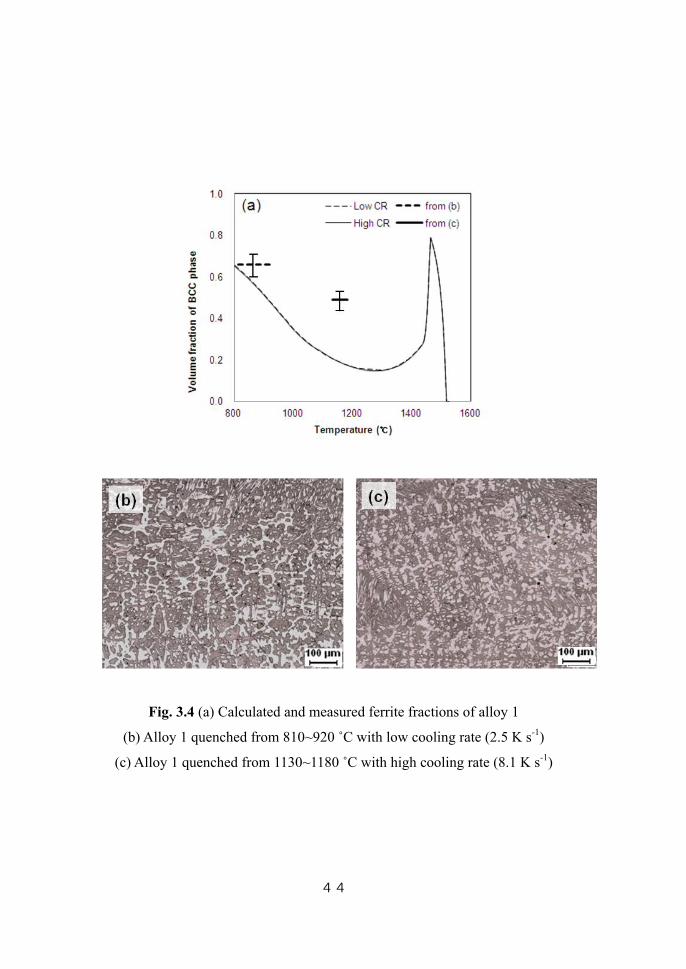
Fig. 3.4 (a) Calculated and measured ferrite fractions of alloy 1
(b) Alloy 1 quenched from 810~920 ˚C with low cooling rate (2.5 K s-1)
(c) Alloy 1 quenched from 1130~1180 ˚C with high cooling rate (8.1 K s-1)
45
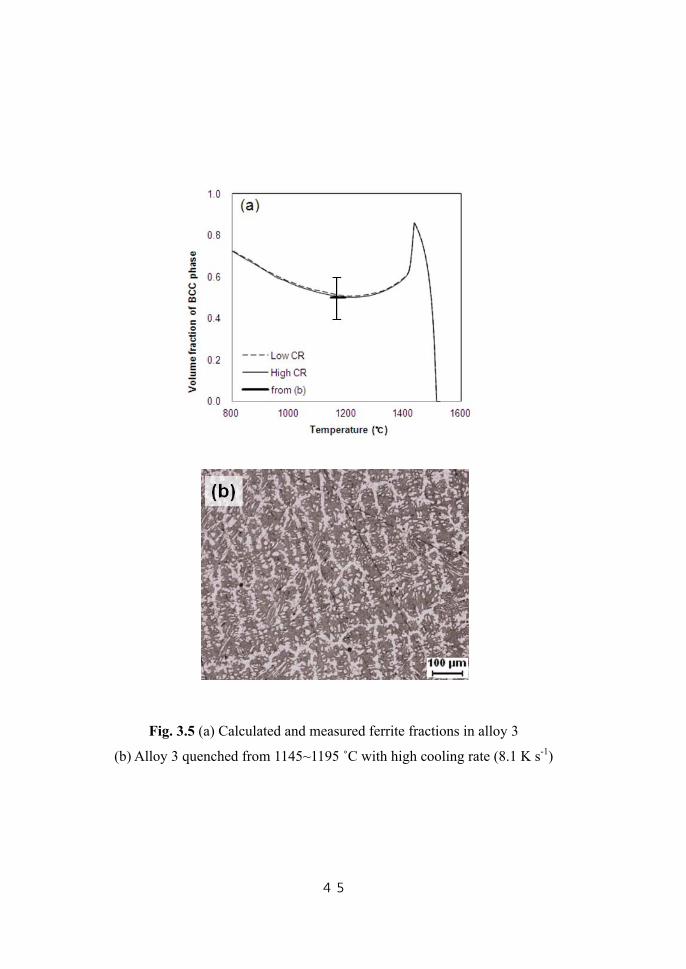
Fig. 3.5 (a) Calculated and measured ferrite fractions in alloy 3
(b) Alloy 3 quenched from 1145~1195 ˚C with high cooling rate (8.1 K s-1)
46
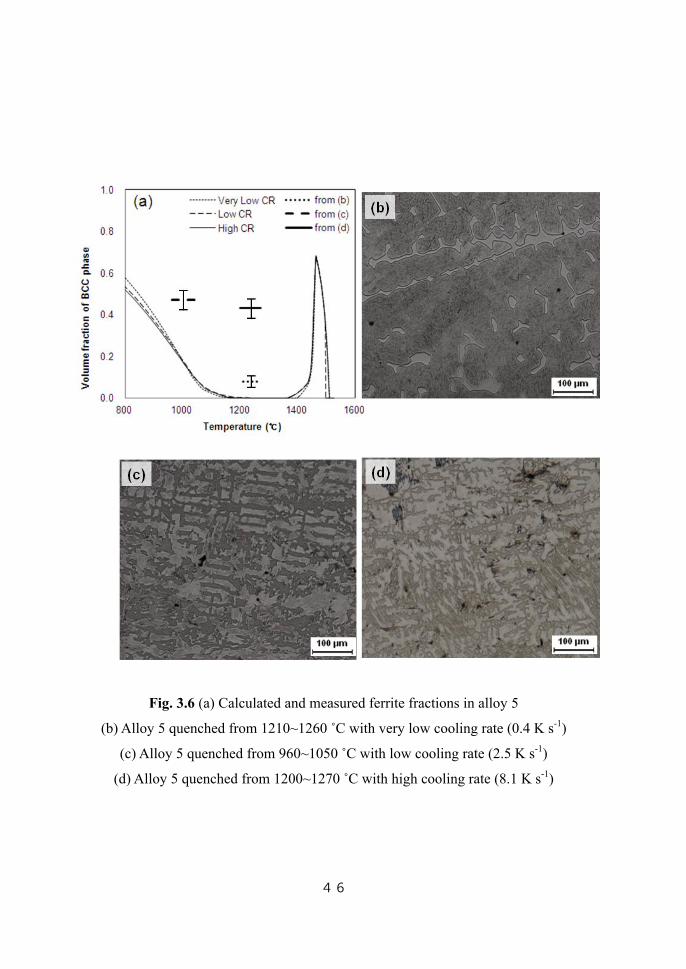
Fig. 3.6 (a) Calculated and measured ferrite fractions in alloy 5
(b) Alloy 5 quenched from 1210~1260 ˚C with very low cooling rate (0.4 K s-1)
(c) Alloy 5 quenched from 960~1050 ˚C with low cooling rate (2.5 K s-1)
(d) Alloy 5 quenched from 1200~1270 ˚C with high cooling rate (8.1 K s-1)

47
Fig. 3.7 (a) Calculated and measured ferrite fractions in alloy 7
(b) Alloy 7 quenched from 810~920 ˚C with low cooling rate (2.5 K s-1)
(c) Alloy 7 quenched from 1110~1150 ˚C with high cooling rate (8.1 K s-1)

48
From Figs. 3.4 to 3.7, measured ferrite fractions and predicted values are
shown together for several temperatures. The curves shown in the figures are
calculated BCC phase fractions from DICTRA simulations and the short bold
lines indicate the fractions measured from the unidirectionally solidified
specimens.
The DICTRA simulation was conducted in the same way as previous chapter
but incorporated actual cooling rate and SDAS measured from the experimental
result. The cell size was set to 36 μm for low cooling rate condition (2.5 K s-1)
and 21 μm for high cooling rate condition (8.1 K s-1). The reason why each
measured value appears as a line rather than a dot is that the temperature range
from which the specimen quenched was estimated from the position of the
specimen. An additional experiment and simulation with very slow cooling rate
(0.4 K s-1) was included for alloy 5, since the alloy showed the largest
discrepancy between calculated equilibrium fraction and measured fractions.
In the case of alloy 1 with low cooling rate, the measured ferrite fraction is
similar to the fraction from the simulation curve. However, the specimen with the
greater cooling rate shows a higher ferrite fraction than the simulated result. For
alloy 3, the ferrite fraction measured from high cooling rage specimen is in
accord with the simulation curve although the observation in low cooling rate is
absent due to a failed experiment. The measured ferrite fractions for alloy 5 as
well as 7 are higher than those calculated, except the one quenched at around
800 ºC.
49
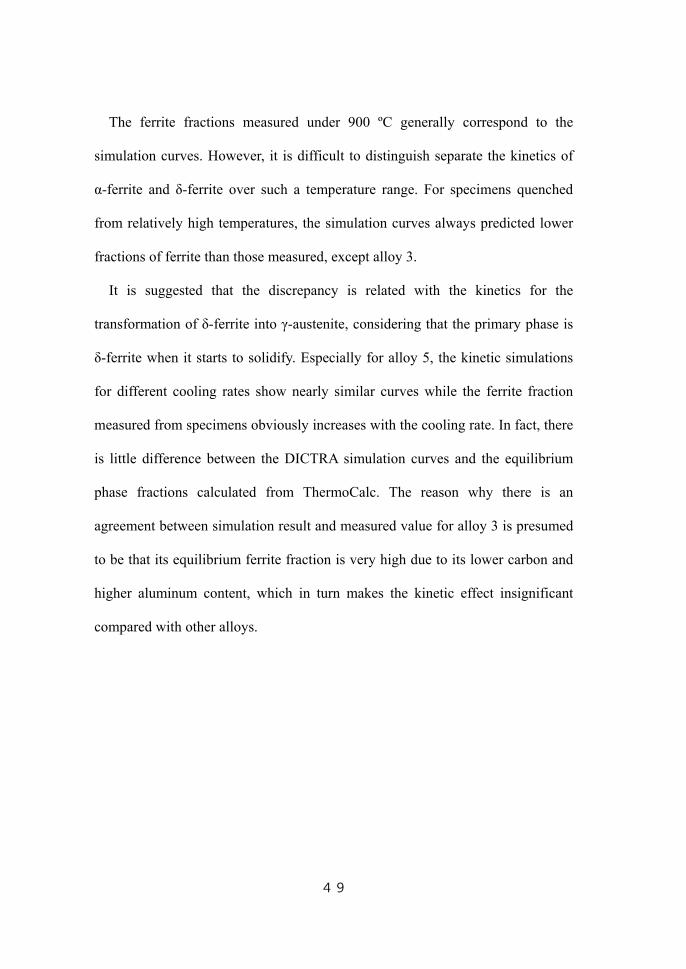
The ferrite fractions measured under 900 ºC generally correspond to the
simulation curves. However, it is difficult to distinguish separate the kinetics of
α-ferrite and δ-ferrite over such a temperature range. For specimens quenched
from relatively high temperatures, the simulation curves always predicted lower
fractions of ferrite than those measured, except alloy 3.
It is suggested that the discrepancy is related with the kinetics for the
transformation of δ-ferrite into γ-austenite, considering that the primary phase is
δ-ferrite when it starts to solidify. Especially for alloy 5, the kinetic simulations
for different cooling rates show nearly similar curves while the ferrite fraction
measured from specimens obviously increases with the cooling rate. In fact, there
is little difference between the DICTRA simulation curves and the equilibrium
phase fractions calculated from ThermoCalc. The reason why there is an
agreement between simulation result and measured value for alloy 3 is presumed
to be that its equilibrium ferrite fraction is very high due to its lower carbon and
higher aluminum content, which in turn makes the kinetic effect insignificant
compared with other alloys.
50
4. Discussion
There are some discrepancies between observed quantity of ferrite and that
predicted, as presented in the preceding chapter. The non-equilibrium
microstructures of δ-TRIP steel have previously been investigated by Yi et al.
(2010). The microscopic features of alloys designed on the basis of equilibrium
to contain substantial amount of δ-ferrite, revealed much reduced fractions of δ-
ferrite in the solidified condition. According to the authors, the feature
responsible for the diminished quantities of δ-ferrite is that the solid-state
transformation of δ-ferrite into austenite occurs without the required partitioning
of solutes, i.e. by a process which may not be far from paraequilibrium. However,
such interpretation should be modified given that the updated thermodynamic
database, TCFE6, indicates totally different phase fraction evolutions. It is noted
that the TCFE6 database is more accurate for the prediction of the relative
stabilities of austenite and ferrite in aluminum and copper-rich alloys, in the
ThermoCalc database description. This improvement can also be verified with
the alloys used in this study, by soaking the specimens at 1300 ºC for 24 h so as
to achieve microstructures close to that of equilibrium. The temperature was
selected in order to observe the point at which the ferrite fraction becomes
minimized. The soaking time is determined based on the diffusion distance
calculation of manganese and aluminum in steel, as discussed in the Chapter 1.3.
The microstructures as well as ferrite fractions of the as-cast and soaked
51
specimens are shown in Figs. 4.1 and 4.2, respectively. The equilibrium phase
diagrams using ThermoCalc software with TCFE6 database were presented in the
preceding chapter (Fig. 3.2) and the same diagrams with previous version of
database, TCFE4, are plotted in Fig. 4.3. These figures suggest that TCFE6
database gives more reliable results than TCFE4 and the ferrite fractions in as-
cast condition are not reduced amount but increased amount. Moreover, the
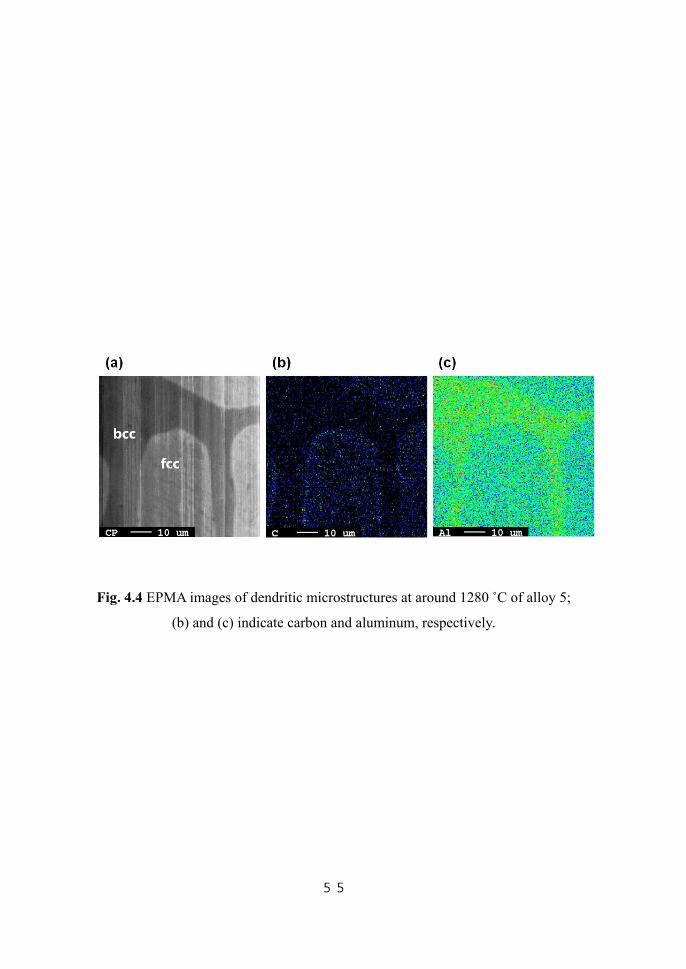
distribution of each element using electron microprobe analysis (EPMA)
indicates that aluminum, a substitutional alloying element, does partition into δ-
ferrite as shown in Fig. 4.4.
In short, the main drawback is not related with thermodynamic database but
the way to deal with the kinetics. The microstructures showed larger amounts of
dendritic δ-ferrite than the minimum amount of ferrite phase shown in
equilibrium phase fraction diagram, which implies that the δ to γ transformation
rate is much lower than expected. The decrease in δ-ferrite fraction is especially
rapid in the region where liquid, δ and γ phases coexist.
Several reasons can be considered to explain the overestimation of
transformation kinetics. Some of the reasons are attributed to the accuracy of
diffusivity or dimensions set in kinetic simulation, while others are associated
with the relative consumption rate of δ and liquid phase when the austenite phase
grows at the interface between the two phases.
52
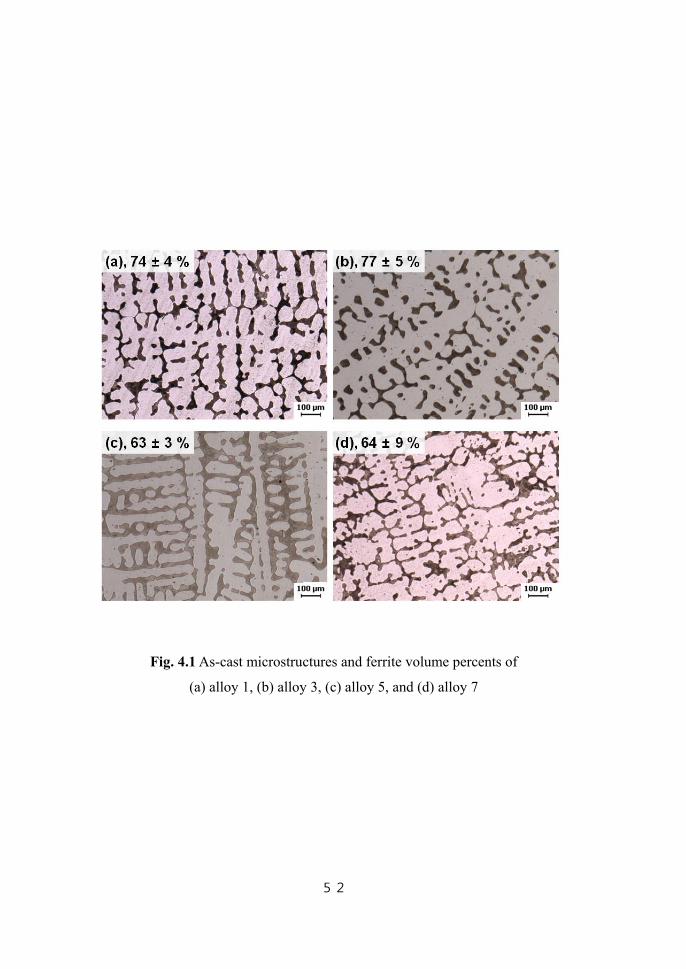
Fig. 4.1 As-cast microstructures and ferrite volume percents of
(a) alloy 1, (b) alloy 3, (c) alloy 5, and (d) alloy 7
53
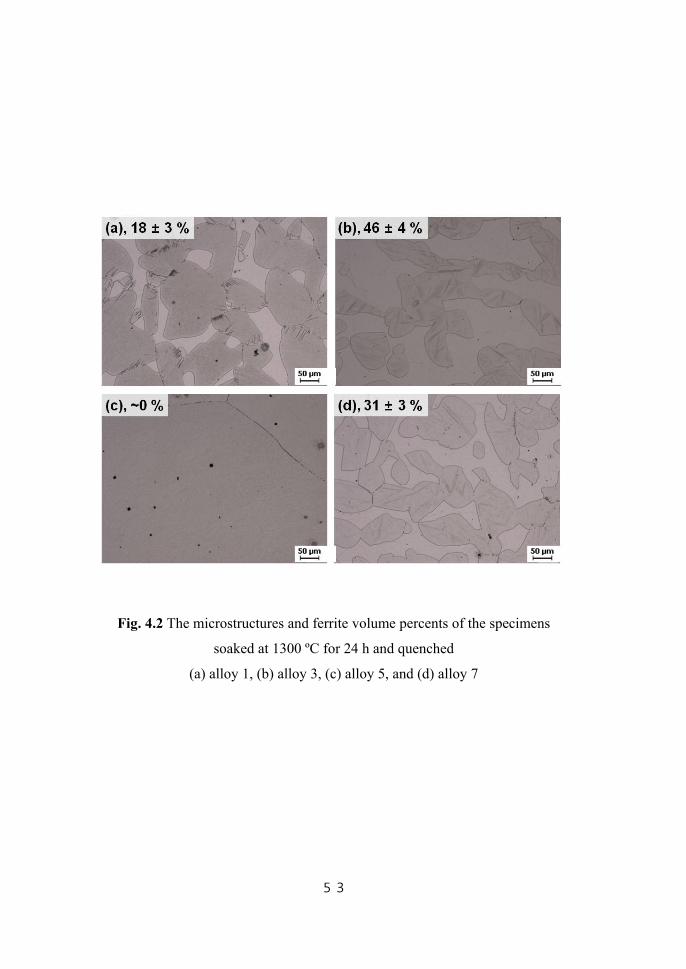
Fig. 4.2 The microstructures and ferrite volume percents of the specimens
soaked at 1300 ºC for 24 h and quenched
(a) alloy 1, (b) alloy 3, (c) alloy 5, and (d) alloy 7

54
Fig. 4.3 Equilibrium phase fractions from the ThermoCalc calculation with
TCFE4 database
(a) alloy 1, (b) alloy 3, (c) alloy 5, and (d) alloy 7
55
Fig. 4.4 EPMA images of dendritic microstructures at around 1280 ˚C of alloy 5;
(b) and (c) indicate carbon and aluminum, respectively.
56
4.1 Solute Movements
One probable explanation of the discrepancy between the actual and simulated
transformation kinetics may come from the overestimation of diffusivities in δ
and γ phases in the mobility database. It can affect the transformation kinetics in
two ways. One is the microsegregation level which depends on the degree of
back-diffusion of solutes in solid phases, i.e. δ-ferrite in this case. The difference
in solute concentration between liquid and δ-ferrite will be reduced if diffusivity
of solutes in the solid phase is overestimated, which in turn creates a more
favorable environment for austenite to grow since less solute diffusion is required.
The other way is the solid state transformation kinetics. Overestimated
diffusivities, of course, will result in higher δ→γ transformation rate. However, if
the inaccurate diffusivity were the reason of the inconsistency of kinetic
simulations with experimental observation, the dependence of cooling rate and
the amount of remaining δ-ferrite should have been revealed even if the ferrite
fraction in absolute terms may not be correct. Furthermore, the microsegregation
is nearly constant over wide ranges of cooling rates owing to the coarsening of
dendrite structure (Flemings, 1974b). The dendrite arm spacing varies with
cooling rate and this variation is such that the extent of diffusion occurring during
and after solidification is nearly constant. The specimens solidified with different
cooling rates also indicate similar levels of segregation as indicated in Fig. 4.5.
Thus, it is necessary to consider other factors.

57
Fig. 4.5 Energy dispersive X-ray microanalysis result for alloy 5
(CARL Zeiss ULTRA 55 FE-SEM)
(a) average aluminum concentration, (b) cooling rate 0.4 K s-1 and (c) 8.1 K s-1

58
Meanwhile, the austenite grows into both liquid and δ phases in the course of
peritectic transformation. It raises a question about the relative moving velocity
of liquid/γ interface and δ/γ interface, and also about the estimation of liquid
diffusivity.
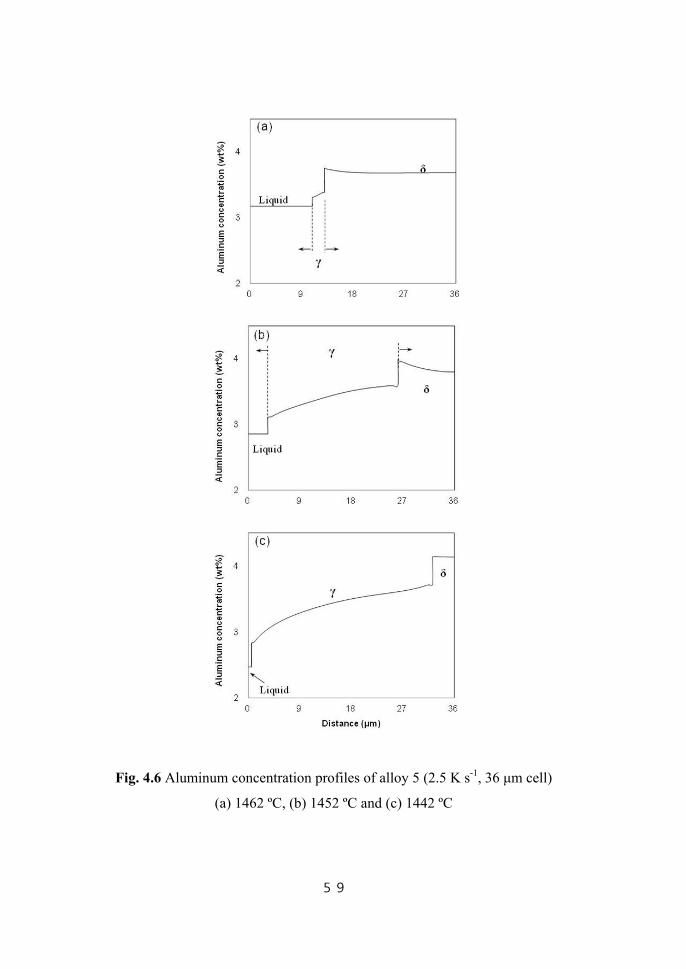
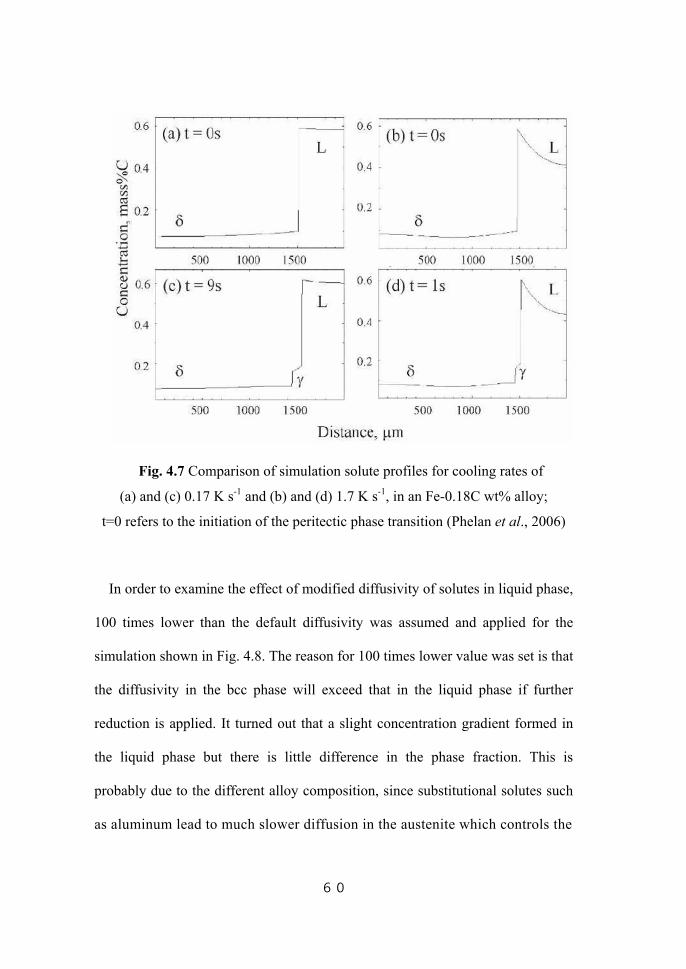
In the previous kinetic simulation done, the austenite phase grows more into δ-
ferrite as shown in Fig. 4.6. However, it is reported that there is a transition point
where the liquid/γ interface propagates faster than γ/δ interface as the cooling
rate increased (Phelan et al., 2006), from observations using high-temperature
laser scanning confocal microscopy as well as the results from phase field
modeling. The γ/δ interface propagates at a higher velocity than liquid/γ interface
at low cooling rates as the finding of previous researchers. However, earlier
modeling work in which complete diffusion in the liquid phase was assumed
could not fully describe the inversion at high cooling rates. According to the
authors, the inversion is attributed to the development of a steep concentration
gradient in the liquid at a cooling rate of 1.7 K s-1 which leads to the increase in
the flux of carbon from the austenite to the liquid phase, as shown in Fig. 4.7.
Although the results were obtained from Fe – 0.18C wt% alloy which is
significantly different from the alloy used in this study, it is worth paying
attention since there will remain more δ-ferrite if austenite grows faster into the
liquid phase. In addition, DICTRA software also considers diffusion in the liquid
phase very fast and the diffusion coefficient in liquid is regarded as a constant, i.e.
10-9 m2 s-1 under the conditions used in this study.
59
Fig. 4.6 Aluminum concentration profiles of alloy 5 (2.5 K s-1, 36 μm cell)
(a) 1462 ºC, (b) 1452 ºC and (c) 1442 ºC
60
Fig. 4.7 Comparison of simulation solute profiles for cooling rates of
(a) and (c) 0.17 K s-1 and (b) and (d) 1.7 K s-1, in an Fe-0.18C wt% alloy;
t=0 refers to the initiation of the peritectic phase transition (Phelan et al., 2006)
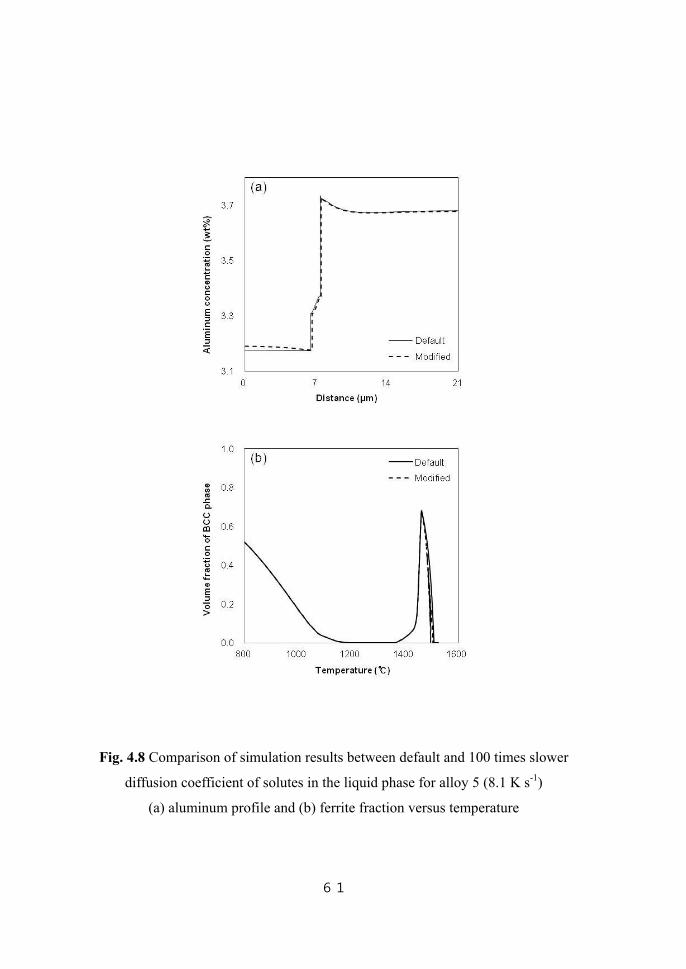
In order to examine the effect of modified diffusivity of solutes in liquid phase,
100 times lower than the default diffusivity was assumed and applied for the
simulation shown in Fig. 4.8. The reason for 100 times lower value was set is that
the diffusivity in the bcc phase will exceed that in the liquid phase if further
reduction is applied. It turned out that a slight concentration gradient formed in
the liquid phase but there is little difference in the phase fraction. This is
probably due to the different alloy composition, since substitutional solutes such
as aluminum lead to much slower diffusion in the austenite which controls the
61
Fig. 4.8 Comparison of simulation results between default and 100 times slower
diffusion coefficient of solutes in the liquid phase for alloy 5 (8.1 K s-1)
(a) aluminum profile and (b) ferrite fraction versus temperature
62
overall kinetics. It is also confirmed by the previous research which states that
the modification of diffusion coefficients by 0.1 ~ 5 times has a negligible
influence on the kinetic simulation results in type 304 stainless steel (Lee, 1998).
Another factor is the dimension (cell size) set for the simulation, since mass
transfer among the phases is less effective when the cell size is large due to the
large diffusion length. Indeed, it is reported that the interdendritic phosphorus
concentration increases with an increase in the size of unit segregation zone set
for DICTRA simulation, in the study on the effect of phosphorus addition on the
phase transformation behavior of low-carbon steels (Kim et al., 2006). Another
modeling study on the microstructure of welds with high aluminum concentration
( ~1.7 wt%) successfully evaluated the deviation from the equilibrium ferrite
fraction with different cooling rates, which indicates a large amount of retained
δ-ferrite (BABU et al., 2001). However, the dendrite arm spacing they assumed
for calculations, 200 μm, was a few times larger than the secondary dendrite arm
spacing which can be estimated from the micrograph they presented. The
changes in dendrite arm spacing with different cooling rate were not considered
either. Actually, considering the evolution of dendrite structure and the
characteristics of peritectic transformation, the cooling rate may have little
impact on the amount of austenite phase formed by peritectic transformation, i.e.,
the solid state transformation whose rate is controlled by the diffusion of solutes
in the austenite phase. It is because a higher cooling rate leads to finer dendrite
structure which provides more nucleation sites for austenite but at the same time

63
less time to proceed with the peritectic transformation.
To sum up, it is necessary to explore factors other than the growth aspect
related with diffusion of solutes.
64
4.2. Partition Characteristics
As mentioned before, the rate of decomposition of δ phase and formation of γ
phase is very rapid in the three-phase region where liquid, γ and δ phase coexist.
Then the slope becomes less steep after most of the liquid is consumed. It
suggests that the kinetics of peritectic transformation in the three-phase region is
critical to the amount of δ-ferrite retained. In the case of substitutional alloying
elements, the peritectic transformation rate will be so low that a considerable
amount of austenite phase was formed by the direct precipitation from the liquid
(Stefanescu, 2002). Direct solidification of austenite from the liquid phase, which
is not included in DICTRA simulation, should be taken into account since the
alloys used in this study contains a relatively high concentration of aluminum.
In general, the solutes are partitioned into the liquid phase from the growing
solid during solidification. However, the reverse is true for some elements such
as chromium whose partition coefficient is larger than unity. Aluminum also
partitions into the solid phase when solidified, thus the liquid phase becomes
aluminum-depleted during the solidification of δ-ferrite which consequently
promotes the direct solidification of austenite from liquid phase since it does not
require the diffusion of solutes across austenite from ferrite. The chemical
composition of liquid phase after incomplete peritectic transformation and further
cooling is actually in the liquid + γ region, as indicated in Fig. 4.9. The
solidification mode change due to microsegregation was previously reported also
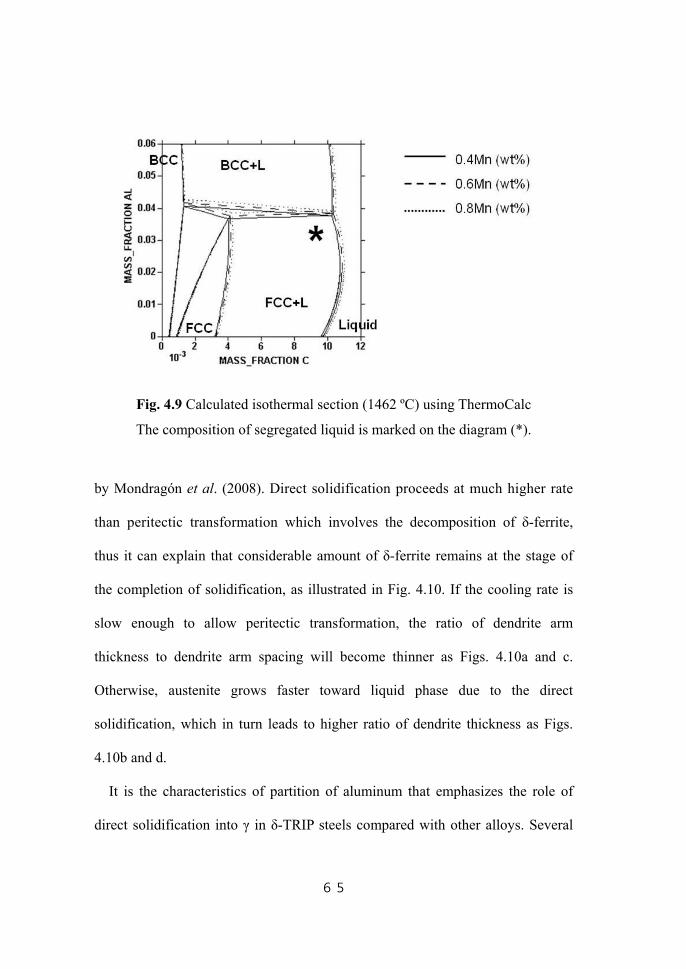
65
Fig. 4.9 Calculated isothermal section (1462 ºC) using ThermoCalc
The composition of segregated liquid is marked on the diagram (*).
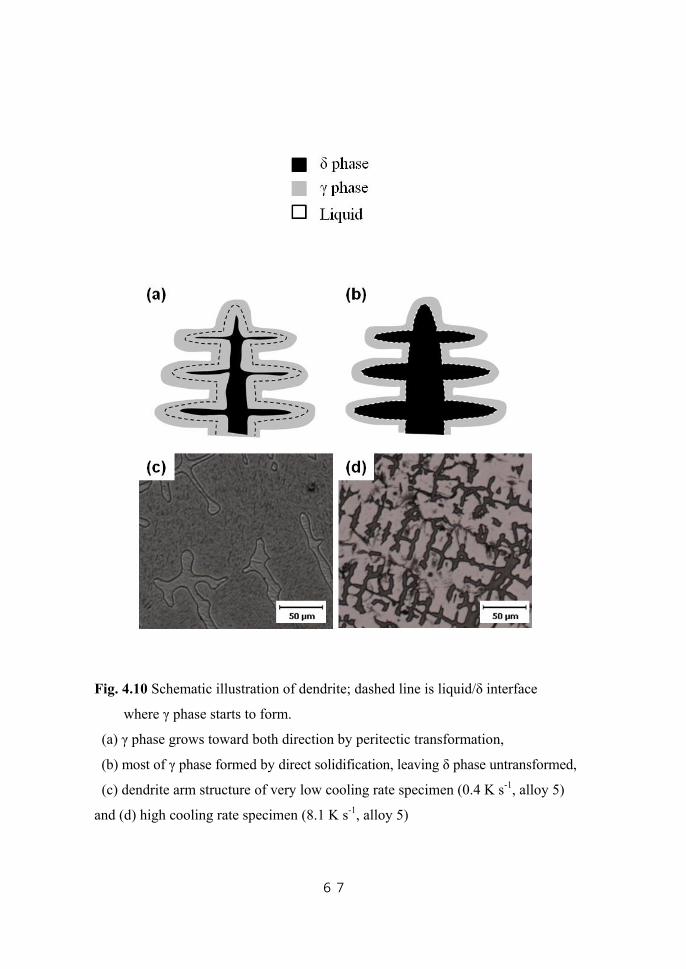
by Mondragón et al. (2008). Direct solidification proceeds at much higher rate
than peritectic transformation which involves the decomposition of δ-ferrite,
thus it can explain that considerable amount of δ-ferrite remains at the stage of
the completion of solidification, as illustrated in Fig. 4.10. If the cooling rate is
slow enough to allow peritectic transformation, the ratio of dendrite arm
thickness to dendrite arm spacing will become thinner as Figs. 4.10a and c.
Otherwise, austenite grows faster toward liquid phase due to the direct
solidification, which in turn leads to higher ratio of dendrite thickness as Figs.
4.10b and d.
It is the characteristics of partition of aluminum that emphasizes the role of
direct solidification into γ in δ-TRIP steels compared with other alloys. Several

66
studies on the kinetic simulation of peritectic solidification with type 304
stainless steels, for example, obtained results with comparable amount of δ-
ferrite (Lee, 1998, Hillert and Larsölund, 1999, Lee et al., 1998). In such case,
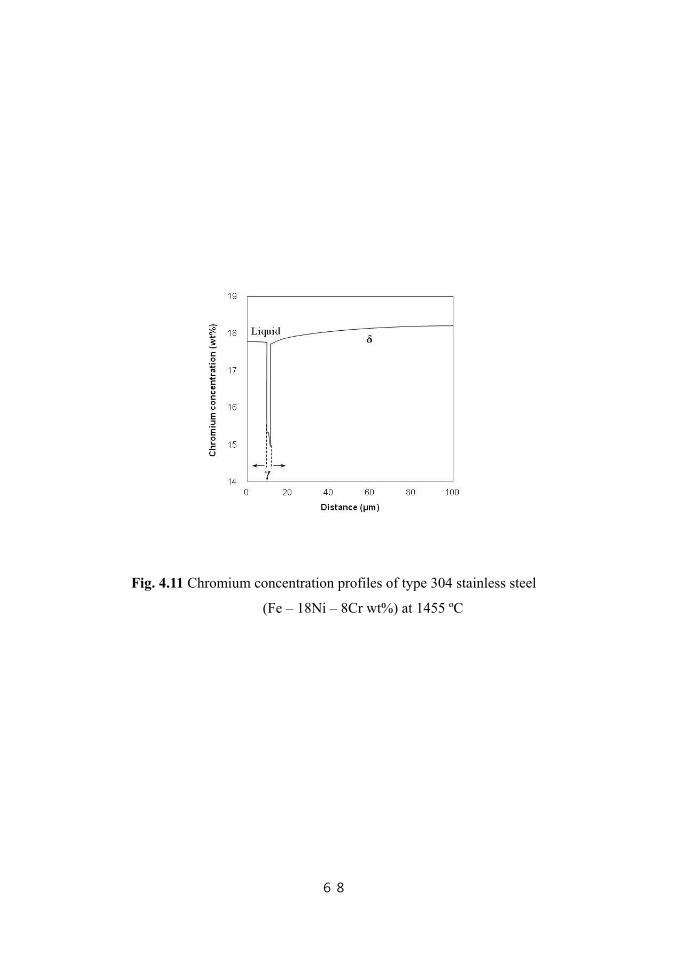
the direct solidification of austenite is less likely to occur since the chemical
composition of the liquid phase is closer to that of ferrite as shown in Fig. 4.11.
Thus DICTRA simulations could successfully describe the kinetics of phase
transformation.
In conclusion, it is difficult to quantitatively predict the amount of δ-ferrite at
ambient temperature with kinetic simulation using DICTRA although the
retention behavior basically comes from the chemical segregation. Nevertheless,
it is envisaged that the amount of retained δ-ferrite is analogous to that at the
temperature where the austenite starts to form during solidification, under high
cooling rates such as small ingot casting used in this study. This means the
amount of austenite formed by peritectic transformation, accompanying the
decomposition of δ-ferrite, is negligible. On the other hand, it will approach the
equilibrium phase fraction under very slow cooling rates, as shown in Fig. 3.6
and verified with the specimens soaked at 1300 ºC for 24 h. Fig. 4.12 compares
the ferrite fraction measured from as-cast specimens as well as soaked specimens
versus estimated fractions from DICTRA simulations and equilibrium phase
fraction diagrams, including additional specimens with different chemical
composition (Table 4.1).
67
Fig. 4.10 Schematic illustration of dendrite; dashed line is liquid/δ interface
where γ phase starts to form.
(a) γ phase grows toward both direction by peritectic transformation,
(b) most of γ phase formed by direct solidification, leaving δ phase untransformed,
(c) dendrite arm structure of very low cooling rate specimen (0.4 K s-1, alloy 5)
and (d) high cooling rate specimen (8.1 K s-1, alloy 5)
68
Fig. 4.11 Chromium concentration profiles of type 304 stainless steel
(Fe – 18Ni – 8Cr wt%) at 1455 ºC

69
Fig. 4.12 The estimation of the volume fractions of ferrite
(a) calculated value; the maximum δ-ferrite fraction during solidification
(b) measured from the as-cast specimens
(c) calculated value at around 1300 ºC
(d) measured from the specimens soaked at 1300 ºC for 24 h
Table 4.1 Chemical composition of the additional alloys in Fig. 4.12
70
5. Conclusion
The solidification of δ-TRIP steel has been studied, which is characterized by
the retention of δ-ferrite. Since the retention of δ-ferrite is attributed to kinetic
effects, DICTRA simulation has been conducted. However, there is discrepancy
in the room temperature δ-ferrite fraction between simulated value and
experimentally measured one. It is suggested that the discrepancy mostly comes
from the three-phase region where most of δ-phase disappears at rapid rate in the
simulation while the experimental results indicate that considerable amount of δ-
phase is retained. In a real solidification situation, the amount of γ phase formed
by peritectic transformation would be very small, especially when involved with
substitutional alloying elements as well as high cooling rate. In addition, the
chemical composition of the liquid is in favorable condition to transform into γ
phase due to segregation. Thus γ phase should grow into the liquid by direct
solidification during peritectic solidification.
It should be pointed out that the thermodynamic database TCFE6 correctly
reproduces the measured equilibrium fractions of δ-ferrite at 1300 ˚C for the
alloys used in this study, which the previous database TCFE4 does not. The cast
microstructures showed diminished quantities of δ-ferrite compared with those
calculated using TCFE4 database, which was difficult to be explained without
introducing para-equilibrium mode. However, the amount of δ-ferrite is actually
greater than those calculated using TCFE6 database which is proved to be more
71
reliable. It leads to more straightforward explanation: the retention of δ-ferrite is
attributed to kinetic effect and the deviation from the equilibrium phase fraction
becomes greater as cooling rate increases.
The attempt to estimate the amount of δ-ferrite at room temperature according
to the cooling rates has not been successful. Even so, it is predictable that the
amount of δ-ferrite is close to the maximum amount of primary δ phase estimated
by Thermo-Calc calculation under high cooling rates such as small ingot casting.
From a practical point of view, the following two can be pointed out to design
δ-TRIP alloys, in which the retention of δ-ferrite plays a key role, using
commercial thermodynamic software such as ThermoCalc. First, the maximum
amount of δ-ferrite in phase fraction diagram can be a guide when one can obtain
sufficient high cooling rate in casting process, e.g. strip casting. In this case,
proper conditions for the successive process such as reheating and hot-rolling as
well as casting should be set in order to maintain δ-ferrite throughout the process.
The other is to design an alloy containing sufficient contents of aluminum so that
the δ-ferrite does not disappear at any conditions, which can be predicted from
the minimum amount of δ-ferrite in phase fraction diagram. This is necessary
since the cooling rate may not be fast enough for normal continuous casting of
large slabs, especially for the central part.
72
References
ARAI, Y., EMI, T., FREDRIKSSON, H. & SHIBATA, H. 2005. In-Situ observed
dynamics of peritectic solidification and δ/γ transformation of Fe-3 to 5
At. pct Ni alloys. Metallurgical and Materials Transactions A, 36, 3065-
3074.
BABU, S. S., DAVID, S. A. & QUINTANA, M. A. 2001. Modeling
Microstructure Development in Self-Shielded Flux Cored Arc Welds.
Welding Journal, 80, 91s-97s.
BHADESHIA, H. K. D. H. 2001. Bainite in Steels, UK, The University Press,
Cambridge.
BHADESHIA, H. K. D. H. & HONEYCOMBE, R. W. K. 2006. Steels:
Microstructure and Properties, UK, Elsevier.
BOWER, T. F., BRODY, H. D. & FLEMINGS, M. C. 1966. Measurements of
Solute Redistribution in Dendritic Solidification. Transaction of the
Metallurgical Society of AIME, 236, 624-633.
BRODY, H. D. & FLEMINGS, M. C. 1966. Solute Redistribution in Dendritic
Solidification. AIME MET SOC TRANS, 236, 615-624.
CHATTERJEE, S., MURUGANANTH, M. & BHADESHIA, H. K. D. H. 2007.
δ TRIP steel. Materials Science and Technology, 23, 819-827.
CHEN, Y., CHEN, X., YUAN, Z. X., XU, B. F., GUO, A. M., LI, P. H. & PU, S.
K. 2002. Effects of Carbon Content and Rolling Processing on Retained
Austenite for Hot-Rolled TRIP Steels. ACTA METALLURGICA SINICA,
15, 439-447.
73
CLYNE, T. & KURZ, W. 1981. Solute redistribution during solidification with
rapid solid state diffusion. Metallurgical and Materials Transactions A,
12, 965-971.
DAS, A., MANNA, I. & PABI, S. K. 1999. A numerical model of peritectic
transformation. Acta Materialia, 47, 1379-1388.
DE COOMAN, B. C., SPEER, J. G., PYSHMINTSEV, I. Y. & YOSHINAGA, N.
2007. Materials design: the key to modern steel products, GRIPS media.
FLEMINGS, M. 1974a. Solidification processing. Metallurgical and Materials
Transactions B, 5, 2121-2134.
FLEMINGS, M. C. 1974b. Solidification Processing, New York, McGraw-Hill.
GHOSH, C., HALDAR, A., GHOSH, P. & RAY, R. K. 2008. Microstructure,
Texture, Grain Boundary Characteristics and Mechanical Properties of a
Cold Rolled and Annealed Martensitic Steel. ISIJ International, 48,
1626-1634.
HA, H. & HUNT, J. 2000. A numerical and experimental study of the rate of
transformation in three directionally grown peritectic systems.
Metallurgical and Materials Transactions A, 31, 29-34.
HASHIMOTO, S., IKEDA, S., SUGIMOTO, K.-I. & MIYAKE, S. 2004. Effects
of Nb and Mo Addition to 0.2%C - 1.5%Si - 1.5%Mn Steel on
Mechanical Properties of Hot Rolled TRIP-aided Steel Sheets. ISIJ
International, 44, 1590-1598.
HILLERT, M. & LARS LUND 1999. Simulation of the Peritectic Reactio in 304
Stainless Steel. Materials Transactions, JIM, 40, 567-570.

74
JACQUES, P., GIRAULT, E., CATLIN, T., GEERLOFS, N., KOP, T., VAN DER
ZWAAG, S. & DELANNAY, F. 1999. Bainite transformation of low
carbon Mn–Si TRIP-assisted multiphase steels: influence of silicon
content on cementite precipitation and austenite retention. Materials
Science and Engineering: A, 273-275, 475-479.
KERR, W., CISSE, J. & BOLLING, G. F. 1974. On equilibrium and non-
equibrium peritectic transformation. Acta Metallurgica, 22, 677-686.
KIM, H. S., KOBAYASHI, Y. & NAGAI, K. 2006. Simulation of the influence of
phosphorus on the prior austenite grain size of high-impurity steels. Acta
Materialia, 54, 2441-2449.
KOZESCHNIK, E. & BHADESHIA, H. K. D. H. 2008. Influence of silicon on
cementite precipitation in steels. Materials Science and Technology, 24,
343-347.
KURZ, W. & FISHER, D. J. 1986. Fundamentals of Solidification,
Aedermannsdorf, Trans Tech Pub.
LEE, B. J. 1998. Computer Simulation of Diffusional Transformation in Alloy
Systems. 한국표준과학연구원(KRISS).
LEE, H. M., BAE, J. S., SOH, J. R., KIM, S. K. & LEE, Y. D. 1998. Diffusional
Solidification Behavior in 304 Stainless Steel. Materials Transactions,
JIM, 39, 633-639.
LEE, S. M. 2008. The change of the morphology of MnS inclusions in steel
during unidirectional solidification. PhD, POSTECH.
LESLIE, W. & RAUCH, G. 1978. Precipitation of carbides in low-carbon Fe-AI-
C alloys. Metallurgical and Materials Transactions A, 9, 343-349.

75
MAHIEU, J., DE COOMAN, B. & CLAESSENS, S. 2001. Galvanizability of
high-strength steels for automotive applications. Metallurgical and
Materials Transactions A, 32, 2905-2908.
MAHIEU, J., MAKI, J., COOMAN, B. C. D. & CLAESSENS, S. 2002. Phase
Transformation and Mechanical Properties of Si-Free CMnAl
Transformation-Induced Plasticity-Aided Steel. Metallurgical and
Materials Transactions A, 33A, 2573-2580.
MCDONALD, N. & SRIDHAR, S. 2003. Peritectic reaction and solidification in
iron-nickel alloys. Metallurgical and Materials Transactions A, 34,
1931-1940.
MCDONALD, N. & SRIDHAR, S. 2005. Observations of the advancing δ-
ferrite/γ-austenite/liquid interface during the peritectic reaction. Journal
of Materials Science, 40, 2411-2416.
MEYER, M. D., VANDERSCHUEREN, D. & COOMAN, B. C. D. 1999. The
Influence of the Substitution of Si by Al on the Properties of Cold Rolled
C-Mn-Si TRIP Steels. ISIJ International, 39, 813-822.
MONDRAG N, J. J. R., TREJO, M. H., ROM N, M. D. J. C. & T., H. S. 2008.
Description of the Hypo-peritectic Steel Solidification under Continuous
Cooling and Crack Susceptibility. 48, 454-460.
NATSUME, Y., SHIMAMOTO, M. & ISHIDA, H. 2010. Numerical Modeling of
Microsegregation for Fe-base Multicomponent Alloys with Peritectic
Transformation Coupled with Thermodynamic Calculations. ISIJ
International, 50, 1867-1874.

76
PHELAN, D., REID, M. & DIPPENAAR, R. 2006. Kinetics of the Peritectic
Phase Transformation: In-Situ Measurements and Phase Field Modeling.
Metallurgical and Materials Transactions A, 37, 985-994.
SAMEK, L., DE MOOR, E., PENNING, J. & DE COOMAN, B. 2006. Influence
of alloying elements on the kinetics of strain-induced martensitic
nucleation in low-alloy, multiphase high-strength steels. Metallurgical
and Materials Transactions A, 37, 109-124.
SHIBATA, H., ARAI, Y., SUZUKI, M. & EMI, T. 2000. Kinetics of peritectic
reaction and transformation in Fe-C alloys. Metallurgical and Materials
Transactions B, 31, 981-991.
STEFANESCU, D. M. 2002. Science and Engineering of Casting Solidification,
New York, Kluwer Academic / Plenum Publishers.
UESHIMA, Y., MIZOGUCHI, S., MATSUMIYA, T. & KAJIOKA, H. 1986.
Analysis of solute distribution in dendrites of carbon steel with δ/γ
transformation during solidification. Metallurgical and Materials
Transactions B, 17, 845-859.
WON, Y.-M. & THOMAS, B. 2001. Simple model of microsegregation during
solidification of steels. Metallurgical and Materials Transactions A, 32,
1755-1767.
YI, H. L. 2010. δ-TRIP Steel. PhD Thesis, POSTECH, Korea.
YI, H. L., GHOSH, S. K., LIU, W. J., LEE, K. Y. & BHADESHIA, H. K. D. H.
2010. Non-equilibrium solidification and ferrite in δ-TRIP steel.
Materials Science and Technology, 26, 817-823.

77
Acknowledgement
I would like to express my gratitude to Professor Dong-Woo Suh and Bhadeshia,
H.K.D.H. for supervision, guidance and enthusiasm. I wish to thank CML
members as well as PT group members for their help and friendship. Also, I
would like to thank to all of my friends for making my stay at school enjoyable
and comfortable.
Lovely thanks to Ki-hyon for his love, care and support.
Finally, I would like to take this opportunity to express my thanks to my family
for their love, understanding and support.
78
Curriculum Vitae
Name: Choi Young-Joo
E-mail: [email protected]
Data of birth: 9th August, 1985
Place of birth: Seoul, South Korea
Education
M. S. 2012, POSTECH (Pohang, Korea), Graduate Institute of Ferrous Technology, Computational Metallurgy Group
B. S. 2009, POSTECH (Pohang, Korea), Department of Materials Science and Engineering