Noise on Analog Systems ECE460 Spring, 2012. AM Receiver s ( t ) is the transmitted signal Let M ( t...
21
Noise on Analog Systems ECE460 Spring, 2012
-
Upload
beverly-dixon -
Category
Documents
-
view
214 -
download
0
Transcript of Noise on Analog Systems ECE460 Spring, 2012. AM Receiver s ( t ) is the transmitted signal Let M ( t...
Noise on Analog Systems
ECE460Spring, 2012
2
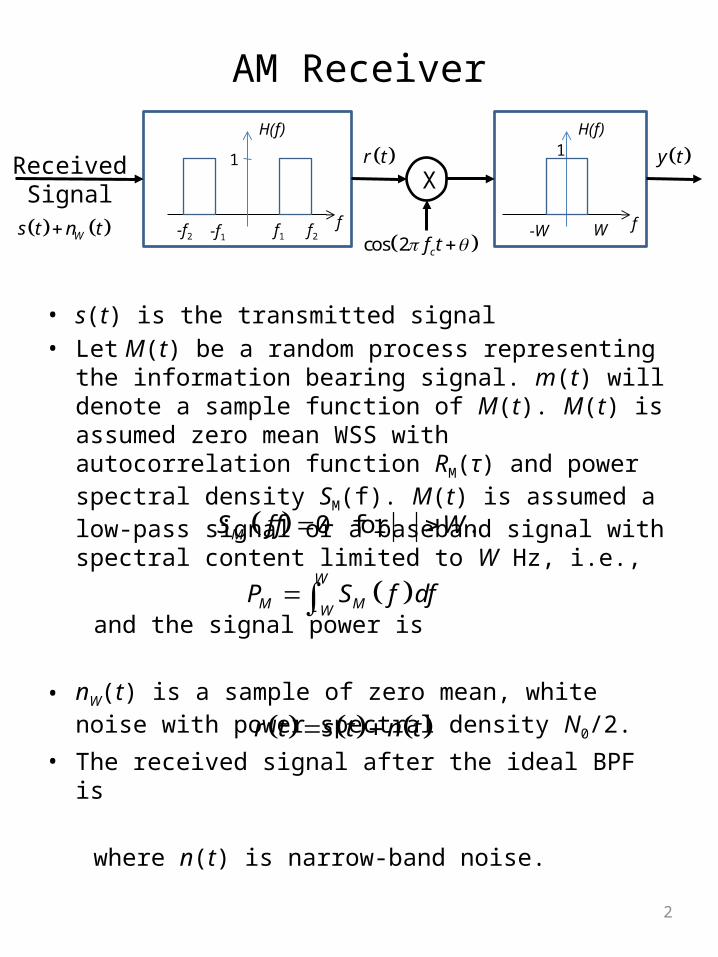
AM Receiver
• s(t) is the transmitted signal• Let M(t) be a random process representing the information
bearing signal. m(t) will denote a sample function of M(t). M(t) is assumed zero mean WSS with autocorrelation function RM(τ) and power spectral density SM(f). M(t) is assumed a low-pass signal or a baseband signal with spectral content limited to W Hz, i.e.,
and the signal power is
• nW(t) is a sample of zero mean, white noise with power spectral density N0/2.
• The received signal after the ideal BPF is
where n(t) is narrow-band noise.
X
W-W
1H(f)
ff1 f2-f1-f2
1
H(f)
f
ReceivedSignal Ws t n t
r t y t
cos 2 cf t
r t s t n t
0 for .MS f f W
W
M MWP S f df
3
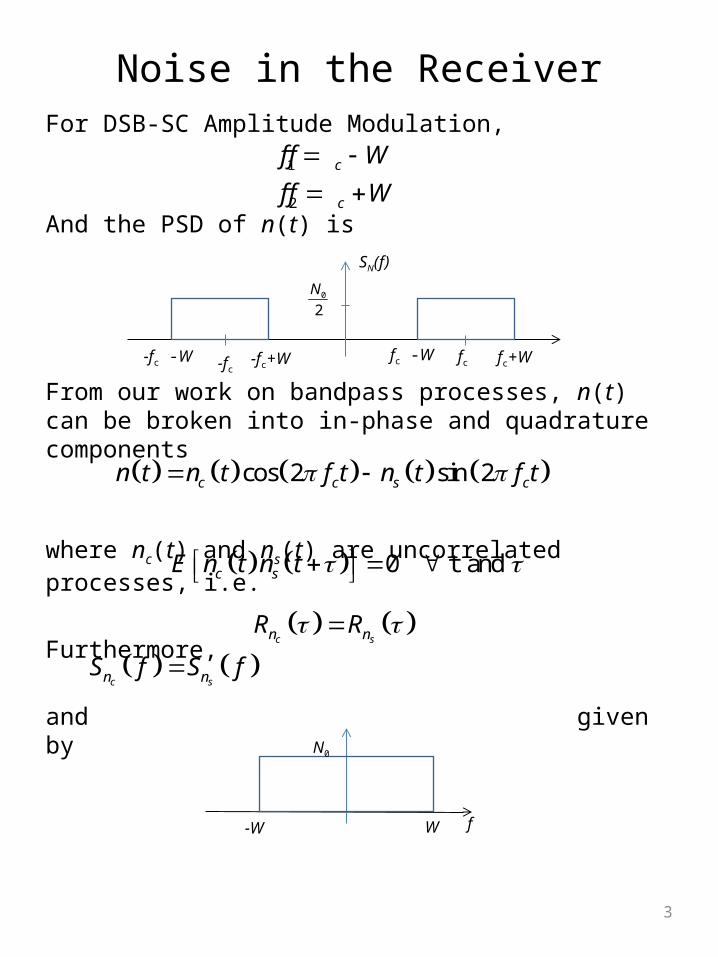
Noise in the ReceiverFor DSB-SC Amplitude Modulation,
And the PSD of n(t) is
From our work on bandpass processes, n(t) can be broken into in-phase and quadrature components
where nc(t) and ns(t) are uncorrelated processes, i.e.
Furthermore,
and given by
1
2
c
c
f f W
f f W
fc -W fc+W-fc
SN(f)
0
2
N
fc-fc -W -fc+W
cos 2 sin 2c c s cn t n t f t n t f t
0 t and c sE n t n t
c sn nR R
c sn nS f S f
W-W
N0
f
4
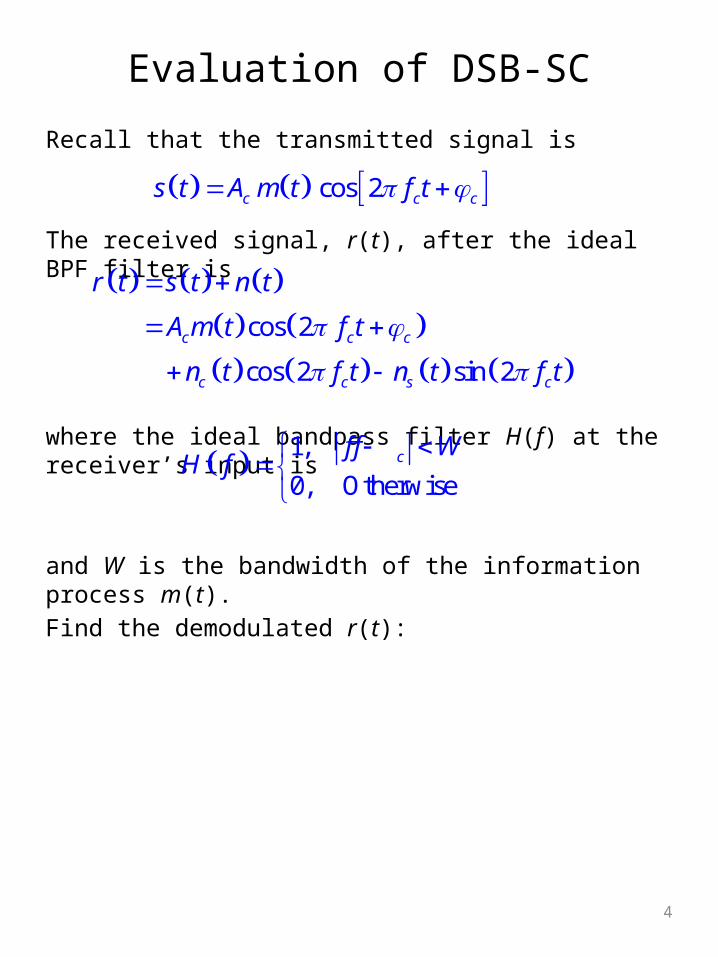
Evaluation of DSB-SC
Recall that the transmitted signal is
The received signal, r(t), after the ideal BPF filter is
where the ideal bandpass filter H(f) at the receiver’s input is
and W is the bandwidth of the information process m(t).Find the demodulated r(t):
cos 2c c cs t A m t f t
cos 2
cos 2 sin 2
c c c
c c s c
r t s t n t
A m t f t
n t f t n t f t
1,
0, Otherwisecf f W
H f
5
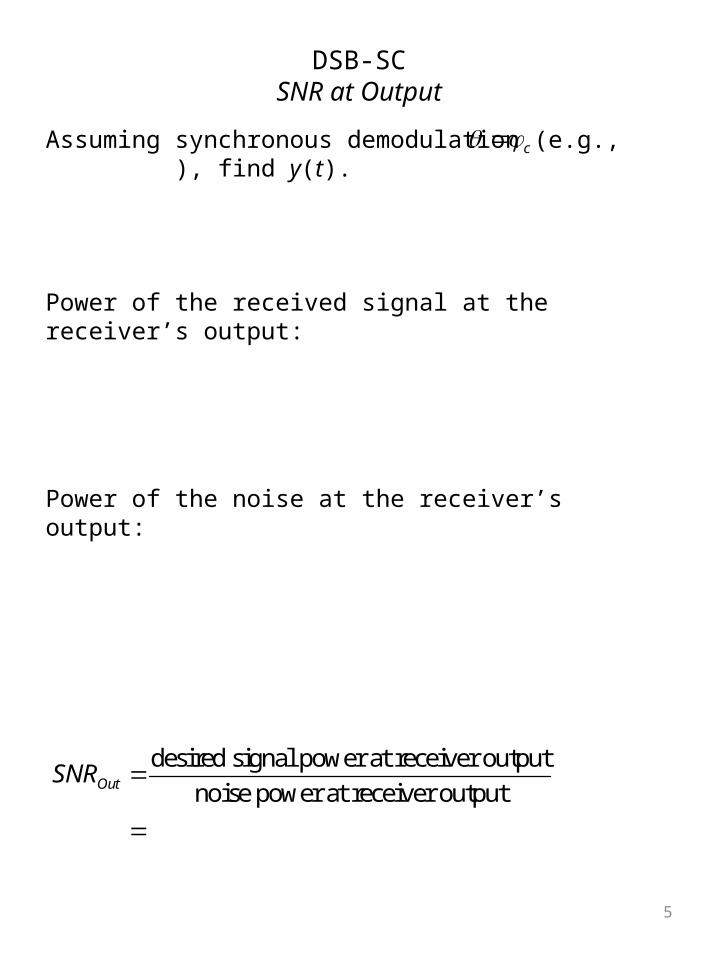
DSB-SCSNR at Output
Assuming synchronous demodulation (e.g., ), find y(t).
Power of the received signal at the receiver’s output:
Power of the noise at the receiver’s output:
c
desired signal power at receiver output
noise power at receiver outputOutSNR
6
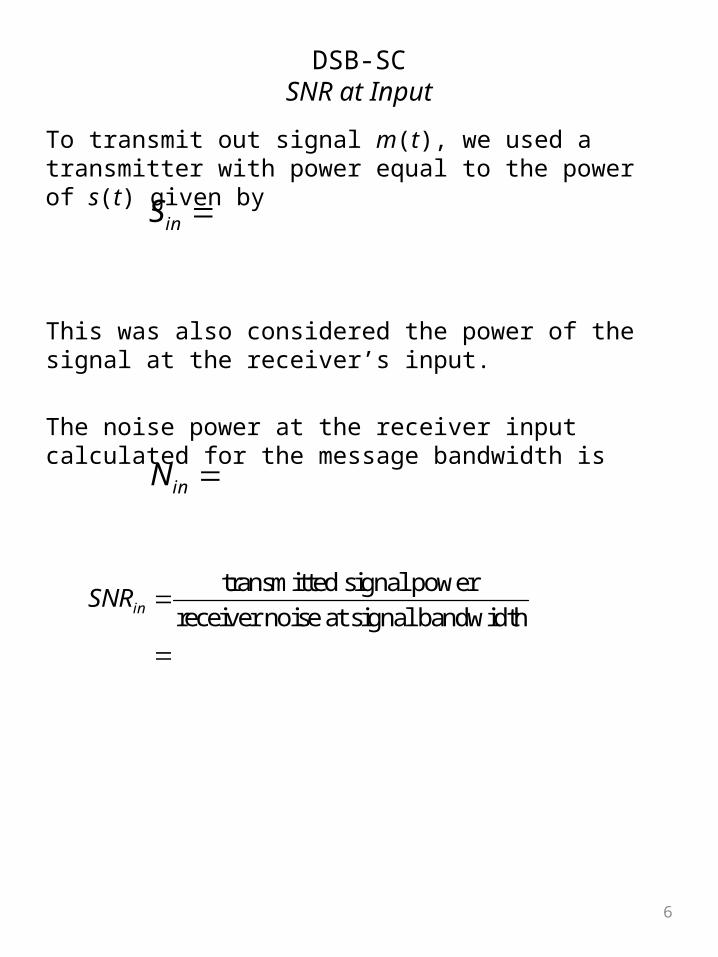
DSB-SCSNR at Input
To transmit out signal m(t), we used a transmitter with power equal to the power of s(t) given by
This was also considered the power of the signal at the receiver’s input.
The noise power at the receiver input calculated for the message bandwidth is
inS
transmitted signal power
receiver noise at signal bandwidthinSNR
inN
7
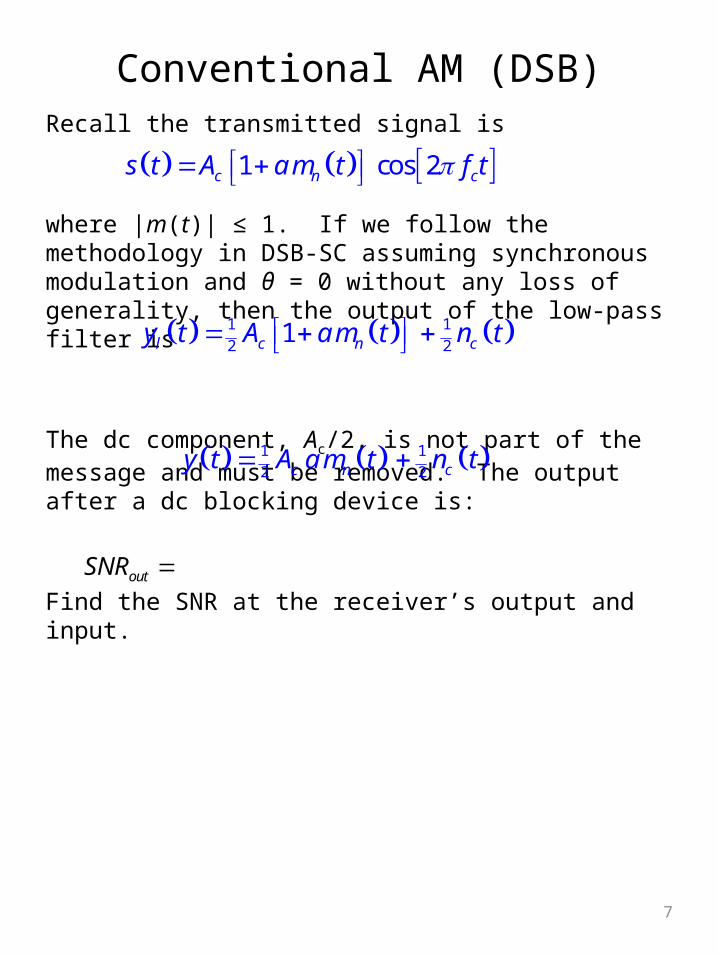
Conventional AM (DSB)Recall the transmitted signal is
where |m(t)| ≤ 1. If we follow the methodology in DSB-SC assuming synchronous modulation and θ = 0 without any loss of generality, then the output of the low-pass filter is
The dc component, Ac/2, is not part of the message and must be removed. The output after a dc blocking device is:
Find the SNR at the receiver’s output and input.
1 cos 2c n cs t A a m t f t
1 1
2 21l c n cy t A a m t n t
1 1
2 2c n cy t A a m t n t
outSNR
8
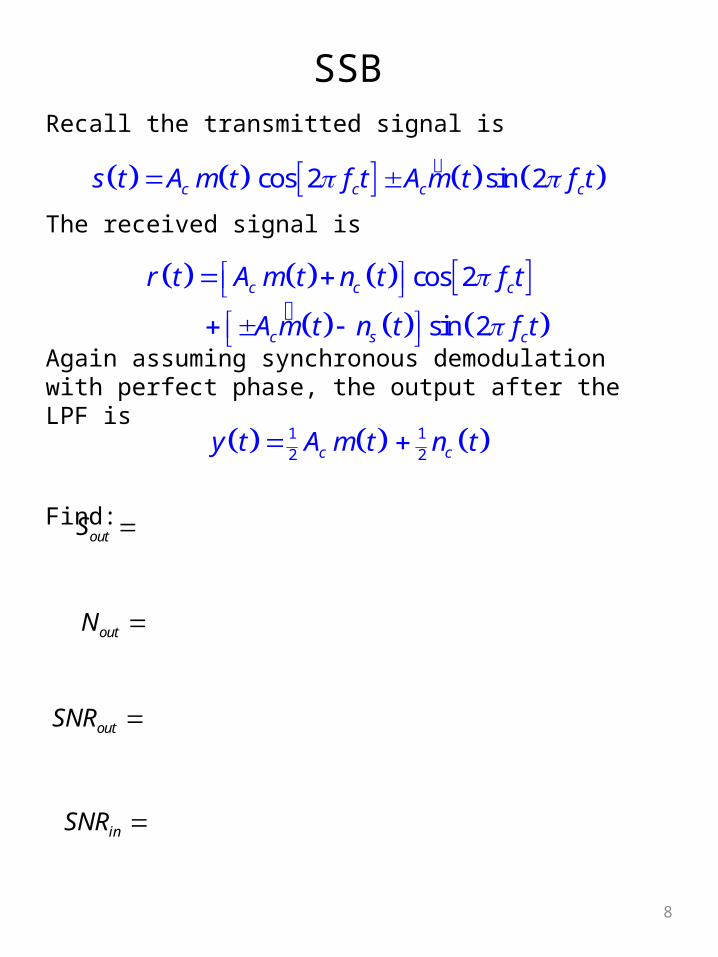
SSB Recall the transmitted signal is
The received signal is
Again assuming synchronous demodulation with perfect phase, the output after the LPF is
Find:
cos 2 sin 2c c c cs t A m t f t A m t f t
1 1
2 2c cy t A m t n t
outS
cos 2
sin 2
c c c
c s c
r t A m t n t f t
A m t n t f t
outN
outSNR
inSNR
9
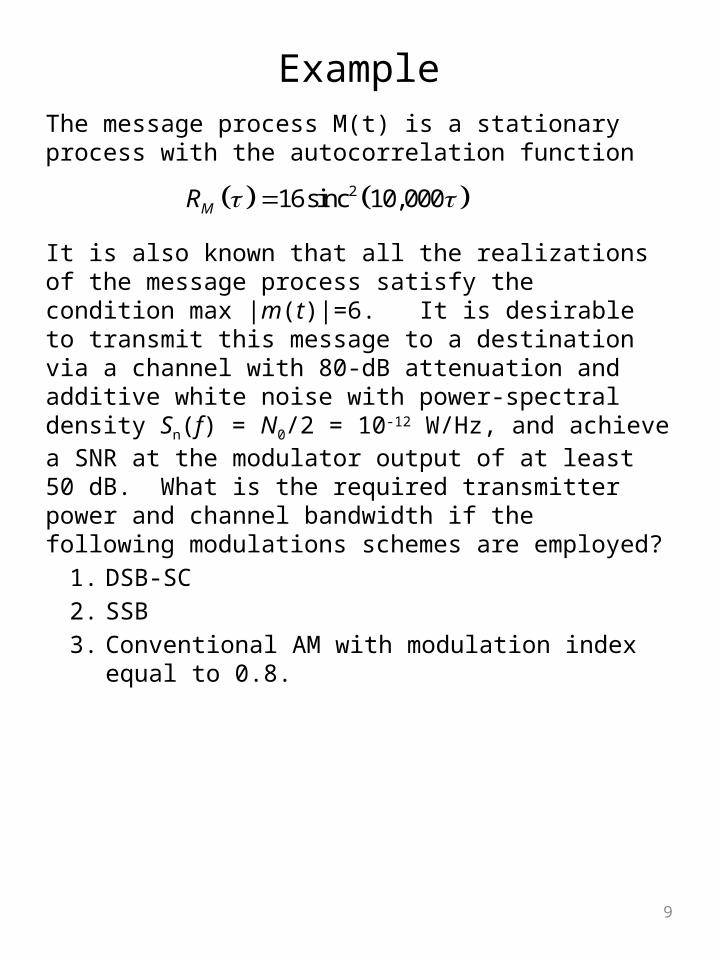
ExampleThe message process M(t) is a stationary process with the autocorrelation function
It is also known that all the realizations of the message process satisfy the condition max |m(t)|=6. It is desirable to transmit this message to a destination via a channel with 80-dB attenuation and additive white noise with power-spectral density Sn(f) = N0/2 = 10-12 W/Hz, and achieve a SNR at the modulator output of at least 50 dB. What is the required transmitter power and channel bandwidth if the following modulations schemes are employed?
1. DSB-SC2. SSB3. Conventional AM with modulation index equal to 0.8.
216sinc 10,000MR
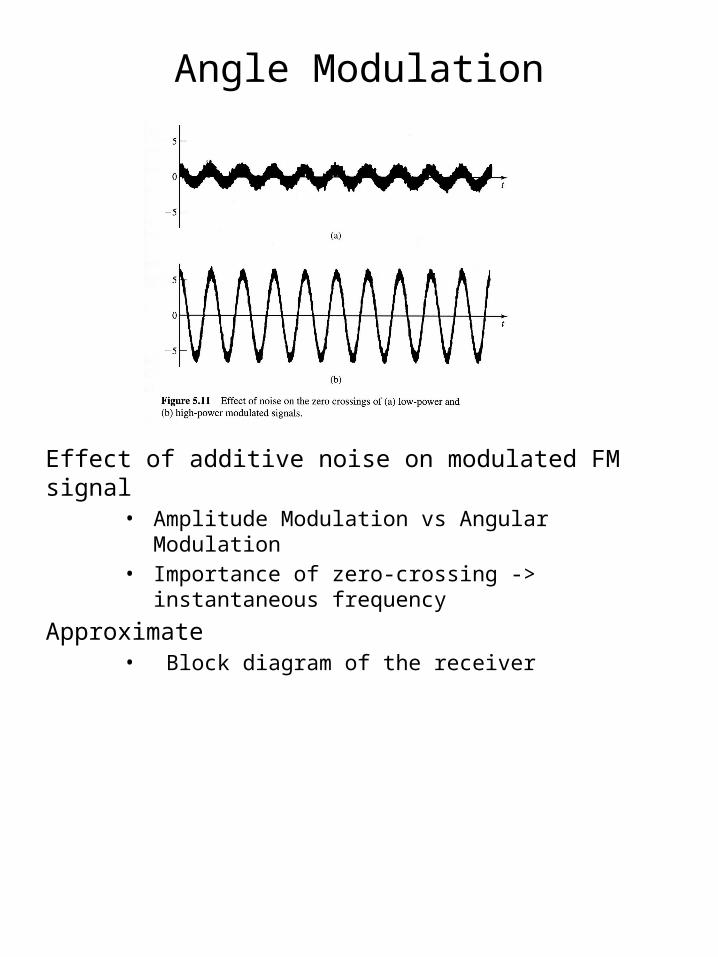
Angle Modulation
Effect of additive noise on modulated FM signal• Amplitude Modulation vs Angular Modulation• Importance of zero-crossing -> instantaneous frequency
Approximate• Block diagram of the receiver
11
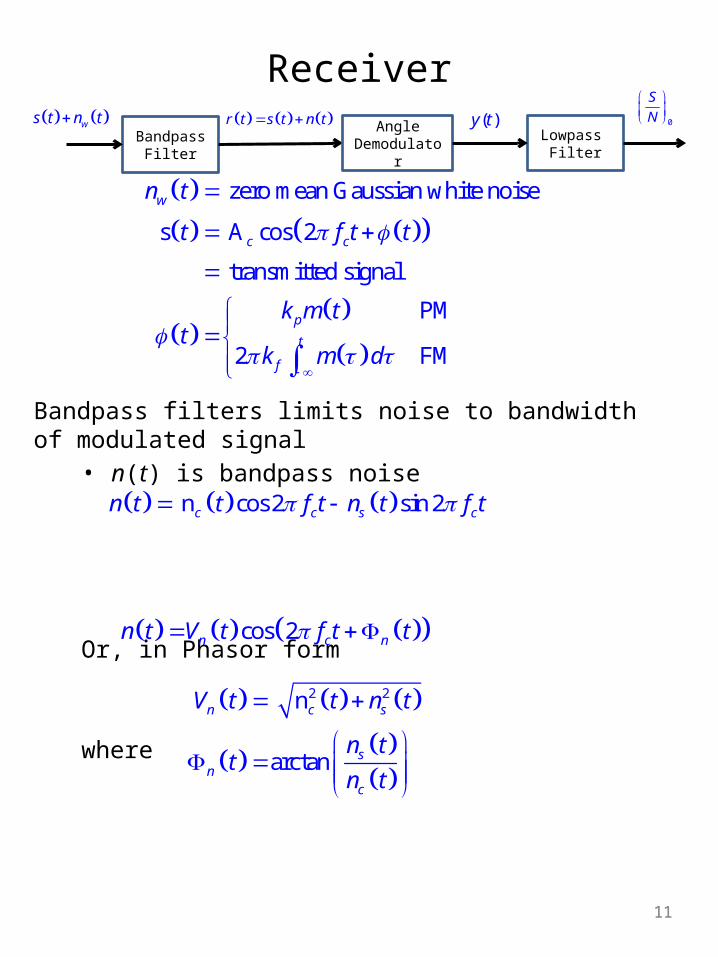
Receiver
Bandpass filters limits noise to bandwidth of modulated signal• n(t) is bandpass noise
Or, in Phasor form
where
11
Bandpass Filter
r t s t n t ( )y tAngle
DemodulatorLowpass
Filter
ws t n t 0
S
N
zero mean Gaussian white noise
s A cos 2
transmitted signal
PM
2 FM
w
c c
p
t
f
n t
t f t t
k m tt
k m d
n cos 2 sin 2c c s cn t t f t n t f t
2 2 n
arctan
n c s
sn
c
V t t n t
n tt
n t
cos 2n c nn t V t f t t
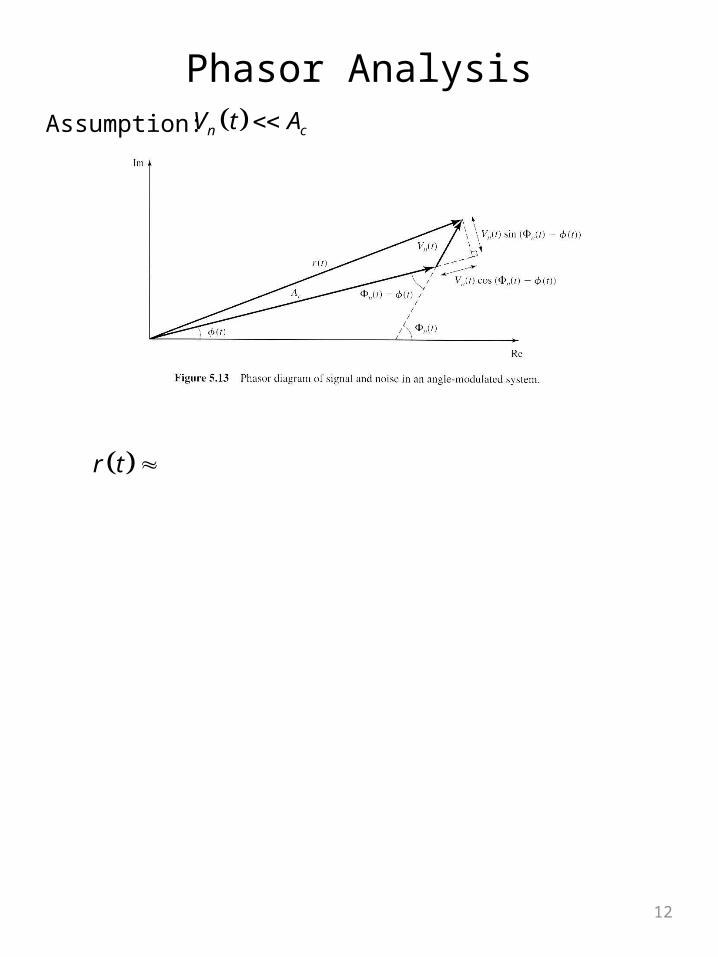
12
Phasor AnalysisAssumption: n cV t A
r t
13
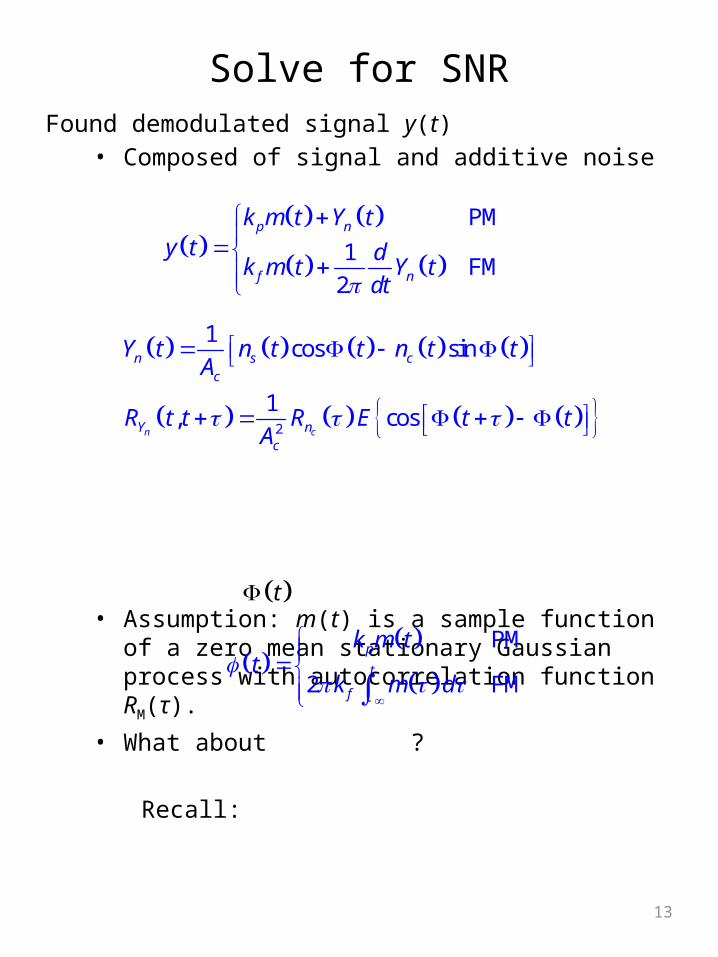
Solve for SNRFound demodulated signal y(t)
• Composed of signal and additive noise
• Assumption: m(t) is a sample function of a zero mean stationary Gaussian process with autocorrelation function RM(τ).
• What about ?
Recall:
PM
1FM
2
p n
f n
k m t Y ty t d
k m t Y tdt
2
1cos sin
1, cos
n c
n s cc
Y nc
Y t n t t n t tA
R t t R E t tA
t
PM
2 FM
p
t
f
k m tt
k m d
14
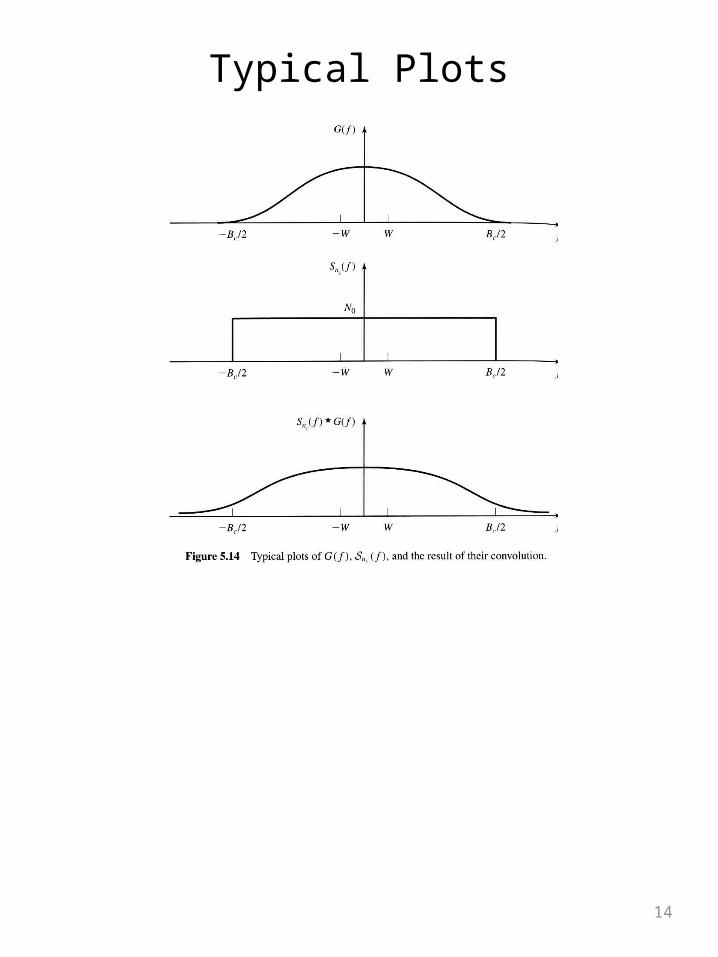
Typical Plots
15
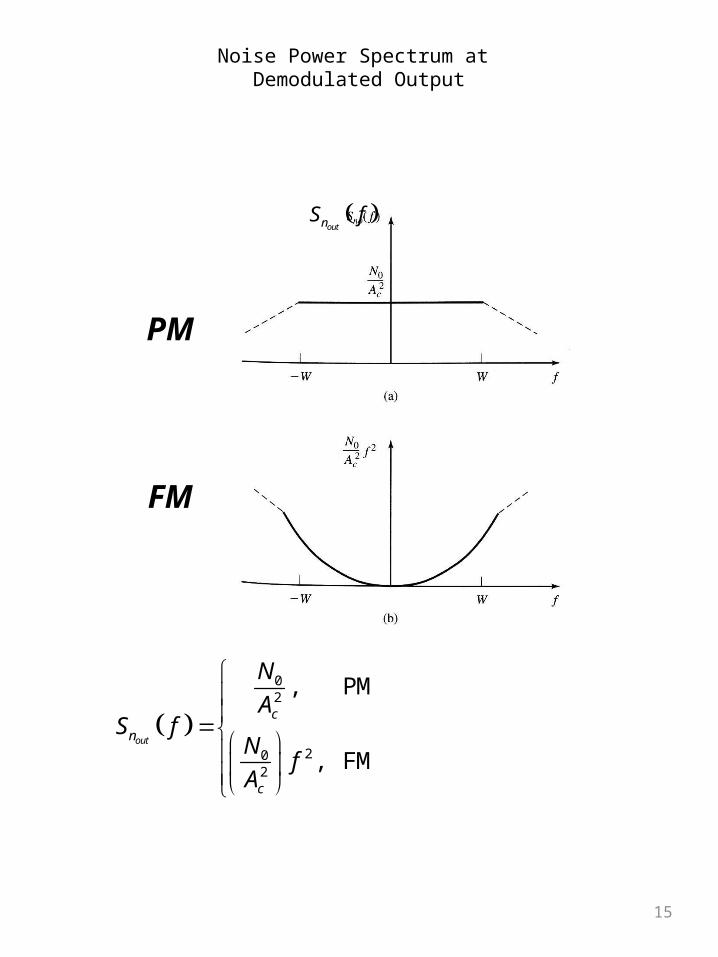
Noise Power Spectrum at Demodulated Output
PM
FM
outnS f
02
202
, PM
, FMout
c
n
c
N
AS f
Nf
A
16
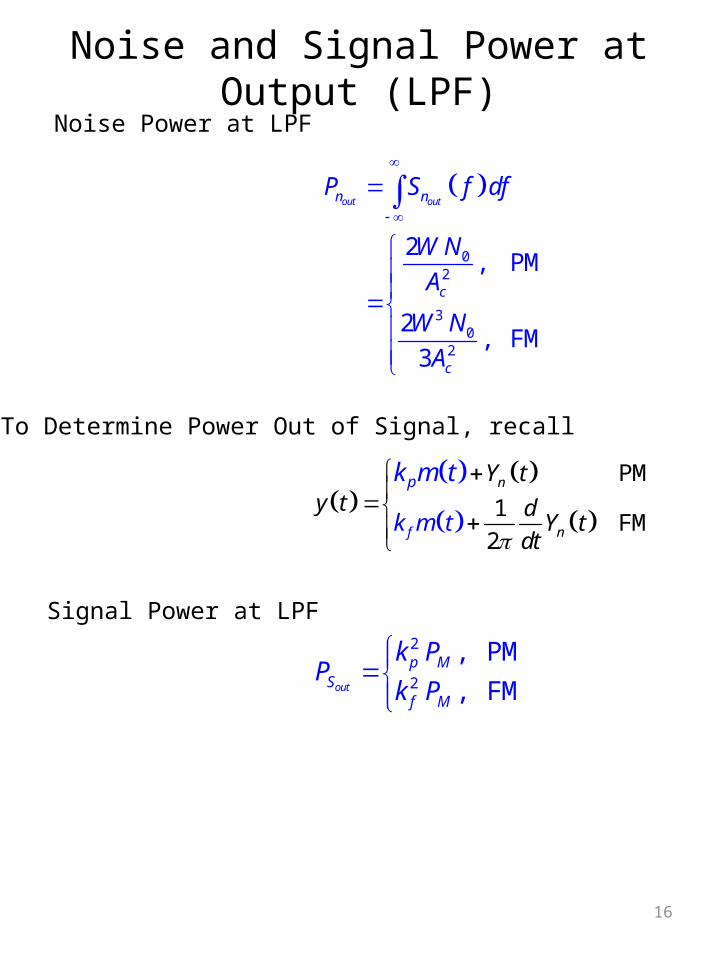
Noise and Signal Power at Output (LPF)
02
30
2
2, PM
2, FM
3
out outn n
c
c
P S f df
W N
A
W N
A
PM
1FM
2
n
f n
p
k m
Y ty t d
Yt tdt
k m t
Noise Power at LPF
To Determine Power Out of Signal, recall
2
2
, PM
, FMout
p MS
f M
k PP
k P
Signal Power at LPF
17
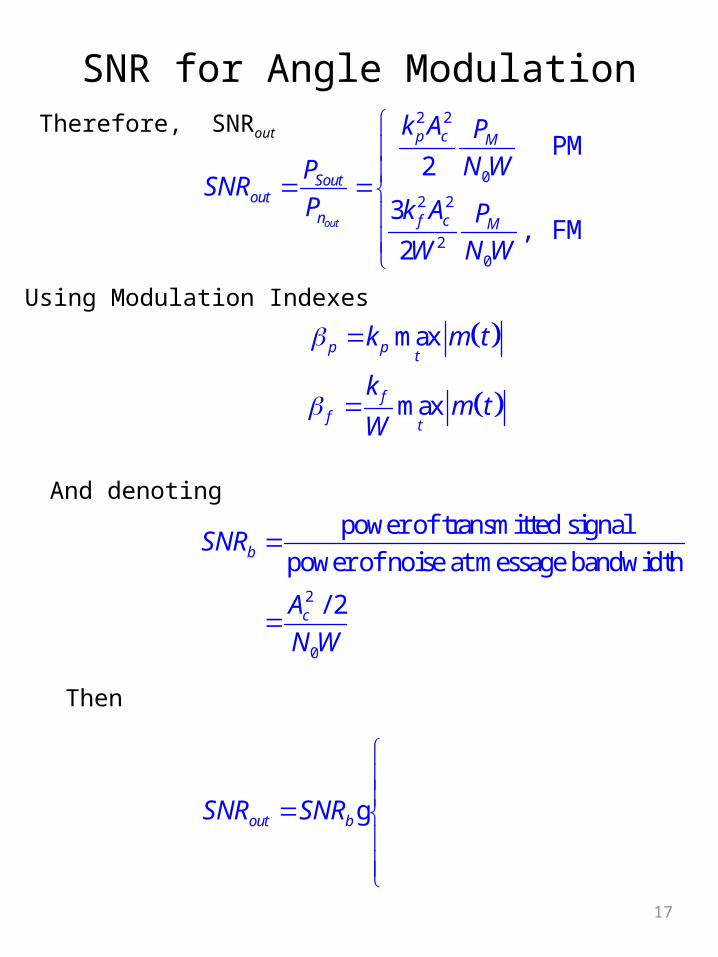
SNR for Angle ModulationTherefore, SNRout
2 2
0
2 2
20
PM2
3, FM
2out
p c M
Soutout
n f c M
k A P
N WPSNR
P k A P
W N W
Using Modulation Indexes
max
max
p pt
ff
t
k m t
km t
W
2
0
power of transmitted signal
power of noise at message bandwidth
/ 2
b
c
SNR
A
N W
And denoting
Then
out bSNR SNR
g
18
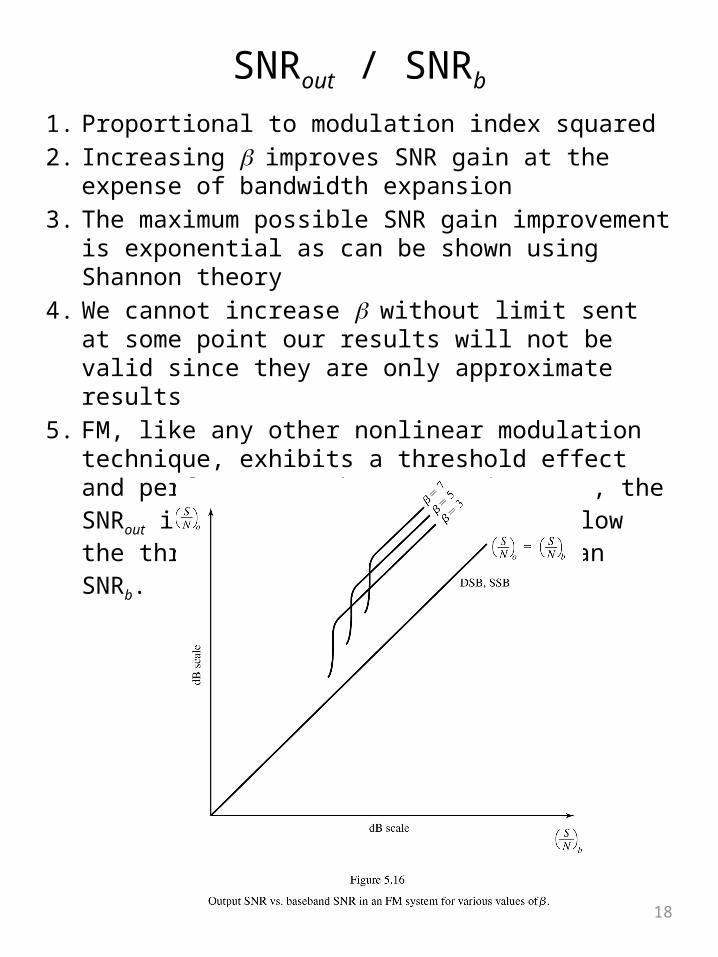
SNRout / SNRb
1. Proportional to modulation index squared2. Increasing improves SNR gain at the expense of bandwidth
expansion3. The maximum possible SNR gain improvement is exponential
as can be shown using Shannon theory4. We cannot increase without limit sent at some point our
results will not be valid since they are only approximate results
5. FM, like any other nonlinear modulation technique, exhibits a threshold effect and performance. Above certain SNRb , the SNRout is proportional to 2 SNRb . Below the threshold, SNRout maybe worse than SNRb.
19
SNRout / SNRb
6. In AM, increasing Ac increases SNRout since the received message is proportional to Ac. Here, increasing Ac also increases SNRout but through a different mechanism. Here increasing Ac reduces the amount of noise that affects the message signal.
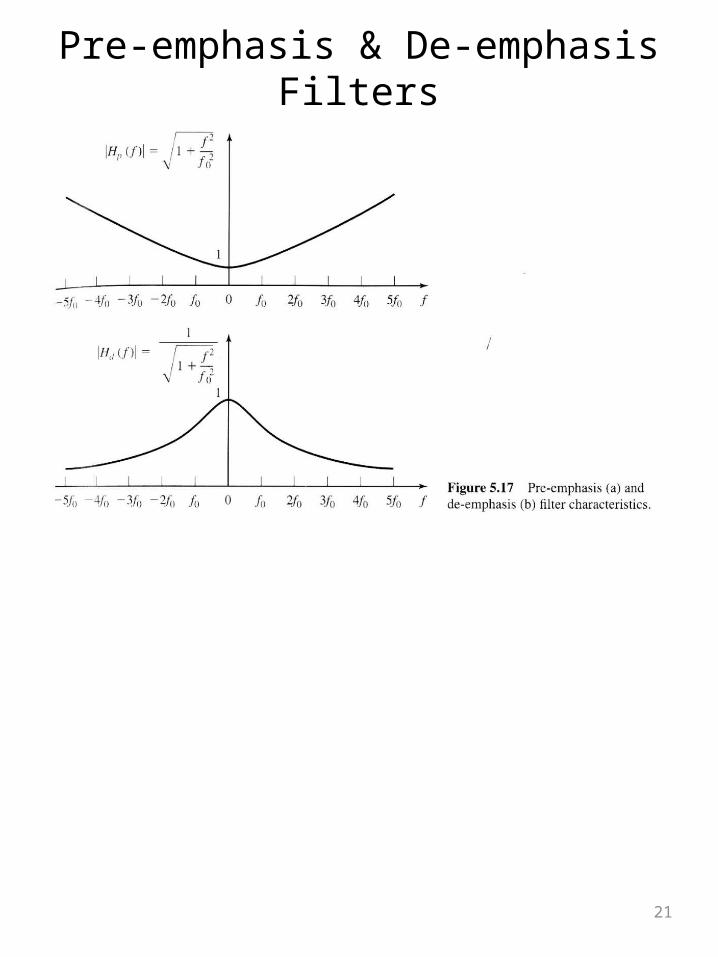
7. To compensate for the high noise PSD at high frequencies and FM, the PSD of the signal is pre-emphasized in the transmitter to increase its immunity to noise at high frequencies and it is then the emphasized at the receivers output.
8. It can be shown that at threshold, we have for FM systems
Given the received power of the modulated signal, this relation gives us the max which ensures that the system works above threshold. Another restricting factor results from Carlson’s rule
Then, give and receive power and channel bandwidth
20 1bSNR
2 1cB W
min , 120 2
b cSNR B
W
20
ExampleConsider an FM broadcast system with parameter and Assuming find the output SNR and calculate the improvement (in dB) over the baseband system.
375 10 ,fk 12 ,MP 15 kHz.W
21
Pre-emphasis & De-emphasis Filters