How Price Signals in Pulses are Transmitted across Regions...
12
Agricultural Economics Research Review Vol. 29 (Conference Number) 2016 pp 75-86 DOI: 10.5958/0974-0279.2016.00035.5 How Price Signals in Pulses are Transmitted across Regions and Value Chain? Examining Horizontal and Vertical Market Price Integration for Major Pulses in India Ranjit Kumar Paul a *, Raka Saxena b and Showkat A. Bhat a a ICAR- Indian Agricultural Statistics Research Institute, New Delhi - 110 012 b ICAR- National Institute of Agricultural Economics and Policy Research, New Delhi - 110 012 Abstract The paper has applied time series model to investigate the wholesale and retail price market integration of major pulses (tur, gram, moong, urad, masoor) in five major regions namely north zone (NZ), south zone (SZ), east zone (EZ), west zone (WZ) and north east zone (NEZ) in the country based on their volume of production. The study has shown that there exists a strong cointegration among the wholesale as well as retail prices of these major pulses, although the cointegration varies. In addition to the horizontal cointegration, the vertical cointegration between the wholesale and retail prices of different pulses has also been investigated. Different causal relationships have been found between wholesale and retail prices in these five zones. The application of vector error correction model (VECM) has indicated that all the error correction terms (ECTs) are negative and most of these terms are statistically significant, implying that the system once in dis-equilibrium tries to come back to the equilibrium situation. The study has also used Impulse response analysis which shows that change in wholesale prices of these five pulses in one zone will cause change in wholesale prices in other zones. The paper has concluded that price signals are transmitted across regions indicating that price changes in one zone are consistently related to price changes in other zones and are able to influence the prices in other zones. However, the direction and intensity of price changes may be affected by the dynamic linkages between the demand and supply of pulses. The study has provided an interesting insight for policy makers, and for contributing to improve the information precision to predict the price movements used by marketing operators for their strategies and by policy makers for designing the suitable marketing strategies to bring more efficiency across the markets. Key words: Cointegration, error correction model, Granger causality, impulse response, pulses, stationarity JEL Classification: Q13 Introduction In India, the area under pulses is 22-23 million hectares which is 33 per cent of total world area under pulses. During the past few years, the production of pulses has shown an increasing trend, it has increased from 15.77 million tonnes (Mt) in 2010-11 to 17.34 Mt in 2012-13 and further to an all-time high of 19.78 Mt in 2013-14, but declined to 17.38 Mt in 2014-15. In India, the most important pulse crops grown are chickpea (41% of total pulses area), pigeon pea (15%), urd bean (10%), mung bean (9%), cowpea (7%), lentil (5%) and field pea (5%). Across the states, the highest share of pulses came from Madhya Pradesh (27.8 % of total pulse production), followed by Rajasthan (13.7%), Uttar Pradesh (9.13%), Maharashtra (8.6%), Andhra Pradesh (7.18%), Karnataka (7.2%), Chhattisgarh (3.17%) and Jharkhand (3.01%) in 2015- * Author for correspondence Email: [email protected]
Transcript of How Price Signals in Pulses are Transmitted across Regions...
Agricultural Economics Research ReviewVol. 29 (Conference Number) 2016 pp 75-86DOI: 10.5958/0974-0279.2016.00035.5
How Price Signals in Pulses are Transmitted across Regions andValue Chain? Examining Horizontal and Vertical Market Price
Integration for Major Pulses in India
Ranjit Kumar Paula*, Raka Saxenab and Showkat A. Bhata
aICAR- Indian Agricultural Statistics Research Institute, New Delhi - 110 012bICAR- National Institute of Agricultural Economics and Policy Research, New Delhi - 110 012
Abstract
The paper has applied time series model to investigate the wholesale and retail price market integrationof major pulses (tur, gram, moong, urad, masoor) in five major regions namely north zone (NZ), southzone (SZ), east zone (EZ), west zone (WZ) and north east zone (NEZ) in the country based on theirvolume of production. The study has shown that there exists a strong cointegration among the wholesaleas well as retail prices of these major pulses, although the cointegration varies. In addition to the horizontalcointegration, the vertical cointegration between the wholesale and retail prices of different pulses hasalso been investigated. Different causal relationships have been found between wholesale and retailprices in these five zones. The application of vector error correction model (VECM) has indicated that allthe error correction terms (ECTs) are negative and most of these terms are statistically significant, implyingthat the system once in dis-equilibrium tries to come back to the equilibrium situation. The study has alsoused Impulse response analysis which shows that change in wholesale prices of these five pulses in onezone will cause change in wholesale prices in other zones. The paper has concluded that price signals aretransmitted across regions indicating that price changes in one zone are consistently related to pricechanges in other zones and are able to influence the prices in other zones. However, the direction andintensity of price changes may be affected by the dynamic linkages between the demand and supply ofpulses. The study has provided an interesting insight for policy makers, and for contributing to improvethe information precision to predict the price movements used by marketing operators for their strategiesand by policy makers for designing the suitable marketing strategies to bring more efficiency across themarkets.
Key words: Cointegration, error correction model, Granger causality, impulse response, pulses, stationarity
JEL Classification: Q13
IntroductionIn India, the area under pulses is 22-23 million
hectares which is 33 per cent of total world area underpulses. During the past few years, the production ofpulses has shown an increasing trend, it has increasedfrom 15.77 million tonnes (Mt) in 2010-11 to 17.34Mt in 2012-13 and further to an all-time high of 19.78
Mt in 2013-14, but declined to 17.38 Mt in 2014-15.In India, the most important pulse crops grown arechickpea (41% of total pulses area), pigeon pea (15%),urd bean (10%), mung bean (9%), cowpea (7%), lentil(5%) and field pea (5%). Across the states, the highestshare of pulses came from Madhya Pradesh (27.8 %of total pulse production), followed by Rajasthan(13.7%), Uttar Pradesh (9.13%), Maharashtra (8.6%),Andhra Pradesh (7.18%), Karnataka (7.2%),Chhattisgarh (3.17%) and Jharkhand (3.01%) in 2015-
*Author for correspondenceEmail: [email protected]
76 Agricultural Economics Research Review Vol. 29 (Conference Number) 2016
16. These states together shared about 80 per cent ofthe total national pulse production. But this increasehas failed to keep pace with the rising consumptiondemand. India produces 25 per cent of globalproduction but the consumption rate is 27 per cent ofglobal consumption (Mohanty and Satyasai, 2015). Theproduction-consumption trend in the previous decadeshowed a shortage of 2-3 Mt of pulses annually on anaverage. Pulses import has increased significantly overthe past decade, quantity imported increased from 0.10Mt in 2000 to 3.9 Mt in 2013-14 (Directorate ofEconomics and Statistics, Department of Agricultureand Cooperation, 2014-15). The country is the world’slargest importer of pulses today. The market price ofdifferent pulses necessarily influences the demand forpulses with varying intensity.
It has been argued that market reforms are requiredfor achieving efficient agricultural markets and hencean efficient agricultural production system. Untilagricultural markets are integrated, producers andconsumers will not be able to realize the potential gainsfrom the common market.
The pulse crops are environment-friendly andimprove soil health, besides complementing cereals inboth production and consumption. As far as nutritionis concerned, pulses are relatively cheaper source ofprotein (Joshi and Saxena, 2002). Pulses will form amajor source of protein for a huge section of India,particularly for the poor, backward classes and mostof the traditionally vegetarian population (Reddy,2004). In this regard, the prices of pulses play a veryimportant role. As the markets are becoming integrated,the price signals are transmitted across locations andinfluence prices at other locations. The pricemechanism or marketing process of pulses fromproducer’s level to consumer’s level involves wholesalemarket prices and retail market prices. The marketintegration of pulses has become important due to theinterdependence of wholesale and retail markets.
Another important feature is the production-consumption gap which has resulted in a rise in pulseprices, thereby pushing pulses out of the reach of poorhousehold, leading to a negative effect on theirnutritional status (Reddy, 2004). Market integration isan important component to ensure remunerative pricesto the farmers which will eventually work as anincentive for them to bring more area under pulses.Therefore, the present paper has examined the
movement of prices of pulses in spatially separatedmarkets in the country and the transmission of pricesignals and information across these markets.
The market integration can be measured in termsof strength and speed of price transmission betweenmarkets across various regions of a country (Ghafooret al., 2009). The degree, to which consumers andproducers can benefit, depends on how domesticmarkets are integrated with world markets and howthe different regional markets are integrated with eachother (Varela et al., 2012).
Although, several empirical studies have been doneusing cointegration techniques which concern themarket integration of agricultural commodities in India(Reddy et al., 2012; Bhardwaj et al., 2015; Wani etal., 2015a; 2015b; 2015c; Saxena et al., 2015; Paul etal., 2015; Paul and Sinha, 2015), a little work has beencarried out on empirically evaluating pulses marketintegration in India. Also all these studies have beenconcentrated in finding integration in price of acommodity in different markets, but it is equallyimportant to see market integration between wholesaleand retail prices of the commodity, i.e. verticaltransmission of information. This study is an attemptto investigate
• Whether the prices of major pulses in differentzones of India are co-integrated and influencedby each other?
• What kind of price linkages exist across two stagesof pulses value chain, viz. wholesaling andretailing?
• What is the likely influence of changes in pricesat one location/stage of value chain on the otherlocation/stage of value chain?
Data and MethodologyThe study selected five major pulses (tur, gram,
moong, urad and masoor) and five major regions —north zone (NZ), south zone (SZ), east zone (EZ), westzone (WZ) and north-east zone (NEZ) in the countrybased on the volume of pulses production. Monthlydata on retail and wholesale prices of these pulses forthe period January, 2009 to July, 2016 (total 91observations) were collected from the Department ofConsumer Affairs, Government of India. TheDepartment monitors the prices of essentialcommodities based on data collected from 75 marketcentres spread across the country.
Paul et al. : How Price Signals in Pulses are Transmitted across Regions and Value Chain? 77
The study has used different statistical methods,namely testing stationarity, concept of cointegration,testing for rank of cointegration, vector error correctionmodel (VECM), Granger causality testing and impulseresponse function. These techniques allow one toquantify the degree of interconnectedness between themarkets. For testing the stationarity of time series data,the tests, namely Augmented Dickey-Fuller (ADF) test(Dickey and Fuller, 1979) and Phillips-Perron UnitRoot test (Philips and Perron, 1988) have been applied.The statistical techniques which were used in thepresent investigation are described below in brief.
Johansen Approach
Johansen (1988) multivariate cointegrationapproach was used to examine cointegration amongprice series. When the data are non-stationary purelydue to unit roots (integrated once, denoted by I(1)),they could be brought back to stationarity bydifferencing. If a series must be differenced d-timesbefore it becomes stationary, then it contains ‘d’ unitroots and is said to be integrated of order d, denotedby I(d). Let yt be and n×1 set of I(1) variables. Ingeneral, any linear combination αααααi′yt will also be I(1)for arbitrary a≠0. However, suppose there exists ann×1 vector αααααi such that αααααi′yt, then it is said that thevariables in yt are cointegrated of order one, denotedCI(1) and αααααi is a cointegrating vector. It is to bementioned that if αααααi is a cointegrating vectors then sois the kαααααi for any k≠0 since kαααααi′yt ~ I(0).
There can be r different cointegrating vectors,where 0 ≤ r < n, i.e. r must be less than the number ofvariables n. In such a case, we can distinguish betweenlong-run relationships between the variables containedin yt, that is, the manner in which the variables driftupward together, and the short-run dynamics, that isthe relationship between deviations of each variablefrom their corresponding long-run trend.
Granger Causality Tests
Granger causality provides additional evidence asto whether and in which direction price transmissionhas occurred between two series (Granger, 1980; 1988).Historically, Granger (1969) and Sims (1972) were theones who formalized the application of causality ineconomics. We investigate the Granger causality testsby fitting VAR and VECM models for our data seriesin order to identify the direction of causality amongthe prices.
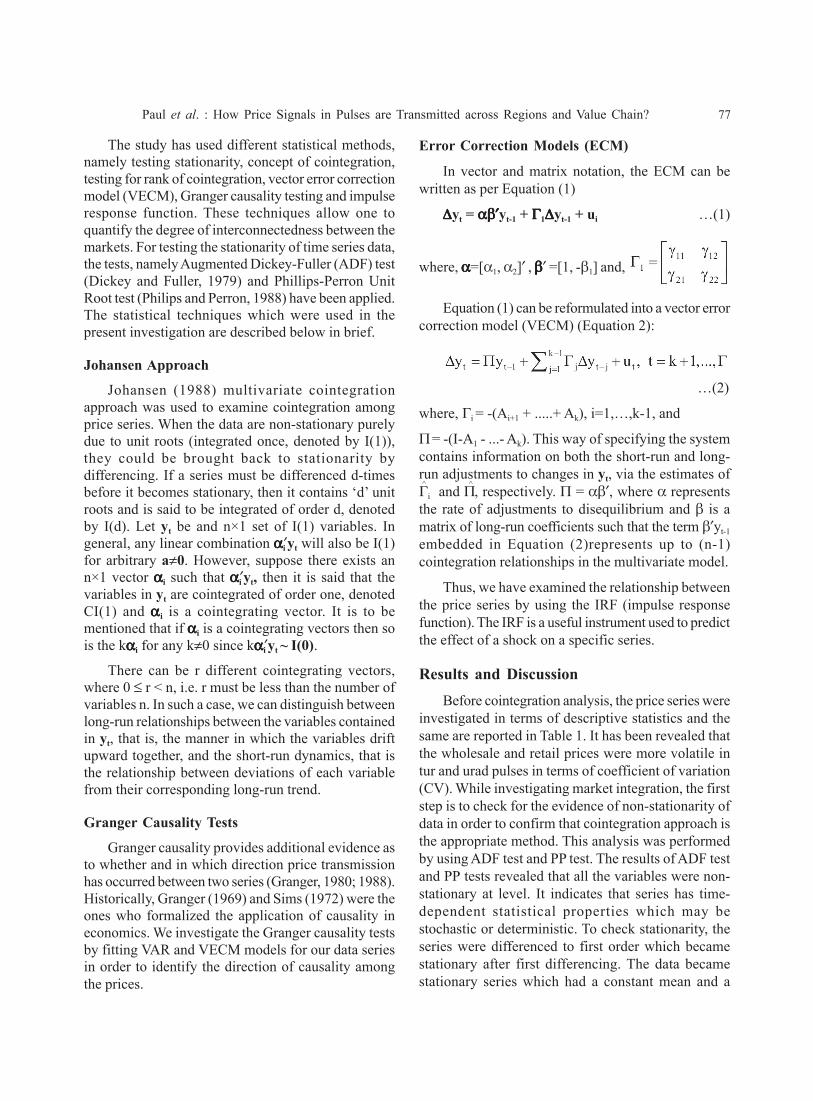
Error Correction Models (ECM)
In vector and matrix notation, the ECM can bewritten as per Equation (1)
∆∆∆∆∆yt = αβ′αβ′αβ′αβ′αβ′yt-1 + ΓΓΓΓΓ1∆∆∆∆∆yt-1 + ui …(1)
where, ααααα=[α1, α2]′ , βββββ′ =[1, -β1] and,
Equation (1) can be reformulated into a vector errorcorrection model (VECM) (Equation 2):
…(2)
where, Γi = -(Ai+1 + .....+ Ak), i=1,…,k-1, and
Π = -(I-A1 - ...- Ak). This way of specifying the systemcontains information on both the short-run and long-run adjustments to changes in yt, via the estimates ofΓ^
i and Π^ , respectively. Π = αβ′, where α representsthe rate of adjustments to disequilibrium and β is amatrix of long-run coefficients such that the term β′yt-1
embedded in Equation (2)represents up to (n-1)cointegration relationships in the multivariate model.
Thus, we have examined the relationship betweenthe price series by using the IRF (impulse responsefunction). The IRF is a useful instrument used to predictthe effect of a shock on a specific series.
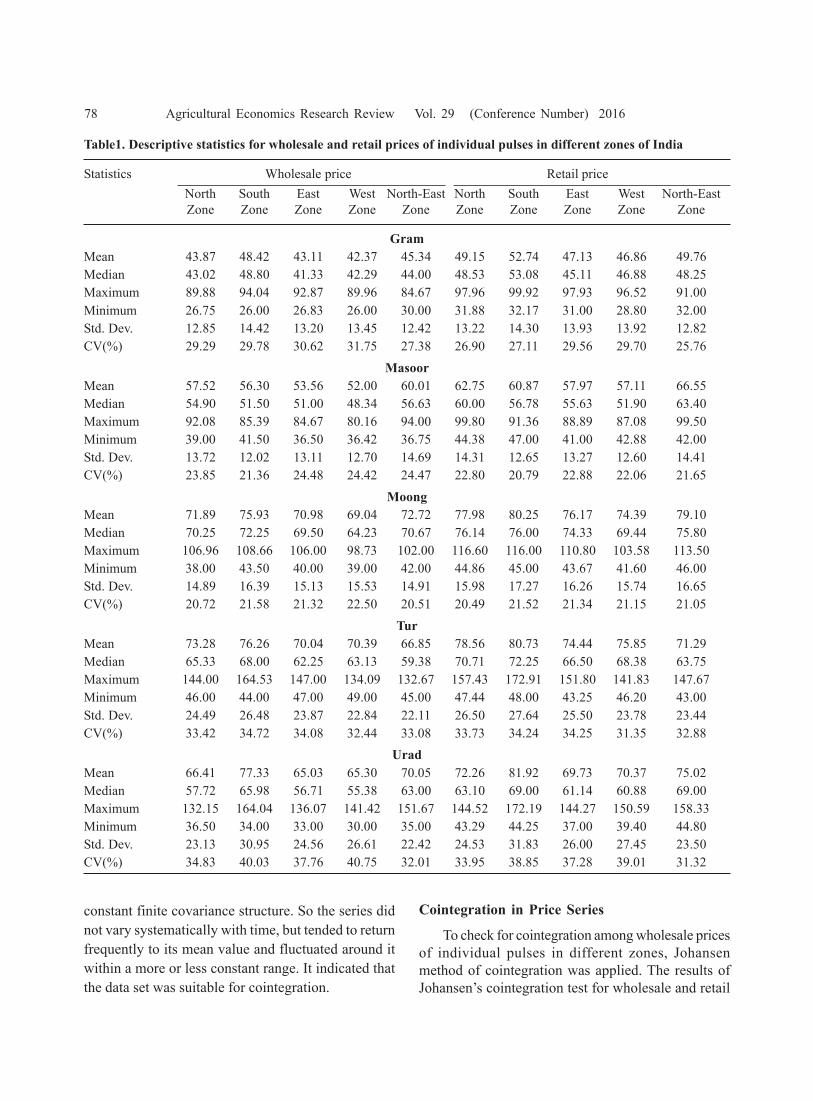
Results and DiscussionBefore cointegration analysis, the price series were
investigated in terms of descriptive statistics and thesame are reported in Table 1. It has been revealed thatthe wholesale and retail prices were more volatile intur and urad pulses in terms of coefficient of variation(CV). While investigating market integration, the firststep is to check for the evidence of non-stationarity ofdata in order to confirm that cointegration approach isthe appropriate method. This analysis was performedby using ADF test and PP test. The results of ADF testand PP tests revealed that all the variables were non-stationary at level. It indicates that series has time-dependent statistical properties which may bestochastic or deterministic. To check stationarity, theseries were differenced to first order which becamestationary after first differencing. The data becamestationary series which had a constant mean and a
78 Agricultural Economics Research Review Vol. 29 (Conference Number) 2016
Table1. Descriptive statistics for wholesale and retail prices of individual pulses in different zones of India
Statistics Wholesale price Retail priceNorth South East West North-East North South East West North-EastZone Zone Zone Zone Zone Zone Zone Zone Zone Zone
GramMean 43.87 48.42 43.11 42.37 45.34 49.15 52.74 47.13 46.86 49.76Median 43.02 48.80 41.33 42.29 44.00 48.53 53.08 45.11 46.88 48.25Maximum 89.88 94.04 92.87 89.96 84.67 97.96 99.92 97.93 96.52 91.00Minimum 26.75 26.00 26.83 26.00 30.00 31.88 32.17 31.00 28.80 32.00Std. Dev. 12.85 14.42 13.20 13.45 12.42 13.22 14.30 13.93 13.92 12.82CV(%) 29.29 29.78 30.62 31.75 27.38 26.90 27.11 29.56 29.70 25.76
MasoorMean 57.52 56.30 53.56 52.00 60.01 62.75 60.87 57.97 57.11 66.55Median 54.90 51.50 51.00 48.34 56.63 60.00 56.78 55.63 51.90 63.40Maximum 92.08 85.39 84.67 80.16 94.00 99.80 91.36 88.89 87.08 99.50Minimum 39.00 41.50 36.50 36.42 36.75 44.38 47.00 41.00 42.88 42.00Std. Dev. 13.72 12.02 13.11 12.70 14.69 14.31 12.65 13.27 12.60 14.41CV(%) 23.85 21.36 24.48 24.42 24.47 22.80 20.79 22.88 22.06 21.65
MoongMean 71.89 75.93 70.98 69.04 72.72 77.98 80.25 76.17 74.39 79.10Median 70.25 72.25 69.50 64.23 70.67 76.14 76.00 74.33 69.44 75.80Maximum 106.96 108.66 106.00 98.73 102.00 116.60 116.00 110.80 103.58 113.50Minimum 38.00 43.50 40.00 39.00 42.00 44.86 45.00 43.67 41.60 46.00Std. Dev. 14.89 16.39 15.13 15.53 14.91 15.98 17.27 16.26 15.74 16.65CV(%) 20.72 21.58 21.32 22.50 20.51 20.49 21.52 21.34 21.15 21.05
TurMean 73.28 76.26 70.04 70.39 66.85 78.56 80.73 74.44 75.85 71.29Median 65.33 68.00 62.25 63.13 59.38 70.71 72.25 66.50 68.38 63.75Maximum 144.00 164.53 147.00 134.09 132.67 157.43 172.91 151.80 141.83 147.67Minimum 46.00 44.00 47.00 49.00 45.00 47.44 48.00 43.25 46.20 43.00Std. Dev. 24.49 26.48 23.87 22.84 22.11 26.50 27.64 25.50 23.78 23.44CV(%) 33.42 34.72 34.08 32.44 33.08 33.73 34.24 34.25 31.35 32.88
UradMean 66.41 77.33 65.03 65.30 70.05 72.26 81.92 69.73 70.37 75.02Median 57.72 65.98 56.71 55.38 63.00 63.10 69.00 61.14 60.88 69.00Maximum 132.15 164.04 136.07 141.42 151.67 144.52 172.19 144.27 150.59 158.33Minimum 36.50 34.00 33.00 30.00 35.00 43.29 44.25 37.00 39.40 44.80Std. Dev. 23.13 30.95 24.56 26.61 22.42 24.53 31.83 26.00 27.45 23.50CV(%) 34.83 40.03 37.76 40.75 32.01 33.95 38.85 37.28 39.01 31.32
constant finite covariance structure. So the series didnot vary systematically with time, but tended to returnfrequently to its mean value and fluctuated around itwithin a more or less constant range. It indicated thatthe data set was suitable for cointegration.
Cointegration in Price Series
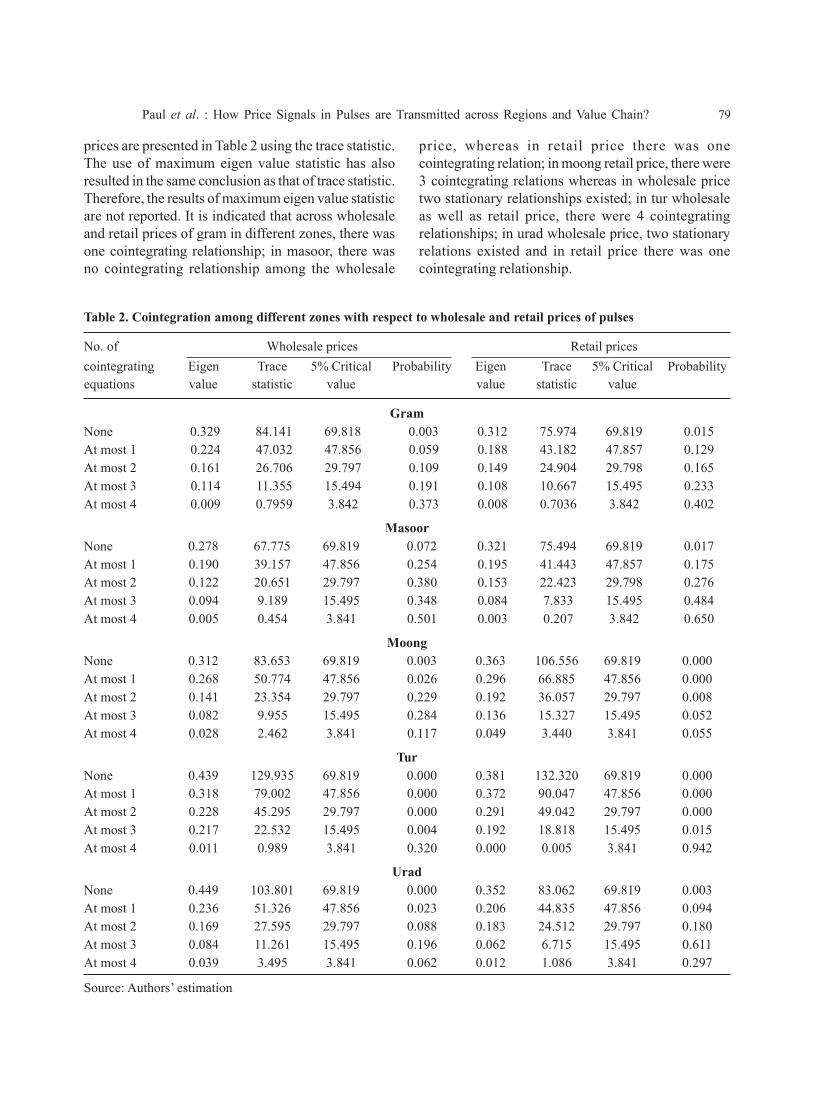
To check for cointegration among wholesale pricesof individual pulses in different zones, Johansenmethod of cointegration was applied. The results ofJohansen’s cointegration test for wholesale and retail
Paul et al. : How Price Signals in Pulses are Transmitted across Regions and Value Chain? 79
prices are presented in Table 2 using the trace statistic.The use of maximum eigen value statistic has alsoresulted in the same conclusion as that of trace statistic.Therefore, the results of maximum eigen value statisticare not reported. It is indicated that across wholesaleand retail prices of gram in different zones, there wasone cointegrating relationship; in masoor, there wasno cointegrating relationship among the wholesale
price, whereas in retail price there was onecointegrating relation; in moong retail price, there were3 cointegrating relations whereas in wholesale pricetwo stationary relationships existed; in tur wholesaleas well as retail price, there were 4 cointegratingrelationships; in urad wholesale price, two stationaryrelations existed and in retail price there was onecointegrating relationship.
Table 2. Cointegration among different zones with respect to wholesale and retail prices of pulses
No. of Wholesale prices Retail pricescointegrating Eigen Trace 5% Critical Probability Eigen Trace 5% Critical Probabilityequations value statistic value value statistic value
GramNone 0.329 84.141 69.818 0.003 0.312 75.974 69.819 0.015At most 1 0.224 47.032 47.856 0.059 0.188 43.182 47.857 0.129At most 2 0.161 26.706 29.797 0.109 0.149 24.904 29.798 0.165At most 3 0.114 11.355 15.494 0.191 0.108 10.667 15.495 0.233At most 4 0.009 0.7959 3.842 0.373 0.008 0.7036 3.842 0.402
MasoorNone 0.278 67.775 69.819 0.072 0.321 75.494 69.819 0.017At most 1 0.190 39.157 47.856 0.254 0.195 41.443 47.857 0.175At most 2 0.122 20.651 29.797 0.380 0.153 22.423 29.798 0.276At most 3 0.094 9.189 15.495 0.348 0.084 7.833 15.495 0.484At most 4 0.005 0.454 3.841 0.501 0.003 0.207 3.842 0.650
MoongNone 0.312 83.653 69.819 0.003 0.363 106.556 69.819 0.000At most 1 0.268 50.774 47.856 0.026 0.296 66.885 47.856 0.000At most 2 0.141 23.354 29.797 0.229 0.192 36.057 29.797 0.008At most 3 0.082 9.955 15.495 0.284 0.136 15.327 15.495 0.052At most 4 0.028 2.462 3.841 0.117 0.049 3.440 3.841 0.055
TurNone 0.439 129.935 69.819 0.000 0.381 132.320 69.819 0.000At most 1 0.318 79.002 47.856 0.000 0.372 90.047 47.856 0.000At most 2 0.228 45.295 29.797 0.000 0.291 49.042 29.797 0.000At most 3 0.217 22.532 15.495 0.004 0.192 18.818 15.495 0.015At most 4 0.011 0.989 3.841 0.320 0.000 0.005 3.841 0.942
UradNone 0.449 103.801 69.819 0.000 0.352 83.062 69.819 0.003At most 1 0.236 51.326 47.856 0.023 0.206 44.835 47.856 0.094At most 2 0.169 27.595 29.797 0.088 0.183 24.512 29.797 0.180At most 3 0.084 11.261 15.495 0.196 0.062 6.715 15.495 0.611At most 4 0.039 3.495 3.841 0.062 0.012 1.086 3.841 0.297
Source: Authors’ estimation
80 Agricultural Economics Research Review Vol. 29 (Conference Number) 2016
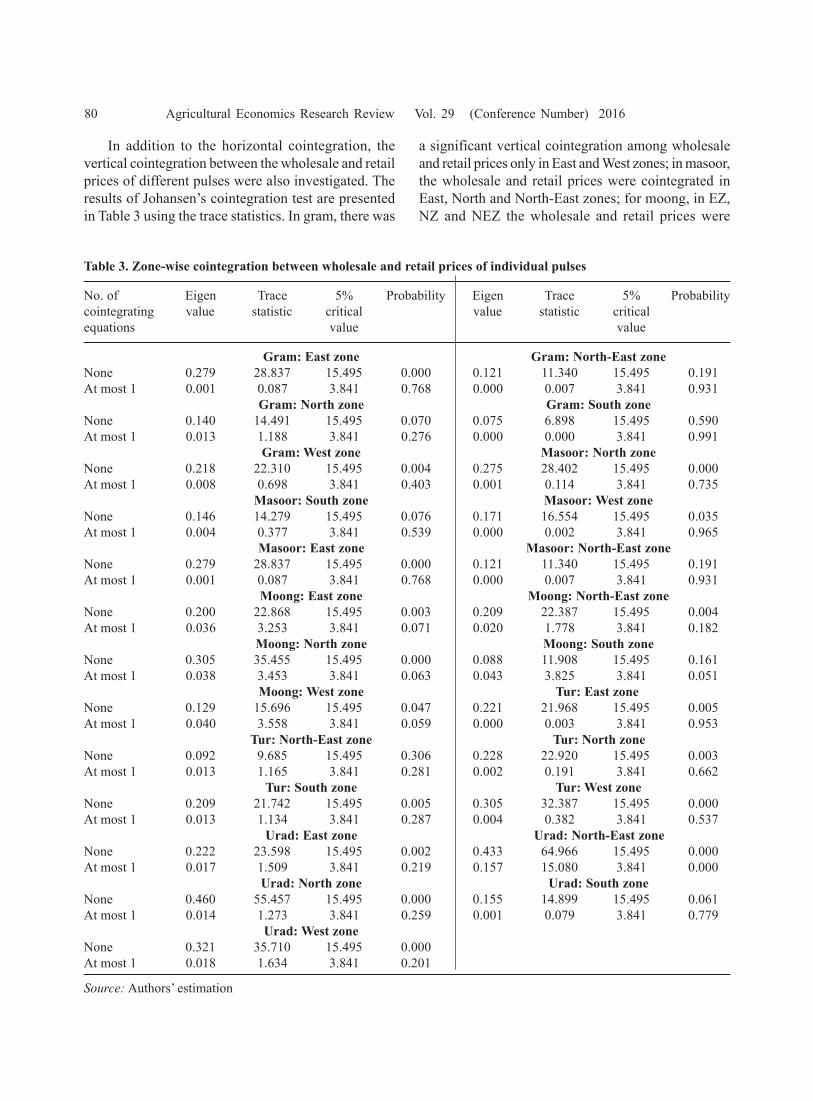
In addition to the horizontal cointegration, thevertical cointegration between the wholesale and retailprices of different pulses were also investigated. Theresults of Johansen’s cointegration test are presentedin Table 3 using the trace statistics. In gram, there was
a significant vertical cointegration among wholesaleand retail prices only in East and West zones; in masoor,the wholesale and retail prices were cointegrated inEast, North and North-East zones; for moong, in EZ,NZ and NEZ the wholesale and retail prices were
Table 3. Zone-wise cointegration between wholesale and retail prices of individual pulses
No. of Eigen Trace 5% Probability Eigen Trace 5% Probabilitycointegrating value statistic critical value statistic criticalequations value value
Gram: East zone Gram: North-East zoneNone 0.279 28.837 15.495 0.000 0.121 11.340 15.495 0.191At most 1 0.001 0.087 3.841 0.768 0.000 0.007 3.841 0.931
Gram: North zone Gram: South zoneNone 0.140 14.491 15.495 0.070 0.075 6.898 15.495 0.590At most 1 0.013 1.188 3.841 0.276 0.000 0.000 3.841 0.991
Gram: West zone Masoor: North zoneNone 0.218 22.310 15.495 0.004 0.275 28.402 15.495 0.000At most 1 0.008 0.698 3.841 0.403 0.001 0.114 3.841 0.735
Masoor: South zone Masoor: West zoneNone 0.146 14.279 15.495 0.076 0.171 16.554 15.495 0.035At most 1 0.004 0.377 3.841 0.539 0.000 0.002 3.841 0.965
Masoor: East zone Masoor: North-East zoneNone 0.279 28.837 15.495 0.000 0.121 11.340 15.495 0.191At most 1 0.001 0.087 3.841 0.768 0.000 0.007 3.841 0.931
Moong: East zone Moong: North-East zoneNone 0.200 22.868 15.495 0.003 0.209 22.387 15.495 0.004At most 1 0.036 3.253 3.841 0.071 0.020 1.778 3.841 0.182
Moong: North zone Moong: South zoneNone 0.305 35.455 15.495 0.000 0.088 11.908 15.495 0.161At most 1 0.038 3.453 3.841 0.063 0.043 3.825 3.841 0.051
Moong: West zone Tur: East zoneNone 0.129 15.696 15.495 0.047 0.221 21.968 15.495 0.005At most 1 0.040 3.558 3.841 0.059 0.000 0.003 3.841 0.953
Tur: North-East zone Tur: North zoneNone 0.092 9.685 15.495 0.306 0.228 22.920 15.495 0.003At most 1 0.013 1.165 3.841 0.281 0.002 0.191 3.841 0.662
Tur: South zone Tur: West zoneNone 0.209 21.742 15.495 0.005 0.305 32.387 15.495 0.000At most 1 0.013 1.134 3.841 0.287 0.004 0.382 3.841 0.537
Urad: East zone Urad: North-East zoneNone 0.222 23.598 15.495 0.002 0.433 64.966 15.495 0.000At most 1 0.017 1.509 3.841 0.219 0.157 15.080 3.841 0.000
Urad: North zone Urad: South zoneNone 0.460 55.457 15.495 0.000 0.155 14.899 15.495 0.061At most 1 0.014 1.273 3.841 0.259 0.001 0.079 3.841 0.779
Urad: West zoneNone 0.321 35.710 15.495 0.000At most 1 0.018 1.634 3.841 0.201
Source: Authors’ estimation
Paul et al. : How Price Signals in Pulses are Transmitted across Regions and Value Chain? 81
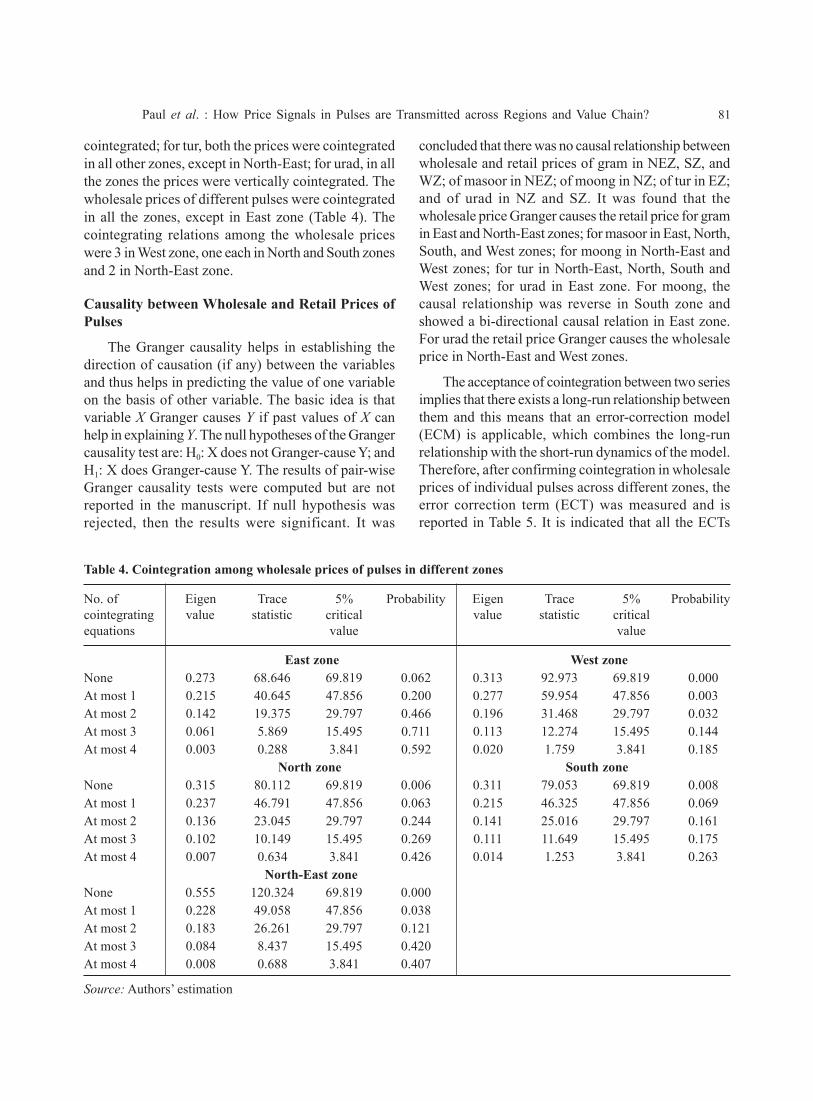
cointegrated; for tur, both the prices were cointegratedin all other zones, except in North-East; for urad, in allthe zones the prices were vertically cointegrated. Thewholesale prices of different pulses were cointegratedin all the zones, except in East zone (Table 4). Thecointegrating relations among the wholesale priceswere 3 in West zone, one each in North and South zonesand 2 in North-East zone.
Causality between Wholesale and Retail Prices ofPulses
The Granger causality helps in establishing thedirection of causation (if any) between the variablesand thus helps in predicting the value of one variableon the basis of other variable. The basic idea is thatvariable X Granger causes Y if past values of X canhelp in explaining Y. The null hypotheses of the Grangercausality test are: H0: X does not Granger-cause Y; andH1: X does Granger-cause Y. The results of pair-wiseGranger causality tests were computed but are notreported in the manuscript. If null hypothesis wasrejected, then the results were significant. It was
concluded that there was no causal relationship betweenwholesale and retail prices of gram in NEZ, SZ, andWZ; of masoor in NEZ; of moong in NZ; of tur in EZ;and of urad in NZ and SZ. It was found that thewholesale price Granger causes the retail price for gramin East and North-East zones; for masoor in East, North,South, and West zones; for moong in North-East andWest zones; for tur in North-East, North, South andWest zones; for urad in East zone. For moong, thecausal relationship was reverse in South zone andshowed a bi-directional causal relation in East zone.For urad the retail price Granger causes the wholesaleprice in North-East and West zones.
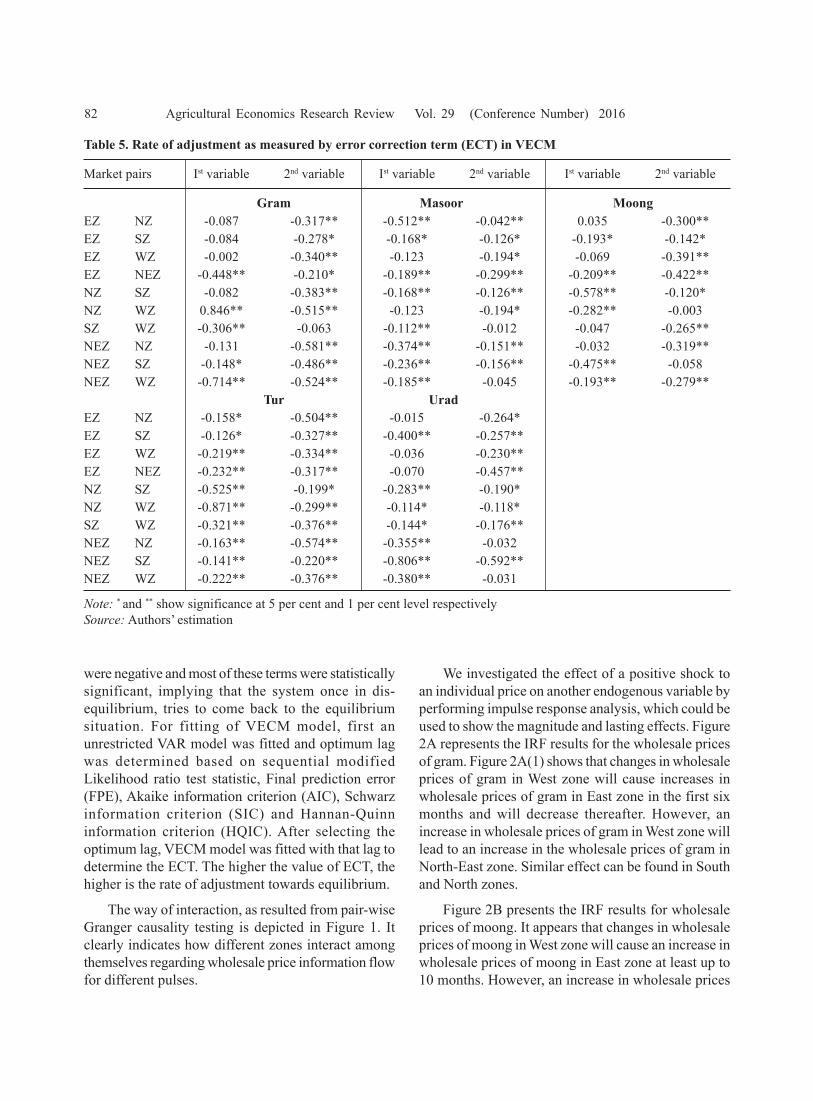
The acceptance of cointegration between two seriesimplies that there exists a long-run relationship betweenthem and this means that an error-correction model(ECM) is applicable, which combines the long-runrelationship with the short-run dynamics of the model.Therefore, after confirming cointegration in wholesaleprices of individual pulses across different zones, theerror correction term (ECT) was measured and isreported in Table 5. It is indicated that all the ECTs
Table 4. Cointegration among wholesale prices of pulses in different zones
No. of Eigen Trace 5% Probability Eigen Trace 5% Probabilitycointegrating value statistic critical value statistic criticalequations value value
East zone West zoneNone 0.273 68.646 69.819 0.062 0.313 92.973 69.819 0.000At most 1 0.215 40.645 47.856 0.200 0.277 59.954 47.856 0.003At most 2 0.142 19.375 29.797 0.466 0.196 31.468 29.797 0.032At most 3 0.061 5.869 15.495 0.711 0.113 12.274 15.495 0.144At most 4 0.003 0.288 3.841 0.592 0.020 1.759 3.841 0.185
North zone South zoneNone 0.315 80.112 69.819 0.006 0.311 79.053 69.819 0.008At most 1 0.237 46.791 47.856 0.063 0.215 46.325 47.856 0.069At most 2 0.136 23.045 29.797 0.244 0.141 25.016 29.797 0.161At most 3 0.102 10.149 15.495 0.269 0.111 11.649 15.495 0.175At most 4 0.007 0.634 3.841 0.426 0.014 1.253 3.841 0.263
North-East zoneNone 0.555 120.324 69.819 0.000At most 1 0.228 49.058 47.856 0.038At most 2 0.183 26.261 29.797 0.121At most 3 0.084 8.437 15.495 0.420At most 4 0.008 0.688 3.841 0.407
Source: Authors’ estimation
82 Agricultural Economics Research Review Vol. 29 (Conference Number) 2016
were negative and most of these terms were statisticallysignificant, implying that the system once in dis-equilibrium, tries to come back to the equilibriumsituation. For fitting of VECM model, first anunrestricted VAR model was fitted and optimum lagwas determined based on sequential modifiedLikelihood ratio test statistic, Final prediction error(FPE), Akaike information criterion (AIC), Schwarzinformation criterion (SIC) and Hannan-Quinninformation criterion (HQIC). After selecting theoptimum lag, VECM model was fitted with that lag todetermine the ECT. The higher the value of ECT, thehigher is the rate of adjustment towards equilibrium.
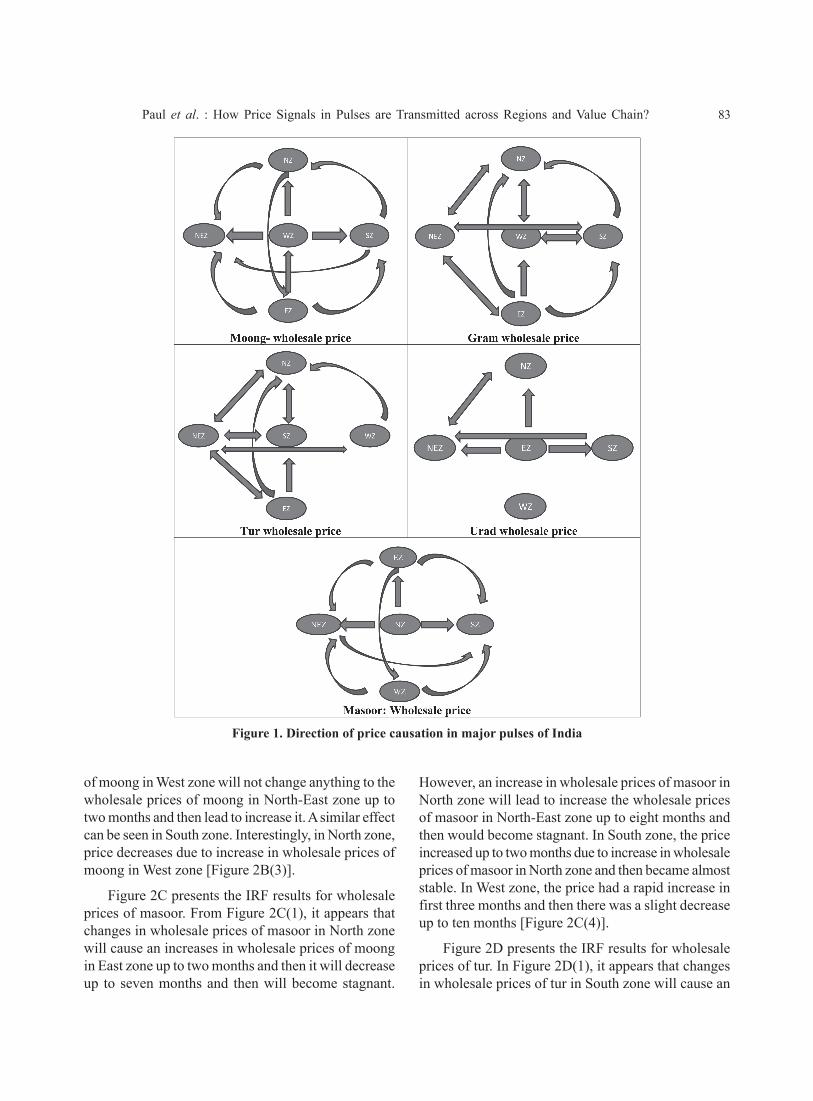
The way of interaction, as resulted from pair-wiseGranger causality testing is depicted in Figure 1. Itclearly indicates how different zones interact amongthemselves regarding wholesale price information flowfor different pulses.
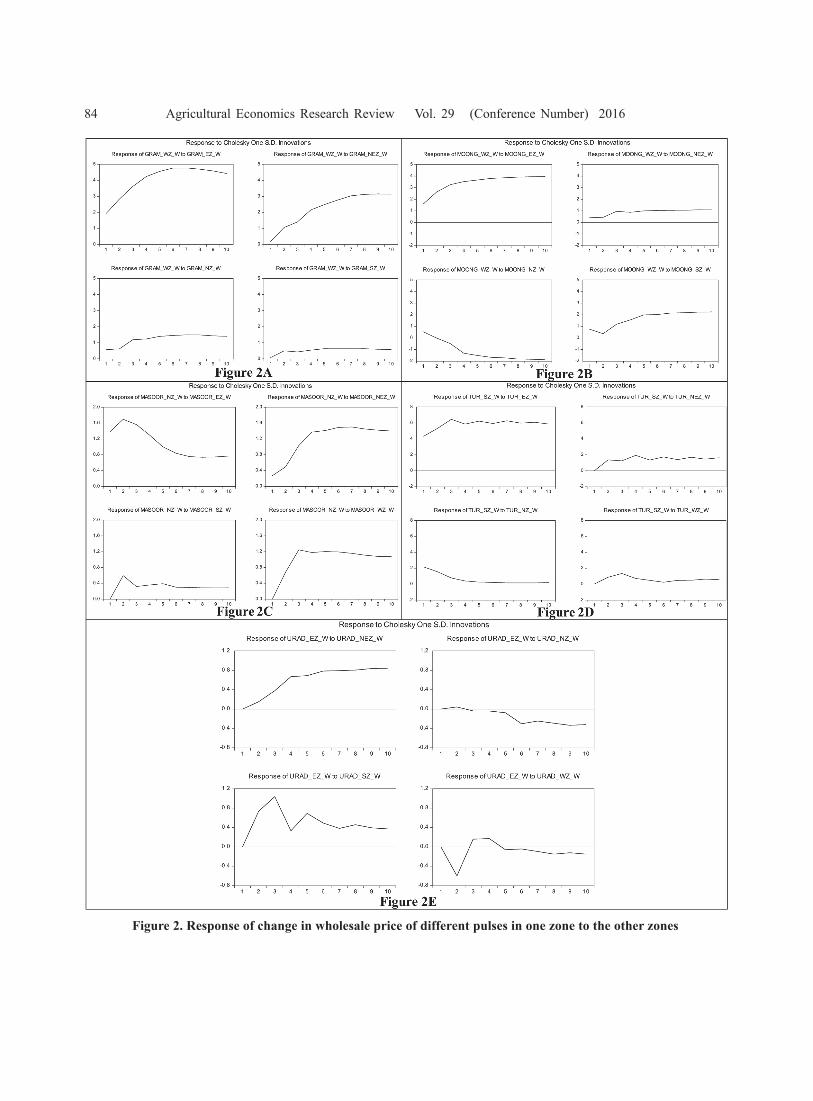
We investigated the effect of a positive shock toan individual price on another endogenous variable byperforming impulse response analysis, which could beused to show the magnitude and lasting effects. Figure2A represents the IRF results for the wholesale pricesof gram. Figure 2A(1) shows that changes in wholesaleprices of gram in West zone will cause increases inwholesale prices of gram in East zone in the first sixmonths and will decrease thereafter. However, anincrease in wholesale prices of gram in West zone willlead to an increase in the wholesale prices of gram inNorth-East zone. Similar effect can be found in Southand North zones.
Figure 2B presents the IRF results for wholesaleprices of moong. It appears that changes in wholesaleprices of moong in West zone will cause an increase inwholesale prices of moong in East zone at least up to10 months. However, an increase in wholesale prices
Table 5. Rate of adjustment as measured by error correction term (ECT) in VECM
Market pairs Ist variable 2nd variable Ist variable 2nd variable Ist variable 2nd variable
Gram Masoor MoongEZ NZ -0.087 -0.317** -0.512** -0.042** 0.035 -0.300**EZ SZ -0.084 -0.278* -0.168* -0.126* -0.193* -0.142*EZ WZ -0.002 -0.340** -0.123 -0.194* -0.069 -0.391**EZ NEZ -0.448** -0.210* -0.189** -0.299** -0.209** -0.422**NZ SZ -0.082 -0.383** -0.168** -0.126** -0.578** -0.120*NZ WZ 0.846** -0.515** -0.123 -0.194* -0.282** -0.003SZ WZ -0.306** -0.063 -0.112** -0.012 -0.047 -0.265**NEZ NZ -0.131 -0.581** -0.374** -0.151** -0.032 -0.319**NEZ SZ -0.148* -0.486** -0.236** -0.156** -0.475** -0.058NEZ WZ -0.714** -0.524** -0.185** -0.045 -0.193** -0.279**
Tur UradEZ NZ -0.158* -0.504** -0.015 -0.264*EZ SZ -0.126* -0.327** -0.400** -0.257**EZ WZ -0.219** -0.334** -0.036 -0.230**EZ NEZ -0.232** -0.317** -0.070 -0.457**NZ SZ -0.525** -0.199* -0.283** -0.190*NZ WZ -0.871** -0.299** -0.114* -0.118*SZ WZ -0.321** -0.376** -0.144* -0.176**NEZ NZ -0.163** -0.574** -0.355** -0.032NEZ SZ -0.141** -0.220** -0.806** -0.592**NEZ WZ -0.222** -0.376** -0.380** -0.031
Note: * and ** show significance at 5 per cent and 1 per cent level respectivelySource: Authors’ estimation
Paul et al. : How Price Signals in Pulses are Transmitted across Regions and Value Chain? 83
Figure 1. Direction of price causation in major pulses of India
of moong in West zone will not change anything to thewholesale prices of moong in North-East zone up totwo months and then lead to increase it. A similar effectcan be seen in South zone. Interestingly, in North zone,price decreases due to increase in wholesale prices ofmoong in West zone [Figure 2B(3)].
Figure 2C presents the IRF results for wholesaleprices of masoor. From Figure 2C(1), it appears thatchanges in wholesale prices of masoor in North zonewill cause an increases in wholesale prices of moongin East zone up to two months and then it will decreaseup to seven months and then will become stagnant.
However, an increase in wholesale prices of masoor inNorth zone will lead to increase the wholesale pricesof masoor in North-East zone up to eight months andthen would become stagnant. In South zone, the priceincreased up to two months due to increase in wholesaleprices of masoor in North zone and then became almoststable. In West zone, the price had a rapid increase infirst three months and then there was a slight decreaseup to ten months [Figure 2C(4)].
Figure 2D presents the IRF results for wholesaleprices of tur. In Figure 2D(1), it appears that changesin wholesale prices of tur in South zone will cause an
84 Agricultural Economics Research Review Vol. 29 (Conference Number) 2016
Figure 2. Response of change in wholesale price of different pulses in one zone to the other zones
Paul et al. : How Price Signals in Pulses are Transmitted across Regions and Value Chain? 85
increase in wholesale prices of tur in East zone up tothree months and then would become stagnant.However, an increase in wholesale prices of tur in Southzone will increase the wholesale prices of tur in North-East zone in first month followed by decrease in thenext month and alternatively this phenomenon isrepeated. In North zone, price will decrease up to fivemonths due to increase in wholesale prices of tur inSouth zone and then would become almost stable[Figure 2D(3)]. In West zone, the price would increasein first three months and then would decrease up to sixmonths and will then increase slightly up to ten months[Figure 2D(4)].
Figure 2E presents the IRF results for wholesaleprices of urad. In Figure 2E(1), it appears that changesin wholesale prices of urad in East zone will have asteep increase in wholesale prices of urad in North-East zone up to four months and then rate of increasewould become slow. However, an increase in wholesaleprices of urad in East zone will lead to a decrease inthe wholesale prices of urad in North zone after secondmonth [Figure 2D(2)]. In South zone, the price wouldincrease up to three months due to increase in wholesaleprices of urad in East zone followed by a decrease andthen again increase [Figure 2E(3)]. In West zone, theprice decreases in first two months followed by anincrease in next month; would become stable and thenstart decreasing after four months [Figure2E(4)].
ConclusionsThe study has focused on time series techniques
to test for market integration in wholesale and retailprices of major pulses in India. It has been found thatamong wholesale and retail prices of gram in differentzones, there is one cointegrating relationship; inmasoor, there is no cointegrating relationship amongthe wholesale price, whereas in retail prices there isone cointegrating relation; in moong retail price, thereare 3 cointegrating relations, whereas in wholesaleprice, two stationary relationships exist; in turwholesale as well as retail prices, there are 4cointegrating relationships; in urad wholesale price,two stationary relations exist and in retail price, thereis one cointegrating relationship. In addition tohorizontal cointegration, the vertical cointegrationbetween the wholesale and retail prices of differentpulses has also been investigated. The results haverevealed that in gram, only in East and West zones there
is a significant cointegration among wholesale andretail prices; for masoor, in North, East and West zonesthe wholesale and retail prices are cointegrated; formoong, in East, North and North-East zones thewholesale and retail prices are cointegrated; for tur,except in North-East zones both the prices arecointegrated in all other zones; for urad, in all the zonesthe prices are vertically cointegrated. Cointegrationamong the wholesale prices of pulses in different zonesindicates that in all other zones, except in East zone,the wholesale prices of different pulses arecointegrated.
Different causal relationships have been foundbetween wholesale and retail prices in these five zones.The acceptance of cointegration between two seriesimplies that there exists a long-run relationship betweenthem and this means that an error-correction model(ECM) exists which combines the long-run relationshipwith the short-run dynamics of the model. The resultshave indicated that all the error correction terms (ECTs)are negative and most of these terms are statisticallysignificant, implying that the system once indisequilibrium tries to come back to the equilibriumsituation.
The effect of a positive shock to an individual priceon another endogenous variable has been investigatedby performing impulse response analysis, which canbe used to show the magnitude and lasting effects.Impulse response analysis has shown that changes inwholesale prices of these five pulses in one zone willcause a change in wholesale prices in other zones. It isinferred that the price signals are transmitted acrossregions indicating that price changes in one zone areconsistently related to the price changes in other zonesand are able to influence the prices in other zones.However, the direction and intensity of price changesmay be affected by the dynamic linkages between thedemand and supply of pulses. The insights from thestudy can be used to improve the information precisionto predict the price movements used by marketingoperators for their strategies. The policy makers canuse it to design suitable marketing strategies to bringmore efficiency across the markets.
The pulse prices witnessed tremendous changeduring the recent period. It has been revealed that mostof the markets are co-integrated and rate of adjustmentsis high when prices are assumed to be influenced bythe changes in each other’s price. Thus, it can be
86 Agricultural Economics Research Review Vol. 29 (Conference Number) 2016
inferred that price changes are temporary and wouldconverge to an equilibrium within a given time span.A proper focus on domestic supply management alongwith international trade coupled with strong marketsurveillance and intelligence efforts would help controlescalating prices and also help in minimizing thedistortions widening the gap between the wholesaleand retail prices of pulses.
ReferencesBhardwaj, S.P., Paul, R.K. and Kumar, A. (2015) Future
trading in soybean – An econometric analysis. Journalof the Indian Society of Agricultural Statistics, 69(1):11-17.
Dickey, D.A., and Fuller, W.A. (1979) Distribution of theestimators for autoregressive time series with a unit root.Journal of the American Statistical Association, 74(3):427-31.
Ghafoor, A., Mustafa, K., Mushtaq, K. and Abedulla (2009)Cointegration and causality: An application to majormango markets in Pakistan. Lahore Journal ofEconomics, 14(1): 85-113.
Granger, C.W.J. (1969) Investigating causal relations byeconometric models and cross-spectral methods.Econometrica, 37(3): 424-38.
Granger, C.W.J. (1980) The comparison of time series andeconometric forecasting strategies. In Large ScaleMacro-Econometric Models, Theory and Practice,edited by J. Kmenta and J.B. Ramsey. North Holland,pp. 123-128.
Granger, C.W.J. (1988) Some recent developments in theconcept of causality. Journal of Econometrics, 39(2):199-211.
Johansen, S. (1988) A statistical analysis of cointegrationvectors. Journal of Economic Dynamics and Control,12(3): 231-54.
Joshi, P.K. and Saxena, R. (2002) A profile of pulsesproduction in India: Facts, trends and opportunities.Indian Journal of Agricultural Economics, 57(3): 326-339.
Mills, T.C. (1999) The Econometric Modelling of FinancialTime Series. Cambridge University Press, Cambridge.
Mohanty, S. and Satyasai, K.J. (2015) Feeling the pulse,Indian pulses sector. NABARD Rural Pulse, Issue X(July-August): 1-4.
Paul, R. K., Saxena, R., Chaurasia, S., Zeeshan and Rana,S. (2015) Examining export volatility, structural breaksin price volatility and linkages between domestic &export prices of onion in India. Agricultural EconomicsResearch Review, 28(2): 101-116.
Paul, R.K. and Sinha, K. (2015) Spatial market integrationamong major coffee markets in India. Journal of theIndian Society of Agricultural Statistics, 69(3): 281-287
Reddy, A.A. (2004) Consumption pattern, trade andproduction potential of pulses. Economic and PoliticalWeekly, 39(44): 4854-4860.
Reddy, B.S., Chandrashekhar, S.M., Dikshit, A.K. andManohar, N.S. (2012) Price trend and integration ofwholesale markets for onion in metro cities of India.Journal of Economics and Sustainable Development,3(70): 120-130.
Saxena, R., Paul, R.K., Rana, S., Chaurasia, S., Pal, K.,Zeeshan and Joshi, D. (2015) Agricultural tradestructure and linkages in SAARC: An empiricalinvestigation. Agricultural Economics Research Review,28(2): 311-358.
Sargan, J.D. (1984) Some tests of dynamic specificationfor a single equation. Econometrica, 48: 879-897.
Sims, C.A. (1972) Money, income and causality. AmericanEconomic Review, 62: 540-552.
Varela, G., Carroll, E.A. and Iacovone, L. (2012)Determinants of Market Integration and PriceTransmission in Indonesia. Policy Research WorkingPaper 6098. Poverty Reduction and EconomicManagement Unit, World Bank.
Wani, M.H., Sehar, H., Paul, R.K., Kuruvila, A. and Hussain,I. (2015a) Supply response of horticultural crops: a caseof apple and pear in Jammu and Kashmir, India.Agricultural Economics Research Review, 28(1): 83-89.
Wani, M.H., Paul, R.K., Bazaz, N.H. and Manzoor, M.(2015b) Market integration and price forecasting ofapple in India. Indian Journal of AgriculturalEconomics, 70(2): 169-181.
Wani, M.H., Bazaz, N.H., Paul, R.K., Showkat, A.I. andBhat, A. (2015c) Inter-sectoral linkages in Jammu &Kashmir economy — An econometric analysis.Agricultural Economics Research Review, 28(1): 11-24.