Nitric oxide and histone deacetylases modulate cocaine-induced mu-opioid receptor levels in
16
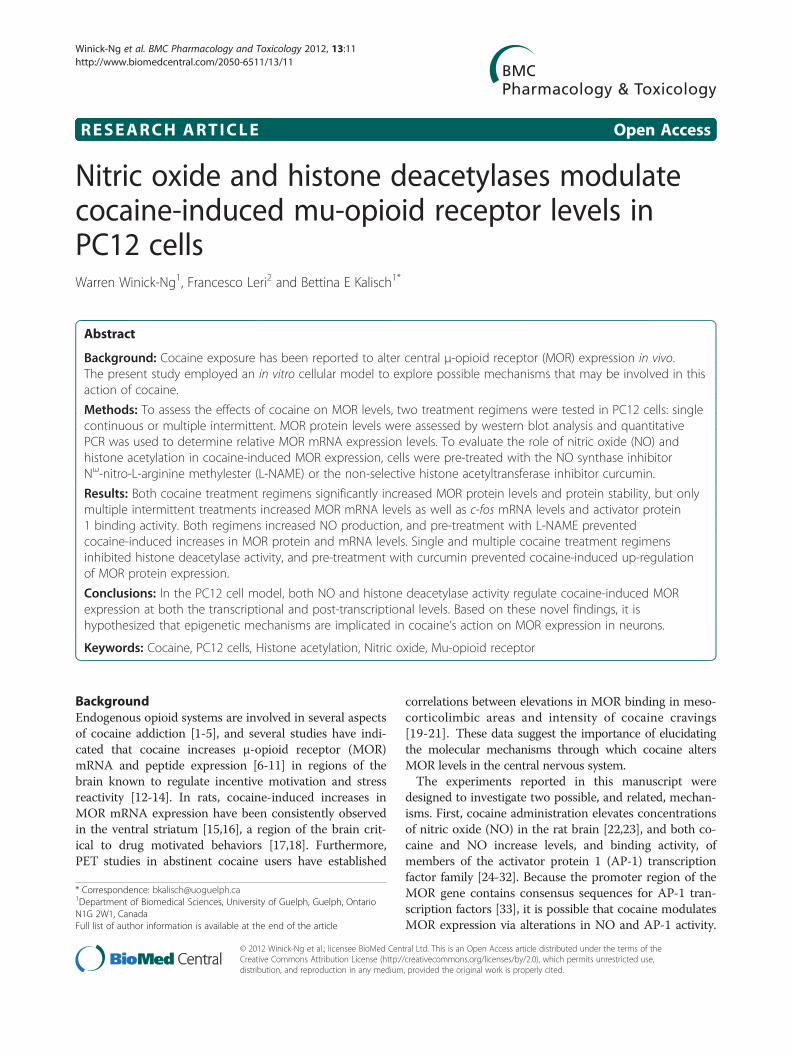
RESEARCH ARTICLE Open Access Nitric oxide and histone deacetylases modulate cocaine-induced mu-opioid receptor levels in PC12 cells Warren Winick-Ng 1 , Francesco Leri 2 and Bettina E Kalisch 1* Abstract Background: Cocaine exposure has been reported to alter central μ-opioid receptor (MOR) expression in vivo. The present study employed an in vitro cellular model to explore possible mechanisms that may be involved in this action of cocaine. Methods: To assess the effects of cocaine on MOR levels, two treatment regimens were tested in PC12 cells: single continuous or multiple intermittent. MOR protein levels were assessed by western blot analysis and quantitative PCR was used to determine relative MOR mRNA expression levels. To evaluate the role of nitric oxide (NO) and histone acetylation in cocaine-induced MOR expression, cells were pre-treated with the NO synthase inhibitor N ω -nitro-L-arginine methylester (L-NAME) or the non-selective histone acetyltransferase inhibitor curcumin. Results: Both cocaine treatment regimens significantly increased MOR protein levels and protein stability, but only multiple intermittent treatments increased MOR mRNA levels as well as c-fos mRNA levels and activator protein 1 binding activity. Both regimens increased NO production, and pre-treatment with L-NAME prevented cocaine-induced increases in MOR protein and mRNA levels. Single and multiple cocaine treatment regimens inhibited histone deacetylase activity, and pre-treatment with curcumin prevented cocaine-induced up-regulation of MOR protein expression. Conclusions: In the PC12 cell model, both NO and histone deacetylase activity regulate cocaine-induced MOR expression at both the transcriptional and post-transcriptional levels. Based on these novel findings, it is hypothesized that epigenetic mechanisms are implicated in cocaine’s action on MOR expression in neurons. Keywords: Cocaine, PC12 cells, Histone acetylation, Nitric oxide, Mu-opioid receptor Background Endogenous opioid systems are involved in several aspects of cocaine addiction [1-5], and several studies have indi- cated that cocaine increases μ-opioid receptor (MOR) mRNA and peptide expression [6-11] in regions of the brain known to regulate incentive motivation and stress reactivity [12-14]. In rats, cocaine-induced increases in MOR mRNA expression have been consistently observed in the ventral striatum [15,16], a region of the brain crit- ical to drug motivated behaviors [17,18]. Furthermore, PET studies in abstinent cocaine users have established correlations between elevations in MOR binding in meso- corticolimbic areas and intensity of cocaine cravings [19-21]. These data suggest the importance of elucidating the molecular mechanisms through which cocaine alters MOR levels in the central nervous system. The experiments reported in this manuscript were designed to investigate two possible, and related, mechan- isms. First, cocaine administration elevates concentrations of nitric oxide (NO) in the rat brain [22,23], and both co- caine and NO increase levels, and binding activity, of members of the activator protein 1 (AP-1) transcription factor family [24-32]. Because the promoter region of the MOR gene contains consensus sequences for AP-1 tran- scription factors [33], it is possible that cocaine modulates MOR expression via alterations in NO and AP-1 activity. * Correspondence: [email protected] 1 Department of Biomedical Sciences, University of Guelph, Guelph, Ontario N1G 2W1, Canada Full list of author information is available at the end of the article © 2012 Winick-Ng et al.; licensee BioMed Central Ltd. This is an Open Access article distributed under the terms of the Creative Commons Attribution License (http://creativecommons.org/licenses/by/2.0), which permits unrestricted use, distribution, and reproduction in any medium, provided the original work is properly cited. Winick-Ng et al. BMC Pharmacology and Toxicology 2012, 13:11 http://www.biomedcentral.com/2050-6511/13/11
Transcript of Nitric oxide and histone deacetylases modulate cocaine-induced mu-opioid receptor levels in
Winick-Ng et al. BMC Pharmacology and Toxicology 2012, 13:11http://www.biomedcentral.com/2050-6511/13/11
RESEARCH ARTICLE Open Access
Nitric oxide and histone deacetylases modulatecocaine-induced mu-opioid receptor levels inPC12 cellsWarren Winick-Ng1, Francesco Leri2 and Bettina E Kalisch1*
Abstract
Background: Cocaine exposure has been reported to alter central μ-opioid receptor (MOR) expression in vivo.The present study employed an in vitro cellular model to explore possible mechanisms that may be involved in thisaction of cocaine.
Methods: To assess the effects of cocaine on MOR levels, two treatment regimens were tested in PC12 cells: singlecontinuous or multiple intermittent. MOR protein levels were assessed by western blot analysis and quantitativePCR was used to determine relative MOR mRNA expression levels. To evaluate the role of nitric oxide (NO) andhistone acetylation in cocaine-induced MOR expression, cells were pre-treated with the NO synthase inhibitorNω-nitro-L-arginine methylester (L-NAME) or the non-selective histone acetyltransferase inhibitor curcumin.
Results: Both cocaine treatment regimens significantly increased MOR protein levels and protein stability, but onlymultiple intermittent treatments increased MOR mRNA levels as well as c-fos mRNA levels and activator protein1 binding activity. Both regimens increased NO production, and pre-treatment with L-NAME preventedcocaine-induced increases in MOR protein and mRNA levels. Single and multiple cocaine treatment regimensinhibited histone deacetylase activity, and pre-treatment with curcumin prevented cocaine-induced up-regulationof MOR protein expression.
Conclusions: In the PC12 cell model, both NO and histone deacetylase activity regulate cocaine-induced MORexpression at both the transcriptional and post-transcriptional levels. Based on these novel findings, it ishypothesized that epigenetic mechanisms are implicated in cocaine’s action on MOR expression in neurons.
Keywords: Cocaine, PC12 cells, Histone acetylation, Nitric oxide, Mu-opioid receptor
BackgroundEndogenous opioid systems are involved in several aspectsof cocaine addiction [1-5], and several studies have indi-cated that cocaine increases μ-opioid receptor (MOR)mRNA and peptide expression [6-11] in regions of thebrain known to regulate incentive motivation and stressreactivity [12-14]. In rats, cocaine-induced increases inMOR mRNA expression have been consistently observedin the ventral striatum [15,16], a region of the brain crit-ical to drug motivated behaviors [17,18]. Furthermore,PET studies in abstinent cocaine users have established
* Correspondence: [email protected] of Biomedical Sciences, University of Guelph, Guelph, OntarioN1G 2W1, CanadaFull list of author information is available at the end of the article
© 2012 Winick-Ng et al.; licensee BioMed CenCreative Commons Attribution License (http:/distribution, and reproduction in any medium
correlations between elevations in MOR binding in meso-corticolimbic areas and intensity of cocaine cravings[19-21]. These data suggest the importance of elucidatingthe molecular mechanisms through which cocaine altersMOR levels in the central nervous system.The experiments reported in this manuscript were
designed to investigate two possible, and related, mechan-isms. First, cocaine administration elevates concentrationsof nitric oxide (NO) in the rat brain [22,23], and both co-caine and NO increase levels, and binding activity, ofmembers of the activator protein 1 (AP-1) transcriptionfactor family [24-32]. Because the promoter region of theMOR gene contains consensus sequences for AP-1 tran-scription factors [33], it is possible that cocaine modulatesMOR expression via alterations in NO and AP-1 activity.
tral Ltd. This is an Open Access article distributed under the terms of the/creativecommons.org/licenses/by/2.0), which permits unrestricted use,, provided the original work is properly cited.
Winick-Ng et al. BMC Pharmacology and Toxicology 2012, 13:11 Page 2 of 16http://www.biomedcentral.com/bmcpharmacoltoxicol/2050-6511/13/1/11
Second, NO also decreases the activity of histone deacety-lases (HDACs) [34,35], enzymes implicated in the behav-ioral effects of cocaine in rats [36,37], as well as inmorphine-induced MOR expression [38,39]. HDACsaffect chromatin structure through the removal of acetylgroups from histones [40-42], and thus contribute to genetranscription [43-47]. Therefore, it is also likely that co-caine modulates MOR expression via alterations in his-tone acetylation.These experiments employed PC12 cells to investigate
the role of NO and HDACs in cocaine-induced alterationsof MOR expression. This in vitro cellular model wasselected because PC12 cells express the MOR gene[48-50], their NO pathway has been fairly well charac-terized [51-54], and they are sensitive to changes inHDACs activity [55]. Three main results were obtained.First, cocaine increased MOR protein expression and pro-tein stability after both single continuous and multipleintermittent treatment regimens, but only the multipleintermittent treatment regimen increased expression ofMOR and c-fos mRNAs, as well as AP-1 binding ac-tivity. Second, NO was identified as an importantmodulator, as cocaine increased NO production, andthe NO synthase (NOS) inhibitor Nω-nitro-L-argininemethylester (L-NAME) attenuated cocaine-induced increasesin MOR protein and mRNA expression. Third, it was foundthat cocaine decreased HDACs activity, and inhibition of his-tone acetyltransferase (HAT) attenuated cocaine-inducedincreases in MOR protein expression following both treat-ment regimens.
MethodsMaterialsDulbecco's modified Eagle medium (DMEM), horseserum, gentamycin, DNAse I, Oligo dT, Superscript II, pri-mers, Platinum Taq and Lipofectamine 2000 were pur-chased from Invitrogen (Mississauga, ON, Canada) andfetal bovine serum (FBS) was obtained from HyClone La-boratories (Logan, UT, USA). Cocaine HCl was purchasedfrom Dumex (Toronto, ON, Canada), L-NAME, curcu-min, and mouse monoclonal anti-α-tubulin were pur-chased from Sigma Aldrich (St. Louis, MO, USA). Thecomplete mini tablets were purchased from Roche Diag-nostics (Laval, QC, Canada), the sodium dodecyl sulfate(SDS) sample buffer, DTT, and protein standards wereobtained from New England Biolabs (Ipswich, MA) andthe polyclonal MOR antibody was from Abcam(Cambridge, MA, USA) or Santa Cruz Biotechnology Inc.(Santa Cruz, CA, USA). Luminol was also purchased fromSanta Cruz. Hybond-C blotting membranes, sheepanti-mouse IgG and enhanced chemiluminescence (ECL)kit were obtained from Amersham/GE Health Care(Piscataway, NJ, USA), poly-D-lysine was from BD Biosciences(Mississauga, ON, Canada) and 4,5-diaminofluorescein
diacetate (DAF-2 DA) was purchased from Calbiochem(San Diego, CA, USA). Syber Green PCR master mix wasobtained from Qiagen (Toronto, ON, Canada) and theHDAC Assay kit was from Active Motif (Carlsbad, CA,USA). The PathDetect pAP-luciferase reporter plasmid wasobtained from Stratagene (La Jolla CA, USA) and the Luci-ferase Assay and Galacto-Light (Tropix) kits were fromPromega (Madison, WI, USA) and Applied Biosystems(Bedford, MA, USA), respectively. All other chemicalswere molecular or electrophoresis grade and obtainedfrom Fisher Scientific (Ottawa, ON, Canada) or DiaMedLaboratories (Mississauga, ON, Canada).
Cell culture, viability and treatmentsPC12 cells were maintained in DMEM containing 5%FBS, 5% horse serum and 50 μg/mL gentamycin at 37oCin 5% CO2. To evaluate the effects of cocaine, NO syn-thase (NOS) inhibitors, and curcumin on MOR proteinand mRNA levels, cells were plated on CorningW 60 mmdishes at a density of 1.0 million cells per plate for pro-tein, and 1.5 million cells per plate for RNA. For the AP-1 study, PC12 cells were plated on 12-well culture dishesat a concentration of 2.0 x 10⁵ cells per well. For NOproduction imaging, PC12 cells were plated on 6-wellculture dishes containing poly-D-lysine coated coverslipsat a concentration of 2.0 x 10⁵ cells per well. For nuclearextraction, PC12 cells were plated on 100 mm culturedishes at a concentration of 4.0 x 10⁶ cells per plate. Allplating was performed 24h prior to any treatment.The effects of cocaine were determined by exposing
PC12 cells to various concentrations of cocaine usingtwo different treatments. The doses of cocaine selectedfor this study (10, 100, and 500 μM) were based on pre-vious reports investigating the effects of cocaine on mor-phological changes and proto-oncogene expression inPC12 cells [56]. Two treatment regimens were chosenbased on previous findings indicating that different ex-posure patterns can differentially affect MOR binding af-finity and receptor density in several regions of the ratbrain [57,58]. These treatments were: single continuoustreatment (SCT) or repeated intermittent treatment(RIT) (see Table 1). The latter regimen included 3 dailytreatments, each lasting 30 min, separated by 60 minexposures to cocaine-free media. Cells were harvested72 h after the beginning of treatment, except whereotherwise indicated.PC12 cell viability was assessed in control cells and
those exposed to 500 μM SCT or 100 μM RIT with co-caine for 72 h by the reduction of 3-(4,5-dimethylthiazole-2-yl)-2,5-diphenyltetrazoliumbromide(MTT)asdescribedby Cheung et al. [59]. Culture media was replaced withmedia containing MTT (0.5mg/mL final concentration)and the cells were incubated at 37°C for 30 min. Thereduced formazan product was lysed from the cells using
Winick-Ng et al. BMC Pharmacology and Toxicology 2012, 13:11 Page 3 of 16http://www.biomedcentral.com/bmcpharmacoltoxicol/2050-6511/13/1/11
a 100% dimethylsulfoxide solution and the absorbancewas subsequently measured at 570nm using the FLUOs-tar Optima plate-reader (BMG, Fisher Scientific).The effect of NOS and HAT inhibitors was determined
by pre-treating PC12 cells with inhibitor, for 1 h prior tococaine exposure. We determined previously that NGFincreases NOS activity and NO production in PC12 cellsand that this increase is attenuated when cells are pre-treated with 20 mM L-NAME [53]. Therefore, cells werepretreated with this dose of L-NAME to examine the in-volvement of NO in the cocaine-induced expression ofMOR. Cells were also pretreated with 1, 3 or 5 μM of thenon-selective HAT inhibitor curcumin, based on a previ-ous report by Siddiqui et al. [60], which explored the im-pact of curcumin on oxidative stress in PC12 cells.Curcumin was selected for these experiments because itinhibits HAT in both in vitro and in vivo models [61-63]and it modulates cocaine place preference in rats [36]. ForRIT, each 30 min cocaine treatment was followed by theaddition of PC12 cell culture media containing onlyL-NAME (20 mM) or curcumin (1, 3, 5 μM).
Immunoblot analysisControl and treated PC12 cells were lysed in 250 μL ofradioimmunoprecipitation assay (RIPA) buffer (finalconcentration: 50 mM Tris, 150 mM NaCl, 1% NP-40,0.25% sodium deoxycholate, 0.5% SDS, 1 mM each ofEDTA, sodium fluoride, sodium orthovanadate and pro-tease inhibitor (1 Complete Mini Tablet (Roche Diagnos-tics)/10 mL], pH 7.4). Samples were rocked on ice for 15min, sonicated, centrifuged at 17 530 g for 15 min andthe protein content of the supernatant determined bythe method of Bradford [64]. Cell lysates (100 μg) werethen boiled in SDS sample buffer (final concentration:62.5 mM Tris-HCl; pH 6.8, 2% SDS, 42 μM DTT, 10%glycerol and 0.01% phenol red) and loaded onto a 10%SDS/polyacrylamide gel.Following electrophoresis, proteins were transferred
onto nitrocellulose membranes (Hybond-C) using aTrans-blot semidry transfer unit (Bio-Rad Laboratories,Mississauga, ON, Canada) with transfer buffer (finalconcentration: 28 mM Tris, 39 mM glycine and 20%methanol, pH 9.2). Membranes were blocked in 2.5% or5% non-fat milk in tris-buffered saline (TBS) containing0.1% Tween-20 (TBS-T) for 1 h. Blots were then incu-bated in 1:750 rabbit MOR antibody in 1% bovine serumalbumin (BSA) in TBS-T for 2 h (Abcam), or in 1:200rabbit MOR antibody in 1% non-fat milk in TBS-T(Santa Cruz) overnight. Antibody detection was achievedusing 1:2500 horseradish peroxidase-conjugated donkeyanti-rabbit IgG in either 1 % BSA or 5% non-fat milk inTBS-T for 1 h, followed by ECL or luminol.Membranes were scanned using the STORM 860 (Mo-
lecular Dynamics, subsidiary of Amersham) for ECL, or
the Fluorchem 9900 imaging system (Alpha Innotech,Santa Clara, CA, USA) for luminol. Bands were analyzeddensitometrically using Imagequant (Molecular Dynam-ics) or Fluorchem 9900 software. Blots were strippedwith 62.5 mM Tris, pH 6.7, containing 2% SDS and 100mM 2-mercaptoethanol at 50oC for 20 min. Membraneswere then rinsed in TBS for at least 4 h before blockingwith 5 % milk in TBS-T for 1 h and reprobing with 1:50000 mouse monoclonal anti-α tubulin antibody over-night. Blots were then exposed to 1:2500 goat anti-mouseIgG-horse radish peroxidase conjugated secondary anti-body, in 5% milk in TBS-T and the protein bands visua-lized as described above.
MOR half-life analysisFollowing 72 h of treatment, control and SCT or RITPC12 cells were exposed to 10 μg/mL cycloheximide[65], a de novo protein translation inhibitor, for 4, 8, 12,24 and 48 h. Cells were then lysed in 250 μL RIPA buf-fer, and western blot analysis for MOR and α-tubulinwas performed as described above.
Analysis of NO productionNO production was assessed using the fluorescent probeDAF-2 DA. PC12 cells were treated with cocaine (100 or500 μM) in the presence or absence of 20 mM L-NAMEfor 3 days, washed once with media and loaded with 10μM DAF-2 DA in 1 mL culture media. Following 2 h ofincubation cells were washed 4 times with 2 mL mediaand DAF-2 fluorescence was visualized using an Olym-pus IX-81 fluorescence microscope (excitation at 488nm, emission at 520 nm) with an Olympus LucPlan FL0.40 aperture lens (at 20 x magnification) in phosphatebuffered saline at room temperature. Digital images werecaptured using a Cascade 512F camera (Photometrics,Tucson, AZ, USA), and processed in Q-Capture andAdobe Photoshop 5.0.
qPCR and PCR analysisIn our previous studies of gene expression in PC12 cells,changes in mRNA typically occurred 24 to 36 h prior tochanges in protein expression [53]. Therefore we initiallyexamined MOR mRNA following 48h of SCT and RITwith cocaine. Control and treated PC12 cells were lysed in1 mL of Trizol reagent to obtain total RNA. The extractedRNA was treated with DNase I and reverse transcribedusing superscript II with oligo-dT as the primer for 75min at 43°C [53]. The resulting cDNA was then used forreal time PCR (qPCR) using a LightCycler (Roche). qPCRwas performed using 1 μL cDNA and 9 μL of QuantiTectSYBR Green PCR master mix. There was a 15 min incu-bation period at 95°C prior to the first cycle, and a meltingcurve was obtained for each sample following the finalcycle [65]. Primer pairs and cycling conditions were: β-2-
Winick-Ng et al. BMC Pharmacology and Toxicology 2012, 13:11 Page 4 of 16http://www.biomedcentral.com/bmcpharmacoltoxicol/2050-6511/13/1/11
microglobulin (Genbank Accession number NM_012512):5’ primer: 5’-TGACCGTGATCTTTCTGGTG-3’ and 3’primer: 5’-ATCTGAGGTGGGTGGAACTG-3’, 45 cyclesof 95°C: 15 s, 55°C: 25 s, 72°C: 15 s; MOR coding region(Genbank Accession Number U02083.1): 5’ primer: 5’-CTGTGTGTTACGGCCTGATG-3’ and 3’ primer: 5’-ATGCAGAAGTGCCAGGAAAC-3’, 55 cycles of 95°C:15 s, 52°C: 25 s, 72°C: 15 s. After each cycle, fluorescentactivity was determined, and a final crossing point (thresh-old cycle, CT) was calculated. Steady-state MOR mRNAlevels relative to β-2 microglobulin were determined withRelQuant softwareTo qualitatively observe the effect of cocaine on c-fos
levels, total RNA was extracted from control and trea-ted PC12 cells as described above 0.5, 1 or 2 h after thefinal 30 min 100 μM cocaine treatment on the first dayof RIT. Following reverse transcription, 5 μL cDNA wascombined with 45 μL of master mix containing (finalconcentration): 15 mM MgCl2, 10 mM dNTPs, 5 μM offorward and reverse primers, 10 x PCR buffer, 0.2 μL ofPlatinum Taq and water [53,65]. Each PCR was per-formed with an initial 2 min, 95°C strand separationand a final 2 min, 72°C elongation. Primer pairs andcycling conditions were: β-actin (Genbank Accessionnumber NM_031144): 5’ primer 5’-TCATGAAGTGT-GACGGTTGACATCCGT-3’ and 3’ primer 5’-CCTA-GAAGATTTGCGGTGCACGATG-3’, 30 cycles of 95°C:30 s, 55°C: 30 s, 72°C: 45 s; c-fos coding region (Gen-bank Accession number NM_022197 XM_234422): 5’primer: 5’-ACGCGGACTACGAGGCGTCA-3’ and 3’primer: 5’-GCTCTGGTCTGCGATGGGGC-3’, 40 cyclesof 95°C: 30 s, 55°C: 30 s, 72°C: 45 s. PCR products wereseparated on a 1.5% agarose gel stained with ethidiumbromide. Fragments were visualized using the Pharma-cia Biotech ImageMaster VDS, and images capturedwere processed in Microsoft Office Picture Manager. Toquantify steady-state mRNA levels qPCR was performedas described above and analysis of c-fos levels relative toβ-2 microglobulin determined using RelQuant software.
AP-1 luciferase activityPC12 cells were fed with antibiotic free media 30 minprior to transfection. For each well 1.0 μg luciferase re-porter plasmid containing 7 AP-1 transcription factorbinding elements was incubated with 0.5 μg of a pSV- β-galactosidase (β-gal) plasmid and 2 μL Lipofecta-mine2000 in 100 μL OptiMEM for 30 min at roomtemperature [51]. The mixture was added to PC12 cellsand the plates returned to the cell culture incubator for5 h. The transfection medium was replaced with regularPC12 culture medium and the cells returned to the incu-bator overnight. Following 6 h of SCT or RIT with co-caine or 50 ng/mL NGF (used as a positive control forAP-1 activation [51]) treatment, PC12 cells were lysed
with 200 μL 1X passive lysis buffer (Promega). Lysateswere incubated for 30 min at 4°C, followed by centrifu-gation at 12 000 x g for 2 min. Duplicate 20 μL samplesof the supernatant were then transferred to a 96 wellplate. To measure luciferase activity, 50μL of LuciferaseAssay Reagent was added to each well, and after a 2 sdelay, luciferase activity was read for 10 s. Luciferase ac-tivity was an indicator for AP-1 plasmid activation. Du-plicate samples from the same lysate were used tomeasure β-gal activity with the Galacto-Light kit. First,25 μL of galacton (1:100 with reaction buffer diluent)was added to each well and the samples were incubatedfor 30 to 60 min. This was then followed by the additionof 50μL of accelerator (provided in the Galacto-Lightkit) to each well, and after a 2 s delay, β-gal activity wasread for 1 s. Luciferase and β-gal activity was measuredusing the FLUOstar Optima plate-reader luminometer(BMG, Fisher Scientific).
Nuclear extraction and HDAC enzyme activity assaySince c-fos expression and AP-1 activity were alteredwithin 24 h of treatment, it was hypothesized that co-caine would alter HDAC activity within a similar timeframe. Following 24 and 36h of SCT and RIT with co-caine, PC12 cells were harvested in nuclear extractionbuffer A (final concentration: 10 mM HEPES; pH 7.9,1.5 mM MgCl2, 10 mM KCl, 0.5 μM DTT and proteaseinhibitor (1 complete MINI tablet/10 mL)) containingphosphatase inhibitors (1mM each of sodium fluoride,sodium orthovanadate). Cells were lysed using a 27.5gauge needle, and the nuclei were pelleted by centrifuga-tion at 14 000 x g for 5 min at 4°C. The supernatant wasdiscarded and the pellet was rinsed in buffer A. Cellswere again centrifuged at 14 000 x g for 5 min at 4°C,the supernatant discarded and the pellet re-suspended innuclear extraction buffer B (final concentration: 20 mMHEPES; pH 7.9, 1.5 mM MgCl2, 420 mM KCl, 0.5 μMDTT, 25% glycerol, 2 mM EDTA, 1mM each of sodiumfluoride, sodium orthovanadate, and protease inhibitor(1 complete MINI tablet/10 mL)) and kept on ice for 15min. Following the addition of nuclear extraction bufferC (final concentration: 20 mM HEPES; pH 7.9, 0.5 μMDTT, 25% glycerol, 0.2 mM EDTA, 1mM each of so-dium fluoride, sodium orthovanadate, and protease in-hibitor (1 complete MINI tablet/10 mL)), samples werecentrifuged at 10 000 x g for 5 min. The nuclear fractionin the supernatant was quantified using the method ofBradford [64].Samples were used to detect HDAC enzyme activity
using an HDAC assay kit according to the manufac-turer’s recommendations. Briefly, nuclear extracts (7 μg)were added to a 96-well half-volume black plate, mixedwith HDAC assay buffer and HDAC substrate (final con-centration: 100 μM), and incubated at 37°C for 50 min.
Winick-Ng et al. BMC Pharmacology and Toxicology 2012, 13:11 Page 5 of 16http://www.biomedcentral.com/bmcpharmacoltoxicol/2050-6511/13/1/11
Following incubation, HDAC reactions were halted usingHDAC developer (containing 2 μM Trichostatin A, finalconcentration: 1 μM) and incubated at room temperaturefor 12 to15 min. Fluorescence was detected using theFLUOstar Optima plate reader with an excitationwavelength at 350 nm and an emission wavelength at460 nm.
Data Analysis & StatisticsFor western blot analysis, each band was analyzed densi-tometrically as described previously [52,65]. To accountfor variability between blots, the densitometric value foreach individual MOR band was expressed as a fractionof the total amount of MOR protein present on the en-tire blot (ie. sample MOR density/sum of density of allMOR bands on blot). The same analysis was carried outfor α-tubulin and then MOR protein values were nor-malized to α-tubulin values from the same sample.For qPCR analysis, relative mRNA levels were deter-
mined using the delta-deltaCt method of analysis. Athreshold cycle (CT) was determined for each data point.A ratio was then determined for each sample using bythe following formula:
Ratio ¼ 2� CT GENEð Þ�CT β2Mð Þ½ � ð1Þwhere CT(GENE) was the gene of interest, and CT(β2M)
was the CT for β-2-microglobulin. Each data point wasthen expressed relative to the control sample.In order to determine HDAC enzyme activity, a stand-
ard curve was prepared using known HDAC assaystandard dilutions. The amount of fluorescence recordedwas then extrapolated to the pM amount of productformed (PF) from the standard curve. The specific activ-ity (SpA) in pM/min/mg was then determined using thePF, incubation time in min (IT), and mass of nuclear ex-tract in mg (mnx), by using the following formula:
SpA ¼ PF=ITð Þ=mnx ð2ÞTo determine relative luciferase activity, each sample
was expressed as a percentage of the total amount ofluciferase activity detected for each sample set. Lucifer-ase activity was then normalized to β-gal activity withinthe same sample.Data are representative of 5 independent experiments
(except where otherwise indicated) and are presented asthe mean ± standard error of the mean (SEM). Datawere assessed for normality and homogeneity of varianceand statistical analysis was carried out using a one ortwo-way analysis of variance (ANOVA). In the case of aone-way ANOVA, analysis was followed by Dunnett’stest or the Tukey-Kramer Multiple Comparisons test todetermine which groups were significantly different.One-way ANOVA analysis was carried out for protein
and RNA analysis of MOR levels following cocaine treat-ment, or for experiments with L-NAME pretreatment.For RNA analysis with cocaine and L-NAME, the datadid not pass the Bartlett test for homogeneity of vari-ance, therefore a Kruskal-Wallis non-parametric ANOVAwas performed. For two-way ANOVA with interaction,analysis was followed by Bonferroni’s multiple compari-sons t-test to determine which groups were significantlydifferent. This analysis was used to determine significantchanges in MOR protein expression following cocaine andcurcumin treatments, and used to determine significantchanges in c-fos mRNA expression following cocaine treat-ments over time. For two-way ANOVA without inter-action, analysis was followed by contrast analysis todetermine which groups were significantly different, andwas used to determine significant changes in histone dea-cetylase activity following cocaine administration. Meanvalues were considered different if p<0.05.For the protein half-life and AP-1 experiments, follow-
ing western blot and luciferase analysis as describedabove, data were assessed for normality and homogen-eity of variance. Due to a large disparity between var-iances, the natural log was taken for each data point. Forthe AP-1 luciferase analysis experiment, statistical ana-lysis was carried out using a one-way ANOVA. Follow-ing transformation in the protein half-life experiment,data were analyzed using an analysis of co-variance(ANCOVA) to determine the effect of each treatment, aswell as significant differences that may exist between theslopes of the resulting regression lines. The original rawdata was also used to perform an ANCOVA, and, wherepossible, the resulting regression line was used to deter-mine an approximate MOR half-life for each treatment.Mean values were considered different if p<0.05.Data analysis was carried out using GraphPad InStat for
one way ANOVA analysis, GraphPad Prism 4.0 or SAS 9.2(SAS Institute, Cary, NC) for two-way ANOVA analysiswith interaction, and SAS 9.2 for two-way ANOVA ana-lysis without interaction, as well as ANCOVA analysis.
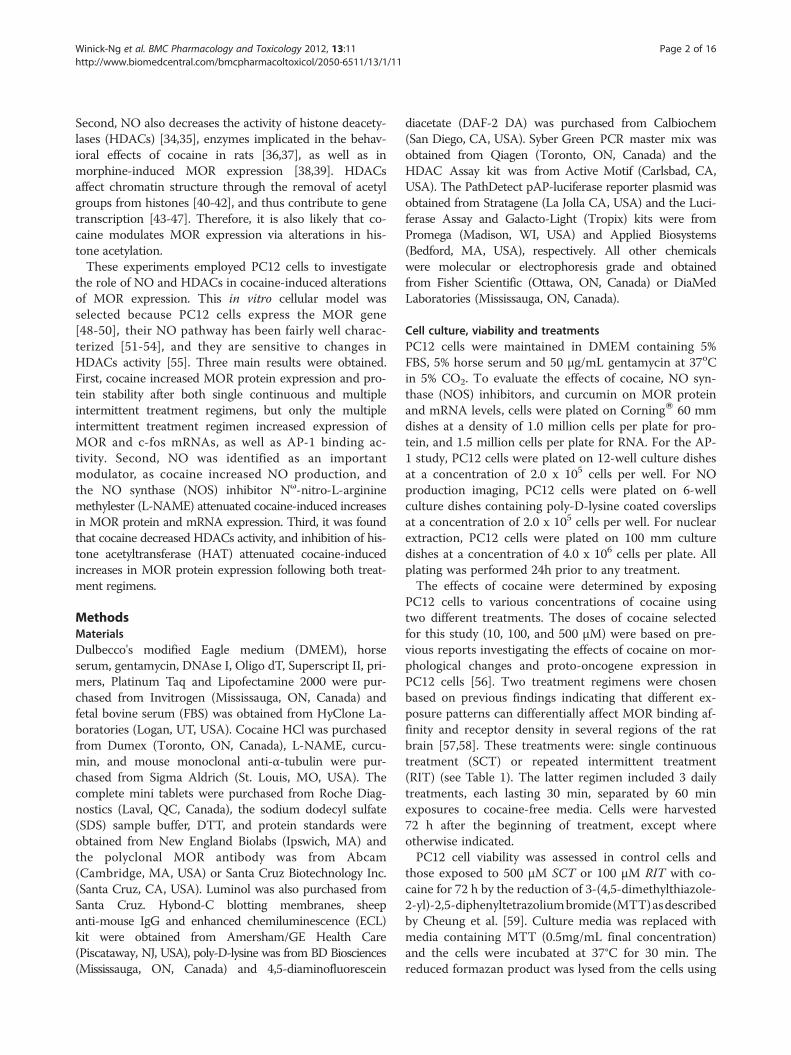
ResultsCocaine modulates MOR protein and mRNA levels, andprotein half-lifeThe effect of cocaine on MOR protein levels was evalu-ated in extracts of control and treated (see Table 1 fortreatment details) PC12 cells using western blot analysis.Figure 1A displays a representative immunoblot of MORlevels (upper panel) and corresponding α-tubulin levels(lower panel) obtained from cells treated with SCT orRIT with 10, 100 or 500 μM cocaine for 72 h. Densito-metric analysis (Figure 1B) revealed a significant increasein MOR protein levels [F(6,33)= 5.75] relative to controlin cells exposed to 500 μM SCT (p<0.05) or 100 μM RIT
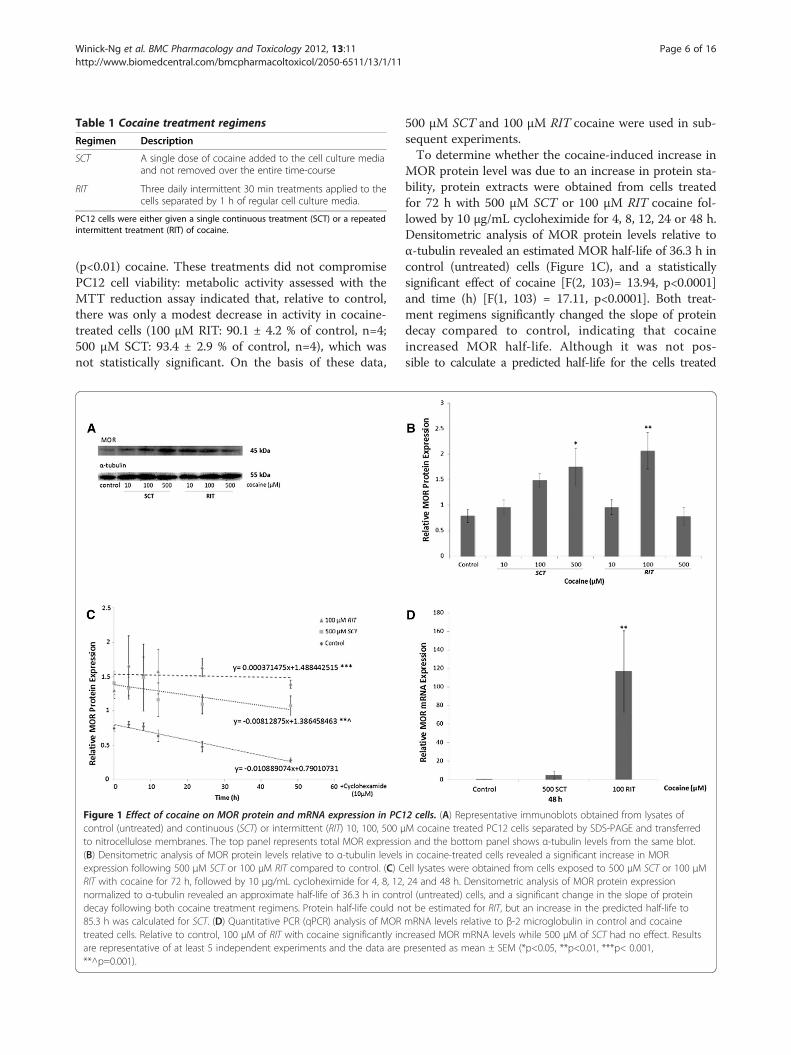
Table 1 Cocaine treatment regimens
Regimen Description
SCT A single dose of cocaine added to the cell culture mediaand not removed over the entire time-course
RIT Three daily intermittent 30 min treatments applied to thecells separated by 1 h of regular cell culture media.
PC12 cells were either given a single continuous treatment (SCT) or a repeatedintermittent treatment (RIT) of cocaine.
Winick-Ng et al. BMC Pharmacology and Toxicology 2012, 13:11 Page 6 of 16http://www.biomedcentral.com/bmcpharmacoltoxicol/2050-6511/13/1/11
(p<0.01) cocaine. These treatments did not compromisePC12 cell viability: metabolic activity assessed with theMTT reduction assay indicated that, relative to control,there was only a modest decrease in activity in cocaine-treated cells (100 μM RIT: 90.1 ± 4.2 % of control, n=4;500 μM SCT: 93.4 ± 2.9 % of control, n=4), which wasnot statistically significant. On the basis of these data,
Figure 1 Effect of cocaine on MOR protein and mRNA expression in PC1control (untreated) and continuous (SCT) or intermittent (RIT) 10, 100, 500 μto nitrocellulose membranes. The top panel represents total MOR expressio(B) Densitometric analysis of MOR protein levels relative to α-tubulin levelsexpression following 500 μM SCT or 100 μM RIT compared to control. (C) CRIT with cocaine for 72 h, followed by 10 μg/mL cycloheximide for 4, 8, 12normalized to α-tubulin revealed an approximate half-life of 36.3 h in contrdecay following both cocaine treatment regimens. Protein half-life could n85.3 h was calculated for SCT. (D) Quantitative PCR (qPCR) analysis of MORtreated cells. Relative to control, 100 μM of RIT with cocaine significantly inare representative of at least 5 independent experiments and the data are**^p=0.001).
500 μM SCT and 100 μM RIT cocaine were used in sub-sequent experiments.To determine whether the cocaine-induced increase in
MOR protein level was due to an increase in protein sta-bility, protein extracts were obtained from cells treatedfor 72 h with 500 μM SCT or 100 μM RIT cocaine fol-lowed by 10 μg/mL cycloheximide for 4, 8, 12, 24 or 48 h.Densitometric analysis of MOR protein levels relative toα-tubulin revealed an estimated MOR half-life of 36.3 h incontrol (untreated) cells (Figure 1C), and a statisticallysignificant effect of cocaine [F(2, 103)= 13.94, p<0.0001]and time (h) [F(1, 103) = 17.11, p<0.0001]. Both treat-ment regimens significantly changed the slope of proteindecay compared to control, indicating that cocaineincreased MOR half-life. Although it was not pos-sible to calculate a predicted half-life for the cells treated
2 cells. (A) Representative immunoblots obtained from lysates ofM cocaine treated PC12 cells separated by SDS-PAGE and transferredn and the bottom panel shows α-tubulin levels from the same blot.in cocaine-treated cells revealed a significant increase in MORell lysates were obtained from cells exposed to 500 μM SCT or 100 μM, 24 and 48 h. Densitometric analysis of MOR protein expressionol (untreated) cells, and a significant change in the slope of proteinot be estimated for RIT, but an increase in the predicted half-life tomRNA levels relative to β-2 microglobulin in control and cocainecreased MOR mRNA levels while 500 μM of SCT had no effect. Resultspresented as mean ± SEM (*p<0.05, **p<0.01, ***p< 0.001,
Winick-Ng et al. BMC Pharmacology and Toxicology 2012, 13:11 Page 7 of 16http://www.biomedcentral.com/bmcpharmacoltoxicol/2050-6511/13/1/11
with 100 μM RIT cocaine, MOR protein half-life followingexposure to 500 μM SCT was estimated to be 85.3 h.The effect of cocaine on MOR mRNA levels was also
examined (Figure 1D). RNAwas isolated from cells treatedfor 48 h with either 500 μM SCT or 100 μM RIT cocaineand levels of MOR mRNA relative to β2-microglobulinwere assessed by reverse transcriptase (RT)-real time PCR(qPCR) analysis. Compared to control, a statistically sig-nificant increase in relative MOR mRNA levels wasdetected in cocaine-treated cells following RIT [F(2,15)=6.80, p<0.01], but not SCT.
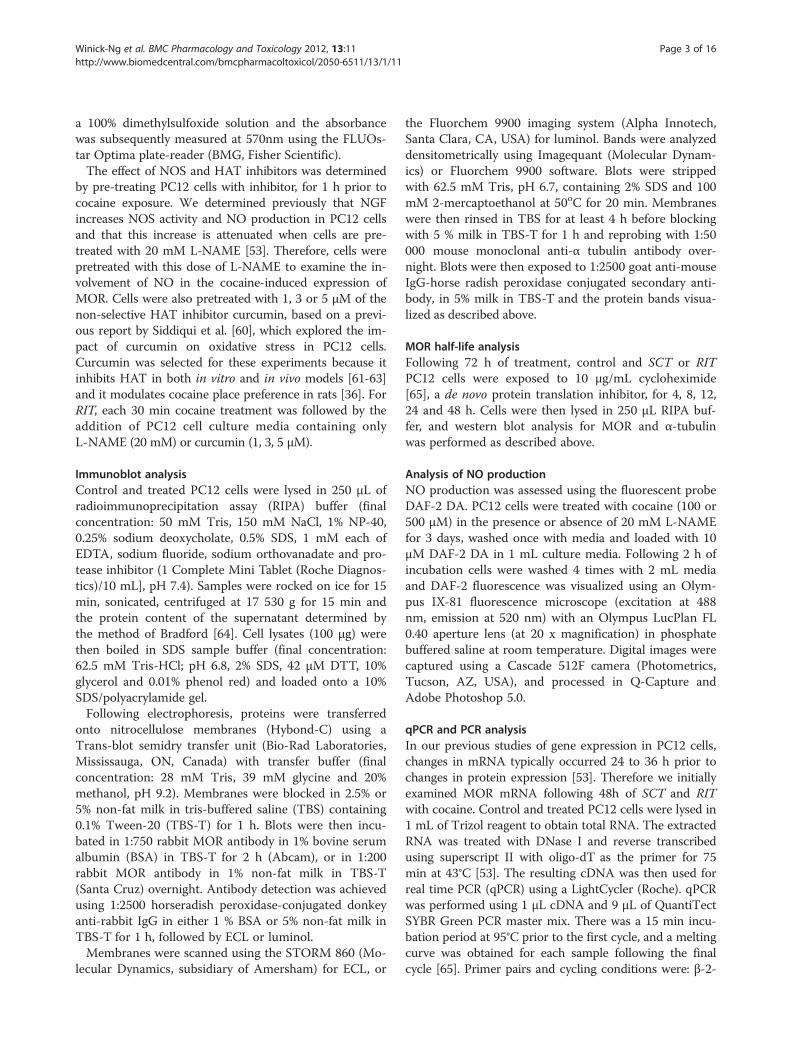
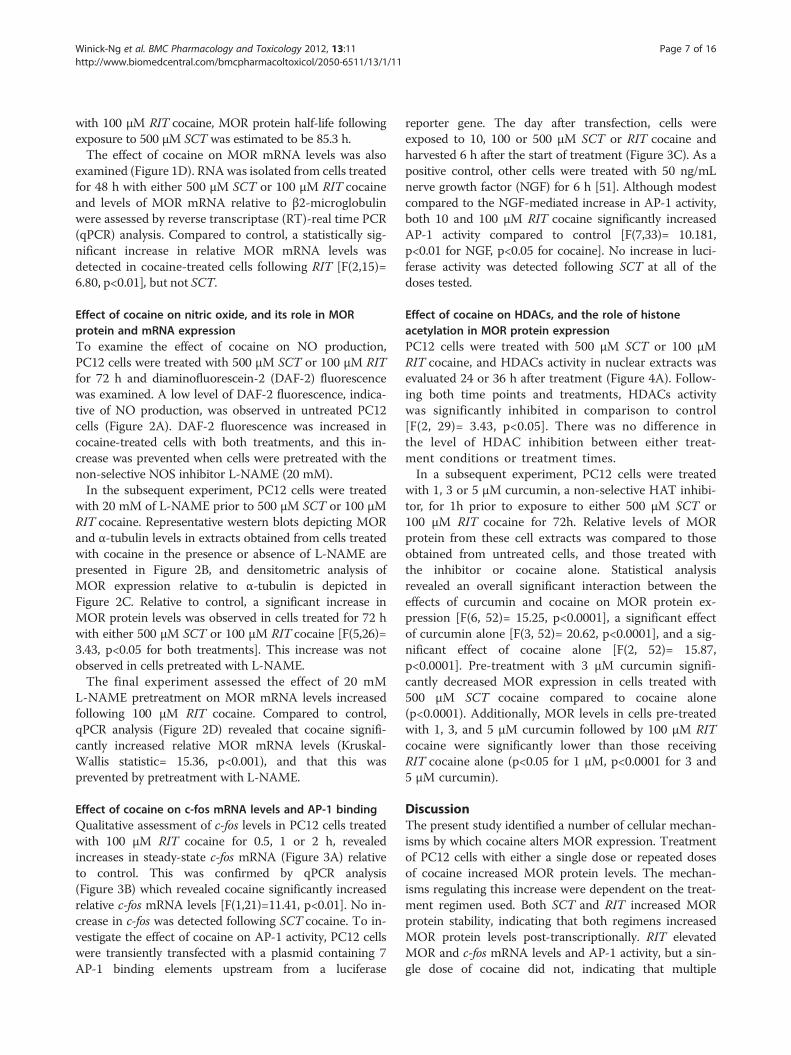
Effect of cocaine on nitric oxide, and its role in MORprotein and mRNA expressionTo examine the effect of cocaine on NO production,PC12 cells were treated with 500 μM SCT or 100 μM RITfor 72 h and diaminofluorescein-2 (DAF-2) fluorescencewas examined. A low level of DAF-2 fluorescence, indica-tive of NO production, was observed in untreated PC12cells (Figure 2A). DAF-2 fluorescence was increased incocaine-treated cells with both treatments, and this in-crease was prevented when cells were pretreated with thenon-selective NOS inhibitor L-NAME (20 mM).In the subsequent experiment, PC12 cells were treated
with 20 mM of L-NAME prior to 500 μM SCT or 100 μMRIT cocaine. Representative western blots depicting MORand α-tubulin levels in extracts obtained from cells treatedwith cocaine in the presence or absence of L-NAME arepresented in Figure 2B, and densitometric analysis ofMOR expression relative to α-tubulin is depicted inFigure 2C. Relative to control, a significant increase inMOR protein levels was observed in cells treated for 72 hwith either 500 μM SCT or 100 μM RIT cocaine [F(5,26)=3.43, p<0.05 for both treatments]. This increase was notobserved in cells pretreated with L-NAME.The final experiment assessed the effect of 20 mM
L-NAME pretreatment on MOR mRNA levels increasedfollowing 100 μM RIT cocaine. Compared to control,qPCR analysis (Figure 2D) revealed that cocaine signifi-cantly increased relative MOR mRNA levels (Kruskal-Wallis statistic= 15.36, p<0.001), and that this wasprevented by pretreatment with L-NAME.
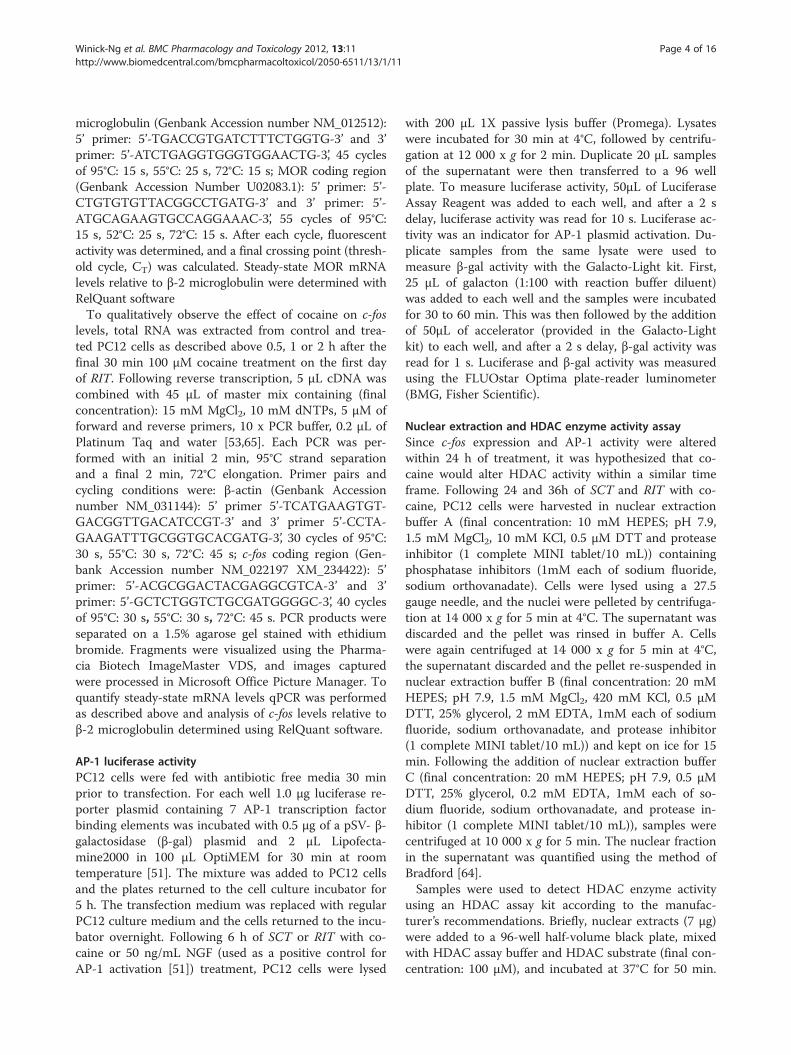
Effect of cocaine on c-fos mRNA levels and AP-1 bindingQualitative assessment of c-fos levels in PC12 cells treatedwith 100 μM RIT cocaine for 0.5, 1 or 2 h, revealedincreases in steady-state c-fos mRNA (Figure 3A) relativeto control. This was confirmed by qPCR analysis(Figure 3B) which revealed cocaine significantly increasedrelative c-fos mRNA levels [F(1,21)=11.41, p<0.01]. No in-crease in c-fos was detected following SCT cocaine. To in-vestigate the effect of cocaine on AP-1 activity, PC12 cellswere transiently transfected with a plasmid containing 7AP-1 binding elements upstream from a luciferase
reporter gene. The day after transfection, cells wereexposed to 10, 100 or 500 μM SCT or RIT cocaine andharvested 6 h after the start of treatment (Figure 3C). As apositive control, other cells were treated with 50 ng/mLnerve growth factor (NGF) for 6 h [51]. Although modestcompared to the NGF-mediated increase in AP-1 activity,both 10 and 100 μM RIT cocaine significantly increasedAP-1 activity compared to control [F(7,33)= 10.181,p<0.01 for NGF, p<0.05 for cocaine]. No increase in luci-ferase activity was detected following SCT at all of thedoses tested.
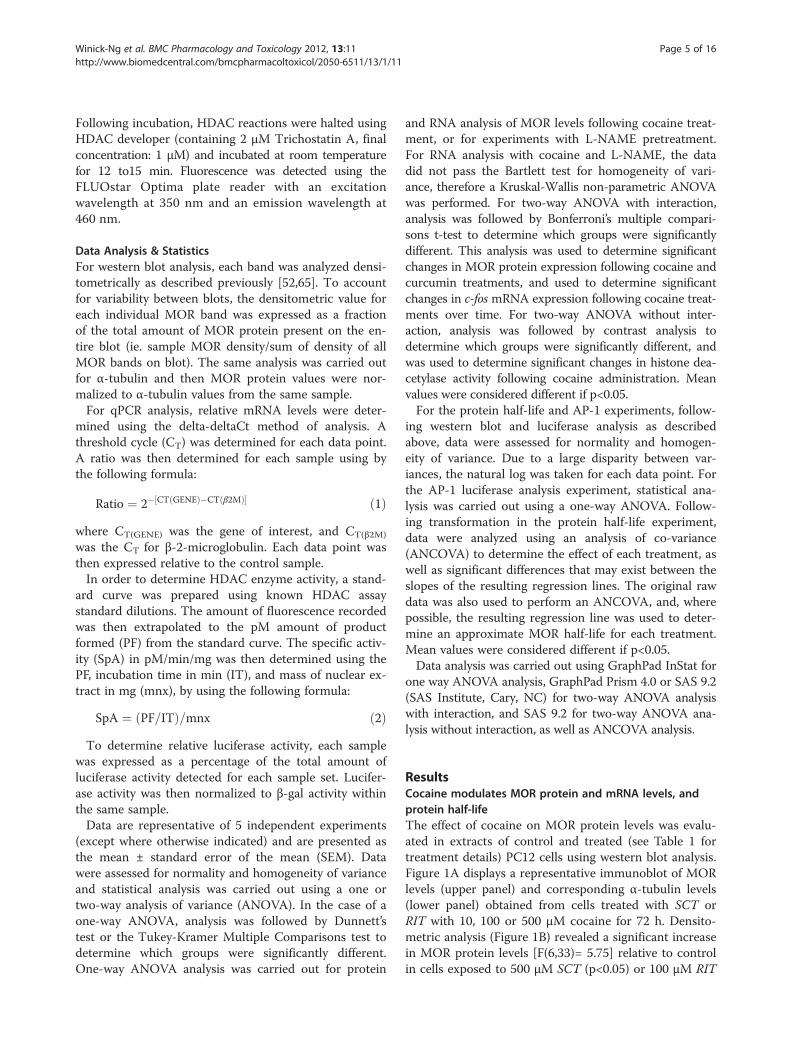
Effect of cocaine on HDACs, and the role of histoneacetylation in MOR protein expressionPC12 cells were treated with 500 μM SCT or 100 μMRIT cocaine, and HDACs activity in nuclear extracts wasevaluated 24 or 36 h after treatment (Figure 4A). Follow-ing both time points and treatments, HDACs activitywas significantly inhibited in comparison to control[F(2, 29)= 3.43, p<0.05]. There was no difference inthe level of HDAC inhibition between either treat-ment conditions or treatment times.In a subsequent experiment, PC12 cells were treated
with 1, 3 or 5 μM curcumin, a non-selective HAT inhibi-tor, for 1h prior to exposure to either 500 μM SCT or100 μM RIT cocaine for 72h. Relative levels of MORprotein from these cell extracts was compared to thoseobtained from untreated cells, and those treated withthe inhibitor or cocaine alone. Statistical analysisrevealed an overall significant interaction between theeffects of curcumin and cocaine on MOR protein ex-pression [F(6, 52)= 15.25, p<0.0001], a significant effectof curcumin alone [F(3, 52)= 20.62, p<0.0001], and a sig-nificant effect of cocaine alone [F(2, 52)= 15.87,p<0.0001]. Pre-treatment with 3 μM curcumin signifi-cantly decreased MOR expression in cells treated with500 μM SCT cocaine compared to cocaine alone(p<0.0001). Additionally, MOR levels in cells pre-treatedwith 1, 3, and 5 μM curcumin followed by 100 μM RITcocaine were significantly lower than those receivingRIT cocaine alone (p<0.05 for 1 μM, p<0.0001 for 3 and5 μM curcumin).
DiscussionThe present study identified a number of cellular mechan-isms by which cocaine alters MOR expression. Treatmentof PC12 cells with either a single dose or repeated dosesof cocaine increased MOR protein levels. The mechan-isms regulating this increase were dependent on the treat-ment regimen used. Both SCT and RIT increased MORprotein stability, indicating that both regimens increasedMOR protein levels post-transcriptionally. RIT elevatedMOR and c-fos mRNA levels and AP-1 activity, but a sin-gle dose of cocaine did not, indicating that multiple
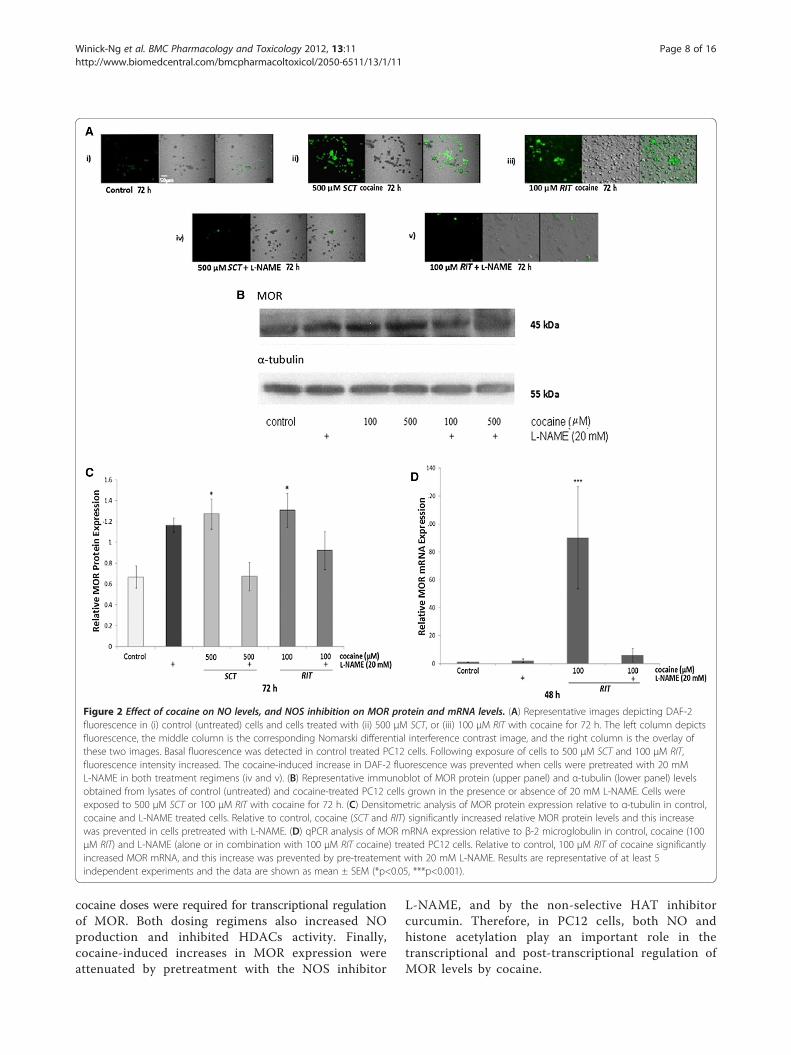
Figure 2 Effect of cocaine on NO levels, and NOS inhibition on MOR protein and mRNA levels. (A) Representative images depicting DAF-2fluorescence in (i) control (untreated) cells and cells treated with (ii) 500 μM SCT, or (iii) 100 μM RIT with cocaine for 72 h. The left column depictsfluorescence, the middle column is the corresponding Nomarski differential interference contrast image, and the right column is the overlay ofthese two images. Basal fluorescence was detected in control treated PC12 cells. Following exposure of cells to 500 μM SCT and 100 μM RIT,fluorescence intensity increased. The cocaine-induced increase in DAF-2 fluorescence was prevented when cells were pretreated with 20 mML-NAME in both treatment regimens (iv and v). (B) Representative immunoblot of MOR protein (upper panel) and α-tubulin (lower panel) levelsobtained from lysates of control (untreated) and cocaine-treated PC12 cells grown in the presence or absence of 20 mM L-NAME. Cells wereexposed to 500 μM SCT or 100 μM RIT with cocaine for 72 h. (C) Densitometric analysis of MOR protein expression relative to α-tubulin in control,cocaine and L-NAME treated cells. Relative to control, cocaine (SCT and RIT) significantly increased relative MOR protein levels and this increasewas prevented in cells pretreated with L-NAME. (D) qPCR analysis of MOR mRNA expression relative to β-2 microglobulin in control, cocaine (100μM RIT) and L-NAME (alone or in combination with 100 μM RIT cocaine) treated PC12 cells. Relative to control, 100 μM RIT of cocaine significantlyincreased MOR mRNA, and this increase was prevented by pre-treatement with 20 mM L-NAME. Results are representative of at least 5independent experiments and the data are shown as mean ± SEM (*p<0.05, ***p<0.001).
Winick-Ng et al. BMC Pharmacology and Toxicology 2012, 13:11 Page 8 of 16http://www.biomedcentral.com/bmcpharmacoltoxicol/2050-6511/13/1/11
cocaine doses were required for transcriptional regulationof MOR. Both dosing regimens also increased NOproduction and inhibited HDACs activity. Finally,cocaine-induced increases in MOR expression wereattenuated by pretreatment with the NOS inhibitor
L-NAME, and by the non-selective HAT inhibitorcurcumin. Therefore, in PC12 cells, both NO andhistone acetylation play an important role in thetranscriptional and post-transcriptional regulation ofMOR levels by cocaine.
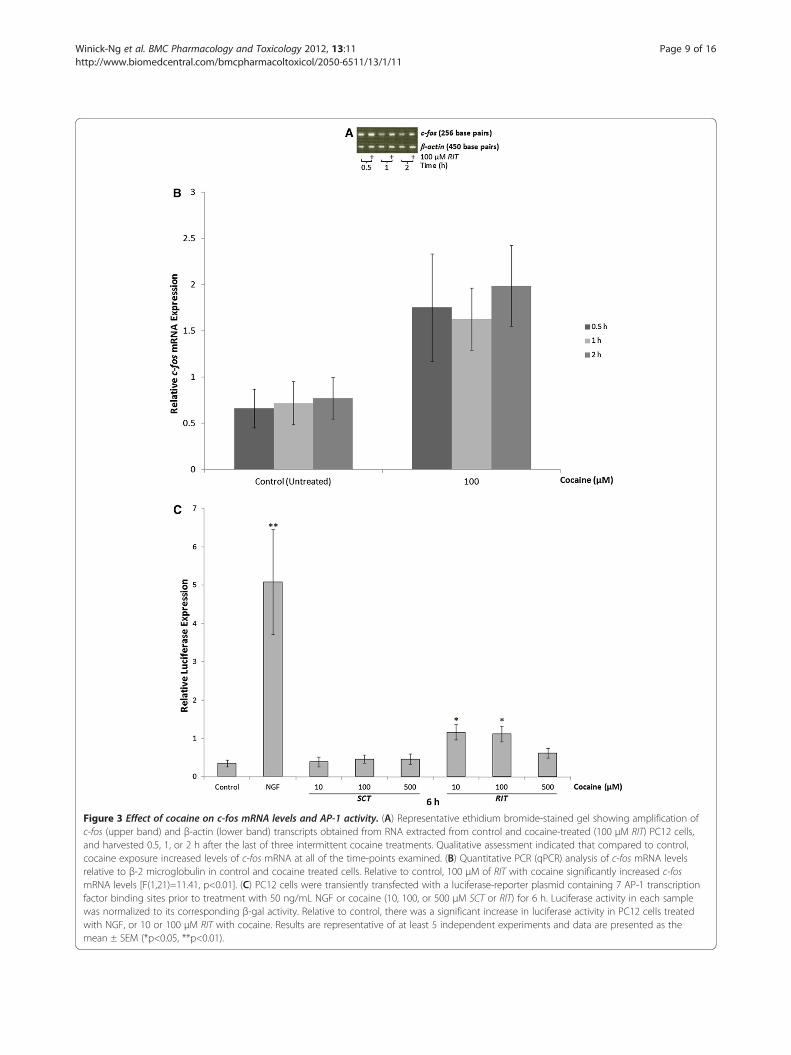
Figure 3 Effect of cocaine on c-fos mRNA levels and AP-1 activity. (A) Representative ethidium bromide-stained gel showing amplification ofc-fos (upper band) and β-actin (lower band) transcripts obtained from RNA extracted from control and cocaine-treated (100 μM RIT) PC12 cells,and harvested 0.5, 1, or 2 h after the last of three intermittent cocaine treatments. Qualitative assessment indicated that compared to control,cocaine exposure increased levels of c-fos mRNA at all of the time-points examined. (B) Quantitative PCR (qPCR) analysis of c-fos mRNA levelsrelative to β-2 microglobulin in control and cocaine treated cells. Relative to control, 100 μM of RIT with cocaine significantly increased c-fosmRNA levels [F(1,21)=11.41, p<0.01]. (C) PC12 cells were transiently transfected with a luciferase-reporter plasmid containing 7 AP-1 transcriptionfactor binding sites prior to treatment with 50 ng/mL NGF or cocaine (10, 100, or 500 μM SCT or RIT) for 6 h. Luciferase activity in each samplewas normalized to its corresponding β-gal activity. Relative to control, there was a significant increase in luciferase activity in PC12 cells treatedwith NGF, or 10 or 100 μM RIT with cocaine. Results are representative of at least 5 independent experiments and data are presented as themean ± SEM (*p<0.05, **p<0.01).
Winick-Ng et al. BMC Pharmacology and Toxicology 2012, 13:11 Page 9 of 16http://www.biomedcentral.com/bmcpharmacoltoxicol/2050-6511/13/1/11
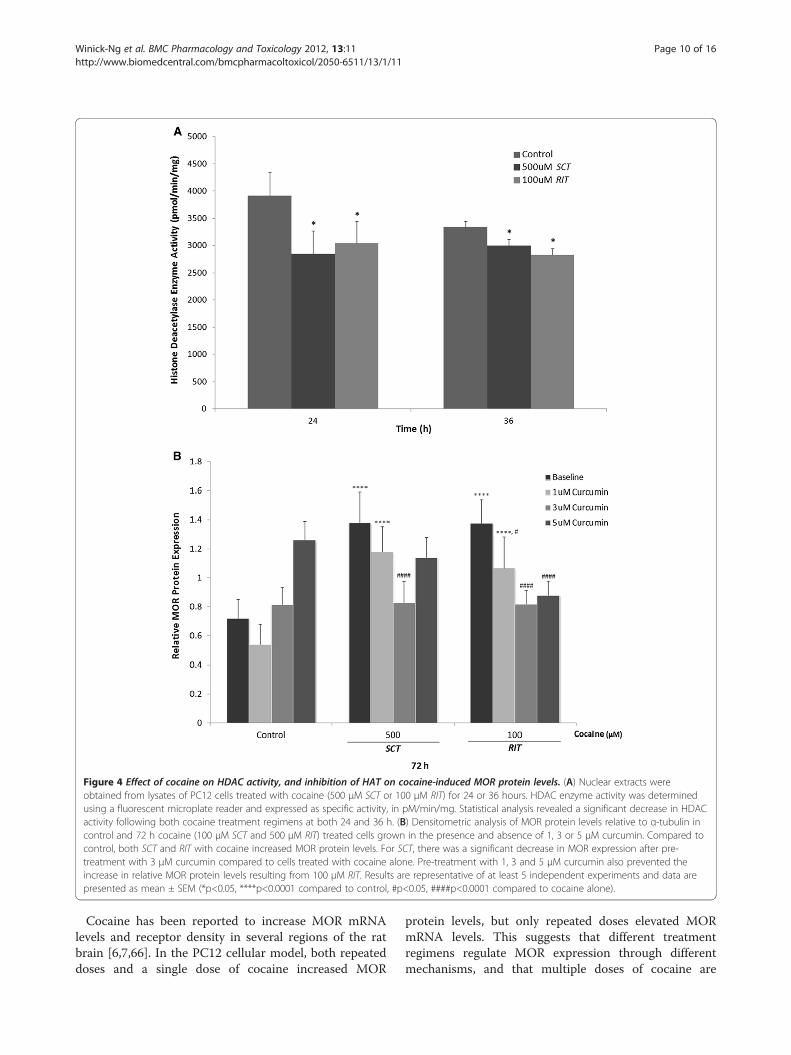
Figure 4 Effect of cocaine on HDAC activity, and inhibition of HAT on cocaine-induced MOR protein levels. (A) Nuclear extracts wereobtained from lysates of PC12 cells treated with cocaine (500 μM SCT or 100 μM RIT) for 24 or 36 hours. HDAC enzyme activity was determinedusing a fluorescent microplate reader and expressed as specific activity, in pM/min/mg. Statistical analysis revealed a significant decrease in HDACactivity following both cocaine treatment regimens at both 24 and 36 h. (B) Densitometric analysis of MOR protein levels relative to α-tubulin incontrol and 72 h cocaine (100 μM SCT and 500 μM RIT) treated cells grown in the presence and absence of 1, 3 or 5 μM curcumin. Compared tocontrol, both SCT and RIT with cocaine increased MOR protein levels. For SCT, there was a significant decrease in MOR expression after pre-treatment with 3 μM curcumin compared to cells treated with cocaine alone. Pre-treatment with 1, 3 and 5 μM curcumin also prevented theincrease in relative MOR protein levels resulting from 100 μM RIT. Results are representative of at least 5 independent experiments and data arepresented as mean ± SEM (*p<0.05, ****p<0.0001 compared to control, #p<0.05, ####p<0.0001 compared to cocaine alone).
Winick-Ng et al. BMC Pharmacology and Toxicology 2012, 13:11 Page 10 of 16http://www.biomedcentral.com/bmcpharmacoltoxicol/2050-6511/13/1/11
Cocaine has been reported to increase MOR mRNAlevels and receptor density in several regions of the ratbrain [6,7,66]. In the PC12 cellular model, both repeateddoses and a single dose of cocaine increased MOR
protein levels, but only repeated doses elevated MORmRNA levels. This suggests that different treatmentregimens regulate MOR expression through differentmechanisms, and that multiple doses of cocaine are
Winick-Ng et al. BMC Pharmacology and Toxicology 2012, 13:11 Page 11 of 16http://www.biomedcentral.com/bmcpharmacoltoxicol/2050-6511/13/1/11
necessary for transcriptional regulation of the MOR. Toinvestigate this possibility further, the effect of RIT andSCT cocaine on potential transcriptional regulators ofMOR expression, c-fos expression and AP-1 activity, wasalso assessed.Several studies have demonstrated increases in c-Fos
levels following cocaine administration [27,30,31,40,67].c-Fos binds to members of the Jun immediate early genefamily to form the AP-1 transcription factor [68,69].Since the promoter of the MOR gene contains consen-sus sequences for binding AP-1 transcription factors[33], AP-1 activity was assessed in PC12 cells treatedwith cocaine. It was found that the effect of cocaine onAP-1 activity was dependent on the treatment regimen.In fact, only exposure to multiple cocaine dosesincreased c-fos mRNA levels and AP-1 activity, suggest-ing that increased MOP-r mRNA levels induced by100 uM RIT in PC12 cells could be mediated by AP-1.Increased c-fos expression following repeated in vivococaine administration has been linked to cocaine-induced phosphorylation of CREB [70]. Since CREB isan important regulator of c-fos transcription (reviewedin [71]), it is possible the increased c-fos mRNA levelsobserved following RIT in the present study are the re-sult of cocaine-induced CREB phosphorylation. Al-though we only focused on one potential candidate,other transcription factors, such as SP-1 and NF-κBare also increased in PC12 cells following cocaine ad-ministration. [72,73] and activation of these transcrip-tion factors has been linked to increases in MORtranscription and mRNA expression [74-76]).The present study also investigated the role of NO in
regulating cocaine-induced changes in MOR proteinlevels. NO has been found to contribute to the behavioraleffects of cocaine, including conditioned place preferenceand sensitization [77-83]. In addition, NO has beenreported to modulate CREB phosphorylation and DNAbinding [84,85], increase the expression of immediateearly genes such as c-Fos and Jun-B [25,28,29] and in-crease transcription from AP-1 responsive promoters[25,29], suggesting that NO could also be involved inregulating MOR transcription. In PC12 cells, pre-treatment with the NOS inhibitor L-NAME preventedcocaine-induced up-regulation of MOR mRNA and pro-tein. Additionally, NO production was assessed visually byloading the cells with DAF-2DA as described previously[53]. Both 100 μM RIT and 500 μM SCT cocaine substan-tially enhanced DAF-2 fluorescence relative to control(untreated) cells indicating both dosing regimens result inincreased NO production. This cocaine-mediated increasein DAF-2 fluorescence was blocked by pre-treated with 20mM L-NAME, the dose of L-NAME that also preventedcocaine-induced increases in MOR protein and mRNAlevels. Taken together, these findings indicate that NO
modulates cocaine-induced changes in MOR proteinlevels. Interestingly, in in vivo neuronal models, cocaineincreases NO production by increasing neuronal NOS(nNOS) protein levels and activation [22,23,78,79] viadopamine-, glutamate- and MOR-dependent mechanisms[22,23,79]. Because the PC12 cell culture model does notcontain these pre- and post-synaptic systems, the currentfindings support the intriguing possibility that cocaine canalter NO levels and/or activity by direct intracellularactions. The specific target of these direct actions, and itsbiological significance, will require further investigation.These experiments in PC12 cells identified another
possible mechanism through which cocaine could in-crease MOR expression. NO has been reported to de-crease HDACs activity [34,35], enzymes that are linkedto the behavioral effects of cocaine in rats [36,37], and in-hibition of these enzymes prolongs histone acetylationand contributes to enhanced transcription [43-47]. In thepresent study, both RIT and SCT cocaine decreasedHDACs activity indicating that in vitro cocaine exposureenhances histone acetylation. In addition, pre-treatmentwith the non-selective HAT inhibitor curcumin pre-vented the cocaine-induced up-regulation of MOR pro-tein levels for both dosing regimens. In vivo studies inrats have demonstrated that cocaine increases histoneacetylation [36,86,87]. Our findings complement and ex-tend these findings, and suggest that cocaine-mediatedalterations in histone acetylation could be an importantregulator of MOR protein levels. However, additionalactions of curcumin could also contribute to theseeffects. In fact, cocaine induces the expression of cyto-kines, such as interleukin-1β [88] which can also regulateMOR transcription [89]. Curcumin inhibits interleukin-1β-induced NF-κB activation [90], suggesting the possi-bility that the anti-inflammatory properties of curcumincould contribute to its ability to inhibit MORtranscription.The relationship between NO and HDACs is also
complex. Although the cocaine-induced increase in NOobserved in the present study could be responsible fordecreasing HDACs activity, inhibition of HDACs hasalso been associated with increases in eNOS mRNA[91]. Increased constitutive NOS levels and increases inNO production resulting in S-nitrosylation have beenreported to regulate protein stability [43,44,47]. Thus, inthe PC12 cell model, NO and HDACs could modulateMOR expression independently, or may regulate eachother to affect MOR transcription and protein stability.As well, the cocaine-induced increase in c-fos expressionand AP-1 activity, only observed after RIT, together withincreased histone acetylation could be involved in thetranscriptional regulation of MOR. Interestingly, bothcocaine and NO were reported to increase c-fos expres-sion in vivo [92], and increases in c-fos are correlated
Winick-Ng et al. BMC Pharmacology and Toxicology 2012, 13:11 Page 12 of 16http://www.biomedcentral.com/bmcpharmacoltoxicol/2050-6511/13/1/11
with hyperacetylation of H3 histones during chronic co-caine administration and H4 histones after a single acutedose [93], suggesting that similar cellular mechanismscould be regulating the effects of cocaine in vitro andin vivo.Although we identified NO and histone acetylation as
important regulators of cocaine-induced MOR proteinexpression, how cocaine initiated the observed effectsremains unclear. Blockade of sodium channels followingpassive entry of cocaine into PC12 cells is one possibil-ity. However, this may not be the only mechanism be-cause, in PC12 cells, NO activity is associated withextracellular signal-regulated kinase (ERK) pathway acti-vation [94-97], and Tan et al. [98] found that the select-ive sodium channel inhibitor tetrodotoxin had no effecton this pathway. We determined previously that NOmodulates ERK activity in PC12 cells [54], and sinceblockade of ERK phosphorylation in the nucleus accum-bens of rats inhibits cocaine-induced behaviouralsensitization [99], it is possible that in our system NO-mediated activation of ERK contributes to cocaine-induced MOR expression. In vivo cocaine exposureincreases dopamine accumulation, through inhibition ofdopamine reuptake by the dopamine transporter (for
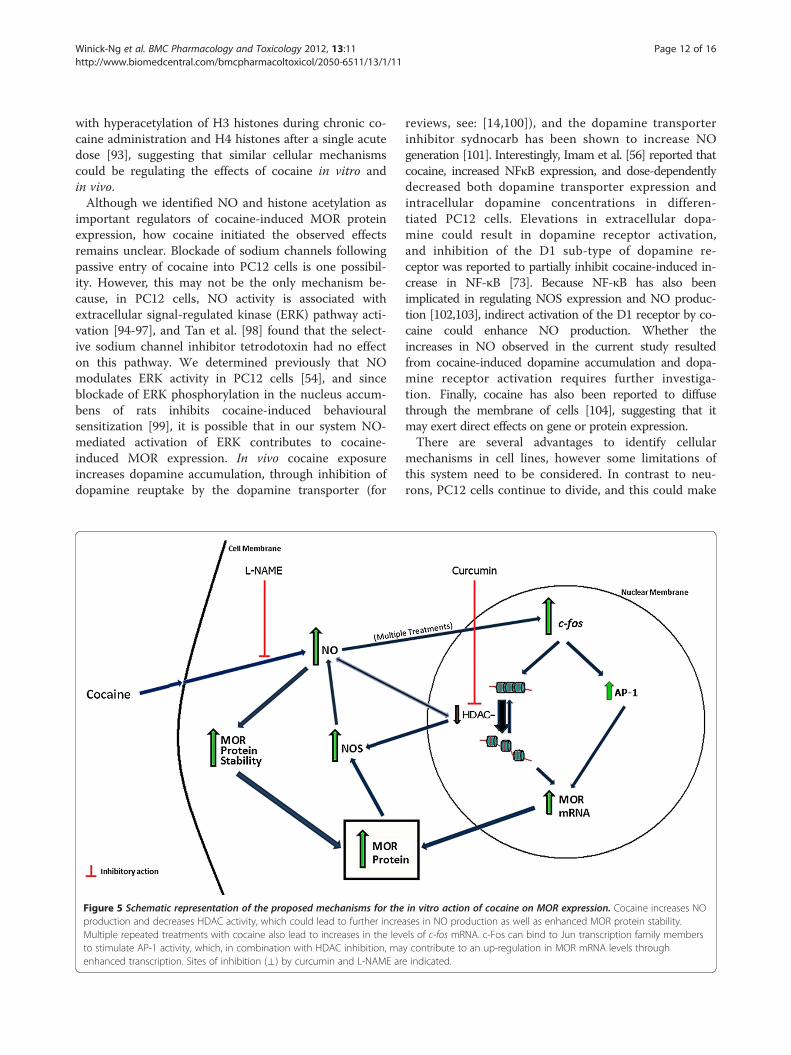
Figure 5 Schematic representation of the proposed mechanisms for theproduction and decreases HDAC activity, which could lead to further increMultiple repeated treatments with cocaine also lead to increases in the levto stimulate AP-1 activity, which, in combination with HDAC inhibition, maenhanced transcription. Sites of inhibition (⊥) by curcumin and L-NAME ar
reviews, see: [14,100]), and the dopamine transporterinhibitor sydnocarb has been shown to increase NOgeneration [101]. Interestingly, Imam et al. [56] reported thatcocaine, increased NFκB expression, and dose-dependentlydecreased both dopamine transporter expression andintracellular dopamine concentrations in differen-tiated PC12 cells. Elevations in extracellular dopa-mine could result in dopamine receptor activation,and inhibition of the D1 sub-type of dopamine re-ceptor was reported to partially inhibit cocaine-induced in-crease in NF-κB [73]. Because NF-κB has also beenimplicated in regulating NOS expression and NO produc-tion [102,103], indirect activation of the D1 receptor by co-caine could enhance NO production. Whether theincreases in NO observed in the current study resultedfrom cocaine-induced dopamine accumulation and dopa-mine receptor activation requires further investiga-tion. Finally, cocaine has also been reported to diffusethrough the membrane of cells [104], suggesting that itmay exert direct effects on gene or protein expression.There are several advantages to identify cellular
mechanisms in cell lines, however some limitations ofthis system need to be considered. In contrast to neu-rons, PC12 cells continue to divide, and this could make
in vitro action of cocaine on MOR expression. Cocaine increases NOases in NO production as well as enhanced MOR protein stability.els of c-fos mRNA. c-Fos can bind to Jun transcription family membersy contribute to an up-regulation in MOR mRNA levels throughe indicated.
Winick-Ng et al. BMC Pharmacology and Toxicology 2012, 13:11 Page 13 of 16http://www.biomedcentral.com/bmcpharmacoltoxicol/2050-6511/13/1/11
them less vulnerable to neurotoxic compounds. Al-though we have identified many similarities between ourfindings and previous in vivo studies, differences in thebiology of cocaine in the intact organisms compared tothe effects observed in vitro are likely to exist. Thephysiological relevance of the doses and regimensemployed in these in vitro studies is also not known.The doses selected for the present study were based ona previous study that characterized changes in proto-oncogene expression in differentiated PC12 cells [56]. Itis not known whether similar treatment regimens, ordoses of cocaine, would exert similar effects in anin vitro neuronal model or in vivo. Further the authorsare not aware of any study that has established concen-trations of cocaine in the extracellular fluid required toinitiate changes in NO production or epigenetic modifi-cations in neurons, or whether cocaine can act on thesemechanisms by pathways that do not involve the trans-porters of catecholamines. Therefore, the current resultsin the PC12 cell model are important as they proposetestable hypotheses about cellular and molecularmechanisms through which cocaine modulates MORprotein and gene expression in neurons.
ConclusionsThe data presented in this study support a model in whichcocaine enhances MOR protein expression by increasingcellular NO levels and by decreasing HDAC activity(Figure 5). In addition to cocaine activating these effectsindependently, elevations in NO could also alter HDACactivity. Inhibition of HDACs could further enhance NOproduction, resulting in increased MOR expression andprotein stability. Additionally, increases in c-fos (followingmultiple treatments) may lead to a modest increasein AP-1 activity that, in combination with enhanced his-tone acetylation, could contribute to the up-regulation ofMOR transcription. Whether these mechanisms occur inneurons, and whether they have implications for the behav-ioral effects of cocaine, should be the focus of additionalinvestigations.
AbbreviationsANOVA: analysis of variance; ANCOVA: analysis of co-variance; AP-1: activatorprotein 1; DAF-2 DA: 4,5-diaminofluorescein diacetate; HAT: histoneacetyltransferase; HDAC: histone deacetylase; L-NAME: Nω-nitro-L-argininemethyl ester; MOR: μ-opioid receptor; nNOS: neuronal nitric oxide synthase;RIPA: radioimmunoprecipitation assay; SEM: standard error of the mean;TBS-T: TBS containing 0.1 % tween 20.
Competing interestsThe authors declare that they have no competing interests.
Authors’ contributionsWW carried out all of the above experiments, performed the statisticalanalysis and contributed to the preparation of the manuscript. FLparticipated in the experimental design of the study, provided some of thematerials used, and edited the manuscript. BK supervised the experiments,provided the laboratory facilities and the majority of the reagents used in
the study, and contributed to the preparation of the manuscript. All authorsparticipated equally in the conception of the study, the interpretation of thedata and have read and approved the final manuscript.
AcknowledgementsWe wish to thank Mrs. Jennifer Winick-Ng for her help and expertise in thestatistical analysis of this study, as well as Dr. Neil MacLusky for his carefulreview and editing of the manuscript. This work was supported by operatinggrants from the Natural Sciences and Engineering Research Council ofCanada (NSERC) to BK and FL.
Author details1Department of Biomedical Sciences, University of Guelph, Guelph, OntarioN1G 2W1, Canada. 2Department of Psychology, University of Guelph, Guelph,Ontario N1G 2W1, Canada.
Received: 23 April 2012 Accepted: 11 October 2012Published: 18 October 2012
References1. Cummins E, Leri F: Animal studies trigger new insights on the use of
methadone maintenance. Exp Opin Drug Disc 2009, 4:577.2. Kreek MJ, Zhou Y, Butelman ER, Levran O: Opiate and cocaine addiction:
from bench to clinic and back to the bench. Curr Opin Pharmacol 2009,9:74–80.
3. Roth-Deri I, Green-Sadan T, Yadid G: Beta-endorphin and drug-inducedreward and reinforcement. Prog Neurobiol 2008, 86:1–21.
4. Shippenberg TS, Zapata A, Chefer VI: Dynorphin and the pathophysiologyof drug addiction. Pharmacol 2007, 116:306–321.
5. Wee S, Koob GF: The role of the dynorphin-kappa opioid system in thereinforcing effects of drugs of abuse. Psychopharmacology (Berl) 2010,210:121–135.
6. Azaryan AV, Clock BJ, Cox BM: Mu opioid receptor mRNA in nucleusaccumbens is elevated following dopamine receptor activation.Neurochem Res 1996, 21:1411–1415.
7. Bailey A, Yuferov V, Bendor J, Schlussman SD, Zhou Y, Ho A, Kreek MJ:Immediate withdrawal from chronic "binge" cocaine administrationincreases mu-opioid receptor mRNA levels in rat frontal cortex.Brain Res Mol Brain Res 2005, 137:258–262.
8. Cohen BM, Nguyen TV, Hyman SE: Cocaine-induced changes in geneexpression in rat brain. NIDA Res Monogr 1991, 105:175–181.
9. Unterwald EM: Regulation of opioid receptors by cocaine. Ann N Y AcadSci 2001, 937:74–92.
10. Zhou Y, Spangler R, Schlussman SD, Yuferov VP, Sora I, Ho A, Uhl GR,Kreek MJ: Effects of acute "binge" cocaine on preprodynorphin,preproenkephalin, proopiomelanocortin, and corticotropin-releasinghormone receptor mRNA levels in the striatum and hypothalamic-pituitary-adrenal axis of mu-opioid receptor knockout mice. Synapse2002, 45:220–229.
11. Zhou Y, Proudnikov D, Yuferov V, Kreek MJ: Drug-induced and geneticalterations in stress-responsive systems: Implications for specificaddictive diseases. Brain Res 2010, 1314:235–252.
12. Di Chiara G: The role of dopamine in drug abuse viewed from theperspective of its role in motivation. Drug Alcohol Depend 1995,38:95–137.
13. Koob G, Kreek MJ: Stress, dysregulation of drug reward pathways, andthe transition to drug dependence. Am J Psychiatry 2007, 164:1149–1159.
14. Wise RA: Neurobiology of addiction. Curr Opin Neurobiol 1996, 6:243–251.15. Leri F, Zhou Y, Goddard B, Cummins E, Kreek MJ: Effects of high-dose
methadone maintenance on cocaine place conditioning, cocaineself-administration, and mu-opioid receptor mRNA expression in the ratbrain. Neuropsychopharmacology 2006, 31:1462–1474.
16. Leri F, Zhou Y, Goddard B, Levy A, Jacklin D, Kreek MJ: Steady-statemethadone blocks cocaine seeking and cocaine-induced geneexpression alterations in the rat brain. Eur Neuropsychopharmacol 2009,19:238–249.
17. Mogenson GJ, Yim CC, Willner P, Scheel-Kruger J: Neuromodulatoryfunctions of the mesolimbic dopamine system: electrophysiological andbehavioural studies. In The mesolimbic dopamine system: from motivation toaction. Edited by Wilner P, Scheel-Kruger J. West Sussex: John Wiley & Sons;1991:106–130.
Winick-Ng et al. BMC Pharmacology and Toxicology 2012, 13:11 Page 14 of 16http://www.biomedcentral.com/bmcpharmacoltoxicol/2050-6511/13/1/11
18. Stewart J: Pathways to relapse: the neurobiology of drug- andstress-induced relapse to drug-taking. J Psychiatry Neurosci 2000,25:125–136.
19. Ghitza UE, Preston KL, Epstein DH, Kuwabara H, Endres CJ, Bencherif B, BoydSJ, Copersino ML, Frost JJ, Gorelick DA: Brain mu-opioid receptor bindingpredicts treatment outcome in cocaine-abusing outpatients.Biol Psychiatry 2010, 68:697–703.
20. Gorelick DA, Kim YK, Bencherif B, Boyd SJ, Nelson R, Copersino M, Endres CJ,Dannals RF, Frost JJ: Imaging brain mu-opioid receptors in abstinentcocaine users: time course and relation to cocaine craving. Biol Psychiatry2005, 57:1573–1582.
21. Zubieta JK, Gorelick DA, Stauffer R, Ravert HT, Dannals RF, Frost JJ: Increasedmu opioid receptor binding detected by PET in cocaine-dependent menis associated with cocaine craving. Nat Med 1996, 2:1225–1229.
22. Lee DK, Koh WC, Shim YB, Shim I, Choe ES: Repeated cocaineadministration increases nitric oxide efflux in the rat dorsal striatum.Psychopharmacology 2010, 208:245–256.
23. Sammut S, West AR: Acute cocaine administration increases NO efflux inthe rat prefrontal cortex via a neuronal NOS-dependent mechanism.Synapse 2008, 62:710–713.
24. Chan SH, Chang KF, Ou CC, Chan JY: Nitric oxide regulates c-fosexpression in nucleus tractus soliarii induced by baroreceptoractivation via cGMP-dependent protein kinase and cAMP responseelement-binding protein phosphorylation. Mol Pharmacol 2004,65:19–325.
25. Haby C, Lisovoski F, Aunis D, Zwiller J: Stimulation of the cyclic GMPpathway by NO induces expression of the immediate early genes c-fosand junB in PC12 cells. J Neurochem 1994, 62:496–501.
26. Imam SZ, Jankovic J, Ali SF, Skinner JT, Xie W, Conneely OM, Le WD: Nitricoxide mediates increased susceptibility to dopaminergic damage inNurr1 heterozygous mice. FASEB J 2005, 19:1441–1450.
27. Kreuter JD, Mattson BJ, Wang B, You ZB, Hope BT: Cocaine-induced Fosexpression in rat striatum is blocked by chloral hydrate or urethane.Neuroscience 2004, 127:233–242.
28. Morris BJ: Stimulation of immediate early gene expression in striatalneurons by nitric oxide. J Biol Chem 1995, 270:24740–24744.
29. Pilz RB, Suhasini M, Idriss S, Meinkoth JL, Boss GR: Nitric oxide and cGMPanalogs activate transcription from AP-1 responsive promoters inmammalian cells. FASEB J 1995, 9:552–558.
30. Radwanska K, Caboche J, Kaczmarek L: Extracellular signal-regulatedkinases (ERKs) modulated cocaine-induced gene expression in themouse amygdala. Eur J Neurosci 2005, 22:939–948.
31. Zahm DS, Becker ML, Freiman AJ, Strauch S, Degarmo B, Geisler S, MeredithGE, Marinelli M: Fos after single and repeated self-administration ofcocaine and saline in the rat: emphasis on the Basal forebrain andrecalibration of expression. Neuropsychopharmacology 2010, 35:445–463.
32. Zhuravliova E, Barbakadze T, Narmania N, Ramsden J, Mikeladze D:Inhibition of nitric oxide synthase and farnesyltransferase change theactivities of several transcription factors. J Mol Neurosci 2007, 31:281–287.
33. Börner C, Höllt V, Kraus J: Involvement of activator protein-1 intranscriptional regulation of the human mu-opioid receptor gene.Mol Pharmacol 2002, 61:800–805.
34. Feng J, Jing F, Fang H, Gu L, Xu W: Expression, purification, and S-nitrosylation of recombinant histone deacetylase 8 in Escherichia coli.Biosci Trends 2011, 5:17–22.
35. Sha Y, Marshall HE: S-nitrosylation in the regulation of gene transcription.Biochim Biophys Acta, in press [Epub ahead of print].
36. Hui B, Wang W, Li J: Biphasic modulation of cocaine-induced conditionedplace preference through inhibition of histone acetyltransferase andhistone deacetylase. Saudi Med J 2010, 31:389–393.
37. Sun J, Wang L, Jiang B, Hui B, Lv Z, Ma L: The effects of sodium butyrate,an inhibitor of histone deacetylase, on the cocaine- and sucrose-maintained self-administration in rats. Neurosci Letters 2008, 441:72–76.
38. Hwang CH, Song KY, Kim CS, Choi HS, Guo X, Law P, Wei L, Loh HH:Epigenetic programming of μ-opioid receptor gene in mouse brain isregulated by MeCP2 and brg1 chromatin remodelling factor. J Cell MolMed 2008, 13:3591–3615.
39. Hwang CK, Kim CS, do K K, Law PY, Wei LN, Loh HH: Up-regulation of themu-opioid receptor gene is mediated through chromatin remodelingand transcriptional factors in differentiated neuronal cells. Mol Pharmacol2010, 78:58–68.
40. Guan X, Tao J, Li S: Dopamine D1 receptor, but not dopamine D2receptor, is a critical regulator for acute cocaine-enhanced geneexpression. Neurol Res 2009, 31:17–22.
41. Jablonka E, Lachman M, Lamb MJ: Evidence, mechanisms and models forthe inheritance of acquired characters. J Theor Biol 1992, 158:245–268.
42. Liu Y, Lu C, Yang Y, Fan Y, Yang R, Liu CF, Korolev N, Nordenskiöld L:Influence of Histone Tails and H4 Tail Acetylations on Nucleosome-Nucleosome Interactions. J Mol Biol 2011, 414:749–764.
43. Kwak Y, Ma T, Diao S, Zhang X, Chen Y, Hsu J, Lipton S, Masliah E, Xu H,Liao F: NO signaling and S-nitrosylation regulate PTEN inhibition inneurodegeneration. Mol Neurodegener 2010, 5:49–61.
44. Palmer LA, Gaston B, Johns RA: Normoxic stabilization of hypoxia-inducible factor-1 expression and activity: redox-dependent effect ofnitrogen oxides. Mol Pharmacol 2000, 58:1197–1203.
45. Schlake T, Klehr-Wirth D, Yoshida M, Beppu T, Bode J: Gene expressionwithin a chromatin domain: the role of core histone hyperacetylation.Biochemistry 1994, 33:4197–4206.
46. Ura K, Kurumizaka H, Dimitrov S, Almouzni G, Wolffe AP: Histoneacetylation: influence on transcription, nucleosome mobility andpositioning, and linker histone-dependent transcriptional repression.EMBO J 1997, 16:2096–2107.
47. Zhou J, Fandrev J, Schiiman J, Tiegs G, Brüne B: NO and TNF- releasedfrom activated macrophages stabilize HIF-1 in resting tubular LLC-PK1cells. Am J Physiol 2003, 284:C439–C446.
48. Borowitz JL, Gunasekar PG, Isom GE: Hydrogen cyanide generation bymu-opiate receptor activation: possible neuromodulatory role ofendogenous cyanide. Brain Res 1997, 768:294–300.
49. Niu S, Kuo CH, Gan Y, Nisikawa E, Sadakata T, Ichikawa H, Miki N: Increaseof calmodulin III gene expression by mu-opioid receptor stimulation inPC12 cells. Jpn J Pharmacol 2000, 84:412–417.
50. Yoshikawa M, Ueno S, Hirano M, Nakayama H, Furuya H: Effects of fentanylon survival of serum-deprived rat pehochromocytoma cells. PharmPharmacol Commun 1999, 5:603–607.
51. Baskey JC, Kalisch BE, Davis WL, Meakin SO, Rylett RJ: PC12nnr5 cellsexpressing TrkA receptors undergo morphological but not cholinergicphenotypic differentiation in response to NGF. J Neurochem 2002,80:501–511.
52. Binnington JC, Kalisch BE: Nitric oxide synthase inhibitors modulate nervegrowth factor-mediated regulation of amyloid precursor proteinexpression in PC12 cells. J Neurochem 2007, 101:422–433.
53. Kalisch BE, Bock NA, Davis W, Rylett RJ: Inhibitors of nitric oxide synthaseattenuate nerve growth factor-mediated increases in cholineacetyltransferase gene expression in PC12 cells. J Neurochem 2002,81:624–635.
54. Kalisch BE, Demeris CS, Ishak M, Rylett RJ: Modulation of nerve growthfactor-induced activation of MAP kinase in PC12 cells by inhibitors ofnitric oxide synthase. J Neurochem 2003, 87:1321–1332.
55. Gotfryd K, Skladchikova G, Lepekhin EA, Berezin V, Bock E, Walmod PS: Celltype-specific anti-cancer properties of valproic acid: independent effectson HDAC activity and Erk1/2 phosphorylation. BMC Cancer 2010, 10:383.
56. Imam SZ, Duhart HM, Skinner JT, Ali SF: Cocaine induces a differentialdose-dependent alteration in the expression profile of immediate earlygenes, transcription factors, and caspases in PC12 cells: a possiblemechanism of neurotoxic damage in cocaine addiction. Ann NY Acad Sci2005, 1053:482–490.
57. Unterwald EM, Cox BM, Kreek MJ, Cote TE, Izenwasser S: Chronic repeatedcocaine administration alters basal and opioid-regulated adenylylcyclase activity. Synapse 1993, 15:33–38.
58. Izenwasser S, Heller B, Cox BM: Continuous cocaine administrationenhances mu- but not delta-opioid receptor-mediated inhibition ofadenylyl cyclase activity in nucleus accumbens. Eur J Pharmacol 1996,297:187–191.
59. Cheung NS, Pascoe CJ, Giardina SF, John CA, Beart PM: MicromolarL-glutamate induces extensive apoptosis in an apoptotic-necroticcontinuum of insult-dependent, excitotoxic injury in cultured corticalneurones. Neuropharmacol 1998, 37:1419–1429.
60. Siddiqui MA, Kashyap MP, Kumar V, Tripathi VK, Khanna VK, Yadav S, Pant AB:Differential protection of pre-, co- and post-treatment of curcumin againsthydrogen peroxide in PC12 cells. Hum Exp Toxicol 2011, 30:192–198.
61. Chen W, Bacanamwo M, Harrison DG: Activation of p300 histoneacetyltransferase activity is an early endothelial response to laminar
Winick-Ng et al. BMC Pharmacology and Toxicology 2012, 13:11 Page 15 of 16http://www.biomedcentral.com/bmcpharmacoltoxicol/2050-6511/13/1/11
shear stress and is essential for stimulation of endothelial nitric-oxidesynthase mRNA transcription. J Biol Chem 2008, 283:16293–16298.
62. Kang SK, Cha SH, Jeon HG: Curcumin-induced histone hypoacetylationenhances caspase-3-dependent glioma cell death and neurogenesis ofneural progenitor cells. Stem Cells Dev 2006, 15:165–174.
63. Sun H, Yang X, Zhu J, Lv T, Chen Y, Chen G, Zhong L, Li Y, Huang X,Huang G, Tian J: Inhibition of p300-HAT results in a reduced histoneacetylation and down-regulation of gene expression in cardiacmyocytes. Life Sci 2010, 87:707–714.
64. Bradford M: A rapid and sensitive method for the quantitation ofmicrogram quantities of protein utilizing the principle of protein-dyebinding. Anal Biochem 1976, 72:248–254.
65. MacKinnon JC, Huether P, Kalisch BE: Effects of nerve growth factor andnitric oxide synthase inhibitors on amyloid precursor protein mRNAlevels and protein stability. Open Biochem J 2012, 6:31–39.
66. Unterwald EM, Kreek MJ, Cuntapay M: The frequency of cocaineadministration impacts cocaine-induced receptor alterations.Brain Res 2001, 900:103–109.
67. Larson EB, Akkentli F, Edwards S, Graham DL, Simmons DL, Alibhai IN,Nestler EJ, Self DW: Striatal regulation of ΔFosB, FosB, and cFos duringcocaine self-administration and withdrawal. J Neurochem 2010, 115:112–122.
68. Bossis G, Malnou CE, Farras R, Andermarcher E, Hipskind R, Rodriguez M,Schmidt D, Muller S, Jariel-Encontre I, Piechaczyk M: Down-regulation ofc-Fos/c-Jun AP-1 dimer activity by sumoylation. Mol Cell Biol 2005,25:6964–6979.
69. Chinenov Y, Kerppola TK: Close encounters of many kinds: Fos-Juninteractions that mediate transcription regulatory specificity. Oncogene2001, 20:2438–2452.
70. Mattson BJ, Bossert JM, Simmons DE, Nozaki N, Nagarkar D, Kreuter JD,Hope BT: Cocaine-induced CREB phosphorylation in nucleus accumbensof cocaine-sensitized rats is enabled by enhanced activation ofextracellular signal-related kinase, but not protein kinase A. J Neurochem2005, 95:1481–1494.
71. Mayr B, Montminy M: Transcriptional regulation by the phosphorylation-dependent factor CREB. Nat Rev Mol Cell Biol 2001, 2:599–609.
72. Imam SZ, Duhart HM, Skinner JT, Ali SF: Cocaine induces a dose-dependent alteration in the expression of immediate early genes c-fosand SP-1 and in nuclear factor NF-kappabeta in PC12 cells. Ann NY AcadSci 2003, 993:362.
73. Lepsch LB, Munhoz CD, Kawamoto EM, Yshii LM, Lima LS,Curi-Boaventura MF, Salgado TM, Curi R, Planeta CS, Scavone C: Cocaineinduces cell death and activates the transcription nuclear factor kappa-Bin PC12 cells. Mol Brain 2009, 2:3.
74. Beltran JA, Peek J, Chang SL: Expression and regulation of the mu opioidpeptide receptor in TPA-differentiated HL-60 promyelocytic leukemiacells. Int Immunopharmacol 2006, 6:1331–1340.
75. Gach K, Piestrzeniewicz M, Fichna J, Stefanska B, Szemraj J, Janecka A:Opioid-induced regulation of mu-opioid receptor gene expression in theMCF-7 breast cancer cell line. Biochem Cell Biol 2008, 86:217–226.
76. Lin YC, Flock KE, Cook RJ, Hunkele AJ, Loh HH, Ko JL: Effects of trichostatinA on neuronal mu-opioid receptor gene expression. Brain Res 2008,1246:1–10.
77. Pudiak CM, Bozarth MA: The effect of nitric oxide synthesis inhibition onintravenous cocaine self-administration. Prog Neuropsychopharmacol BiolPsychiatry 2002, 26:189–196.
78. Bhargava HN, Kumar S: Sensitization to the locomotor stimulant activityof cocaine is associated with increases in nitric oxide synthase activity inbrain regions and spinal cord of mice. Pharmacol 1997, 55:292–298.
79. Yoo JH, Cho JH, Lee SY, Lee S, Loh HH, Ho IK, Jang CG: Differential effectsof morphine- and cocaine-induced nNOS immunoreactivity in thedentate gyrus of hippocampus of mice lacking mu-opioid receptors.Neurosci Lett 2006, 395:98–102.
80. Collins SL, Kantak KM: Neuronal nitric oxide synthase inhibition decreasescocaine self-administration behavior in rats. Psychopharmacology (Berl)2002, 159:361–369.
81. Itzhak Y, Martin JL, Black MD, Huang PL: The role of neuronal nitric oxidesynthase in cocaine-induced conditioned place preference. Neuroreport1998, 9:2485–2488.
82. Itzhak Y: Role of the NMDA receptor and nitric oxide in memoryreconsolidation of cocaine-induced conditioned place preference inmice. Ann N Y Acad Sci 2008, 1139:350–357.
83. Martin JL, Itzhak Y: 7-Nitroindazole blocks nicotine-induced conditionedplace preference but not LiCl-induced conditioned place aversion.Neuroreport 2000, 11:947–949.
84. Ohki K, Yoshida K, Hagiwara M, Harada T, Takamura M, Ohashi T,Matsuda H, Imaki J: Nitric oxide induces c-fos gene expression viacyclic AMP response element binding protein (CREB)phosphorylation in rat retinal pigment epithelium. Brain Res 1995,696:140–144.
85. Riccio A, Alvania RS, Lonze BE, Ramanan N, Kim T, Huang Y, DawsonTM, Snyder SH, Ginty DD: A nitric oxide signaling pathway controlsCREB-mediated gene expression in neurons. Mol Cell 2006, 21:283–294.
86. Sanchis-Segura C, Lopez-Atalaya JP, Barco A: Selective boosting oftranscriptional and behavioral responses to drugs of abuse by histonedeacetylase inhibition. Neuropsychopharmacol 2009, 34:2642–2654.
87. Wang L, Lv Z, Hu Z, Sheng J, Hui B, Sun J, Ma L: Chronic cocaine-inducedH3 acetylation and transcriptional activation of CaMKII alpha in thenucleus accumbens is critical for motivation for drug reinforcement.Neuropsychopharmacol 2010, 35:913–928.
88. Cearley CN, Blindheim K, Sorg BA, Krueger JM, Churchill L: Acute cocaineincreases interleukin-1β mRNA and immunoreactive cells in the cortexand nucleus accumbens. Neurochem Res 2011, 36:686–692.
89. Zhang L, Belkowski JS, Briscoe T, Rogers TJ: Regulation of Mu OpioidReceptor Expression in Developing T Cells. J Neuroimmune Pharmacol2012, [Epub ahead of print].
90. Buhrmann C, Mobasheri A, Busch F, Aldinger C, Stahlmann R, Montaseri A,Shakibaei M: Curcumin modulates nuclear factor kappaB (NF-kappaB)-mediated inflammation in human tenocytes in vitro: role of thephosphatidylinositol 3-kinase/Akt pathway. J Biol Chem 2011,286:28556–28566.
91. Gan Y, Shen YH, Utama B, Wang J, Coselli J, Wang XL: Dual effects ofhistone deacetylase inhibition by trichostatin A on endothelial nitricoxide synthase expression in endothelial cells. Biochem Biophys ResCommun 2006, 340:29–34.
92. Thiriet N, Aunis D, Zwiller J: The nitric oxide releasing agent sodiumnitroprusside modulates cocaine-induced immediate early geneexpression in rat brain. Ann NY Acad Sci 2002, 965:47–54.
93. Kumar A, Choi KH, Renthal W, Tsankova NM, Theobald DE, Truong HT,Russo SJ, Laplant Q, Sasaki TS, Whistler KN, Neve RL, Self DW, Nestler EJ:Chromatin remodeling is a key mechanism underlying cocaine-inducedplasticity in striatum. Neuron 2005, 48:303–314.
94. Miyamoto Y, Sakai R, Maeda C, Takata T, Ihara H, Tsuchiya Y, Watanabe Y:Nitric oxide promotes nicotine-triggered ERK signaling via redoxreactions in PC12 cells. Nitric Oxide 2011, 25:344–349.
95. Yasui H, Ito N, Yamamori T, Nakamura H, Okano J, Asanuma T, Nakajima T,Kuwabara M, Inanami O: Induction of neurite outgrowth by alpha-phenyl-N-tert-butylnitrone through nitric oxide release and Ras-ERK pathway inPC12 cells. Free Radic Res 2010, 44:645–654.
96. Jang JH, Surh YJ: AP-1 mediates beta-amyloid-induced iNOS expressionin PC12 cells via the ERK2 and p38 MAPK signaling pathways. BiochemBiophys Res Commun 2005, 331:1421–1428.
97. Kim TW, Lee CH, Choi CY, Kwon NS, Baek KJ, Kim YG, Yun HY: Nitric oxidemediates membrane depolarization-promoted survival of rat neuronalPC12 cells. Neurosci Lett 2003, 344:209–211.
98. Tan Z, Dohi S, Ohguchi K, Nakashima S, Nozawa Y: Local anesthetics inhibitmuscarinic receptor-mediated activation of extracellular signal-regulatedkinases in rat pheochromocytoma PC12 cells. Anesthesiology 1999,91:1014–1024.
99. Kim S, Shin JK, Yoon HS, Kim JH: Blockade of ERK Phosphorylation inthe Nucleus Accumbens Inhibits the Expression of Cocaine-inducedBehavioral Sensitization in Rats. Korean J Physiol Pharmacol 2011, 15:389–395.
100. Self DW, Nestler EJ: Molecular mechanisms of drug reinforcement andaddiction. Annu Rev Neurosci 1995, 18:463–495.
101. Bashkatova V, Mathieu-Kia AM, Durand C, Penit-Soria J: Neurochemicalchanges and neurotoxic effects of an acute treatment with sydnocarb, anovel psychostimulant: comparison with D-amphetamine. Ann NY AcadSci 2002, 965:180–192.
102. Broadbelt NV, Chen J, Silver RB, Poppas DP, Felsen D: Pressure activatesepidermal growth factor receptor leading to the induction of iNOS viaNFkappaB and STAT3 in human proximal tubule cells. Am J Physiol RenalPhysiol 2009, 297:F114–F124.
Winick-Ng et al. BMC Pharmacology and Toxicology 2012, 13:11 Page 16 of 16http://www.biomedcentral.com/bmcpharmacoltoxicol/2050-6511/13/1/11
103. Hwang MH, Damte D, Lee JS, Gebru E, Chang ZQ, Cheng H, Jung BY,Rhee MH, Park SC: Mycoplasma hyopneumoniae inducespro-inflammatory cytokine and nitric oxide production through NFκBand MAPK pathways in RAW264.7 cells. Vet Res Commun 2011, 35:21–34.
104. Rang HP, Dale MM, Ritter JM: Local anaesthetics and other drugs thataffect ion channels. In Pharmacology. 4th edition. Edinburgh: HarcourtPublishers Ltd; 2001:634–645.
doi:10.1186/2050-6511-13-11Cite this article as: Winick-Ng et al.: Nitric oxide and histonedeacetylases modulate cocaine-induced mu-opioid receptor levels inPC12 cells. BMC Pharmacology and Toxicology 2012 13:11.
Submit your next manuscript to BioMed Centraland take full advantage of:
• Convenient online submission
• Thorough peer review
• No space constraints or color figure charges
• Immediate publication on acceptance
• Inclusion in PubMed, CAS, Scopus and Google Scholar
• Research which is freely available for redistribution
Submit your manuscript at www.biomedcentral.com/submit