Modeling the coupling between free and forced convection ... · convection in a vertical permeable...
59
Modeling the coupling between free and forced convection in a vertical permeable slot: implications for the heat production of an Enhanced Geothermal System Arnaud Battaill´ e, Pierre Genthon, Michel Rabinowicz, Bertrand Fritz To cite this version: Arnaud Battaill´ e, Pierre Genthon, Michel Rabinowicz, Bertrand Fritz. Modeling the coupling between free and forced convection in a vertical permeable slot: implications for the heat production of an Enhanced Geothermal System. Geothermics, Elsevier, 2006, 35 (5-6), pp.654- 682. <10.1016/j.geothermics.2006.11.008>. <ird-00310440> HAL Id: ird-00310440 http://hal.ird.fr/ird-00310440 Submitted on 8 Aug 2008 HAL is a multi-disciplinary open access archive for the deposit and dissemination of sci- entific research documents, whether they are pub- lished or not. The documents may come from teaching and research institutions in France or abroad, or from public or private research centers. L’archive ouverte pluridisciplinaire HAL, est destin´ ee au d´ epˆ ot et ` a la diffusion de documents scientifiques de niveau recherche, publi´ es ou non, ´ emanant des ´ etablissements d’enseignement et de recherche fran¸cais ou ´ etrangers, des laboratoires publics ou priv´ es.
Transcript of Modeling the coupling between free and forced convection ... · convection in a vertical permeable...
Modeling the coupling between free and forced
convection in a vertical permeable slot: implications for
the heat production of an Enhanced Geothermal System
Arnaud Battaille, Pierre Genthon, Michel Rabinowicz, Bertrand Fritz
To cite this version:
Arnaud Battaille, Pierre Genthon, Michel Rabinowicz, Bertrand Fritz. Modeling the couplingbetween free and forced convection in a vertical permeable slot: implications for the heatproduction of an Enhanced Geothermal System. Geothermics, Elsevier, 2006, 35 (5-6), pp.654-682. <10.1016/j.geothermics.2006.11.008>. <ird-00310440>
HAL Id: ird-00310440
http://hal.ird.fr/ird-00310440
Submitted on 8 Aug 2008
HAL is a multi-disciplinary open accessarchive for the deposit and dissemination of sci-entific research documents, whether they are pub-lished or not. The documents may come fromteaching and research institutions in France orabroad, or from public or private research centers.
L’archive ouverte pluridisciplinaire HAL, estdestinee au depot et a la diffusion de documentsscientifiques de niveau recherche, publies ou non,emanant des etablissements d’enseignement et derecherche francais ou etrangers, des laboratoirespublics ou prives.
1
Modeling the coupling between free and forced convection in
a vertical permeable slot: implications for the heat production of an Enhanced Geothermal System
Arnaud Batailléa, Pierre Genthona,†, Michel Rabinowicza,٭, Bertrand Fritzb
( a) Laboratoire de Dynamique Terrestre et Planétaire, UMR 5562, Observatoire
Midi-Pyrénées, 14 Avenue Edouard Belin, 31400 Toulouse, France
(b) Centre de Géochimie de Surface, UMR 7517, Ecole de l’Observatoire des Sciences de la Terre, 1 rue Blessig, F-67084 Strasbourg, France
(†) Now at Hydrosciences/MSE, Univ. Montpellier II, France
Received 30 June 2004 ; Abstract The aim of the hydraulic stimulations in the Soultz-sous-Forêts, France, Enhanced
Geothermal System (EGS) project was to create, in crystalline rocks, a fractured
reservoir 750 m high, 750 m long and 35 m thick interconnecting the injection and
production wells. Increasing the permeability in a zone with a high geothermal
gradient will trigger free convection, which will interact with the forced flow driven
by pumping. A systematic numerical study of the coupling between forced and free
convective flows has been performed by considering a large range of injection rates
and Rayleigh numbers. The simulations showed that if there is weak or no free
convection in an EGS reservoir, economic exploitation of the system will rapidly end
because of a decrease in produced fluid temperature. The maximum injection rate
preventing such a temperature drop increases with the Rayleigh number and the height
of the stimulated domain. The model establishes constraints on the conditions for
achieving optimal heat extraction at the Soultz-sous-Forêts EGS site. It was also
shown that although mineral precipitation may close or heal fractures, it does not lead
to a major decrease of the hydraulic conductivity in the stimulated reservoir.

2
Keywords: Geothermal energy; Enhanced Geothermal Systems; EGS; Hot Dry Rock;
HDR; Free convection; Forced flow; Heat transfer; Soultz-sous-Forêts; France
.Corresponding author. Tel.: +33 5 6133 2962; fax: +33 5 6133 2900 ٭E-mail address: [email protected] (M. Rabinowicz)

3
Nomenclature
a thickness of the fracture zone [m]
a/HR dimensionless thickness of the fractured slot
A/2 half thickness of the modeled domain
cP specific heat capacity [J/(kg °C)]
f spacing of the fissure network [m]
g gravitational acceleration [m/s2]
h height of layer at the bottom of the model [m]
l conduction length
H height of the fracture zone [m]
k permeability [m2]
L length of the fracture zone [m]
P pressure [Pa]
Peg grid Peclet number
Pw thermal power [MW]
Q injection rate [L/s]
QF free convection flow rate [L/s]
R hydraulic conductivity [m]
Ra Rayleigh number
T temperature [°C]
u horizontal velocity in the fractured slot [m/s]
v fluid velocity [m/s] vD Darcy fluid velocity [m/s]

4
w vertical velocity in the fractured slot [m/s]
Greek letters
α coefficient of thermal expansion [1/°C]
∆T temperature difference between the top and bottom of the model [°C]
δ fissure aperture [m]
ε porosity
θ dimensionless temperature
κ thermal diffusivity [m2/s]
λ thermal conductivity [W/(m°C)]
µ fluid viscosity [Pa·s]
ρ density [kg/m3]
ψ stream function
Subscripts
C critical
f fluid
I initial
N normal to strike
R reservoir (or stimulated zone)
s solid
S along strike
0 reference
* saturated porous media
’ dimensionless
1. Introduction
5
Since the 1970s, the increasing threat of a worldwide energy crisis has
prompted many governments to try to reduce their dependence on traditional non-
renewable energy sources and to focus on renewable ones such as geothermal energy.
Geothermal energy systems are most prevalent in regions of elevated heat flow and
vigorous deep fluid circulation, such as The Geysers, USA, and Larderello, Italy.
Aside from these hydrothermal systems, however, it is also possible to extract the heat
stored in subsurface rock masses. In general, these rocks do not have an adequate
natural permeability such as to guarantee the circulation of fluids needed to produce
heat on a commercial scale, but this can be changed naturally by seismic events or
artificially by hydraulic stimulation, both of which may create an extended region of
permeable fractures. These man-made or artificially enhanced geothermal systems are
called Hot Dry Rock (HDR) and/or Enhanced Geothermal Systems (EGS). The
objective of EGS and HDR projects is to improve the productivity of naturally
fractured systems and/or create new fractures to allow the circulation of large volumes
of fluids through the hot rocks. In some instances EGS projects are targetted at
increasing the output and commercial lifetime of an existing hydrothermal geothermal
system. Since geothermal resources amenable to EGS- and HDR-type projects are
widespread, they have stimulated considerable interest (Barbier, 2002). Several HDR
projects have been launched in different parts of the world: e.g. at Fenton Hill (USA),
in Cornwall (England), and Hijiori (Japan), and EGS projects are currently under way
at Soultz-sous-Forêts (France), Coso (USA), Habanero (Australia).
Abé et al. (1999) stressed the importance of a thorough knowledge of the local
geology and the mode of subsurface fluid circulation to the successful exploitation of
EGS reservoirs. O’Sullivan et al. (2001) showed that it is essential we develop
6
methods that predict the economic lifetime of a EGS, and particularly the fluid flow
between production and injection wells, before proceeding with the full commercial
implementation of an EGS project.
Several types of models have been developed, focusing on the thermal
performance and flow characteristics of the regions with fluid circulation within the
EGS. These models require a coupling of the thermal, mechanical, chemical and
hydraulic processes occurring in the reservoir. Kohl et al. (1995) and Hicks et al.
(1996) developed 2-D thermo-mechanical models that highlight the importance of
thermo-elastic mechanisms on the behavior of EGS reservoirs over time. Kolditz and
Clauser (1998) studied the forced circulation of a fluid in a fracture and the heat
transfer between the fluid and surrounding rock using a 3-D finite-element model. A
model based on a realistic stochastic fracture network accounts well for the observed
early temperature drop in the fluid produced from EGS systems. Because the
permeability of their model was small, free convection and, thus, fluid buoyancy were
neglected.
Modeling of free convection in a fault was investigated by Murphy (1979) and
Tournier et al. (2000). These authors represent the fault by a vertical porous slot with
a high 2-D permeability field enclosed by impermeable but thermally conductive
walls. They showed the effects of the heat exchange between the walls and the slot on
the convective flow. The strength of the convection increases with the Rayleigh
number:
µκρ
⋅⋅⋅⋅∆
=kHgRa (1)
7
where ∆ρ is the difference in fluid density between the top and bottom of the modeled
domain, µ is the dynamic viscosity of the fluid, g is gravity, and k, H and κ are the
permeability, height, and thermal diffusivity of the porous slot, respectively. Based on
a stability analysis, Murphy (1979) showed how the convective flow is dampened by
the heat conducted through the lateral walls. He showed that convection starts
instantaneously for a Rayleigh number RaI, greatly exceeding the critical value for
free convection in an infinite horizontal porous layer (i.e. 4π2). He also showed that
RaI decreases with a/H, where a is the thickness and H the height of the permeable
slot; in the cases considered in the present study, RaI exceeds a few thousands.
Murphy (1979) also defined a modified Rayleigh number Ra*=Ra×(a/H)² that
determines the linear stability of the convection in a fault with different thickness-to-
height aspect ratios. Rabinowicz et al. (1999) developed a model of convection in an
equivalent porous permeable slot surrounded by conductive impermeable walls to
simulate hydrothermal circulation at mid-ocean ridges. Using a similar numerical
model, Tournier et al. (2000) reported a new critical Rayleigh number, RaC, above
which convection starts after a time delay. Considering the case of a highly permeable
network in a fault system, Murphy et al. (1981) noted the simultaneous effects of free
and forced convection within a fracture.
None of the modelling efforts described above evaluates the long-term
profitability of an EGS system as a function of the Raleigh number of the stimulated
volume located between the injection and production wells, the rate of fluid injection
in the wells and of the dissolution/precipitation of minerals in the equivalent porous
network during fluid circulation. Using data from the Soultz-sous-Forêts project, we
have therefore developed a model specifically to study this profitability aspect.
8
The Soultz-sous-Forêts site is located over a high heat flow anomaly in the
extensional Upper Rhine Graben. The subsurface thermal gradients reflect a natural
convective circulation at the scale of the entire Rhine basin, which includes the granite
basement down to at least 5000 m and part of the sedimentary cover (Pribnow and
Schellschmidt, 2000). This convection is slow and gives rise to temperature variations
that can only be measured at geological time scales (Ormond et al., 1995). Hydraulic
stimulation of the granitic volume around the drilled granitic section at the Soultz-
sous-Forêts site is expected to create a permeable region (or reservoir) connecting the
wells, in which free convective circulation can develop.
The present study begins with a summary of the geological setting of the
Soultz-sous-Forêts EGS project. We then present the appropriate equations for
describing the numerical model developed to study the interaction of free convection
with forced flow in a vertical slot simulating the fracture zone, including the
stimulated reservoir connecting the injection and production wells (Fig. 1). Finally,
we describe the results of modeling the long-term exploitation of this Enhanced
Geothermal System both in terms of produced fluid temperature and mineral
precipitation/dissolution in the fractures.
2. Geological setting
The European EGS project at Soultz-sous-Forêts started in 1987. Numerous
well stimulation and circulation tests have been performed at various depths,
providing the large database of reservoir parameters that is essential for numerical
modeling of the site. Two boreholes, GPK1 and GPK2 were drilled and logged in
1993 and 1994; they reached 3590 and 3876 m depth, respectively. The external
9
casings of the two boreholes are cemented from the wellhead to 1500 m depth; the
internal casings are cemented below 2850 m and 3210 m depth, respectively. Both
wells were drilled into the same fault segment and are 450 m apart. The open-hole
portions of GPK1 and GPK2 have been hydraulically stimulated, thus enhancing the
permeability of the natural reservoir connecting both wells (Baria et al., 1999). A third
well, EPS1, drilled in 1987, is located close to GPK2. It is used as a test hole and has
been fully cored from 930 m down to bottomhole. The large amount of data collected
from EPS1 (including core samples, borehole images and hydraulic data) has provided
constraints on the structural and mineralogical properties of the Soultz granite, and,
hence, on the parameters used in our modeling study.
The Soultz granite hosts a high-salinity (100 g/L) brine (Pauwels et al., 1993).
In the deep aquifers of the overlying sedimentary sequences, heat is transported by a
convection system that is thermally coupled to a very slow, deep convective flow in
the underlying granite that presents a set of natural sub-vertical N-S striking fractures.
A knowledge of the geometry and the hydraulic characteristics of the fractured system
is fundamental to our evaluation and exploitation of the EGS reservoir.
For Soultz, Genter et al. (1995) proposed, within the impermeable granite, a fault
system consisting of a connected network of 10-m thick hydrothermally altered gouge
zones some 100 m apart. The data collected from the deep wells reveal the presence of
three zones associated with these fault gouges (Genter et al., 2002): (i) the fresh non-
altered granite forming the walls of the fault; (ii) the outer gouge consisting of
hydrothermally altered granite, about 30% of which is clay-like material with a high
porosity (10%); and (iii) the central part of the gouge, 50% of which is represented by
clay-like minerals, plus quartz and calcite, and a high density of fissures that are
partially open and connected.
10
Large-scale deformation in the Soultz granite due to the Rhine Graben tectonics
mainly occurs through fault motion (Plenefisch and Bonjer, 1997). As a result, the set
of gouges tends to run parallel to the direction of maximum shear stress, and
eventually constitutes a connected network of more or less parallel, sub-vertical, 10-m
thick sheets that have randomly distributed permeabilities. Outside these gouges, the
granite is weakly altered and thus almost impermeable.
The effective permeability of the fault, that represents the equivalent Darcy
permeability at the scale of the entire height of the fault itself, was estimated
on the basis of numerous observations (e.g. core samples studies, borehole
imagery, hydraulic tests). Estimates of the effective permeability of drill cores
cut from the slightly altered granite range from about 10-20 m² to 10-18 m²
(Genter and Traineau, 1993). On the other hand, the propagation of the
microseismic cloud observed during the stimulation tests yielded estimated
permeabilities for the slightly altered granite between 10-19 m2 and 10-17 m2
(Shapiro et al., 2002). This represents the range of permeability of the bulk
rock outside the sub-parallel set of connected fault gouges.
Analysis of pressure test data collected prior to the stimulation experiments
gave effective permeabilities in the 10-15 to 10-14 m² range for the slightly
altered granite (Hettcamp et al., 2002). Because of the low bulk permeability
of this type of granite, the latter values result from the hydraulic
interconnection of the open fissure network within the gouge systems.
Downhole data show that the permeability of the naturally fractured granite in
the 1400-4000 m depth interval essentially reflects the presence of the open
11
fractures and of the highly porous altered granite found in the central and
outer zones of the fault gouges.
The downhole temperature logs show that: (i) the mean geothermal gradient
in the sediment cover, down to 1400 m depth, is about 100°C/km; (ii) the
gradient drops by a factor of 3 between 1400 and 4000 m depth, to about
28°C/km; and (iii) the gradient increases again below 4 km depth. These data
indicate that convective flow exists in the relatively homogeneous bottom part
of the sediment cover and in the quasi-parallel and vertical set of gouges that
occur at 1400 m depth and extend down to at least 4 km. Inside the granitic
rock mass, this convective flow is essentially confined to the fault gouges
and, thus, is subparallel to the N-S strike of the gouges. As a first
approximation, this fluid circulation can be envisaged as convective rolls
whose axes are orthogonal to the gouge strike, similar to those observed in
Hele-Shaw laboratory experiments (Hu and Steen, 1996).
The increase in geothermal gradient observed at depths greater than 4 km
indicates that the lower convective boundary layer, and hence the bottom of
the convection rolls, are close. The data indicate the existence of a convective
process with flow lines parallel to the sub-vertical gouge system, and a
Rayleigh number that exceeded several times the critical Rayleigh number (in
this case, RaC = 4 2π ) before the hydraulic stimulation of the granitic rocks.
Since all the parameters in Eq.(1), except permeability, are easy to
estimate, we can deduce that the effective permeability of the fracture gouge
network is 10-14 m² or higher. This value falls within the range estimated by
Pribnow and Schellschmidt (2000), i.e. > 10-14 m². By analogy with
12
comparable cases, we can deduce that the Darcy velocity of this convective
flow is small, i.e. a few cm/yr (Rabinowicz et al., 1985). Because of the
spacing of the gouges in the granitic mass (i.e. 10-m thick sheets, 100 m
apart), the gouge volume represents nearly 10% of the total volume. As a
result, the Darcy velocity vD within the gouge is an order of magnitude greater
than the bulk one. Thus,vD remains lower than a few dm/yr: i.e. vD < 1 m/yr.
The hydraulic pressure gradients created during stimulation re-open numerous
fractures and separate blocks of granites that were welded together by mineral
deposits precipitated during previous hydrothermal pulses. Hence, most of the fluid
circulation in the stimulated reservoir occurs in open sets of pre-existing or newly
developed flow channels or fractures. The distribution of the microseismic events
recorded during the stimulation tests suggests that pressure waves were felt within a
volume that can be considered as the EGS reservoir, whose length is about 750 m and
width about 35 m (Pearson, 1981; Shapiro et al., 1999, 2002). Assuming that the
flow is approximately one-dimensional, the bulk permeability of the
stimulated reservoir connecting the two wells may be determined from the
hydraulic parameters measured during the stimulations (Gérard et al., 1998):
iE P
vk∇⋅
=µ (2)
where kE is the effective permeability, µ the fluid viscosity, v the fluid
velocity calculated based on tracer test and iP∇ the pressure gradient between
the two wells. Using the injected flow rate, the injection pressure, and the
estimated thickness of the stimulated reservoir, Eq. (2) yields an effective
permeability of about 10-11 m². Note that this value is two or three orders of
13
magnitude greater than the estimated permeability of the fractured granite
prior to hydraulic stimulation (about 10-14 m²).
According to the downhole temperature logs, the top of the vertical permeable slot
is located just below the sedimentary cover, i.e. at about 1400 m depth, and its
bottom lies below 4 km. The propagation of the microseismic front ends along
the boundary of the stimulated domain (Shapiro et al., 2002). As its width at the
logging depth does not exceed 35 m, it is plausible that the thickness of the
permeable fractured slot, which hydraulically connects both wells from 1400 down to
4000 m depth, is also 35 m thick. Thus, we will assume that the hydraulically
stimulated reservoir is approximately nested in the center of this slot, and has a height,
length and thickness of about 750 m, 750 m, and 35 m, respectively (see Fig 1).
However, the permeability of the stimulated reservoir and the fractured slot are likely
to be heterogeneous, decreasing drastically as a function of distance to the main open
fractures located near the central part of the gouge (zone iii; see above) and near one
of the wells. As one or both of the wells was not drilled into this central part, the fluid
circulating between the wells flows through a region of lower permeability (Zone ii).
Accordingly, the 10-11 m2 effective permeability of the stimulated domain, calculated
on the basis of hydraulic impedance during pumping, can be considered a
minimum value.
3. The numerical model
3.1. Physical model
14
The well data suggest that the fractured slot can be modeled as a vertical
permeable box about 35 m wide, 2250 m long and at least 2250 m high. This
slot includes the 750 m high, 750 m wide and 35 m thick stimulated volume
(Fig. 1). The two arrows shown in the figure indicate the injection and
production points, separated by 450 m at a 3000-3875 m depth.
Since the fractures, which contribute most of the permeability to the slot,
are nearly parallel to the direction of shear (i.e. to the plane of the fracture
slot), the effective permeability in the direction perpendicular to shear (kN) is
negligible. Thus, we assume kN=0. The effective permeability of the slot
inside the 750 m x 750 m x 35 m stimulated reservoir in the direction of strike
(kS) is assumed to be 10-12 m2, a reasonable value when compared with the
maximum value of 10-11 m2 estimated in the previous section. In the model the
along-strike mean permeability (kS) for the region of the faulted slot outside
of the stimulated reservoir is assumed to be more than two orders of
magnitude lower (i.e. 10-14 m2), despite the fact that local high permeable
features not directly connected to the wells could contribute to the drainage of
the fractured slot.
The permeability parallel to the shear zone (i.e. kS ) and the porosity, ε, of
the permeable fracture network can be considered to be a function of fissure
aperture δ and spacing f.; i.e.:
fkS 12
3δ= (3)
fδε = . (4)
In the stimulated reservoir, an aperture δ of about 0.23 mm and a spacing
of about 1 m correspond to a porosity ε of 2.3 × 10⁻⁴ and a fracture
15
permeability of 10-12 m², the reference permeability in our model. Note that
inside the fractured slot but outside the stimulated reservoir, a fracture
aperture δ of about 0.05 mm and the same spacing (f = 1 m) could explain the
along-strike permeability kS ≈10-14 m2.
In the model, the fractured slot is parallel to the XZ plane containing the
injection and the production points, with the Z-axis pointing vertically
downwards and the X-axis horizontal (Fig. 1). The slot is bound between two
conductive walls of infinite extent in the Y direction. Owing to the symmetry
of the system, we consider only the half-space y ≥ 0: i.e., the half thickness of
the fractured slot is 17.5 m.
The numerical simulations are performed assuming two different
permeability fields. In the first, the entire fractured slot has a uniform along-
strike permeability. In the other simulations, only the stimulated reservoir has
the high permeability value, and four permeability ratios (KR) between the
stimulated reservoir and the non-stimulated zone of the fractured slot are
considered (i.e. KR = 5, 10, 50 and 100).
3.2. Convection equations
3.2.1. Equation of flow
In our numerical experiments (see Section 4), the Darcy velocity, vD,
attains, at most, 6.7×10⁻⁵ m/s: i.e. ≈ 2.1 km/yr. Comparing this last estimate
with the Darcy velocity vD within the fractured slot, i.e. vD < 1 m/yr, we
conclude that the natural (pre-stimulation) fluid flow through the entire
granitic layer is too slow to interact with the flow that develops inside the
stimulated reservoir. Besides, the interstitial fluid velocity within the
16
permeable fracture network inside the stimulated reservoir reaches a
maximum value of vD/ε ≈ 20 cm/s, which is low enough for the inertial terms
to be negligible. Here we assume that these fractures are vertical even though
the gouge planes are sub-vertical. Thus, a two-dimensional Darcy’s flow
describes fluid flow inside the fractured slot:
xPk
u S
∂∂
−=µ
(5)
−∂∂
−= gzPk
w fS ρµ
(6)
where u and w are the horizontal and the vertical velocity in the fractured slot,
P represents the fluid pressure, µ the fluid viscosity, g the gravitational
acceleration, and ρf the fluid density. Here u and w depend on x, z, and also on y,
the coordinate perpendicular to the permeable slot as a consequence of density
changes caused by temperature variations within the slot. It must be remembered that
the plane y = 0 coincides with the mid-plane of the fractured slot, and that the
velocities u and w are zero when y > 17.5 m.
Since we do not consider compressibility effects in the model, the mass
conservation equation can be written as:
( ) ( )0=
∂
∂+
∂
∂
zw
xu ff ρρ (7)
This allows us to introduce the stream function ψ for two-dimensional flow
defined by:
17
zu
f ∂∂
=ψ
ρ1 (8)
xw
f ∂∂
−=ψ
ρ1 (9)
The stream function represents the flow rate inside the flow tubes.
3.2.2. Heat equation
In order to determine the temperature field in the permeable slot, we must
consider heat transfer between the fluid circulating in the fractures and the
surrounding walls. In our models, the time step is defined as being equal to
the minimum time required for the fluid to cross the vertical grid spacing dz.
With dz = 17.6 m and v = 6.7×10⁻⁵ m/s, the time step is about 3 days. The
corresponding conduction length is tl ⋅= κ4 ≈ 2 m, with thermal diffusivity
κ=10-6 m2/s. The distance between two fractures (or fault gouges) is about 1
m; i.e. each side of the rock walls heated by one fracture has a thickness l ≈
0.5 m. The time required to reach thermal equilibrium between the fluid and
the rock is therefore less than the time step used in our model. As a result, we
may assume that the temperature of the fluid and of the surrounding walls are
equal and that the bulk thermal properties may be used to describe the
saturated porous medium within the permeable slot. These properties are
denoted by asterisks. The advection diffusion equation for the fractured slot
(Eq. 10) and the heat conduction equation for the impermeable walls (Eq. 11)
are:
18
( ) ( ) TTvctTc Dfpp
2** ∇=∇⋅⋅+∂∂
⋅ λρρrr (10)
( ) TtTc ssp
2∇=∂∂
⋅ λρ (11)
(For consistency, in Eq. (10) “v” has been changed to “vD”)
where (ρ⋅cp) and λ are the volumetric heat capacity [J/(m3°C)] and the thermal
conductivity [(W/m°C-1)], respectively; ‘*’, ‘f’ and ‘s’ refer to the saturated
porous medium, the fluid and the solid properties, respectively, and Dvr is the
Darcy’s fluid velocity. Here the temperature T depends on x, y, and z, and Dvr
is included in the XY plane. We assume that the thermal diffusivity of the
saturated porous rock in the fractured domain and that of the weakly altered-
granitic rock are the same, i.e. ( ) ( )spp cc
s⋅≈⋅= ρλρλκ // **
3.3. Scaling of the equations and numerical methods
The numerical method used here consists of coupling a 2-D fluid flow code
for the porous slot with a unique 3-D solver for the temperature field in the
fractured slot and its walls. This is achieved by setting vr = 0 in Eq. (10) outside
the fractured slot (y > 17.5 m). The temperature and the flow equations become
dimensionless by using the following scaling factors: in the uniform
permeability cases the length scale H is the height of the convective domain
(i.e. 2250 m plus h=200 m of impermeable granite bottom layer, see below), H
= 2450 m, the time unit is H²/κ = 6×10¹² s, and the Darcy velocity unit is κ/H
= 4×10⁻¹⁰ m/s, while in the non-uniform permeability cases, H = 2250 m and
represents the total height of the convective domain only. Then, H²/κ and κ/H
19
are changed accordingly. The dimensionless time t’=κt/H² and the
dimensionless Darcy velocity is Dv ' = Hν/κ . The permeability kS is scaled by
the permeability assigned to the stimulated reservoir at the center of the
fractured slot. The dimensionless injection rate Q’ is related to the
dimensional one Q by Q’= Q/(κ H). The dimensionless temperature is θ = (T-
T0)/∆T where ∆T = 60°C is the difference in temperature between the top and
bottom of the model, and T0 = 140°C is the constant temperature at its top.
These values are consistent with recorded logging temperatures.
The dependence of fluid density ρf on temperature is given by:
( ) ( )θαρθρ ⋅∆⋅−= Tf 10 (12)
where ρ0 = 980 kg/m3 is the fluid density at T = 140°C and at P = 490 bars.
The fluid thermal expansion coefficient s α=10-3/°C at temperatures ranging
from 80 to 200°C and at a pressure of about 600 bars (Jung et al., 1997).
Thus, in the fracture, the dimensionless heat equation becomes:
θθθγ 2'
'∇=∇⋅+
∂∂ rr
Dvt
(13)
where t' and vr D’ are the dimensionless time and velocity, respectively, and γ
= (ρcp)*/(ρcp)f is the ratio of the granite volumetric thermal capacity to that of
the geothermal fluid.
Therefore, the dimensionless flow equation is given by:
( )x
Razr
1zxr
1xr
1 2
′∂θ∂
×−
′∂
ψ′∂×
′∂
∂+
′∂ψ′∂
×
′∂
∂−=ψ′∇× (14)
20
where dimensionless variables for the distance and stream function are
designated by primes. Here, the driving term of the motion ( )x
Ra′∂θ∂
×− depends
on y’, the coordinate perpendicular to the fractured slot; this term generally
has its maximum value at the axis of the stimulated reservoir. The factor r =
R/R0 is the dimensionless hydraulic conductivity, which is a function of both
temperature and distance. The dimensional hydraulic conductivities are: R =
kS⋅ρf⋅g/µ and R0 = k⋅ρ0⋅g/µ0, where µ0 is the reference viscosity. In practice,
the difference in fluid viscosity between the top and the bottom of the porous
slot is not large enough to alter the convective flow (Kestin et al., 1978):
4.1/ 200140 ==∆ °=°= CTCT µµµ (15)
Only the temperature contrast between the injected fluid (T = 80°C) and the
initial reservoir temperature (T = 160°C) is likely to lead to a local viscosity
contrast. However, if the fluid has been heated up quickly at the contact with
the surrounding rock, the local viscosity variation cannot modify the flow at
some distance from the injection well. After performing a sensitivity analysis,
we verified that the circulation of the fluid is not sensitive to such viscosity
variations. Thus, a constant fluid viscosity of 3×10⁻⁴ Pa·s was used in the
models. Consequently, the Rayleigh number that characterizes the strength of
the convection is only a function of the height of the porous slot H, the
density difference across the convective domain ∆ρ, and the permeability kS.
The calculations are performed in a simulation domain of dimensionless
height widz = 1 , length widx = 1 , and width widy that is adjusted to represent
300 m in both the uniform and non-uniform permeability cases. We use a set
21
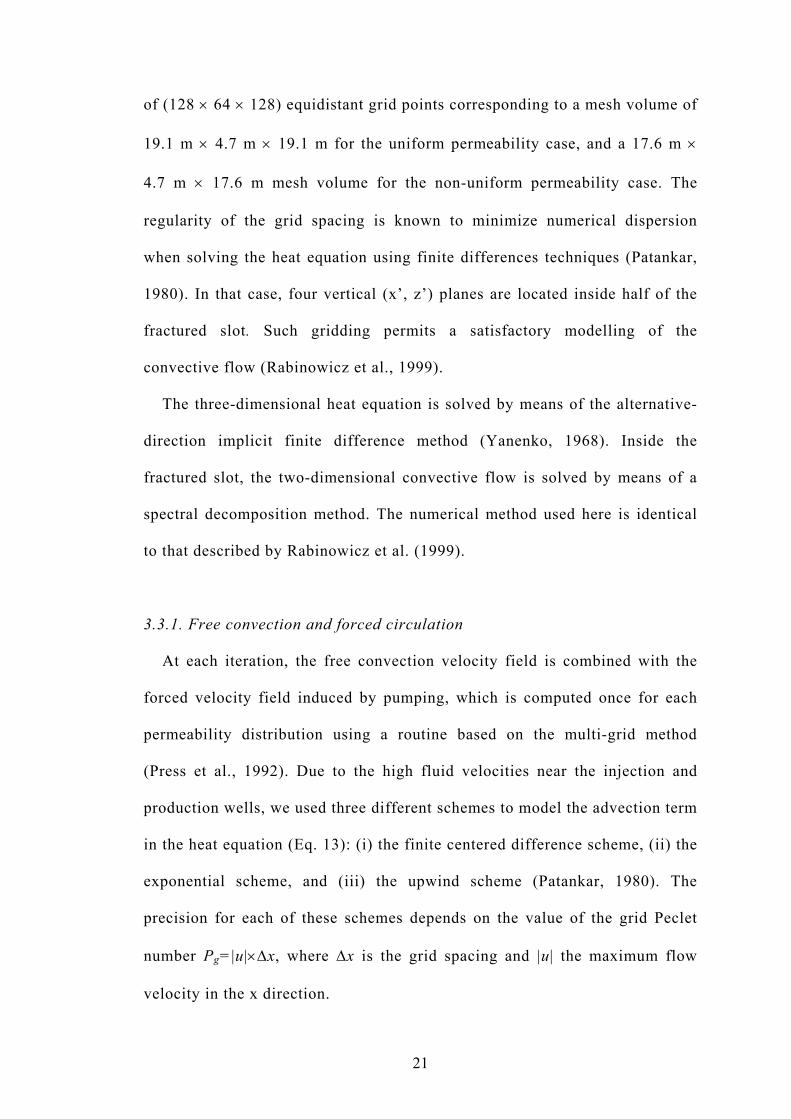
of (128 × 64 × 128) equidistant grid points corresponding to a mesh volume of
19.1 m × 4.7 m × 19.1 m for the uniform permeability case, and a 17.6 m ×
4.7 m × 17.6 m mesh volume for the non-uniform permeability case. The
regularity of the grid spacing is known to minimize numerical dispersion
when solving the heat equation using finite differences techniques (Patankar,
1980). In that case, four vertical (x’, z’) planes are located inside half of the
fractured slot. Such gridding permits a satisfactory modelling of the
convective flow (Rabinowicz et al., 1999).
The three-dimensional heat equation is solved by means of the alternative-
direction implicit finite difference method (Yanenko, 1968). Inside the
fractured slot, the two-dimensional convective flow is solved by means of a
spectral decomposition method. The numerical method used here is identical
to that described by Rabinowicz et al. (1999).
3.3.1. Free convection and forced circulation
At each iteration, the free convection velocity field is combined with the
forced velocity field induced by pumping, which is computed once for each
permeability distribution using a routine based on the multi-grid method
(Press et al., 1992). Due to the high fluid velocities near the injection and
production wells, we used three different schemes to model the advection term
in the heat equation (Eq. 13): (i) the finite centered difference scheme, (ii) the
exponential scheme, and (iii) the upwind scheme (Patankar, 1980). The
precision for each of these schemes depends on the value of the grid Peclet
number Pg=|u|×∆x, where ∆x is the grid spacing and |u| the maximum flow
velocity in the x direction.
22
Near the injection point, the temperature field is solved using the upwind
scheme, which ensures numerical stability but can result in large artificial
dispersion when locating the thermal front. Thus, the injection zone is not a
point source but an injection spot. Fitzgerald et al. (1996) established an
experimental law giving the temperature profile in the wall as a function of the
position with respect to the injection spot. We check that our computed temperature
profiles are in good agreement from that predicted by these authors.
3.3.2. Boundary and initial conditions
We impose adiabatic conditions on the vertical sides of the domain and
impermeable conditions on the four boundaries of the porous slot (ψ is zero
along these boundaries). The dimensionless temperature θ along the top and
bottom of the domain remains constant and is equal to 0 and 1, respectively.
The former conditions are consistent with the fact that: i) the y’= 0 plane is
the plane of symmetry for the 2 × 17.5 = 35-m thick fractured slot, and ii) the
plane y’= widy ( 300≈ m) is too far from the fractured slot for the temperature
field to be influenced by a convective process lasting about 20 years. In
several uniform permeability experiments, the cooling front reaches the
bottom interface of the permeable slot, there resulting in the development of a
steep thermal boundary layer. To accurately model the heat transfer in this
zone, we fix the conductive temperature of the model at h=200 m below the
slot bottom (this explains why the slot plus the bottom impermeable granite
basement for uniform permeability cases is at H = 2250 m+200 m = 2450 m).
The cooling front reaches the base of the 200-m thick conductive layer after a
23
period of t' = 5.25 × 10⁻⁴ ( ≈100 years); i.e. far longer than the expected life of
the planned EGS plant.
More generally, with the same configuration, but when there is no forced
flow (i.e. no fluid is injected or produced), the time necessary to develop both
the top and bottom boundary layers is large: it represents a fraction of the
dimensionless time, i.e. much more than ≈10,000 years. As a result, in the
experiments with a forced cold flow, we did not observe the development of a
top boundary layer. As no front developed there, we did not include a top
conductive horizontal layer in the model.
The numerical simulations began with a 3-D conductive temperature field
given by: Θ(x’, y’, z’) = 1 – z’. In the free convection simulations, the
convection was triggered by introducing a thermal perturbation of the
conductive temperature field according to:
Θ(x’, y’, z’) = 1 – z’+ 0.1 × sin(πz’) × ran(x’,y’) (16)
where ran(x’,y’) is a random function between 0 and 1. The introduction of this
“noise” considerably hastened the development of the non-linear convective
regime, which in any case requires more than 10,000 years to be established,
a time period that is far too long when compared with the expected life of the
EGS plant.
4. Results
Since the geometry is fixed, the distribution of temperature in the reservoir
will depend only on the Rayleigh number, the injection rate and the
permeability field. The effects of these three parameters are discussed below.
24
4.1. Uniform permeability
We consider dimensionless injection rates Q’ varying between 1.78 and
44.4 (4 L/s and 100 L/s) and Rayleigh numbers of 4050, 8100 and 16,200,
which correspond to a slot permeability of kS = 10-12 m2, 2 × 10-12 m2 and 4 × 10-12
m2, respectively. The period of simulation is t’ = 1.07×10⁻⁴ ( ≈20 years).
First we describe the thermal field at a fixed dimensionless injection rate of
17.8 (40 L/s) for each Rayleigh number (Figs. 2 to 5). Other injection rates
are then considered.
Since the injectate is colder than the in-situ fluid, a steep thermal front
develops at the contact with the hotter water in the permeable slot. When
buoyancy of the cold fluid is not considered in the model, i.e. when Ra = 0,
the front develops radially and is gradually smoothed by diffusion (Figs. 2a-
d). After t’ = 1.6×10⁻⁵ (≈3 years), the front reaches the production point and a
drastic drop in the temperature of the produced fluid is observed (Fig. 2f). If
the Rayleigh number is 4050 (Fig. 3), similar results are obtained.
When using the highest Rayleigh number, (Ra = 16,200), the cold (and denser)
injectate flows downwards and spreads along the bottom of the slot (Figs. 5a-d).
Along this lower interface a steep thermal boundary layer develops, as indicated by
the compressed isotherms. Two diffuse rising currents develop on both sides of the
cold-water tongue. One of them is captured by the flow toward the production point,
slightly increasing the temperature of the produced fluid (Fig. 5f). As the cold tongue
spreads outwards, it displaces plumes rising on each side of the fracture (Fig. 5e),
resulting in a slight drop in the produced fluid temperature. When using Ra = 8100
(Fig. 4), the behavior of the system is intermediate between that observed for Ra =
4050 and Ra = 16,200. The cold front is advected downward while it spreads radially,
25
reaching the production point after a long time lag. In all the simulations, the slot
walls are cooled by the injected fluid over a distance l equal to t⋅κ4 (i.e. 100 m)
after t’ = 1.07×10⁻⁴ (≈20 years) (Figs. 2e, 3e, 4e, 5e).
As a result, two types of behavior are observed, depending on the value of
the Rayleigh number and the injection rate. For a low Ra and a Q’ of 17.8 (40
L/s), the free convection is relatively slow and the cold front develops
laterally, affecting the fluid production temperature after t' = 2.14×10⁻⁵ (≈4
years). For higher Ra, the variations of fluid density with temperature drive
the flow. The injected fluid is dragged toward the bottom of the fracture by
thermal convection. As a result, the production temperature does not change,
even after t’= 1.07×10⁻⁴ (≈20 years).
We can therefore define a critical dimensionless injection rate QC’ below
which the production zone remains isolated from the cold injectate for t'
≤1.07×10⁻⁴ (≈20 years), preventing a dramatic drop of the extracted fluid
temperature. Conversely, at rates larger than QC’, the production
temperatures show significant decreases (Fig. 6).
In the following section, a given injection rate will be described as
“subcritical” or “supercritical” when it is lower or higher than the critical
injection rate, respectively. The critical injection rates QC and dimensionless
critical injection rates QC’, for Ra varying between 2025 and 24,300, are
given in Table 1. Figure 7 shows how the produced thermal power changes
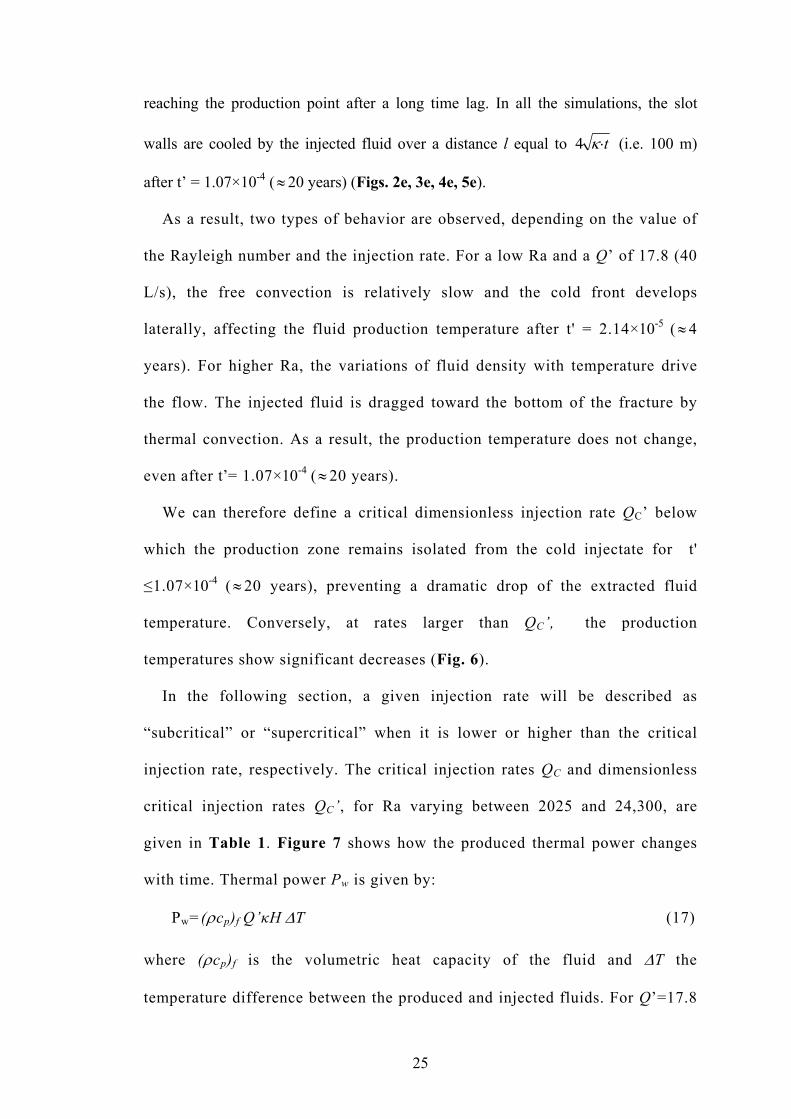
with time. Thermal power Pw is given by:
Pw=(ρcp)f Q’κH ∆T (17)
where (ρcp)f is the volumetric heat capacity of the fluid and ∆T the
temperature difference between the produced and injected fluids. For Q’=17.8
26
(40 L/s) and Ra = 4050, 8100 and 16,200, at t' = 1.07×10⁻⁴ (≈20 years), the
thermal power of the produced fluids amounts to 13.1 MW, 15.2 MW and 15.6
MW, respectively (Fig. 7). Thus, increasing the slot permeability by a factor
of four (i.e. raising Ra from 4050 to 16,200) improves the thermal yield of the
slot by 20 % (at t’ ≈20 years). These results show that the thermal power does
not increase linearly with the slot permeability. In fact, an infinitely large
Rayleigh number would result in an extraction temperature close to that at the
bottom of the fractured slot, and a thermal power of 20 MW.
4.2. Comparison between injection and free flow
In the previous section, we emphasized that there is competition between
free convection and the forced flow driven by pumping, which leads to a
calculation of the characteristic flow rate for free convection, QF’. Murphy
(1979) and Tournier et al. (2000) showed that free convection inside a vertical
fracture begins gradually, because of the transient heat exchange between the
convecting fluid and the surrounding rock. A quasi-steady convection state is,
however, observed when the heat transfer between the fluid in the slot and the
fracture walls reaches a constant asymptotic value. This steady convection
pattern is used to assess the fluid flow rate QF’ transported in the fracture by
free convection; QF’ is related to the stream function ψ’, which represents the
flow rate inside the flow tubes (see Eqs. 5-9). As a result, QF’ corresponds to
the product of the maximum dimensionless stream function value |ψ’|max and
the dimensionless slot aperture a’ (a’=a/H), i.e.:
QF’=a' |ψ’|max (18)
27
It should be noted that, at the highest values of Ra, fluid flow is mainly
confined along the outer parts of the convection cells, whereas at lower Ra it
occurs both within the periphery of the cells and at their core.
The non-dimensional QF’ is calculated for Ra values in the 0-24,300 range.
The maximum dimensionless free convection velocity varies between 472 (2.1
× 10-7 m/s) and 3825 (1.7 × 10⁻⁶ m/s) when Ra increases from 2025 to 16,200.
Table 1 presents the dimensionless (QF’) and dimensional free convection
(QF) rates for various Rayleigh numbers varying between 2025 and 24,300,
showing that QF’ increases approximately linearly with Ra, according to the
formula:
QF’= 3×10⁻⁴ × Ra – 0.4 (19)
When Ra >16,200, QF’ stops growing linearly with Ra. This Ra value is
close to RaI, the Rayleigh number above which convection starts
instantaneously (Tournier et al., 2000). This is due to the fact that heat
transport is increased by the appearance of a growing number of convection
cells without any notable increase in fluid flow velocities in the plumes.
Therefore, the convective velocities and flow rate do not increase linearly
with Ra. A similar situation can be achieved by increasing the thickness of the
slot. Murphy (1979) showed that the strength of the convection increases with
the square of the slot aperture. Accordingly, when the aperture or thickness
(a) of the fractured slot being modeled is large, the convective flow quickly
becomes chaotic. The simulations performed with smaller Ra have, however,
28
shown that both QF’ and QC’ are linearly related to the thickness of the
dimensionless fracture a’.
4.3. Non-uniform permeability
In this section we consider a fractured slot whose permeability is much
lower than that of the central stimulated domain (i.e. the core of the slot). The
configuration may be adjusted by changing the ratio KR of
the permeability of the stimulated core relative to that of the non-stimulated
external zone. The Rayleigh number is computed using the permeability of the
central zone and the total height of the domain (H = 2250 m). We use four Ra
values (0, 4050, 8100 and 16,200) and a dimensionless injection rate of 17.8
(40 L/s). As discussed in the previous section, this injection rate is higher
than the QC’ for Ra = 4050, and lower than that for Ra = 16,200.
Figures 8 to 11 (a to d) illustrate the temperature field at t’ = 1.07 × 10⁻⁴
(20 years) and Figs. 8 to 11 (e) the change in fluid production temperature
with time . The permeability ratios KR are assumed to be equal to 1, 5, 10, 50
and 100. A decrease of KR is associated with an increase in production
temperature. The propagation of the cold front through the system is similar
to that observed in the uniform permeability case (i.e. KR = 1) until the
injected fluid reaches the “permeability barrier” (i.e. the contact between the
stimulated and non-stimulated zone). The effect of confining fluid convection
mainly to the stimulated zone (i.e. the “confinement effect”) is significant
after about t' = 2 × 10⁻⁵ (4 years) when Ra = 4050 and 8100 (Figs. 9e and
10e), and after t'=10-5 (2 years) when Ra = 16,200 (Fig. 11e).
29
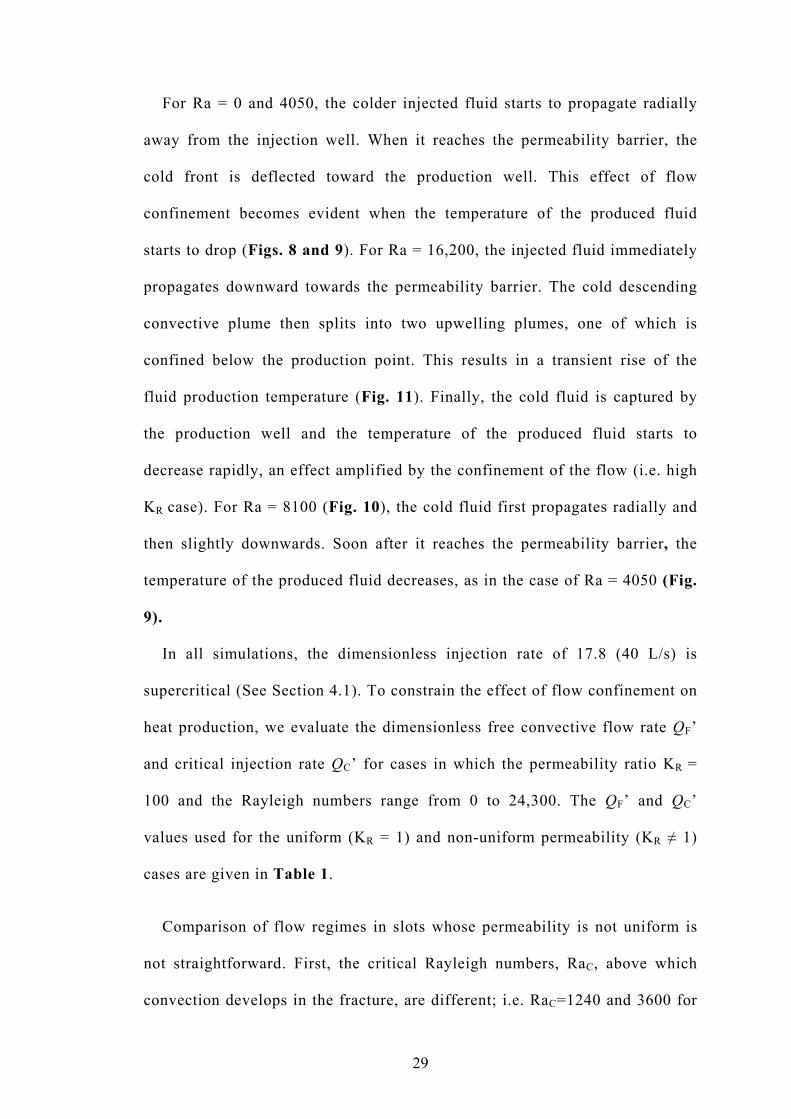
For Ra = 0 and 4050, the colder injected fluid starts to propagate radially
away from the injection well. When it reaches the permeability barrier, the
cold front is deflected toward the production well. This effect of flow
confinement becomes evident when the temperature of the produced fluid
starts to drop (Figs. 8 and 9). For Ra = 16,200, the injected fluid immediately
propagates downward towards the permeability barrier. The cold descending
convective plume then splits into two upwelling plumes, one of which is
confined below the production point. This results in a transient rise of the
fluid production temperature (Fig. 11). Finally, the cold fluid is captured by
the production well and the temperature of the produced fluid starts to
decrease rapidly, an effect amplified by the confinement of the flow (i.e. high
KR case). For Ra = 8100 (Fig. 10), the cold fluid first propagates radially and
then slightly downwards. Soon after it reaches the permeability barrier, the
temperature of the produced fluid decreases, as in the case of Ra = 4050 (Fig.
9).
In all simulations, the dimensionless injection rate of 17.8 (40 L/s) is
supercritical (See Section 4.1). To constrain the effect of flow confinement on
heat production, we evaluate the dimensionless free convective flow rate QF’
and critical injection rate QC’ for cases in which the permeability ratio KR =
100 and the Rayleigh numbers range from 0 to 24,300. The QF’ and QC’
values used for the uniform (KR = 1) and non-uniform permeability (KR ≠ 1)
cases are given in Table 1.
Comparison of flow regimes in slots whose permeability is not uniform is
not straightforward. First, the critical Rayleigh numbers, RaC, above which
convection develops in the fracture, are different; i.e. RaC=1240 and 3600 for
30
the uniform and non-uniform permeability models, respectively (Tournier et
al., 2000). The factor of three between these two RaC numbers is puzzling.
The Rayleigh number of the stimulated domain, i.e. the domain characterized
by a height of H/3 and a conductive temperature difference across it of ∆TR =
∆T/3, is Ra/9. A factor of nine is therefore expected between the RaC of the
confined and unconfined layer (i.e. with an height equal to H and a conductive
temperature difference across it of ∆T). In fact, the simulations show that the
strength of convection and, hence, the RaC, increases with the dimensionless
thickness of the fractured slot a/HR (which is three times greater than a/H).
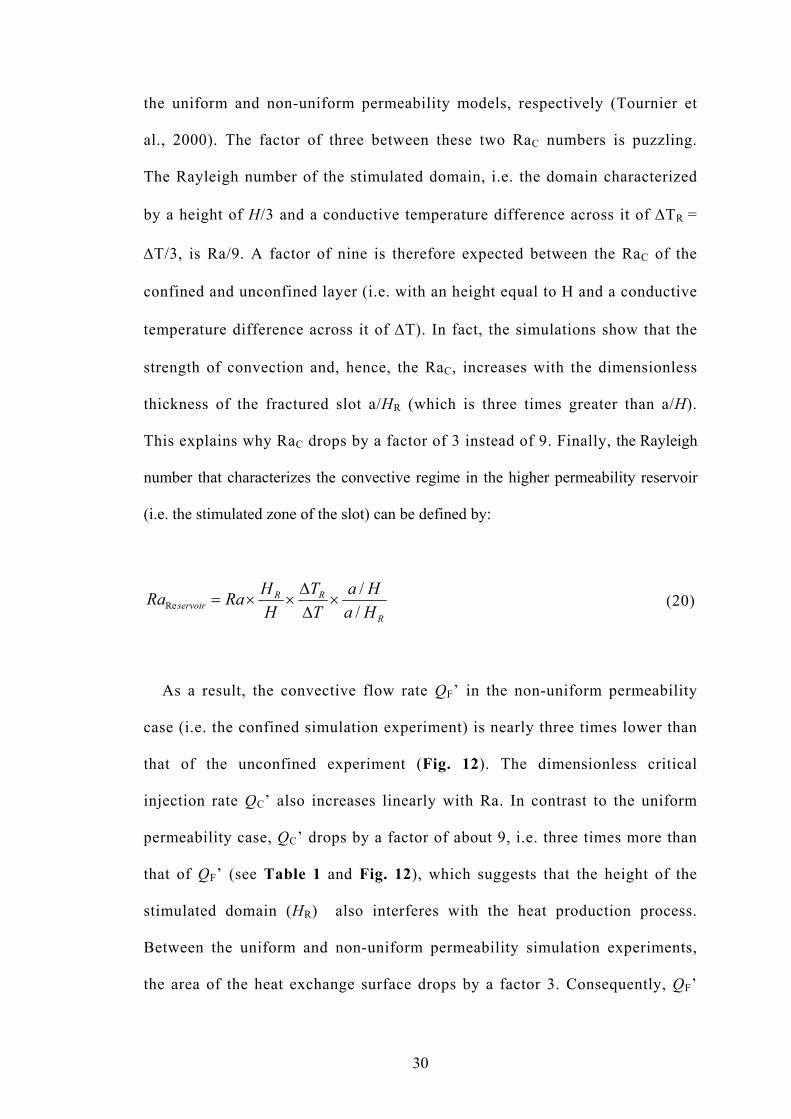
This explains why RaC drops by a factor of 3 instead of 9. Finally, the Rayleigh
number that characterizes the convective regime in the higher permeability reservoir
(i.e. the stimulated zone of the slot) can be defined by:
R
RRservoir Ha
HaTT
HHRaRa
//
Re ×∆∆
××= (20)
As a result, the convective flow rate QF’ in the non-uniform permeability
case (i.e. the confined simulation experiment) is nearly three times lower than
that of the unconfined experiment (Fig. 12). The dimensionless critical
injection rate QC’ also increases linearly with Ra. In contrast to the uniform
permeability case, QC’ drops by a factor of about 9, i.e. three times more than
that of QF’ (see Table 1 and Fig. 12), which suggests that the height of the
stimulated domain (HR) also interferes with the heat production process.
Between the uniform and non-uniform permeability simulation experiments,
the area of the heat exchange surface drops by a factor 3. Consequently, QF’
31
and QC’ are proportional to Ra×HR/H and to Ra×(HR/H)2, respectively. The
experiments also show that below a dimensionless critical injection rate QC0’
of about 2.7 (6 L/s) the cold front has not reached the production well at
t’=1.07×10⁻⁴ (20 years). Thus, even when there is no free convection, cold
water may be injected into the permeable slot without affecting the
temperature of the produced fluid. This minimum injection rate within the
higher permeability zone depends on the thickness of the stimulated domain
and on the distance between the injection and production wells.
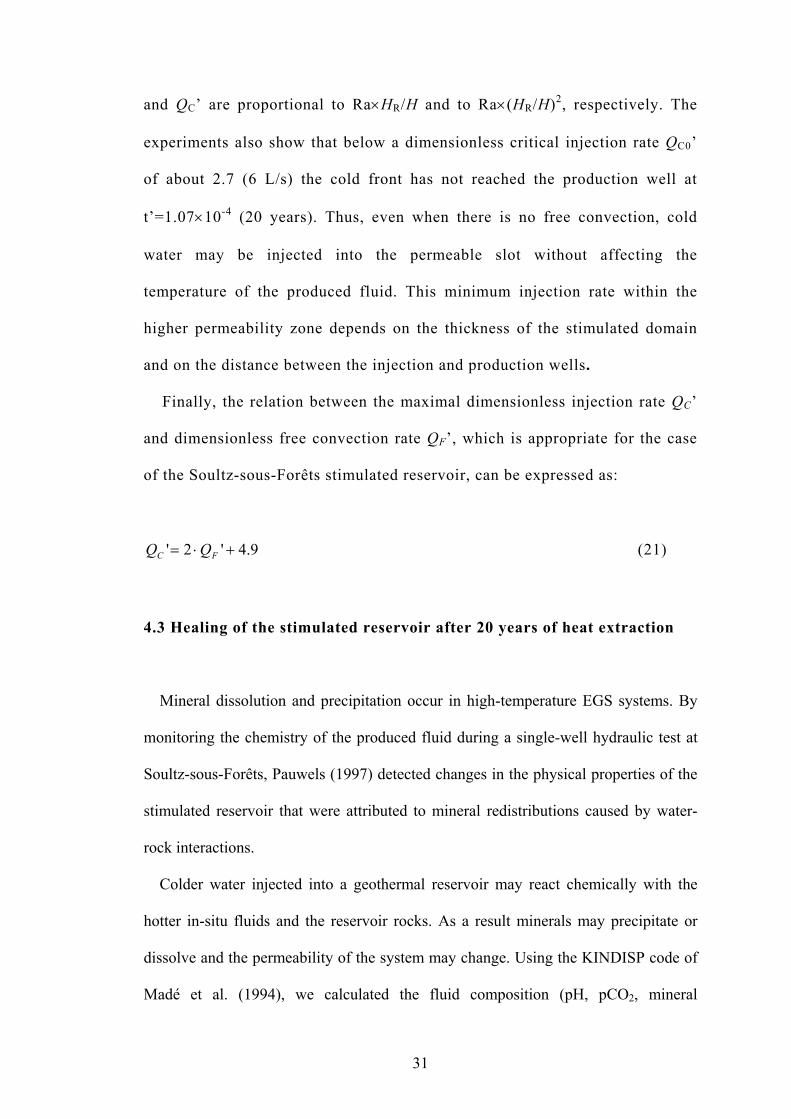
Finally, the relation between the maximal dimensionless injection rate QC’
and dimensionless free convection rate QF’, which is appropriate for the case
of the Soultz-sous-Forêts stimulated reservoir, can be expressed as:
9.4 '2' +⋅= FC QQ (21)
4.3 Healing of the stimulated reservoir after 20 years of heat extraction
Mineral dissolution and precipitation occur in high-temperature EGS systems. By
monitoring the chemistry of the produced fluid during a single-well hydraulic test at
Soultz-sous-Forêts, Pauwels (1997) detected changes in the physical properties of the
stimulated reservoir that were attributed to mineral redistributions caused by water-
rock interactions.
Colder water injected into a geothermal reservoir may react chemically with the
hotter in-situ fluids and the reservoir rocks. As a result minerals may precipitate or
dissolve and the permeability of the system may change. Using the KINDISP code of
Madé et al. (1994), we calculated the fluid composition (pH, pCO2, mineral
32
concentrations, and alkalinity) along a characteristic flow line connecting both wells.
We used the temperature and flow fields calculated when Ra = 16,200, for a fluid
injection rate Q = 40 L/s, and a stimulated reservoir of 750 m × 750 m × 35 m; these
parameters correspond to the model whose results are given in Fig. 11. The KINDISP
program uses kinetic laws governing water-rock interactions and computes mineral
precipitation and dissolution rates and related porosity changes along fluid flow lines.
Since the mineral assemblage in the system is dominated by carbonates, porosity
increases around the injection well, and the flow line is progressively sealed as the
injected fluid heats up during its flow towards the production well. If mineral
precipitation took place exclusively at the entrance of the fractures instead of all along
the crack walls, the reservoir permeability would likely drop dramatically around the
production well, but this situation is unlikely to occur. Our simulation results show
that the time required to seal the porosity of the fractured network is very long, and far
greater than the expected economic lifetime of an EGS project. As a result, we are
confident that the performance of EGS system at Soultz will not be significantly
affected by the rock-fluid chemical interactions. Moreover, Jacquot (2000) showed
that when the fracture network becomes partially sealed, acidification or hydraulic
stimulation of the wells could restore the permeability in the fracture system.
5. Summary, discussion and conclusions.
Our models examine forced circulation into a vertical fractured slot bound between
conductive walls. The heat extracted from an enhanced geothermal system over long
periods of time will depend on the interaction between forced and free convective
flows. Numerical experiments using different injection rates and Rayleigh numbers
showed that the effects of injecting colder fluid into the fractured system depend on
33
the strength of free convection. At high injection rates and low Rayleigh numbers, the
cold fluid propagates radially away from the injection well, quickly reaches the
production zone and inevitably leads to a dramatic drop in fluid production
temperature. At low injection rates and high Ra numbers, the cold injectate is dragged
downward towards the bottom of the reservoir by convection. Thus, the production
zone is isolated from the colder fluid and the temperature of the extracted fluid
remains high. For each Ra, the dimensionless critical injection rate, QC’, which
represents the transition between the two behaviors just described, is greater than six
times the dimensionless convective flow rate QF’. More precisely, our modelling
results lead to the following fit:
QC’=1.8×10⁻³ Ra + 0.2 (22)
The simulations also show that the dimensionless free convective flow rate QF’
grows linearly with Ra as long as the convective regime remains quasi-steady (Fig.
12). If a chaotic convective regime develops either by raising the Ra or by increasing
the slot thickness a, QF’ does not remain proportional to the Rayleigh number. A
specific study should be done to estimate the critical injection rate in EGS reservoirs
subjected to chaotic thermal convection. However, in the particular case of the
stimulated geothermal reservoir at Soultz-sous-Forêts, this regime is unlikely.
A variable permeability field was introduced to study the effect of a
peripheral low-permeability zone on reservoir performance. It accounts for a
highly stimulated zone around the injection and production points. The results
of the simulations suggest that both convective and forced flows are confined
to the highly permeable region of the slot. The injected fluid is deflected towards
34
the production zone when it reaches the boundaries of the lower permeability region.
Moreover, as the ratio between the permeability of the stimulated zone and that of the
peripheral domain approaches 100, the dimensionless free convection flow rate, QF’,
and critical injection rate, QC’, seem to decrease as HR/H and (HR/H)2, respectively.
For a permeability ratio KR = 100, a value reasonable for the Soultz-sous-Forêts site,
our modelling results lead to the following fit:
QC’=2×10⁻⁴ Ra + 4. (23)
Note that Eqs. (22) and (23) limit the QC’ variation range, when KR is between 1
and 100 (Fig. 12). The simulation conducted assuming no convection highlights the
existence of a dimensionless critical injection rate, QC0’, below which the cold front
never reaches the production zone. Therefore, whatever the convective regime, there
is a minimum injection rate below which short-circuiting is avoided for t’≤ 1.25 ×10⁻⁴
(20 years), which corresponds to the expected period of production of the geothermal
system at Soultz.
Our results compare favorably to the data from the Soultz September 1993
stimulation experiment. The injection started at low flow rates (less than 1 L/s) and
was progressively increased to 40 L/s after 15 days. Cornet (2000) shows the change
in the depth of the observed microseismic events with time. The data indicate that a
significant part of the injectate flowed along the lower half of the reservoir as long as
the injection rate was less than 12 L/s. This value is very close to the critical injection
rate we defined for a reservoir height of 750 m and a Ra = 4050.
At higher injection rates, the seismic cloud extended both upwards and downwards.
Such a behavior is consistent with the computed radial propagation of the cold front
35
when we used an injection rate greater than QC. This clearly highlights the role of
convection in modifying the flow path of the injected fluid. Note that, during the
hydraulic tests, the effective permeability increased as injection proceeded. Hence, in
this type of experiment, the critical injection rate QC also increased with time.
We demonstrated that, for a given borehole spacing and a production lifetime of 20
years, short-circuiting of the injected fluid between the wells occurs at a critical
injection rate of 6 L/s if no convection develops within the stimulated reservoir (Ra =
0). Considering the optimal permeability for the stimulated reservoir (i.e. Ra >
16,200), QC is equal to 61 L/s if the total height of the stimulated reservoir is 2250 m,
but equal to 17 L/s if the reservoir height HR is only 750 m (see Table 1 and Fig. 12).
At Soultz the injection rate is restricted to 20 L/s to prevent the development of
induced seismic events of magnitude greater than 3. This rate is very close to the
optimal fluid production rate for the stimulated geothermal reservoir of Soultz-sous-
Forêts (see Fig. 12 and table 1).
Based on the thermodynamic properties of the fluid and the configuration of the
stimulated reservoir, we can expect Rayleigh numbers ranging from 4050 to a
maximum of 18,225 at Soultz-sous-Forêts. Our simulations using Ra = 4050 and Q =
20 L/s resulted in a thermal power of 5.7 MW and a production temperature of
146.5°C, after 20 years. Using a Rayleigh number of 18,225, for which Q is close to
QC, the produced thermal power is 8 MW and the production temperature is 172°C
(Table 1). It should be emphasized that the efficiency of heat conversion to electricity
is so poor for a fluid production temperature lower than 150°C that a geothermal site
could become of questionable economic feasibility.
A rough estimate of the heat production from an EGS system when the injection
rate is supercritical can be obtained from calculations of the rock volume affected by
36
the circulation. The maximum geothermal heat flux measured at Soultz is about 180
mW/m2 (Gérard et al, 1984). Considering that all this heat is conducted through the
750 m× 35 m bottom of the stimulated domain of the permeable granitic slot (see Fig
1), the maximum total steady heat recharge rate by conduction through this lower
surface is about 4725 W. This quantity is negligible compared to the amount of heat
expected to be extracted during exploitation of the geothermal system (several MW).
It is thus impossible to assume a steady reservoir temperature.
To estimate the cooling of the stimulated region of the permeable slot (i.e. the
reservoir), we must consider the volume of rock affected by the fluid flowing between
the injection and production wells. This volume is a function of the characteristic
thickness of the region cooled inside the slot walls (i.e. t⋅κ4 ) and the path used by
the injected fluid in the reservoir. According to the strength of the convection, the
flow of the fluid affects different domains inside the stimulated reservoir. When Ra =
18,225, the height of the domain extends along the entire axis of the stimulated
reservoir, i.e. it covers a vertical area of 750 m × 750 m; when Ra = 4050 this surface
is reduced to 750 m × 400 m. The calculated temperature drop using an initial
temperature of 169°C is about 27° and 17°C for Ra = 4050 and 18,225, respectively.
These values confirm that this type of approximation is valid only when using
supercritical injection rates. This is consistent with the fact that the production
temperature under subcritical conditions is supplied by the hot convective current
generated along the bottom of the high-permeability slot.
A precise knowledge of reservoir parameters is fundamental to the evaluation of the
vigor of the convective regime and to optimizing the long-term profitability of the
EGS geothermal project. The useful parameters are height, permeability and the
thickness-to-height aspect ratio (a/H)R of the activated domain, but these are difficult
37
to assess, since the geometry of the strongly fractured porous slot is very complex and
is characterized by a heterogeneous permeability distribution (one should remember
that the fluid is channeled into the high permeability zones).
A major difficulty when modeling EGS systems is the lack of thermal equilibrium
between the fluid and the rock in the stimulated reservoir. This does not seem to be
the case at Soultz, but might be true in other EGS. Under such circumstances, the
transport of heat and mass would have to be simulated using more sophisticated
models (Quintard et al., 1997) than the ones utilized here.
Our numerical experiments were conducted using thickness-to-height aspect ratios
that were based on the distribution of the microseismic events recorded during Soultz-
sous-Forêts stimulation tests. Both the strength of free convection (Murphy, 1979) and
the critical injection rate depend greatly on the thickness of the stimulated reservoir.
This thickness must be carefully constrained if we are to achieve a realistic estimate of
the thermal yield of a given EGS project.
Using the KINDISP code of Madé et al. (1994), we simulated mineral
dissolution/precipitation during 20 years of exploiting an EGS system. Our
simulations indicate that even for time periods far longer than 20 years, mineral
precipitation will not be fast enough to significantly affect the permeability of the
EGS reservoir at Soultz-sous-Forêts.
Acknowledgments
The authors would like to thank André Gérard, Jason McKenna, Michael
O’Sullivan, and an anonymous reviewer for their helpful comments, as well as
Stefano Bellani, Marcelo Lippmann, Marnell Dickson, and Mike Toplis for major
38
editorial improvements. The calculations were performed using computers of the
Centre National d’Etudes Spatiales, Toulouse, France. The Institut de Recherche por
le Développment (IRD) is acknowledged for supporting A.B. during his stay at
Nouméa. This project was financed by the European Union STREP Pilot Plant.
References
Abé, H., Duchane, D.V., Parker, R.H., Kuriyagawa, M., 1999. Present status and remaining problems of HDR/HWR system design. Geothermics 28, 573−590. Barbier, E., 2002. Geothermal energy technology and current status: an overview. Renewable and Sustainable Energy Rev. 6, 3−65. Baria, R., Baumgärtner, J., Gérard, A., Jung, R., Garnish, J., 1999. European HDR research programme at Soultz-sous-Forêts (France) 1987-1996. Geothermics 28, 655-669. Cornet, F.H., 2000. Comment on ‘Large scale in situ permeability tensor of rocks from induced microseismicity’. Geophys. J. Int. 140, 465-469. Fitzgerald, S.D., Pruess, K., van Rappard, D.M., 1996. Laboratory studies of injection into horizontal fractures. In: Proceedings 21th Workshop on Geothermal Reservoir Engineering, Stanford University, Stanford, CA, pp. 113-118. Genter, A., Traineau, H., 1993. Fracture distribution from core analyses in the basement of the Rhine Graben. In: Proc. European Union of Geosciences, E.U.G. VII 4−8 April 1993, Strasbourg, France. Terra Nova Abstract 5, pp. 217−218. Genter, A., Dezayes, C., Gentier, S., Ledesert, B., Saussé, J., 2002. Conceptual fracture model at Soultz based on geological data. Fourth Int. H.D.R. Forum in Strasbourg 1998, Draft papers, Geologishe Jahrbuch, Sonderhefte Hannover, Baria, Baumgärtner, Gérard, and Jung Editors, 418 pp, 92-102. Genter, A., Traineau, H., Dezayes, C., Elsass, P., Ledesert, B., Meunier, A., Villemin, T., 1995. Fracture analysis and reservoir characterization of the granitic basement in the Hot Dry Rock Soultz project (France). Geotherm. Sci. Tech. 4, 189−214. Gérard, A., Jung, R., Baumgärtner, J., Baria, R., Gandy, T., Tran-Viet, T., 1998. Essais de circulation de moyenne durée conduits à Soultz-sous-Forêts en 1997. In :
39
Résultats et interprétation préliminaires et perspectives, internal report GEIE-Soultz-sous-Forêts, pp 62. Gérard, A, Menjoz, A., Schwoerer, P., 1984. L’anomalie thermique de Soultz-sous-Forêts. Géothermie Actualités 3, 35-42. Hettcamp, T., Klee, G., Rummel, F., 2002. Stress regime and permeability at Soultz derived from laboratory and in-situ tests. Fourth Int. H.D.R. Forum in Strasbourg 1998, Draft papers, Geologishe Jahrbuch, Sonderhefte Hannover, Baria, Baumgärtner, Gérard, and Jung Editors, 418 pp, 165-172. Hicks, T.W., Pines, R.J., Willis-Richards, J., Xu, S., Jupe, A.J., Rodrigues, N.E.V., 1996. A hydro-thermo-mechanical numerical model for HDR geothermal reservoir evaluation. Int. J. Rock Mech. Min. Sci. & Geomech. Abstr. 33, 499−511. Hu, W., Steen, H.P., 1996. Transition to chaotic natural convection in tall Hele-Shaw slots. Phys. Fluids 8, 1929-1937. Jacquot, J., 2000. Modélisation thermodynamique et cinétique des réactions géochimiques entre fluides de bassin et socle cristallin : application au site expérimental du programme européen de recherche en géothermie profonde (Soultz-sous-Forêts, Bas-Rhin, France). Phd thesis, Université Louis Pasteur de Strasbourg, France, 202 pp. Jung, R., Tran-Viet, T., Reich, W., Orzol, J., Dorner, D., Zaske, J., Schanze, U., 1997. Long term circulation test 97JUL12, HDR Project Soultz-sous-Forêts. Field Report Bgr Hannover, 1997. Kestin, J., Khalifa, H.E., Abe, Y., Grimes, C.E., Sookiazan, H., Wakehan, W.A., 1978. Effect of the pressure on the viscosity of aqueous NaCl solutions in the temperature range 20-150 °C. J. Chem. Eng. Data 23, 328-336. Kohl, T., Evans, K.F., Hopkirk, R.J., Rybach, J., 1995. Coupled hydraulic, thermal and mechanical considerations for the simulation of Hot Dry Rock reservoirs. Geothermics 24, 345−359. Kolditz, O., Clauser, C., 1998. Numerical simulation of flow and heat transfer in fractured crystalline rocks: application to the Hot Dry Rock site in Rosemanowes (U.K.). Geothermics 27, 1−23. Madé, B., Clément, A., Fritz, B., 1994. Modelling mineral/solution interactions: the thermodynamic and kinetic code KINDISP. Computers and Geosciences, 20, 1347-1363. Murphy, H.D., 1979. Convective instabilities in vertical fractures and faults. J. Geophys. Res. 84, 6121−6130. Murphy, H.D., Tester, J.W., Grigsby, C.O., Potter, R.M., 1981. Energy extraction from fractured geothermal reservoirs in low-permeability crystalline rock. J. Geophys. Res. 103, 7145−7158.
40
Ormond, A., Boulègue, J., Genthon, P., 1995. A thermo-convective interpretation of heat flow data around ODP Leg 116 in a distal part of the Bengal Basin. J. Geophys. Res. 100, 8083−8095. O’Sullivan, M.J., Pruess, K., Lippmann, M.J., 2001. State of the art of geothermal reservoir simulation. Geothermics 30, 395−429. Patankar, S.V., 1980. Numerical heat transfer and fluid flow. Series in computational methods in mechanics and thermal sciences. McGraw-Hill, New York, NY, USA, 197 pp. Pauwels, H., Fouillac, C., Fouillac, A.M., 1993. Chemistry and isotopes of deep geothermal saline fluids in the upper Grabben : origin of compounds and water rock interaction, Geochim. Cosmochim. Acta 57, 243-255. Pauwels, H., 1997. Geochemical results of a single-well hydraulic injection test in an experimental Hot Dry Rock geothermal reservoir, Soultz-sous-Forêts, Alsace, France. Applied Geochemistry 12, 661-673. Pearson, C., 1981. The relationship between microseismicity and high fluid pressure during hydraulic experiments in low permeability granitic rocks, J. Geophys. Res., 86, B9, 7854-7864. Plenefisch, T., and Bonjer, K.P., 1997. The stress field in the Rhine Graben area inferred from earthquake focal mechanism and estimation of frictional parameters, Tectonophysics, 275, 71-97. Press, W.H., Teukolsky, S.A., Vetterling, W.T., Flannery, B.P., 1992. Numerical recipes in Fortran. The Art of Scientific Computing, 2nd ed., Cambridge University Press, New York, NY, USA, 818 pp. Pribnow, D.F.C., Schellschmidt, R., 2000. Thermal tracking of upper crustal fluid flow in the Rhine Graben. Geophys. Res. Lett. 27, 1957-1961. Quintard, M., Kaviany, M., Whitaker, S., 1997. Two-medium treatment of heat transfer in porous media: numerical results for effective properties. Advances in Water Resources 20, 77−94. Rabinowicz M., Dandurand, J.L., Jakubowski, M., Schott, J., Cassan, J.P., 1985. Convection in a North Sea oil reservoir; inferences on diagenesis and hydrocarbon migration. Earth Planet. Sci. Lett. 74, 4, 387-404. Rabinowicz, M., Sempéré, J.C., Genthon, P., 1999. Thermal convection in a vertical permeable slot: implications for hydrothermal circulation along mid-ocean ridges. J. Geophys. Res. 104, 29275−29292. Shapiro, S.A., Audigane, P., Royer, J.J, 1999. Large scale in situ permeability tensor of rocks from induced microsismicity. Geophys. J. Int. 137, 207-213.
41
Shapiro, S.A., Royer, J.J., Audigane, P., 2002. Characterization of the reservoir permeability using fluid-injection induced seismic emission. Fourth Int. H.D.R. Forum in Strasbourg 1998, Draft papers, Geologishe Jahrbuch, Sonderhefte Hannover, Baria, Baumgärtner, Gérard, and Jung Editors, 418 pp, 219-225. Tournier, C., Genthon, P., Rabinowicz, M., 2000. The onset of natural convection in vertical fault planes: consequences for the thermal regime in crystalline basement and heat recovery experiments. Geophys. J. Int. 140, 500−508. Yanenko, N.N., 1968. Méthode à pas fractionnaire: résolution des problèmes polydimensionnels de la physique mathématique. Librairie Armand Colin, Paris, France, 205 pp.
42
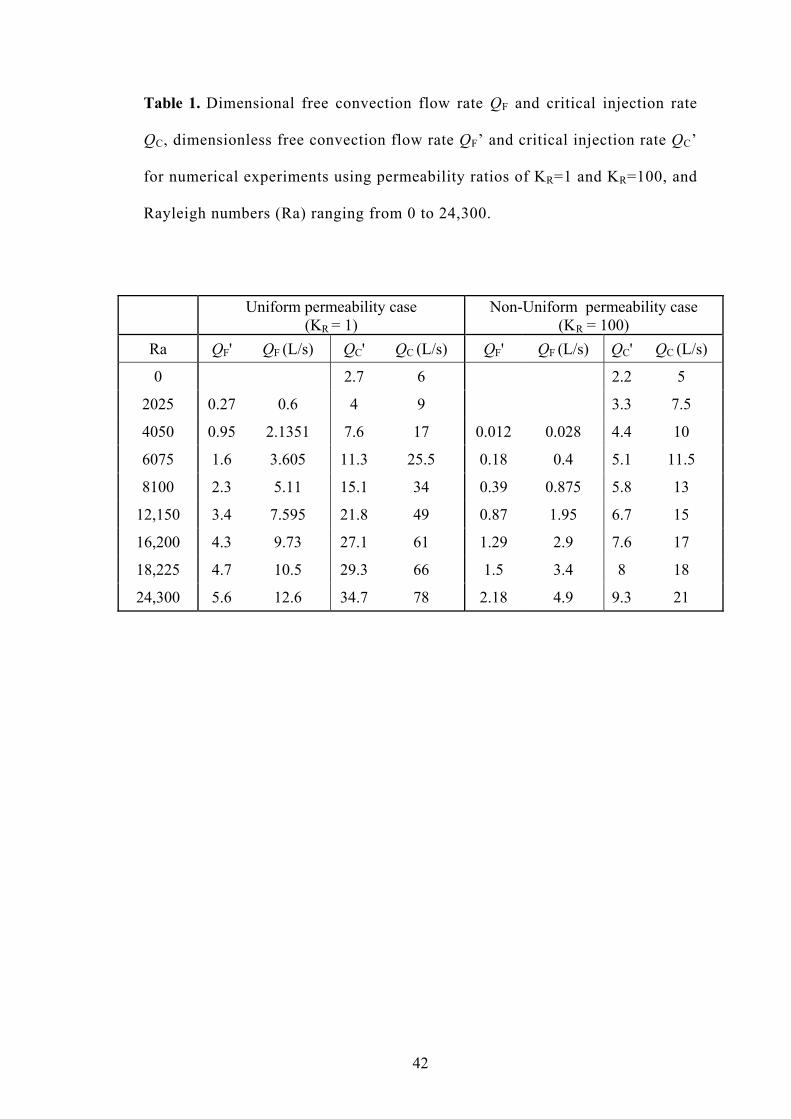
Table 1. Dimensional free convection flow rate QF and critical injection rate
QC, dimensionless free convection flow rate QF’ and critical injection rate QC’
for numerical experiments using permeability ratios of KR=1 and KR=100, and
Rayleigh numbers (Ra) ranging from 0 to 24,300.
Uniform permeability case (KR = 1)
Non-Uniform permeability case (KR = 100)
Ra QF' QF (L/s) QC' QC (L/s) QF' QF (L/s) QC' QC (L/s)
0 2.7 6 2.2 5
2025 0.27 0.6 4 9 3.3 7.5
4050 0.95 2.1351 7.6 17 0.012 0.028 4.4 10
6075 1.6 3.605 11.3 25.5 0.18 0.4 5.1 11.5
8100 2.3 5.11 15.1 34 0.39 0.875 5.8 13
12,150 3.4 7.595 21.8 49 0.87 1.95 6.7 15
16,200 4.3 9.73 27.1 61 1.29 2.9 7.6 17
18,225 4.7 10.5 29.3 66 1.5 3.4 8 18
24,300 5.6 12.6 34.7 78 2.18 4.9 9.3 21
43
Figure captions
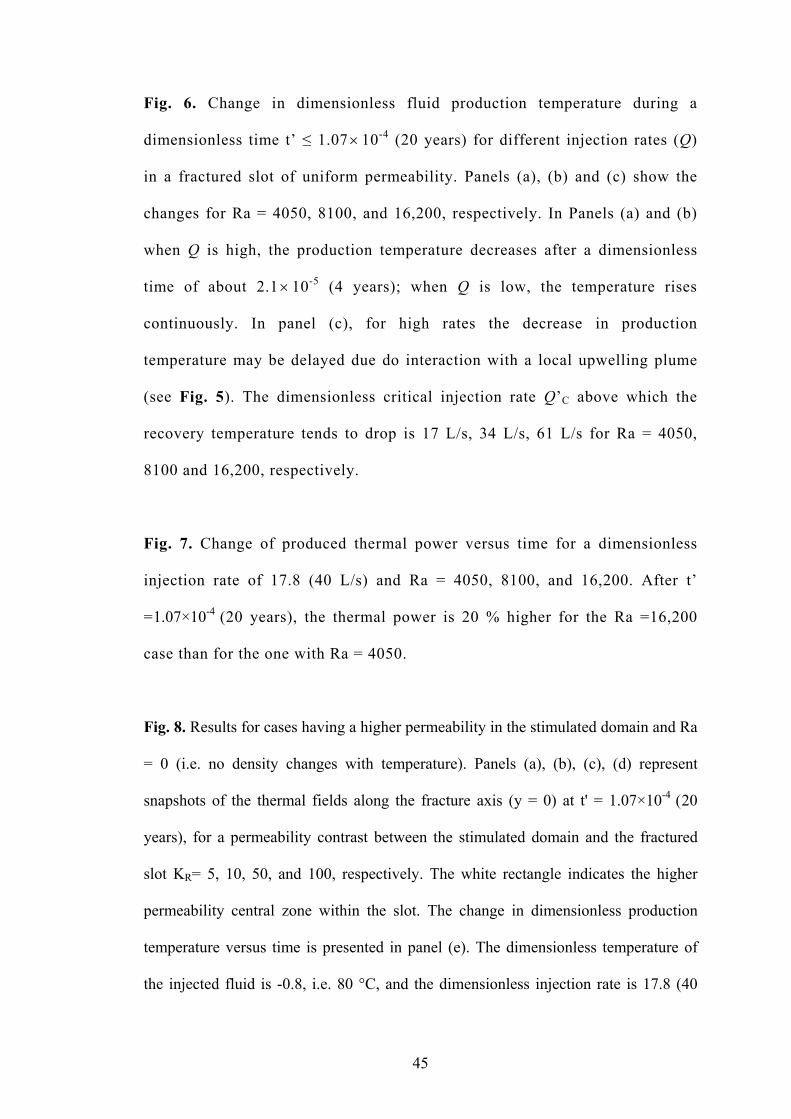
Fig. 1. (a) Configuration of the test performed in 1997 at the Soultz-sous-Forêts EGS
site. The two boreholes, GPK1 and GPK2, are separated by a horizontal distance of
450 m and define an alignment parallel to the direction of the major horizontal stress.
The height (HR) and length (LR) of the stimulated reservoir (gray area) connecting
both wells is 750 m. The (cold) water injected into GPK1 picks up heat within the
stimulated reservoir, is extracted in well GPK2, the (hot} produced fluid is cooled
with water from the pond near GPK2 and piped back to GPK1 for a new circulation
cycle. (b) Geometry of the modeled domain. Due to the symmetry of the system, only
the half-space (y ≥ 0) is shown. The light gray area represents half of the modeled
fractured slot with thickness a/2 = 17.5 m. The slot exchanges heat with the
impermeable granitic rock located at y > a/2. A total width of A/2 = 300 m of granite
is modeled. For the uniform permeability cases, a conductive layer of height h = 200
m is added at the base of the model (dotted area) to prevent the formation of an
unrealistically thin thermal boundary layer (see text). In this case, the width, L and
height, H are both equal to 2450 m. In the non-uniform permeability cases, the
stimulated reservoir (dark gray area) corresponds to a high permeability zone with a
height HR = 750 m a width LR = 750 m and a half thickness equal to a/2 = 17.5 m.
Since in this case the bottom conductive layer is not considered, the height and length
of the modeled zone are H = L = 2250 m. The two arrows point toward the injection
and production points (i.e. where the wells are open to the stimulated reservoir).
44
Fig. 2. Results for the case of uniform permeability in the vertical fractured slot and
Ra = 0 (i.e. no density changes with temperature). Distribution of dimensionless
temperatures along the fracture axis (y = 0), (a) at t' = 1.07×10⁻⁵ (2 years); (b) at t =
2.66×10⁻⁵ (5 years); (c) at t' = 5.35×10⁻⁵ (10 years); and (d) at t' = 1.07×10⁻⁴ (20
years); (e) 3-D dimensionless temperature field inside the walls of the slot (i.e. a/2 <y
<A): the 0.6 and 0.8 isotherms at t '= 1.07×10⁻⁴ (20 years) are drawn. The coldest
surface (θ = 0.6) overlies the warmest one (θ = 0.8). The vertical plane at the back
corresponds to the border of the model (y = A), while the plane at the front borders the
permeable slot (y = a/2). The dimensionless temperature of the injected fluid is -0.8
(80 °C), and the dimensionless injection rate is 17.8 (40 L/s). The injected fluid flows
radially away from the injection well and the cold front reaches the production point
after 4 years; (f) fluid production temperature versus time,
Fig. 3. Same as Fig. 2, but with Ra = 4050. The behavior of the injected fluid is
similar to that when Ra =0. The temperature of the produced fluid decreases after 5
years.
Fig. 4. Same as Fig. 2, but with Ra = 8100. The cold front is advected downward
while it spreads radially.
Fig. 5. Same as Fig. 2, but with Ra =16,200. The injected fluid is advected downward
as a cold tongue by free convection. The production zone is isolated from the
colder injectate and the fluid production temperature increases uniformly.
45
Fig. 6. Change in dimensionless fluid production temperature during a
dimensionless time t’ ≤ 1.07× 10⁻⁴ (20 years) for different injection rates (Q)
in a fractured slot of uniform permeability. Panels (a), (b) and (c) show the
changes for Ra = 4050, 8100, and 16,200, respectively. In Panels (a) and (b)
when Q is high, the production temperature decreases after a dimensionless
time of about 2.1× 10⁻⁵ (4 years); when Q is low, the temperature rises
continuously. In panel (c), for high rates the decrease in production
temperature may be delayed due do interaction with a local upwelling plume
(see Fig. 5). The dimensionless critical injection rate Q’C above which the
recovery temperature tends to drop is 17 L/s, 34 L/s, 61 L/s for Ra = 4050,
8100 and 16,200, respectively.
Fig. 7. Change of produced thermal power versus time for a dimensionless
injection rate of 17.8 (40 L/s) and Ra = 4050, 8100, and 16,200. After t’
=1.07×10⁻⁴ (20 years), the thermal power is 20 % higher for the Ra =16,200
case than for the one with Ra = 4050.
Fig. 8. Results for cases having a higher permeability in the stimulated domain and Ra
= 0 (i.e. no density changes with temperature). Panels (a), (b), (c), (d) represent
snapshots of the thermal fields along the fracture axis (y = 0) at t' = 1.07×10⁻⁴ (20
years), for a permeability contrast between the stimulated domain and the fractured
slot KR= 5, 10, 50, and 100, respectively. The white rectangle indicates the higher
permeability central zone within the slot. The change in dimensionless production
temperature versus time is presented in panel (e). The dimensionless temperature of
the injected fluid is -0.8, i.e. 80 °C, and the dimensionless injection rate is 17.8 (40
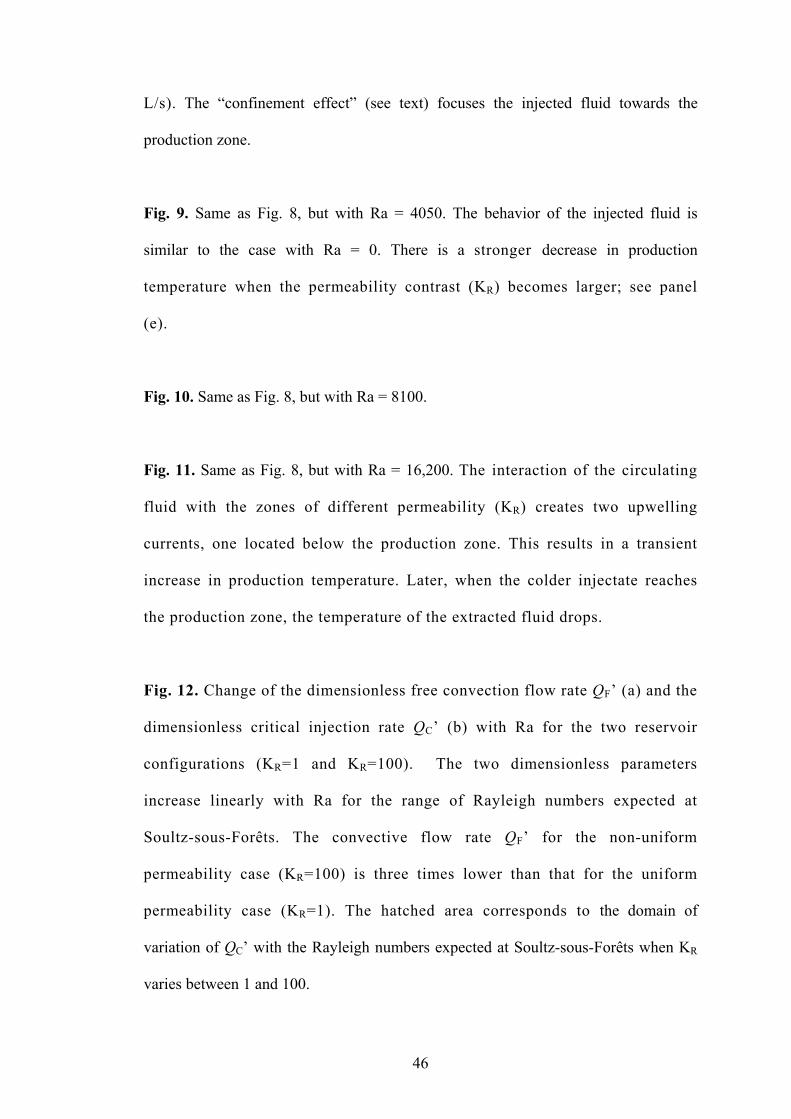
46
L/s). The “confinement effect” (see text) focuses the injected fluid towards the
production zone.
Fig. 9. Same as Fig. 8, but with Ra = 4050. The behavior of the injected fluid is
similar to the case with Ra = 0. There is a stronger decrease in production
temperature when the permeability contrast (KR) becomes larger; see panel
(e).
Fig. 10. Same as Fig. 8, but with Ra = 8100.
Fig. 11. Same as Fig. 8, but with Ra = 16,200. The interaction of the circulating
fluid with the zones of different permeability (KR) creates two upwelling
currents, one located below the production zone. This results in a transient
increase in production temperature. Later, when the colder injectate reaches
the production zone, the temperature of the extracted fluid drops.
Fig. 12. Change of the dimensionless free convection flow rate QF’ (a) and the
dimensionless critical injection rate QC’ (b) with Ra for the two reservoir
configurations (KR=1 and KR=100). The two dimensionless parameters
increase linearly with Ra for the range of Rayleigh numbers expected at
Soultz-sous-Forêts. The convective flow rate QF’ for the non-uniform
permeability case (KR=100) is three times lower than that for the uniform
permeability case (KR=1). The hatched area corresponds to the domain of
variation of QC’ with the Rayleigh numbers expected at Soultz-sous-Forêts when KR
varies between 1 and 100.
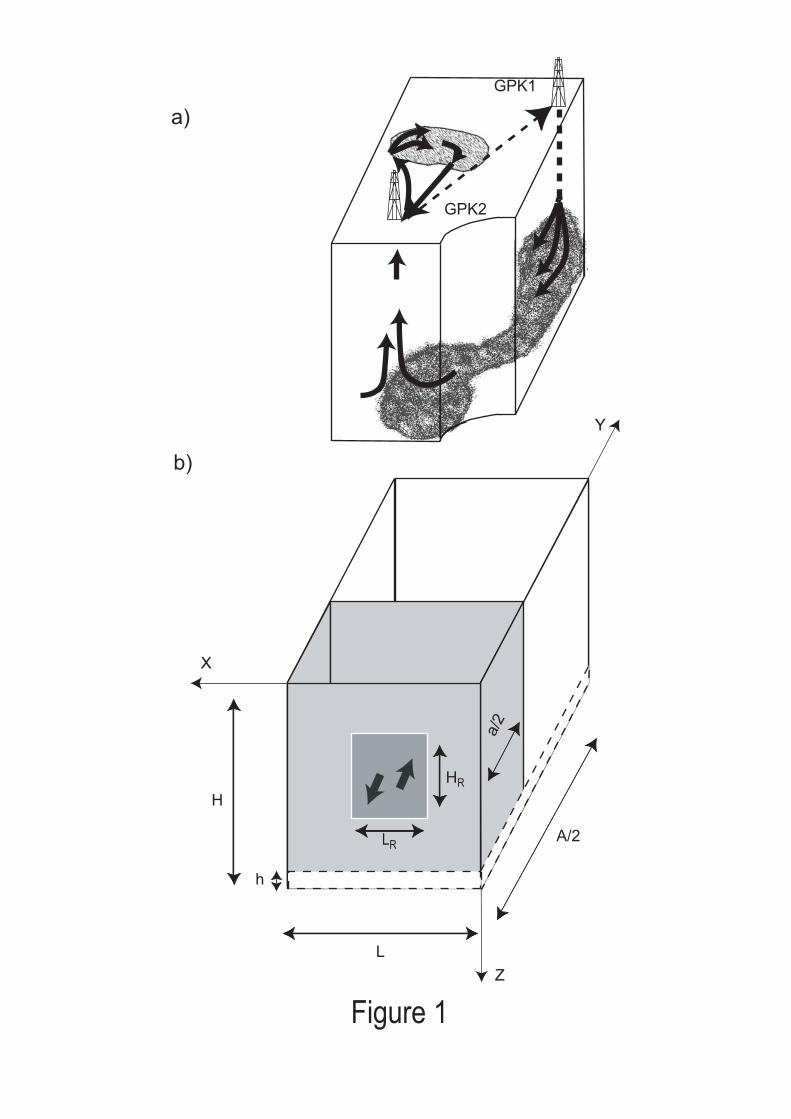
b)
X
Y
Z
H
A/2
a/2
HR
LR
L
h
GPK1
GPK2
a)
Figure 1
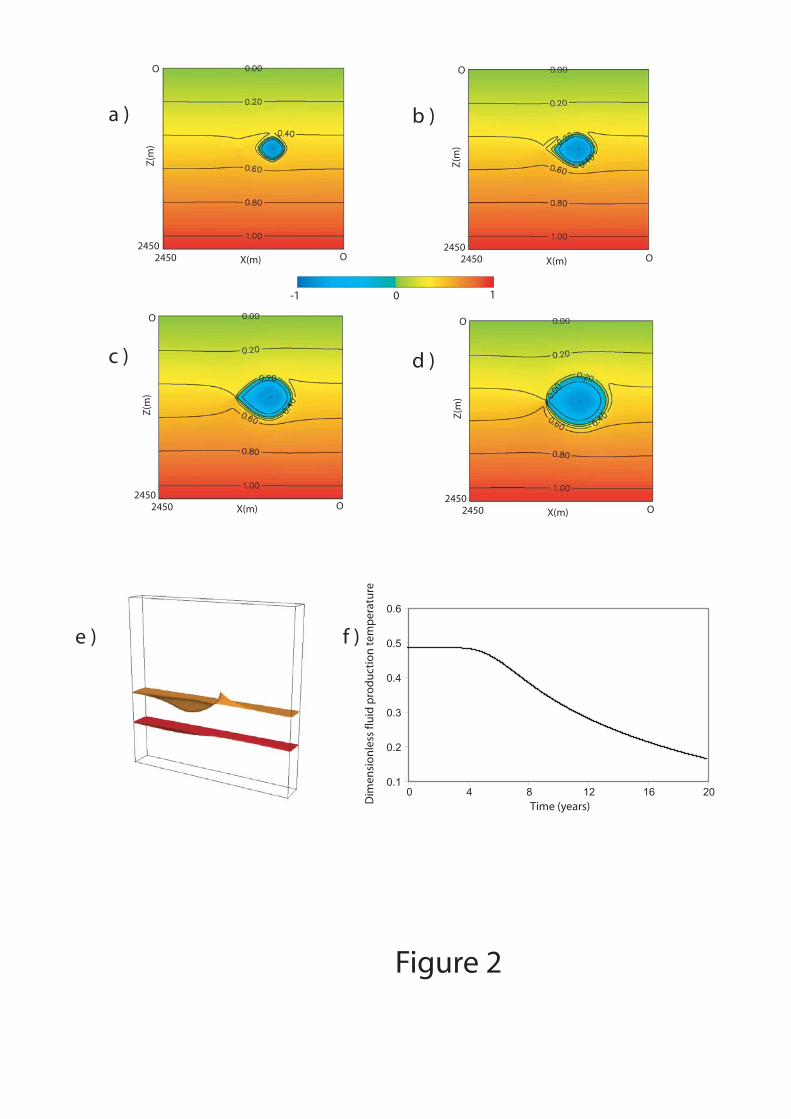
0.1
0.2
0.3
0.4
0.5
0.6
0 4 8 12 16 20
Time (years)
e ) f )
a )
c )
b )
d )
-1 0 1
O
2450O2450 X(m)
Z(m
)
O
2450O2450 X(m)
Z(m
)
O
2450O2450 X(m)
Z(m
)
O
2450O2450 X(m)
Z(m
)
Figure 2
Dim
ensi
on
less
flu
id p
rod
uct
ion
tem
per
atu
re
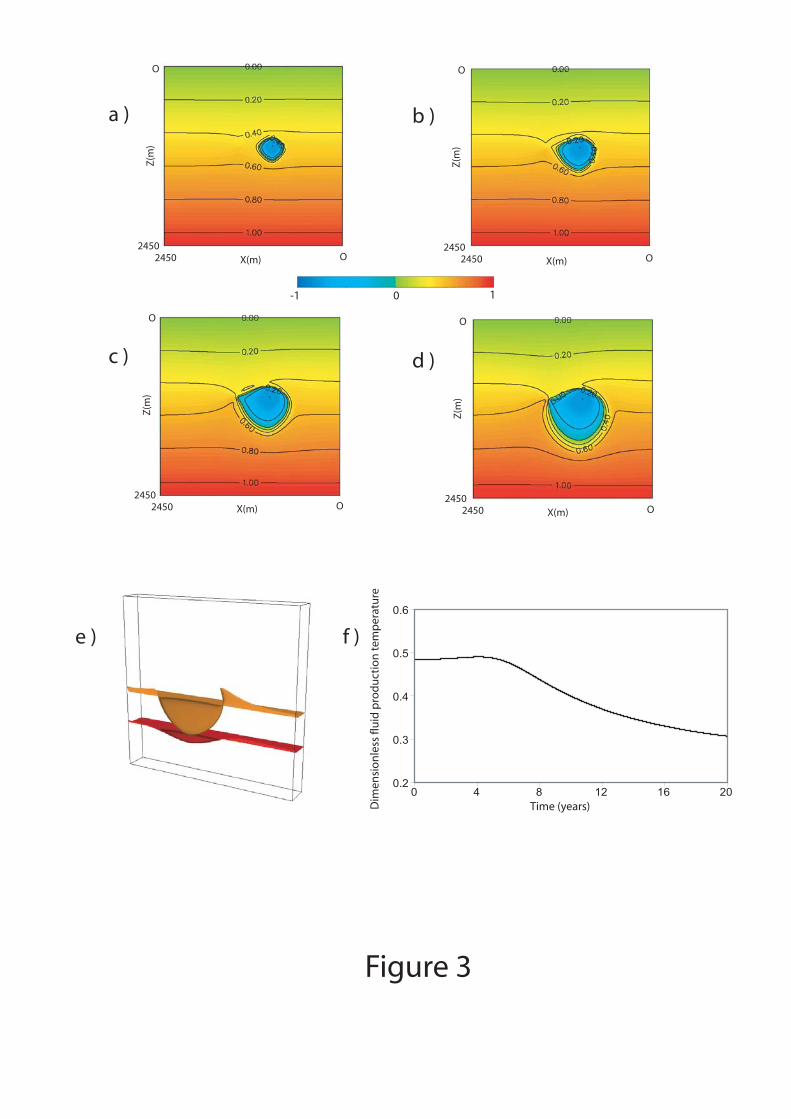
e ) f )
a )
c )
b )
d )
-1 0 1
O
2450O2450 X(m)
Z(m
)
O
2450O2450 X(m)
Z(m
)
O
2450O2450 X(m)
Z(m
)
O
2450O2450 X(m)
Z(m
)
Time (years)
0.2
0.3
0.4
0.5
0.6
0 4 8 12 16 20
Figure 3
Dim
ensi
on
less
flu
id p
rod
uct
ion
tem
per
atu
re
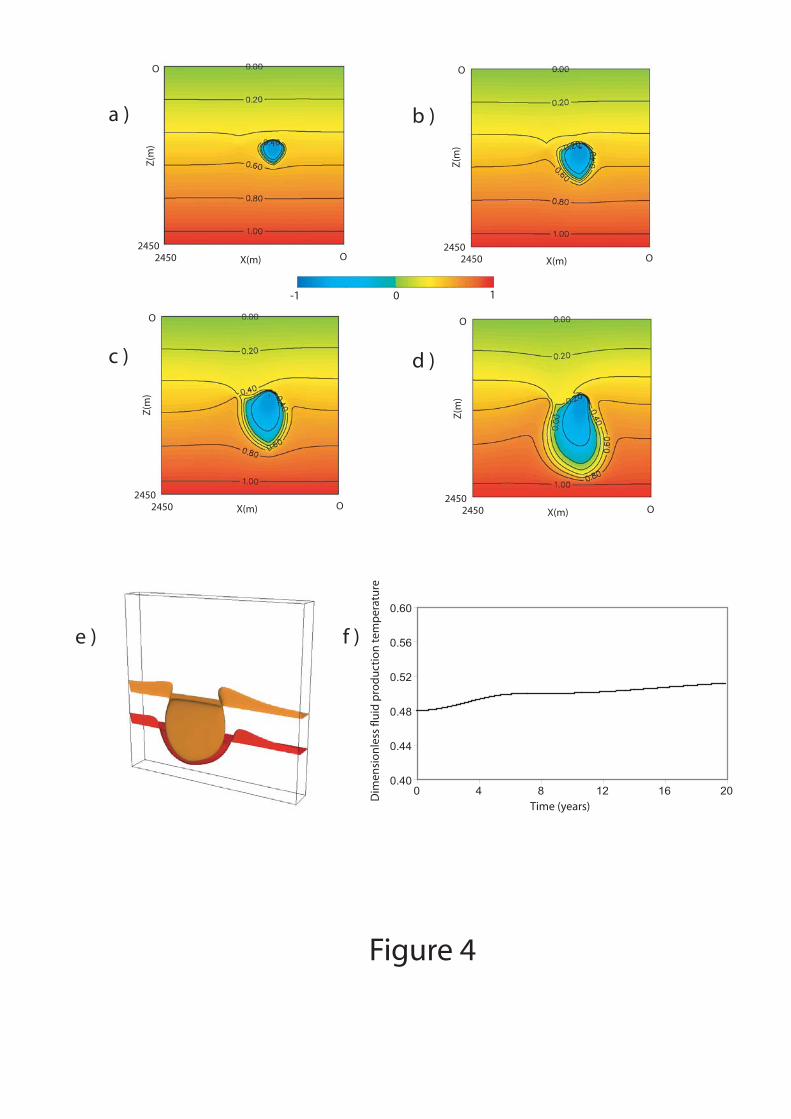
e ) f )
a )
c )
b )
d )
-1 0 1
O
2450O2450 X(m)
Z(m
)
O
2450O2450 X(m)
Z(m
)
O
2450O2450 X(m)
Z(m
)
O
2450O2450 X(m)
Z(m
)
Time (years)
0.40
0.44
0.48
0.52
0.56
0.60
0 4 8 12 16 20
Figure 4
Dim
ensi
on
less
flu
id p
rod
uct
ion
tem
per
atu
re
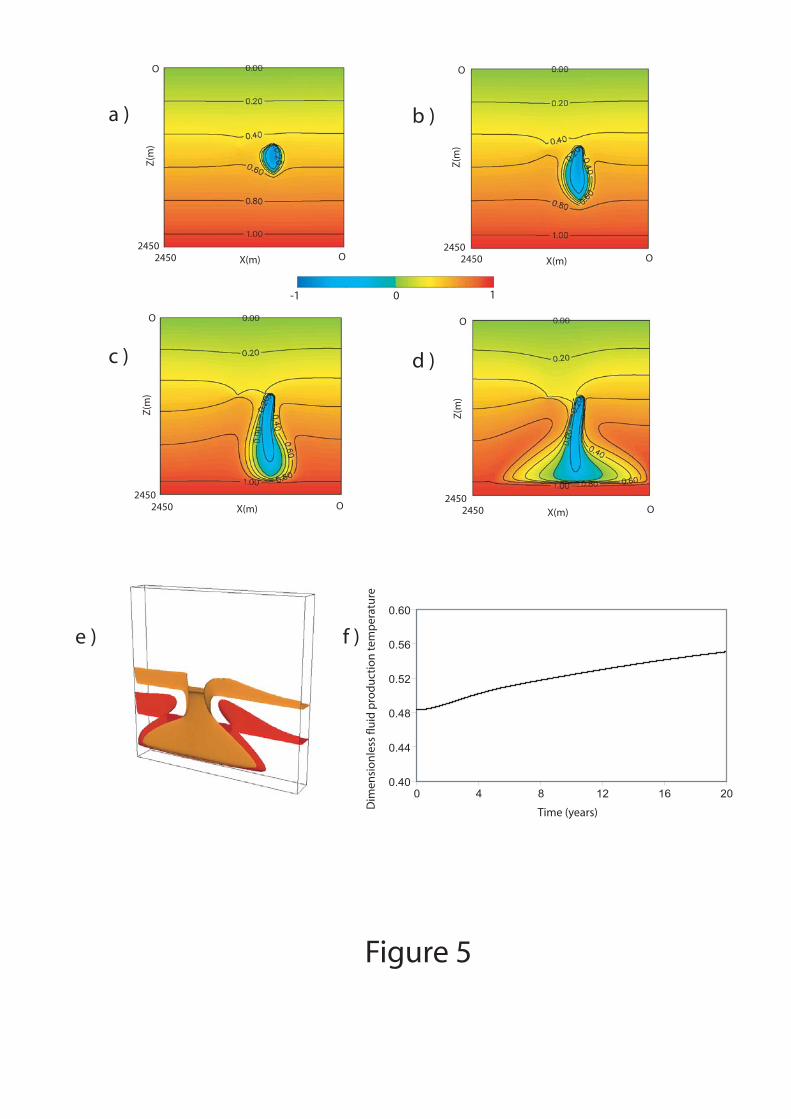
e ) f )
a )
c )
b )
d )
-1 0 1
O
2450O2450 X(m)
Z(m
)
O
2450O2450 X(m)
Z(m
)
O
2450O2450 X(m)
Z(m
)
O
2450O2450 X(m)
Z(m
)
0.40
0.44
0.48
0.52
0.56
0.60
0 4 8 12 16 20
Figure 5
Time (years)
Dim
ensi
on
less
flu
id p
rod
uct
ion
tem
per
atu
re
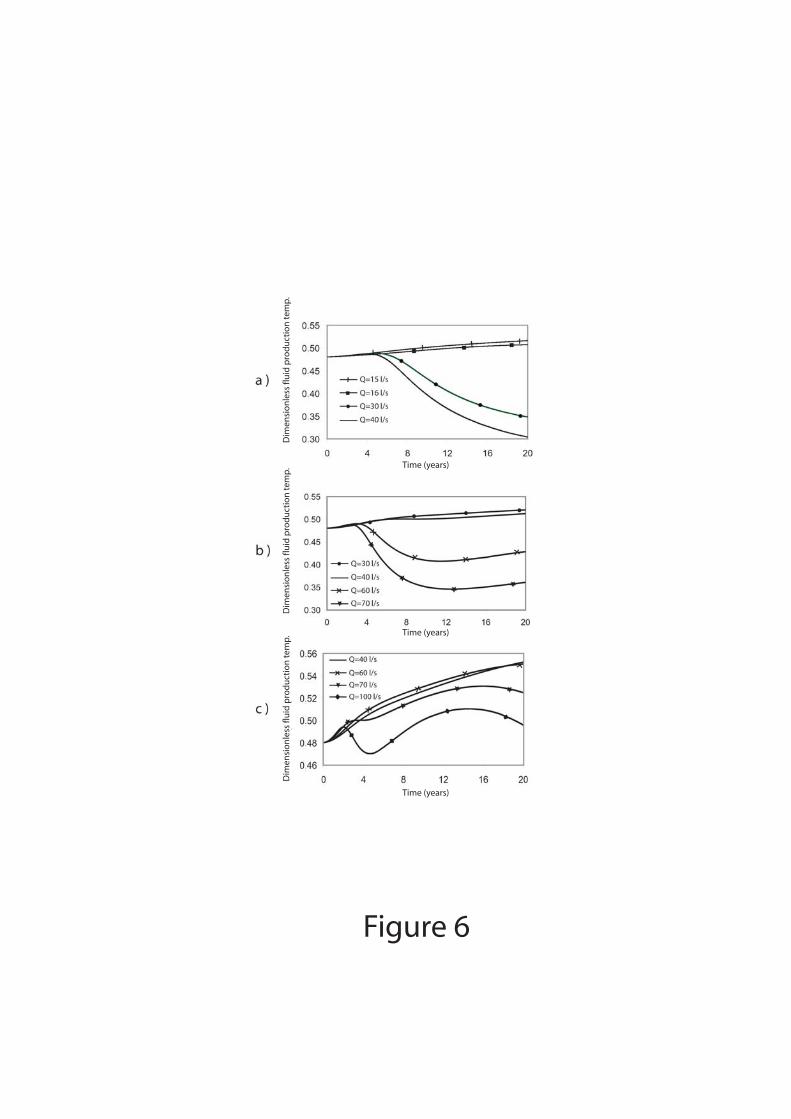
Figure 6
Dim
ensi
on
less
flu
id p
rod
uct
ion
tem
p.
Dim
ensi
on
less
flu
id p
rod
uct
ion
tem
p.
Dim
ensi
on
less
flu
id p
rod
uct
ion
tem
p.
Time (years)
Time (years)
Time (years)
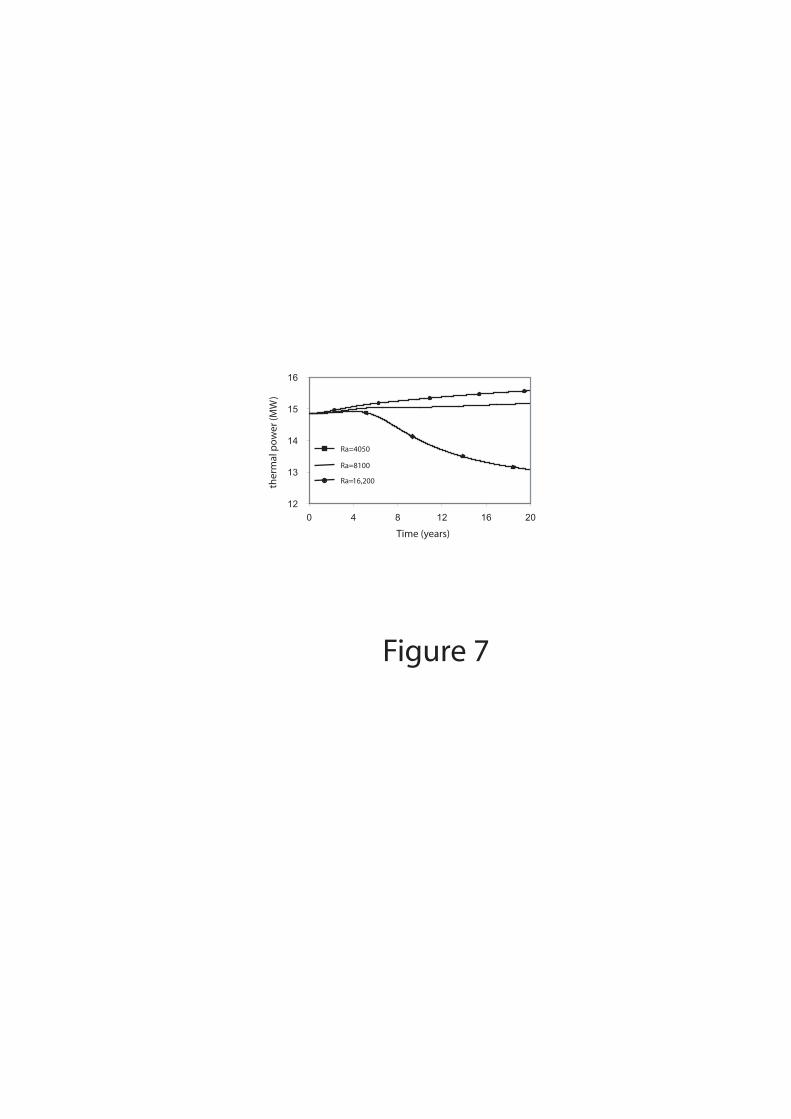
12
13
14
15
16
0 4 8 12 16 20
Ra=4050
Ra=8100
Ra=16200
time in years
ther
mal
po
wer
(MW
)
Figure 7
Time (years)
16,200
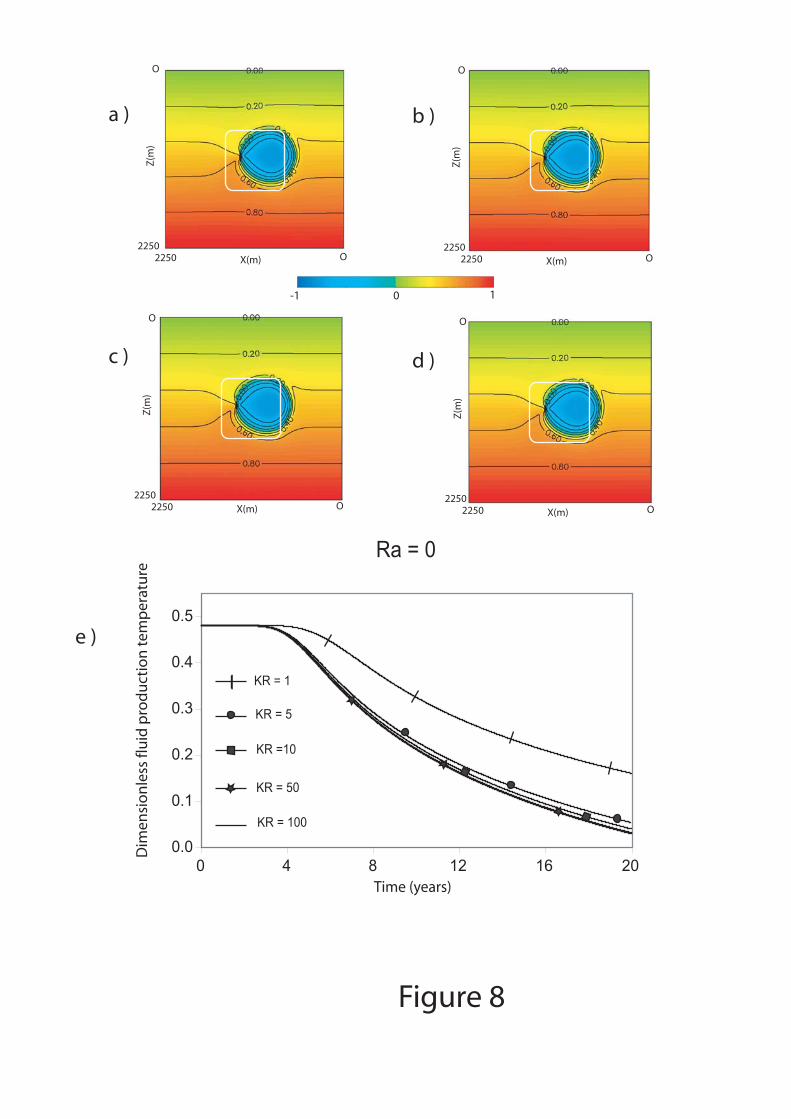
e )
a )
c )
b )
d )
-1 0 1
O
2250O2250 X(m)
Z(m
)
O
2250O2250 X(m)
Z(m
)
O
2250O2250 X(m)
Z(m
)
O
2250O2250 X(m)
Z(m
)
0.0
0.1
0.2
0.3
0.4
0.5
0 4 8 12 16 20
KR = 1
Time (years)
Figure 8
Dim
ensi
on
less
flu
id p
rod
uct
ion
tem
per
atu
re
KR = 5
KR =10
KR = 50
KR = 100
Ra = 0
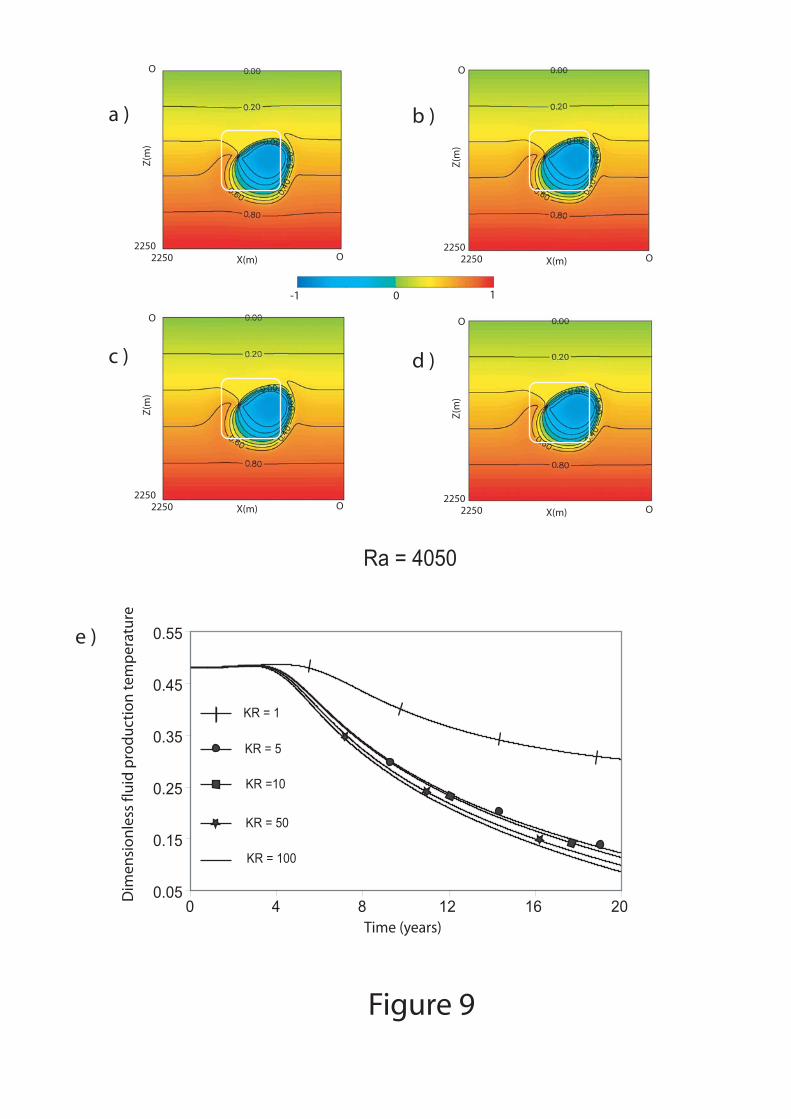
e )
a )
c )
b )
d )
-1 0 1
O
2250O2250 X(m)
Z(m
)
O
2250O2250 X(m)
Z(m
)
O
2250O2250 X(m)
Z(m
)
O
2250O2250 X(m)
Z(m
)
0.05
0.15
0.25
0.35
0.45
0.55
0 4 8 12 16 20
Figure 9
KR = 1
KR = 5
KR =10
KR = 50
KR = 100
Time (years)
Dim
ensi
on
less
flu
id p
rod
uct
ion
tem
per
atu
re
Ra = 4050
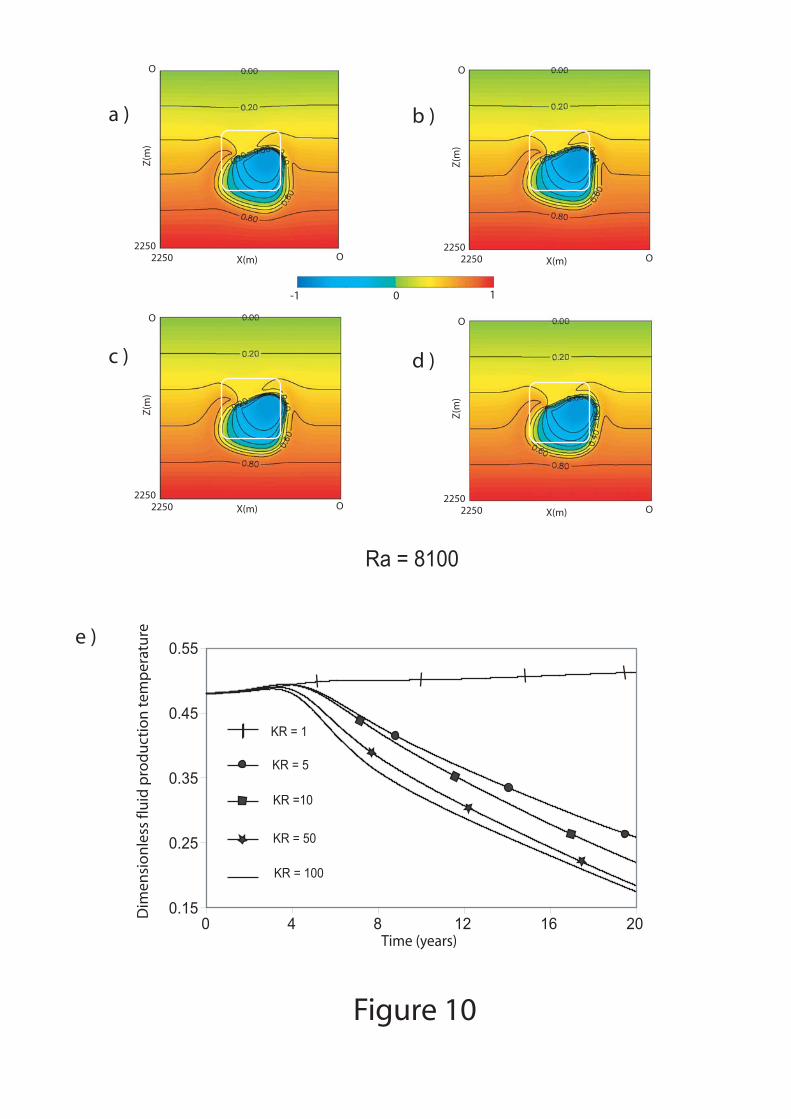
e )
a )
c )
b )
d )
-1 0 1
O
2250O2250 X(m)
Z(m
)
O
2250O2250 X(m)
Z(m
)
O
2250O2250 X(m)
Z(m
)
O
2250O2250 X(m)
Z(m
)
0.15
0.25
0.35
0.45
0.55
0 4 8 12 16 20Time (years)
Figure 10
KR = 1
KR = 5
KR =10
KR = 50
KR = 100
Dim
ensi
on
less
flu
id p
rod
uct
ion
tem
per
atu
re
Ra = 8100
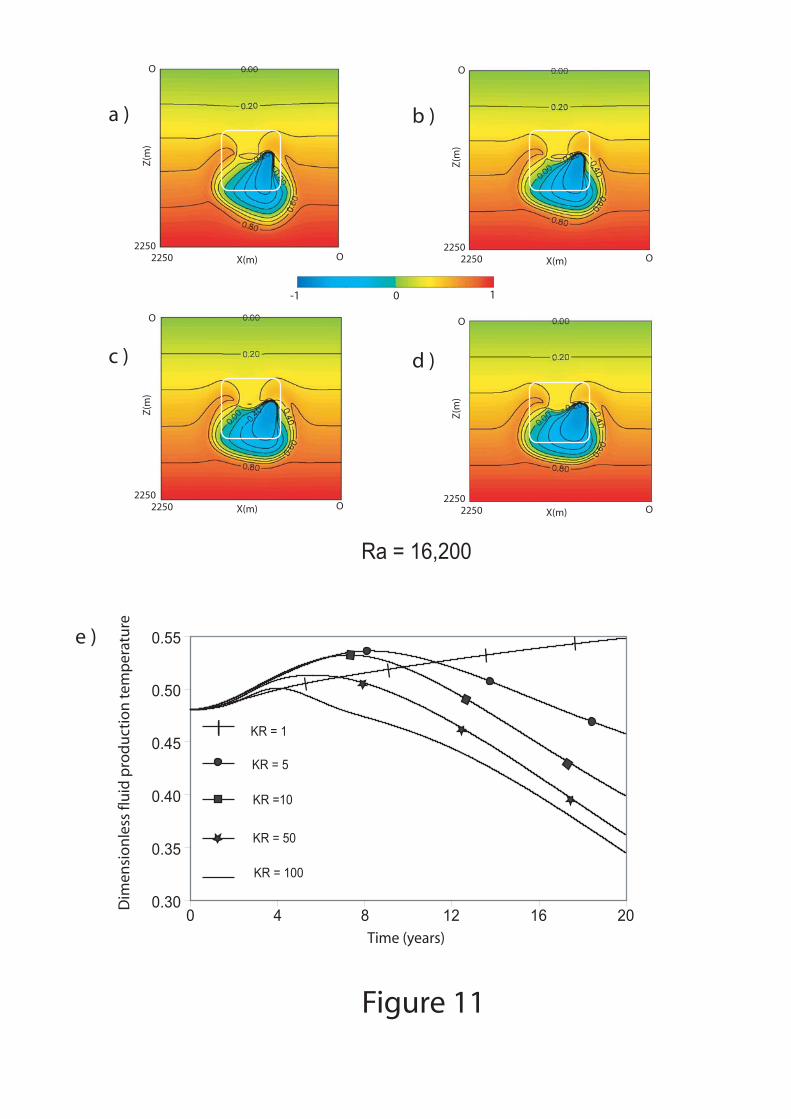
e )
a )
c )
b )
d )
-1 0 1
O
2250O2250 X(m)
Z(m
)
O
2250O2250 X(m)
Z(m
)
O
2250O2250 X(m)
Z(m
)
O
2250O2250 X(m)
Z(m
)
0.30
0.35
0.40
0.45
0.50
0.55
0 4 8 12 16 20
Figure 11
KR = 1
KR = 5
KR =10
KR = 50
KR = 100
Time (years)
Ra = 16,200
Dim
ensi
on
less
flu
id p
rod
uct
ion
tem
per
atu
re
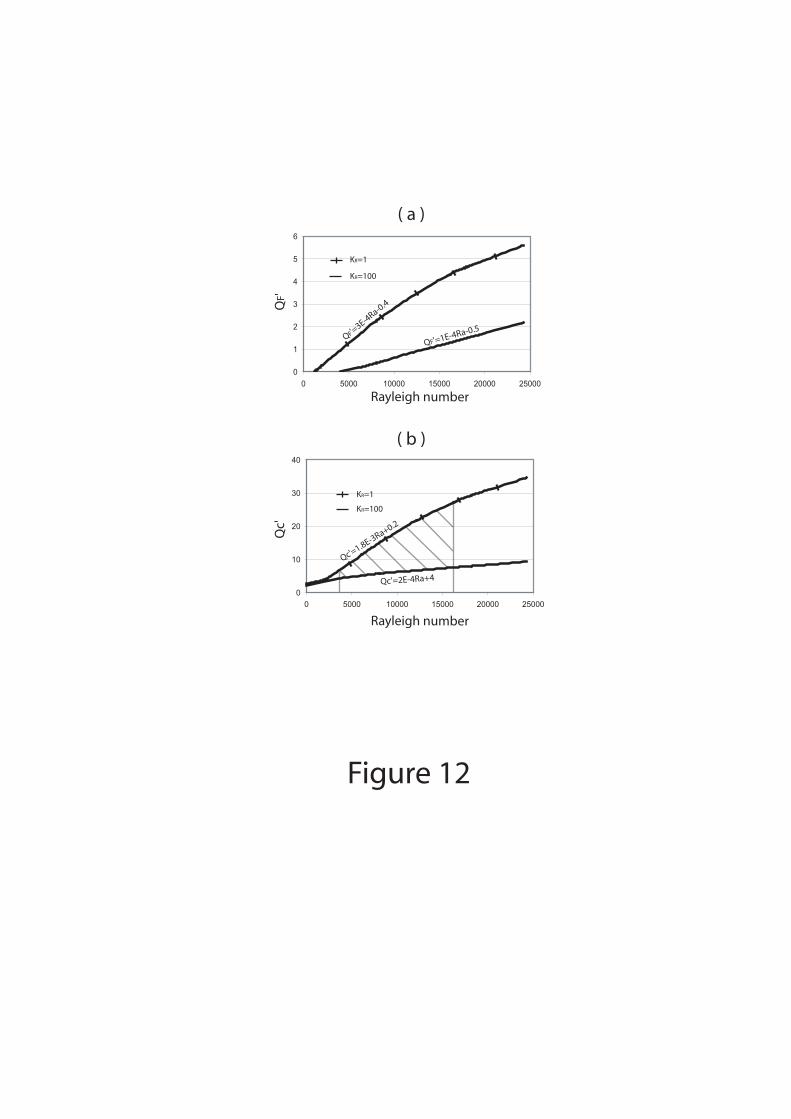
Figure 12
0
1
2
3
4
5
6
0 5000 10000 15000 20000 25000
QF'
Rayleigh number
KR=1
KR=100
QF'=3E-4Ra-0.4
QF'=1E-4Ra-0.5
( a )
( b )
0
10
20
30
40
0 5000 10000 15000 20000 25000
KR=1
KR=100
Qc'=1.8E-3Ra+0.2
Qc'=2E-4Ra+4
Qc'
Rayleigh number