MASS SPECTROCETRY
5
-t,-:f --il· ' il Π - *>d©rri Industrial Too! -H ! hi ENBOSTEL, JR., and WILLIAM PRIESTLEY; -H ft H'l Ht Ί JR. tsîA^S. Jê3... FROM A SCIENTIFIC CURIOSITY to a dependable, rapid analytical tool in 20 years—this is the story of mass spec- trometry. Now used as both research and routine instruments in many fields —biology, chemistry, geology, medi- cine, physics—mass spectrometers are no longer found only in a few college and university laboratories. They are indispensable tools in industry. Analyses which formerly required days now are completed in minutes by the use of automatic mass spectrometry and computation. It is now entirely feasible to feed a process stream into a mass spectrometer and continuously obtain a complete 20- to 30-component analysis. Through servomechanisms these results can be used to control plant operation. Modern Spectrometers Differ From Early Models Mostly in Their Use Present day mass spectrometers are vastly different from the early instru- ments of Thomson, Aston, Dempster, et al. Perhaps the greatest difference lies in their utilization. Early instru- ments were used to determine isotopic masses and, later, relative abundances of those masses. Today's applications are in quantitative analysis, and com- mercial mass spectrometers are de- signed for that purpose. In 1910, J. J. Thomson showed by mass spectrography that neon consisted of two types of atoms of relative masses 20 and 22. Since then, a third isotope of mass 21 has been found. In Thom- son's "positive ray" apparatus, positive ions passed through a long narrow tube; the fine beam produced was sub- jected to parallel electrostatic and magnetic fields. This produced ion beams in the form of truncated para- bolic curves, each beam corresponding to some definite mass/charge (m/e) ratio. In 1919, F. W. Aston extended this work and developed a new type of positive ray apparatus, similar to an optical spectrograph in that it gave a spectrum of lines, each corresponding to a definite m/e number. Positive ions of the sample were created in a Aston's first mass spectrograph was able to sort atoms very accurately and to demonstrate the existence of isotopes discharge tube and collimated by very narrow parallel slits. The resulting thin beam of ions passed through elec- trical and magnetic fields arranged such that all particles of equal m/e ratio but of different velocities were focused to the same line on a photo- graphic plate. Actual determination of masses was empirical (compared to known reference lines). This type of instrument, suitable only for deter- mination of isotopic mass, is called a mass spectrograph. A J. Dempster, in 1919, made use of a magnetic field to focus the ion beams. In this arrangement, ions of only a single mass are permitted to impinge on the target at a time. The mass spec- trum is progressively recorded. This is the mass spectrometer, forerunner of today's instruments. For the next 10 or 15 years the mass spectrograph was employed mainly in fundamental molecular bond energy studies. K. T. Bainbridge developed one suitable for precision mass/charge determinations in the 1930's. This led to exhaustive studies using stable iso- tope tracers. It was not until almost 1940 that development of an instrument suitable for analytical applications was under- taken. About this time, Consolidated Engineering Corp. became interested in a mass spectrometer capable of analyzing the complex hydrocarbon 4736 CHEMICAL AND ENGINEERING NEWS m&ss SPECTROCETRY A AAodern Industrial Too! Bv. F. ÎBJUbENBOSTELii JR. r EssélSbErS^^rSfhndard Oïl Dev^ffiomenf, UndenTNljT ^hje4^i^|ha»ïfl4~^>^ usefali^s andi)a|bîiity to anolvze comolex mixtures ramdlv ancm-ec— cufdfëiyi'aremaîor facîorsl]which haveO aîvert mass }$pectrpmetry its prom ment hplacenfin science and industry
Transcript of MASS SPECTROCETRY
-t,-:f --il· ' il Π -*>d©rri Industrial Too!
-H ! hi
ENBOSTEL, JR., a n d W I L L I A M PRIESTLEY; -H ft H ' l H t Ί
JR.
t s îA^S. Jê3...
F R O M A SCIENTIFIC CURIOSITY to a dependable, rapid analytical tool in 20 years—this is the story of mass spectrometry. Now used as both research and routine instruments in many fields —biology, chemistry, geology, medicine, physics—mass spectrometers are no longer found only in a few college and university laboratories. They are indispensable tools in industry.
Analyses which formerly required days now are completed in minutes by the use of automatic mass spectrometry and computation. It is now entirely feasible to feed a process stream into a mass spectrometer and continuously obtain a complete 20- to 30-component analysis. Through servomechanisms these results can be used to control plant operation.
Modern Spectrometers Differ From Early Models Mostly in Their Use
Present day mass spectrometers are vastly different from the early instruments of Thomson, Aston, Dempster, et al. Perhaps the greatest difference lies in their utilization. Early instruments were used to determine isotopic masses and, later, relative abundances of those masses. Today's applications are in quantitative analysis, and commercial mass spectrometers are designed for that purpose.
In 1910, J. J. Thomson showed by mass spectrography that neon consisted
of two types of atoms of relative masses 20 and 22. Since then, a third isotope of mass 21 has been found. In Thomson's "positive ray" apparatus, positive ions passed through a long narrow tube; the fine beam produced was subjected to parallel electrostatic and magnetic fields. This produced ion beams in the form of truncated parabolic curves, each beam corresponding to some definite mass/charge (m/e) ratio.
In 1919, F. W. Aston extended this work and developed a new type of positive ray apparatus, similar to an optical spectrograph in that it gave a spectrum of lines, each corresponding to a definite m/e number. Positive ions of the sample were created in a
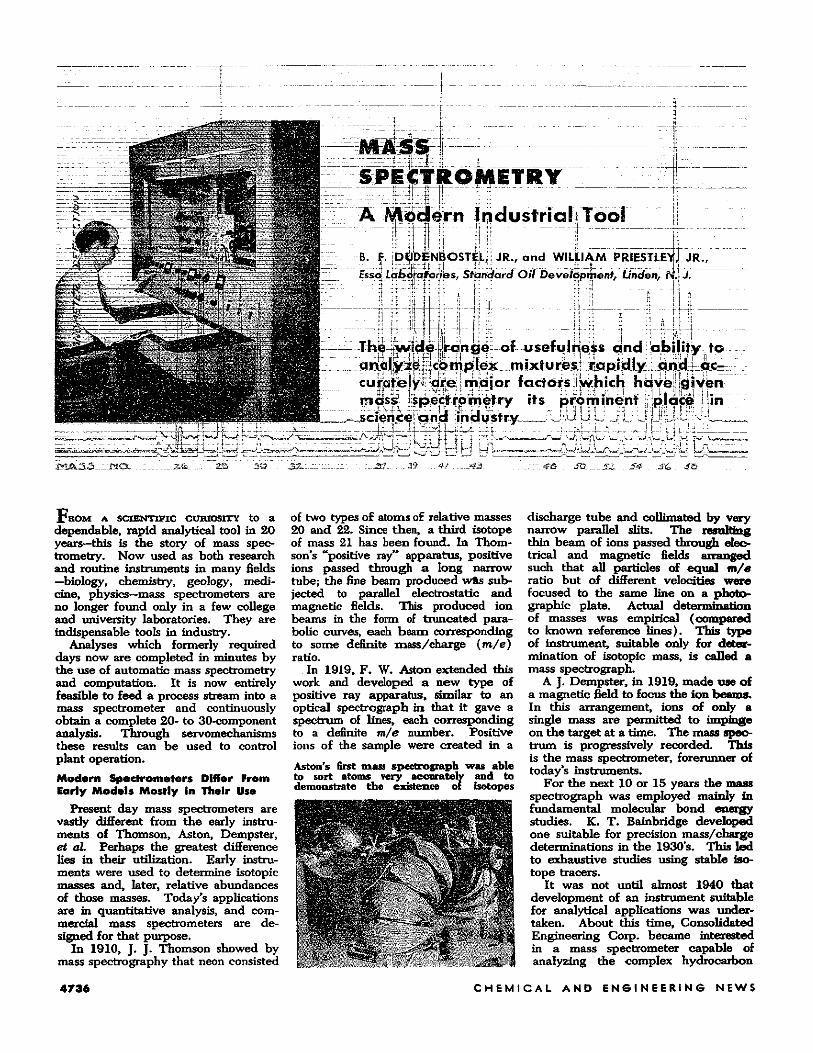
Aston's first mass spectrograph was able to sort atoms very accurately and to demonstrate the existence of isotopes
discharge tube and collimated by very narrow parallel slits. The resulting thin beam of ions passed through electrical and magnetic fields arranged such that all particles of equal m/e ratio but of different velocities were focused to the same line on a photographic plate. Actual determination of masses was empirical (compared to known reference lines). This type of instrument, suitable only for determination of isotopic mass, is called a mass spectrograph.
A J. Dempster, in 1919, made use of a magnetic field to focus the ion beams. In this arrangement, ions of only a single mass are permitted to impinge on the target at a time. The mass spectrum is progressively recorded. This is the mass spectrometer, forerunner of today's instruments.
For the next 10 or 15 years the mass spectrograph was employed mainly in fundamental molecular bond energy studies. K. T. Bainbridge developed one suitable for precision mass/charge determinations in the 1930's. This led to exhaustive studies using stable isotope tracers.
It was not until almost 1940 that development of an instrument suitable for analytical applications was undertaken. About this time, Consolidated Engineering Corp. became interested in a mass spectrometer capable of analyzing the complex hydrocarbon
4 7 3 6 C H E M I C A L A N D E N G I N E E R I N G N E W S
m&ss SPECTROCETRY A AAodern Industrial Too!
Bv. F. ÎBJUbENBOSTELii JR.r
EssélSbErS^^rSfhndard Oïl Dev^ffiomenf, UndenTNljT
^hje4^i^|ha»ïfl4~^>^ u s e f a l i ^ s andi)a|bîiity to anolvze comolex mixtures ramdlv ancm-ec— cufdfëiyi 'aremaîor facîorsl]which haveO aîvert mass }$pectrpmetry its prom ment hplacenfin science a n d industry
mixtures encountered in the petroleum industry. The loan to Consolidated of a mass spectrometer developed at Cal-tech facilitated the preliminary work.
After about four years of research by H. W. Washburn and his coworkers, a commercial instrument was placed on the market by Consolidated. The first one was delivered to Atlantic Refining in late 1942.
Large Analytical Instrument-Most Versati le off Al l Types
By far the most versatile o f the types of mass spectrometers is the large analytical instrument. Several models are available—all using the same basic principle of operation. One of the most critical specifications of such an instrument is the range of masses it covers. A knowledge of the general classes of materials to be handled determines this specification. Normally, for gases and light liquids, an instrument is designed to cover the range of mass 2 to 150. Accessories can raise the upper limit to 400 or higher. Special instruments can be furnished to range between any two selected mass numbers.
The analytical mass spectrometer has been extensively applied to the vapor and liquid analyses of mixtures encountered in the chemical and petroleum industries. Analysis of petroleum fractions—an interesting and widely used application—may be divided into three classes: determination of individual components, compound type or class analysis, and control of processes.
Since the mass spectra of most compounds usually consist of a relatively small number of discrete masses, it is often possible to detect and determine an impurity in a complex mixture. In many instances it is possible to determine minute traces of an impurity by mass spectrometry where no other analytical method is feasible. The minimum detectable quantity of an impurity—in the order of 0.1 to 0.001 mole%—may b e possible, depending on the components present. Concentrations of diethylbenzene as low as 0.03 mole%, for example, can be determined when present in ethylbenzene.
In addition to impurity determinations, the same phenomenon of spectral characteristics enables one t o use mass spectrometry for control by analysis of key components. Among possible applications is analysis of key components in overhead streams from fractionating columns. Use of plant control instruments permits continuous, instantaneous analysis.
There are two kinds of process control samples: (1) those in which a key component or components have unique analytical peaks which permit record-
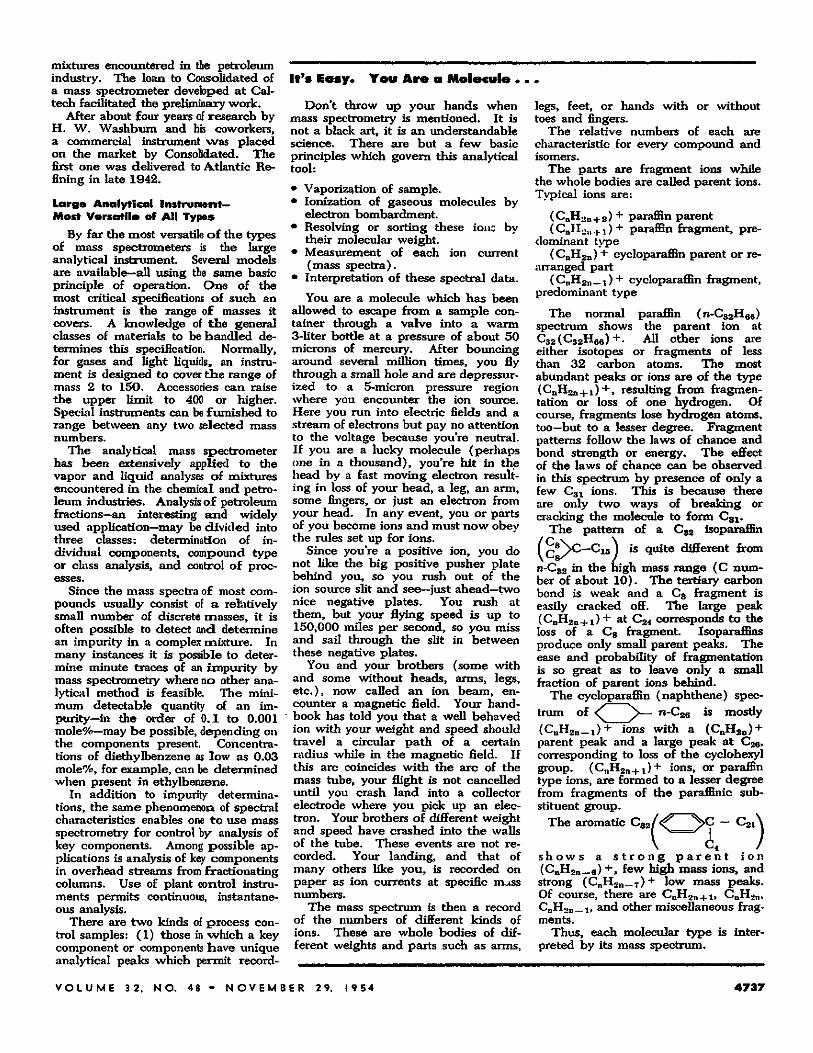
It's Easy· You Are a Molecule ·
Don't throw up your hands when mass spectrometry is mentioned. It is not a black art, it is an understandable science. There are but a few basic principles which govern this analytical tool:
• Vaporization of sample. • Ionization of gaseous molecules by
electron bombardment. • Resolving or sorting these ionc by
their molecular weight. • Measurement of each ion current
(mass spectra). • Interpretation of these spectral data.
You are a molecule which has been allowed to escape from a sample container through a valve into a warm 3-liter bottle at a pressure of about 50 microns of mercury. After bouncing around several million times, you fly through a small hole and are depressur-ized to a 5-micron pressure region where you encounter the ion source. Here you run into electric fields and a stream of electrons but pay no attention to the voltage because you're neutral. If you are a lucky molecule (perhaps one in a thousand), you're hit in the head by a fast moving electron resulting in loss of your head, a leg, an arm, some fingers, or just an electron from your head. In any event, you or parts of you become ions and must now obey the rules set up for ions.
Since you're a positive ion, you do not like the big positive pusher plate behind you, so you rush out of the ion source slit and see—just ahead—two nice negative plates. You rush at them, but your flying speed is up to 150,000 miles per second, so you miss and sail through the slit in between these negative plates.
You and your brothers (some with and some without heads, arms, legs, etc . ) , now called an ion beam, encounter a magnetic field. Your handbook has told you that a well behaved ion with your weight and speed should travel a circular path of a certain radius while in the magnetic field. If this arc coincides with the arc of the mass tube, your flight is not cancelled until you crash land into a collector electrode where you pick up an electron. Your brothers of different weight and speed have crashed into the walls of the tube. These events are not recorded. Your landing, and that of many others like you, is recorded on paper as ion currents at specific mass numbers.
The mass spectrum is then a record of the numbers of different kinds of ions. These are whole bodies of different weights and parts such as arms,
legs, feet, or hands with or without toes and fingers.
The relative numbers of each are characteristic for every compound and isomers.
The parts are fragment ions while the whole bodies are called parent ions. Typical ions are:
( CnH2t»+2 ) + paraffin parent (CnlLjM.j-i) + paraffin fragment, pre
dominant type ( C n H 2 n ) + cycloparaffin parent or re
arranged part ( C n H 2 n _ ι ) + cycloparaffin fragment,
predominant type
The normal paraffin (fi-C82Hee) spectrum shows the parent ion at C32(C S 2 H e e )+ . AU other ions are either isotopes or fragments of less than 32 carbon atoms. The most abundant peaks or ions are of the type ( C n H 2 n + 1 ) + , resulting from fragmentation or loss of one hydrogen. Of course, fragments lose hydrogen atoms, too—but to a lesser degree. Fragment patterns follow the laws of chance and bond strength or energy. The effect of the laws of chance can be observed in this spectrum by presence of only a few C s l ions. This is because there are only two ways of breaking or cracking the molecule to form C 8 1 .
The pattern of a C S 2 isoparafBn ( c
8 y C — C i 5 J is quite different from n-C32 in the high mass range (C number of about 10) . The tertiary carbon bond is weak and a C 8 fragment is easily cracked off. The large peak ( C n H 2 n + 1 ) + at C 2 4 corresponds to the loss of a C 8 fragment. Isoparaffins produce only small parent peaks. The ease and probability of fragmentation is so great as to leave only a small fraction of parent ions behind.
The cycloparaffin (naphthene) spectrum of ^ S — n-C2 e is mostly ( C n H 2 n _ 1 ) + ions with a (CnH 2 n ) + parent peak and a large peak at C26 , corresponding to loss of the cyclohexyl group. ( C n H 2 l l + i ) + ions, or paraffin type ions, are formed to a lesser degree from fragments of the paraffinic substituent group.
The aromatic C92f<t ^ > c — C 2 i \
s h o w s a s t r o n g p a r e n t i o n (C n H 2 n _ e ) + , few higjh mass ions» and strong ( C n H o n _ 7 ) + low mass peaks. Of course, there are CnH2n+i> CnïÏ2n' C n H 2 n _i , and other miscellaneous fragments.
Thus, each molecular type is interpreted by its mass spectrum.
V O L U M E 32 . N O . 48 · N O V E M B E R 2 9, 1954 4737
Ε % co2 ,co, ο2 Point Thermal Conductivity)
^2H I
Flue Gas
^
^S>*L Complete Gas Analysis Cg and Lighter (Mass Spectrometer)
ρ
Catalyst Flow
Naphtha Feed
JTl
Λ
CO
c e ο Ο
£
il ®-*£
α» c α>
- ο C ο ο
1=4
Ι
CO
Polymer
Recycle Gas
<$H Liquid Gravity
Complete Gas Analysis C5 and Lighter (Mass Spectrometer)
Gas G r a v i t y ι % H 2
Thermal Conductivity
ΦΗ Refractive Index 1
Liquid Product
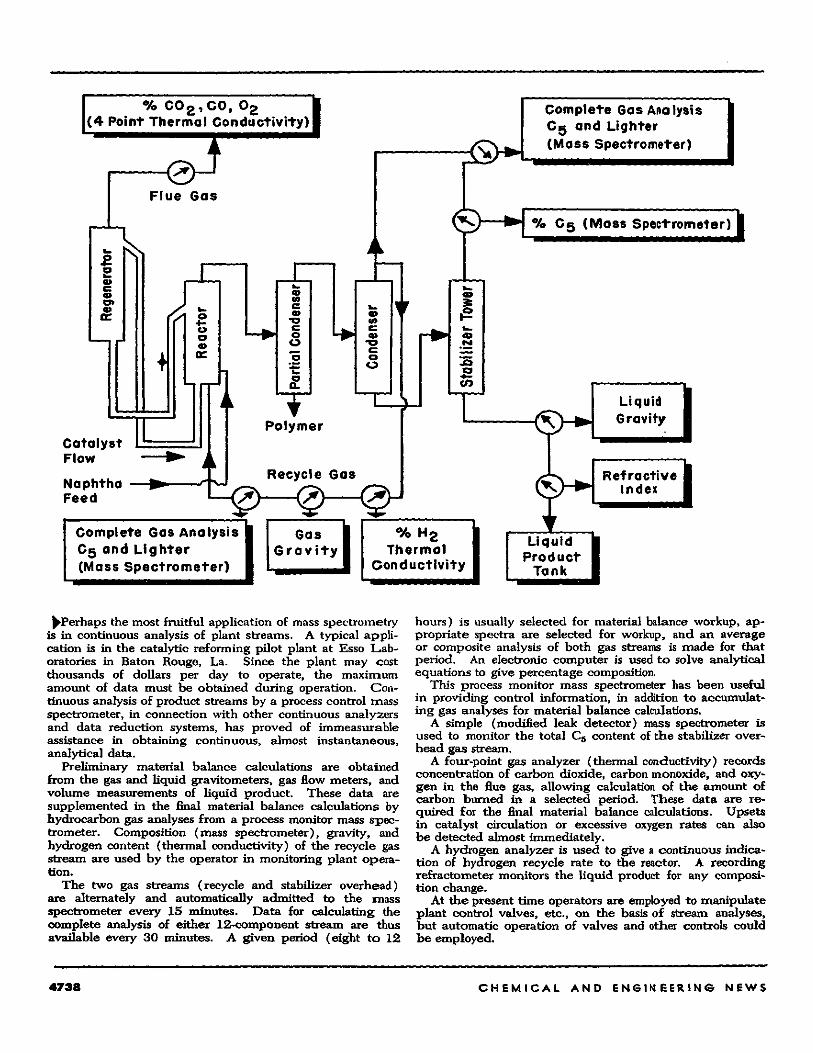
Tank ι ^Perhaps the most fruitful application of mass spectrometry
is in continuous analysis of plant streams. A typical application is in the catalytic reforming pilot plant at Esso Laboratories in Baton Rouge, La. Since the plant may cost thousands of dollars per day to operate, the maximum amount of data must be obtained during operation. Continuous analysis of product streams by a process control mass spectrometer, in connection with other continuous analyzers and data reduction systems, has proved of immeasurable assistance in obtaining continuous, almost instantaneous, analytical data.
Preliminary material balance calculations are obtained from the gas and liquid gravitometers, gas flow meters, and volume measurements of liquid product. These data are supplemented in the final material balance calculations by hydrocarbon gas analyses from a process monitor mass spectrometer. Composition (mass spectrometer), gravity, and hydrogen content (thermal conductivity) of the recycle gas stream are used by the operator in monitoring plant operation.
The two gas streams (recycle and stabilizer overhead) are alternately and automatically admitted to the mass spectrometer every 15 minutes. Data for calculating the complete analysis of either 12-component stream are thus available every 30 minutes. A given period (eight to 12
hours) is usually selected for material balance workup, appropriate spectra are selected for workup, and an average or composite analysis of both gas streams is made for that period. An electronic computer is used to solve analytical equations to give percentage composition.
This process monitor mass spectrometer has been useful in providing control information, in addition to accumulating gas analyses for material balance calculations.
A simple (modified leak detector) mass spectrometer is used to monitor the total C5 content of the stabilizer overhead gas stream.
A four-point gas analyzer (thermal conductivity) records concentration of carbon dioxide, carbon monoxide, and oxygen in the flue gas, allowing calculation of the amount of carbon burned in a selected period. These data are required for the final material balance calculations. Upsets in catalyst circulation or excessive oxygen rates can also be detected almost immediately.
A hydrogen analyzer is used to give a continuous indication of hydrogen recycle rate to the reactor. A recording refractorneter monitors the liquid product for any composition change.
At the present time operators are employed to manipulate plant control valves, etc., on the basis of stream analyses, but automatic operation of valves and other controls could be employed.
4 7 3 8 C H E M I C A L A N D E N G I N E E R I N G N E W S
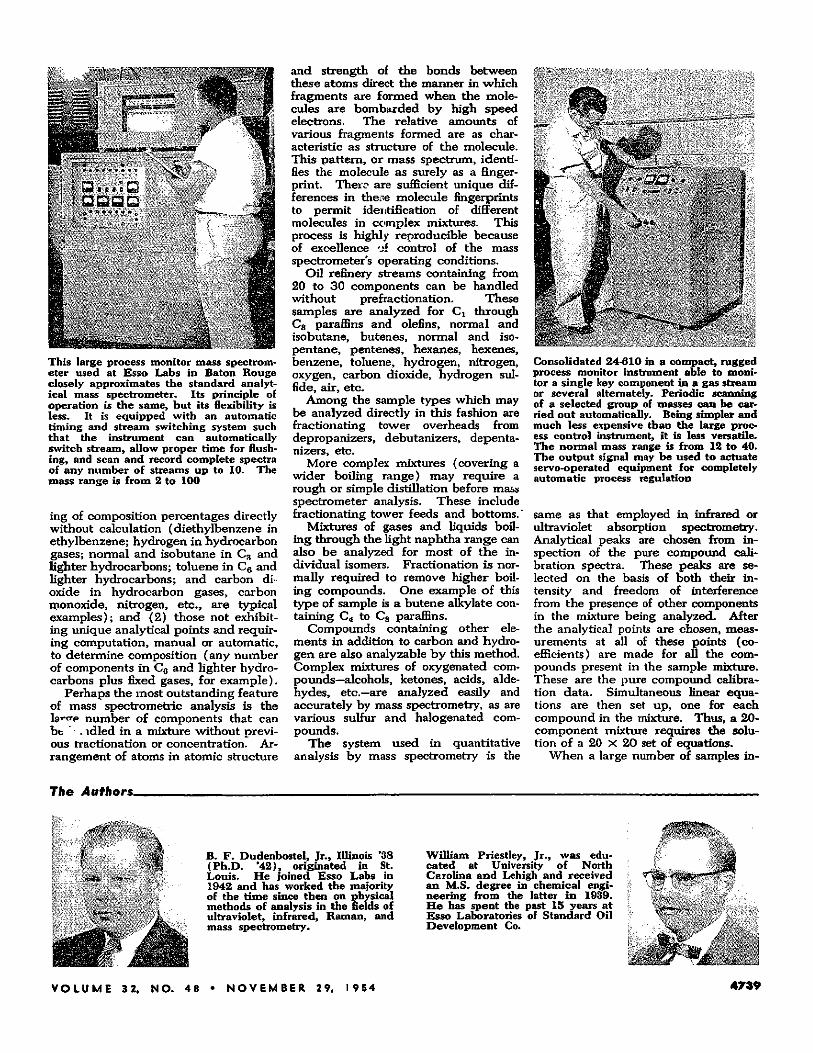
This large process monitor mass spectrometer used at Esso Labs in Baton Rouge closely approximates the standard analytical mass spectrometer. Its principle of operation is the same, but its flexibility is less. It is equipped with an automatic timing and stream switching system such that the instrument can automatically switch stream, allow proper time for flushing, and scan and record complete spectra of any number of streams up to 10. The mass range is from 2 to 100
ing of composition percentages directly without calculation (diethylbenzene in ethylbenzene; hydrogen in hydrocarbon gases; normal and isobutane in C 3 and lighter hydrocarbons; toluene in C e and lighter hydrocarbons; and carbon dioxide in hydrocarbon gases, carbon monoxide, nitrogen, etc., are typical examples); and (2) those not exhibiting unique analytical points and requiring computation, manual or automatic, to determine composition (any number of components in C e and lighter hydrocarbons plus fixed gases, for example).
Perhaps the most outstanding feature of mass specrrometric analysis is the latere number of components that can be ' * idled in a mixture without previous tractionation or concentration. Arrangement of atoms in atomic structure
and strength of the bonds between these atoms direct the manner in which fragments are formed when the molecules are bombarded by high speed electrons. The relative amounts of various fragments formed are as characteristic as structure of the molecule. This pattern, or mass spectrum, identifies the molecule as surely as a fingerprint. There are sufficient unique differences in these molecule fingerprints to permit identification of different molecules in complex mixtures. This process is highly reproducible because of excellence Ά control of the mass spectrometer's operating conditions.
Oil refinery streams containing from 20 to 30 components can be handled without prefractionation. These samples are analyzed for Cx through C3 paraffins and olefins, normal and isobutane, butènes, normal and iso-pentane, pentenes, hexanes, hexenes, benzene, toluene, hydrogen, nitrogen, oxygen, carbon dioxide, hydrogen sulfide, air, etc.
Among the sample types which may be analyzed directly in this fashion are fractionating tower overheads from depropanizers, debutanizers, depenta-nizers, etc.
More complex mixtures (covering a wider boiling range) may require a rough or simple distillation before mass spectrometer analysis. These include fractionating tower feeds and bottoms.*
Mixtures of gases and liquids boiling through the light naphtha range can also be analyzed for most of the individual isomers. Fractionation is normally required to remove higher boiling compounds. One example of this type of sample is a butene alkylate containing C4 to C8 paraffins.
Compounds containing other elements in addition to carbon and hydrogen are also analyzable by this method. Complex mixtures of oxygenated compounds—alcohols, ketones, acids, aldehydes, etc.—are analyzed easily and accurately by mass spectrometry, as are various sulfur and halogenated compounds.
The system used in quantitative analysis by mass spectrometry is the
Consolidated 24-610 in a compact, rugged process monitor instrument able to monitor a single key component in a gas stream or several alternately. Periodic scanning of a selected group of masses can be carried out automatically. Being simpler and much less expensive than the large process control instrument, it is less versatile. The normal mass range is from 12 to 40. The output signal may be used to actuate servo-operated equipment for completely automatic process regulation
same as that employed in infrared or ultraviolet absorption spectrometry. Analytical peaks are chosen from inspection of the pure compound calibration spectra. These peaks are selected on the basis of both their intensity and freedom of interference from the presence of other components in the mixture being analyzed. After the analytical points are chosen, measurements at all of these points (coefficients) are made for all the compounds present in the sample mixture. These are the pure compound calibration data. Simultaneous linear equations are then set up, one for each compound in the mixture. Thus, a 20-component mixture requires the solution of a 20 X 20 set of equations.
When a large number of samples in-
The Authors-
B. F. Dudenbostel, Jr., Illinois '38 (Ph.D. *42 ), originated in St. Louis. He joined Esso Labs in 1942 and has worked the majority of the time since then on physical methods of analysis in the fields of ultraviolet, infrared, Raman, and mass spectrometry.
William Priestley, Jr., was educated at University of North Carolina and Lehigh and received an M.S. degree in chemical engineering from the latter in 1939. He has spent the past 15 years at Esso Laboratories of Standard Oil Development Co.
V O L U M E 32, N O . 4 8 · N O V E M B E R 29. 1954 4 7 3 9
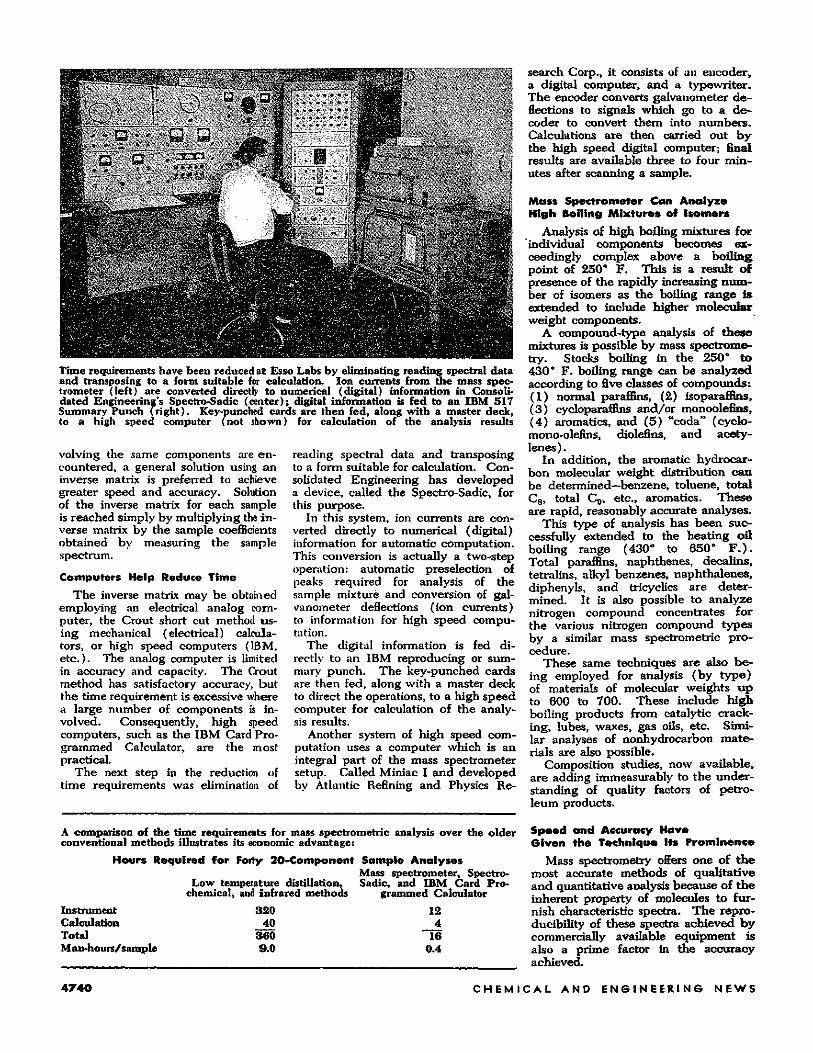
Time requirements have been reduced at Esso Labs by eliminating reading spectral data and transposing to a form suitable for calculation. Ion currents from the mass spectrometer (left) are converted directly to numerical (digital) information in Consolidated Engineering's Spectro-Sadic (center); digital information is fed to an IBM 517 Summary Punch (right). Key-punched cards are then fed, along with a master deck, to a high speed computer (not shown) for calculation of the analysis results
volving the same components are encountered, a general solution using an inverse matrix is preferred to achieve greater speed and accuracy. Solution of the inverse matrix for each sample is reached simply by multiplying the inverse matrix by the sample coefficients obtained by measuring the sample spectrum.
Computers Help Reduce Time
The inverse matrix may be obtained employing an electrical analog computer, the Crout short cut method using mechanical (electrical) calculators, or high speed computers (IBM, etc.) . The analog computer is limited in accuracy and capacity. The Crout method has satisfactory accuracy, but the time requirement is excessive where a large number of components is involved. Consequently, high speed computers, such as the IBM Card Programmed Calculator, are the most practical.
The next step in the reduction of time requirements was elimination of
reading spectral data and transposing to a form suitable for calculation. Consolidated Engineering has developed a device, called the Spectro-Sadic, for this purpose.
In this system, ion currents are converted directly to numerical (digital) information for automatic computation. This conversion is actually a two-step operation: automatic preselection of peaks required for analysis of the sample mixture and conversion of galvanometer deflections (ion currents) to information for high speed computation.
The digital information is fed directly to an IBM reproducing or summary punch. The key-punched cards are then fed, along with a master deck to direct the operations, to a high speed computer for calculation of the analysis results.
Another system of high speed computation uses a computer which is an integral part of the mass spectrometer setup. Called Miniac I and developed by Atlantic Refining and Physics Re
search Corp., it consists of an encoder, a digital computer, and a typewriter. The encoder converts galvanometer deflections to signals which go to a decoder to convert them into numbers. Calculations are then carried out by the high speed digital computer; final results are available three to four minutes after scanning a sample.
Mass Spectrometer Can Analyze High Boiling Mixtures of Isomers
Analysis of high boiling mixtures for individual components becomes exceedingly complex above a boiling point of 250° F. This is a result of presence of the rapidly increasing number of isomers as the boiling range is extended to include higher molecular weight components.
A compound-type analysis of these mixtures is possible by mass spectrometry. Stocks boiling in the 250° to 430 e F. boiling range can be analyzed according to five classes of compounds: (1) normal paraffins, (2) isoparaffins, (3 ) cycloparaffins and/or monoolefins, (4 ) aromatics, and (5 ) "coda" (cyclo-mono-olefins, diolefins, and acetylenes).
In addition, the aromatic hydrocarbon molecular weight distribution can be determined—benzene, toluene, total C8, total C0, etc., aromatics. These are rapid, reasonably accurate analyses.
This type of analysis has been successfully extended to the heating oil boiling range (430° to 650° F . ) . Total paraffins, naphthenes, decalins, tetralins, alkyl benzenes, naphthalenes, diphenyls, and tricyclics are determined. It is also possible to analyze nitrogen compound concentrates for the various nitrogen compound types by a similar mass spectrometric procedure.
These same techniques are also being employed for analysis (by type) of materials of molecular weights up to 600 to 700. These include high boiling products from catalytic cracking, lubes, waxes, gas oils, etc. Similar analyses of nonhydrocarbon materials are also possible.
Composition studies, now available, are adding immeasurably to the understanding of quality factors of petroleum products.
Speed and Accuracy Have Given the Technique Its Prominence
Mass spectrometry offers one of the most accurate methods of qualitative and quantitative analysis because of the inherent property of molecules to furnish characteristic spectra. The reproducibility of these spectra achieved by commercially available equipment is also a prime factor in the accuracy achieved.
A comparison of the time requirements for mass spectrometric analysis over the older conventional methods illustrates its economic advantage:
Hours Required for Forty 20-Component Sample Analyses Mass spectrometer, Spectro-
Low temperature distillation, Sadie, and IBM Card Pro-chemical, and infrared methods grammed Calculator
Instrument 320 12 Calculation 40 4 Total 360 16 Man-hours/sample 9.0 0.4
4 7 4 0 C H E M I C A L A N D E N G I N E E R I N G N E W S