Literature-Based Automated Reconstruction, Expansion, and Refinement of the TGF-β Superfamily...
6
Literature-Based Automated Reconstruction, Expansion, and Refinement of the TGF-b Superfamily Ligand-Receptor Network Qian Mei • Leonor Saiz Received: 28 December 2013 / Accepted: 28 January 2014 Ó Springer Science+Business Media New York 2014 Abstract The TGF-b pathway transduces a variety of extracellular signals into intracellular responses that control multiple cellular processes, including cell growth, apoptosis, and differentiation. It encompasses 33 ligands that interact with 7 type II receptors and 5 type I receptors at the plasma mem- brane to potentially form 1,155 ligand-receptor complexes in mammalian cells. Retrieving the information of the complexes that are actually formed from reading the literature might be tedious and prone to missing links. Here, we have developed an automated literature-mining procedure to obtain the interactions of the TGF-b ligand-receptor network. By querying the Infor- mation Hyperlinked over Proteins (iHOP) online service and processing the results, we were able to find pairwise interactions between ligands and receptors that allowed us to build the net- work automatically from the literature. Comparison with available published review papers indicates that this method is able to automatically reconstruct and expand the TGF-b superfamily ligand-receptor network. Retrieving and parsing the full text of the manuscripts containing the interactions allowed us to refine the network interactions for specific cell lines. Keywords Transmembrane-receptor networks Á Text mining Á Signal transduction Á Transforming growth factor-b Á Protein–protein interactions Á Systems biology Introduction The transforming growth factor-b (TGF-b) superfamily of cytokines regulates fundamental cellular responses, such as proliferation, differentiation, and apoptosis (Massague ´ 1998), through complex networks of interactions. The ligands of this superfamily initiate signaling at the plasma membrane by binding to two types of transmembrane ser- ine-threonine kinase receptors, known as type I and type II receptors. Upon the formation of the ligand-receptor com- plex, the constitutively active type II receptors phosphory- late type I receptors within the complex, which become active (Wrana et al. 1994). This heteromeric signaling receptor complex is internalized and recruits cytosolic receptor-regulated Smad (R-Smad) proteins. Active type I receptors in turn phosphorylate the associated R-Smads, which propagate the signal downstream to regulate the expression of hundreds of genes in a cell-type-specific and context-dependent fashion (Shi and Massague ´ 2003). The potential combinatorial interactions in the macro- molecular assembly of the active ligand-receptor complexes at the plasma membrane are enormous. The 33 known members of the TGF-b superfamily of ligands can form complexes with five type II and seven type I receptors in mammalian cells, leading to a total of 1,155 potential ligand- receptor complexes (Feng and Derynck 2005; Vilar et al. 2006). For instance, TGF-b ligands typically induce phos- phorylation of Smad2 and Smad3 through the type I receptor ALK5 but they have also been shown to activate Smad1 in a number of cell types through type I receptors from the ALK1/2/3/6 group (Bharathy et al. 2008; Daly et al. 2008; Goumans et al. 2002; Liu et al. 2009; Wrighton et al. 2009). Besides binding events, several mechanisms exist that contribute to the regulation of signaling (Itoh and ten Dijke 2007). Particularly important for the TGF-b pathway is Electronic supplementary material The online version of this article (doi:10.1007/s00232-014-9643-2) contains supplementary material, which is available to authorized users. Q. Mei Á L. Saiz (&) Modeling of Biological Networks Laboratory, Department of Biomedical Engineering, University of California, 451 E. Health Sciences Drive, Davis, CA 95616, USA e-mail: [email protected] 123 J Membrane Biol DOI 10.1007/s00232-014-9643-2
Transcript of Literature-Based Automated Reconstruction, Expansion, and Refinement of the TGF-β Superfamily...
Literature-Based Automated Reconstruction, Expansion,and Refinement of the TGF-b Superfamily Ligand-ReceptorNetwork
Qian Mei • Leonor Saiz
Received: 28 December 2013 / Accepted: 28 January 2014
� Springer Science+Business Media New York 2014
Abstract The TGF-b pathway transduces a variety of
extracellular signals into intracellular responses that control
multiple cellular processes, including cell growth, apoptosis,
and differentiation. It encompasses 33 ligands that interact with
7 type II receptors and 5 type I receptors at the plasma mem-
brane to potentially form 1,155 ligand-receptor complexes in
mammalian cells. Retrieving the information of the complexes
that are actually formed from reading the literature might be
tedious and prone to missing links. Here, we have developed an
automated literature-mining procedure to obtain the interactions
of the TGF-b ligand-receptor network. By querying the Infor-
mation Hyperlinked over Proteins (iHOP) online service and
processing the results, we were able to find pairwise interactions
between ligands and receptors that allowed us to build the net-
work automatically from the literature. Comparison with
available published review papers indicates that this method is
able to automatically reconstruct and expand the TGF-bsuperfamily ligand-receptor network. Retrieving and parsing the
full text of the manuscripts containing the interactions allowed
us to refine the network interactions for specific cell lines.
Keywords Transmembrane-receptor networks �Text mining � Signal transduction � Transforming growth
factor-b � Protein–protein interactions � Systems biology
Introduction
The transforming growth factor-b (TGF-b) superfamily of
cytokines regulates fundamental cellular responses, such as
proliferation, differentiation, and apoptosis (Massague
1998), through complex networks of interactions. The
ligands of this superfamily initiate signaling at the plasma
membrane by binding to two types of transmembrane ser-
ine-threonine kinase receptors, known as type I and type II
receptors. Upon the formation of the ligand-receptor com-
plex, the constitutively active type II receptors phosphory-
late type I receptors within the complex, which become
active (Wrana et al. 1994). This heteromeric signaling
receptor complex is internalized and recruits cytosolic
receptor-regulated Smad (R-Smad) proteins. Active type I
receptors in turn phosphorylate the associated R-Smads,
which propagate the signal downstream to regulate the
expression of hundreds of genes in a cell-type-specific and
context-dependent fashion (Shi and Massague 2003).
The potential combinatorial interactions in the macro-
molecular assembly of the active ligand-receptor complexes
at the plasma membrane are enormous. The 33 known
members of the TGF-b superfamily of ligands can form
complexes with five type II and seven type I receptors in
mammalian cells, leading to a total of 1,155 potential ligand-
receptor complexes (Feng and Derynck 2005; Vilar et al.
2006). For instance, TGF-b ligands typically induce phos-
phorylation of Smad2 and Smad3 through the type I receptor
ALK5 but they have also been shown to activate Smad1 in a
number of cell types through type I receptors from the
ALK1/2/3/6 group (Bharathy et al. 2008; Daly et al. 2008;
Goumans et al. 2002; Liu et al. 2009; Wrighton et al. 2009).
Besides binding events, several mechanisms exist that
contribute to the regulation of signaling (Itoh and ten Dijke
2007). Particularly important for the TGF-b pathway is
Electronic supplementary material The online version of thisarticle (doi:10.1007/s00232-014-9643-2) contains supplementarymaterial, which is available to authorized users.
Q. Mei � L. Saiz (&)
Modeling of Biological Networks Laboratory, Department of
Biomedical Engineering, University of California, 451 E. Health
Sciences Drive, Davis, CA 95616, USA
e-mail: [email protected]
123
J Membrane Biol
DOI 10.1007/s00232-014-9643-2
receptor trafficking (Di Guglielmo et al. 2003). Receptors are
constitutively internalized and recycled, tightly regulating
the number of active receptors at the plasma membrane to
interact with extracellular ligands (Di Guglielmo et al. 2003;
Mitchell et al. 2004). Quantitative approaches and predictive
models have been successfully applied to the TGF-b signal
transduction pathway, providing a means to functionally
understand the key mechanisms and processes underpinning
experimental results (Celliere et al. 2011; Chung et al. 2009,
2012; Clarke et al. 2006; Ho and Saiz 2011; Melke et al.
2006; Nicklas and Saiz 2013a, b, 2014; Paulsen et al. 2011;
Schmierer et al. 2008; Vilar et al. 2006; Vilar and Saiz 2011;
Wegner et al. 2012; Zi et al. 2011; Zi and Klipp 2007).
Specifically, receptor trafficking and the dynamics of ligand-
receptor complexes have been shown to be a crucial signal-
processing component (Vilar et al. 2006; Vilar and Saiz
2011). By differentially degrading receptors depending on
their signaling activity, receptor trafficking provides an
effective negative feedback that controls the extent of
adaptation and the cross-talking among multiple ligands.
One of the main challenges in the field is, therefore, to
uncover the potential interactions among ligands and
receptors and how they are actually implemented in each
cell type. So far, the core experimental information comes
from traditional cell biology and biochemistry experiments
from a large number of laboratories. A global view of the
pathway requires tracking all this dynamic information in
the biomedical literature. Here, we present an automated
literature-mining procedure to obtain the interactions of the
TGF-b ligand-receptor network.
To construct the network automatically, we made use of
the Information Hyperlinked over Proteins (iHOP) online
service (iHOP—http://www.ihop-net.org), a web tool that
provides information hyperlinked over proteins based on
literature (Hoffmann and Valencia 2004). Information
extraction, data organization, text mining, and result for-
matting were mainly implemented through Perl scripts,
with the help of additional, widespread used software.
Furthermore, since iHOP extracts information just going
through the abstracts of published papers and information
on cell lines is limited there, we developed a method to
automatically build subnetworks for different cell lines/
types by mining through the full text of articles.
Methods
Workflow
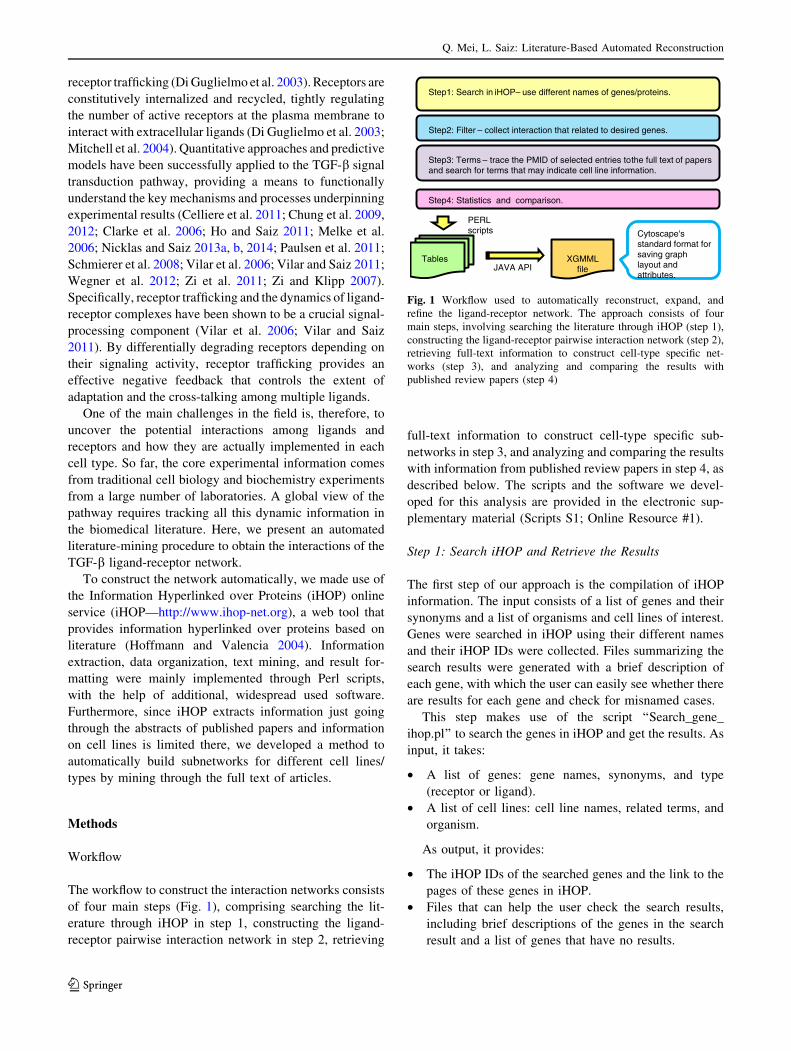
The workflow to construct the interaction networks consists
of four main steps (Fig. 1), comprising searching the lit-
erature through iHOP in step 1, constructing the ligand-
receptor pairwise interaction network in step 2, retrieving
full-text information to construct cell-type specific sub-
networks in step 3, and analyzing and comparing the results
with information from published review papers in step 4, as
described below. The scripts and the software we devel-
oped for this analysis are provided in the electronic sup-
plementary material (Scripts S1; Online Resource #1).
Step 1: Search iHOP and Retrieve the Results
The first step of our approach is the compilation of iHOP
information. The input consists of a list of genes and their
synonyms and a list of organisms and cell lines of interest.
Genes were searched in iHOP using their different names
and their iHOP IDs were collected. Files summarizing the
search results were generated with a brief description of
each gene, with which the user can easily see whether there
are results for each gene and check for misnamed cases.
This step makes use of the script ‘‘Search_gene_
ihop.pl’’ to search the genes in iHOP and get the results. As
input, it takes:
• A list of genes: gene names, synonyms, and type
(receptor or ligand).
• A list of cell lines: cell line names, related terms, and
organism.
As output, it provides:
• The iHOP IDs of the searched genes and the link to the
pages of these genes in iHOP.
• Files that can help the user check the search results,
including brief descriptions of the genes in the search
result and a list of genes that have no results.
Step1: Search in iHOP– use different names of genes/proteins.
Step2: Filter – collect interaction that related to desired genes.
Step3: Terms – trace the PMID of selected entries to the full text of papers and search for terms that may indicate cell line information.
Step4: Statistics and comparison.
Tables XGMML file
Cytoscape'sstandard format for saving graph layout and attributes.
JAVA API
PERL scripts
Fig. 1 Workflow used to automatically reconstruct, expand, and
refine the ligand-receptor network. The approach consists of four
main steps, involving searching the literature through iHOP (step 1),
constructing the ligand-receptor pairwise interaction network (step 2),
retrieving full-text information to construct cell-type specific net-
works (step 3), and analyzing and comparing the results with
published review papers (step 4)
Q. Mei, L. Saiz: Literature-Based Automated Reconstruction
123
Step 2: Construct the Whole Interaction Network
(Cell-Line Nonspecific)
The second step is to generate the whole network (cell-line
nonspecific). Output files are tables of interaction attributes
and node attributes, as well as other files used in the sub-
sequent steps.
This step makes use of the script ‘‘Batch_etr.pl’’ to
extract and filter interaction information in iHOP, with a
whole interaction network as a result. As input, it takes:
• Search results generated by step 1.
As output, it provides:
• PPI.txt: Edges and their attributes in the whole
interaction network between ligands and receptors
(cell-line nonspecific).
• NODE_ATTR.txt: Nodes and their attributes in the
whole interaction network.
• PMID list: List of references detected by iHOP with
their PubMed (http://www.ncbi.nlm.nih.gov/pubmed)
identifiers (PMIDs), which will help to find the paper.
Step 3: Construct Cell-Line Specific Networks
In the third step, cell-line specific networks are constructed.
This process is semi-automatic with the help of the wide-
spread used software EndNote and Adobe Acrobat. End-
Note is a popular tool for reference management, with
which we can download the references detected by iHOP in
batch mode. Adobe Acrobat is used to convert the PDF
files into text files in batch mode as well, which makes it
possible to text-mine through their contents. The mining is
conducted by Perl scripts with a list of cell line names and
related terms as input. In the results, the occurrences of
terms from the list or detected by patterns are counted and
the parts in the article they appeared also considered.
Generally, if a term appeared in the materials and methods
section, it is most likely that the results reported by the
authors can be found in this particular cell line. For the
terms that appear in other parts of the article and with low
occurrences, it may indicate that the author mentions it for
comparison or as background. In our study, terms like the
latter were ignored. It is also possible that a term has high
occurrences in the full text but does not appear in the
methods sections. In this case, we would pay special
attention to them, and check the article manually.
Step 4: Compare Text-Mining Network Results
with Published Review Papers
The last step includes a series of analysis and statistics. The
networks generated in step 2 and 3 can be converted with a
short java program into XGMML files, which is a standard
format for network description and can be read by most
network visualization software. Here, we use cytoscape
(http://cytoscape.org) to display our resulting network
(Smoot et al. 2011).
This step makes use of the script ‘‘COMPARE.pl’’,
which takes as input:
• PPI.txt.
• TGFBpaper.txt: Interactions reported by two extensive
review papers (de Caestecker 2004; Lowery and de
Caestecker 2010).
As output, it provides:
• COMMON-INTR.txt: common interactions.
• PAPER-INTR.txt: interactions only in the review
papers.
• PPI-INTR.txt: interactions only in our resulting
network.
To generate the XGMML files needed to visualize the
networks, we preprocessed the data with the script ‘‘get_
nodes_edge.pl’’, which organizes the attributes of nodes
and edges in the interaction network and generates input
files for the java programs ‘‘XGMMLwriter.java’’ and
‘‘XGMMLCreator.java’’, which are used to generate the
XGMML files.
Results and Discussion
The approach followed, as indicated in the workflow
(Fig. 1) and detailed in the methods section, successfully
captures most of the known interactions reported in the two
extensive review papers (de Caestecker 2004; Lowery and
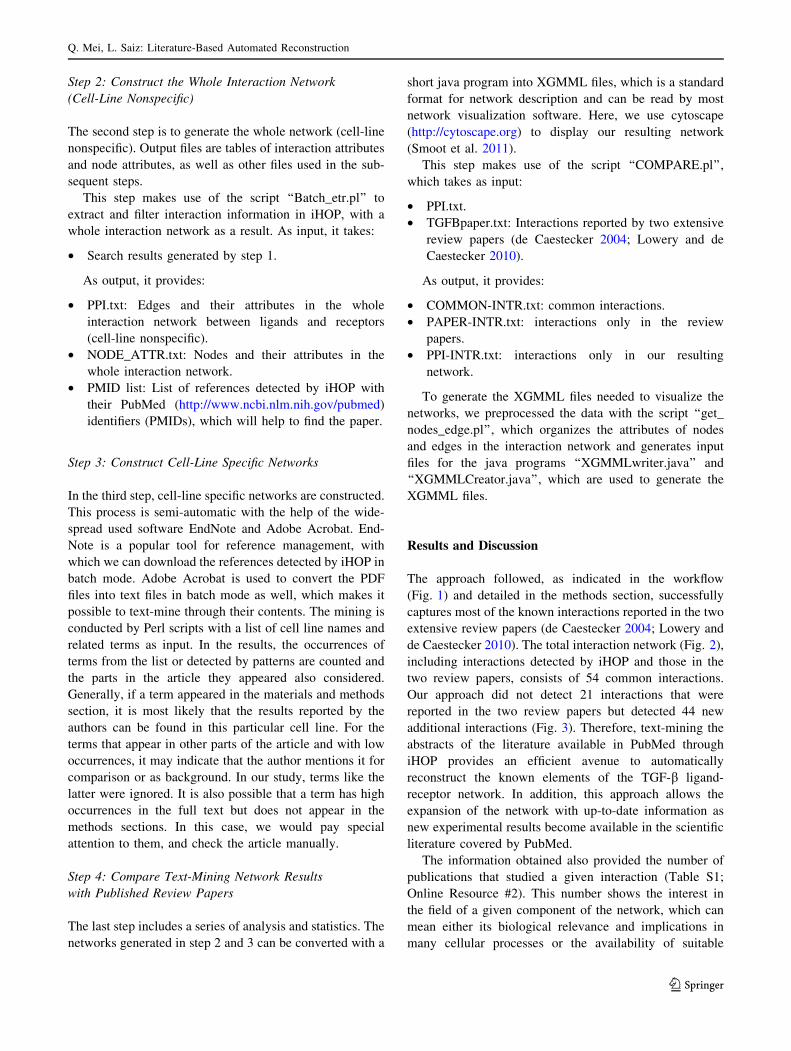
de Caestecker 2010). The total interaction network (Fig. 2),
including interactions detected by iHOP and those in the
two review papers, consists of 54 common interactions.
Our approach did not detect 21 interactions that were
reported in the two review papers but detected 44 new
additional interactions (Fig. 3). Therefore, text-mining the
abstracts of the literature available in PubMed through
iHOP provides an efficient avenue to automatically
reconstruct the known elements of the TGF-b ligand-
receptor network. In addition, this approach allows the
expansion of the network with up-to-date information as
new experimental results become available in the scientific
literature covered by PubMed.
The information obtained also provided the number of
publications that studied a given interaction (Table S1;
Online Resource #2). This number shows the interest in
the field of a given component of the network, which can
mean either its biological relevance and implications in
many cellular processes or the availability of suitable
Q. Mei, L. Saiz: Literature-Based Automated Reconstruction
123
methodologies for its study. Among the interactions found,
two of them stand out in terms of publications that studied
them: TGFBR2 with TGF-b1 and TGF-b1 with ALK5,
which are the canonical elements of the TGF-b pathway.
On second line in terms of publications reporting them,
there are TGF-b1 with ALK1, BMPR2 with BMP2, and
MISR2 with MIS, which involve well-known components
of the pathway.
The automated analysis of the full text of the literature
allowed us to refine the network with cell-specific
information (Table S2; Online Resource #3). We focused
explicitly on the C2C12 cell line, which is widely used in
the laboratory and its name does not get confused with
other terms. For instance, other cell lines are more difficult
to identify automatically because of the presence of single
terms, such as muscle, epithelial, and endothelial. Here, we
assumed that the interaction was present in the cell line if
the cell line name appeared in both methods section and the
full text. If the cell line name appeared in other parts of the
article, we checked it manually. The results obtained from
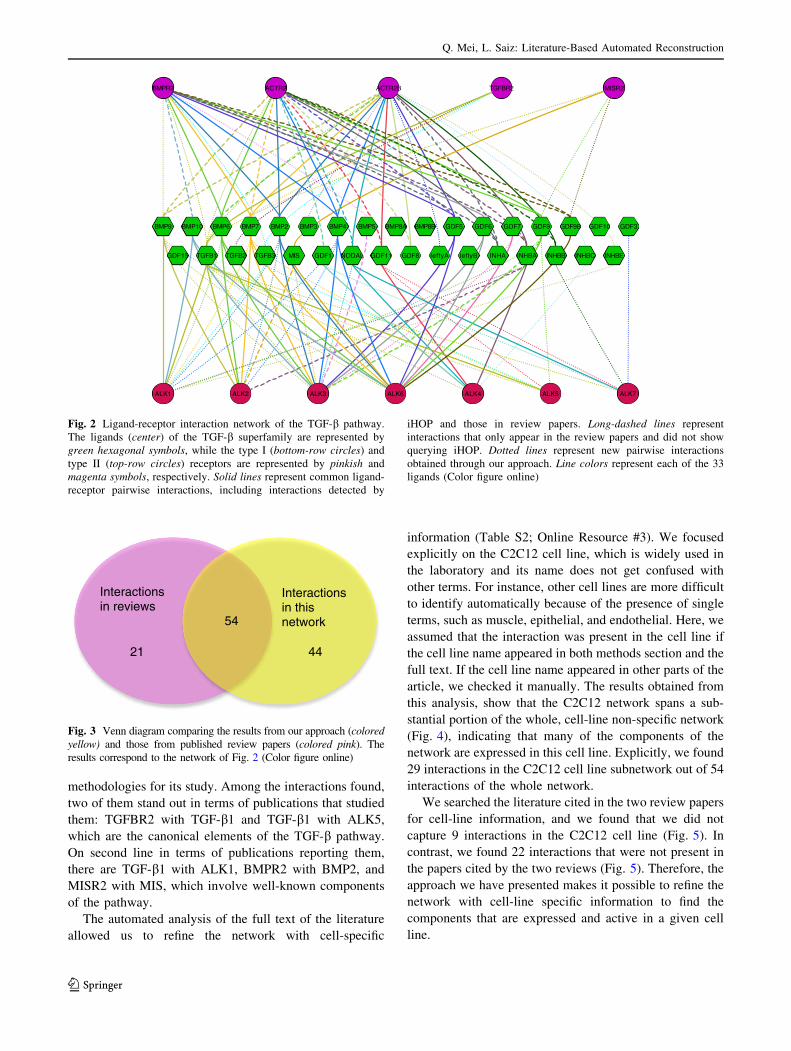
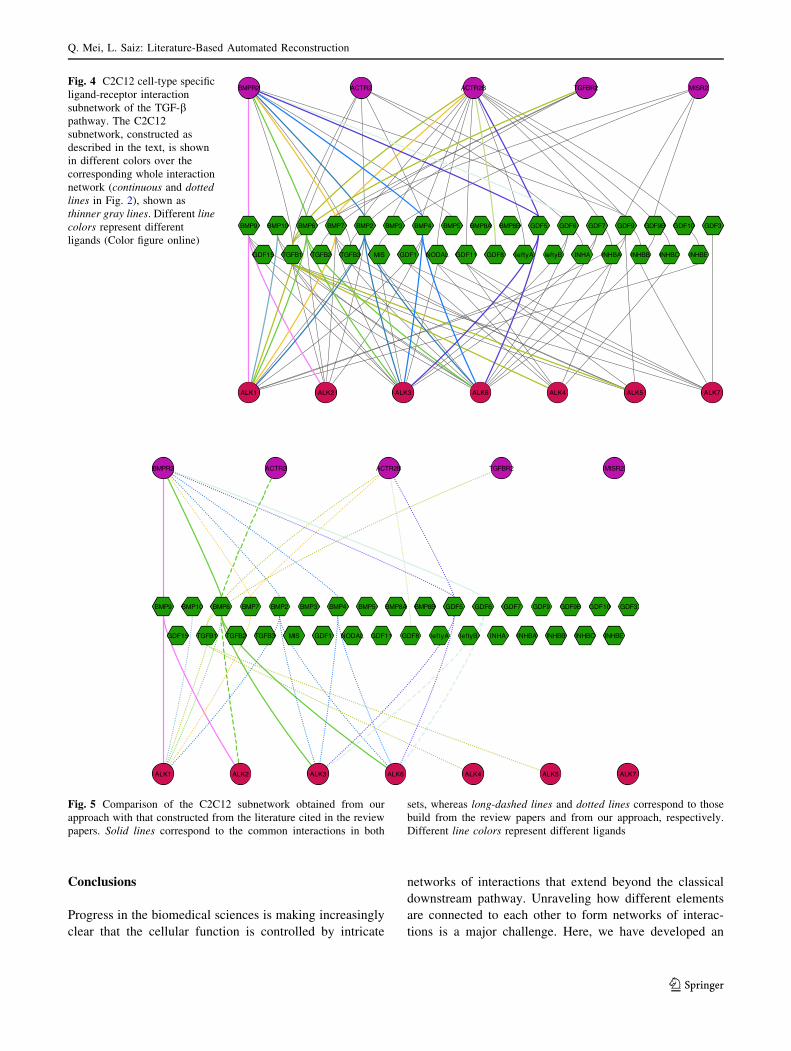
this analysis, show that the C2C12 network spans a sub-
stantial portion of the whole, cell-line non-specific network
(Fig. 4), indicating that many of the components of the
network are expressed in this cell line. Explicitly, we found
29 interactions in the C2C12 cell line subnetwork out of 54
interactions of the whole network.
We searched the literature cited in the two review papers
for cell-line information, and we found that we did not
capture 9 interactions in the C2C12 cell line (Fig. 5). In
contrast, we found 22 interactions that were not present in
the papers cited by the two reviews (Fig. 5). Therefore, the
approach we have presented makes it possible to refine the
network with cell-line specific information to find the
components that are expressed and active in a given cell
line.
Fig. 2 Ligand-receptor interaction network of the TGF-b pathway.
The ligands (center) of the TGF-b superfamily are represented by
green hexagonal symbols, while the type I (bottom-row circles) and
type II (top-row circles) receptors are represented by pinkish and
magenta symbols, respectively. Solid lines represent common ligand-
receptor pairwise interactions, including interactions detected by
iHOP and those in review papers. Long-dashed lines represent
interactions that only appear in the review papers and did not show
querying iHOP. Dotted lines represent new pairwise interactions
obtained through our approach. Line colors represent each of the 33
ligands (Color figure online)
Interactions in reviews
Interactions in this network
44
54
21
Fig. 3 Venn diagram comparing the results from our approach (colored
yellow) and those from published review papers (colored pink). The
results correspond to the network of Fig. 2 (Color figure online)
Q. Mei, L. Saiz: Literature-Based Automated Reconstruction
123
Conclusions
Progress in the biomedical sciences is making increasingly
clear that the cellular function is controlled by intricate
networks of interactions that extend beyond the classical
downstream pathway. Unraveling how different elements
are connected to each other to form networks of interac-
tions is a major challenge. Here, we have developed an
Fig. 4 C2C12 cell-type specific
ligand-receptor interaction
subnetwork of the TGF-bpathway. The C2C12
subnetwork, constructed as
described in the text, is shown
in different colors over the
corresponding whole interaction
network (continuous and dotted
lines in Fig. 2), shown as
thinner gray lines. Different line
colors represent different
ligands (Color figure online)
Fig. 5 Comparison of the C2C12 subnetwork obtained from our
approach with that constructed from the literature cited in the review
papers. Solid lines correspond to the common interactions in both
sets, whereas long-dashed lines and dotted lines correspond to those
build from the review papers and from our approach, respectively.
Different line colors represent different ligands
Q. Mei, L. Saiz: Literature-Based Automated Reconstruction
123
automated approach to achieve this goal and applied it to
the TGF-b signaling system. Our results show that it is
indeed possible to perform to a large extent a literature-
based automated reconstruction, expansion, and refinement
of the TGF-b superfamily ligand-receptor network. This
network is particularly challenging because it encompasses
33 ligands that interact with 7 type II receptors and 5 type I
receptors at the plasma membrane to potentially form
1,155 ligand-receptor complexes. Despite this complexity,
our approach provided not only an efficient alternative to
manually retrieving the information of the complexes that
are actually formed from reading the literature, which
might be tedious and prone to missing links, but also an
avenue to expand and refine with cell-line specific infor-
mation the available networks.
Acknowledgments This work was supported by the University of
California, Davis (to L.S.).
References
Bharathy S, Xie W, Yingling JM, Reiss M (2008) Cancer-associated
transforming growth factor b type II receptor gene mutant causes
activation of bone morphogenic protein-smads and invasive
phenotype. Cancer Res 68:1656–1666
Celliere G, Fengos G, Herve M, Iber D (2011) Plasticity of TGF-beta
signaling. BMC Syst Biol 5:184
Chung S-W, Miles FL, Sikes RA, Cooper CR, Farach-Carson MC,
Ogunnaike BA (2009) Quantitative modeling and analysis of the
transforming growth factor b signaling pathway. Biophys J
96:1733–1750
Chung SW, Cooper CR, Farach-Carson MC, Ogunnaike BA (2012) A
control engineering approach to understanding the TGF-beta
paradox in cancer. J R Soc Interface 9:1389–1397
Clarke DC, Betterton MD, Liu X (2006) Systems theory of Smad
signalling. IEEE Proc Syst Biol 153:412–424
Daly AC, Randall RA, Hill CS (2008) Transforming growth factor b-
induced Smad1/5 phosphorylation in epithelial cells is mediated
by novel receptor complexes and is essential for anchorage-
independent growth. Mol Cell Biol 28:6889–6902
de Caestecker M (2004) The transforming growth factor-beta
superfamily of receptors. Cytokine Growth Factor Rev 15:1–11
Di Guglielmo GM, Le Roy C, Goodfellow AF, Wrana JL (2003)
Distinct endocytic pathways regulate TGF-b receptor signalling
and turnover. Nature Cell Biol 5:410–421
Feng X-H, Derynck R (2005) Specificity and versatility in TGF-bsignaling through Smads. Annu Rev Cell Dev Biol 21:659–693
Goumans M-J, Valdimarsdottir G, Itoh S, Rosendahl A, Sideras P, ten
Dijke P (2002) Balancing the activation state of the endothelium
via two distinct TGF-b type I receptors. EMBO J 21:1743–1753
Ho J, Saiz L (2011) Computational analysis of the TGF-Beta and
BMP signal transduction pathways. Biophys J 100:164a
Hoffmann R, Valencia A (2004) A gene network for navigating the
literature. Nat Genet 36:664
Itoh S, ten Dijke P (2007) Negative regulation of TGF-b receptor/
Smad signal transduction. Curr Opin Cell Biol 19:176–184
Liu IM, Schilling SH, Knouse KA, Choy L, Derynck R, Wang X-F
(2009) TGFb-stimulated Smad1/5 phosphorylation requires the
ALK5 L45 loop and mediates the pro-migratory TGFb switch.
EMBO J 28:88–98
Lowery JW, de Caestecker MP (2010) BMP signaling in vascular
development and disease. Cytokine Growth Factor Rev 21:287–298
Massague J (1998) TGF-b signal transduction. Annu Rev Biochem
67:753–791
Melke P, Jonsson H, Pardali E, ten Dijke P, Peterson C (2006) A rate
equation approach to elucidate the kinetics and robustness of the
TGF-b pathway. Biophys J 91:4368–4380
Mitchell H, Choudhury A, Pagano RE, Leof EB (2004) Ligand-
dependent and -independent transforming growth factor-bReceptor recycling regulated by clathrin-mediated endocytosis
and Rab11. Mol Biol Cell 15:4166–4178
Nicklas D, Saiz L (2013a) Characterization of negative feedback network
motifs in the TGF-b signaling pathway. PLoS One 8:e83531
Nicklas D, Saiz L (2013b) Computational modelling of Smad-
mediated negative feedback and crosstalk in the TGF-beta
superfamily network. J R Soc Interface 10:20130363
Nicklas D, Saiz L (2014) In silico identification of potential therapeutic
targets in the TGF-b signal transduction pathway. Mol BioSyst
10:537–548
Paulsen M, Legewie S, Eils R, Karaulanov E, Niehrs C (2011) Negative
feedback in the bone morphogenetic protein 4 (BMP4) synexpres-
sion group governs its dynamic signaling range and canalizes
development. Proc Natl Acad Sci USA 108:10202–10207
Schmierer B, Tournier AL, Bates PA, Hill CS (2008) Mathematical
modeling identifies Smad nucleocytoplasmic shuttling as a
dynamic signal-interpreting system. Proc Natl Acad Sci USA
105:6608–6613
Shi Y, Massague J (2003) Mechanisms of TGF-b signaling from cell
membrane to the nucleus. Cell 113:685–700
Smoot ME, Ono K, Ruscheinski J, Wang PL, Ideker T (2011)
Cytoscape 2.8: new features for data integration and network
visualization. Bioinformatics 27:431–432
Vilar JMG, Saiz L (2011) Trafficking coordinate description of
intracellular transport control of signaling networks. Biophys J
101:2315–2323
Vilar JMG, Jansen R, Sander C (2006) Signal processing in the TGF-
b superfamily ligand-receptor network. PLoS Comput Biol 2:e3
Wegner K, Bachmann A, Schad JU, Lucarelli P, Sahle S, Nickel P,
Meyer C, Klingmuller U, Dooley S, Kummer U (2012)
Dynamics and feedback loops in the transforming growth factor
beta signaling pathway. Biophys Chem 162:22–34
Wrana JL, Attisano L, Wieser R, Ventura F, Massague J (1994)
Mechanism of activation of the TGF-b receptor. Nature
370:341–347
Wrighton KH, Lin X, Yu PB, Feng X-H (2009) Transforming growth
factor b can stimulate Smad1 phosphorylation independently of
bone morphogenic protein receptors. J Biol Chem 284:9755–9763
Zi Z, Klipp E (2007) Constraint-based modeling and kinetic analysis
of the Smad dependent TGF-b signaling pathway. PLoS One
2:e936
Zi Z, Feng Z, Chapnick DA, Dahl M, Deng D, Klipp E, Moustakas A,
Liu X (2011) Quantitative analysis of transient and sustained
transforming growth factor-b signaling dynamics. Mol Syst Biol
7:492
Q. Mei, L. Saiz: Literature-Based Automated Reconstruction
123