Li and δ7Li in mudrocks from the British Caledonides ...mcdonoug/documents/geochemistry...Li and...
16
Li and d 7 Li in mudrocks from the British Caledonides: Metamorphism and source influences Lin Qiu a, * , Roberta L. Rudnick a , William F. McDonough a , Richard J. Merriman b a Geochemistry Laboratory, Department of Geology, University of Maryland, College Park, MD 20742, USA b British Geological Survey, Keyworth, Nottingham NG125GG, UK Received 28 March 2009; accepted in revised form 17 August 2009; available online 23 August 2009 Abstract Mudrocks from three lower Paleozoic basins in the British Caledonides (southern Lake District, northern Lake District and Southern Uplands) were investigated to determine the influence of sub-greenschist facies metamorphism on Li and the factors that control Li in fine-grained terrigenous sedimentary rocks. Metamorphic grade, as determined by KI (Ku ¨ bler index) does not correlate with Li content ([Li]) and d 7 Li, indicating that sub-greenschist facies metamorphism has negligible effect on Li in these rocks. Collectively, the data for all three basins show a negative correlation between [Li] and d 7 Li and a positive correlation between [Li] and the Chemical Index of Alteration (CIA), suggesting that provenance exerts the greatest control on Li in mudrocks. Samples from the northern Lake District, which were deposited in an extensional basin, have homoge- neous REE patterns, similar to shale composites (PAAS), the highest CIA, Th/U and [Li] and the lowest d 7 Li and e Nd , con- sistent with their derivation from a highly weathered, ancient continental source. By contrast, mudrocks from the Southern Uplands range to the lowest CIA, Th/U and [Li] and have the highest d 7 Li and e Nd . These samples were deposited in a forearc basin on the southern margin of the Laurentian craton and contain volcanic detritus. Their REE patterns are the most var- iable, ranging from average shale-like patterns to less LREE-enriched patterns. The compositional heterogeneity within the Southern Uplands mudrocks is consistent with a mixed provenance that includes juvenile crustal materials (lower [Li], e Nd and Th/U, higher d 7 Li), likely derived from the arc, as well as more highly weathered continental detritus. Mudrocks from the southern Lake District were deposited in a foreland basin, and exhibit geochemical characteristics intermediate between the northern Lake District and the Southern Uplands mudrocks, indicating their derivation from a mixed source. Our study shows that Li concentrations and d 7 Li can provide additional information on the degree of weathering of the provenance of mudrocks. Published by Elsevier Ltd. 1. INTRODUCTION Lithium, a light alkali metal with its two stable isotopes, 6 Li and 7 Li, has received significant attention during the last decade due to the large isotopic fractionation that has been documented in near-surface environments (d 7 Li = 20& to +40&)(Rudnick et al., 2004; Pogge von Strandmann et al., 2006), and its potential to trace crustal recycling into the mantle. Recent studies have demon- strated large Li isotopic fractionation during arrested diffu- sion (Richter et al., 2003; Beck et al., 2005; Lundstrom et al., 2005; Teng et al., 2006a; Jeffcoate et al., 2007; Marks et al., 2007; Parkinson et al., 2007), terrestrial weathering (Pistiner and Henderson, 2003; Huh et al., 2004; Kisakurek et al., 2004; Rudnick et al., 2004), and seafloor alteration (Chan et al., 1992, 1993, 1994; Seyfried et al., 1998; Chan and Kastner, 2000; James et al., 2003; Bouman et al., 2004). By contrast, very limited Li isotopic fractionation occurs during igneous differentiation (Tomascak et al., 1999; Bryant et al., 2004; Teng et al., 2004, 2006b; Halama et al., 2007). Consequently, this system has been suggested to be a potentially useful tracer of crustal recycling in sub- duction zones (e.g., Elliott et al., 2004, 2006). 0016-7037/$ - see front matter Published by Elsevier Ltd. doi:10.1016/j.gca.2009.08.017 * Corresponding author. Tel.: +1 301 405 6248. E-mail address: [email protected] (L. Qiu). www.elsevier.com/locate/gca Available online at www.sciencedirect.com Geochimica et Cosmochimica Acta 73 (2009) 7325–7340
-
Upload
hoangkhanh -
Category
Documents
-
view
222 -
download
1
Transcript of Li and δ7Li in mudrocks from the British Caledonides ...mcdonoug/documents/geochemistry...Li and...
Available online at www.sciencedirect.com
www.elsevier.com/locate/gca
Geochimica et Cosmochimica Acta 73 (2009) 7325–7340
Li and d7Li in mudrocks from the British Caledonides:Metamorphism and source influences
Lin Qiu a,*, Roberta L. Rudnick a, William F. McDonough a, Richard J. Merriman b
a Geochemistry Laboratory, Department of Geology, University of Maryland, College Park, MD 20742, USAb British Geological Survey, Keyworth, Nottingham NG125GG, UK
Received 28 March 2009; accepted in revised form 17 August 2009; available online 23 August 2009
Abstract
Mudrocks from three lower Paleozoic basins in the British Caledonides (southern Lake District, northern Lake Districtand Southern Uplands) were investigated to determine the influence of sub-greenschist facies metamorphism on Li and thefactors that control Li in fine-grained terrigenous sedimentary rocks. Metamorphic grade, as determined by KI (Kubler index)does not correlate with Li content ([Li]) and d7Li, indicating that sub-greenschist facies metamorphism has negligible effect onLi in these rocks. Collectively, the data for all three basins show a negative correlation between [Li] and d7Li and a positivecorrelation between [Li] and the Chemical Index of Alteration (CIA), suggesting that provenance exerts the greatest controlon Li in mudrocks. Samples from the northern Lake District, which were deposited in an extensional basin, have homoge-neous REE patterns, similar to shale composites (PAAS), the highest CIA, Th/U and [Li] and the lowest d7Li and eNd, con-sistent with their derivation from a highly weathered, ancient continental source. By contrast, mudrocks from the SouthernUplands range to the lowest CIA, Th/U and [Li] and have the highest d7Li and eNd. These samples were deposited in a forearcbasin on the southern margin of the Laurentian craton and contain volcanic detritus. Their REE patterns are the most var-iable, ranging from average shale-like patterns to less LREE-enriched patterns. The compositional heterogeneity within theSouthern Uplands mudrocks is consistent with a mixed provenance that includes juvenile crustal materials (lower [Li], eNd andTh/U, higher d7Li), likely derived from the arc, as well as more highly weathered continental detritus. Mudrocks from thesouthern Lake District were deposited in a foreland basin, and exhibit geochemical characteristics intermediate betweenthe northern Lake District and the Southern Uplands mudrocks, indicating their derivation from a mixed source. Our studyshows that Li concentrations and d7Li can provide additional information on the degree of weathering of the provenance ofmudrocks.Published by Elsevier Ltd.
1. INTRODUCTION
Lithium, a light alkali metal with its two stable isotopes,6Li and 7Li, has received significant attention during thelast decade due to the large isotopic fractionation that hasbeen documented in near-surface environments (d7Li =��20& to �+40&) (Rudnick et al., 2004; Pogge vonStrandmann et al., 2006), and its potential to trace crustalrecycling into the mantle. Recent studies have demon-strated large Li isotopic fractionation during arrested diffu-
0016-7037/$ - see front matter Published by Elsevier Ltd.
doi:10.1016/j.gca.2009.08.017
* Corresponding author. Tel.: +1 301 405 6248.E-mail address: [email protected] (L. Qiu).
sion (Richter et al., 2003; Beck et al., 2005; Lundstromet al., 2005; Teng et al., 2006a; Jeffcoate et al., 2007; Markset al., 2007; Parkinson et al., 2007), terrestrial weathering(Pistiner and Henderson, 2003; Huh et al., 2004; Kisakureket al., 2004; Rudnick et al., 2004), and seafloor alteration(Chan et al., 1992, 1993, 1994; Seyfried et al., 1998; Chanand Kastner, 2000; James et al., 2003; Bouman et al.,2004). By contrast, very limited Li isotopic fractionationoccurs during igneous differentiation (Tomascak et al.,1999; Bryant et al., 2004; Teng et al., 2004, 2006b; Halamaet al., 2007). Consequently, this system has been suggestedto be a potentially useful tracer of crustal recycling in sub-duction zones (e.g., Elliott et al., 2004, 2006).
7326 L. Qiu et al. / Geochimica et Cosmochimica Acta 73 (2009) 7325–7340
Marine sediments are a major source of Li in subductingslabs and may therefore control the Li budget of recycledmaterials (Chan et al., 2006). However, the behavior of Liduring metamorphic devolatilization of sedimentary rockshas only been partially explored (e.g., Teng et al., 2007),as have the factors that control the Li isotopic compositionof terrigenous sediments (Teng et al., 2004; Chan et al.,2006). In particular, the effects of sub-greenschist faciesmetamorphism on [Li] and d7Li, during which significantvolatiles may be lost (Merriman and Roberts, 2001), isunknown.
The degree of Li isotope fractionation caused by meta-morphic devolatilization is a matter of current debate. Ina study of alpine eclogites, which are considered analogsfor subducted oceanic crust, Zack et al. (2003) suggestedthat sub-greenschist to greenschist facies metamorphicdehydration of altered basalts produced the light d7Li val-ues (as low as �12&) seen in some of these samples. Bycontrast, Marschall et al. (2007), using the spodumene-fluidisotopic fractionation factors of Wunder et al. (2007), sug-gested that dehydration cannot produce such low d7Li.These authors concluded that the very light d7Li value seenin some massif eclogites are likely the result of kinetic frac-tionation during diffusive influx of Li from the countryrocks into the eclogite body. Similarly, in a study of the ef-fects of contact metamorphic dehydration of chlorite to sil-limanite zone metapelites, Teng et al. (2007) suggested thatmetamorphic dehydration had little discernible effect on thed7Li of the rocks, despite the fact that up to half of the Liwas lost during metamorphism. They showed that the lim-ited isotopic fractionation of up to 3& is consistent withpublished fluid-mineral isotopic partitioning studies (Wun-der et al., 2006). However, to date, no comprehensive studyof the factors that control Li and its isotopic composition invery low temperature metasediments, i.e., sub-greenschistfacies metasediments, has been carried out. Such conditionsshould be representative of metamorphism in the forearc ofsubduction zones when initial dewatering process occurs.
In a recent review, Chan et al. (2006) document the ma-jor influences on the Li abundance and d7Li of marine sed-iments. While a number of factors influence Li in marinesediments, provenance plays a major role in determiningthe bulk Li isotopic composition and concentration of glo-bal marine sediments, with clay-rich sediments generallyhaving higher Li abundance and lower d7Li than other oce-anic sediments (calcareous oozes, carbonates, sand, andhydrothermally altered sediments). Sediments derived frommature continental crust are especially light and may reflectenhanced or prolonged weathering, whereas volcanogenicsediments derived from unweathered sources have relativelyheavier d7Li values. It has yet to be established how wellthese provenance differences are preserved during subduc-tion and metamorphic dehydration and to what degree Liin terrigenous sediments may act as a proxy for weatheringin the source region.
We present here the Li concentration [Li], isotopic com-position, major-element and trace-element abundances andNd and Sr isotopic composition for three suites of mud-rocks from lower Paleozoic basins within the British Cale-donides. These samples have experienced metamorphic
conditions ranging from deep diagenetic to epizonal (lowergreenschist facies) metamorphism over a range of dP/dTgradients. These rocks are used to explore the factors thatcontrol lithium concentration and its isotopic compositionin sub-greenschist facies metapelites and determine whetherlithium is lost during dehydration reactions that occur dur-ing sub-greenschist facies metamorphism, and if so,whether isotopic fractionation occurs.
2. GEOLOGICAL BACKGROUND AND SAMPLES
The Caledonian mudrocks examined here come fromOrdovician to Silurian sedimentary basins that are juxta-posed across the Iapetus Suture, the structural trace withinthe British Caledonides of the early Paleozoic IapetusOcean (Fig. 1, Merriman et al., 2009). In the northern LakeDistrict, the Skiddaw Group formed in a sedimentary basinthat developed in an extensional setting on the southernmargin of the Iapetus Ocean during the early to mid-Ordo-vician. Thus, these sediments were metamorphosed underrelatively high heat flow conditions (35–50 �C km�1, Stoneand Merriman, 2004). By contrast, the other two sedimen-tary basins formed in relatively low heat flow regimes(<25 �C km�1 in the Southern Uplands and <20 �C km�1
in the southern Lake District, Merriman and Roberts,2001; Soper and Woodcock, 2003). The Southern Uplandsterrane formed as an accretionary thrust complex at theLaurentian continental margin and the southern Lake Dis-trict evolved largely in response to flexural subsidence ofthe crust, in convergent plate settings. These latter two ba-sins formed as the Iapetus Ocean closed during the lateOrdovician and early Silurian (Leggett et al., 1979; Stoneet al., 1987; Kneller, 1991).
In response to sedimentary burial and enhanced heatflow, minerals in sediments undergo diagenetic to verylow-grade metamorphic reactions as soft clays and mudsare systematically converted to lithified mudrocks (Merri-man and Peacor, 1999). The Caledonian samples from thethree basins consist of clays, mostly <2 lm in grain size,as well as non-clay minerals. The latter include quartz(<40%), albite (<15%) minor amounts (<5%) of calcite,dolomite, K-feldspar, hematite, pyrite, and trace amounts(1<%) of rutile or anatase (Merriman, 2006). In the north-ern Lake District, clay mineral assemblages include K- andNa-rich white micas, chlorite, minor pyrophyllite, rectorite(Na,Ca)Al4(Si,Al)8O20(OH)4�2(H2O)) and corrensite (Ca,-Na,K)(Mg,Fe,Al)9(Si,Al)8O20(OH)10�n(H2O). The Na-richclays indicate relatively high heat flow conditions in themudrocks (Merriman, 2006). By contrast, Na-micas andpyrophyllite are much less abundant or absent in clay min-erals from the Southern Uplands and the southern LakeDistrict (Merriman et al., 2009) due to relatively low heatflow (Fortey, 1989; Cooper et al., 2004). Southern Uplandsmudrocks also contain volcanic detritus, including unal-tered pyroxene, probably derived from a nearby eroded vol-canic arc. The clay minerals in the Southern Uplandssamples are rich in chlorite and other Fe, Mg-clays, likelyderived from weathering of mafic volcanic detritus.
The metamorphic grade of the samples was determinedusing the Kubler index (KI), which is a measure of small
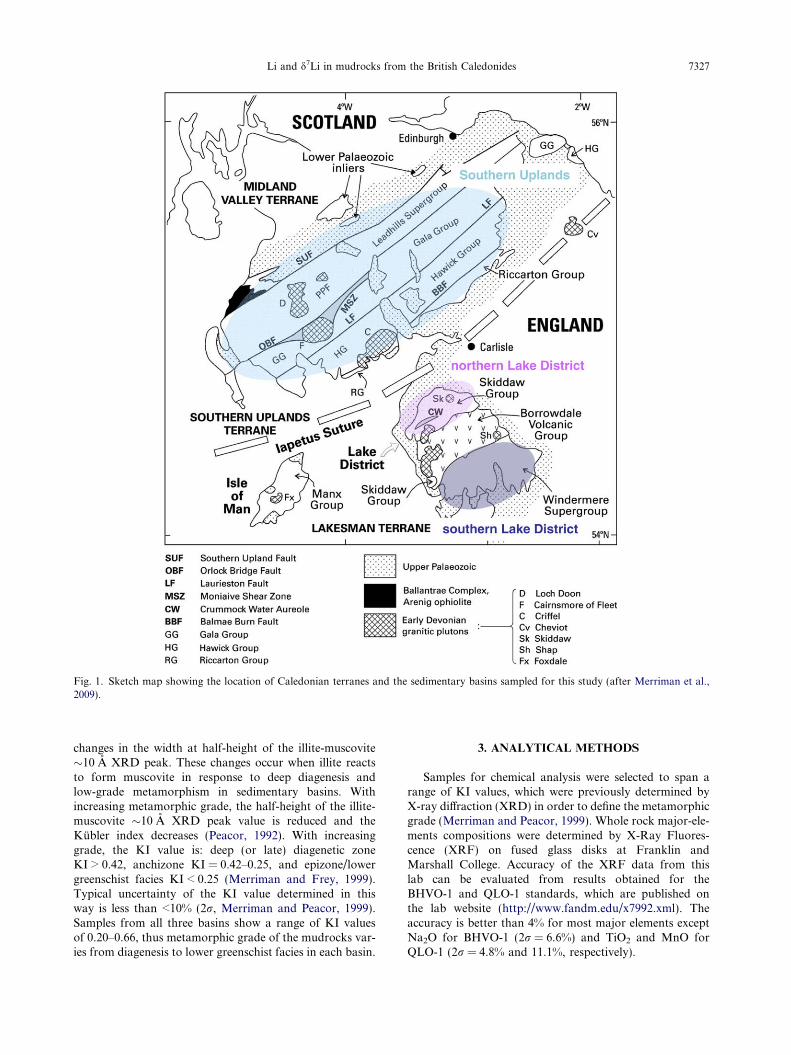
Fig. 1. Sketch map showing the location of Caledonian terranes and the sedimentary basins sampled for this study (after Merriman et al.,2009).
Li and d7Li in mudrocks from the British Caledonides 7327
changes in the width at half-height of the illite-muscovite�10 A XRD peak. These changes occur when illite reactsto form muscovite in response to deep diagenesis andlow-grade metamorphism in sedimentary basins. Withincreasing metamorphic grade, the half-height of the illite-muscovite �10 A XRD peak value is reduced and theKubler index decreases (Peacor, 1992). With increasinggrade, the KI value is: deep (or late) diagenetic zoneKI > 0.42, anchizone KI = 0.42–0.25, and epizone/lowergreenschist facies KI < 0.25 (Merriman and Frey, 1999).Typical uncertainty of the KI value determined in thisway is less than <10% (2r, Merriman and Peacor, 1999).Samples from all three basins show a range of KI valuesof 0.20–0.66, thus metamorphic grade of the mudrocks var-ies from diagenesis to lower greenschist facies in each basin.
3. ANALYTICAL METHODS
Samples for chemical analysis were selected to span arange of KI values, which were previously determined byX-ray diffraction (XRD) in order to define the metamorphicgrade (Merriman and Peacor, 1999). Whole rock major-ele-ments compositions were determined by X-Ray Fluores-cence (XRF) on fused glass disks at Franklin andMarshall College. Accuracy of the XRF data from thislab can be evaluated from results obtained for theBHVO-1 and QLO-1 standards, which are published onthe lab website (http://www.fandm.edu/x7992.xml). Theaccuracy is better than 4% for most major elements exceptNa2O for BHVO-1 (2r = 6.6%) and TiO2 and MnO forQLO-1 (2r = 4.8% and 11.1%, respectively).
7328 L. Qiu et al. / Geochimica et Cosmochimica Acta 73 (2009) 7325–7340
Lithium concentrations and isotopic compositions weredetermined at the Geochemistry Laboratory of the Univer-sity of Maryland, College Park. Most of the whole rockpowders measured for Li isotopes were the same as thosepreviously analyzed by one of us (Merriman) for selectedmajor and trace elements, as well as KI. However, someoriginal sample powders were fully consumed in thatstudy, necessitating re-sampling and creation of a secondbatch of whole rock powders for a subset of samples.The new samples were collected at the same outcrop withina few meters from the original site and, thus, should havethe same metamorphic grade (KI value) as the originalsamples. These samples are marked by an “r” in Tables 1and 2.
Procedures for sample dissolution, column chemistryand instrumental analysis are the same as those reportedin Teng et al. (2006b). The sample dissolution proceduredoes not include the high-P teflon bomb process, however,for the samples that contained organic carbon (labeled “o”
in Tables 1 and 2), we used HClO4 in a 1:1 mixture with HFin the first step of sample dissolution. The presence of or-ganic carbon in the samples does not correlate with lithiumconcentration or isotopic composition, suggesting thatthere is no organic matter influence on lithium behaviorin our samples. The long-term external precision of Li iso-topic analyses, based on repeat analyses of pure Li stan-dards in this laboratory over the past eight years is61.0& (2r) (Teng et al., 2006b). Precision on pure Li stan-dards analyzed during the course of our analyses is as fol-lows: UMD-1 (50 ppb, n = 40 runs) d7Li = 54.2 ± 0.6,IRMM-016 (100 ppb, n = 38 runs) d7Li = �0.2 ± 0.5 andthe rock reference material BCR-1 gives d7Li = 2.0 ± 0.3(n = 2 runs). As a benchmark, Teng et al. (2006b) reportedBCR-1 d7Li = 2.0 ± 0.7 in 10 runs and Rudnick et al.(2004) reported BCR-1 d7Li = 2.7 ± 1&. The total proce-dural blank measured during the course of this study isLi = 0.11 ± 0.12 ng and d7Li = �25.3 ± 40. Given theamount of Li processed in any one sample (minimumLi = 30 ng), this blank has negligible effect on both concen-tration and isotopic composition and thus no blank correc-tion was applied.
Li concentration measurements were determined byvoltage comparisons between sample solutions and mea-surements for a 50 ppb L-SVEC bracketing standard solu-tion and then adjusting for sample weight. The rockreference material BCR-1 gives [Li] = 12.6 ± 0.6 ppm(n = 2 runs) and GEOREM preferred value is [Li] = 13 ±1 ppm. Typical uncertainty of concentration determinedin this way was previously established to be ±10% (1r,Teng et al., 2006b).
Trace-element abundances were measured using an Ele-ment 2 ICP-MS in the Geochemistry Lab, University ofMaryland. The digestion procedures were the same as forLi measurements. Final sample solutions were diluted2000 times in 2% HNO3. An indium spike (3 ppb) wasintroduced to the solutions in order to monitor and correctfor signal drift. BHVO-1 served as our calibration standardafter applying a blank correction. BHVO-1 analyzed as un-knowns during our analyses return concentration within10% uncertainty of preferred values (Table 1).
Strontium and Nd were separated from sample solutionsprepared for Li chemistry. Cation exchange column separa-tion was performed in three steps. Strontium and REE cutswere collected by eluting with 2.5 N HCl and 6.0 N HClthrough the column filled with AG 50W-X12 (200–400)mesh resin. Separation of Nd from other REE was donein another column filled with the same resins. The columnwas eluted with 0.15 N HCl and 0.25 N HCl first, followedby 0.34 N HCl for Nd cuts. The Sr cut purification was per-formed using Eichrom Sr-Spec resin in order to remove anyremaining Rb (Rb in Sr cut 6 0.2%, Aulbach et al., 2008).Strontium was measured at the University of Marylandby VG Sector 54 TIMS in dynamic collection mode afterloading cuts onto Re filaments, and using 87Sr/86Sr of0.1194 for mass fractionation correction. The average valueof multiple analyses of SRM987 determined during thecourse of this study is 0.710258 ± 32 (2r, n = 4) relativeto the recommended value of 0.71025. Neodymium isotopeswere measured using a Nu plasma MC-ICP-MS with anApex nebulizer in the Geochemistry Laboratory, Universityof Maryland, following the method described by Aulbachet al. (2008). Multiple 143Nd/144Nd analyses of AMES Ndstandard averaged 0.512175 ± 18 (2r, n = 5); rock stan-dards and samples were normalized to a 143Nd/144Nd forAMES of 0.512138 (Aulbach et al., 2008). Using this meth-od, a single analysis of BHVO-1 yielded 0.513048 ± 28 (2r).
4. RESULTS
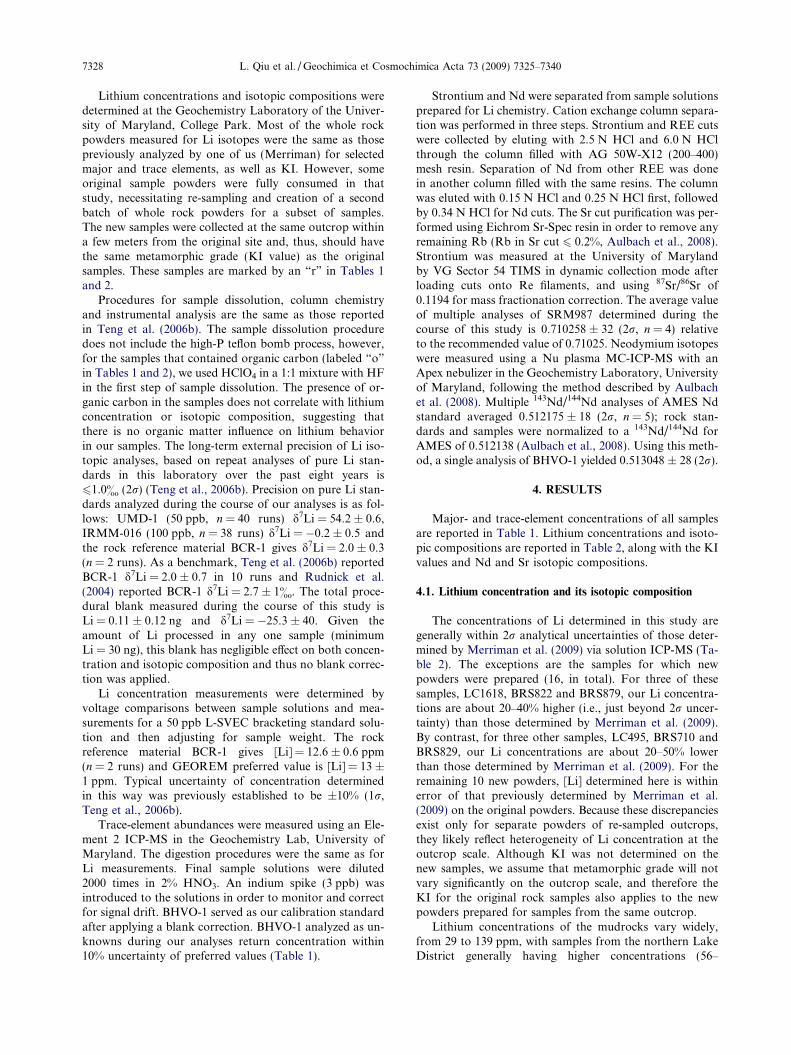
Major- and trace-element concentrations of all samplesare reported in Table 1. Lithium concentrations and isoto-pic compositions are reported in Table 2, along with the KIvalues and Nd and Sr isotopic compositions.
4.1. Lithium concentration and its isotopic composition
The concentrations of Li determined in this study aregenerally within 2r analytical uncertainties of those deter-mined by Merriman et al. (2009) via solution ICP-MS (Ta-ble 2). The exceptions are the samples for which newpowders were prepared (16, in total). For three of thesesamples, LC1618, BRS822 and BRS879, our Li concentra-tions are about 20–40% higher (i.e., just beyond 2r uncer-tainty) than those determined by Merriman et al. (2009).By contrast, for three other samples, LC495, BRS710 andBRS829, our Li concentrations are about 20–50% lowerthan those determined by Merriman et al. (2009). For theremaining 10 new powders, [Li] determined here is withinerror of that previously determined by Merriman et al.(2009) on the original powders. Because these discrepanciesexist only for separate powders of re-sampled outcrops,they likely reflect heterogeneity of Li concentration at theoutcrop scale. Although KI was not determined on thenew samples, we assume that metamorphic grade will notvary significantly on the outcrop scale, and therefore theKI for the original rock samples also applies to the newpowders prepared for samples from the same outcrop.
Lithium concentrations of the mudrocks vary widely,from 29 to 139 ppm, with samples from the northern LakeDistrict generally having higher concentrations (56–
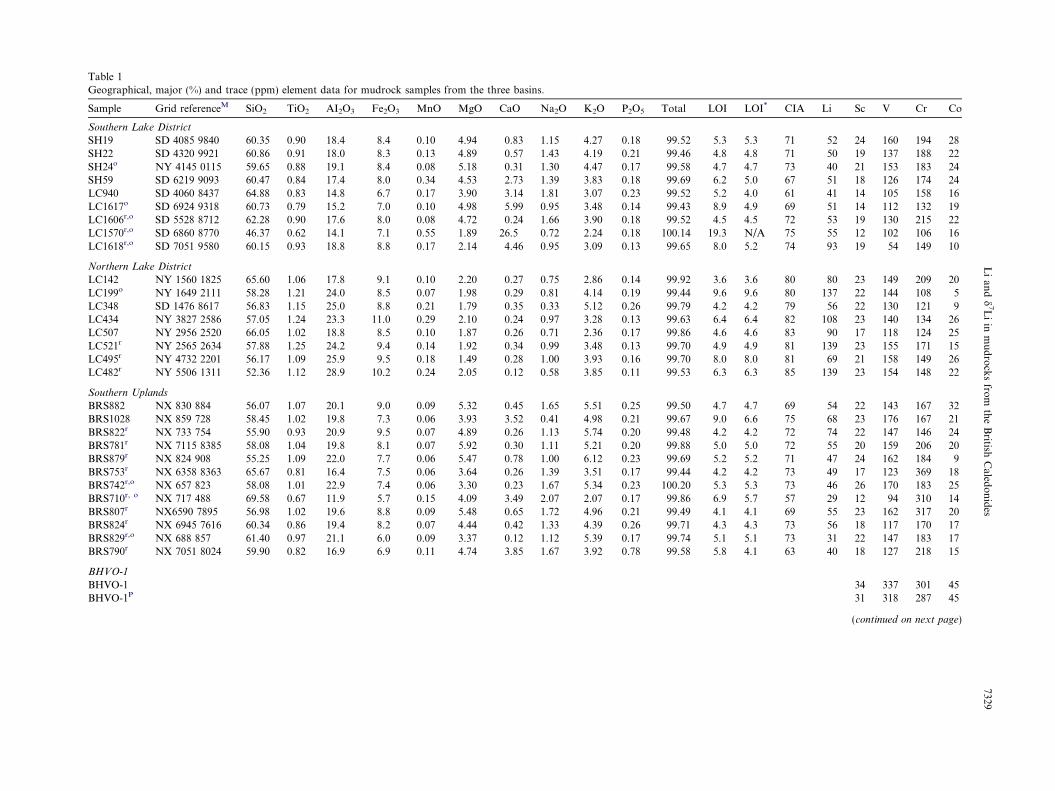
Table 1Geographical, major (%) and trace (ppm) element data for mudrock samples from the three basins.
Sample Grid referenceM SiO2 TiO2 AI2O3 Fe2O3 MnO MgO CaO Na2O K2O P2O5 Total OI LOI* CIA Li Sc V Cr Co
Southern Lake District
SH19 SD 4085 9840 60.35 0.90 18.4 8.4 0.10 4.94 0.83 1.15 4.27 0.18 99.52 5.3 5.3 71 52 24 160 194 28SH22 SD 4320 9921 60.86 0.91 18.0 8.3 0.13 4.89 0.57 1.43 4.19 0.21 99.46 4.8 4.8 71 50 19 137 188 22SH24o NY 4145 0115 59.65 0.88 19.1 8.4 0.08 5.18 0.31 1.30 4.47 0.17 99.58 4.7 4.7 73 40 21 153 183 24SH59 SD 6219 9093 60.47 0.84 17.4 8.0 0.34 4.53 2.73 1.39 3.83 0.18 99.69 6.2 5.0 67 51 18 126 174 24LC940 SD 4060 8437 64.88 0.83 14.8 6.7 0.17 3.90 3.14 1.81 3.07 0.23 99.52 5.2 4.0 61 41 14 105 158 16LC1617o SD 6924 9318 60.73 0.79 15.2 7.0 0.10 4.98 5.99 0.95 3.48 0.14 99.43 8.9 4.9 69 51 14 112 132 19LC1606r,o SD 5528 8712 62.28 0.90 17.6 8.0 0.08 4.72 0.24 1.66 3.90 0.18 99.52 4.5 4.5 72 53 19 130 215 22LC1570r,o SD 6860 8770 46.37 0.62 14.1 7.1 0.55 1.89 26.5 0.72 2.24 0.18 100.14 9.3 N/A 75 55 12 102 106 16LC1618r,o SD 7051 9580 60.15 0.93 18.8 8.8 0.17 2.14 4.46 0.95 3.09 0.13 99.65 8.0 5.2 74 93 19 54 149 10
Northern Lake District
LC142 NY 1560 1825 65.60 1.06 17.8 9.1 0.10 2.20 0.27 0.75 2.86 0.14 99.92 3.6 3.6 80 80 23 149 209 20LC199o NY 1649 2111 58.28 1.21 24.0 8.5 0.07 1.98 0.29 0.81 4.14 0.19 99.44 9.6 9.6 80 137 22 144 108 5LC348 SD 1476 8617 56.83 1.15 25.0 8.8 0.21 1.79 0.35 0.33 5.12 0.26 99.79 4.2 4.2 79 56 22 130 121 9LC434 NY 3827 2586 57.05 1.24 23.3 11.0 0.29 2.10 0.24 0.97 3.28 0.13 99.63 6.4 6.4 82 108 23 140 134 26LC507 NY 2956 2520 66.05 1.02 18.8 8.5 0.10 1.87 0.26 0.71 2.36 0.17 99.86 4.6 4.6 83 90 17 118 124 25LC521r NY 2565 2634 57.88 1.25 24.2 9.4 0.14 1.92 0.34 0.99 3.48 0.13 99.70 4.9 4.9 81 139 23 155 171 15LC495r NY 4732 2201 56.17 1.09 25.9 9.5 0.18 1.49 0.28 1.00 3.93 0.16 99.70 8.0 8.0 81 69 21 158 149 26LC482r NY 5506 1311 52.36 1.12 28.9 10.2 0.24 2.05 0.12 0.58 3.85 0.11 99.53 6.3 6.3 85 139 23 154 148 22
Southern Uplands
BRS882 NX 830 884 56.07 1.07 20.1 9.0 0.09 5.32 0.45 1.65 5.51 0.25 99.50 4.7 4.7 69 54 22 143 167 32BRS1028 NX 859 728 58.45 1.02 19.8 7.3 0.06 3.93 3.52 0.41 4.98 0.21 99.67 9.0 6.6 75 68 23 176 167 21BRS822r NX 733 754 55.90 0.93 20.9 9.5 0.07 4.89 0.26 1.13 5.74 0.20 99.48 4.2 4.2 72 74 22 147 146 24BRS781r NX 7115 8385 58.08 1.04 19.8 8.1 0.07 5.92 0.30 1.11 5.21 0.20 99.88 5.0 5.0 72 55 20 159 206 20BRS879r NX 824 908 55.25 1.09 22.0 7.7 0.06 5.47 0.78 1.00 6.12 0.23 99.69 5.2 5.2 71 47 24 162 184 9BRS753r NX 6358 8363 65.67 0.81 16.4 7.5 0.06 3.64 0.26 1.39 3.51 0.17 99.44 4.2 4.2 73 49 17 123 369 18BRS742r,o NX 657 823 58.08 1.01 22.9 7.4 0.06 3.30 0.23 1.67 5.34 0.23 100.20 5.3 5.3 73 46 26 170 183 25BRS710r, o NX 717 488 69.58 0.67 11.9 5.7 0.15 4.09 3.49 2.07 2.07 0.17 99.86 6.9 5.7 57 29 12 94 310 14BRS807r NX6590 7895 56.98 1.02 19.6 8.8 0.09 5.48 0.65 1.72 4.96 0.21 99.49 4.1 4.1 69 55 23 162 317 20BRS824r NX 6945 7616 60.34 0.86 19.4 8.2 0.07 4.44 0.42 1.33 4.39 0.26 99.71 4.3 4.3 73 56 18 117 170 17BRS829r,o NX 688 857 61.40 0.97 21.1 6.0 0.09 3.37 0.12 1.12 5.39 0.17 99.74 5.1 5.1 73 31 22 147 183 17BRS790r NX 7051 8024 59.90 0.82 16.9 6.9 0.11 4.74 3.85 1.67 3.92 0.78 99.58 5.8 4.1 63 40 18 127 218 15
BHVO-1
BHVO-1 34 337 301 45BHVO-1P 31 318 287 45
(continued on next page)
Li
and
d7L
iin
mu
dro
cks
from
the
British
Caled
on
ides
7329
L
1
Table 1 (continued)
Ni Cu Y Zr La Ce Pr Nd Sm Eu Gd Tb Dy Ho Er Tm Yb Lu Pb Th U Th/U Th/La Th/Sc (La/Yb)n
101 38 25 159 49 101 12 44 8.1 1.7 7.2 1.1 5.0 1.0 3.0 0.42 2.9 0.42 49 14 3.2 4.5 0.29 0.61 11.780 31 27 157 42 83 10 38 7.1 1.5 6.2 1.0 5.0 1.0 3.0 0.41 2.7 0.38 12 11 2.7 4.2 0.28 0.61 10.696 50 17 142 12 25 4 14 3.1 0.8 3.1 0.5 3.2 0.7 2.2 0.36 2.5 0.38 23 12 2.9 4.2 1.0 0.58 3.277 37 26 157 37 77 9 34 6.5 1.4 6.3 0.9 4.8 0.9 2.9 0.41 2.7 0.38 21 11 2.5 4.3 0.29 0.59 9.462 30 30 173 42 87 10 39 7.4 1.6 6.8 1.0 5.5 1.1 3.1 0.43 2.8 0.40 23 11 2.6 4.4 0.27 0.77 10.256 44 24 133 35 75 9 33 6.2 1.3 5.8 0.9 4.5 0.9 2.7 0.38 2.5 0.36 50 10 2.9 3.4 0.29 0.71 9.590 48 24 158 40 86 10 35 6.3 1.2 5.9 0.8 4.6 0.9 2.7 0.42 2.7 0.40 11 13 3.4 3.7 0.31 0.68 10.282 14 25 73 39 73 9 34 6.7 1.3 6.6 0.9 4.7 0.9 2.6 0.34 2.2 0.31 19 9 1.7 5.4 0.23 0.74 11.864 74 26 129 43 84 10 38 6.4 1.2 6.0 0.9 4.3 0.9 2.7 0.37 2.5 0.36 89 13 2.2 5.8 0.30 0.67 11.7
48 55 26 88 47 102 12 44 8.7 1.9 9.5 1.1 5.7 1.1 3.2 0.47 3.2 0.48 157 15 2.8 5.2 0.31 0.64 9.921 11 26 142 49 100 12 44 8.3 1.7 6.8 1.1 5.4 1.0 3.0 0.41 2.7 0.40 57 16 2.8 5.7 0.33 0.73 12.240 6 33 134 57 108 13 47 8.9 1.9 9.0 1.3 6.3 1.2 3.6 0.48 3.1 0.44 5 18 2.8 6.4 0.31 0.80 12.251 38 27 154 49 97 11 39 6.9 1.5 5.7 0.9 4.9 1.0 3.1 0.44 2.9 0.42 14 14 2.4 5.9 0.29 0.63 11.548 28 22 165 43 88 10 35 6.2 1.4 5.7 0.8 4.2 0.8 2.5 0.35 2.4 0.35 14 14 2.3 5.9 0.32 0.80 12.240 21 26 134 46 97 11 41 7.8 1.7 7.4 1.1 5.1 1.0 3.0 0.41 2.7 0.40 27 15 2.5 6.2 0.33 0.66 11.550 4 33 133 67 136 15 53 9.8 2.1 9.1 1.2 6.3 1.2 3.6 0.50 3.2 0.45 9 20 2.8 7.0 0.29 0.92 14.351 22 29 117 67 132 14 51 8.7 1.8 7.3 1.1 5.6 1.1 3.2 0.45 2.9 0.41 23 20 3.0 6.7 0.29 0.86 15.9
83 9 43 223 44 94 11 40 7.6 1.9 7.6 1.2 7.4 1.5 4.3 0.62 3.9 0.57 11 15 3.1 4.9 0.34 0.67 7.677 54 29 165 40 83 10 35 6.6 1.4 6.1 1.0 5.3 1.1 3.2 0.47 3.1 0.45 17 14 3.1 4.3 0.34 0.58 9.0
100 35 40 216 92 153 18 64 11.4 2.6 11.3 1.6 7.8 1.5 4.3 0.59 3.7 0.53 29 14 3.1 4.7 0.16 0.64 16.892 33 33 287 53 105 13 46 7.5 1.7 6.8 1.1 5.7 1.2 3.8 0.56 3.8 0.56 6 11 3.5 3.3 0.22 0.58 9.650 27 29 201 5 16 2 11 3.7 1.1 4.0 0.7 5.1 1.1 3.1 0.50 3.2 0.48 11 14 3.5 3.9 2.7 0.55 1.1
124 36 23 146 36 76 9 32 5.9 1.3 6.0 0.8 4.4 0.9 2.5 0.35 2.3 0.34 29 10 2.9 3.4 0.28 0.57 10.596 91 25 193 43 87 10 36 6.5 1.6 5.9 0.9 4.6 0.9 2.9 0.41 2.7 0.40 20 12 3.2 3.9 0.29 0.48 10.8
107 11 20 53 32 62 7 27 5.2 1.2 5.2 0.7 3.8 0.7 2.2 0.30 1.9 0.28 11 7 1.7 4.3 0.22 0.62 11.4120 241 18 159 18 40 5 19 3.7 1.0 3.7 0.6 3.2 0.7 2.2 0.35 2.4 0.36 11 12 3.1 3.9 0.65 0.53 5.177 4 28 164 49 104 12 47 9.2 1.8 7.9 1.1 5.5 1.0 3.0 0.41 2.7 0.40 6 12 2.7 4.5 0.25 0.68 12.366 130 32 166 47 88 11 41 7.6 1.7 7.7 1.1 5.7 1.1 3.2 0.45 2.9 0.41 5 12 2.4 5.1 0.26 0.55 11.1
125 46 28 165 48 80 11 41 7.3 1.7 7.3 1.0 5.0 1.0 3.1 0.44 2.9 0.43 723 10 2.5 4.1 0.21 0.56 11.2
126 152 27 184 16 39 5.6 26 6.4 2.2 6.8 1.0 5.6 1.0 2.7 0.3 2.1 0.29 2.6 1.1 0.4118 137 26 174 16 38 5.4 25 6.1 2.1 6.3 1.0 5.3 1.0 2.6 0.3 2.0 0.27 2.4 1.2 0.4
n: chondrite normalized (Sun and McDonough, 1989).M Merriman et al. (2009).* Corrected by removing CO2 content, see text for details.r Re-sample from the original sample of Merriman et al. (2009).o Sample with organic carbon.P Preferred values from GEOREM; URL: http://georem.mpch-mainz.gwdg.de/.
7330L
.Q
iuet
al./G
eoch
imica
etC
osm
och
imica
Acta
73(2009)
7325–7340
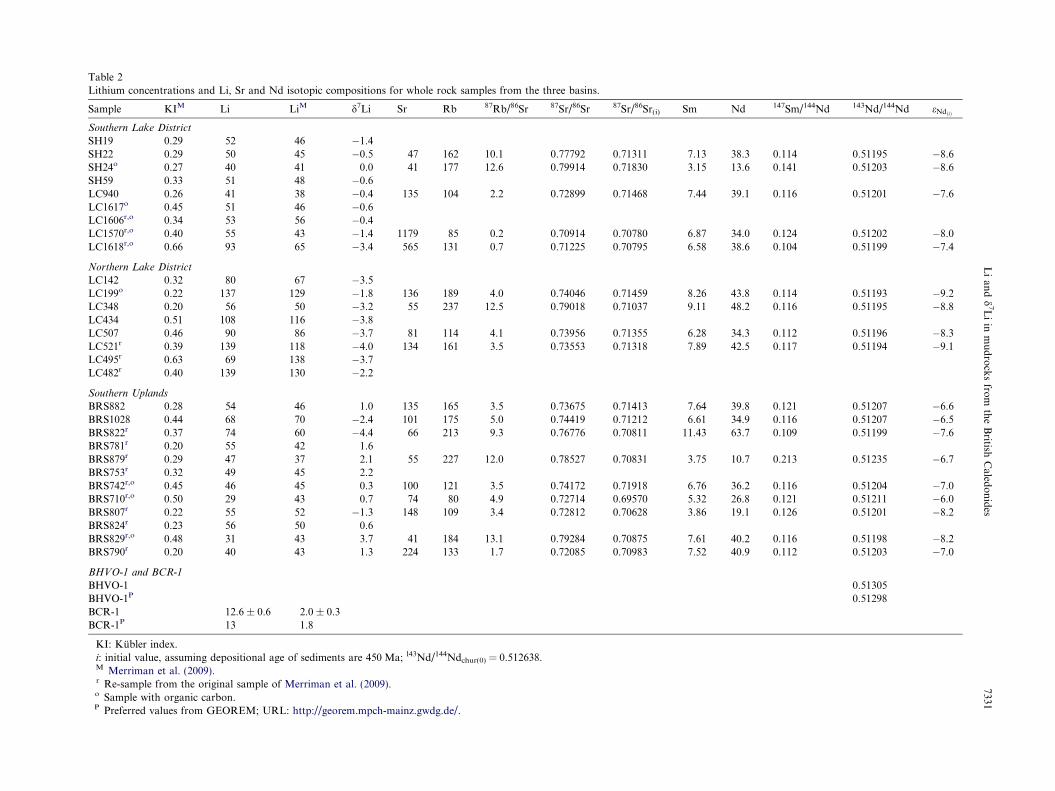
Table 2Lithium concentrations and Li, Sr and Nd isotopic compositions for whole rock samples from the three basins.
Sample KIM Li LiM d7Li Sr Rb 87Rb/86Sr 87Sr/86Sr 87Sr/86Sr(i) Sm Nd 147Sm/144Nd 143Nd/144Nd eNdðiÞ
Southern Lake District
SH19 0.29 52 46 �1.4SH22 0.29 50 45 �0.5 47 162 10.1 0.77792 0.71311 7.13 38.3 0.114 0.51195 �8.6SH24o 0.27 40 41 0.0 41 177 12.6 0.79914 0.71830 3.15 13.6 0.141 0.51203 �8.6SH59 0.33 51 48 �0.6LC940 0.26 41 38 �0.4 135 104 2.2 0.72899 0.71468 7.44 39.1 0.116 0.51201 �7.6LC1617o 0.45 51 46 �0.6LC1606r,o 0.34 53 56 �0.4LC1570r,o 0.40 55 43 �1.4 1179 85 0.2 0.70914 0.70780 6.87 34.0 0.124 0.51202 �8.0LC1618r,o 0.66 93 65 �3.4 565 131 0.7 0.71225 0.70795 6.58 38.6 0.104 0.51199 �7.4
Northern Lake District
LC142 0.32 80 67 �3.5LC199o 0.22 137 129 �1.8 136 189 4.0 0.74046 0.71459 8.26 43.8 0.114 0.51193 �9.2LC348 0.20 56 50 �3.2 55 237 12.5 0.79018 0.71037 9.11 48.2 0.116 0.51195 �8.8LC434 0.51 108 116 �3.8LC507 0.46 90 86 �3.7 81 114 4.1 0.73956 0.71355 6.28 34.3 0.112 0.51196 �8.3LC521r 0.39 139 118 �4.0 134 161 3.5 0.73553 0.71318 7.89 42.5 0.117 0.51194 �9.1LC495r 0.63 69 138 �3.7LC482r 0.40 139 130 �2.2
Southern Uplands
BRS882 0.28 54 46 1.0 135 165 3.5 0.73675 0.71413 7.64 39.8 0.121 0.51207 �6.6BRS1028 0.44 68 70 �2.4 101 175 5.0 0.74419 0.71212 6.61 34.9 0.116 0.51207 �6.5BRS822r 0.37 74 60 �4.4 66 213 9.3 0.76776 0.70811 11.43 63.7 0.109 0.51199 �7.6BRS781r 0.20 55 42 1.6BRS879r 0.29 47 37 2.1 55 227 12.0 0.78527 0.70831 3.75 10.7 0.213 0.51235 �6.7BRS753r 0.32 49 45 2.2BRS742r,o 0.45 46 45 0.3 100 121 3.5 0.74172 0.71918 6.76 36.2 0.116 0.51204 �7.0BRS710r,o 0.50 29 43 0.7 74 80 4.9 0.72714 0.69570 5.32 26.8 0.121 0.51211 �6.0BRS807r 0.22 55 52 �1.3 148 109 3.4 0.72812 0.70628 3.86 19.1 0.126 0.51201 �8.2BRS824r 0.23 56 50 0.6BRS829r,o 0.48 31 43 3.7 41 184 13.1 0.79284 0.70875 7.61 40.2 0.116 0.51198 �8.2BRS790r 0.20 40 43 1.3 224 133 1.7 0.72085 0.70983 7.52 40.9 0.112 0.51203 �7.0
BHVO-1 and BCR-1
BHVO-1 0.51305BHVO-1P 0.51298BCR-1 12.6 ± 0.6 2.0 ± 0.3BCR-1P 13 1.8
KI: Kubler index.i: initial value, assuming depositional age of sediments are 450 Ma; l43Nd/144Ndchur(0) = 0.512638.M Merriman et al. (2009).r Re-sample from the original sample of Merriman et al. (2009).o Sample with organic carbon.P Preferred values from GEOREM; URL: http://georem.mpch-mainz.gwdg.de/.
Li
and
d7L
iin
mu
dro
cks
from
the
British
Caled
on
ides
7331
a
7332 L. Qiu et al. / Geochimica et Cosmochimica Acta 73 (2009) 7325–7340
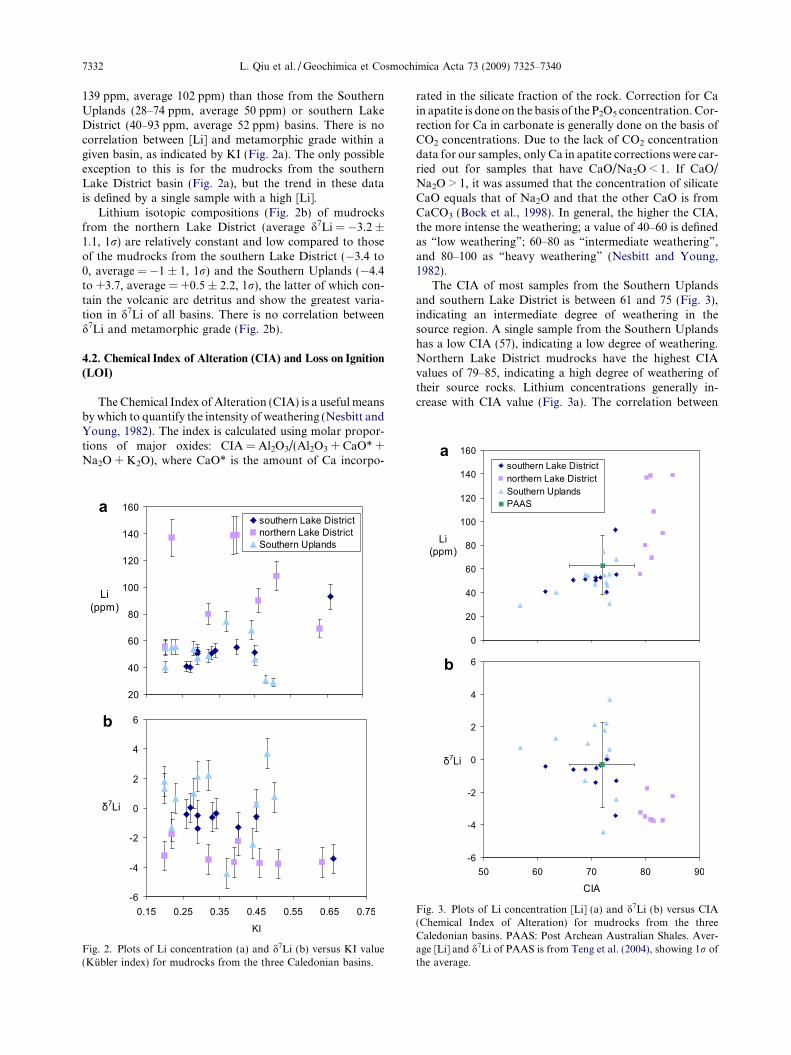
139 ppm, average 102 ppm) than those from the SouthernUplands (28–74 ppm, average 50 ppm) or southern LakeDistrict (40–93 ppm, average 52 ppm) basins. There is nocorrelation between [Li] and metamorphic grade within agiven basin, as indicated by KI (Fig. 2a). The only possibleexception to this is for the mudrocks from the southernLake District basin (Fig. 2a), but the trend in these datais defined by a single sample with a high [Li].
Lithium isotopic compositions (Fig. 2b) of mudrocksfrom the northern Lake District (average d7Li = �3.2 ±1.1, 1r) are relatively constant and low compared to thoseof the mudrocks from the southern Lake District (�3.4 to0, average = �1 ± 1, 1r) and the Southern Uplands (�4.4to +3.7, average = +0.5 ± 2.2, 1r), the latter of which con-tain the volcanic arc detritus and show the greatest varia-tion in d7Li of all basins. There is no correlation betweend7Li and metamorphic grade (Fig. 2b).
4.2. Chemical Index of Alteration (CIA) and Loss on Ignition
(LOI)
The Chemical Index of Alteration (CIA) is a useful meansby which to quantify the intensity of weathering (Nesbitt andYoung, 1982). The index is calculated using molar propor-tions of major oxides: CIA = Al2O3/(Al2O3 + CaO* +Na2O + K2O), where CaO* is the amount of Ca incorpo-
b
a
Fig. 2. Plots of Li concentration (a) and d7Li (b) versus KI value(Kubler index) for mudrocks from the three Caledonian basins.
rated in the silicate fraction of the rock. Correction for Cain apatite is done on the basis of the P2O5 concentration. Cor-rection for Ca in carbonate is generally done on the basis ofCO2 concentrations. Due to the lack of CO2 concentrationdata for our samples, only Ca in apatite corrections were car-ried out for samples that have CaO/Na2O < 1. If CaO/Na2O > 1, it was assumed that the concentration of silicateCaO equals that of Na2O and that the other CaO is fromCaCO3 (Bock et al., 1998). In general, the higher the CIA,the more intense the weathering; a value of 40–60 is definedas “low weathering”; 60–80 as “intermediate weathering”,and 80–100 as “heavy weathering” (Nesbitt and Young,1982).
The CIA of most samples from the Southern Uplandsand southern Lake District is between 61 and 75 (Fig. 3),indicating an intermediate degree of weathering in thesource region. A single sample from the Southern Uplandshas a low CIA (57), indicating a low degree of weathering.Northern Lake District mudrocks have the highest CIAvalues of 79–85, indicating a high degree of weathering oftheir source rocks. Lithium concentrations generally in-crease with CIA value (Fig. 3a). The correlation between
b
Fig. 3. Plots of Li concentration [Li] (a) and d7Li (b) versus CIA(Chemical Index of Alteration) for mudrocks from the threeCaledonian basins. PAAS: Post Archean Australian Shales. Aver-age [Li] and d7Li of PAAS is from Teng et al. (2004), showing 1r ofthe average.
Li and d7Li in mudrocks from the British Caledonides 7333
d7Li and CIA is not strong, though mudrocks with thehighest CIA values generally have the lowest d7Li (Fig. 3b).
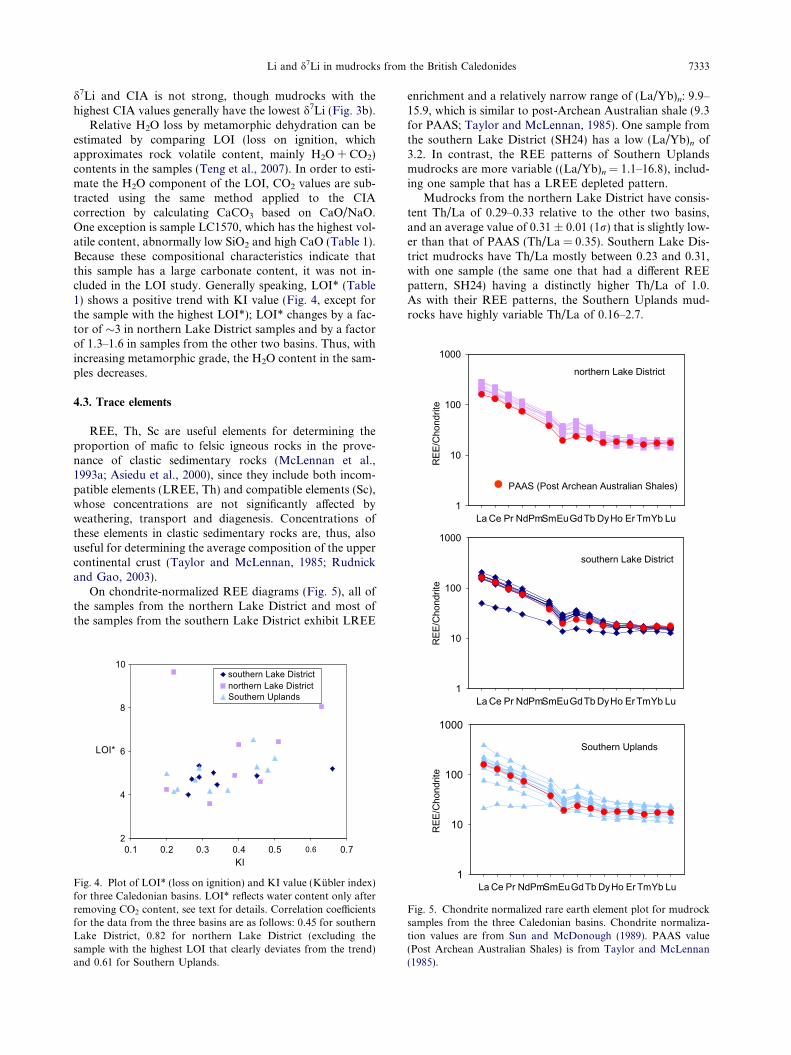
Relative H2O loss by metamorphic dehydration can beestimated by comparing LOI (loss on ignition, whichapproximates rock volatile content, mainly H2O + CO2)contents in the samples (Teng et al., 2007). In order to esti-mate the H2O component of the LOI, CO2 values are sub-tracted using the same method applied to the CIAcorrection by calculating CaCO3 based on CaO/NaO.One exception is sample LC1570, which has the highest vol-atile content, abnormally low SiO2 and high CaO (Table 1).Because these compositional characteristics indicate thatthis sample has a large carbonate content, it was not in-cluded in the LOI study. Generally speaking, LOI* (Table1) shows a positive trend with KI value (Fig. 4, except forthe sample with the highest LOI*); LOI* changes by a fac-tor of �3 in northern Lake District samples and by a factorof 1.3–1.6 in samples from the other two basins. Thus, withincreasing metamorphic grade, the H2O content in the sam-ples decreases.
4.3. Trace elements
REE, Th, Sc are useful elements for determining theproportion of mafic to felsic igneous rocks in the prove-nance of clastic sedimentary rocks (McLennan et al.,1993a; Asiedu et al., 2000), since they include both incom-patible elements (LREE, Th) and compatible elements (Sc),whose concentrations are not significantly affected byweathering, transport and diagenesis. Concentrations ofthese elements in clastic sedimentary rocks are, thus, alsouseful for determining the average composition of the uppercontinental crust (Taylor and McLennan, 1985; Rudnickand Gao, 2003).
On chondrite-normalized REE diagrams (Fig. 5), all ofthe samples from the northern Lake District and most ofthe samples from the southern Lake District exhibit LREE
Fig. 4. Plot of LOI* (loss on ignition) and KI value (Kubler index)for three Caledonian basins. LOI* reflects water content only afterremoving CO2 content, see text for details. Correlation coefficientsfor the data from the three basins are as follows: 0.45 for southernLake District, 0.82 for northern Lake District (excluding thesample with the highest LOI that clearly deviates from the trend)and 0.61 for Southern Uplands.
enrichment and a relatively narrow range of (La/Yb)n: 9.9–15.9, which is similar to post-Archean Australian shale (9.3for PAAS; Taylor and McLennan, 1985). One sample fromthe southern Lake District (SH24) has a low (La/Yb)n of3.2. In contrast, the REE patterns of Southern Uplandsmudrocks are more variable ((La/Yb)n = 1.1–16.8), includ-ing one sample that has a LREE depleted pattern.
Mudrocks from the northern Lake District have consis-tent Th/La of 0.29–0.33 relative to the other two basins,and an average value of 0.31 ± 0.01 (1r) that is slightly low-er than that of PAAS (Th/La = 0.35). Southern Lake Dis-trict mudrocks have Th/La mostly between 0.23 and 0.31,with one sample (the same one that had a different REEpattern, SH24) having a distinctly higher Th/La of 1.0.As with their REE patterns, the Southern Uplands mud-rocks have highly variable Th/La of 0.16–2.7.
Fig. 5. Chondrite normalized rare earth element plot for mudrocksamples from the three Caledonian basins. Chondrite normaliza-tion values are from Sun and McDonough (1989). PAAS value(Post Archean Australian Shales) is from Taylor and McLennan(1985).
7334 L. Qiu et al. / Geochimica et Cosmochimica Acta 73 (2009) 7325–7340
The Th/Sc ratios of all mudrocks studied here are, ingeneral, lower than that of PAAS. Amongst the differentbasins, the northern Lake District mudrocks have the high-est average Th/Sc (Th/Sc = 0.76 ± 0.11, 1r), which is closerto the value of PAAS (Th/Sc = 0.9) than the average Th/Scof mudrocks from the other two basins (southern Lake Dis-trict: Th/Sc = 0.66 ± 0.07, 1r; Southern Uplands: Th/Sc = 0.58 ± 0.06, 1r).
Th/U ratio can also be an indicator of weathering inten-sity of the sediment source (McLennan et al., 1993a). Mud-rocks from the northern Lake District have higher averageTh/U ratio (6.1 ± 0.6, 1r) than those from the southernLake District (4.4 ± 0.7, 1r) and Southern Uplands(4.2 ± 0.5, 1r).
The ferromagnesian trace elements, Ni and Cr, are gen-erally abundant in mafic and ultramafic rocks relative tofelsic rocks, so their abundance in sedimentary rocks maybe indicative of the provenance of the sediments (McLen-nan et al., 1993b). In the British Caledonides mudrocks,Ni and Cr are positively correlated (Fig. 6), with the north-ern Lake District samples having the lowest average con-centrations (average = 44 and 145 ppm, respectively) andthe Southern Uplands samples having the highest averageconcentrations (93 and 218 ppm, respectively), with thesamples from the southern Lake District falling in between(79 and 166 ppm, respectively).
4.4. Sr and Nd isotopes
Samples chosen for Nd and Sr isotope analyses arerepresentative of the three basins and include samples withsuspected mantle-derived signatures based on their trace-element abundances as well as the presence of volcanicarc detritus; the average [Li] and d7Li of the selected rocksare similar to the average value of all the samples within thebasin. The Nd and Sr isotopic compositions of sedimentsreflects the average provenance age (McCulloch et al.,1987; McLennan et al., 1993b). These mudrocks are marine
Fig. 6. Plot of Ni versus Cr concentration for mudrocks from threeCaledonian basins. The Ni and Cr contents of PAAS are from Taylorand McLennan (1985) and island arc basalts are from Kelemen et al.(2003), standard deviations for these estimates are not available. Themudrock data have a correlation coefficient of 0.70.
sediments deposited during the Ordovician to Silurian. Ini-tial Sr and Nd isotope ratios are therefore calculatedassuming an average depositional age of 450 Ma (Fig. 7).Although the Rb–Sr regression lines (Fig. 8) have a largevariation in MSWD, the ages corresponding to the regres-sion lines range from 423 ± 33 Ma to 494 ± 60 Ma andtherefore the �450 Ma age is consistent with the interpreteddepositional age. Initial eNd values for the three basins (Ta-ble 2) show a general increase from the northern Lake Dis-trict (average = �8.8 ± 0.4, 1r) to southern Lake District(average = �8.0 ± 0.4, 1r) to Southern Uplands (aver-age = �7.0 ± 0.8, 1r).
5. DISCUSSION
5.1. Effects of metamorphism on Li
Lithium is a fluid-mobile element whose partitioningbehavior between fluid and rock (fluid/rockKLi) varies as afunction of temperature; fluid/rockKLi is always greater than1, and increases with increasing temperature (Seyfried et al.,1998). This means that Li concentrations in mudrocks areexpected to decrease with increasing metamorphic grade,since dehydration reactions dominate in metapelites fromsub-greenschist through granulite-facies metamorphism.On the basis of petrologic and thermobarometric studies,Marschall et al. (2007) suggested that, depending on the ini-tial H2O content, between 5% and 40% of the original Lican be lost from rocks during metamorphic dehydration.Teng et al. (2007) showed that about 50% of Li was lostfrom regional chlorite-zone metapelites during contactmetamorphism up to sillimanite zone. The correlation be-tween LOI and KI of our samples (Fig. 4) indicates thatup to 50% of the original H2O has been lost during sub-greenschist-facies metamorphism ranging from diagenesisto epizone (90–300 �C, Hower, 1976; Kisch, 1983; Freyand Robinson, 1999). However, [Li] in the mudrocks(Fig. 2a) does not change systematically over this interval,indicating that Li is not progressively lost under conditionsof sub-greenschist facies metamorphism. Lithium isotopic
Fig. 7. Plot of initial 87Sr/86Sr and initial eNd, assuming that thedepositional age of the sediments is 450 Ma and 143Nd/144Nd chur(0) =0.512638.
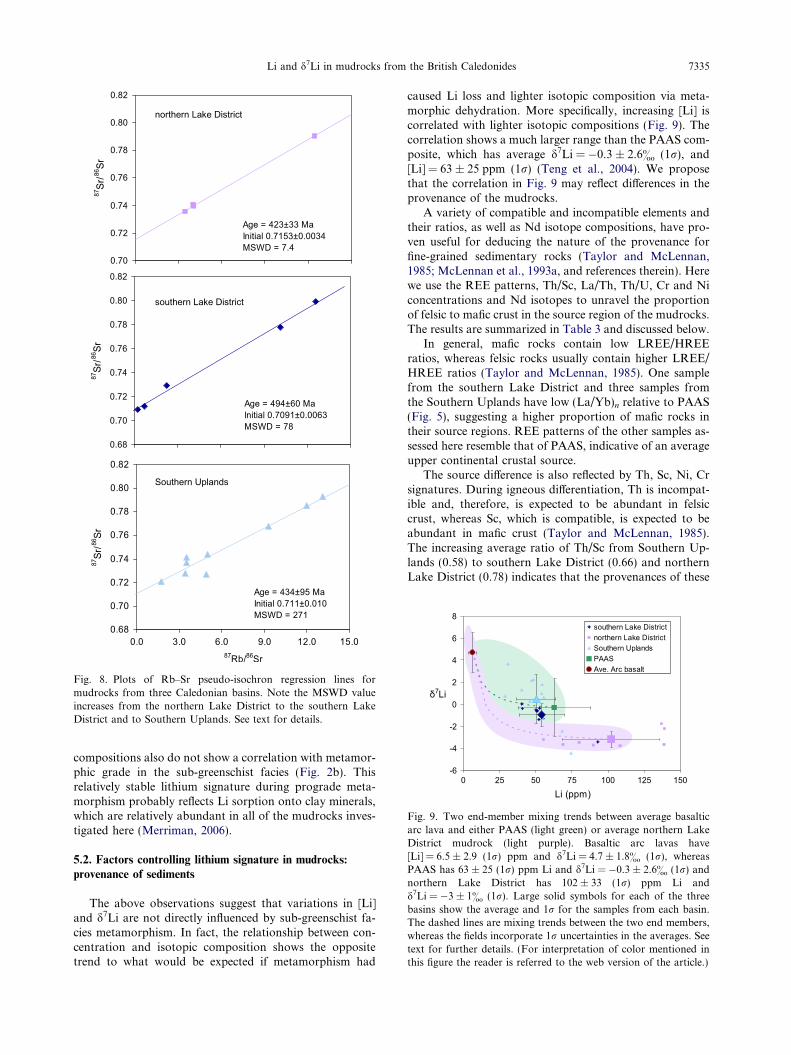
Fig. 8. Plots of Rb–Sr pseudo-isochron regression lines formudrocks from three Caledonian basins. Note the MSWD valueincreases from the northern Lake District to the southern LakeDistrict and to Southern Uplands. See text for details.
Fig. 9. Two end-member mixing trends between average basalticarc lava and either PAAS (light green) or average northern LakeDistrict mudrock (light purple). Basaltic arc lavas have[Li] = 6.5 ± 2.9 (1r) ppm and d7Li = 4.7 ± 1.8& (1r), whereasPAAS has 63 ± 25 (1r) ppm Li and d7Li = �0.3 ± 2.6& (1r) andnorthern Lake District has 102 ± 33 (1r) ppm Li andd7Li = �3 ± 1& (1r). Large solid symbols for each of the threebasins show the average and 1r for the samples from each basin.The dashed lines are mixing trends between the two end members,whereas the fields incorporate 1r uncertainties in the averages. Seetext for further details. (For interpretation of color mentioned inthis figure the reader is referred to the web version of the article.)
Li and d7Li in mudrocks from the British Caledonides 7335
compositions also do not show a correlation with metamor-phic grade in the sub-greenschist facies (Fig. 2b). Thisrelatively stable lithium signature during prograde meta-morphism probably reflects Li sorption onto clay minerals,which are relatively abundant in all of the mudrocks inves-tigated here (Merriman, 2006).
5.2. Factors controlling lithium signature in mudrocks:
provenance of sediments
The above observations suggest that variations in [Li]and d7Li are not directly influenced by sub-greenschist fa-cies metamorphism. In fact, the relationship between con-centration and isotopic composition shows the oppositetrend to what would be expected if metamorphism had
caused Li loss and lighter isotopic composition via meta-morphic dehydration. More specifically, increasing [Li] iscorrelated with lighter isotopic compositions (Fig. 9). Thecorrelation shows a much larger range than the PAAS com-posite, which has average d7Li = �0.3 ± 2.6& (1r), and[Li] = 63 ± 25 ppm (1r) (Teng et al., 2004). We proposethat the correlation in Fig. 9 may reflect differences in theprovenance of the mudrocks.
A variety of compatible and incompatible elements andtheir ratios, as well as Nd isotope compositions, have pro-ven useful for deducing the nature of the provenance forfine-grained sedimentary rocks (Taylor and McLennan,1985; McLennan et al., 1993a, and references therein). Herewe use the REE patterns, Th/Sc, La/Th, Th/U, Cr and Niconcentrations and Nd isotopes to unravel the proportionof felsic to mafic crust in the source region of the mudrocks.The results are summarized in Table 3 and discussed below.
In general, mafic rocks contain low LREE/HREEratios, whereas felsic rocks usually contain higher LREE/HREE ratios (Taylor and McLennan, 1985). One samplefrom the southern Lake District and three samples fromthe Southern Uplands have low (La/Yb)n relative to PAAS(Fig. 5), suggesting a higher proportion of mafic rocks intheir source regions. REE patterns of the other samples as-sessed here resemble that of PAAS, indicative of an averageupper continental crustal source.
The source difference is also reflected by Th, Sc, Ni, Crsignatures. During igneous differentiation, Th is incompat-ible and, therefore, is expected to be abundant in felsiccrust, whereas Sc, which is compatible, is expected to beabundant in mafic crust (Taylor and McLennan, 1985).The increasing average ratio of Th/Sc from Southern Up-lands (0.58) to southern Lake District (0.66) and northernLake District (0.78) indicates that the provenances of these
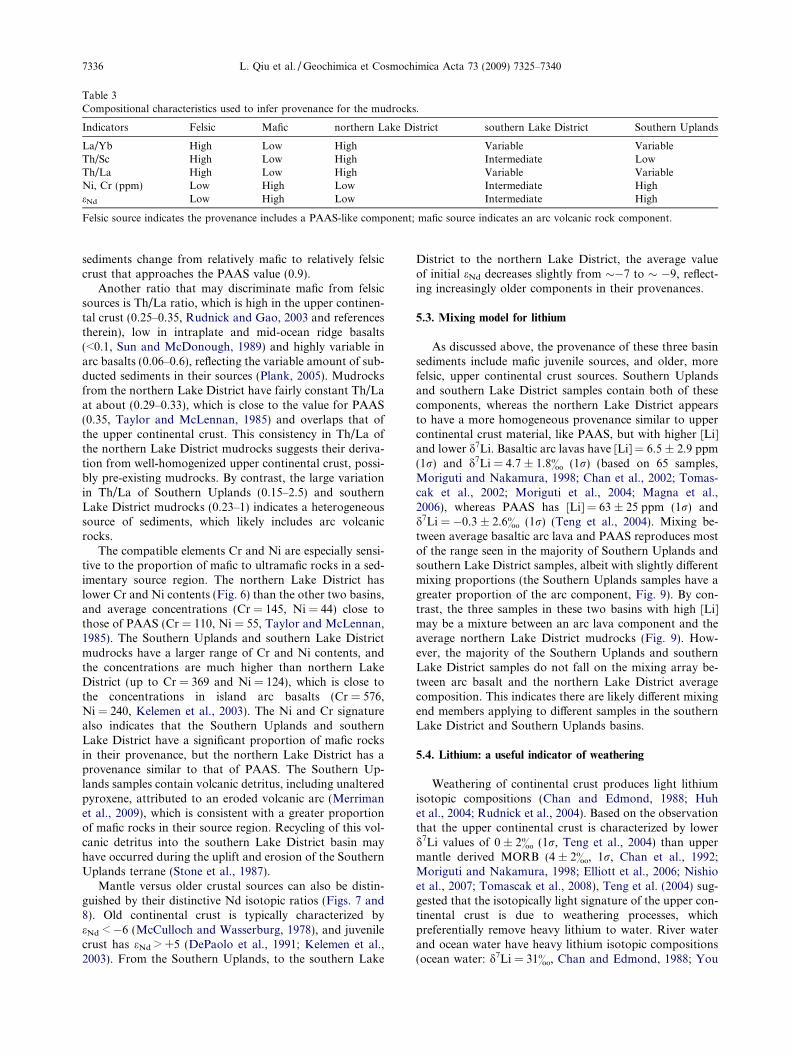
Table 3Compositional characteristics used to infer provenance for the mudrocks.
Indicators Felsic Mafic northern Lake District southern Lake District Southern Uplands
La/Yb High Low High Variable VariableTh/Sc High Low High Intermediate LowTh/La High Low High Variable VariableNi, Cr (ppm) Low High Low Intermediate HigheNd Low High Low Intermediate High
Felsic source indicates the provenance includes a PAAS-like component; mafic source indicates an arc volcanic rock component.
7336 L. Qiu et al. / Geochimica et Cosmochimica Acta 73 (2009) 7325–7340
sediments change from relatively mafic to relatively felsiccrust that approaches the PAAS value (0.9).
Another ratio that may discriminate mafic from felsicsources is Th/La ratio, which is high in the upper continen-tal crust (0.25–0.35, Rudnick and Gao, 2003 and referencestherein), low in intraplate and mid-ocean ridge basalts(<0.1, Sun and McDonough, 1989) and highly variable inarc basalts (0.06–0.6), reflecting the variable amount of sub-ducted sediments in their sources (Plank, 2005). Mudrocksfrom the northern Lake District have fairly constant Th/Laat about (0.29–0.33), which is close to the value for PAAS(0.35, Taylor and McLennan, 1985) and overlaps that ofthe upper continental crust. This consistency in Th/La ofthe northern Lake District mudrocks suggests their deriva-tion from well-homogenized upper continental crust, possi-bly pre-existing mudrocks. By contrast, the large variationin Th/La of Southern Uplands (0.15–2.5) and southernLake District mudrocks (0.23–1) indicates a heterogeneoussource of sediments, which likely includes arc volcanicrocks.
The compatible elements Cr and Ni are especially sensi-tive to the proportion of mafic to ultramafic rocks in a sed-imentary source region. The northern Lake District haslower Cr and Ni contents (Fig. 6) than the other two basins,and average concentrations (Cr = 145, Ni = 44) close tothose of PAAS (Cr = 110, Ni = 55, Taylor and McLennan,1985). The Southern Uplands and southern Lake Districtmudrocks have a larger range of Cr and Ni contents, andthe concentrations are much higher than northern LakeDistrict (up to Cr = 369 and Ni = 124), which is close tothe concentrations in island arc basalts (Cr = 576,Ni = 240, Kelemen et al., 2003). The Ni and Cr signaturealso indicates that the Southern Uplands and southernLake District have a significant proportion of mafic rocksin their provenance, but the northern Lake District has aprovenance similar to that of PAAS. The Southern Up-lands samples contain volcanic detritus, including unalteredpyroxene, attributed to an eroded volcanic arc (Merrimanet al., 2009), which is consistent with a greater proportionof mafic rocks in their source region. Recycling of this vol-canic detritus into the southern Lake District basin mayhave occurred during the uplift and erosion of the SouthernUplands terrane (Stone et al., 1987).
Mantle versus older crustal sources can also be distin-guished by their distinctive Nd isotopic ratios (Figs. 7 and8). Old continental crust is typically characterized byeNd < �6 (McCulloch and Wasserburg, 1978), and juvenilecrust has eNd > +5 (DePaolo et al., 1991; Kelemen et al.,2003). From the Southern Uplands, to the southern Lake
District to the northern Lake District, the average valueof initial eNd decreases slightly from ��7 to � �9, reflect-ing increasingly older components in their provenances.
5.3. Mixing model for lithium
As discussed above, the provenance of these three basinsediments include mafic juvenile sources, and older, morefelsic, upper continental crust sources. Southern Uplandsand southern Lake District samples contain both of thesecomponents, whereas the northern Lake District appearsto have a more homogeneous provenance similar to uppercontinental crust material, like PAAS, but with higher [Li]and lower d7Li. Basaltic arc lavas have [Li] = 6.5 ± 2.9 ppm(1r) and d7Li = 4.7 ± 1.8& (1r) (based on 65 samples,Moriguti and Nakamura, 1998; Chan et al., 2002; Tomas-cak et al., 2002; Moriguti et al., 2004; Magna et al.,2006), whereas PAAS has [Li] = 63 ± 25 ppm (1r) andd7Li = �0.3 ± 2.6& (1r) (Teng et al., 2004). Mixing be-tween average basaltic arc lava and PAAS reproduces mostof the range seen in the majority of Southern Uplands andsouthern Lake District samples, albeit with slightly differentmixing proportions (the Southern Uplands samples have agreater proportion of the arc component, Fig. 9). By con-trast, the three samples in these two basins with high [Li]may be a mixture between an arc lava component and theaverage northern Lake District mudrocks (Fig. 9). How-ever, the majority of the Southern Uplands and southernLake District samples do not fall on the mixing array be-tween arc basalt and the northern Lake District averagecomposition. This indicates there are likely different mixingend members applying to different samples in the southernLake District and Southern Uplands basins.
5.4. Lithium: a useful indicator of weathering
Weathering of continental crust produces light lithiumisotopic compositions (Chan and Edmond, 1988; Huhet al., 2004; Rudnick et al., 2004). Based on the observationthat the upper continental crust is characterized by lowerd7Li values of 0 ± 2& (1r, Teng et al., 2004) than uppermantle derived MORB (4 ± 2&, 1r, Chan et al., 1992;Moriguti and Nakamura, 1998; Elliott et al., 2006; Nishioet al., 2007; Tomascak et al., 2008), Teng et al. (2004) sug-gested that the isotopically light signature of the upper con-tinental crust is due to weathering processes, whichpreferentially remove heavy lithium to water. River waterand ocean water have heavy lithium isotopic compositions(ocean water: d7Li = 31&, Chan and Edmond, 1988; You
a
b
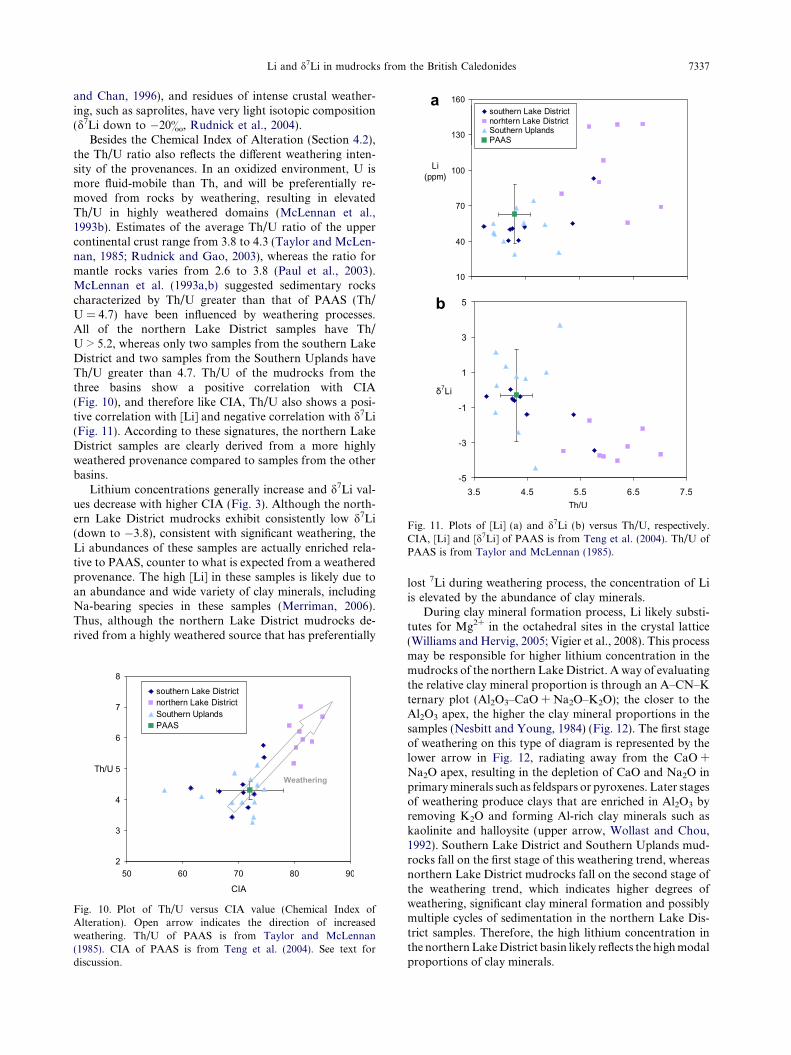
Fig. 11. Plots of [Li] (a) and d7Li (b) versus Th/U, respectively.CIA, [Li] and [d7Li] of PAAS is from Teng et al. (2004). Th/U ofPAAS is from Taylor and McLennan (1985).
Li and d7Li in mudrocks from the British Caledonides 7337
and Chan, 1996), and residues of intense crustal weather-ing, such as saprolites, have very light isotopic composition(d7Li down to �20&, Rudnick et al., 2004).
Besides the Chemical Index of Alteration (Section 4.2),the Th/U ratio also reflects the different weathering inten-sity of the provenances. In an oxidized environment, U ismore fluid-mobile than Th, and will be preferentially re-moved from rocks by weathering, resulting in elevatedTh/U in highly weathered domains (McLennan et al.,1993b). Estimates of the average Th/U ratio of the uppercontinental crust range from 3.8 to 4.3 (Taylor and McLen-nan, 1985; Rudnick and Gao, 2003), whereas the ratio formantle rocks varies from 2.6 to 3.8 (Paul et al., 2003).McLennan et al. (1993a,b) suggested sedimentary rockscharacterized by Th/U greater than that of PAAS (Th/U = 4.7) have been influenced by weathering processes.All of the northern Lake District samples have Th/U > 5.2, whereas only two samples from the southern LakeDistrict and two samples from the Southern Uplands haveTh/U greater than 4.7. Th/U of the mudrocks from thethree basins show a positive correlation with CIA(Fig. 10), and therefore like CIA, Th/U also shows a posi-tive correlation with [Li] and negative correlation with d7Li(Fig. 11). According to these signatures, the northern LakeDistrict samples are clearly derived from a more highlyweathered provenance compared to samples from the otherbasins.
Lithium concentrations generally increase and d7Li val-ues decrease with higher CIA (Fig. 3). Although the north-ern Lake District mudrocks exhibit consistently low d7Li(down to �3.8), consistent with significant weathering, theLi abundances of these samples are actually enriched rela-tive to PAAS, counter to what is expected from a weatheredprovenance. The high [Li] in these samples is likely due toan abundance and wide variety of clay minerals, includingNa-bearing species in these samples (Merriman, 2006).Thus, although the northern Lake District mudrocks de-rived from a highly weathered source that has preferentially
Fig. 10. Plot of Th/U versus CIA value (Chemical Index ofAlteration). Open arrow indicates the direction of increasedweathering. Th/U of PAAS is from Taylor and McLennan(1985). CIA of PAAS is from Teng et al. (2004). See text fordiscussion.
lost 7Li during weathering process, the concentration of Liis elevated by the abundance of clay minerals.
During clay mineral formation process, Li likely substi-tutes for Mg2+ in the octahedral sites in the crystal lattice(Williams and Hervig, 2005; Vigier et al., 2008). This processmay be responsible for higher lithium concentration in themudrocks of the northern Lake District. A way of evaluatingthe relative clay mineral proportion is through an A–CN–Kternary plot (Al2O3–CaO + Na2O–K2O); the closer to theAl2O3 apex, the higher the clay mineral proportions in thesamples (Nesbitt and Young, 1984) (Fig. 12). The first stageof weathering on this type of diagram is represented by thelower arrow in Fig. 12, radiating away from the CaO +Na2O apex, resulting in the depletion of CaO and Na2O inprimary minerals such as feldspars or pyroxenes. Later stagesof weathering produce clays that are enriched in Al2O3 byremoving K2O and forming Al-rich clay minerals such askaolinite and halloysite (upper arrow, Wollast and Chou,1992). Southern Lake District and Southern Uplands mud-rocks fall on the first stage of this weathering trend, whereasnorthern Lake District mudrocks fall on the second stage ofthe weathering trend, which indicates higher degrees ofweathering, significant clay mineral formation and possiblymultiple cycles of sedimentation in the northern Lake Dis-trict samples. Therefore, the high lithium concentration inthe northern Lake District basin likely reflects the high modalproportions of clay minerals.
Fig. 12. The Al2O3–(CaO* + Na2O)–K2O (A–CN–K) ternarydiagram for mudrocks from the three basins (after Nesbitt andYoung, 1984). Open arrows are plotted according to Wollast andChou (1992). See Sections 4.2 and 5.4 for details. Abbreviationsmark position on plot for the following minerals: Pl – plagioclasefeldspar; Sm – smectite; Ms – muscovite; IL – illite; Ka – kaolinite.
7338 L. Qiu et al. / Geochimica et Cosmochimica Acta 73 (2009) 7325–7340
In conclusion, Li isotopic compositions, when combinedwith concentration data, is an indicator of weatheringintensity for pelitic sediments; mudrocks with high Li con-centrations (over 63 ppm, average of PAAS, Teng et al.,2004) but light isotopic compositions (<�3&) likely derivefrom a highly weathered provenance.
6. CONCLUSIONS
Three suites of mudrocks from three lower Paleozoic ba-sins within the British Caledonides exhibit wide variation oflithium concentration and isotopic composition, rangingfrom 29 to 139 ppm and �4.4& to +3.7&, respectively.[Li] and d7Li in the mudrocks do not correlate with sub-greenschist facies metamorphic grade determined by theKubler index, suggesting little impact of low-grade meta-morphism on these variables. CIA values, trace elements,and Nd and Sr isotope data indicate that the provenancesof the sediments control the signature of lithium in thesethree basins. Mudrocks from the Southern Uplands andthe southern Lake District reflect a mixed provenance ofarc lavas and PAAS-like upper continental crust, whereasmudrocks from the northern Lake District are clay-rich, de-rived from a highly weathered, older upper continentalcrust source. The higher [Li] in the mudrocks of the north-ern Lake District reflects the higher proportions and greatervariety of clay minerals in the rocks. Thus, lithium in mud-rocks can be used as an indicator of weathering intensity oftheir source regions.
ACKNOWLEDGMENTS
We thank Richard Ash and Igor Puchtel for their assistance inthe Plasma Lab and Chemistry Clean Lab at the University ofMaryland, College Park, Adam Mansur and Satoshi Saito for helpwith the Sr–Nd isotope method, Darya Slobodyanik for help withtrace element preparations and Casey Soneira for early Li isotopeseparations. We thank Stan Mertzman, Franklin and MarshallCollege for performing the XRF analyses. This work was sup-
ported by NSF Grant EAR 0609689. Lin Qiu was also partiallysupported by a graduate fellowship from the University of Mary-land. Richard Merriman publishes by permission of the Director,British Geological Survey (N.E.R.C.).
REFERENCES
Asiedu D. K., Suzuki S., Nogami K. and Shibata T. (2000)Geochemistry of Lower Cretaceous sediments, Inner Zone ofSouthwest Japan: constraints on provenance and tectonicenvironment. Geochem. J. 34, 155–173.
Aulbach S., Rudnick R. L. and McDonough W. F. (2008) Li–Sr–Nd isotope signatures of the plume and cratonic lithosphericmantle beneath the margin of the rifted Tanzanian Craton(Labait). Contrib. Mineral. Petrol. 155, 79–92.
Beck P., Chaussidon M., Barrat J. A., Gillet P. and Bohn M. (2005)An ion-microprobe study of lithium isotopes behavior innakhlites. Meteorit. Planet. Sci. 40, A18.
Bock B., McLennan S. M. and Hanson G. N. (1998) Geochemistryand provenance of the Middle Ordovician Austin Glen Member(Normanskill Formation) and the Taconian Orogeny in NewEngland. Sedimentology 45, 635–655.
Bouman C., Vroon P. Z. and Elliott T. (2004) Lithium inputs tosubduction zones. Chem. Geol. 212, 59–79.
Bryant C. J., Chappell B. W., Bennett V. C. and McCulloch M. T.(2004) Lithium isotopic compositions of the New EnglandBatholith; correlations with inferred source rock compositions.Trans. R. Soc. Edinburgh Earth Sci. 95, 199–214.
Chan L. H. and Edmond J. M. (1988) Variation of lithium isotopecomposition in the marine-environment – a preliminary-report.Geochim. Cosmochim. Acta 52, 1711–1717.
Chan L. H., Edmond J. M., Thompson G. and Gillis K. (1992)Lithium isotopic composition of submarine basalts – implica-tions for the lithium cycle in the oceans. Earth Planet. Sci. Lett.
108, 151–160.
Chan L. H., Edmond J. M. and Thompson G. (1993) A lithiumisotope study of hot-springs and metabasalts from midoceanridge hydrothermal systems. J. Geophys. Res. Solid Earth 98,
9653–9659.
Chan L. H., Gieskes J. M., You C. F. and Edmond J. M. (1994)Lithium isotope geochemistry of sediments and hydrothermalfluids of the Guaymas Basin, Gulf of California. Geochim.
Cosmochim. Acta 58, 4443–4454.
Chan L. H. and Kastner M. (2000) Lithium isotopic compositionsof pore fluids and sediments in the Costa Rica subduction zone:implications for fluid processes and sediment contribution tothe arc volcanoes. Earth Planet. Sci. Lett. 183, 275–290.
Chan L. H., Leeman W. P. and You C. F. (2002) Lithium isotopiccomposition of Central American volcanic arc lavas: implica-tions for modification of subarc mantle by slab-derived fluids:correction. Chem. Geol. 182, 293–300.
Chan L. H., Leeman W. P. and Plank T. (2006) Lithium isotopiccomposition of marine sediments. Geochem. Geophys. Geosyst.
7. doi:10.1029/2005GC001202.
Cooper A. H., Fortey N. J., Hughes R. A., Molyneux S. G., MooreR. M., Rushton A. W. A. and Stone P. (2004) The SkiddawGroup of the English Lake District. In Memoir of the British
Geological Survey. British Geological Survey, Keyworth, Not-tingham, pp. 110–120.
DePaolo D. J., Linn A. M. and Schubert G. (1991) The continentalcrustal age distribution: methods of determining mantle sepa-ration ages from Sm–Nd isotopic data and application to theSoutheastern United States. J. Geophys. Res. 96, 2071–2088.
Elliott T., Jeffcoate A. and Bouman C. (2004) The terrestrial Liisotope cycle: light-weight constraints on mantle convection.Earth Planet. Sci. Lett. 220, 231–245.
Li and d7Li in mudrocks from the British Caledonides 7339
Elliott T., Thomas A., Jeffcoate A. B. and Niu Y. (2006) Lithiumisotope evidence for subduction-enriched mantle in the sourceof mid-ocean-ridge basalts. Nature (London) 443, 565–568.
Fortey N. J. (1989) Low grade metamorphism in the LowerOrdovician Skiddaw Group of the Lake District, England.Proc. Yorks. Geol. Soc. 47, 325–337.
Frey M. and Robinson D. (1999) Low-Grade Metamorphism.Blackwell Sciences Ltd., Oxford, pp. 313–320.
Halama R., McDonough W. F., Rudnick R. L., Keller J. andKlaudius J. (2007) The Li isotopic composition of OldoinyoLengai: nature of the mantle sources and lack of isotopicfractionation during carbonatite petrogenesis. Earth Planet.
Sci. Lett. 254, 77–89.
Hower J. (1976) The determination of diagenetic and metamorphictemperatures using clay mineral assemblages. Geol. Soc. Am. 8,
201–215.
Huh Y., Chan L. H. and Chadwick O. A. (2004) Behavior oflithium and its isotopes during weathering of Hawaiian basalt.Geochem. Geophys. Geosyst. 5. doi:10.1029/2004GC000729.
James R. H., Allen D. E. and Seyfried W. E. (2003) Anexperimental study of alteration of oceanic crust and terrige-nous sediments at moderate temperatures (51 to 350 degrees C):insights as to chemical processes in near-shore ridge-flankhydrothermal systems. Geochim. Cosmochim. Acta 67, 681–691.
Jeffcoate A. B., Elliott T., Kasemann S. A., Ionov D., Cooper K.and Brooker R. (2007) Li isotope fractionation in peridotitesand mafic melts. Geochim. Cosmochim. Acta 71, 202–218.
Kelemen, P. B., Hanghøj K. and Greene A. R. (2003) One view ofthe geochemistry of subduction-related magmatic arcs with anemphasis on primitive andesite and lower crust. In The Crust
(ed. R. L. Rudnick). In Treatise on Geochemistry, (eds. H. D.Holland and K. K. Turekian). Elsevier-Pergamon, Oxford, pp.593–659.
Kisakurek B., Widdowson M. and James R. H. (2004) Behaviourof Li isotopes during continental weathering: the Bidar lateriteprofile, India. Chem. Geol. 212, 27–44.
Kisch H. J. (1983) Mineralogy and petrology of burial diagenesis(burial metamorphism) and incipient metamorphism in clasticrocks. In Diagenesis in Sediments and Sedimentary Rocks (eds.G. Larsen and G. V. Chilingar). Elsevier, New York, pp. 213–
289.
Kneller B. C. (1991) A foreland basin on the southern margin ofIapetus. J. Geol. Soc. Lond. 148, 207–210.
Leggett J. K., Mckerrow W. S. and Eales M. H. (1979) SouthernUplands of Scotland – lower Paleozoic accretionary prism. J.
Geol. Soc. Lond. 136, 755–770.
Lundstrom C. C., Chaussidon M., Hsui A. T., Kelemen P. andZimmerman M. (2005) Observations of Li isotopic variations inthe Trinity Ophiolite: evidence for isotopic fractionation bydiffusion during mantle melting. Geochim. Cosmochim. Acta 69,
735–751.
Magna T., Wiechert U., Grove T. L. and Halliday A. N. (2006)Lithium isotope fractionation in the southern Cascadia sub-duction zone. Earth Planet. Sci. Lett. 250, 428–443.
Marks M. A. W., Rudnick R. L., McCammon C., Vennemann T.and Markl G. (2007) Arrested kinetic Li isotope fractionationat the margin of the llimaussaq complex, South Greenland:evidence for open-system processes during final cooling ofperalkaline igneous rocks. Chem. Geol. 246, 207–230.
Marschall H. R., Pogge von Strandmann P. A. E., Seitz H. M.,Elliott T. and Niu Y. L. (2007) The lithium isotopic compo-sition of orogenic eclogites and deep subducted slabs. Earth
Planet. Sci. Lett. 262, 563–580.
McCulloch M. T. and Wasserburg G. J. (1978) Sm–Nd and Rb–Srchronology of continental crust formation. Science 200, 1003–
1011.
McCulloch M. T., Bradshaw J. Y. and Taylor S. R. (1987) Sm–Ndand Rb–Sr isotopic and geochemical systematics in Phanerozoicgranulites from Fjordland, Southwest New Zealand. Contrib.
Mineral. Petrol. 97, 183–195.
McLennan S. M., Hemming S., McDaniel D. K. and Hanson G. N.(1993a) Geochemical approaches to sedimentation, provenance,and tectonics. In Processes Controlling the Composition of
Clastic Sediments (eds. M. J. Johnsson and A. Basu). Geol. Soc.
Am., Boulder, Colorado. 284, 21–40.McLennan S. M., Hemming S. R., Taylor S. R. and Eriksson K. A.
(1993b) Early Proterozoic crustal evolution: geochemical andNd–Pb isotopic evidence from metasedimentary rocks, south-western North America. Geochim. Cosmochim. Acta 59, 1153–
1177.
Merriman R. J. and Frey M. (1999) Patterns of very low-grademetamorphism in metapelitic rocks. In Low-Grade Metamor-
phism (eds. M. Frey and D. Robinson). Blackwell Sciences Ltd.,Oxford, pp. 61–77.
Merriman R. J. and Peacor D. R. (1999) Very low-grademetapelites; mineralogy, microfabrics and measuring reactionprogress. In Low-Grade Metamorphism (eds. M. Frey and D.Robinson). Blackwell Sciences Ltd., Oxford, pp. 10–60.
Merriman R. J. and Roberts B. (2001) Low-grade metamorphismin the Scottish Southern Uplands terrane: deciphering thepatterns of accretionary burial, shearing and cryptic aureoles.Trans. R. Soc. Edinburgh Earth Sci. 91, 521–537.
Merriman R. J. (2006) Clay minerals assemblages in British LowerPalaeozoic mudrocks. Clay Miner. 41, 473–512.
Merriman R. J., Breward N., Stone P. and Green K. (2009)Element mobility and low-grade metamorphism of mudrocks inBritish Caledonian Basins. British Geological Survey Open
Report, OR/09/017.
Moriguti T. and Nakamura E. (1998) Across-arc variation of Liisotopes in lavas and implications for crust/mantle recyclingat subduction zones. Earth Planet. Sci. Lett. 163,
167–174.
Moriguti T., Shibata T. and Nakamura E. (2004) Lithium, boronand lead isotope and trace element systematics of Quaternarybasaltic volcanic rocks in northeastern Japan: mineralogicalcontrols on slab-derived fluid composition. Chem. Geol. 212,
81–100.
Nesbitt H. W. and Young G. M. (1982) Early Proterozoic climatesand plate motions inferred from major element chemistry oflutites. Nature 299, 715–717.
Nesbitt H. W. and Young G. M. (1984) Prediction of someweathering trends of plutonic and volcanic-rocks based onthermodynamic and kinetic considerations. Geochim. Cosmo-
chim. Acta 48, 1523–1534.
Nishio Y., Nakai S., Ishii T. and Sano Y. (2007) Isotopesystematics of Li, Sr, Nd, and volatiles in Indian OceanMORBs of the Rodrigues Triple Junction: constraints on theorigin of the DUPAL anomaly. Geochim. Cosmochim. Acta 71,
745–759.
Parkinson I. J., Hammond S. J., James R. H. and Rogers N. W.(2007) High-temperature lithium isotope fractionation: insightsfrom lithium isotope diffusion in magmatic systems. Earth
Planet. Sci. Lett. 257, 609–621.
Paul D., White W. M. and Turcotte D. L. (2003) Constraints onthe 232Th/238U ratio (j) of the continental crust. Geochem.
Geophys. Geosyst. 4. doi:10.1029/2002GC000497.
Peacor D. R. (1992) Diagenesis and low-grade metamorphism ofshales and slates. Rev. Mineral. 27, 335–380.
Pistiner J. S. and Henderson G. M. (2003) Lithium-isotopefractionation during continental weathering processes. Earth
Planet. Sci. Lett. 214, 327–339.
7340 L. Qiu et al. / Geochimica et Cosmochimica Acta 73 (2009) 7325–7340
Plank T. (2005) Constraints from thorium/lanthanum on sedimentrecycling at subduction zones and the evolution of thecontinents. J. Petrol. 46, 921–944.
Pogge von Strandmann P. A. E., Burton K. W., James R. H., vanCalsteren P., Gislason S. R. and Mokadem F. (2006) Riverinebehaviour of uranium and lithium isotopes in an activelyglaciated basaltic terrain. Earth Planet. Sci. Lett. 251, 134–147.
Richter F. M., Davis A. M., DePaolo D. J. and Watson E. B.(2003) Isotope fractionation by chemical diffusion betweenmolten basalt and rhyolite. Geochim. Cosmochim. Acta 67,
3905–3923.
Rudnick R. L. and Gao S. (2003) The composition of thecontinental crust. In The Crust (ed. R.L. Rudnick). In Treatise
on Geochemistry, vol. 3 (eds. H.D. Holland and K.K. Tureki-an). Elsevier-Pergamon, Oxford, pp. 1–64.
Rudnick R. L., Tomascak P. B., Njo H. B. and Gardner R. L.(2004) Extreme isotopic fractionation during continentalweathering revealed in saprolites from South Carolina. Chem.
Geol., 45–58.Seyfried W. E., Chen X. and Chan L. H. (1998) Trace element
mobility and lithium isotope exchange during hydrothermalalteration of seafloor weathered basalt: an experimental study at350 degrees C, 500 bars. Geochim. Cosmochim. Acta 62, 949–960.
Soper N. and Woodcock N. (2003) The lost Lower Old RedSandstone of England and Wales: a record of post-Iapetanflexure or Early Devonian transtension. Geol. Mag. 140, 627–
647.
Stone P., Floyd J. D., Barnes R. P. and Lintern B. C. (1987) ASequential Back-Arc and Foreland Basin Thrust Duplex Modelfor the Southern Uplands of Scotland. J. Geol. Soc. Lond. 144,
753–764.
Stone P. and Merriman R. J. (2004) Basin thermal history favoursan accretionary origin for the Southern Uplands terrane,Scottish Caledonides. J. Geol. Soc. Lond. 161, 829–836.
Sun S. S. and McDonough W. F. (1989) Chemical and isotopicsystematics of oceanic basalts; implications for mantle compo-sition and processes. In Magmatism in the Ocean Basins (eds.A. D. Saunders and M. J. Norry). Spec. Pub. Geol. Soc. Lond.42, 313–345.
Taylor S. R. and McLennan S. M. (1985) The Continental Crust:
Its Composition and Evolution. Blackwell, Oxford.Teng F. Z., McDonough W. F., Rudnick R. L., Dalpe C.,
Tomascak P. B., Chappell B. W. and Gao S. (2004) Lithiumisotopic composition and concentration of the upper continen-tal crust. Geochim. Cosmochim. Acta 68, 4167–4178.
Teng F. Z., McDonough W. F., Rudnick R. L. and Walker R. J.(2006a) Diffusion-driven extreme lithium isotopic fractionation
in country rocks of the Tin Mountain pegmatite. Earth Planet.
Sci. Lett. 243, 701–710.
Teng F. Z., McDonough W. F., Rudnick R. L., Walker R. J. andSirbescu M. L. C. (2006b) Lithium isotopic systematics ofgranites and pegmatites from the Black Hills, South Dakota.Am. Mineral. 91, 1488–1498.
Teng F. Z., McDonough W. F., Rudnick R. L. and Wing B. A.(2007) Limited lithium isotopic fractionation during progressivemetamorphic dehydration in metapelites: a case study from theOnawa contact aureole, Maine. Chem. Geol. 239, 1–12.
Tomascak P. B., Carlson R. W. and Shirey S. B. (1999) Accurateand precise determination of Li isotopic compositions by multi-collector sector ICP-MS. Chem. Geol. 158, 145–154.
Tomascak P. B., Widom E., Benton L. D., Goldstein S. L. andRyan J. G. (2002) The control of lithium budgets in island arcs.Earth Planet. Sci. Lett. 196, 227–238.
Tomascak P. B., Langmuir C. H., le Roux P. J. and Shirey S. B.(2008) Lithium isotopes in global mid-ocean ridge basalts.Geochim. Cosmochim. Acta 72, 1626–1637.
Vigier N., Decarreau A., Millot R., Carignan J., Petit S. andFrance-Lanord C. (2008) Quantifying Li isotope fractionationduring smectite formation and implications for the Li cycle.Geochim. Cosmochim. Acta 72, 780–792.
Williams L. B. and Hervig R. L. (2005) Lithium and boron isotopesin illite–smectite: the importance of crystal size. Geochim.
Cosmochim. Acta 69, 5705–5716.
Wollast R. and Chou L. (1992) Surface-reactions during the earlystages of weathering of albite. Geochim. Cosmochim. Acta 56,
3113–3121.
Wunder B., Meixner A., Romer R. L. and Heinrich W. (2006)Temperature-dependent isotopic fractionation of lithiumbetween clinopyroxene and high-pressure hydrous fluids. Con-
trib. Mineral. Petrol. 151, 112–120.
Wunder B., Meixner A., Romer R. L., Feenstra A., Schettler G.and Heinrich W. (2007) Lithium isotope fractionation betweenLi-bearing staurolite, Li-mica and aqueous fluids: an experi-mental study. Chem. Geol. 238, 277–290.
You C. F. and Chan L. H. (1996) Precise determination of lithiumisotopic composition in low concentration natural samples.Geochim. Cosmochim. Acta 60, 909–915.
Zack T., Tomascak P. B., Rudnick R. L., Dalpe C. and McDon-ough W. F. (2003) Extremely light Li in orogenic eclogites: therole of isotope fractionation during dehydration in subductedoceanic crust. Earth Planet. Sci. Lett. 208, 279–290.
Associate editor: Thomas Chacko


![Xue Li arXiv:1409.3567v3 [astro-ph.CO] 15 Oct 2014](https://static.fdocument.org/doc/165x107/62d08b52e94c8031e45efaa7/xue-li-arxiv14093567v3-astro-phco-15-oct-2014.jpg)