
Interconversion of α Fe O and Fe O Thin Films: Mechanisms...
9
Interconversion of α‑Fe 2 O 3 and Fe 3 O 4 Thin Films: Mechanisms, Morphology, and Evidence for Unexpected Substrate Participation Francesca Genuzio, Alessandro Sala, Thomas Schmidt,* Dietrich Menzel, and Hans-Joachim Freund Department of Chemical Physics, Fritz Haber Institute of the Max Planck Society, Faradayweg 4-6, 14195 Berlin, Germany ABSTRACT: The reversible transformations of thin magnetite (Fe 3 O 4 ) and hematite (α- Fe 2 O 3 ) films grown on Pt(111) and Ag(111) single crystals as support have been investigated by a combined low energy electron microscopy (LEEM) and low-energy electron diffraction (LEED) study. The conversions were driven by oxidation, annealing in ultrahigh vacuum (UHV), or Fe deposition with subsequent annealing. As expected, the oxidation of a Fe 3 O 4 film yielded an α-Fe 2 O 3 structure. Unexpectedly, the annealing in UHV also led to a transformation from Fe 3 O 4 into α-Fe 2 O 3 , but only if Pt(111) was used as substrate. In contrast, on a Ag(111) substrate the inverse reaction, a slow transformation from α-Fe 2 O 3 into Fe 3 O 4 , was observed, as expected for oxygen desorption. Fe deposition on α-Fe 2 O 3 and subsequent annealing in UHV transformed the film into Fe 3 O 4 . As the most probable explanation we propose that the UHV conversion on Pt(111) supports proceeds by Fe cation diffusion through the film and Fe atom dissolution in the substrate, decreasing the Fe concentration within the iron oxide film. This process is not possible for a Ag(111) substrate. The interconversions, which were best observable in mixed films containing domains of both oxides, occurred by growth of one domain type with well-defined boundaries and growth rates. 1. INTRODUCTION The investigation of iron oxide films and their surfaces has developed into a promising research field, due to their many technological applications, ranging from magnetic devices to heterogeneous catalysis. 1,2 This class of material exhibits rather different magnetic or conducting properties 3,4 depending on their crystal structures, which is strongly determined by the way of preparation. During recent years, increasing numbers of studies have addressed the issue of growth conditions of well-defined oxide film systems, indicating that the film stability depends on many parameters, which may differ significantly from those predicted via a bulk oxide phase diagram. 5−9 In the case of thin oxide films, the influence of the supporting metal substrate has to be taken into account, also. Karunamuni et al. suggested 10 that in general distinct phase diagrams have to be considered for each kind of substrate. Unfortunately, only very few systematic studies have addressed these issues. Magnetite (Fe 3 O 4 ) and hematite (α-Fe 2 O 3 ) are the most frequently investigated iron oxides since they are the most stable and common phases existing in nature, but there are also metastable phases known, such as γ-Fe 2 O 3 , ε-Fe 2 O 3 , etc. 1 In particular, Fe 3 O 4 and α-Fe 2 O 3 thin films have been successfully grown on many substrates, 11−14 by Fe deposition and oxidation in a wide temperature and pressure range. 15 Even though it has been known since the 1990s that different surface terminations are formed depending on preparation conditions, 16 no unambiguous model exists up to now which explains this variability coherently. 17 The reversible transformation between α-Fe 2 O 3 and Fe 3 O 4 has been investigated by different groups using low-energy electron diffraction (LEED), 13,18,19 surface X-ray diffraction (SXRD), 13 scanning tunneling microscopy (STM), 19 and low energy electron microscopy (LEEM) 18 using either iron oxide single crystals or thin films grown on different substrates, with special focus on the stability of the different phases. The oxidation of Fe 3 O 4 leads to γ-(maghemite) and α-Fe 2 O 3 (hematite) allotropes; the reasons for the different structural results have been debated in the literature already in the 1960s 20−23 with the conclusion that the temperature required to enable the structural transformation of Fe 3 O 4 to α-Fe 2 O 3 is influenced by crystal size and impurities already present in the samples. Therefore, studying well-defined systems and under- standing their stability conditions are fundamental. Moreover, controlling the preparation parameters is essential for the growth of thin oxide films on single-crystal surfaces, as they are used as model systems (e.g., for heterogeneous catalysis). 24 For a transformation between the two crystalline phases of Fe 3 O 4 and α-Fe 2 O 3 , both the crystal structure and the stoichiometry have to change. In principle, at least four possible types of reactions can change the stoichiometry of the two iron phases. The two processes, yielding Fe 2 O 3 (oxidation and redox-reaction, respectively) are + → 4Fe O O 6Fe O 3 4 2 2 3 → + 3Fe O 4Fe O Fe 3 4 2 3 and the inverse processes (reduction) are Special Issue: John C. Hemminger Festschrift Received: April 24, 2014 Revised: September 12, 2014 Published: September 16, 2014 Article pubs.acs.org/JPCC © 2014 American Chemical Society 29068 dx.doi.org/10.1021/jp504020a | J. Phys. Chem. C 2014, 118, 29068−29076
Transcript of Interconversion of α Fe O and Fe O Thin Films: Mechanisms...
Interconversion of α‑Fe2O3 and Fe3O4 Thin Films: Mechanisms,Morphology, and Evidence for Unexpected Substrate ParticipationFrancesca Genuzio, Alessandro Sala, Thomas Schmidt,* Dietrich Menzel, and Hans-Joachim Freund
Department of Chemical Physics, Fritz Haber Institute of the Max Planck Society, Faradayweg 4-6, 14195 Berlin, Germany
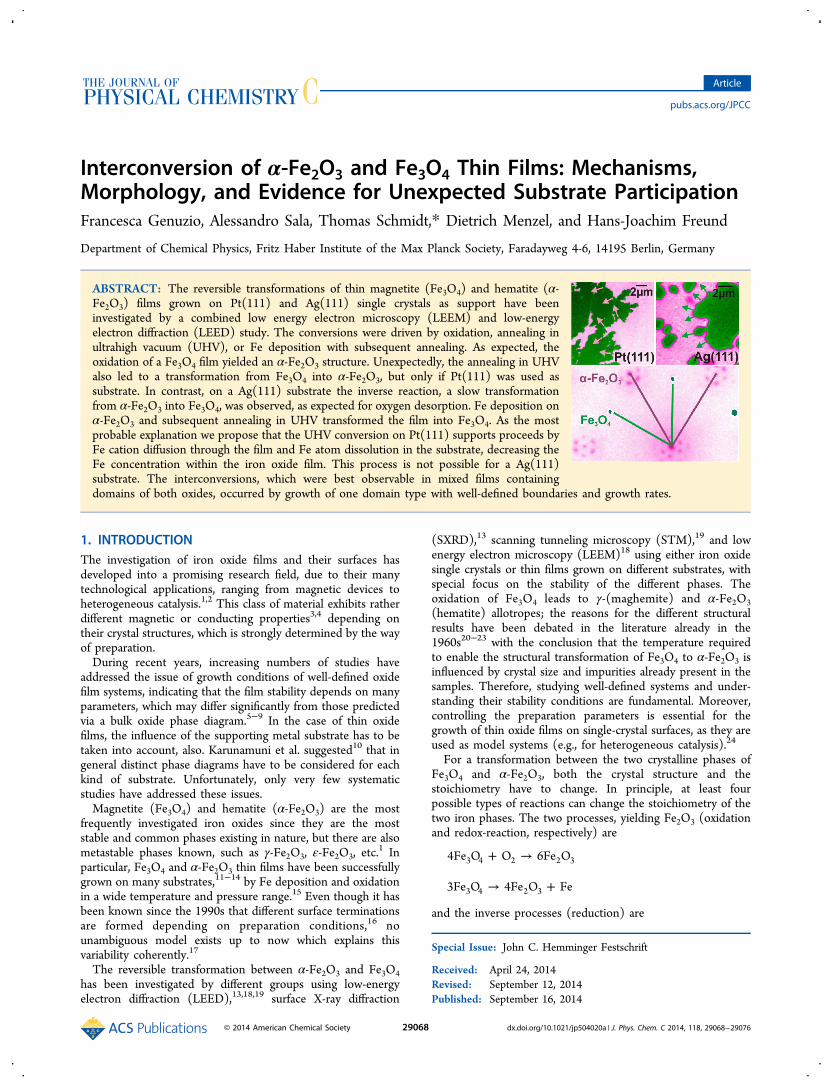
ABSTRACT: The reversible transformations of thin magnetite (Fe3O4) and hematite (α-Fe2O3) films grown on Pt(111) and Ag(111) single crystals as support have beeninvestigated by a combined low energy electron microscopy (LEEM) and low-energyelectron diffraction (LEED) study. The conversions were driven by oxidation, annealing inultrahigh vacuum (UHV), or Fe deposition with subsequent annealing. As expected, theoxidation of a Fe3O4 film yielded an α-Fe2O3 structure. Unexpectedly, the annealing in UHValso led to a transformation from Fe3O4 into α-Fe2O3, but only if Pt(111) was used assubstrate. In contrast, on a Ag(111) substrate the inverse reaction, a slow transformationfrom α-Fe2O3 into Fe3O4, was observed, as expected for oxygen desorption. Fe deposition onα-Fe2O3 and subsequent annealing in UHV transformed the film into Fe3O4. As the mostprobable explanation we propose that the UHV conversion on Pt(111) supports proceeds byFe cation diffusion through the film and Fe atom dissolution in the substrate, decreasing theFe concentration within the iron oxide film. This process is not possible for a Ag(111)substrate. The interconversions, which were best observable in mixed films containingdomains of both oxides, occurred by growth of one domain type with well-defined boundaries and growth rates.
1. INTRODUCTIONThe investigation of iron oxide films and their surfaces hasdeveloped into a promising research field, due to their manytechnological applications, ranging from magnetic devices toheterogeneous catalysis.1,2 This class of material exhibits ratherdifferent magnetic or conducting properties3,4 depending ontheir crystal structures, which is strongly determined by the wayof preparation.During recent years, increasing numbers of studies have
addressed the issue of growth conditions of well-defined oxidefilm systems, indicating that the film stability depends on manyparameters, which may differ significantly from those predictedvia a bulk oxide phase diagram.5−9 In the case of thin oxidefilms, the influence of the supporting metal substrate has to betaken into account, also. Karunamuni et al. suggested10 that ingeneral distinct phase diagrams have to be considered for eachkind of substrate. Unfortunately, only very few systematicstudies have addressed these issues.Magnetite (Fe3O4) and hematite (α-Fe2O3) are the most
frequently investigated iron oxides since they are the moststable and common phases existing in nature, but there are alsometastable phases known, such as γ-Fe2O3, ε-Fe2O3, etc.
1 Inparticular, Fe3O4 and α-Fe2O3 thin films have been successfullygrown on many substrates,11−14 by Fe deposition and oxidationin a wide temperature and pressure range.15 Even though it hasbeen known since the 1990s that different surface terminationsare formed depending on preparation conditions,16 nounambiguous model exists up to now which explains thisvariability coherently.17
The reversible transformation between α-Fe2O3 and Fe3O4has been investigated by different groups using low-energyelectron diffraction (LEED),13,18,19 surface X-ray diffraction
(SXRD),13 scanning tunneling microscopy (STM),19 and lowenergy electron microscopy (LEEM)18 using either iron oxidesingle crystals or thin films grown on different substrates, withspecial focus on the stability of the different phases. Theoxidation of Fe3O4 leads to γ-(maghemite) and α-Fe2O3(hematite) allotropes; the reasons for the different structuralresults have been debated in the literature already in the1960s20−23 with the conclusion that the temperature requiredto enable the structural transformation of Fe3O4 to α-Fe2O3 isinfluenced by crystal size and impurities already present in thesamples. Therefore, studying well-defined systems and under-standing their stability conditions are fundamental. Moreover,controlling the preparation parameters is essential for thegrowth of thin oxide films on single-crystal surfaces, as they areused as model systems (e.g., for heterogeneous catalysis).24
For a transformation between the two crystalline phases ofFe3O4 and α-Fe2O3, both the crystal structure and thestoichiometry have to change. In principle, at least fourpossible types of reactions can change the stoichiometry of thetwo iron phases. The two processes, yielding Fe2O3 (oxidationand redox-reaction, respectively) are
+ →4Fe O O 6Fe O3 4 2 2 3
→ +3Fe O 4Fe O Fe3 4 2 3
and the inverse processes (reduction) are
Special Issue: John C. Hemminger Festschrift
Received: April 24, 2014Revised: September 12, 2014Published: September 16, 2014
Article
pubs.acs.org/JPCC
© 2014 American Chemical Society 29068 dx.doi.org/10.1021/jp504020a | J. Phys. Chem. C 2014, 118, 29068−29076
→ +6Fe O 4Fe O O2 3 3 4 2
+ →4Fe O Fe 3Fe O2 3 3 4
In this paper, we present a combined LEEM and LEED studyto characterize systematically the conditions for reversetransformations between these two oxide phases. Somesupporting X-ray photoelectron spectroscopy (XPS) and X-ray photoemission electron microscopy (XPEEM) results arealso described. The iron oxide films were grown as about 10 nmthin films on two different single-crystal substrates, Pt(111) andAg(111), in order to study substrate effects. In this work, wefound conditions under which Fe3O4 is reversibly convertedinto α-Fe2O3 on both substrates, however with different drivingforces for the transformation.
2. EXPERIMENTAL PROCEDURES AND SAMPLEPREPARATION
Experiments were carried out in the SMART spectromicro-scope, an aberration-corrected and energy-filtered LEEM−PEEM system which combines spectroscopy (XPS, NEXAFS),microscopy (LEEM, PEEM, XPEEM), and diffractiontechniques (LEED, SPA-LEED) for a comprehensive character-ization of the sample surface. The high acquisition rate allowsthe observation of processes like growth, chemical reaction, andphase transitions on the surface in real time (with time scales oftypically one image per second) and in situ.25−27
Iron oxide thin films were grown on clean Pt(111) andAg(111) single-crystal substrates by repeated cycles of irondeposition and oxidation at elevated temperature.6,15 The in situpreparation in the main chamber of the SMART microscopeallows us to directly follow the processes and to check thequality of the growing film.9 The Pt(111) and Ag(111) surfaceswere cleaned by repeated cycles of argon sputtering and UHVannealing at 1100 and 830 K, respectively, until a sharp LEEDpattern without a structured background was obtained. A finaloxygen treatment at 1 × 10⁻⁶ mbar and 700 K, followed byannealing in ultrahigh vacuum (UHV), removed carboncontaminations, as checked with XPS.The specimen chamber of SMART with a base pressure of 1
× 10−10 mbar is suited for operation in an oxygen pressureranging up to 10−5 mbar. The single crystals were mounted ona commercial and transferable ELMITEC sample holder with aMo cap fixing the sample, which was heated from the back sideeither by radiation from a filament for T < 700 K or by electronbombardment for T > 700 K with maximum of 2000 K. Thetemperature was measured with an absolute accuracy of about10 K by a W26%Re/W5%Re thermocouple, spot-welded to thecrystal support. Oxygen (99.999% purity) was dosed by a leakvalve directly into the main chamber of the microscope; iron(99.995% purity, Alfa Aesar) was vapor deposited using acommercial evaporator (Omicron EFM3 with ion suppressor)pointing toward the sample under grazing incidence of 20°.In LEEM the collimated electron beam of a field emitter gun
illuminates the sample surface, and the reflected electrons areimaged by a magnifying lens system on a 2D detector, where aCCD camera records the images in about video rate. Secondaryand inelastically backscattered electrons are cut off by theenergy filter with a bandwidth of 0.5 eV. By changing thekinetic energy (typically 0−500 eV) and the defocus, the imagecontrast can be optimized. While in the so-called bright-fieldmode the specularly reflected electrons are used for imaging,the dark-field mode utilizes the reflected electrons from a
higher-order diffraction spot and therefore identifies super-structure domains or rotational domains.We briefly sketch the crystal structures of the iron oxide
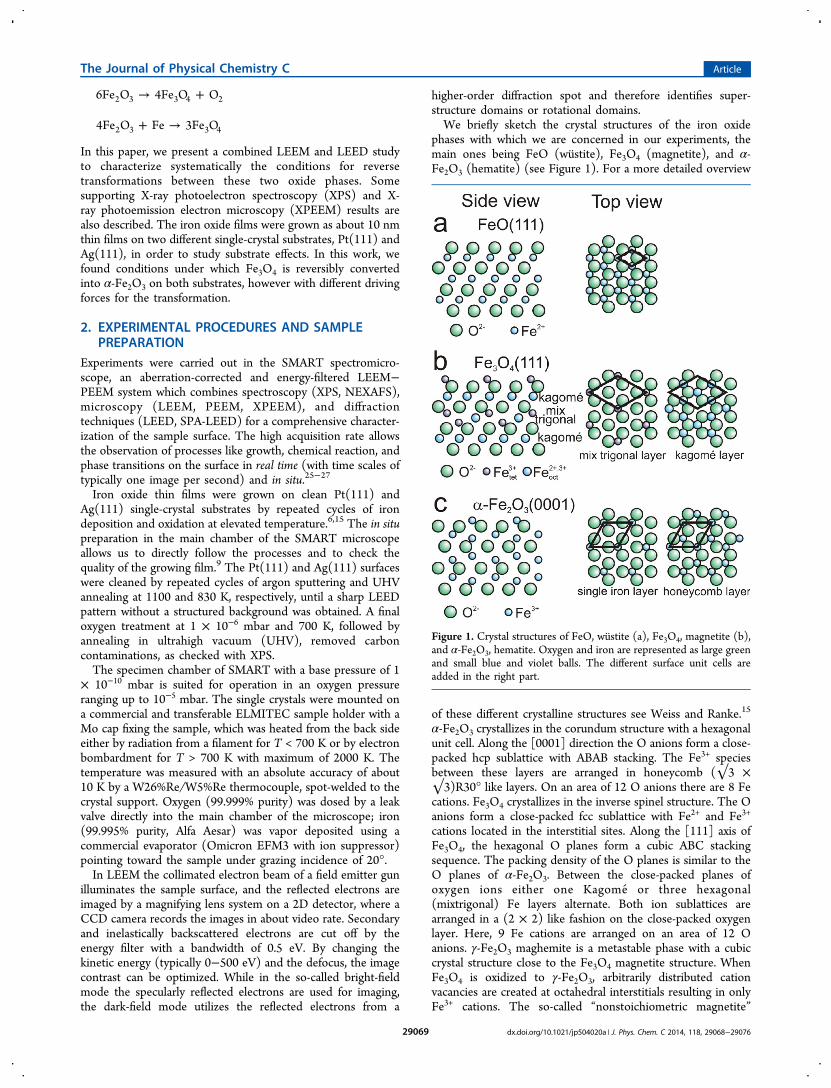
phases with which we are concerned in our experiments, themain ones being FeO (wustite), Fe3O4 (magnetite), and α-Fe2O3 (hematite) (see Figure 1). For a more detailed overview
of these different crystalline structures see Weiss and Ranke.15
α-Fe2O3 crystallizes in the corundum structure with a hexagonalunit cell. Along the [0001] direction the O anions form a close-packed hcp sublattice with ABAB stacking. The Fe3+ speciesbetween these layers are arranged in honeycomb (√3 ×√3)R30° like layers. On an area of 12 O anions there are 8 Fecations. Fe3O4 crystallizes in the inverse spinel structure. The Oanions form a close-packed fcc sublattice with Fe2+ and Fe3+
cations located in the interstitial sites. Along the [111] axis ofFe3O4, the hexagonal O planes form a cubic ABC stackingsequence. The packing density of the O planes is similar to theO planes of α-Fe2O3. Between the close-packed planes ofoxygen ions either one Kagome or three hexagonal(mixtrigonal) Fe layers alternate. Both ion sublattices arearranged in a (2 × 2) like fashion on the close-packed oxygenlayer. Here, 9 Fe cations are arranged on an area of 12 Oanions. γ-Fe2O3 maghemite is a metastable phase with a cubiccrystal structure close to the Fe3O4 magnetite structure. WhenFe3O4 is oxidized to γ-Fe2O3, arbitrarily distributed cationvacancies are created at octahedral interstitials resulting in onlyFe3+ cations. The so-called “nonstoichiometric magnetite”
Figure 1. Crystal structures of FeO, wustite (a), Fe3O4, magnetite (b),and α-Fe2O3, hematite. Oxygen and iron are represented as large greenand small blue and violet balls. The different surface unit cells areadded in the right part.
The Journal of Physical Chemistry C Article
dx.doi.org/10.1021/jp504020a | J. Phys. Chem. C 2014, 118, 29068−2907629069
Fe(3−δ)O4 (with 0 < δ < 1/3) describes the situation, when onlypart of these vacancies are formed (δ = 1/3 corresponds tomaghemite). In the FeO crystal structure, the O and Fe(111)planes form ideal two-dimensional hexagonal lattices with acubic ABC stacking sequence along the [111] direction.Pt(111) and Ag(111) crystals share an fcc bulk structure with
similar interatomic distances of 2.77 and 2.89 Å, respectively.When iron oxide films are grown on them, they are orientedsuch that the close-packed oxygen layers are aligned as thePt(111) and the Ag(111) substrates for both α-Fe2O3 andFe3O4. While the Fe3O4(111) surface exhibits in LEED anapproximate (2 × 2) reconstructionwith respect to thePt(111) surface structurethe α-Fe2O3(0001) surface ischaracterized by an approximate (√3 × √3)R30° super-structure. The lattice constant of FeO(111) differs from that ofthe substrates by only 9.7% (Pt(111)) and 5.2% (Ag(111)),respectively, leading to typical Moire patterns as significantfingerprints. All these three oxide structures grow in tworotational domains.13,15
Furthermore, α-Fe2O3 and Fe3O4 LEED patterns may exhibitextra hexagonal spots surrounding the main diffraction spot,indicating an additional long-range periodicity on the surface,the so-called biphase (α-Fe2O3
28 and Fe3O429). The model for
this periodic surface rearrangement is still under debate, and itis not clear if its origin is the same for both oxides.29−31 In ourwork, the biphase was always present on α-Fe2O3 films (mostlikely due to our low oxygen pressure used for preparation),while for Fe3O4 films a biphase structure resulted if prepared byoxidation at lower temperature or by Fe deposition onto an α-Fe2O3 film at RT and subsequent annealing to 700 K. Underthe conditions of our experiments, the initial Fe3O4(111)surface is terminated by 1/4 of iron (in the following called“canonical”), as shown with LEED-IV and described in previousworks.7,9,32 By spatially resolved XPS and XPEEM, using theFe2+ signal of the Fe 3p XPS peak, we could exclude thatmaghemite is present on our freshly prepared oxide films. Wecannot exclude, however, that during conversion there is somechange of the Fe:O ratio in the structurally Fe3O4-like regionssince nonstoichiometric magnetite and maghemite have thesame crystal structure and therefore the same LEED pattern.Due to the low kinetic electron energy in our LEEM and
LEED experiments (between 5 and 50 eV), our results arerather surface sensitive with a probing depth within 0.5−2 nm,which is only a fraction of our 10 nm thick oxide film.Therefore, with our experimental setup, we cannot directlyexclude a layered film structure beyond our probing depth, suchas α-Fe2O3 covered by Fe3O4 or a thick FeO layer at theinterface to the Pt or Ag support. However, to our knowledge,no such scenario has been observed by other techniques. Onthe contrary, Willinger et al.33 have recently reported on Fe3O4films on Pt support, prepared under nearly identical conditions.Using HR-TEM, they found a homogeneous structure, fromthe surface to the interface. Therefore, we assume that thestable film structure, observed at the surface, represents theentire film thickness.Fe3O4(111) and α-Fe2O3(0001) thin films were grown by
repeated cycles of Fe deposition at RT (each cycle about 7−9ML, where 1 ML Fe is the amount corresponding to onecomplete FeO layer on Pt(111)) and oxidation at elevatedtemperature, after one complete FeO layer was initiallyformed.9 The final film thickness in our experiments wasalways 10 nm (±1 nm). On the Pt(111) surface, theFe3O4(111) film was produced by annealing at T = 900 K in
p = 1.0 × 10⁻⁶ mbar oxygen, whereas α-Fe2O3(0001) wasformed at T = 870 K and p = 3 × 10⁻⁵ mbar. A lower oxidationtemperature was used for the Ag(111) surface to avoidcontamination from the bulk: Fe3O4 was formed at T = 720K (pO2 = 2 × 10⁻⁶ mbar), while for α-Fe2O3(0001) T = 670 Kat p = 2.4 × 10⁻⁵ mbar was required. In spite of the differentoxidation temperature, the oxide film morphology was nearlythe same on both the Pt and the Ag substrate: a closed filmwith terrace width of a few tens of nanometers.Under our preparation conditions we could usually find areas
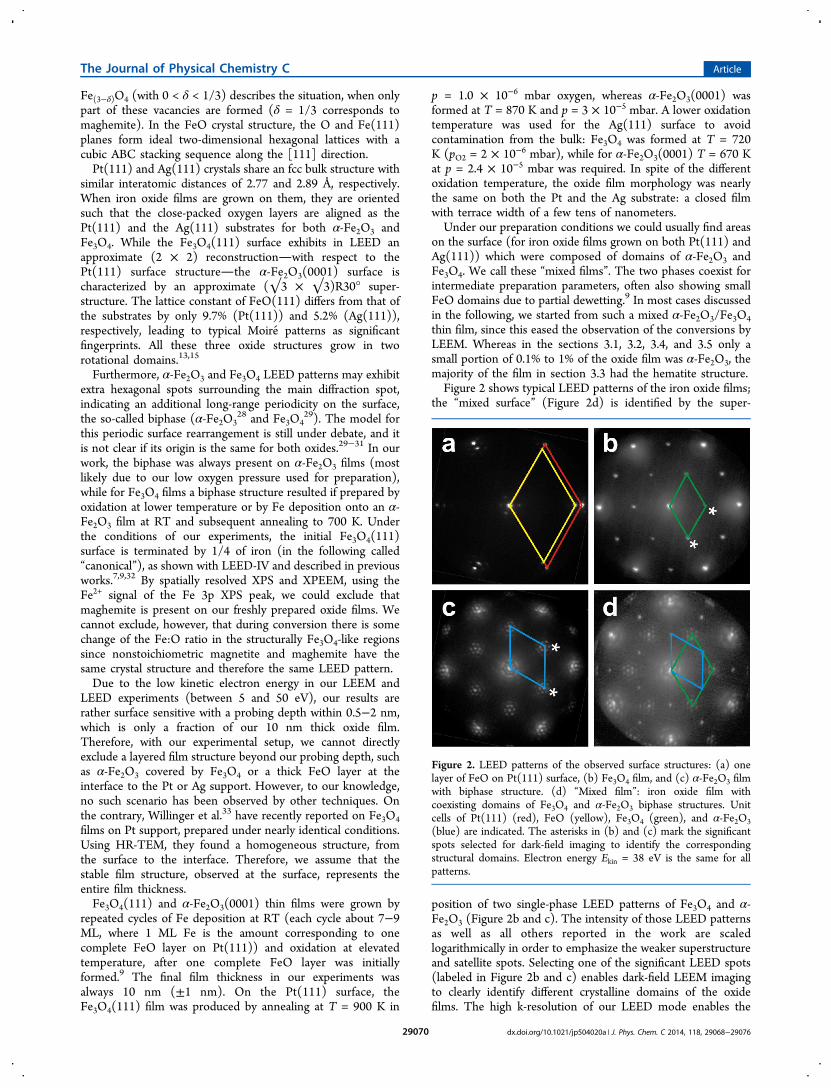
on the surface (for iron oxide films grown on both Pt(111) andAg(111)) which were composed of domains of α-Fe2O3 andFe3O4. We call these “mixed films”. The two phases coexist forintermediate preparation parameters, often also showing smallFeO domains due to partial dewetting.9 In most cases discussedin the following, we started from such a mixed α-Fe2O3/Fe3O4thin film, since this eased the observation of the conversions byLEEM. Whereas in the sections 3.1, 3.2, 3.4, and 3.5 only asmall portion of 0.1% to 1% of the oxide film was α-Fe2O3, themajority of the film in section 3.3 had the hematite structure.Figure 2 shows typical LEED patterns of the iron oxide films;
the “mixed surface” (Figure 2d) is identified by the super-
position of two single-phase LEED patterns of Fe3O4 and α-Fe2O3 (Figure 2b and c). The intensity of those LEED patternsas well as all others reported in the work are scaledlogarithmically in order to emphasize the weaker superstructureand satellite spots. Selecting one of the significant LEED spots(labeled in Figure 2b and c) enables dark-field LEEM imagingto clearly identify different crystalline domains of the oxidefilms. The high k-resolution of our LEED mode enables the
Figure 2. LEED patterns of the observed surface structures: (a) onelayer of FeO on Pt(111) surface, (b) Fe3O4 film, and (c) α-Fe2O3 filmwith biphase structure. (d) “Mixed film”: iron oxide film withcoexisting domains of Fe3O4 and α-Fe2O3 biphase structures. Unitcells of Pt(111) (red), FeO (yellow), Fe3O4 (green), and α-Fe2O3(blue) are indicated. The asterisks in (b) and (c) mark the significantspots selected for dark-field imaging to identify the correspondingstructural domains. Electron energy Ekin = 38 eV is the same for allpatterns.
The Journal of Physical Chemistry C Article
dx.doi.org/10.1021/jp504020a | J. Phys. Chem. C 2014, 118, 29068−2907629070
study of spot profiles and shifts in spot position (SPA-LEEDfunction).
3. RESULTS AND INTERPRETATION3.1. Oxidation of Magnetite: Fe3O4 + O2 → α-Fe2O3.
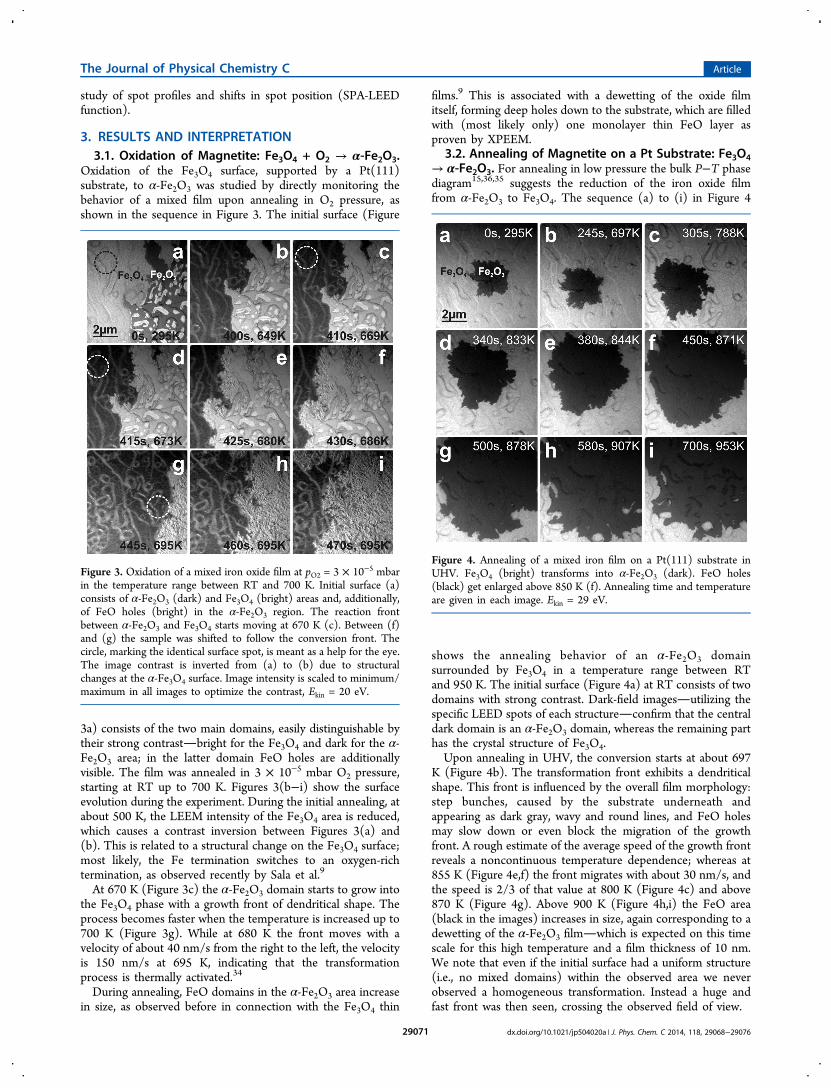
Oxidation of the Fe3O4 surface, supported by a Pt(111)substrate, to α-Fe2O3 was studied by directly monitoring thebehavior of a mixed film upon annealing in O2 pressure, asshown in the sequence in Figure 3. The initial surface (Figure
3a) consists of the two main domains, easily distinguishable bytheir strong contrastbright for the Fe3O4 and dark for the α-Fe2O3 area; in the latter domain FeO holes are additionallyvisible. The film was annealed in 3 × 10⁻⁵ mbar O2 pressure,starting at RT up to 700 K. Figures 3(b−i) show the surfaceevolution during the experiment. During the initial annealing, atabout 500 K, the LEEM intensity of the Fe3O4 area is reduced,which causes a contrast inversion between Figures 3(a) and(b). This is related to a structural change on the Fe3O4 surface;most likely, the Fe termination switches to an oxygen-richtermination, as observed recently by Sala et al.9
At 670 K (Figure 3c) the α-Fe2O3 domain starts to grow intothe Fe3O4 phase with a growth front of dendritical shape. Theprocess becomes faster when the temperature is increased up to700 K (Figure 3g). While at 680 K the front moves with avelocity of about 40 nm/s from the right to the left, the velocityis 150 nm/s at 695 K, indicating that the transformationprocess is thermally activated.34
During annealing, FeO domains in the α-Fe2O3 area increasein size, as observed before in connection with the Fe3O4 thin
films.9 This is associated with a dewetting of the oxide filmitself, forming deep holes down to the substrate, which are filledwith (most likely only) one monolayer thin FeO layer asproven by XPEEM.
3.2. Annealing of Magnetite on a Pt Substrate: Fe3O4→ α-Fe2O3. For annealing in low pressure the bulk P−T phasediagram15,36,35 suggests the reduction of the iron oxide filmfrom α-Fe2O3 to Fe3O4. The sequence (a) to (i) in Figure 4
shows the annealing behavior of an α-Fe2O3 domainsurrounded by Fe3O4 in a temperature range between RTand 950 K. The initial surface (Figure 4a) at RT consists of twodomains with strong contrast. Dark-field imagesutilizing thespecific LEED spots of each structureconfirm that the centraldark domain is an α-Fe2O3 domain, whereas the remaining parthas the crystal structure of Fe3O4.Upon annealing in UHV, the conversion starts at about 697
K (Figure 4b). The transformation front exhibits a dendriticalshape. This front is influenced by the overall film morphology:step bunches, caused by the substrate underneath andappearing as dark gray, wavy and round lines, and FeO holesmay slow down or even block the migration of the growthfront. A rough estimate of the average speed of the growth frontreveals a noncontinuous temperature dependence; whereas at855 K (Figure 4e,f) the front migrates with about 30 nm/s, andthe speed is 2/3 of that value at 800 K (Figure 4c) and above870 K (Figure 4g). Above 900 K (Figure 4h,i) the FeO area(black in the images) increases in size, again corresponding to adewetting of the α-Fe2O3 filmwhich is expected on this timescale for this high temperature and a film thickness of 10 nm.We note that even if the initial surface had a uniform structure(i.e., no mixed domains) within the observed area we neverobserved a homogeneous transformation. Instead a huge andfast front was then seen, crossing the observed field of view.
Figure 3. Oxidation of a mixed iron oxide film at pO2 = 3 × 10⁻⁵ mbarin the temperature range between RT and 700 K. Initial surface (a)consists of α-Fe2O3 (dark) and Fe3O4 (bright) areas and, additionally,of FeO holes (bright) in the α-Fe2O3 region. The reaction frontbetween α-Fe2O3 and Fe3O4 starts moving at 670 K (c). Between (f)and (g) the sample was shifted to follow the conversion front. Thecircle, marking the identical surface spot, is meant as a help for the eye.The image contrast is inverted from (a) to (b) due to structuralchanges at the α-Fe3O4 surface. Image intensity is scaled to minimum/maximum in all images to optimize the contrast, Ekin = 20 eV.
Figure 4. Annealing of a mixed iron film on a Pt(111) substrate inUHV. Fe3O4 (bright) transforms into α-Fe2O3 (dark). FeO holes(black) get enlarged above 850 K (f). Annealing time and temperatureare given in each image. Ekin = 29 eV.
The Journal of Physical Chemistry C Article
dx.doi.org/10.1021/jp504020a | J. Phys. Chem. C 2014, 118, 29068−2907629071
Clearly, the experimentally observed transformation is justthe opposite of what is expected from the phase diagram forstable bulk iron oxides.36 Also, Schlueter et al. found the inverseresult; i.e., α-Fe2O3 transforms to Fe3O4 upon annealing byoxygen desorption, but on a different substrate, namely, onAg(111).13 We corroborated this with our methods as well (seesection 3.4).So here the ratio Fe:O was not changed by oxygen
desorption but by a decrease of the Fe concentration: Femust disappear from the oxide layer. As will be discussed below,iron likely diffuses toward the interface between Pt support andoxide film, either increasing the Fe concentration at theinterface or being dissolved in the Pt(111) substrate.In the following, we intentionally increased the Fe
concentration by deposition to enforce the inverse trans-formation.3.3. Fe Deposition on Hematite: α-Fe2O3 + Fe →
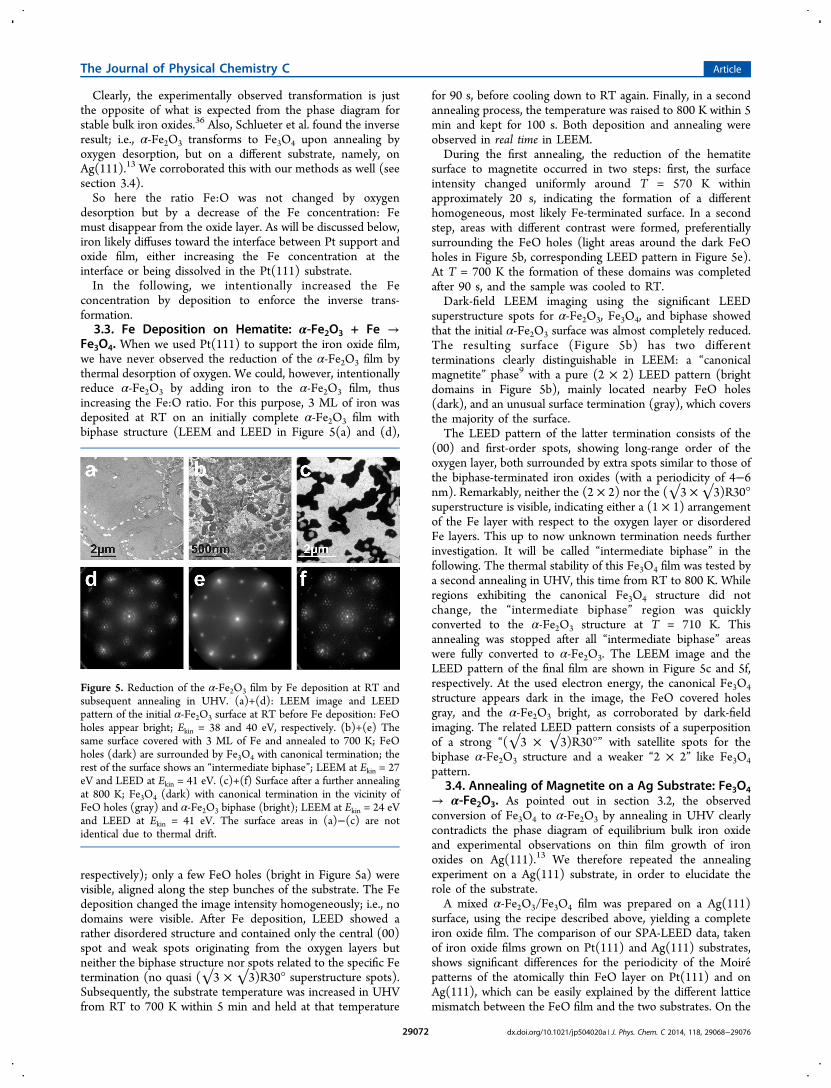
Fe3O4. When we used Pt(111) to support the iron oxide film,we have never observed the reduction of the α-Fe2O3 film bythermal desorption of oxygen. We could, however, intentionallyreduce α-Fe2O3 by adding iron to the α-Fe2O3 film, thusincreasing the Fe:O ratio. For this purpose, 3 ML of iron wasdeposited at RT on an initially complete α-Fe2O3 film withbiphase structure (LEEM and LEED in Figure 5(a) and (d),
respectively); only a few FeO holes (bright in Figure 5a) werevisible, aligned along the step bunches of the substrate. The Fedeposition changed the image intensity homogeneously; i.e., nodomains were visible. After Fe deposition, LEED showed arather disordered structure and contained only the central (00)spot and weak spots originating from the oxygen layers butneither the biphase structure nor spots related to the specific Fetermination (no quasi (√3 × √3)R30° superstructure spots).Subsequently, the substrate temperature was increased in UHVfrom RT to 700 K within 5 min and held at that temperature
for 90 s, before cooling down to RT again. Finally, in a secondannealing process, the temperature was raised to 800 K within 5min and kept for 100 s. Both deposition and annealing wereobserved in real time in LEEM.During the first annealing, the reduction of the hematite
surface to magnetite occurred in two steps: first, the surfaceintensity changed uniformly around T = 570 K withinapproximately 20 s, indicating the formation of a differenthomogeneous, most likely Fe-terminated surface. In a secondstep, areas with different contrast were formed, preferentiallysurrounding the FeO holes (light areas around the dark FeOholes in Figure 5b, corresponding LEED pattern in Figure 5e).At T = 700 K the formation of these domains was completedafter 90 s, and the sample was cooled to RT.Dark-field LEEM imaging using the significant LEED
superstructure spots for α-Fe2O3, Fe3O4, and biphase showedthat the initial α-Fe2O3 surface was almost completely reduced.The resulting surface (Figure 5b) has two differentterminations clearly distinguishable in LEEM: a “canonicalmagnetite” phase9 with a pure (2 × 2) LEED pattern (brightdomains in Figure 5b), mainly located nearby FeO holes(dark), and an unusual surface termination (gray), which coversthe majority of the surface.The LEED pattern of the latter termination consists of the
(00) and first-order spots, showing long-range order of theoxygen layer, both surrounded by extra spots similar to those ofthe biphase-terminated iron oxides (with a periodicity of 4−6nm). Remarkably, neither the (2 × 2) nor the (√3 ×√3)R30°superstructure is visible, indicating either a (1 × 1) arrangementof the Fe layer with respect to the oxygen layer or disorderedFe layers. This up to now unknown termination needs furtherinvestigation. It will be called “intermediate biphase” in thefollowing. The thermal stability of this Fe3O4 film was tested bya second annealing in UHV, this time from RT to 800 K. Whileregions exhibiting the canonical Fe3O4 structure did notchange, the “intermediate biphase” region was quicklyconverted to the α-Fe2O3 structure at T = 710 K. Thisannealing was stopped after all “intermediate biphase” areaswere fully converted to α-Fe2O3. The LEEM image and theLEED pattern of the final film are shown in Figure 5c and 5f,respectively. At the used electron energy, the canonical Fe3O4structure appears dark in the image, the FeO covered holesgray, and the α-Fe2O3 bright, as corroborated by dark-fieldimaging. The related LEED pattern consists of a superpositionof a strong “(√3 × √3)R30°” with satellite spots for thebiphase α-Fe2O3 structure and a weaker “2 × 2” like Fe3O4pattern.
3.4. Annealing of Magnetite on a Ag Substrate: Fe3O4→ α-Fe2O3. As pointed out in section 3.2, the observedconversion of Fe3O4 to α-Fe2O3 by annealing in UHV clearlycontradicts the phase diagram of equilibrium bulk iron oxideand experimental observations on thin film growth of ironoxides on Ag(111).13 We therefore repeated the annealingexperiment on a Ag(111) substrate, in order to elucidate therole of the substrate.A mixed α-Fe2O3/Fe3O4 film was prepared on a Ag(111)
surface, using the recipe described above, yielding a completeiron oxide film. The comparison of our SPA-LEED data, takenof iron oxide films grown on Pt(111) and Ag(111) substrates,shows significant differences for the periodicity of the Moire patterns of the atomically thin FeO layer on Pt(111) and onAg(111), which can be easily explained by the different latticemismatch between the FeO film and the two substrates. On the
Figure 5. Reduction of the α-Fe2O3 film by Fe deposition at RT andsubsequent annealing in UHV. (a)+(d): LEEM image and LEEDpattern of the initial α-Fe2O3 surface at RT before Fe deposition: FeOholes appear bright; Ekin = 38 and 40 eV, respectively. (b)+(e) Thesame surface covered with 3 ML of Fe and annealed to 700 K; FeOholes (dark) are surrounded by Fe3O4 with canonical termination; therest of the surface shows an “intermediate biphase”; LEEM at Ekin = 27eV and LEED at Ekin = 41 eV. (c)+(f) Surface after a further annealingat 800 K; Fe3O4 (dark) with canonical termination in the vicinity ofFeO holes (gray) and α-Fe2O3 biphase (bright); LEEM at Ekin = 24 eVand LEED at Ekin = 41 eV. The surface areas in (a)−(c) are notidentical due to thermal drift.
The Journal of Physical Chemistry C Article
dx.doi.org/10.1021/jp504020a | J. Phys. Chem. C 2014, 118, 29068−2907629072
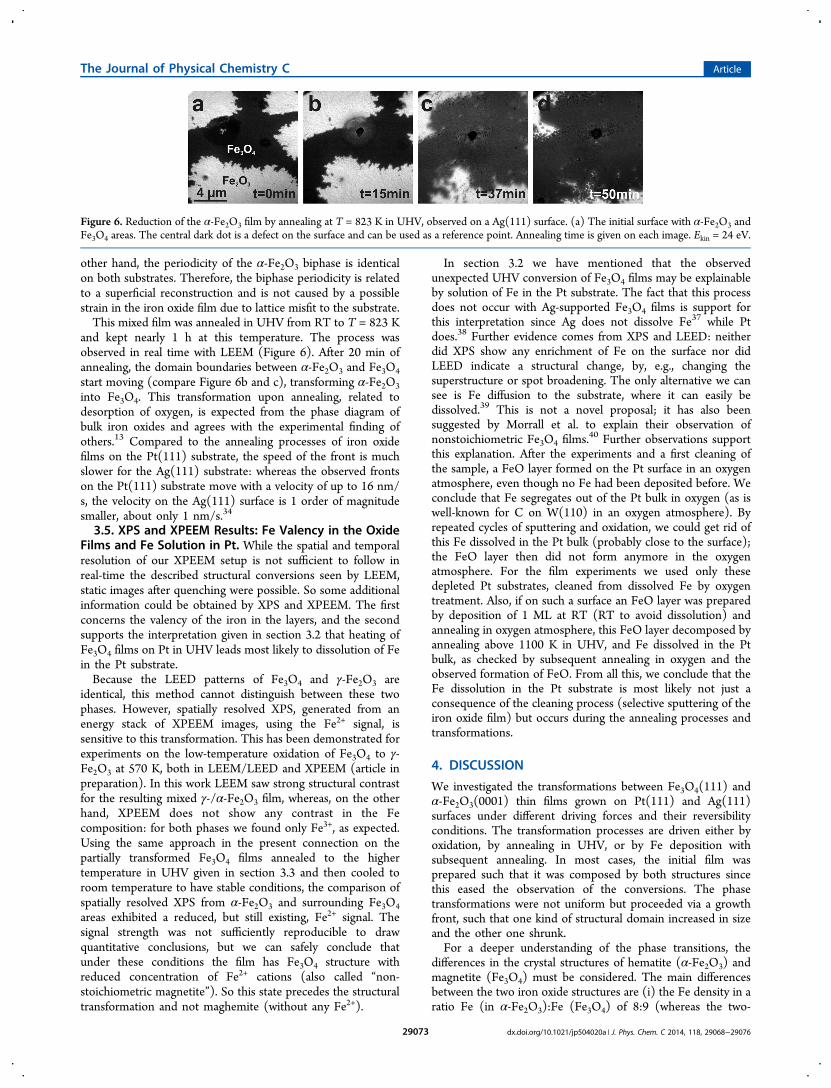
other hand, the periodicity of the α-Fe2O3 biphase is identicalon both substrates. Therefore, the biphase periodicity is relatedto a superficial reconstruction and is not caused by a possiblestrain in the iron oxide film due to lattice misfit to the substrate.This mixed film was annealed in UHV from RT to T = 823 K
and kept nearly 1 h at this temperature. The process wasobserved in real time with LEEM (Figure 6). After 20 min ofannealing, the domain boundaries between α-Fe2O3 and Fe3O4start moving (compare Figure 6b and c), transforming α-Fe2O3into Fe3O4. This transformation upon annealing, related todesorption of oxygen, is expected from the phase diagram ofbulk iron oxides and agrees with the experimental finding ofothers.13 Compared to the annealing processes of iron oxidefilms on the Pt(111) substrate, the speed of the front is muchslower for the Ag(111) substrate: whereas the observed frontson the Pt(111) substrate move with a velocity of up to 16 nm/s, the velocity on the Ag(111) surface is 1 order of magnitudesmaller, about only 1 nm/s.34
3.5. XPS and XPEEM Results: Fe Valency in the OxideFilms and Fe Solution in Pt. While the spatial and temporalresolution of our XPEEM setup is not sufficient to follow inreal-time the described structural conversions seen by LEEM,static images after quenching were possible. So some additionalinformation could be obtained by XPS and XPEEM. The firstconcerns the valency of the iron in the layers, and the secondsupports the interpretation given in section 3.2 that heating ofFe3O4 films on Pt in UHV leads most likely to dissolution of Fein the Pt substrate.Because the LEED patterns of Fe3O4 and γ-Fe2O3 are
identical, this method cannot distinguish between these twophases. However, spatially resolved XPS, generated from anenergy stack of XPEEM images, using the Fe2+ signal, issensitive to this transformation. This has been demonstrated forexperiments on the low-temperature oxidation of Fe3O4 to γ-Fe2O3 at 570 K, both in LEEM/LEED and XPEEM (article inpreparation). In this work LEEM saw strong structural contrastfor the resulting mixed γ-/α-Fe2O3 film, whereas, on the otherhand, XPEEM does not show any contrast in the Fecomposition: for both phases we found only Fe3+, as expected.Using the same approach in the present connection on thepartially transformed Fe3O4 films annealed to the highertemperature in UHV given in section 3.3 and then cooled toroom temperature to have stable conditions, the comparison ofspatially resolved XPS from α-Fe2O3 and surrounding Fe3O4areas exhibited a reduced, but still existing, Fe2+ signal. Thesignal strength was not sufficiently reproducible to drawquantitative conclusions, but we can safely conclude thatunder these conditions the film has Fe3O4 structure withreduced concentration of Fe2+ cations (also called “non-stoichiometric magnetite”). So this state precedes the structuraltransformation and not maghemite (without any Fe2+).
In section 3.2 we have mentioned that the observedunexpected UHV conversion of Fe3O4 films may be explainableby solution of Fe in the Pt substrate. The fact that this processdoes not occur with Ag-supported Fe3O4 films is support forthis interpretation since Ag does not dissolve Fe37 while Ptdoes.38 Further evidence comes from XPS and LEED: neitherdid XPS show any enrichment of Fe on the surface nor didLEED indicate a structural change, by, e.g., changing thesuperstructure or spot broadening. The only alternative we cansee is Fe diffusion to the substrate, where it can easily bedissolved.39 This is not a novel proposal; it has also beensuggested by Morrall et al. to explain their observation ofnonstoichiometric Fe3O4 films.
40 Further observations supportthis explanation. After the experiments and a first cleaning ofthe sample, a FeO layer formed on the Pt surface in an oxygenatmosphere, even though no Fe had been deposited before. Weconclude that Fe segregates out of the Pt bulk in oxygen (as iswell-known for C on W(110) in an oxygen atmosphere). Byrepeated cycles of sputtering and oxidation, we could get rid ofthis Fe dissolved in the Pt bulk (probably close to the surface);the FeO layer then did not form anymore in the oxygenatmosphere. For the film experiments we used only thesedepleted Pt substrates, cleaned from dissolved Fe by oxygentreatment. Also, if on such a surface an FeO layer was preparedby deposition of 1 ML at RT (RT to avoid dissolution) andannealing in oxygen atmosphere, this FeO layer decomposed byannealing above 1100 K in UHV, and Fe dissolved in the Ptbulk, as checked by subsequent annealing in oxygen and theobserved formation of FeO. From all this, we conclude that theFe dissolution in the Pt substrate is most likely not just aconsequence of the cleaning process (selective sputtering of theiron oxide film) but occurs during the annealing processes andtransformations.
4. DISCUSSION
We investigated the transformations between Fe3O4(111) andα-Fe2O3(0001) thin films grown on Pt(111) and Ag(111)surfaces under different driving forces and their reversibilityconditions. The transformation processes are driven either byoxidation, by annealing in UHV, or by Fe deposition withsubsequent annealing. In most cases, the initial film wasprepared such that it was composed by both structures sincethis eased the observation of the conversions. The phasetransformations were not uniform but proceeded via a growthfront, such that one kind of structural domain increased in sizeand the other one shrunk.For a deeper understanding of the phase transitions, the
differences in the crystal structures of hematite (α-Fe2O3) andmagnetite (Fe3O4) must be considered. The main differencesbetween the two iron oxide structures are (i) the Fe density in aratio Fe (in α-Fe2O3):Fe (Fe3O4) of 8:9 (whereas the two-
Figure 6. Reduction of the α-Fe2O3 film by annealing at T = 823 K in UHV, observed on a Ag(111) surface. (a) The initial surface with α-Fe2O3 andFe3O4 areas. The central dark dot is a defect on the surface and can be used as a reference point. Annealing time is given on each image. Ekin = 24 eV.
The Journal of Physical Chemistry C Article
dx.doi.org/10.1021/jp504020a | J. Phys. Chem. C 2014, 118, 29068−2907629073
dimensional O density is the same); (ii) the structure of the Fesublattices; and finally (iii) the stacking of the close-packedoxygen planes. As a consequence, a phase transformationinvolves a change in the Fe density and concomitantly of theFe:O ratio, as well as structural rearrangements in the Fesublattice and in the stacking of the close-packed oxygen planes.The spinel forming process, as well as the spinel to corundumtransformation, have been extensively studied in solid−solidreactions, pointing out the role of cation diffusion andcrystalline rearrangement. The restacking of the oxygen layersis believed to progress through rigid O layers shifting againsteach other which induces the simultaneous adjustment ofcations in the new structure, as discussed in Kachi et al.,41 inCarter and Schmalzried,42 and more generally bySchmalzried.43
A frame of rigid O-layers, providing sites for cationrearrangements, is used also in a model for the spinel formingprocess from binary oxides by Hesse.44 Here, the diffusion andthe rearrangement of the cations drive the transformation: inour case the Fe diffusion at the transformation of Fe3O4 to γ-Fe2O3. This conversion might occur as an intermediate stepduring our annealing experiment since the structures of theseoxides are indistinguishable in our experiments. In a final step,this γ-Fe2O3 structure might transform to α-Fe2O3, as observedexperimentally and described theoretically by Kachi et al.41
However, this two-step model can only be applied withconstraints to our observations in section 3.2. The XPS resultsreported in section 3.5 show that the entire Fe3O4 area is notcompletely converted to a γ-Fe2O3 structure before beingtransformed to α-Fe2O3 because after cooling the unconvertedarea still showed an Fe2+ signal in XPS, indicating at least anonstoichoimetric magnetite structure. However, during theconversion, there might be a vertical and/or horizontal gradientin the Fe concentration of the magnetite area, yielding in a γ-Fe2O3 region at the moving conversion front to α-Fe2O3,meaning indeed a local two-step process from Fe3O4 via γ-Fe2O3 to α-Fe2O3. To finally describe the spatial-temporalevolution of the conversion, the system has to be investigated inmore detail combining structural and spectroscopic contrast atreaction conditions.Starting with a mixed surface of different structural domains,
the film is converted by a moving reaction front. The velocity ofthe front depends on temperature; therefore, the trans-formation must be driven by thermally activated processes.This is expected for all processes necessary for conversion: (i)density change of Fe, (ii) structural rearrangement of the Fesublattices, and (iii) modification of the close-packed oxygenlayer stacking. In order to reduce the Fe density, Fe cationshave to diffuse through the iron oxide film along the [111]direction. This Fe diffusion is assumed to proceed by interstitialcollinear removal.45,46 When these Fe cations diffuse to thesurface, they react with oxygen from the gas phase. Thus, aftercompletion of the oxidation process, the iron oxide film hasgrown in thickness, because 1/9 of the Fe cations of the initialFe3O4 domains have diffused to the surface. The velocity of thetransformation front of 150 nm/s at 700 K and pO2 = 3 × 10⁻⁵
mbar is the highest observed in our experiments, and thereforeoxidation is completed within only a few minutes, as alreadyobserved by Schlueter13 on a Ag(111) surface. We concludethat the activation barriers for the oxidation must be lower thanfor the competing processes (see below).An interesting observation is the dendrite shape of the front.
Most likely the conversion process at 700 K is defect-
dominated, leading to imperfect stacking or rearrangement ofthe Fe sublattice, so that the conversion occurs locally (seeFigure 3). In contrast to Nie et al.,47 we have not observed theformation of Fe3O4 domains within the α-Fe2O3 phase, far awayfrom the oxidation front, and therefore we exclude a reactionlike 9Fe3O4 + 2O2 → 12Fe2O3 + Fe3O4. The reason for thedifference might be their film thickness of 100 nm, in contrastto 10 nm in our experiments.For a mixed film on Ag(111), the expected reduction
behavior α-Fe2O3 → Fe3O4 was observed, in agreement withprevious work.13 Though the annealing was carried out athigher temperature (823 K) the process was very slow. The fullconversion needed more than an hour, corresponding to aspeed of the conversion front of only 1 nm/s. Here, the processis most likely driven by overcoming the attractive potentialbetween Fe and O at the surface and the subsequent α-Fe2O3desorption of oxygen and diffusion of Fe into the oxide layer,where it is incorporated in the interstitial Fe layers.As stressed above, the behavior observed when a mixed film
on Pt(111) was annealed in UHV was definitely unexpected.Instead of the expected reduction process the oppositetransformation occurs: Fe3O4 transforms to α-Fe2O3. Herethe conversion front has a speed of 30 nm/s (maximum atabout 855 K). Because no additional oxygen was offered to thesystem, the ratio of Fe:O can be only lowered, if the Fe cationsdiffuse either to the surface or to the oxide−Pt interface. Asstated in section 3.5 we can exclude Fe enrichment at thesurface. Therefore, the segregated iron might form an FeO layerat the interface. In this model, the entire conversion wouldtransform the topmost 3/4 of the initial Fe3O4 area to α-Fe2O3,the bottom part to FeO, corresponding to a reaction Fe3O4 →Fe2O3 + FeO. Alternatively, Fe may diffuse into the Ptsubstrate, where it can be easily dissolved. In our case of a 10nm thick Fe3O4 film the total diffused amount of Fe cationscorresponds to ∼3.3 ML in the corresponding domains.The Fe dissolution can explain the opposing results obtained
on the two substrates Pt and Ag. The reason is the differentbehavior of the substrates: Fe can be dissolved in the Pt bulk,but not in the Ag bulk.37,38 The desorption of oxygen (thedominant process on the Ag(111) substrate) must occur as wellon the Pt substrate, but at a much slower rate than Fesegregation into the substrate. However, oxygen desorptionmight explain why the front velocity on the Pt substratedecreases at higher temperature.Another type of transformation is initiated by Fe deposition
and therefore by a forced enrichment of Fe density. Thisprocess converts α-Fe2O3 into Fe3O4 and also needs thermalactivation. At 700 K the conversion is incomplete: only 20% ofthe surface converts to canonical Fe3O4, and the remaining partshows an (up to now unreported) “intermediate biphase”. Theconversion may be explained by diffusion of deposited Fe intothe oxide film. Compared to the oxidation of Fe3O4, thisprocess takes more time because iron diffusion is less favored inα-Fe2O3 than in Fe3O4.
45,46,48 A second annealing to 800 Kreconverts the “intermediate biphase” to α-Fe2O3. However,when we repeated the experiment and added this time 10 MLof Fe, the film was fully converted and stable upon higherannealing, indicating that it is necessary to add a sufficientamount of Fe to complete the transformation throughout thefilm.We finally return to the observation that all transformations
occurred with growth fronts. For mixed films this is shown inFigures 3, 4, and 6. As mentioned in section 3.2, even for an
The Journal of Physical Chemistry C Article
dx.doi.org/10.1021/jp504020a | J. Phys. Chem. C 2014, 118, 29068−2907629074
initially uniform surface we never observed a homogeneoustransformation, but a huge, fast front was then eventuallycrossing the observed field of view. Obviously, the trans-formations are promoted by nucleation centers. Once a favoreddomain has formed (or pre-exists in the mixed films), thetransformation continues by growing in size, i.e., with a movingfront. We never observed a spontaneous phase transformationon a homogeneous surface (neither for α-Fe2O3 nor Fe3O4) butonly at the front between two phases. Obviously, thetransformation to Fe3O4 needs a seed to start. The LEEMobservations show that most of the seeds are formed in thevicinity of micrometer-large, mesa-like morphological defects ofthe metal support, as they always existed on our substrate.As to the nature of the observed moving growth fronts
during conversions, it should be borne in mind that the contrastin LEEM is due to the geometry change between Fe3O4 and α-Fe2O3. The direct role of the frontwhether the Fe diffusionor oxygen diffusion occurs only at the border between twophases, or nearby, or independentlycannot be answered fromour present experiments because our XPEEM setup lacks thetemporal and spatial resolution required for this. However, it iswell possible that the front motion is not connected to materialdiffusion of O and/or Fe but to “diffusion” of an activatedstructural arrangement between the two phases. The changes ofFe:O ratio driving these structural conversions could well occuron a faster time scale and possibly be even laterallyhomogeneous over the film. The structural change wouldthen be slower because it can occur only at the mentionedseeds and propagate by a repeatable step. We hope to gainfurther insight from ongoing investigations.34
5. CONCLUSIONS
This paper describes a study on the transformations betweenhematite and magnetite in thin films on Pt(111) and on theAg(111) substrate, using mainly LEEM and LEED comple-mented by XPS and XPEEM. The transformations involve bothstructural changes of the oxygen and iron layers and a change inthe Fe concentration and might be explained by a two-stepprocess via an intermediate maghemite or nonstoichiometricmagnetite phase. The conversions appear to be mainly drivenby the interstitial diffusion of iron in the film. In the case of theoxidation of Fe3O4 to α-Fe2O3, Fe has to diffuse from the filmto the surface, where it is oxidized. For the reduction by oxygendesorption, observed on Ag(111), the reverse process occurs:breaking the Fe−O bond at the surface and diffusion of Fe intothe oxide film. The enrichment of Fe density by Fe depositionand annealing leads to a reduction process as well: α-Fe2O3 →Fe3O4. A novel additional process is the decrease of the Fe:Oratio by Fe diffusion toward the supporting interface, mostlikely into the substrate bulk, possible only on the Pt(111)substrate, but not on Ag(111). This leads to an unexpected“oxidizing” process on the Pt(111), though no oxygen is addedto the oxide film, but the Fe density is reduced. Thisobservation stresses the possible importance of the substratefor supported thin oxide films. All processes are thermallyactivated and promoted by nucleation centers. The trans-formations are not homogeneous but take place withconversion fronts which move at considerably different ratesand with complicated morphology and which deserve furtherstudy.
■ AUTHOR INFORMATION
Corresponding Author*E-mail: [email protected]. Phone: +49-30-8062-1-4671.
NotesThe authors declare no competing financial interest.
■ ACKNOWLEDGMENTS
We gratefully acknowledge the financial support by the FederalGerman Ministry of Education and Science (BMBF) underContract no. 05KS4WWB/4, the German Science Foundation(DFG) through Sonderforschungsbereich 546, and the Clusterof excellence UNICAT, as well as Fonds der ChemischenIndustrie. We are thankful for the technical support by theBESSY-II crew. The microscope is installed at the BESSY-IIstorage ring of the Helmholtz-Center Berlin for Material andEnergy. We thank HZB for the allocation of synchrotronradiation beamtime.
■ REFERENCES(1) Cornell, R. M.; Schwertmann, U. The Iron Oxides; Wiley-VCH:Weinheim, Germany, 2003.(2) Ertl, G.; Knozinger, H.; Schuth, F.; Weitkamp, J. Handbook ofHeterogeneous Catalysis; Wiley-VCH: Weinheim, Germany, 2008.(3) Yue, J.; Jiang, X.; Kaneti, Y. V.; Yu, A. Experimental andTheoretical Study of Low-Dimensional Iron Oxide Nanostructures. InSmart Nanoparticles Technology; Hashim, A., Ed.; InTech: Rijeka, 2012;pp 119−146.(4) Zboril, R.; Mashlan, M.; Petridis, D. Iron(III) Oxides fromThermal Processess Synthesis, Structural and Magnetic Properties,Mossbauer Spectroscopy Characterization, and Application. Chem.Mater. 2002, 14, 969−982.(5) Vurens, G. H.; Salmeron, M.; Somorjai, G. A. Structure,Composition and Chemisorption Studies of Thin Ordered Iron OxideFilms on Platinum (111). Surf. Sci. 1988, 201, 129−144.(6) Weiss, W.; Ritter, M. Metal Oxide Heteroepitaxy: Stranski-Krastanov Growth for Iron Oxides on Pt(111). Phys. Rev. B 1999, 59,5201−5213.(7) Ritter, M.; Weiss, W. Fe3O4(111) Surface Structure Determinedby LEED Crystallography. Surf. Sci. 1999, 432, 81−94.(8) Lennie, A. R.; Condon, N. G.; Leibsle, F. M.; Murray, P. W.;Thornton, G.; Vaughan, D. J. Structures of Fe3O4 (111) SurfacesObserved by Scanning Tunneling Microscopy. Phys. Rev. B 1996, 53,10244−10253.(9) Sala, A.; Marchetto, H.; Qin, Z.-H.; Shaikhutdinov, S.; Schmidt,Th.; Freund, H.-J. Defects and Inhomogeneities in Fe3O4(111) ThinFilm Growth on Pt(111). Phys. Rev. B 2012, 86, 155430−1−155430−10.(10) Karunamuni, J.; Kurtz, R. L.; Stockbauer, R. L. Growth of IronOxide on Cu(001) at Elevated Temperature. Surf. Sci. 1999, 442, 223−238.(11) Xue, M.; Wang, S.; Ku, K.; Guo, J.; Guo, Q. Surface StructuralEvolution in Iron Oxide Thin Films. Langmuir 2011, 27, 11−14.(12) Waddill, G. D.; Ozturk, O. Epitaxial Growth of Iron Oxide Filmson Ag(111). Surf. Sci. 2005, 575, 35−50.(13) Schlueter, C.; Lubbe, M.; Gigler, A. M.; Moritz, W. Growth ofIron Oxides on Ag(111) Reversible Fe2O3/Fe3O4 Transformation.Surf. Sci. 2011, 605, 1986−1993.(14) Deng, X.; Lee, J.; Matranga, C. Preparation and Characterizationof Fe3O4(111) Nanoparticles and Thin Films on Au(111). Surf. Sci.2010, 604, 627−632.(15) Weiss, W.; Ranke, W. Surface Chemistry and Catalysis on Well-Defined Epitaxial Iron-Oxide Layers. Prog. Surf. Sci. 2002, 70, 1−151.(16) Wang, X.-G.; Weiss, W.; Shaikhutdinov, Sh. K.; Ritter, M.;Petersen, M.; Wagner, F.; Schlogl, R.; Scheffler, M. The Hematite (α-
The Journal of Physical Chemistry C Article
dx.doi.org/10.1021/jp504020a | J. Phys. Chem. C 2014, 118, 29068−2907629075
Fe2O3) (0001) Surface: Evidence for Domains of Distinct Chemistry.Phys. Rev. Lett. 1998, 81, 1038−1041.(17) Kuhlenbeck, H.; Shaikhutdinov, S.; Freund, H.-J. Well-OrderedTransition Metal Oxide Layers in Model Catalysis - A Series of CaseStudies. Chem. Rev. 2013, 113, 3986−4034.(18) Monti, M.; Santos, B.; Mascaraque, A.; Rodriguez de la Fuente,O.; Nino, M. A.; Mentes, T. O.; Locatelli, A.; McCarthy, K. F.; Marco,J. F.; de la Figuera, J. Oxidation Pathways in Bicomponent UltrathinIron Oxide Films. J. Phys. Chem. C 2012, 116, 11539−11547.(19) Tang, Y.; Qin, H.; Wu, K.; Guo, Q.; Guo, J. The Reduction andOxidation of Fe2O3(0001) Surface Investigated by STM. Surf. Sci.2013, 609, 67−72.(20) Colombo, U.; Fagherazzi, G.; Gazzarrini, F.; Lanzavecchia, G.Mechanisms in the First Stage of Oxidation in Magnetites. Nature1964, 202, 175−176.(21) Gallagher, K. J.; Feitknecht, W.; Mannweiler, U. Mechanism ofOxidation of Magnetite to γ-Fe2O3. Nature 1968, 217, 1118−1121.(22) Colombo, U.; Fagherazzi, G.; Gazzarrini, F.; Lanzavecchia, G.Mechanism of Low Temperature Oxidation of Magnetites. Nature1968, 219, 1036−1037.(23) Feitknecht, W.; Gallagher, K. J. Mechanisms for the Oxidationof Fe3O4. Nature 1970, 228, 548−549.(24) Freund, H.-J. Metal-Supported Ultrathin Oxide Film Systems asDesignable Catalysts and Catalyst Supports. Surf. Sci. 2007, 601,1438−1442.(25) Fink, R.; Weiss, M. R.; Umbach, E.; Preikszas, D.; Rose, H.;Spehr, R.; Hartel, P.; Engel, W.; Degenhardt, R.; Kuhlenbeck, H.; et al.SMART: A Planned Ultrahigh-Resolution Spectromicroscope forBESSY II. J. Electron Spectrosc. Relat. Phenom. 1997, 84, 231−250.(26) Schmidt, Th.; Marchetto, H.; Levesque, P. L.; Groh, U.; Maier,F.; Preikszas, D.; Hartel, P.; Spehr, R.; Lilienkamp, G.; Engel, W.; et al.Double Aberration Correction in a Low-Energy Electron Microscope.Ultramicroscopy 2010, 110, 1358−1361.(27) Freund, H.-J.; Nilius, N.; Risse, T.; Schauermann, S.; Schmidt,Th. Innovative Measurement Techniques in Surface Science. Chem.Phys. Chem. 2011, 12, 79−87.(28) Lad, R. J.; Henrich, V. E. Structure of α-Fe2O3 Single CrystalSurfaces Following Ar+ Ion Bombardment and Annealing in O2. Surf.Sci. 1988, 193, 81−93.(29) Condon, N. G.; Leibsle, F. M.; Lennie, A. R.; Murray, P. W.;Vaughan, D. J.; Thornton, G. Biphase Ordering of Iron Oxide Surfaces.Phys. Rev. Lett. 1995, 75, 1961−1964.(30) Condon, N. G.; Leibsle, F. M.; Parker, T.; Lennie, A. R.;Vaughan, D. J.; Thornton, G. Biphase ordering on Fe3O4(111). Phys.Rev. B 1997, 55, 15885−15894.(31) Lanier, C. H.; Chiaramonti, A. N.; Marks, L. D.; Poeppelmeier,K. R. The Fe3O4 Origin of the ‘‘Biphase” Reconstruction on α-Fe2O3(0001). Surf. Sci. 2009, 603, 2574−2579.(32) Barbieri, A.; Weiss, W.; Van Hove, M. A. MagnetiteFe3O4(111): Surface Structure by LEED Crystallography andEnergetics. Surf. Sci. 1994, 302, 259−279.(33) Willinger, M. G.; Zhang, W.; Bondarchuk, O.; Shaikhutdinov, S.;Freund, H.-J.; Schlogl, R. A Case of Strong Metal−SupportInteractions: Combining Advanced Microscopy and Model Systemsto Elucidate the Atomic Structure of Interfaces. Angew. Chem., Int. Ed.2014, 53, 5998−6001.(34) The detailed temperature dependences of the varioustransformations here and below are being investigated and will bepublished separately.(35) Muan, A. On the Stability of The Phase Fe2O3-Al2O3. Am. J. Sci.1958, 256, 413−422.(36) Ketteler, G.; Weiss, W.; Ranke, W.; Schlogl, R. Bulk and SurfacePhases of Iron Oxides in an Oxygen and Water. Phys. Chem. Chem.Phys. 2001, 3, 1114−1122.(37) Ma, E.; He, J.-H.; Schilling, P. J. Mechanical alloying ofimmiscible elements: Ag-Fe contrasted with Cu-Fe. Phys. Rev. B 1997,55, 5542−5545.
(38) Okamoto, H. Fe-Pt (Iron-Platinum). In Phase Diagrams ofBinary Iron Alloys; Okamoto, H., Ed.; ASM International: MaterialsPark, OH, 1993; pp 330−336.(39) Liu, Y.; Wang, J.; Du, Y.; Zhang, L.; Liang, D. Mobilities anddiffusivities in fcc Fe−X (Ag, Au, Cu, Pd and Pt) alloys. CALPHAD2010, 34, 253−262.(40) Morrall, P.; Schedin, F.; Case, G. S.; Thomas, M. F.; Dudzik, E.;van der Laan, G.; Thornton, G. Stoichiometry of Fe3‑δO4(111)Ultrathin Films on Pt(111). Phys. Rev. B 2003, 67, 214408−1 -214408−7.(41) Kachi, S.; Momiyama, K.; Shimizu, S. An Electron DiffractionStudy and a Theory of the Transformation from γ-Fe2O3 to α-Fe2O3. J.Phys. Soc. Jpn. 1963, 18, 106−116.(42) Carter, C. B.; Schmalzried, H. The Growth of Spinel into AI2O3.Philos. Mag. A 1985, 52, 207−224.(43) Schmalzried, H. Chemical Kinetics of Solids; Wiley-VCH:Weinheim, Germany, 2008.(44) Hesse, D. The Submicroscopic Structure of Reaction Fronts inSolid-Solid Reactions and its Correlation with Reaction Mechanismand Kinetics. Solid State Ionics 1997, 95, 1−15.(45) Peterson, N. L.; Chen, W. K.; Wolf, D. Correlation And IsotopeEffects For Cation Diffusion In Magnetite. J. Phys. Chem. Solids 1980,41, 709−719.(46) Lewis, G. V.; Catlow, C. R. A.; Cormack, A. N. Defect StructureAnd Migration In Fe3O4. J. Phys. Chem. Solids 1985, 46, 1227−1233.(47) Nie, S.; Starodub, E.; Monti, M.; Siegel, D. A.; Vergara, L.; ElGabaly, F.; Bartelt, N. C.; de la Figuera, J.; McCarty, K. F. Insight intoMagnetite’s Redox Catalysis from Observing Surface Morphologyduring Oxidation. J. Am. Chem. Soc. 2013, 135, 10091−10098.(48) Atkinson, A.; Taylor, R. I. Diffusion Of 55Fe In Fe2O3 SingleCrystals. J. Phys. Chem. Solids 1985, 46, 469−475.
The Journal of Physical Chemistry C Article
dx.doi.org/10.1021/jp504020a | J. Phys. Chem. C 2014, 118, 29068−2907629076


![[PPT]No Slide Title - Prof. Stephen J. Pearton's Research Grouppearton.mse.ufl.edu/research/FTFTs/MRS_fall_2007-2.ppt · Web viewIndium Zinc Oxide Thin Films Deposited by Sputtering](https://static.fdocument.org/doc/165x107/5aa9b1b37f8b9a90188d2f55/pptno-slide-title-prof-stephen-j-peartons-research-viewindium-zinc-oxide.jpg)